Cambridge A Level Chemistry 9701 — 2019 May/June Paper 3 · Variant 5
9701/35/M/J/19 · 3 questions · 40 marks · ≈45 min
The question paper and its mark scheme, free to read here and free to download. This is Cambridge’s own paper, exactly as it was sat.
Question paper12 pages
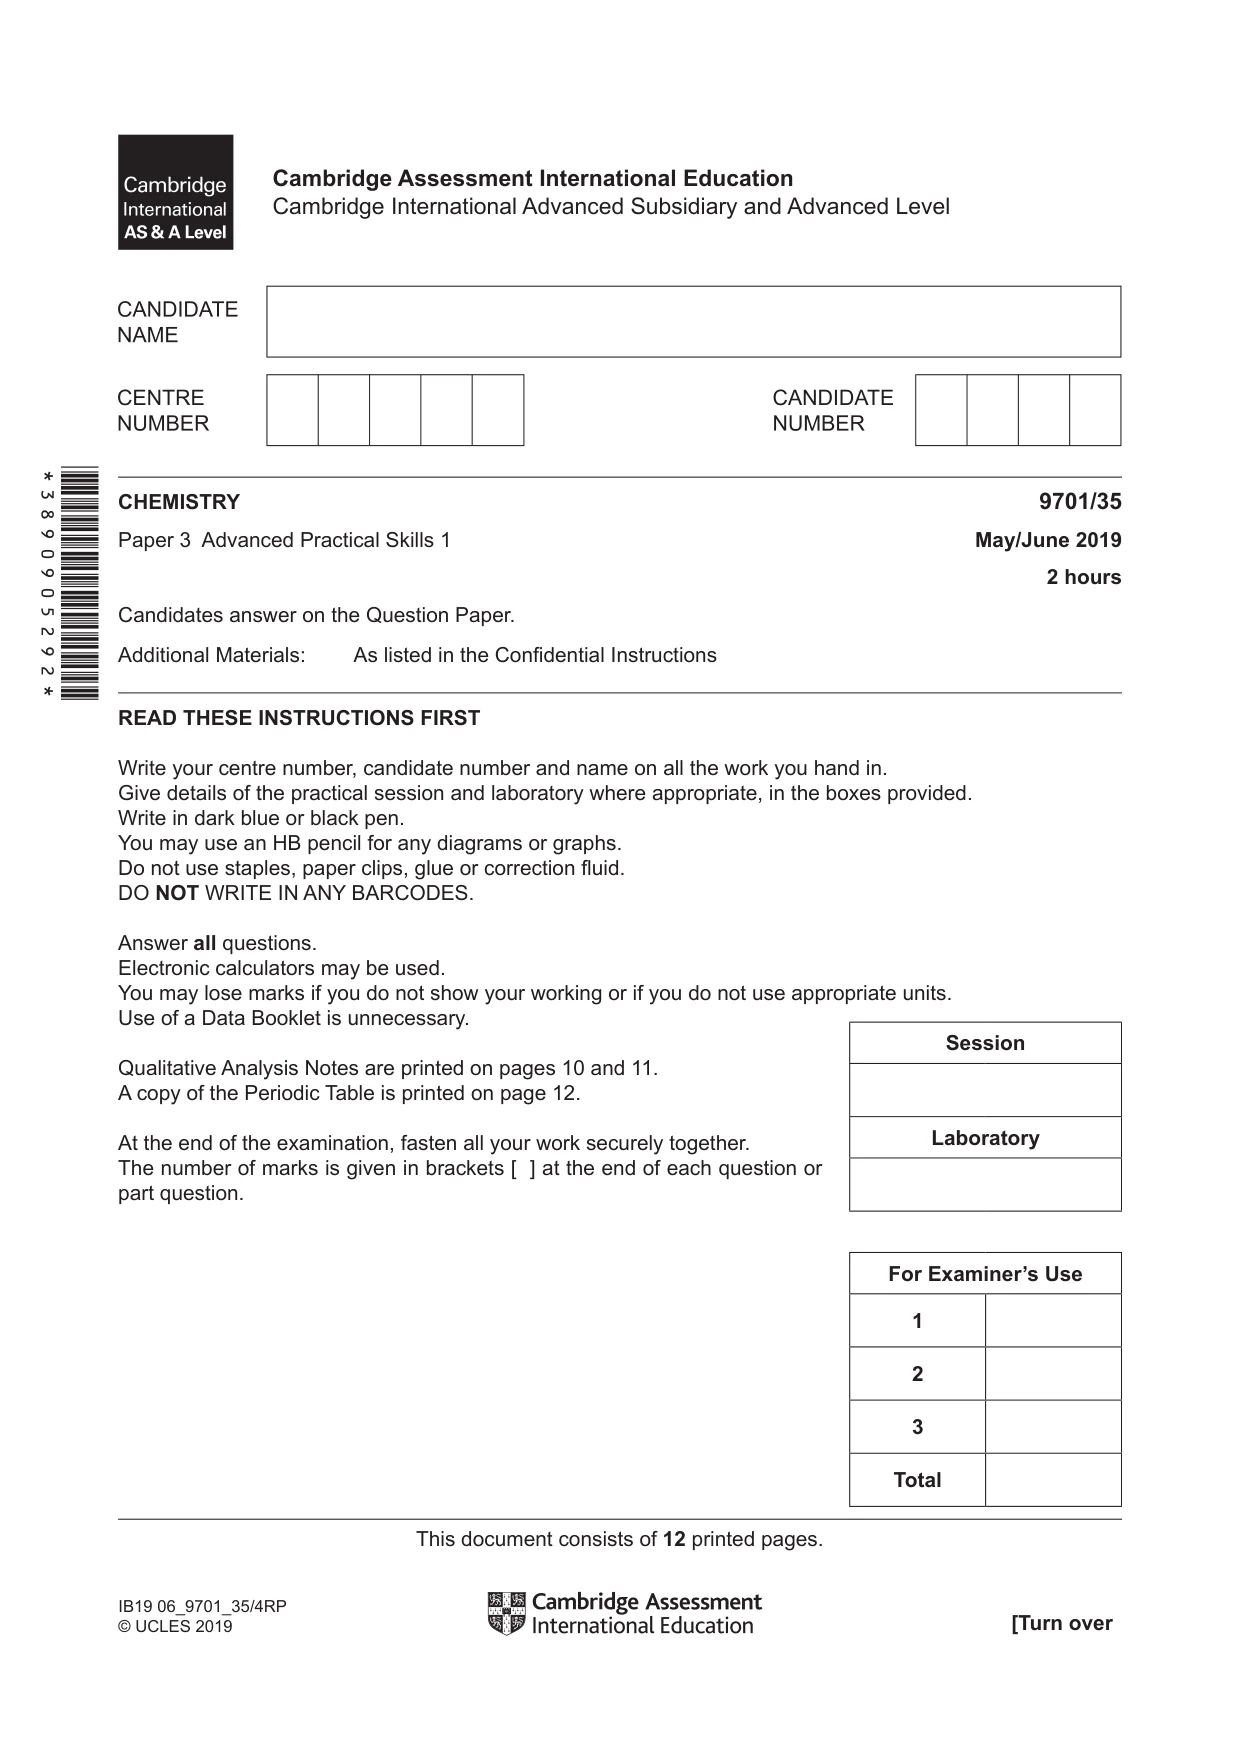
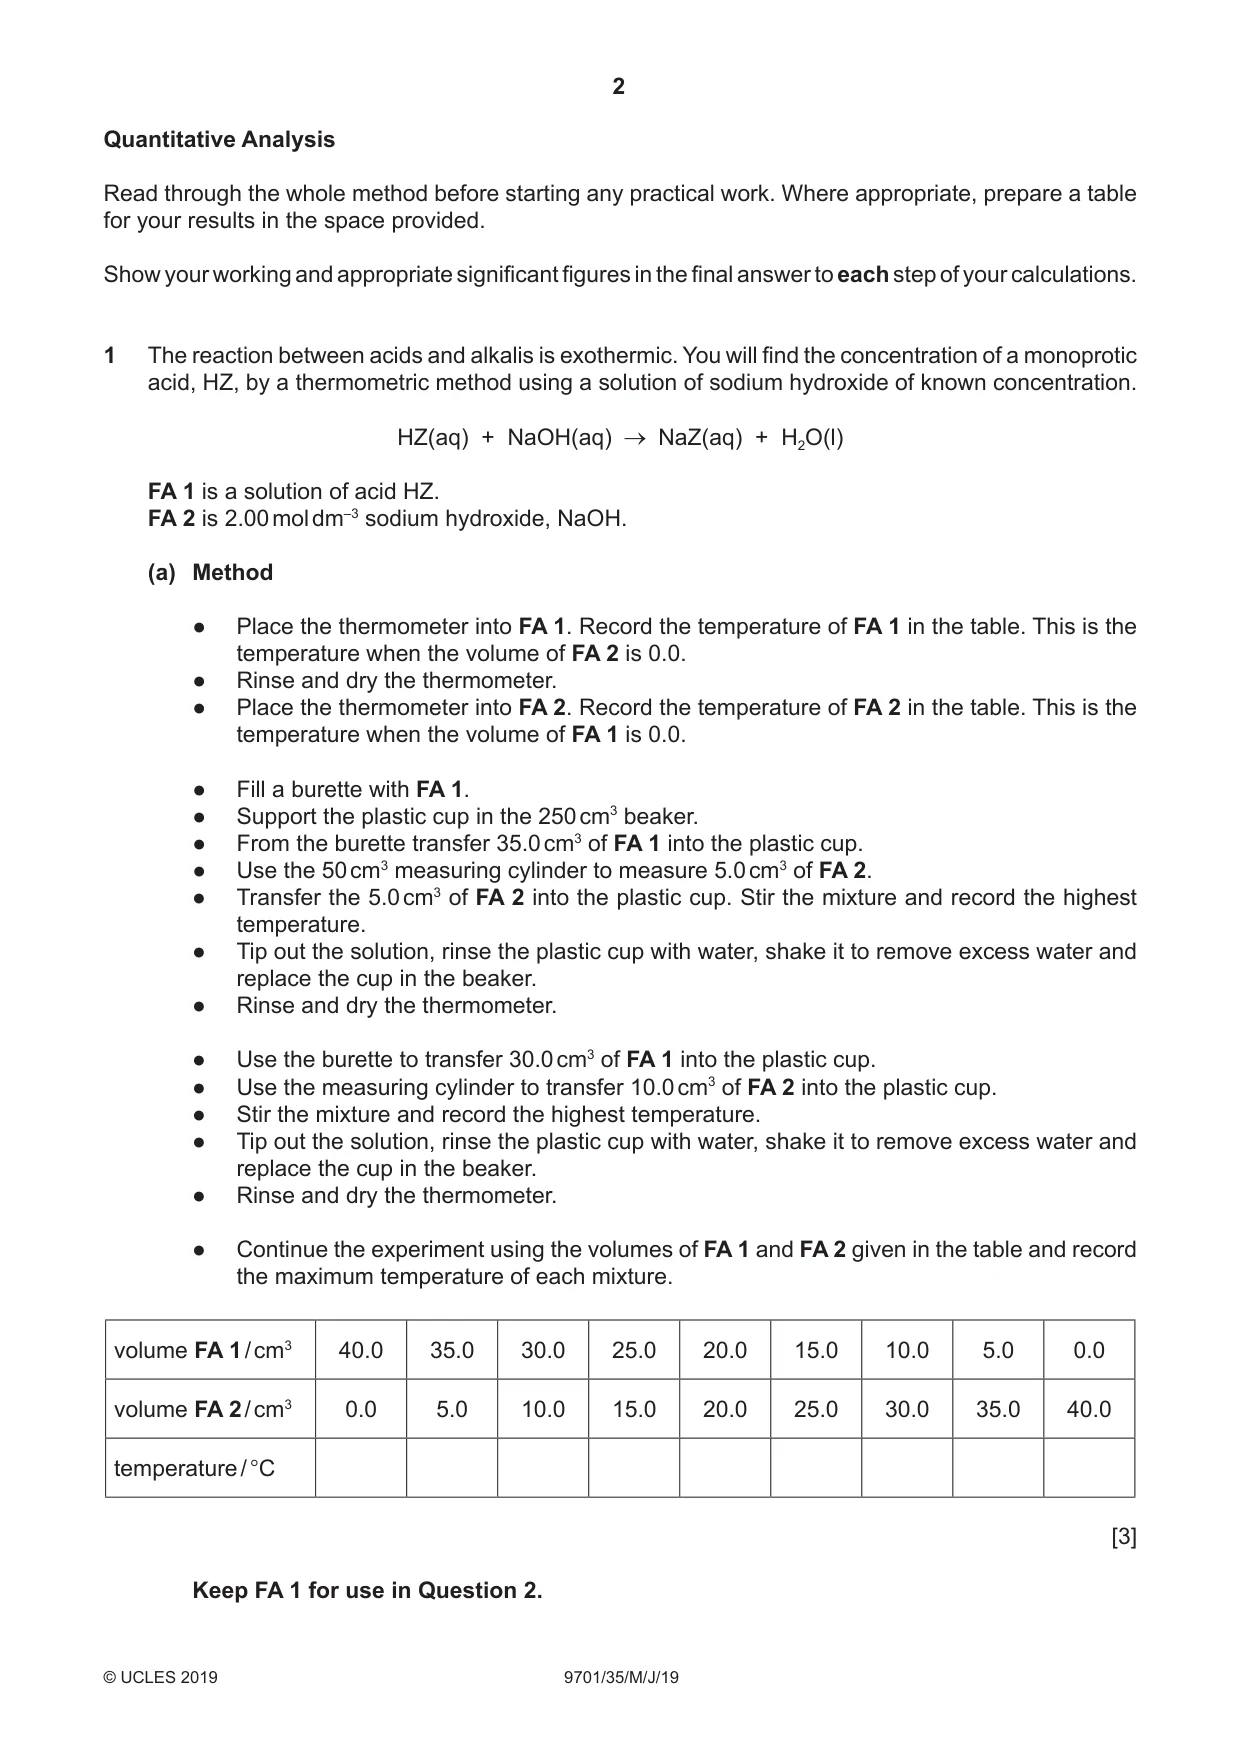
Mark scheme11 pages
Answers below. Sit the paper first if you are practising.

Questions as text
Q1 · The reaction between acids and alkalis is exothermic
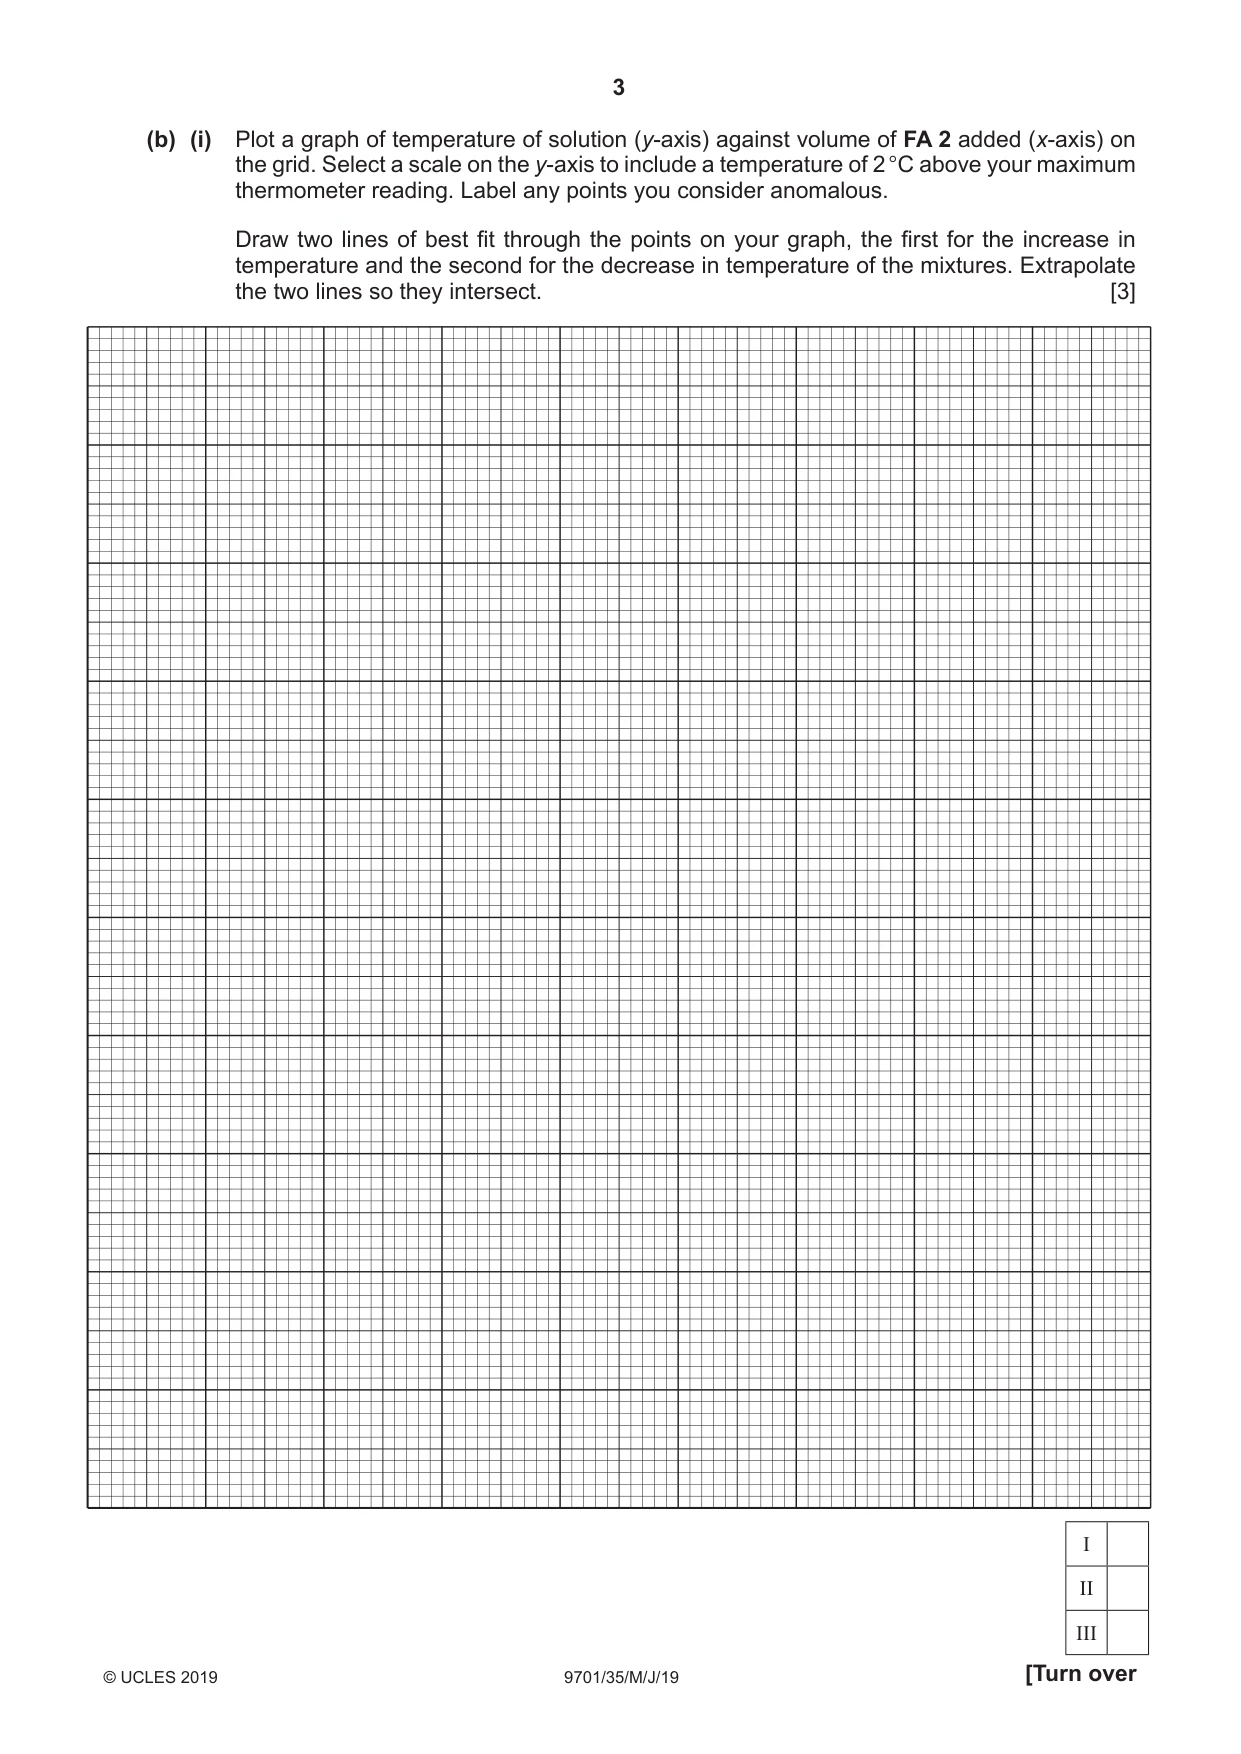
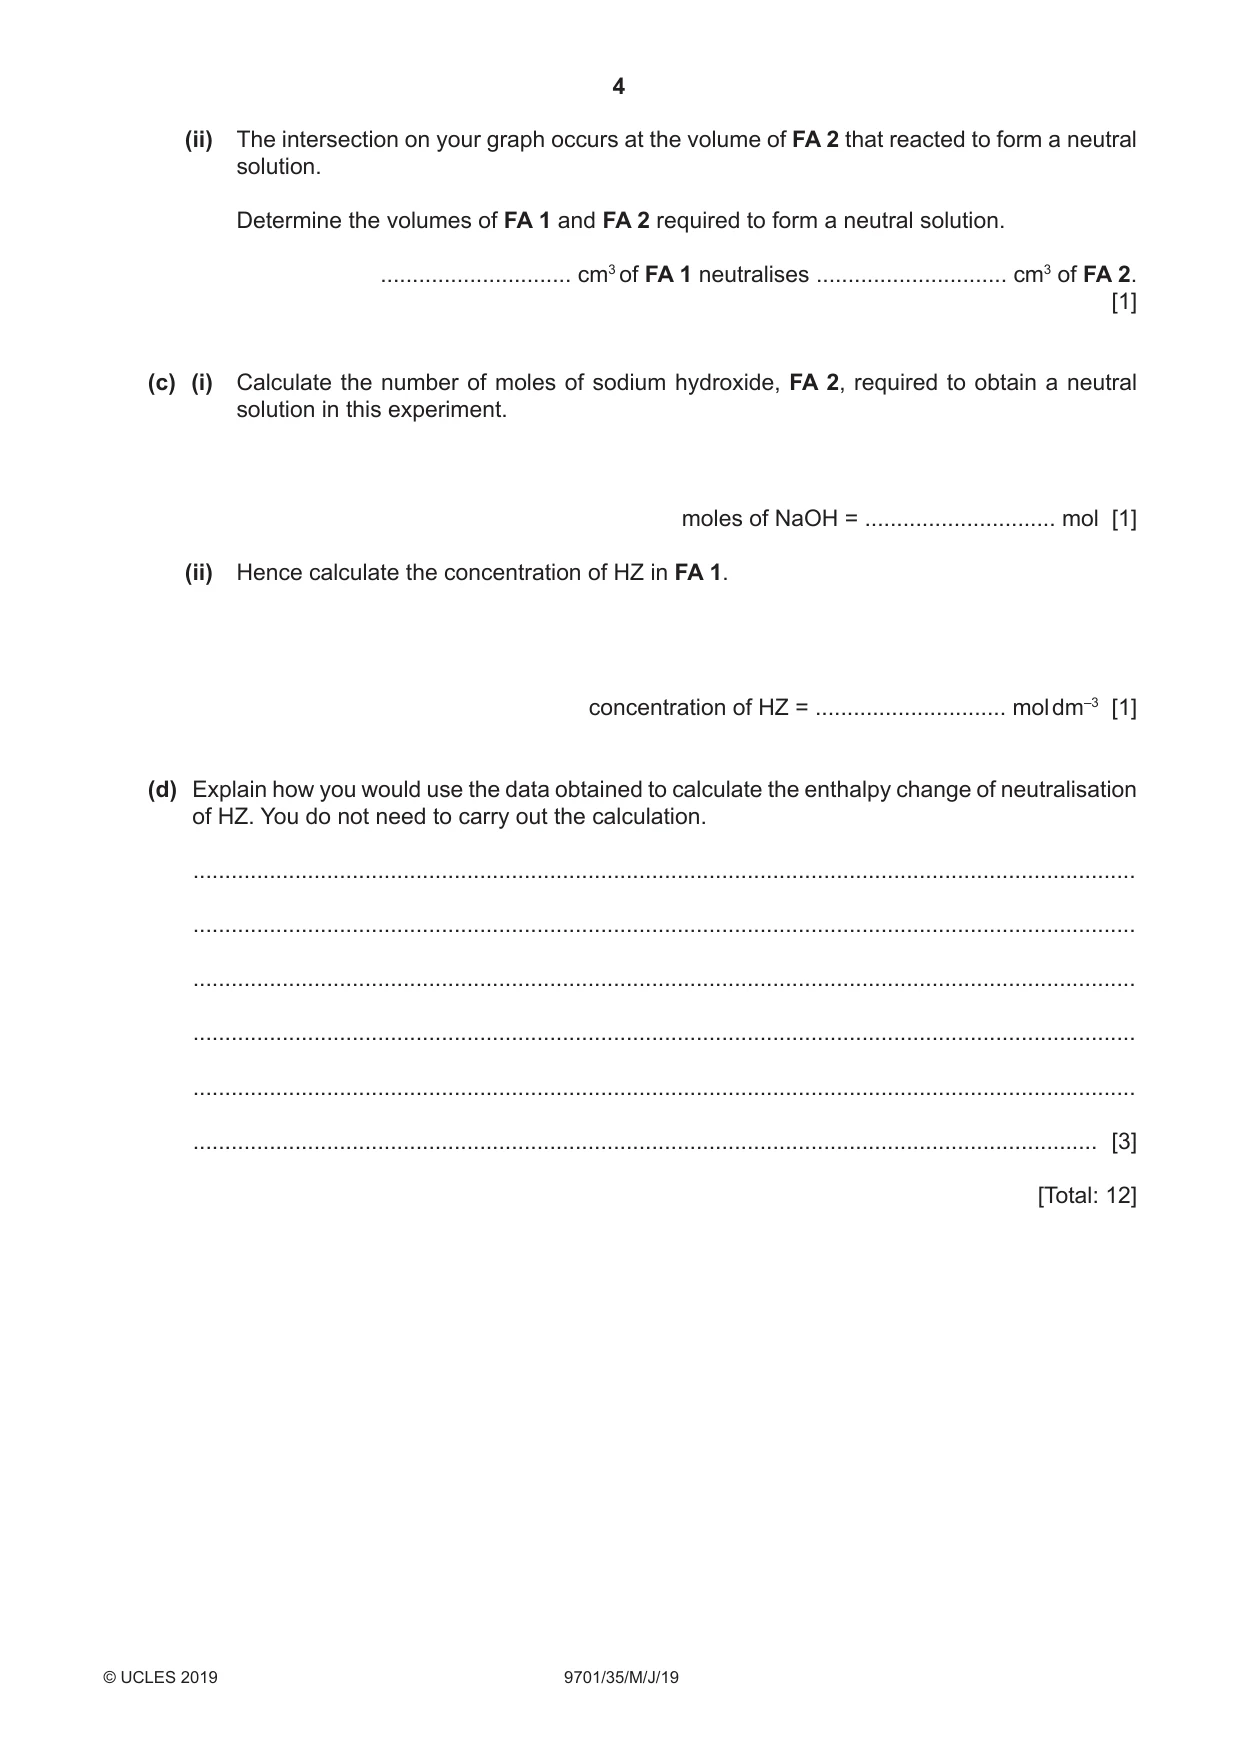
1 The reaction between acids and alkalis is exothermic. You will find the concentration of a monoprotic acid, HZ, by a thermometric method using a solution of sodium hydroxide of known concentration. HZ(aq) + NaOH(aq) NaZ(aq) + H2O(l) FA 1 is a solution of acid HZ. FA 2 is 2.00 mol dm–3 sodium hydroxide, NaOH. (a) Method ●● Place the thermometer into FA 1. Record the temperature of FA 1 in the table. This is the temperature when the volume of FA 2 is 0.0. ●● Rinse and dry the thermometer. ●● Place the thermometer into FA 2. Record the temperature of FA 2 in the table. This is the temperature when the volume of FA 1 is 0.0. ●● Fill a burette with FA 1. ●● Support the plastic cup in the 250 cm3 beaker. ●● From the burette transfer 35.0 cm3 of FA 1 into the plastic cup. ●● Use the 50 cm3 measuring cylinder to measure 5.0 cm3 of FA 2. ●● Transfer the 5.0 cm3 of FA 2 into the plastic cup. Stir the mixture and record the highest temperature. ●● Tip out the solution, rinse the plastic cup with water, shake it to remove excess water and replace the cup in the beaker. ●● Rinse and dry the thermometer. ●● Use the burette to transfer 30.0 cm3 of FA 1 into the plastic cup. ●● Use the measuring cylinder to transfer 10.0 cm3 of FA 2 into the plastic cup. ●● Stir the mixture and record the highest temperature. ●● Tip out the solution, rinse the plastic cup with water, shake it to remove excess water and replace the cup in the beaker. ●● Rinse and dry the thermometer. ●● Continue the experiment using the volumes of FA 1 and FA 2 given in the table and record the maximum temperature of each mixture. volume FA 1 / cm3 40.0 35.0 30.0 25.0 20.0 15.0 10.0 5.0 0.0 volume FA 2 / cm3 0.0 5.0 10.0 15.0 20.0 25.0 30.0 35.0 40.0 temperature / °C [3] Keep FA 1 for use in Question 2. (ii) The intersection on your graph occurs at the volume of FA 2 that reacted to form a neutral solution. Determine the volumes of FA 1 and FA 2 required to form a neutral solution. .............................. cm3 of FA 1 neutralises .............................. cm3 of FA 2. [1] (c) (i) Calculate the number of moles of sodium hydroxide, FA 2, required to obtain a neutral solution in this experiment. moles of NaOH = .............................. mol [1] (ii) Hence calculate the concentration of HZ in FA 1. concentration of HZ = .............................. mol dm‒3 [1] (d) Explain how you would use the data obtained to calculate the enthalpy change of neutralisation of HZ. You do not need to carry out the calculation. .................................................................................................................................................... .................................................................................................................................................... .................................................................................................................................................... .................................................................................................................................................... .................................................................................................................................................... .............................................................................................................................................. [3] [Total: 12]
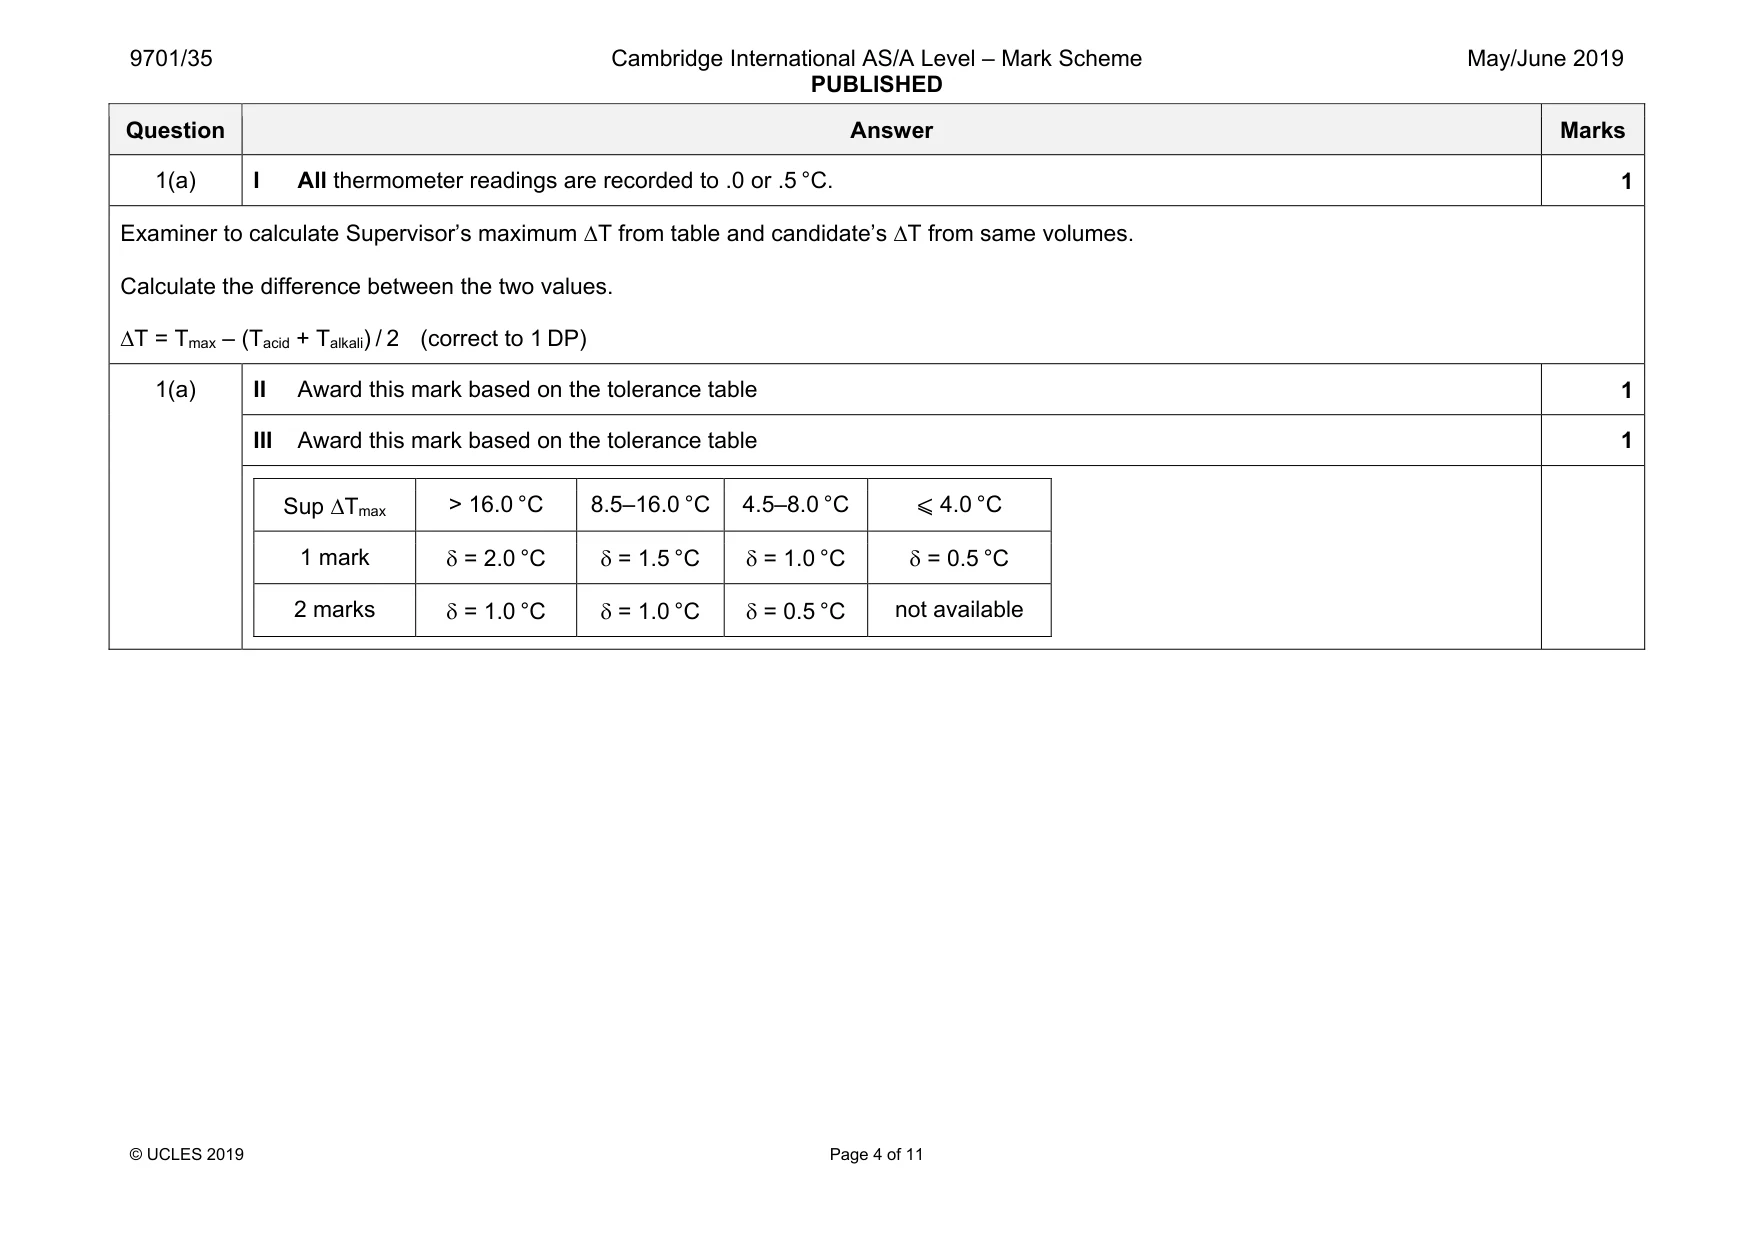
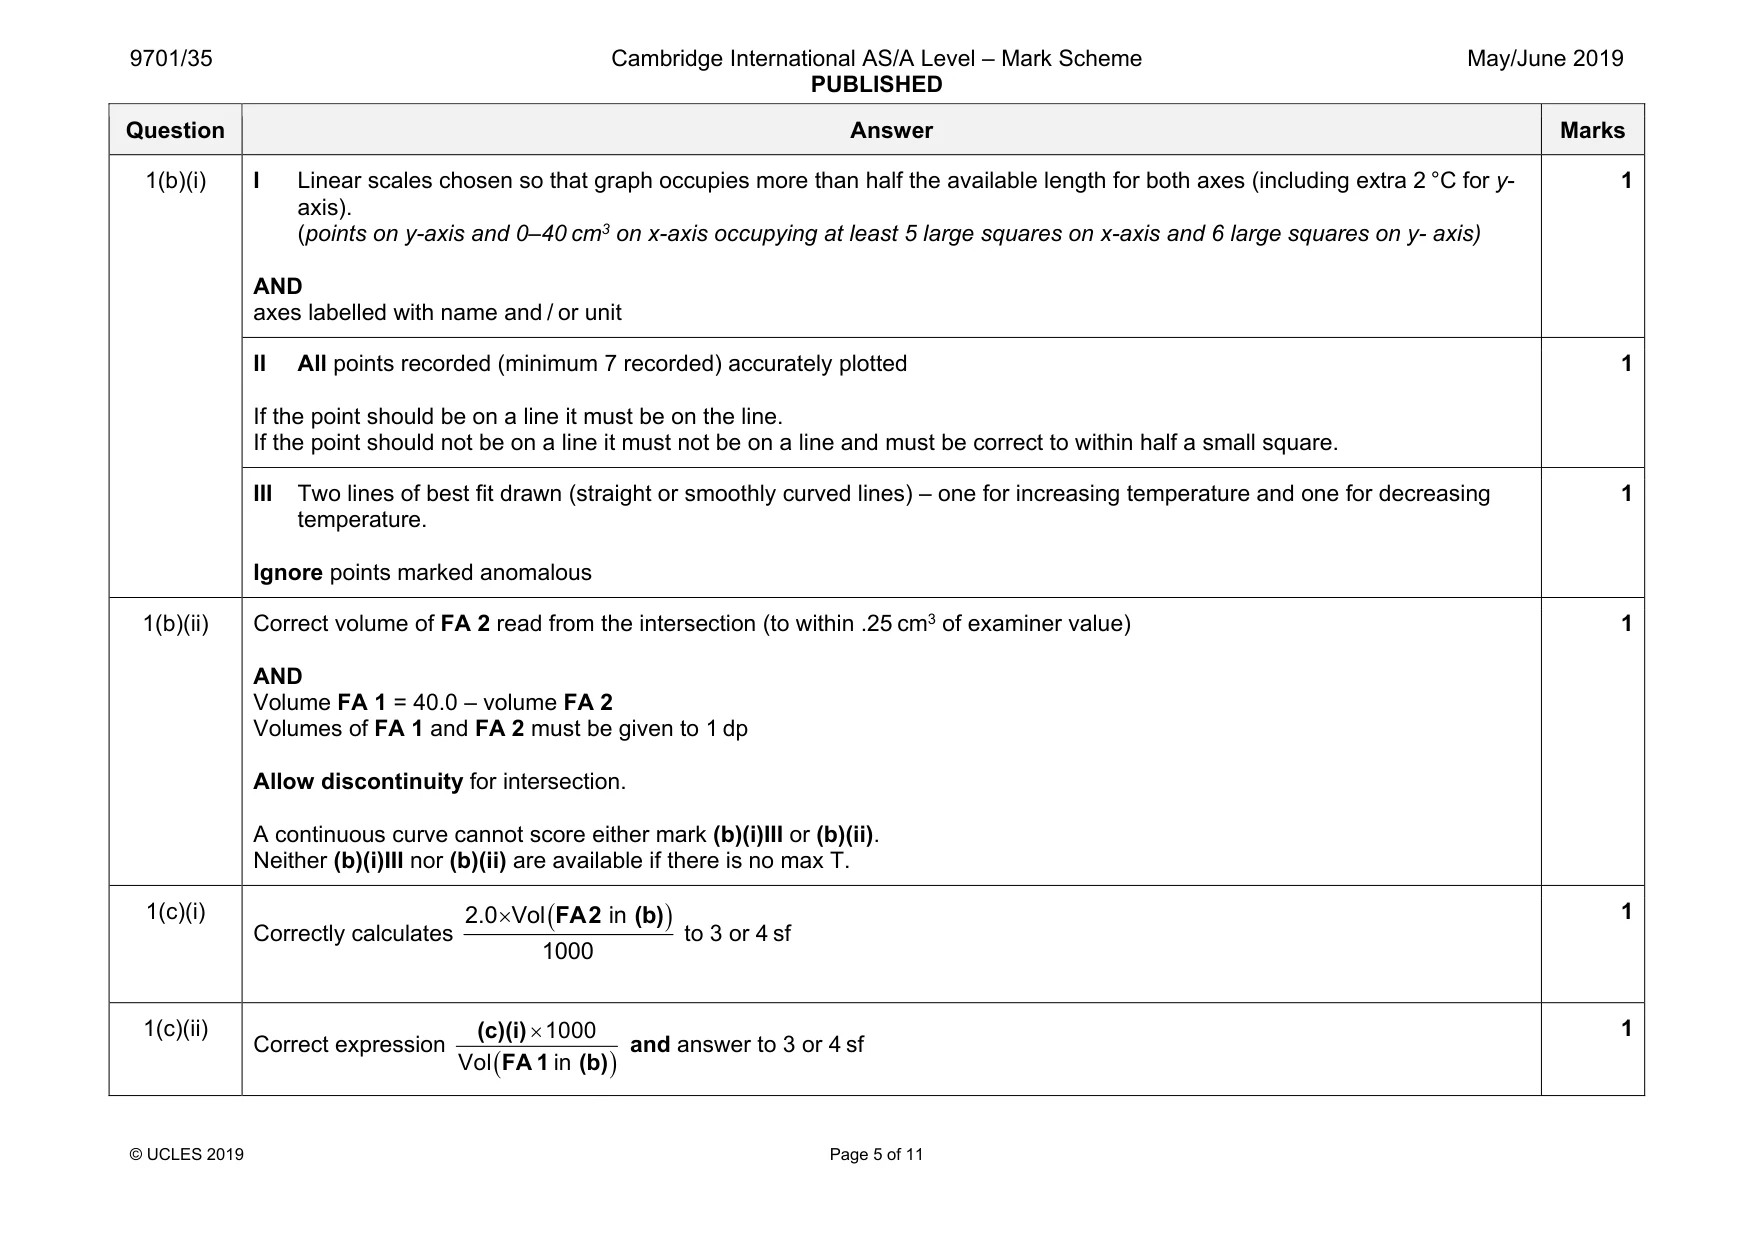
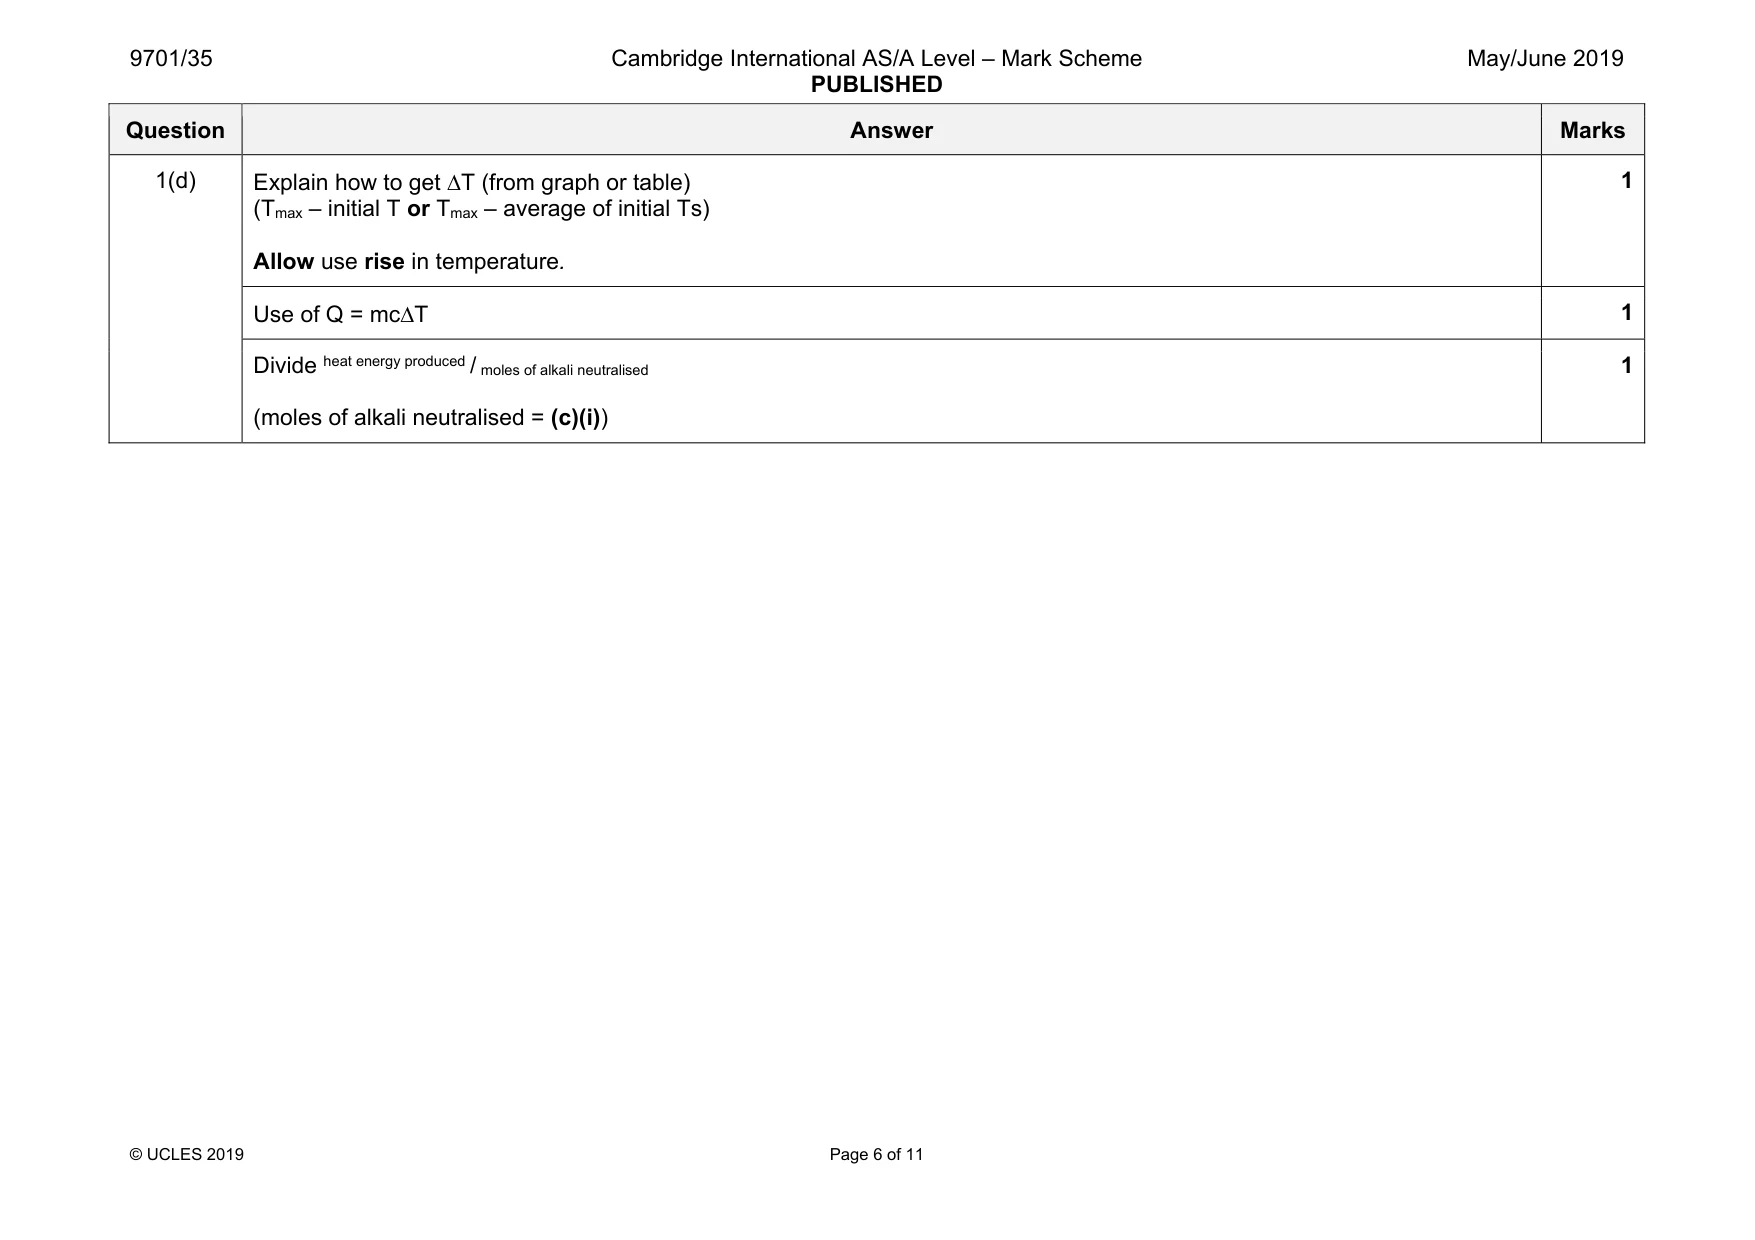
Mark scheme: 1(a) I All thermometer readings are recorded to .0 or .5 °C. 1 Examiner to calculate Supervisor’s maximum ∆T from table and candidate’s ∆T from same volumes. Calculate the difference between the two values. ∆T = Tmax – (Tacid + Talkali) / 2 (correct to 1 DP) 1(a) II Award this mark based on the tolerance table 1 III Award this mark based on the tolerance table 1 Sup ∆Tmax > 16.0 °C 8.5–16.0 °C 4.5–8.0 °C ⩽ 4.0 °C 1 mark δ = 2.0 °C δ = 1.5 °C δ = 1.0 °C δ = 0.5 °C 2 marks δ = 1.0 °C δ = 1.0 °C δ = 0.5 °C not available Question Answer Marks 1(b)(i) I Linear scales chosen so that graph occupies more than half the available length for both axes (including extra 2 °C for y- axis). (points on y-axis and 0–40 cm3 on x-axis occupying at least 5 large squares on x-axis and 6 large squares on y- axis) AND axes labelled with name and / or unit 1 II All points recorded (minimum 7 recorded) accurately plotted If the point should be on a line it must be on the line. If the point should not be on a line it must not be on a line and must be correct to within half a small square. 1 III Two lines of best fit drawn (straight or smoothly curved lines) – one for increasing temperature and one for decreasing temperature. Ignore points marked anomalous 1 1(b)(ii) Correct volume of FA 2 read from the intersection (to within .25 cm3 of examiner value) AND Volume FA 1 = 40.0 – volume FA 2 Volumes of FA 1 and FA 2 must be given to 1 dp Allow discontinuity for intersection. A continuous curve cannot score either mark (b)(i)III or (b)(ii). Neither (b)(i)III nor (b)(ii) are available if there is no max T. 1 1(c)(i) Correctly calculates ( ) 2.0 Vol in 1000 × FA2 (b) to 3 or 4 sf 1 1(c)(ii) Correct expression ( ) 1000 Vol in × (c)(i) FA 1 (b) and answer to 3 or 4 sf 1 Question Answer Marks 1(d) Explain how to get ∆T (from graph or table) (Tmax – initial T or Tmax – average of initial Ts) Allow use rise in temperature. 1 Use of Q = mc∆T 1 Divide heat energy produced / moles of alkali neutralised (moles of alkali neutralised = (c)(i)) 1
Q2 · You will now determine the concentration of HZ in FA 1 by titration using aqueous sodium…
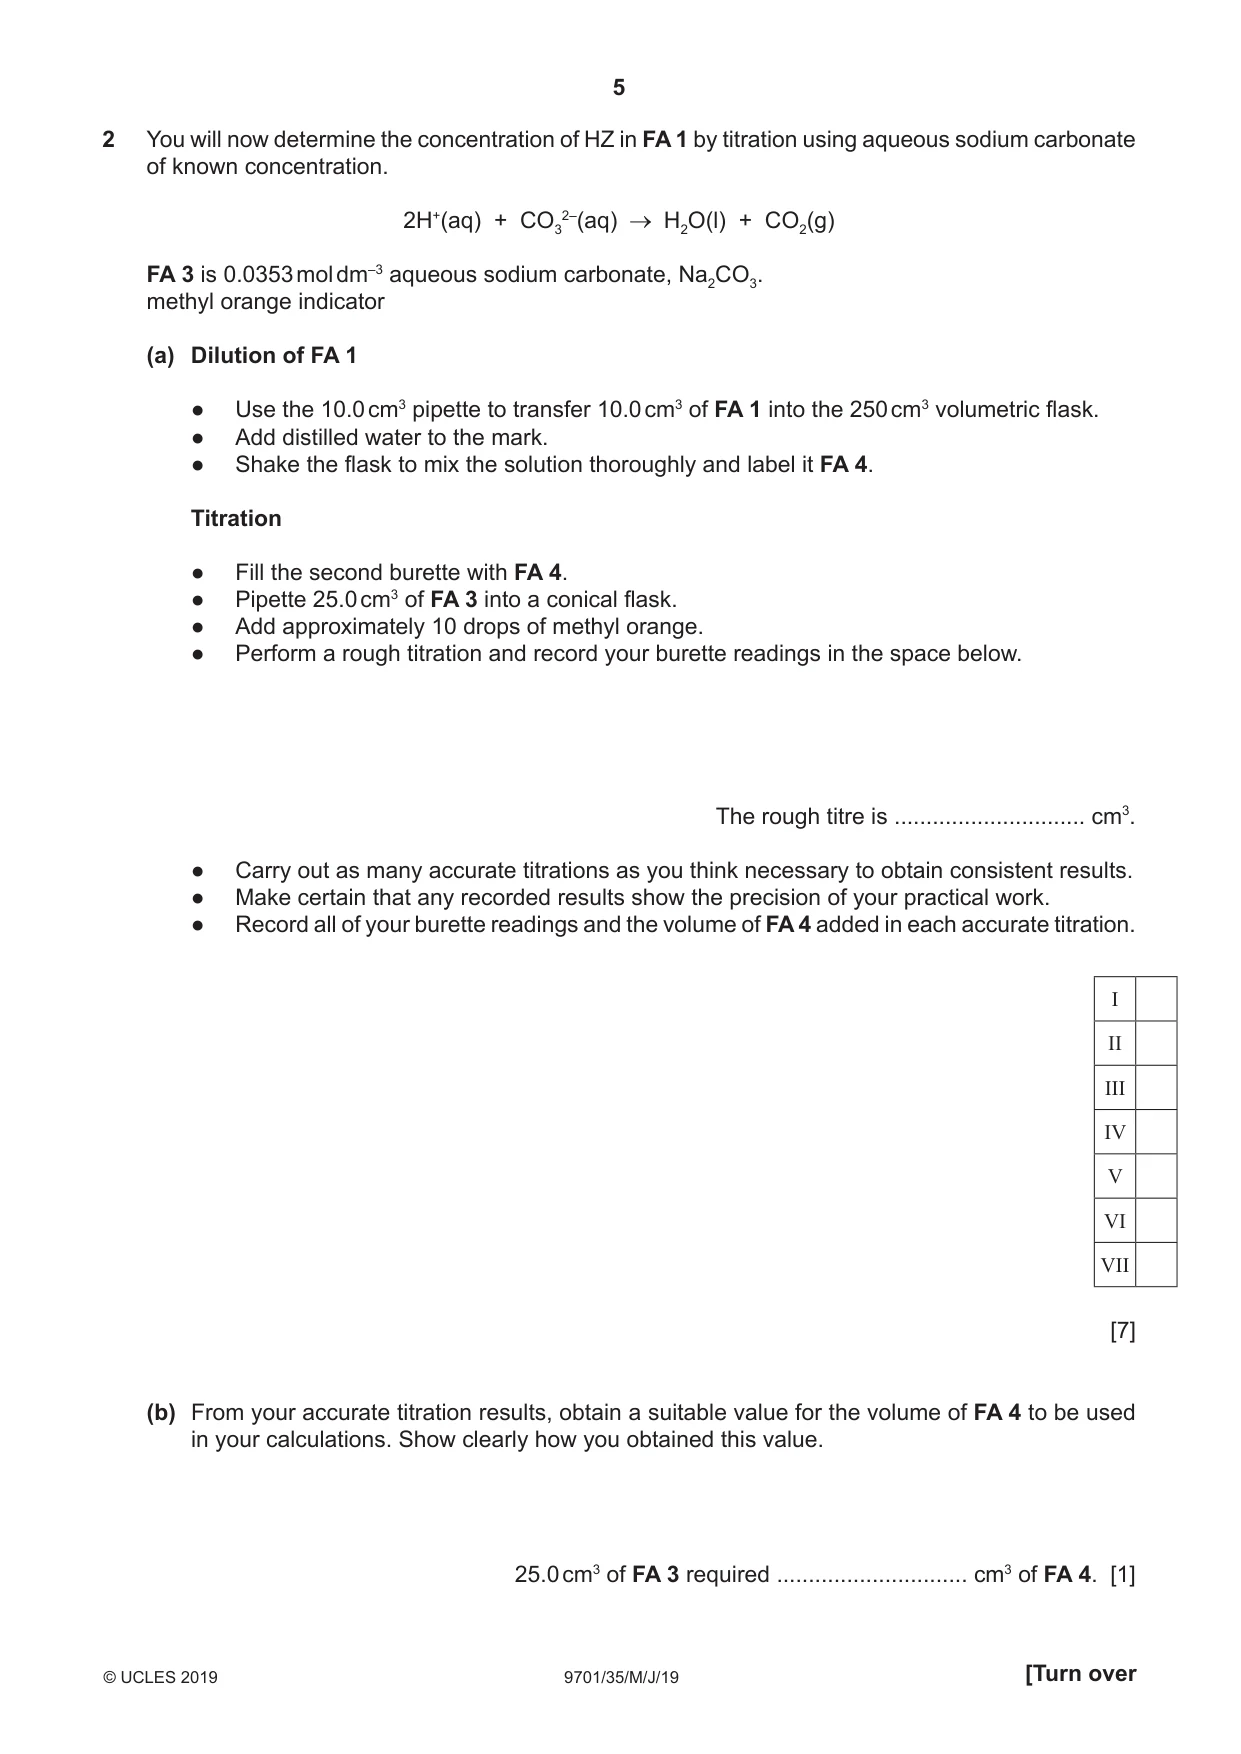
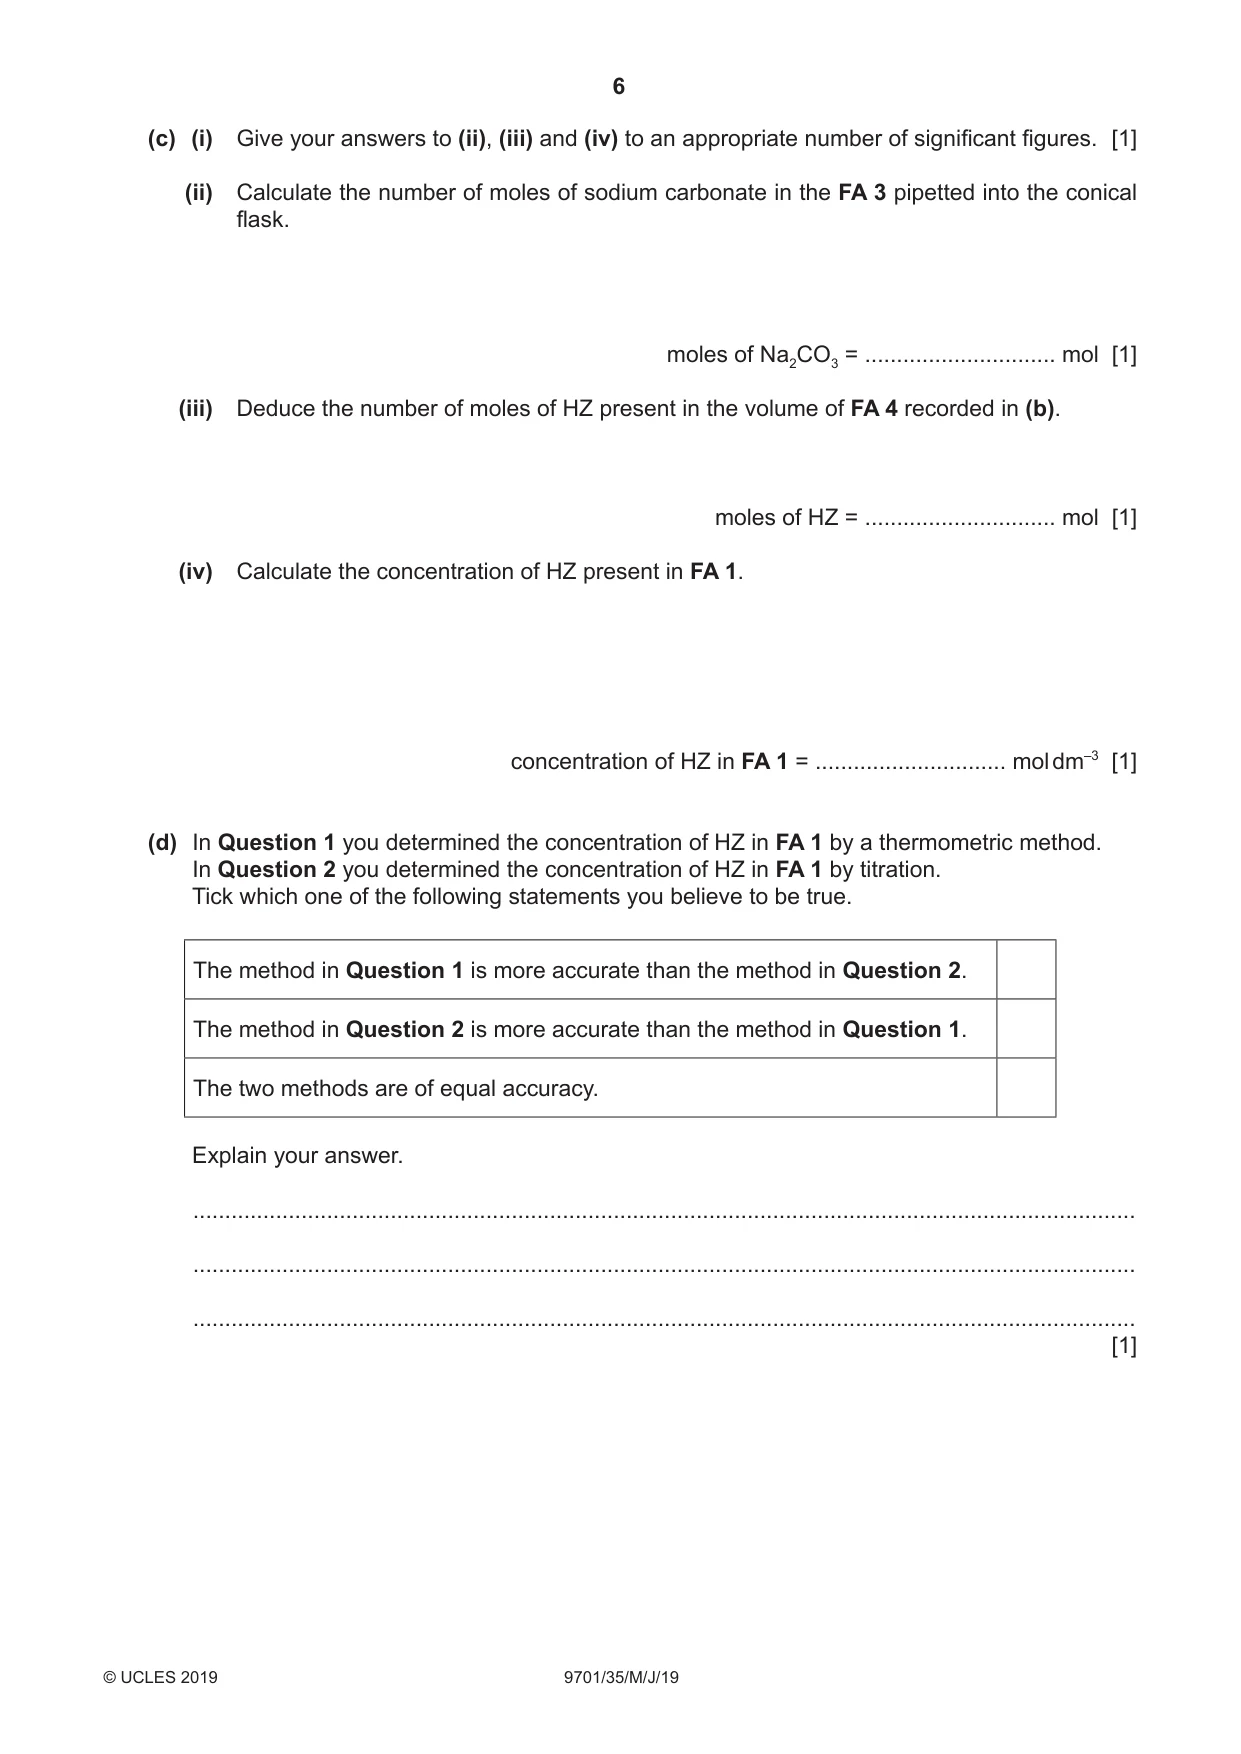
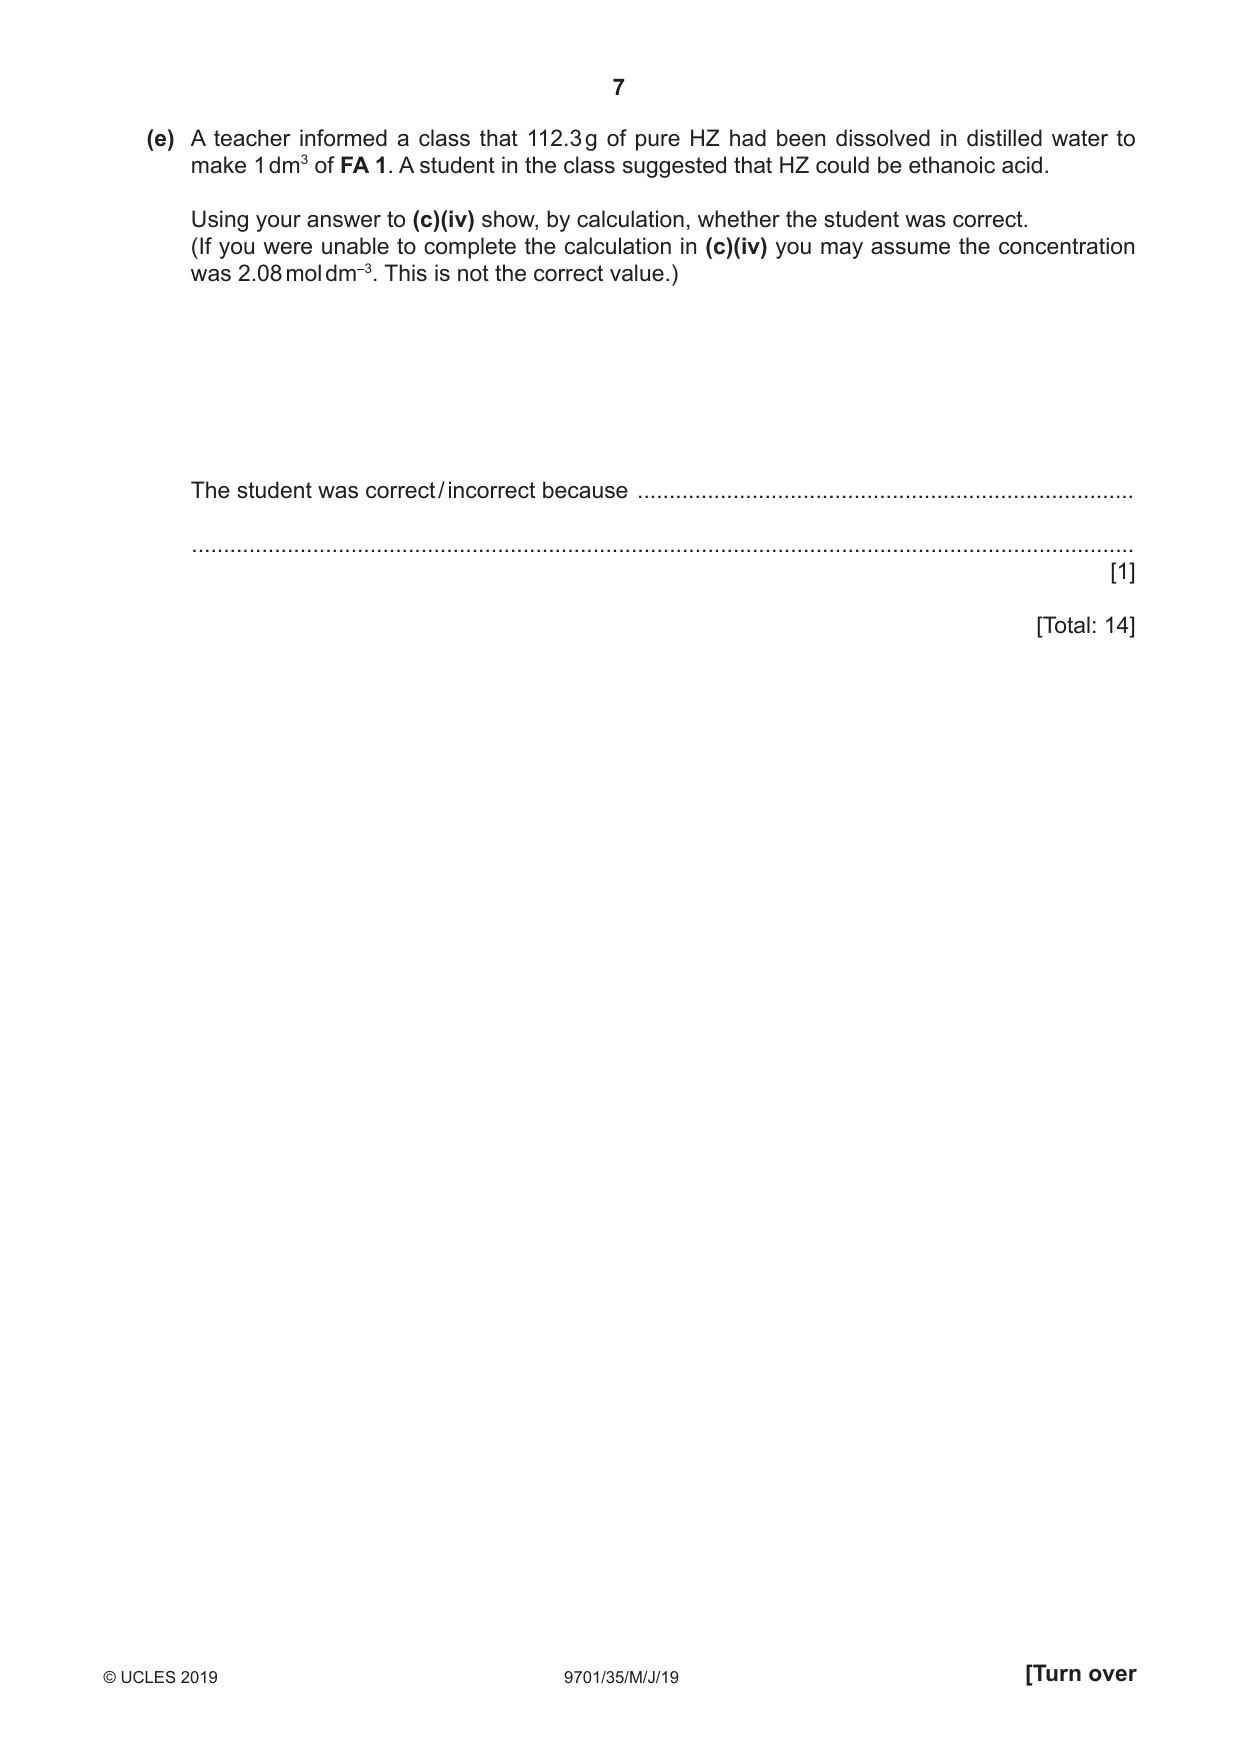
2 You will now determine the concentration of HZ in FA 1 by titration using aqueous sodium carbonate of known concentration. 2H+(aq) + CO32–(aq) H2O(l) + CO2(g) FA 3 is 0.0353 mol dm‒3 aqueous sodium carbonate, Na2CO3. methyl orange indicator (a) Dilution of FA 1 ●● Use the 10.0 cm3 pipette to transfer 10.0 cm3 of FA 1 into the 250 cm3 volumetric flask. ●● Add distilled water to the mark. ●● Shake the flask to mix the solution thoroughly and label it FA 4. Titration ●● Fill the second burette with FA 4. ●● Pipette 25.0 cm3 of FA 3 into a conical flask. ●● Add approximately 10 drops of methyl orange. ●● Perform a rough titration and record your burette readings in the space below. The rough titre is .............................. cm3. ●● Carry out as many accurate titrations as you think necessary to obtain consistent results. ●● Make certain that any recorded results show the precision of your practical work. ●● Record all of your burette readings and the volume of FA 4 added in each accurate titration. I II III IV V VI VII [7] (b) From your accurate titration results, obtain a suitable value for the volume of FA 4 to be used in your calculations. Show clearly how you obtained this value. 25.0 cm3 of FA 3 required .............................. cm3 of FA 4. [1] (c) (i) Give your answers to (ii), (iii) and (iv) to an appropriate number of significant figures. [1] (ii) Calculate the number of moles of sodium carbonate in the FA 3 pipetted into the conical flask. moles of Na2CO3 = .............................. mol [1] (iii) Deduce the number of moles of HZ present in the volume of FA 4 recorded in (b). moles of HZ = .............................. mol [1] (iv) Calculate the concentration of HZ present in FA 1. concentration of HZ in FA 1 = .............................. mol dm‒3 [1] (d) In Question 1 you determined the concentration of HZ in FA 1 by a thermometric method. In Question 2 you determined the concentration of HZ in FA 1 by titration. Tick which one of the following statements you believe to be true. The method in Question 1 is more accurate than the method in Question 2. The method in Question 2 is more accurate than the method in Question 1. The two methods are of equal accuracy. Explain your answer. .................................................................................................................................................... .................................................................................................................................................... .................................................................................................................................................... [1] (e) A teacher informed a class that 112.3 g of pure HZ had been dissolved in distilled water to make 1 dm3 of FA 1. A student in the class suggested that HZ could be ethanoic acid. Using your answer to (c)(iv) show, by calculation, whether the student was correct. (If you were unable to complete the calculation in (c)(iv) you may assume the concentration was 2.08 mol dm‒3. This is not the correct value.) The student was correct / incorrect because ............................................................................... .................................................................................................................................................... [1] [Total: 14] Qualitative Analysis Where reagents are selected for use in a test, the name or correct formula of the element or compound must be given. At each stage of any test you are to record details of the following: ● colour changes seen; ● the formation of any precipitate and its solubility in an excess of the reagent added; ● the formation of any gas and its identification by a suitable test. You should indicate clearly at what stage in a test a change occurs. If any solution is warmed, a boiling tube must be used. Rinse and reuse test-tubes and boiling tubes where possible. No additional tests for ions present should be attempted.
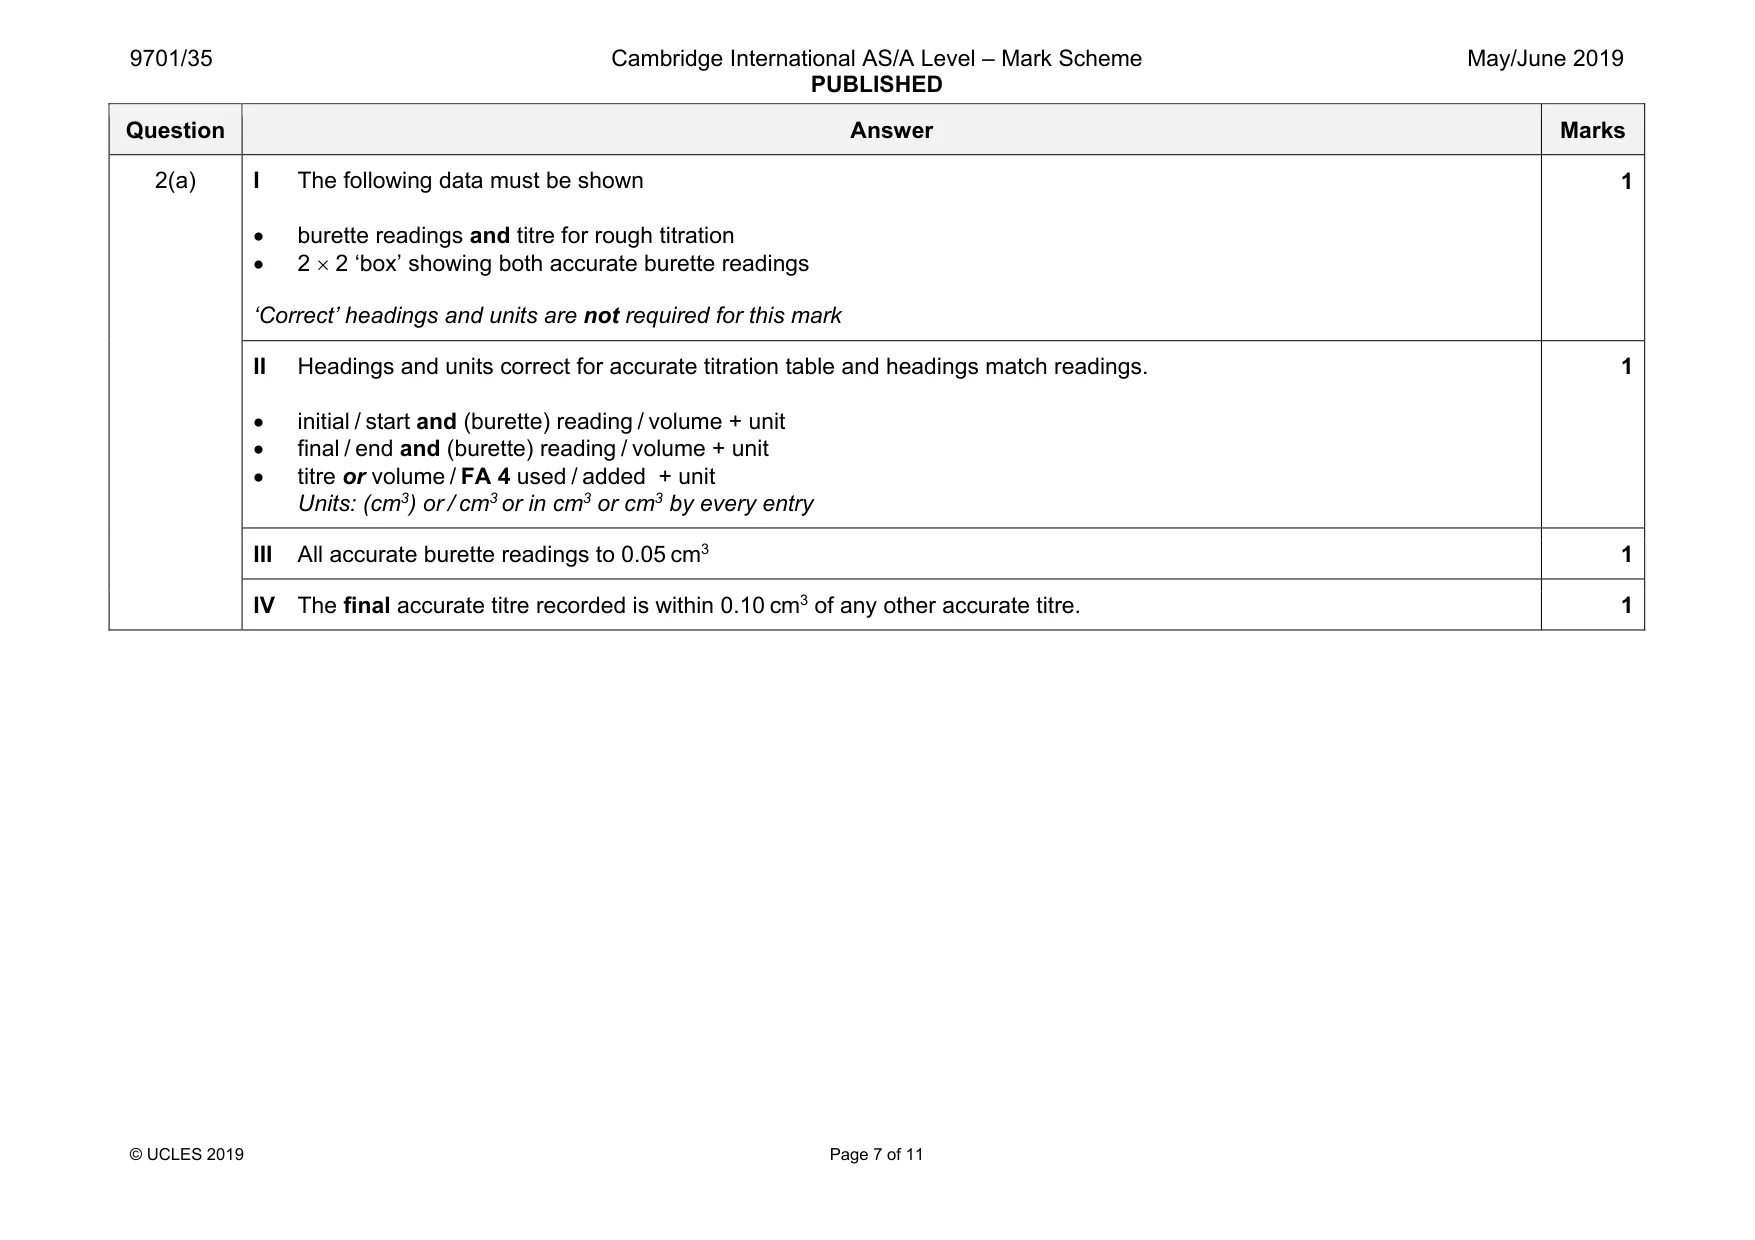
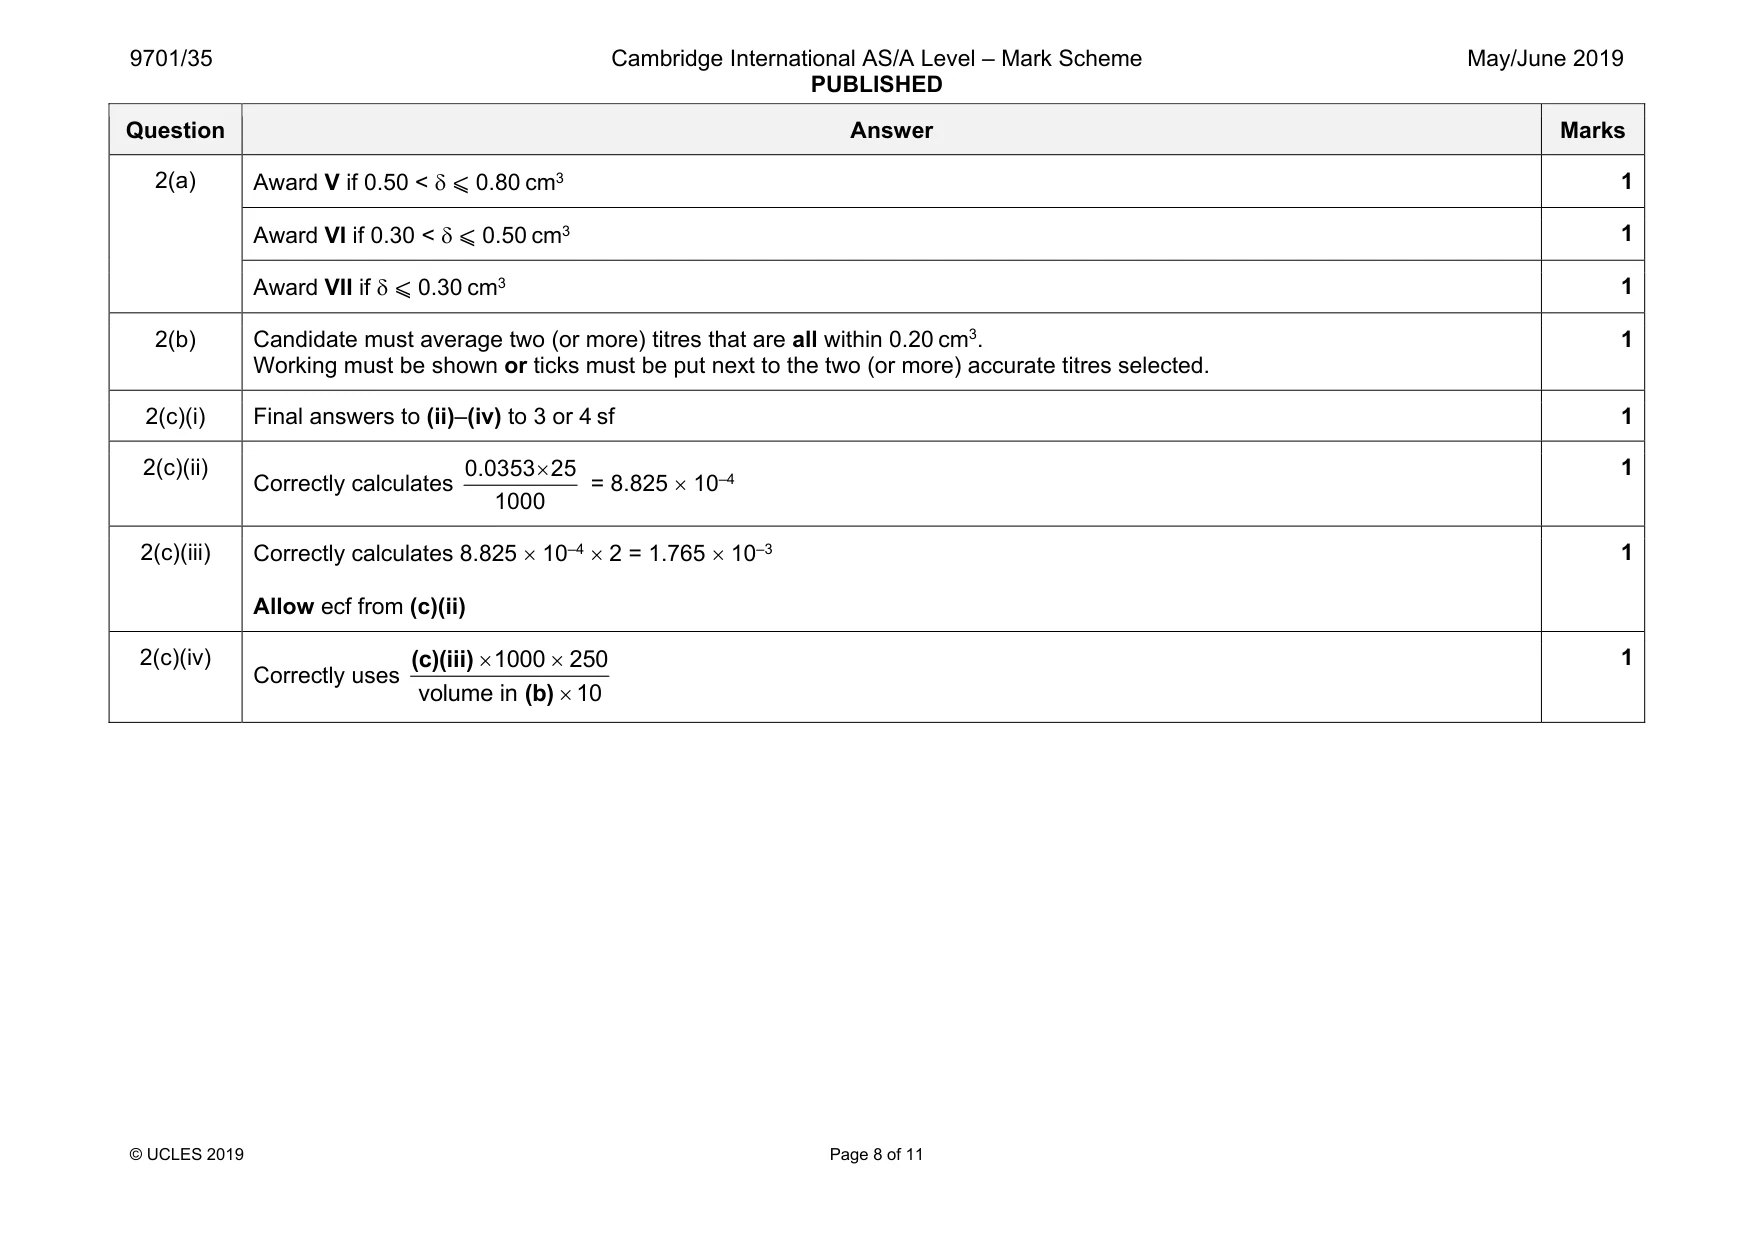
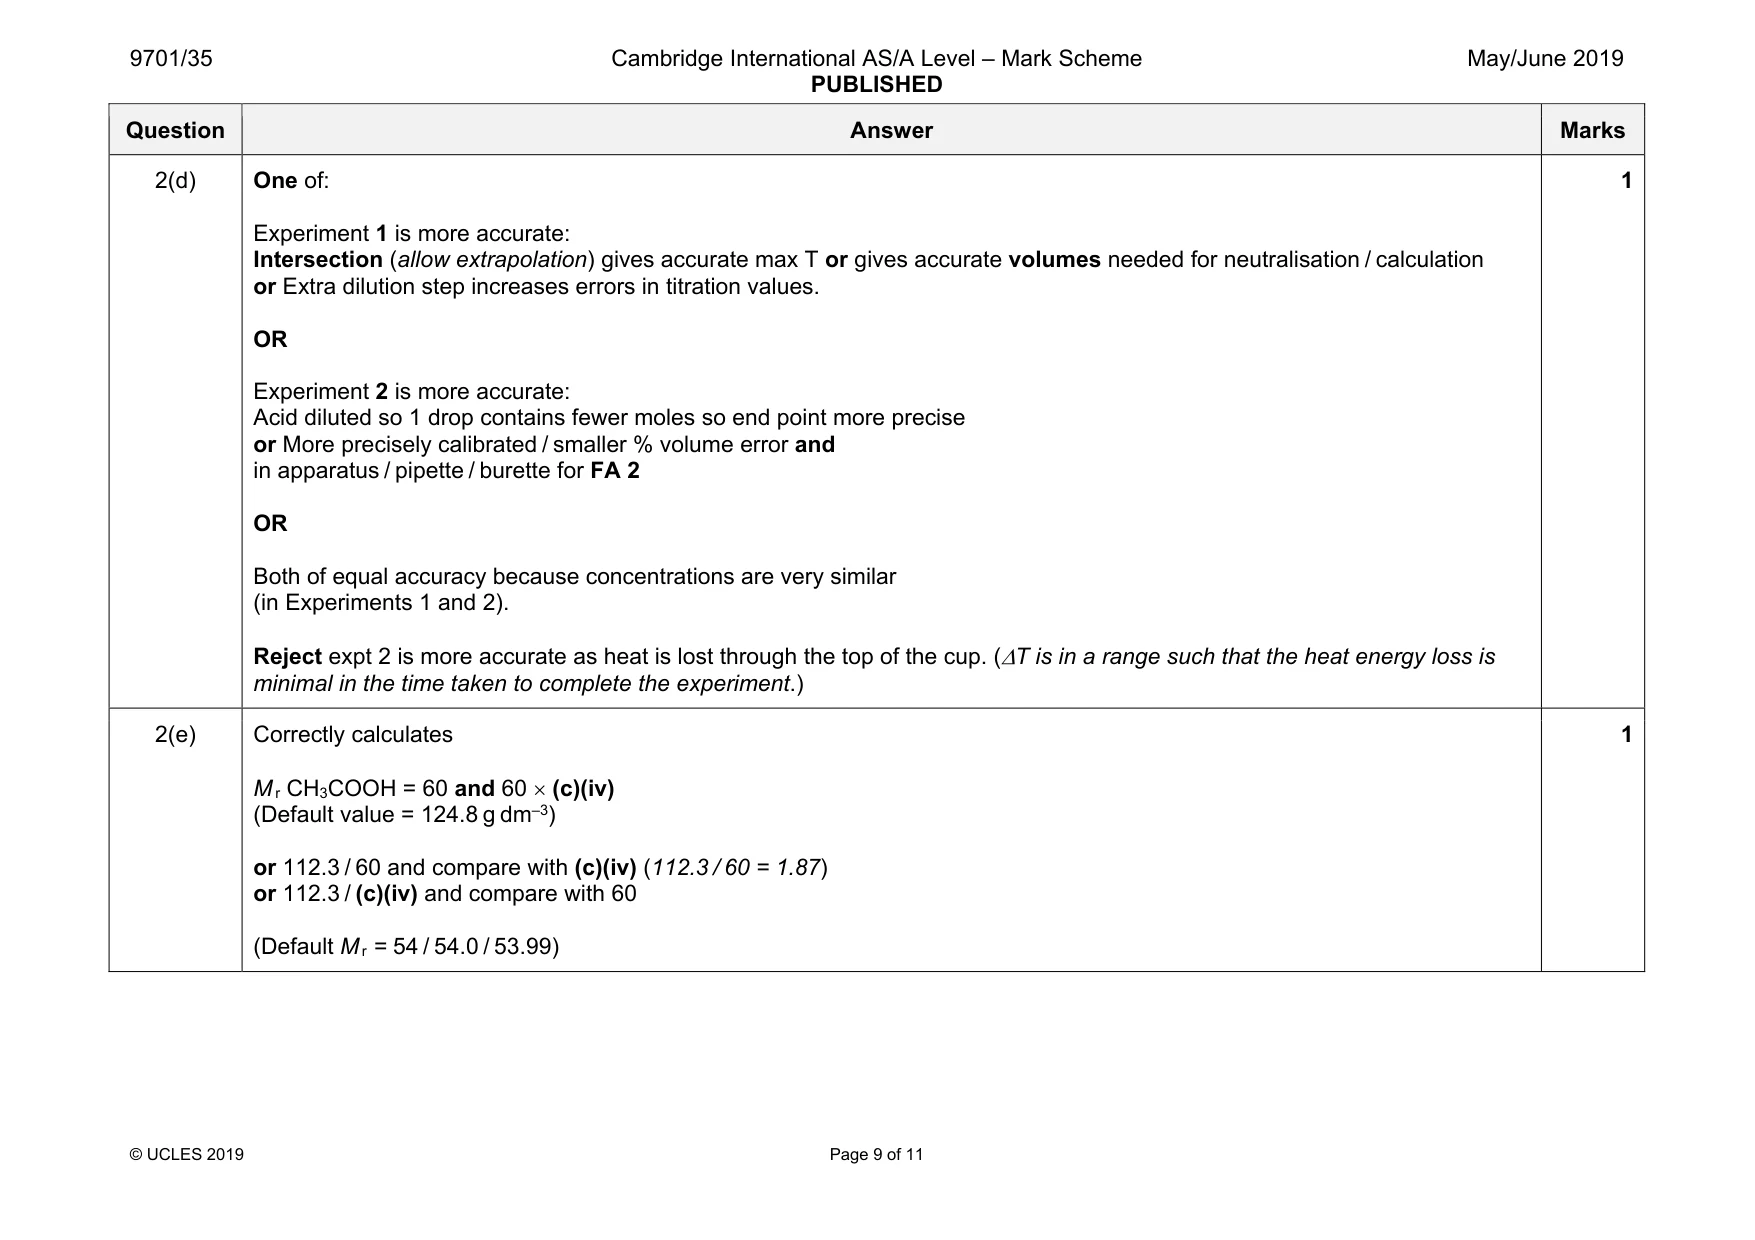
Mark scheme: 2(a) I The following data must be shown • burette readings and titre for rough titration • 2 × 2 ‘box’ showing both accurate burette readings ‘Correct’ headings and units are not required for this mark 1 II Headings and units correct for accurate titration table and headings match readings. • initial / start and (burette) reading / volume + unit • final / end and (burette) reading / volume + unit • titre or volume / FA 4 used / added + unit Units: (cm3) or / cm3 or in cm3 or cm3 by every entry 1 III All accurate burette readings to 0.05 cm3 1 IV The final accurate titre recorded is within 0.10 cm3 of any other accurate titre. 1 Question Answer Marks 2(a) Award V if 0.50 < δ ⩽ 0.80 cm3 1 Award VI if 0.30 < δ ⩽ 0.50 cm3 1 Award VII if δ ⩽ 0.30 cm3 1 2(b) Candidate must average two (or more) titres that are all within 0.20 cm3. Working must be shown or ticks must be put next to the two (or more) accurate titres selected. 1 2(c)(i) Final answers to (ii)–(iv) to 3 or 4 sf 1 2(c)(ii) Correctly calculates 0.0353 25 1000 × = 8.825 × 10⁻⁴ 1 2(c)(iii) Correctly calculates 8.825 × 10–4 × 2 = 1.765 × 10⁻³ Allow ecf from (c)(ii) 1 2(c)(iv) Correctly uses 1000 250 volume in 1 0 × × × (c)(iii) (b) 1 Question Answer Marks 2(d) One of: Experiment 1 is more accurate: Intersection (allow extrapolation) gives accurate max T or gives accurate volumes needed for neutralisation / calculation or Extra dilution step increases errors in titration values. OR Experiment 2 is more accurate: Acid diluted so 1 drop contains fewer moles so end point more precise or More precisely calibrated / smaller % volume error and in apparatus / pipette / burette for FA 2 OR Both of equal accuracy because concentrations are very similar (in Experiments 1 and 2). Reject expt 2 is more accurate as heat is lost through the top of the cup. (∆T is in a range such that the heat energy loss is minimal in the time taken to complete the experiment.) 1 2(e) Correctly calculates M r CH3COOH = 60 and 60 × (c)(iv) (Default value = 124.8 g dm‒3) or 112.3 / 60 and compare with (c)(iv) (112.3 / 60 = 1.87) or 112.3 / (c)(iv) and compare with 60 (Default M r = 54 / 54.0 / 53.99) 1
More questions on Reacting masses and volumes (of solutions and gases)
Q3 · FA 5, FA 6 and FA 7 are solutions each containing one cation and one anion
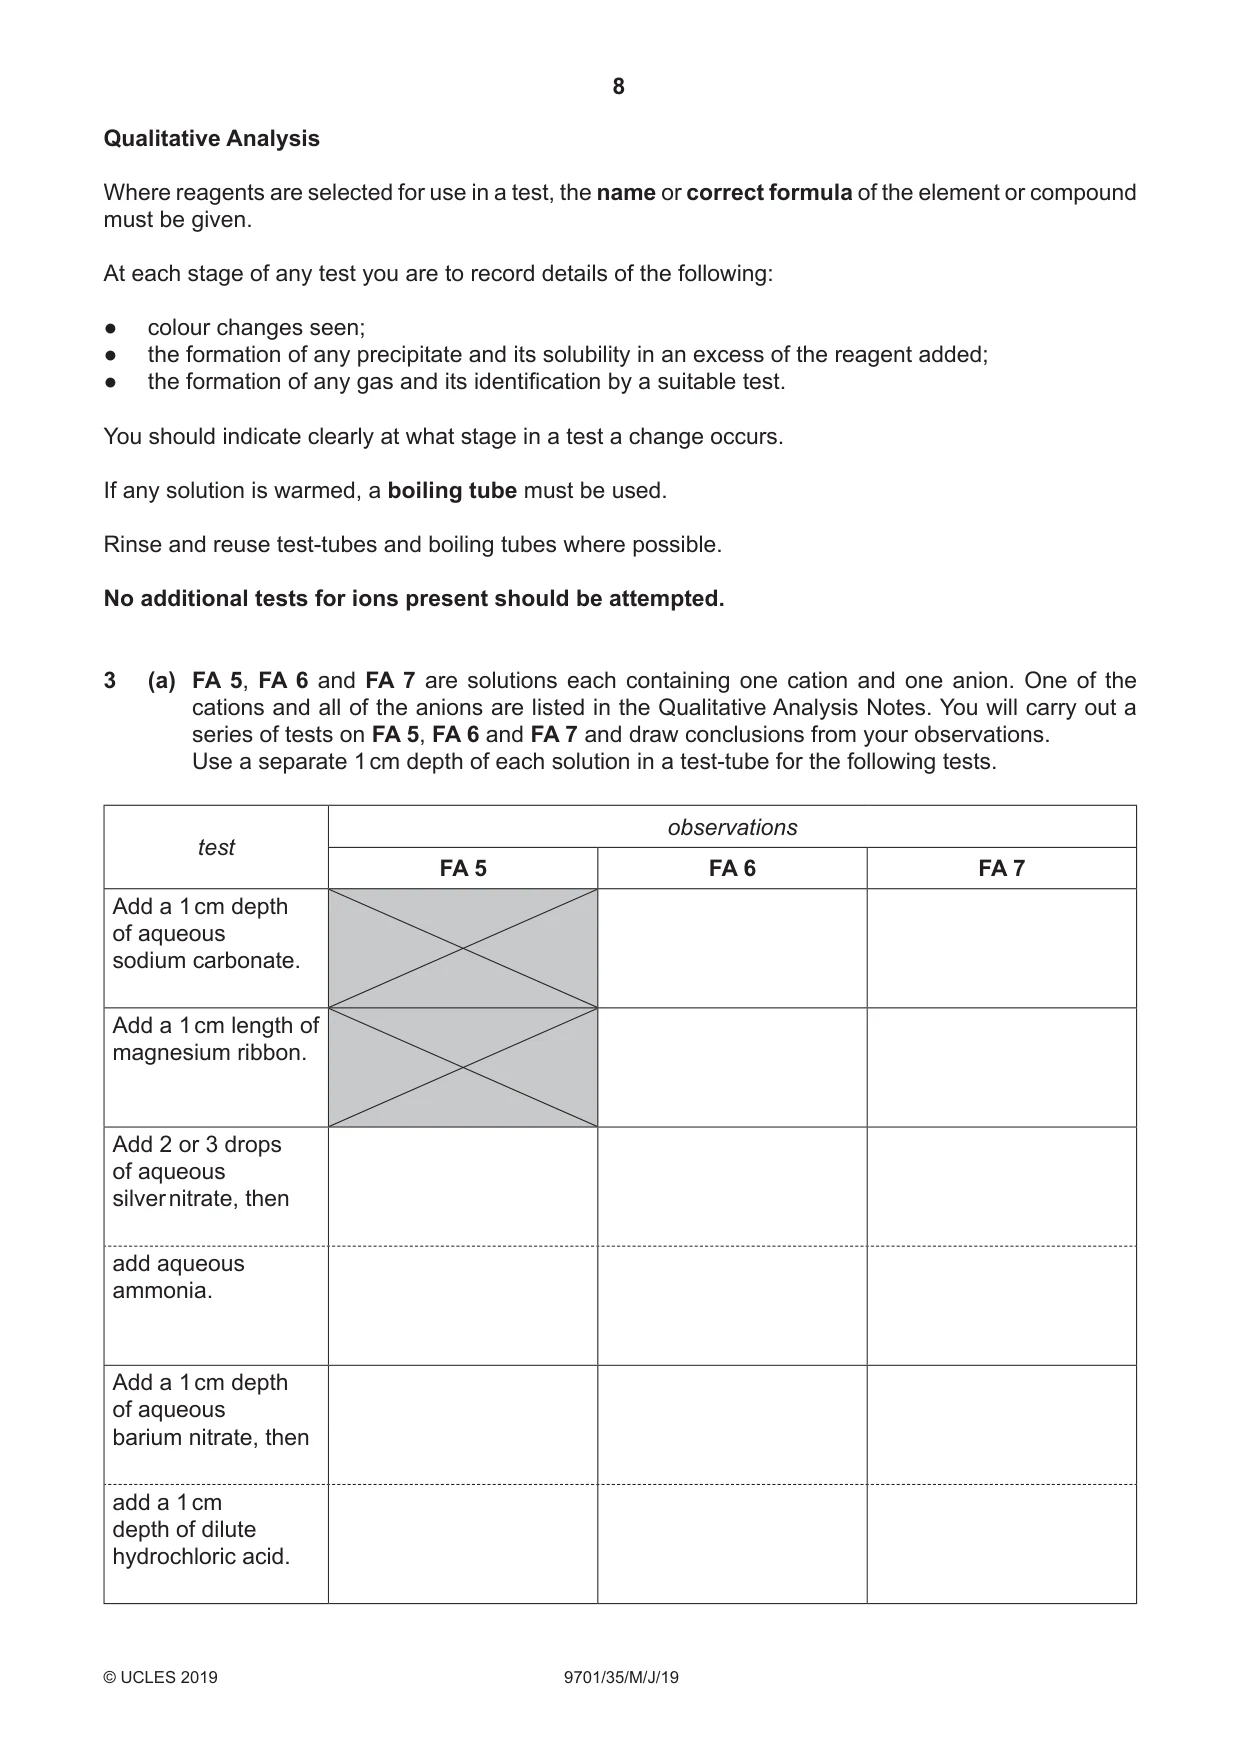
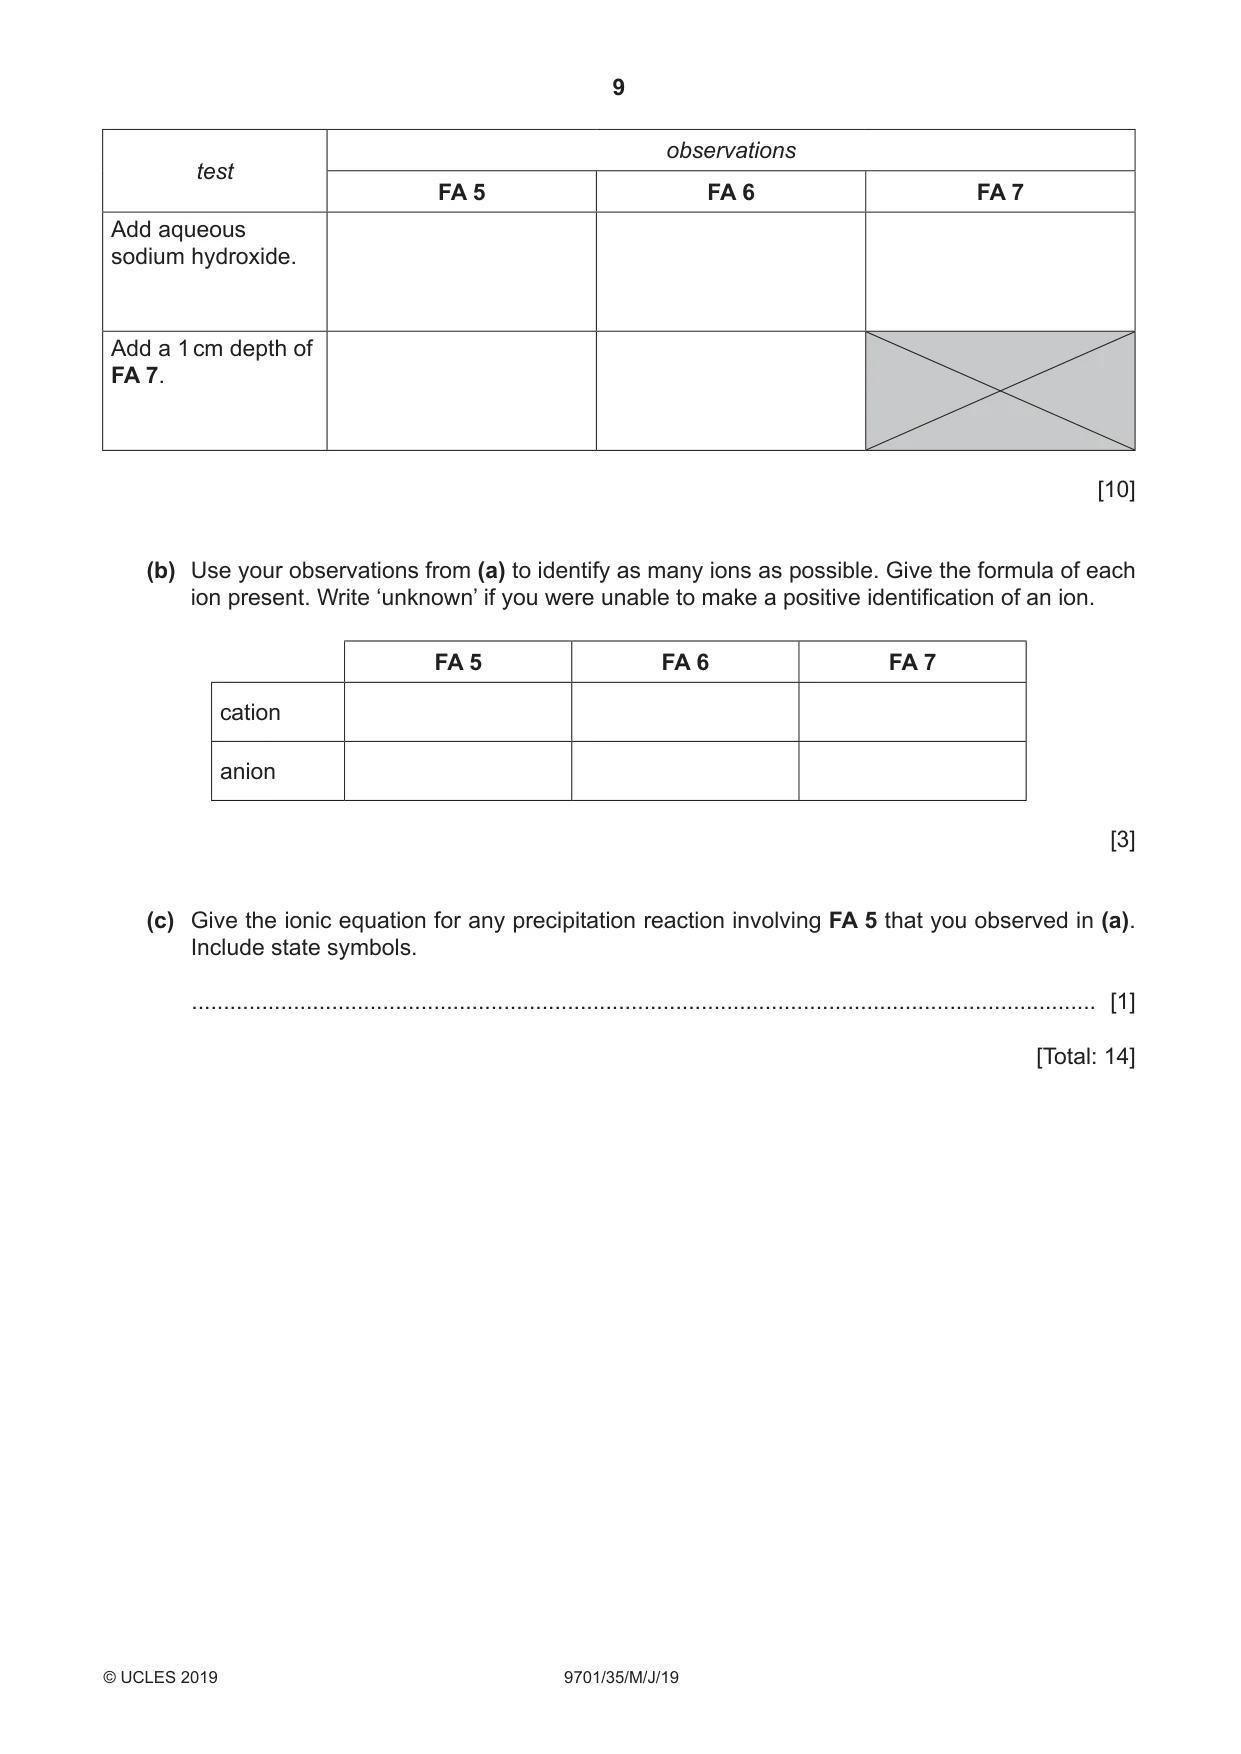
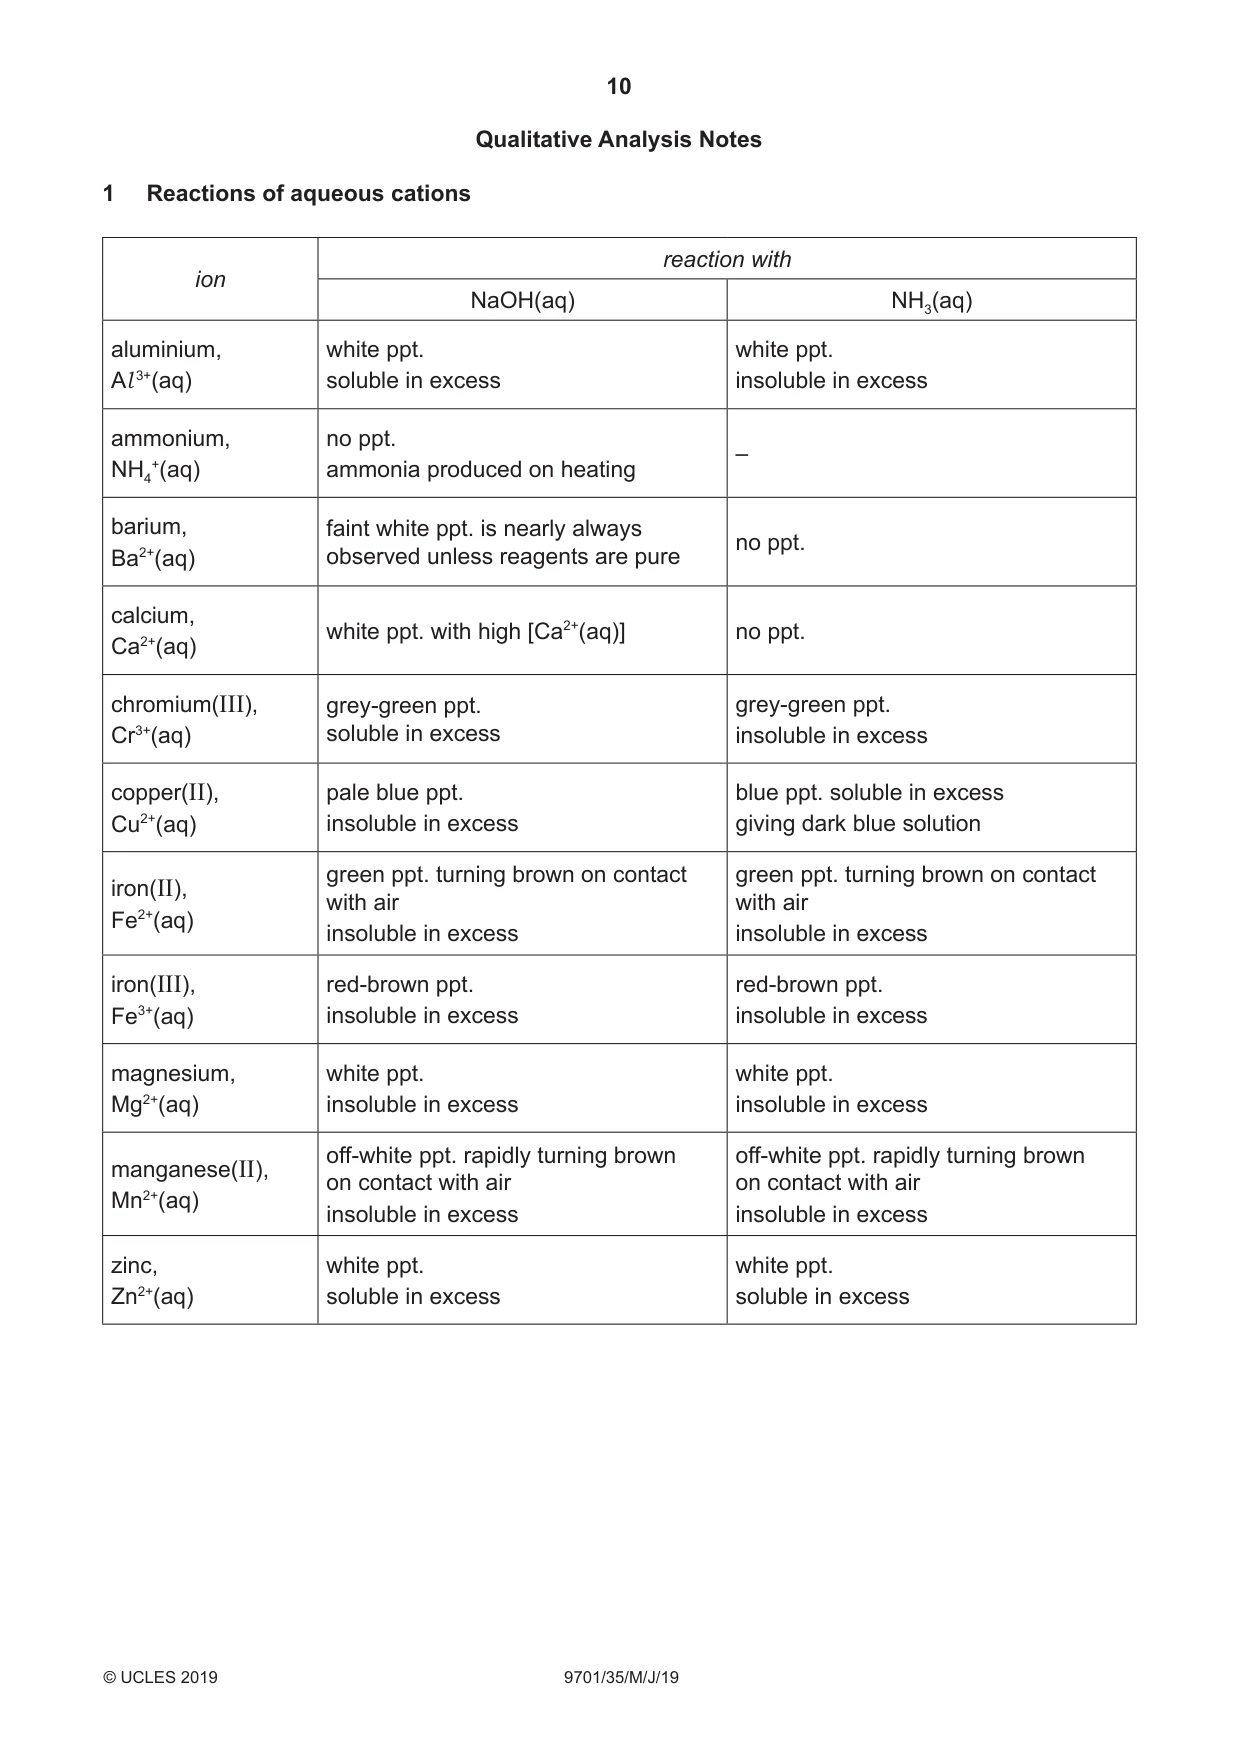
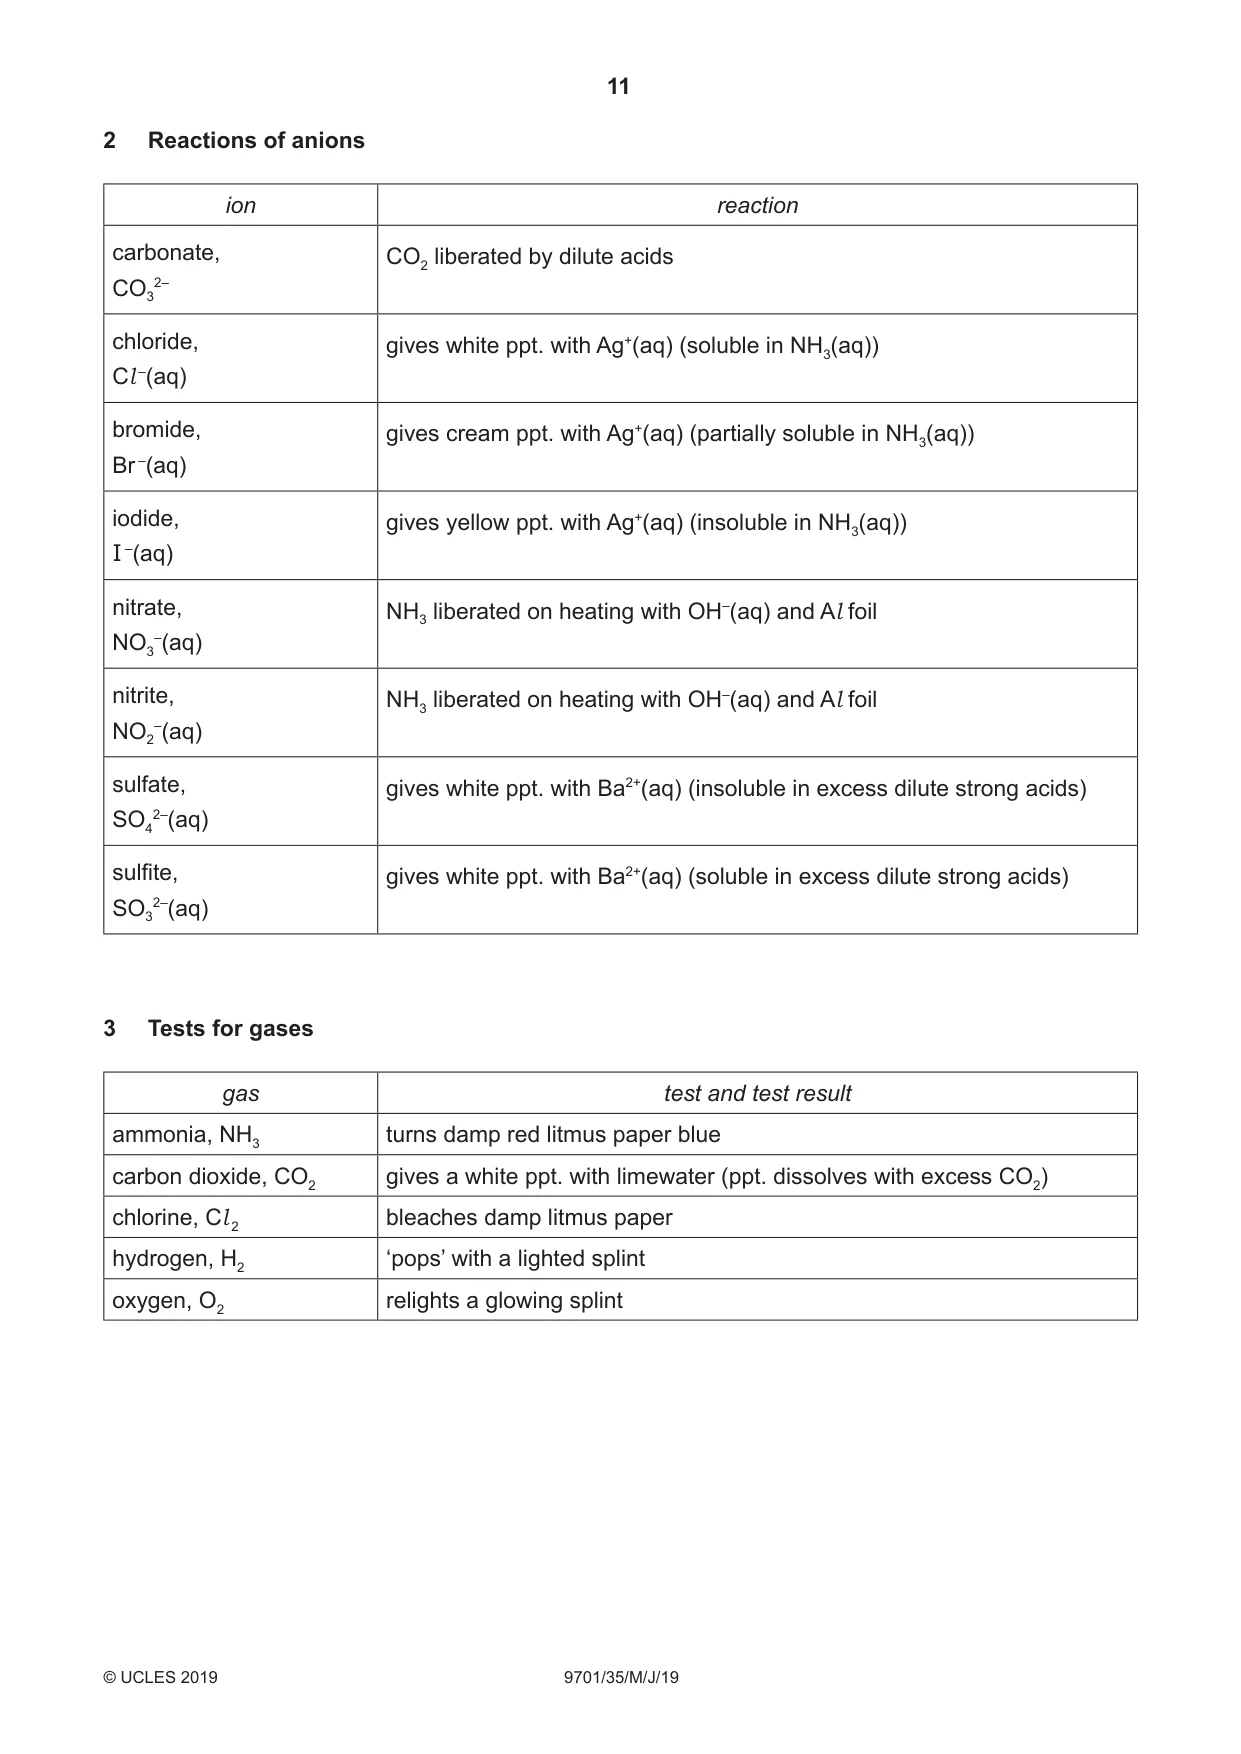
3 (a) FA 5, FA 6 and FA 7 are solutions each containing one cation and one anion. One of the cations and all of the anions are listed in the Qualitative Analysis Notes. You will carry out a series of tests on FA 5, FA 6 and FA 7 and draw conclusions from your observations. Use a separate 1 cm depth of each solution in a test‑tube for the following tests. observations test FA 5 FA 6 FA 7 Add a 1 cm depth of aqueous sodium carbonate. Add a 1 cm length of magnesium ribbon. Add 2 or 3 drops of aqueous silver nitrate, then add aqueous ammonia. Add a 1 cm depth of aqueous barium nitrate, then add a 1 cm depth of dilute hydrochloric acid. observations test FA 5 FA 6 FA 7 Add aqueous sodium hydroxide. Add a 1 cm depth of FA 7. [10] (b) Use your observations from (a) to identify as many ions as possible. Give the formula of each ion present. Write ‘unknown’ if you were unable to make a positive identification of an ion. FA 5 FA 6 FA 7 cation anion [3] (c) Give the ionic equation for any precipitation reaction involving FA 5 that you observed in (a). Include state symbols. .............................................................................................................................................. [1] [Total: 14] Qualitative Analysis Notes 1 Reactions of aqueous cations reaction with ion NaOH(aq) NH3(aq) aluminium, white ppt. white ppt. Al 3+(aq) soluble in excess insoluble in excess ammonium, no ppt. – NH4+(aq) ammonia produced on heating barium, faint white ppt. is nearly always no ppt. Ba2+(aq) observed unless reagents are pure calcium, white ppt. with high [Ca2+(aq)] no ppt. Ca2+(aq) chromium(III), grey-green ppt. grey-green ppt. Cr3+(aq) soluble in excess insoluble in excess copper(II), pale blue ppt. blue ppt. soluble in excess Cu2+(aq) insoluble in excess giving dark blue solution green ppt. turning brown on contact green ppt. turning brown on contact iron(II), with air with air Fe2+(aq) insoluble in excess insoluble in excess iron(III), red-brown ppt. red-brown ppt. Fe3+(aq) insoluble in excess insoluble in excess magnesium, white ppt. white ppt. Mg2+(aq) insoluble in excess insoluble in excess off-white ppt. rapidly turning brown off-white ppt. rapidly turning brown manganese(II), on contact with air on contact with air Mn2+(aq) insoluble in excess insoluble in excess zinc, white ppt. white ppt. Zn2+(aq) soluble in excess soluble in excess
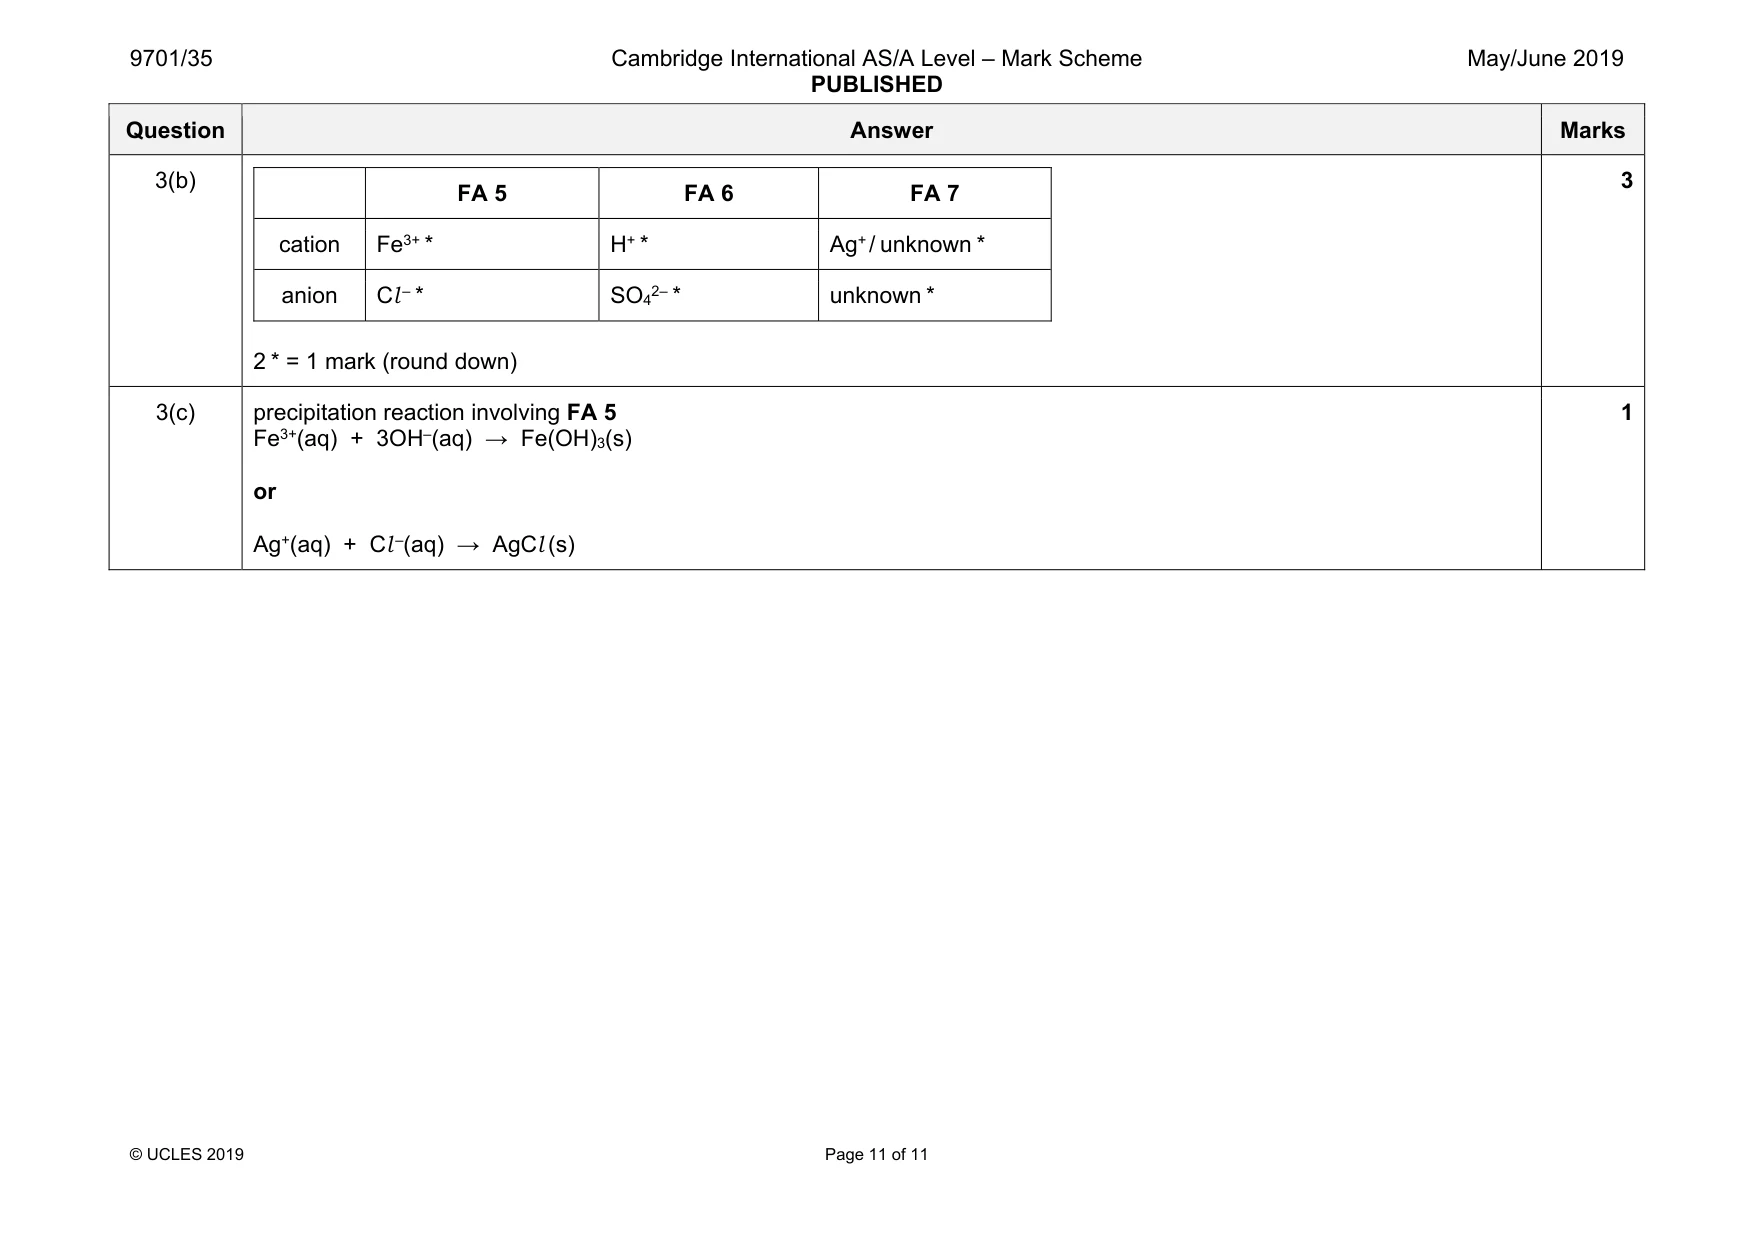
Mark scheme: 3(a) Award one mark for every two correct observations (*) 10 test observations FA 5 FA 6 FA 7 + Na2CO3 effervescence / fizzing / bubbling * off white / pale brown / cream ppt * gas / CO2 turns limewater milky / chalky / cloudy white / forms white ppt * + Mg effervescence / fizzing / bubbling * black ppt / black solid formed * gas / H2 pops with lighted splint * + AgNO3 white ppt * Allow off-white ppt no change / no (visible) reaction / no ppt * no change / no (visible) reaction / no ppt * + NH3 brown / red-brown / orange-brown / rust ppt * Ignore Ignore + Ba(NO3)2 no change / no (visible) reaction / no ppt * white ppt * no change / no (visible) reaction / no ppt * Ignore faint white ppt + HCl Ignore ppt insoluble * Allow no change white ppt * Soluble in excess is CON + NaOH brown / red- brown / orange- brown / rust ppt and insoluble in excess * no change / no (visible) reaction / no ppt / temp increases * (dark) brown / grey-brown ppt and insoluble in excess * + FA 7 white ppt * allow off-white ppt no change / no (visible) reaction / no ppt * Question Answer Marks 3(b) FA 5 FA 6 FA 7 cation Fe3+ * H+ * Ag+ / unknown * anion Cl ‒ * SO42– * unknown * 2 * = 1 mark (round down) 3 3(c) precipitation reaction involving FA 5 Fe3+(aq) + 3OH‒(aq) → Fe(OH)3(s) or Ag+(aq) + Cl ‒(aq) → AgCl (s) 1
What was in this paper
The subtopics covered by these 3 questions, and how many questions each got. Open one in a new tab to see every Cambridge question on it.
What you needed in this session
Cambridge’s own grade thresholds for 2019 May/June, Paper 3 · Variant 5. A higher threshold means an easier paper — the bar moves with how the cohort did.