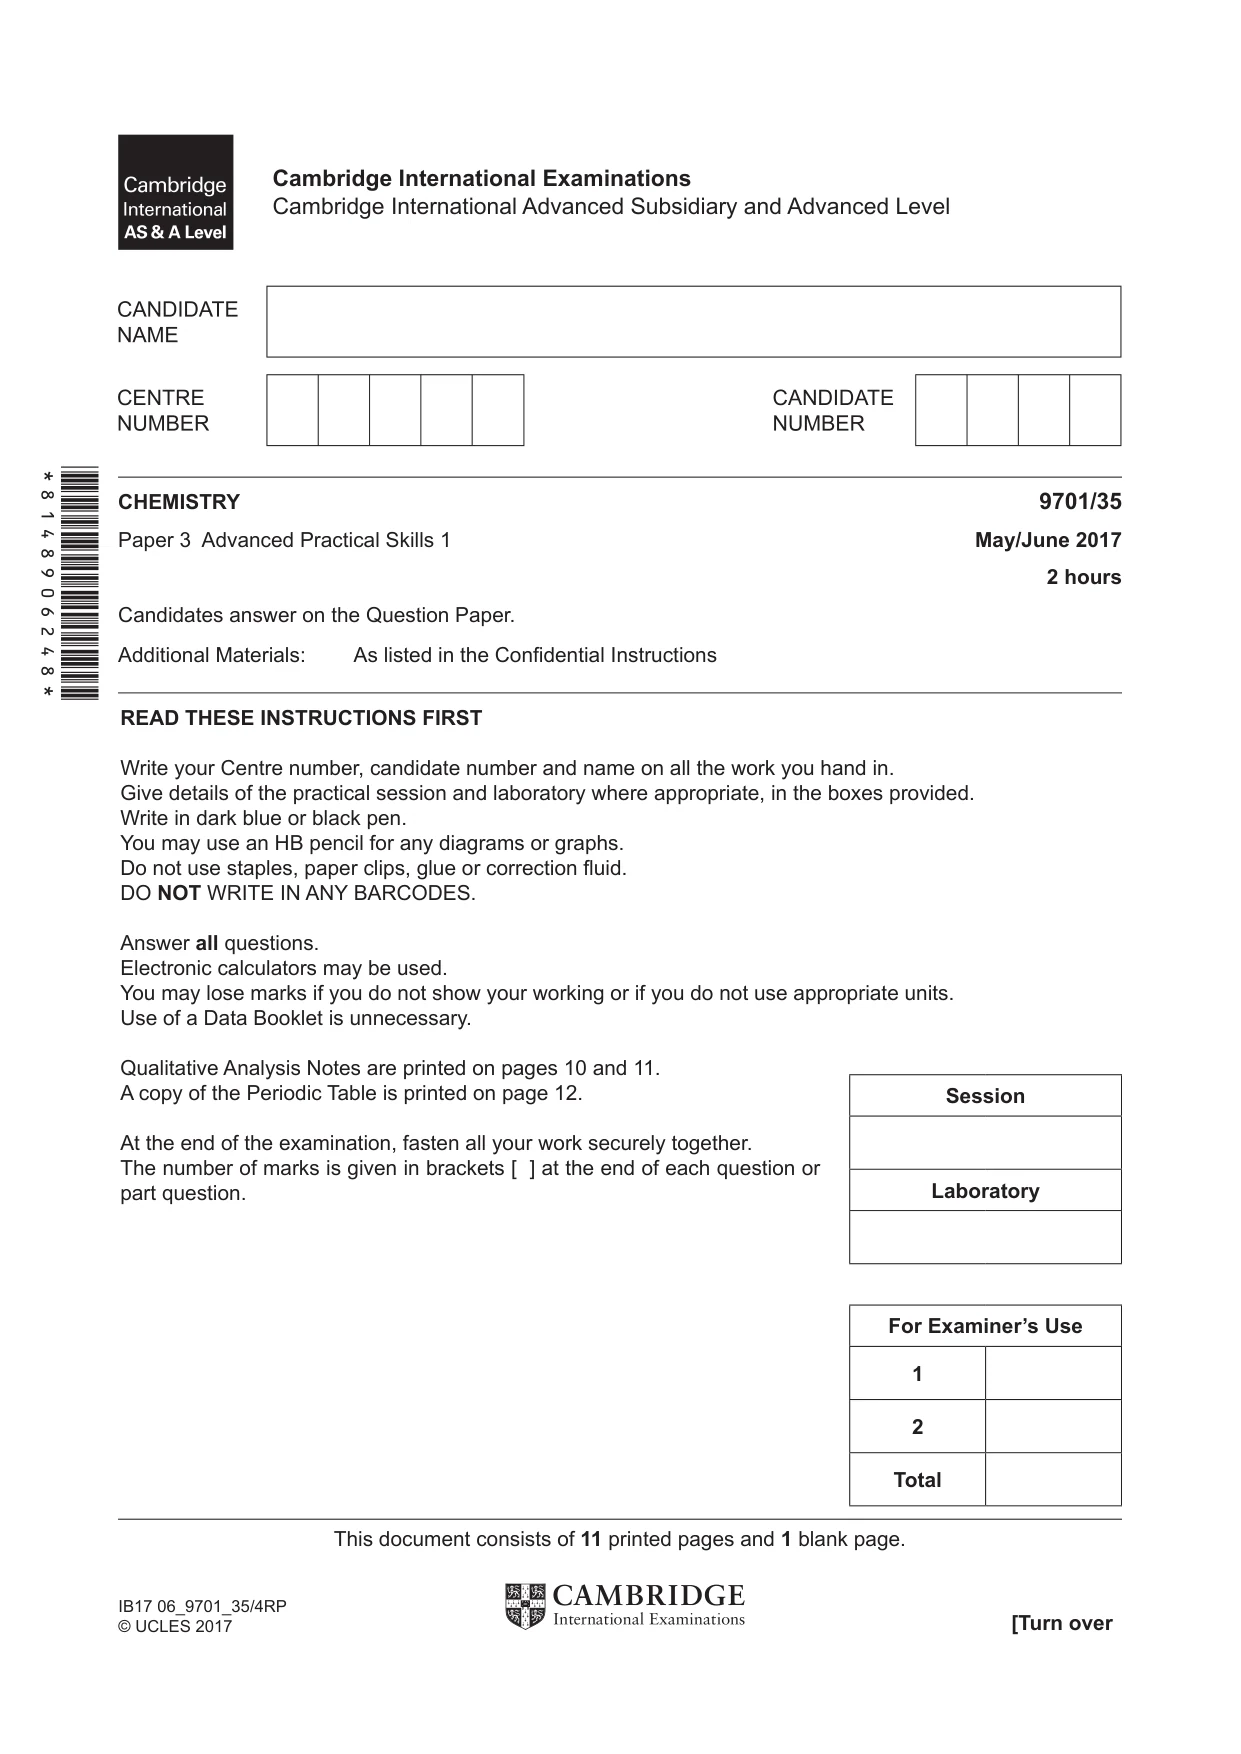
Cambridge A Level Chemistry 9701 — 2017 May/June Paper 3 · Variant 5
9701/35/M/J/17 · 2 questions · 40 marks · ≈45 min
The question paper and its mark scheme, free to read here and free to download. This is Cambridge’s own paper, exactly as it was sat.
Question paper12 pages


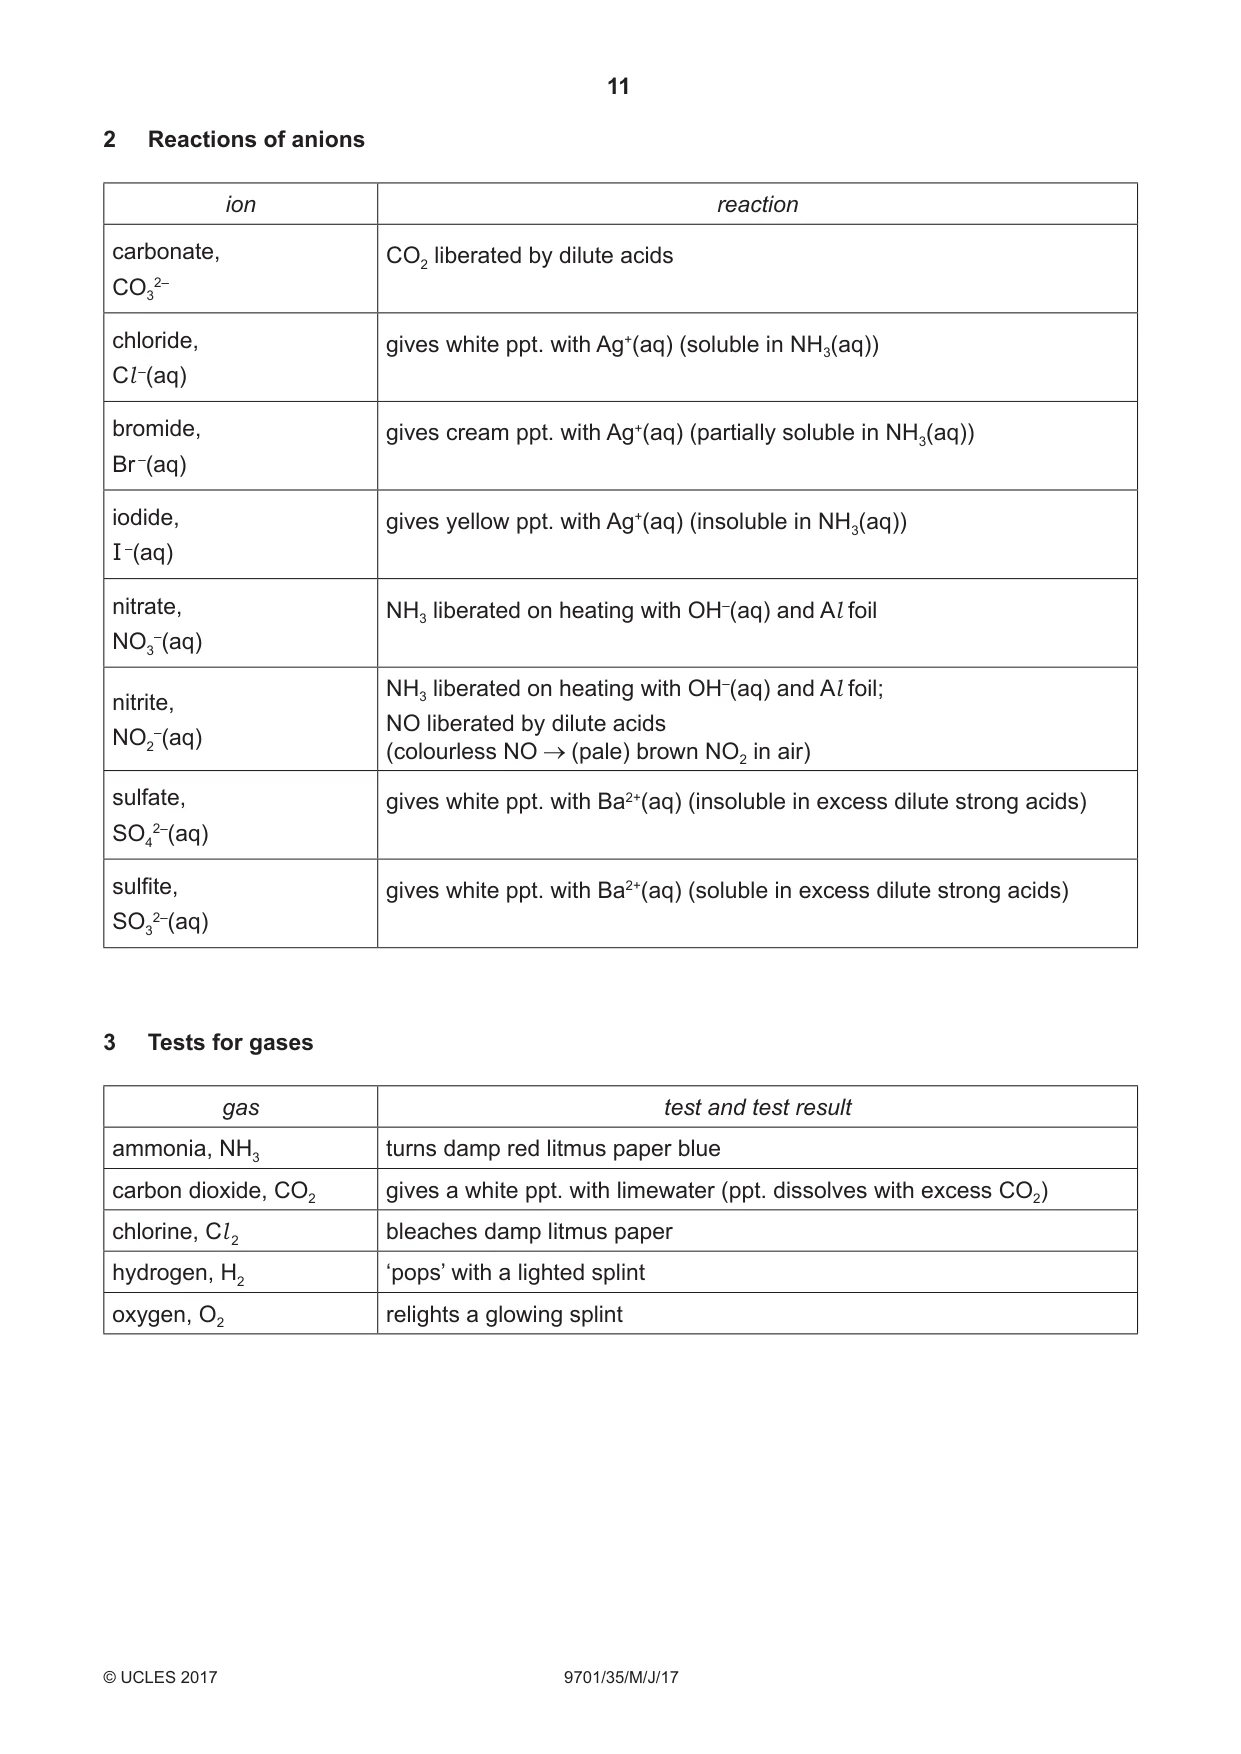
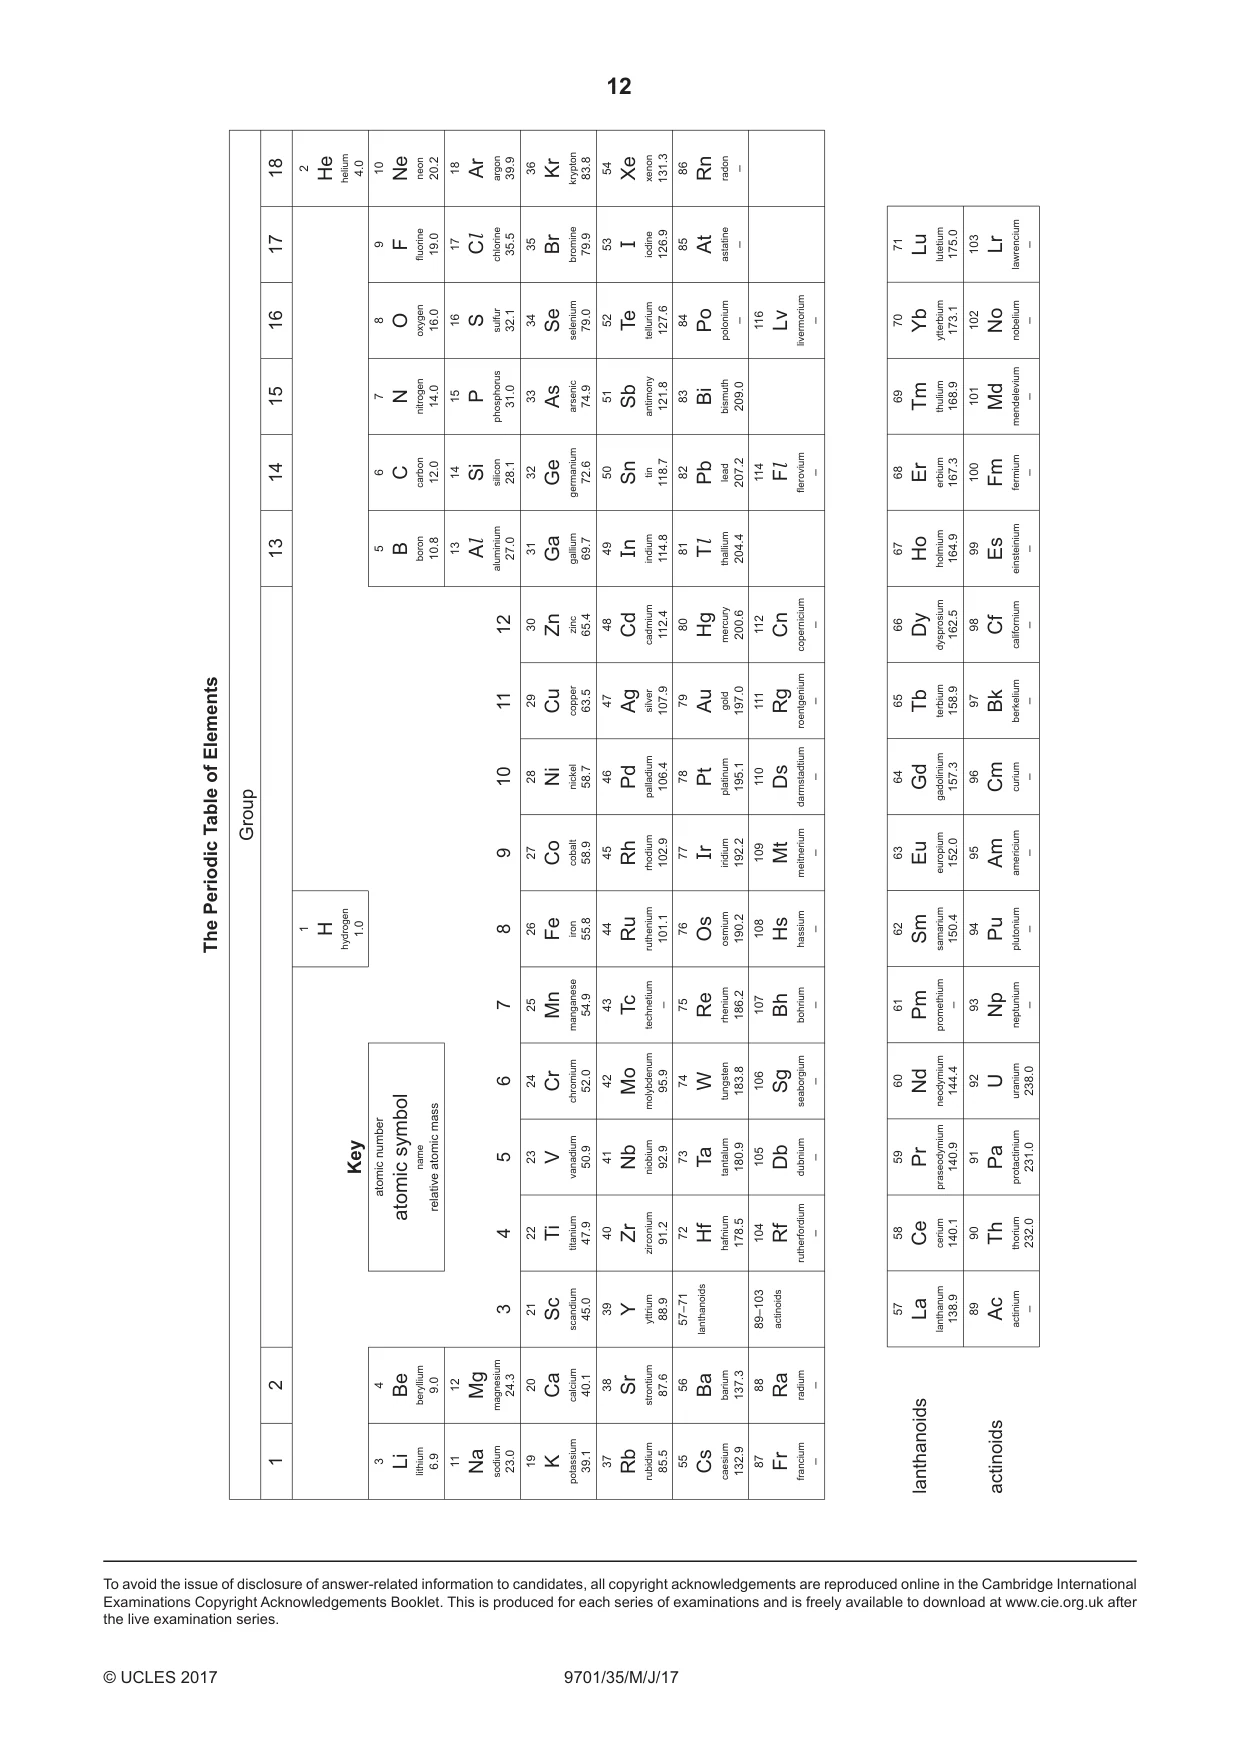
Mark scheme6 pages
Answers below. Sit the paper first if you are practising.
Questions as text
Q1 · Sulfur forms the peroxodisulfate anion, S2O82–
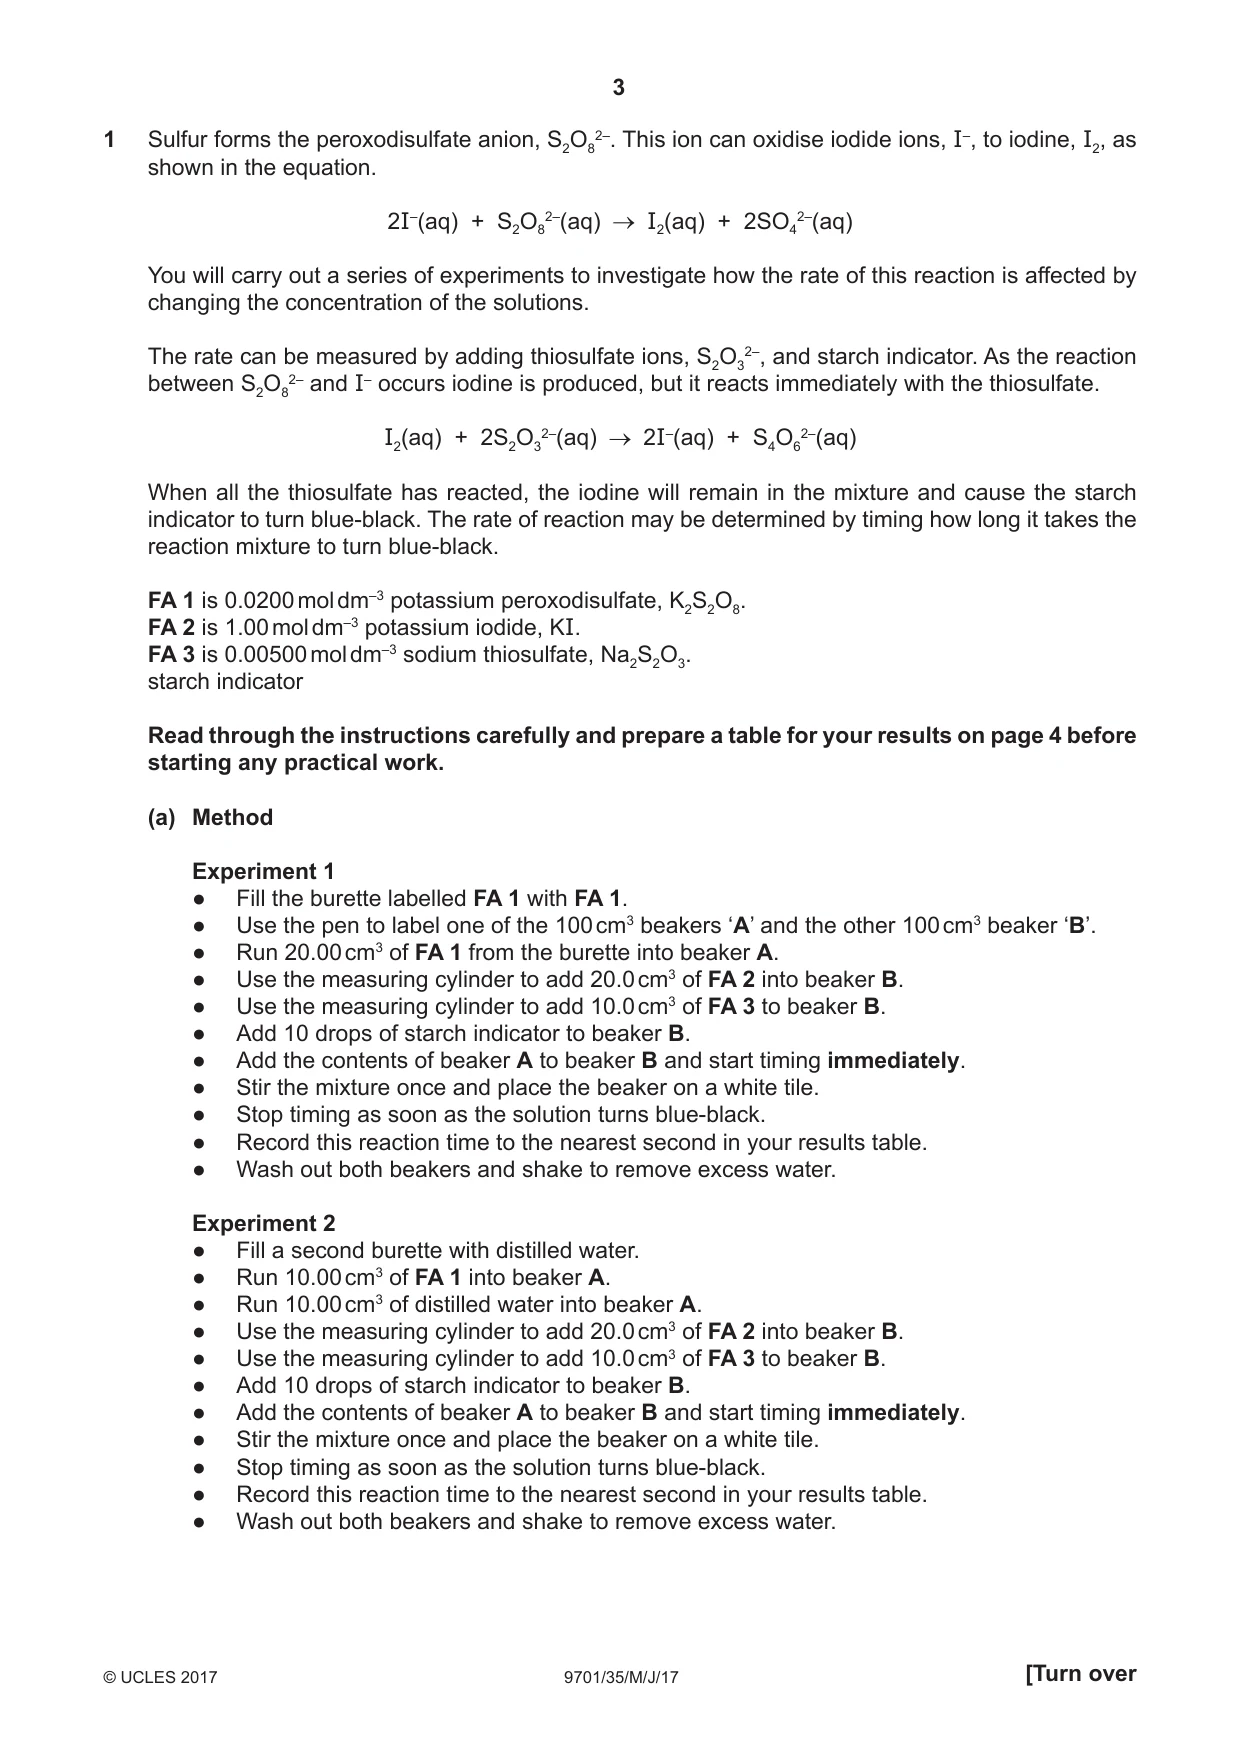
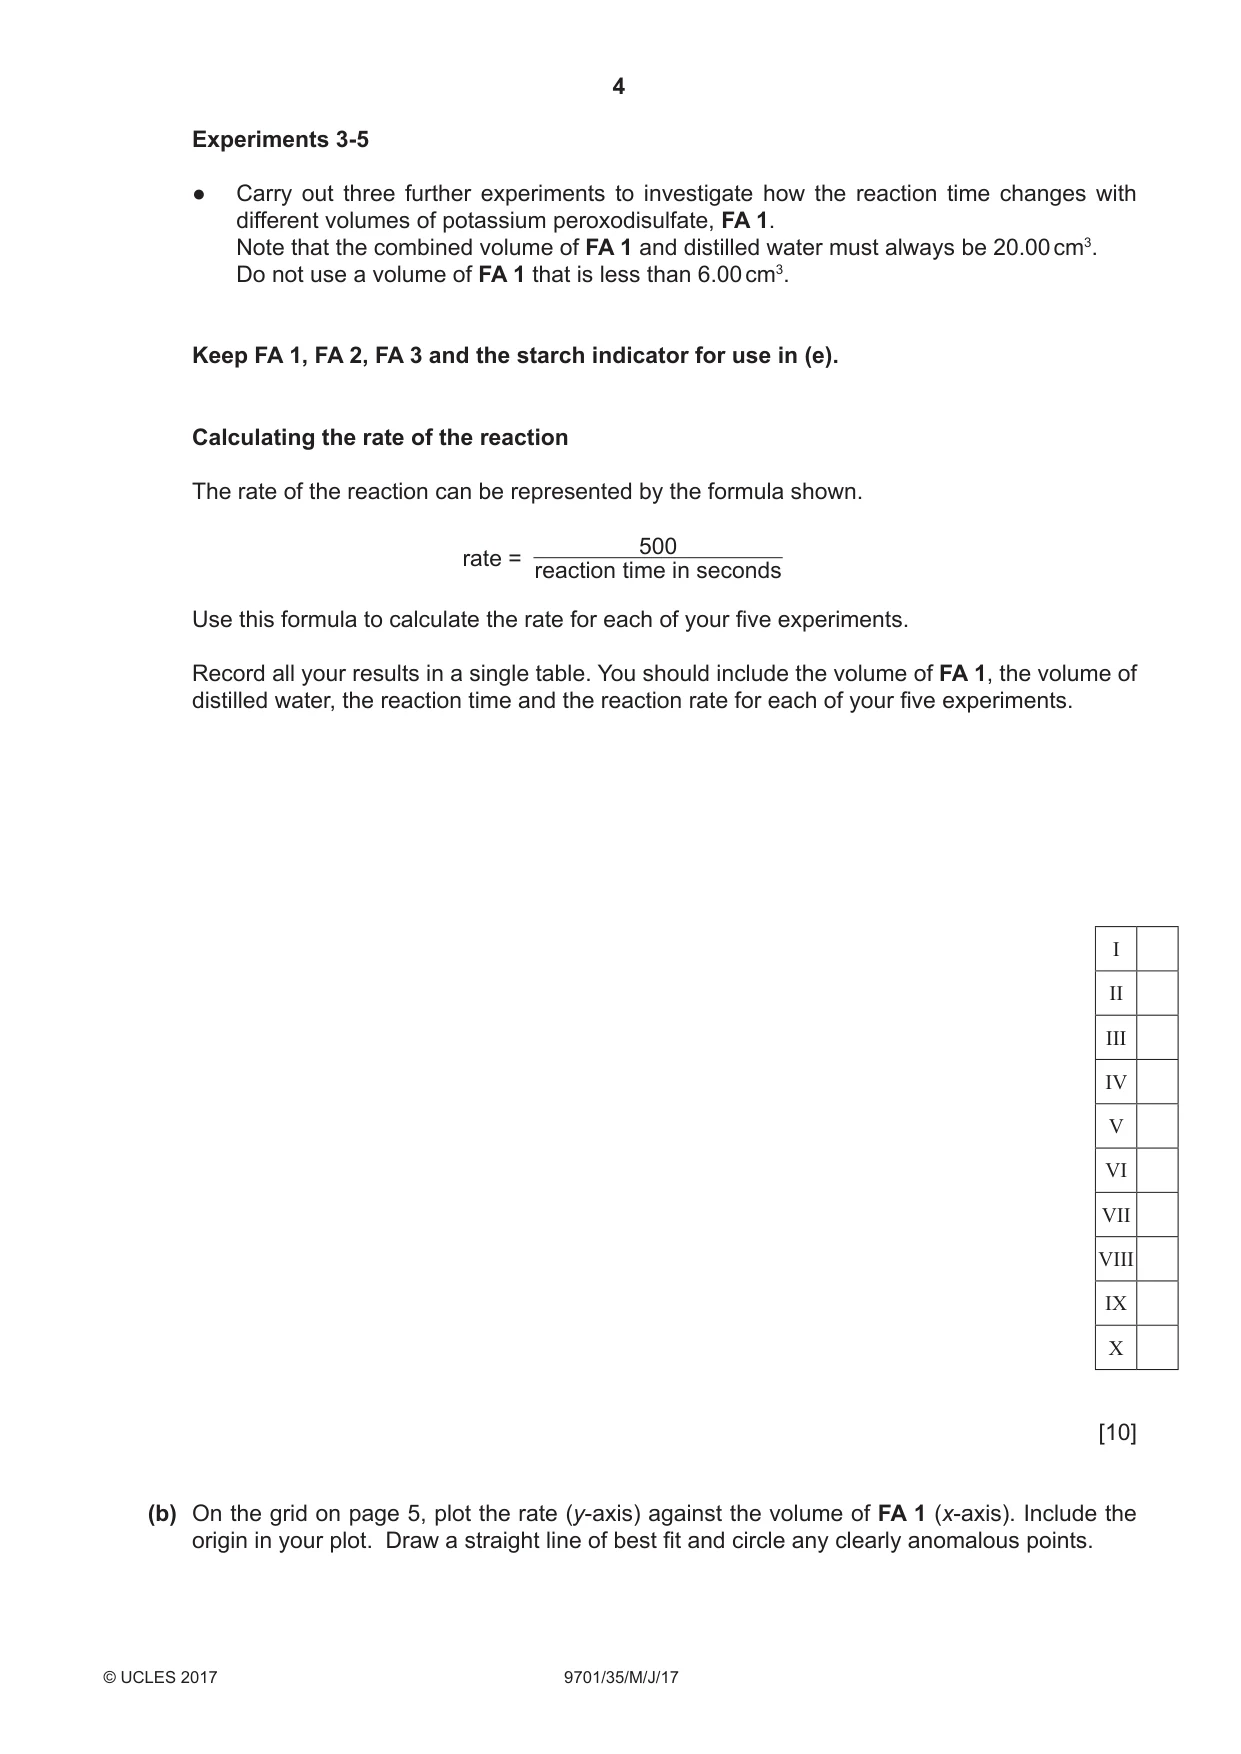
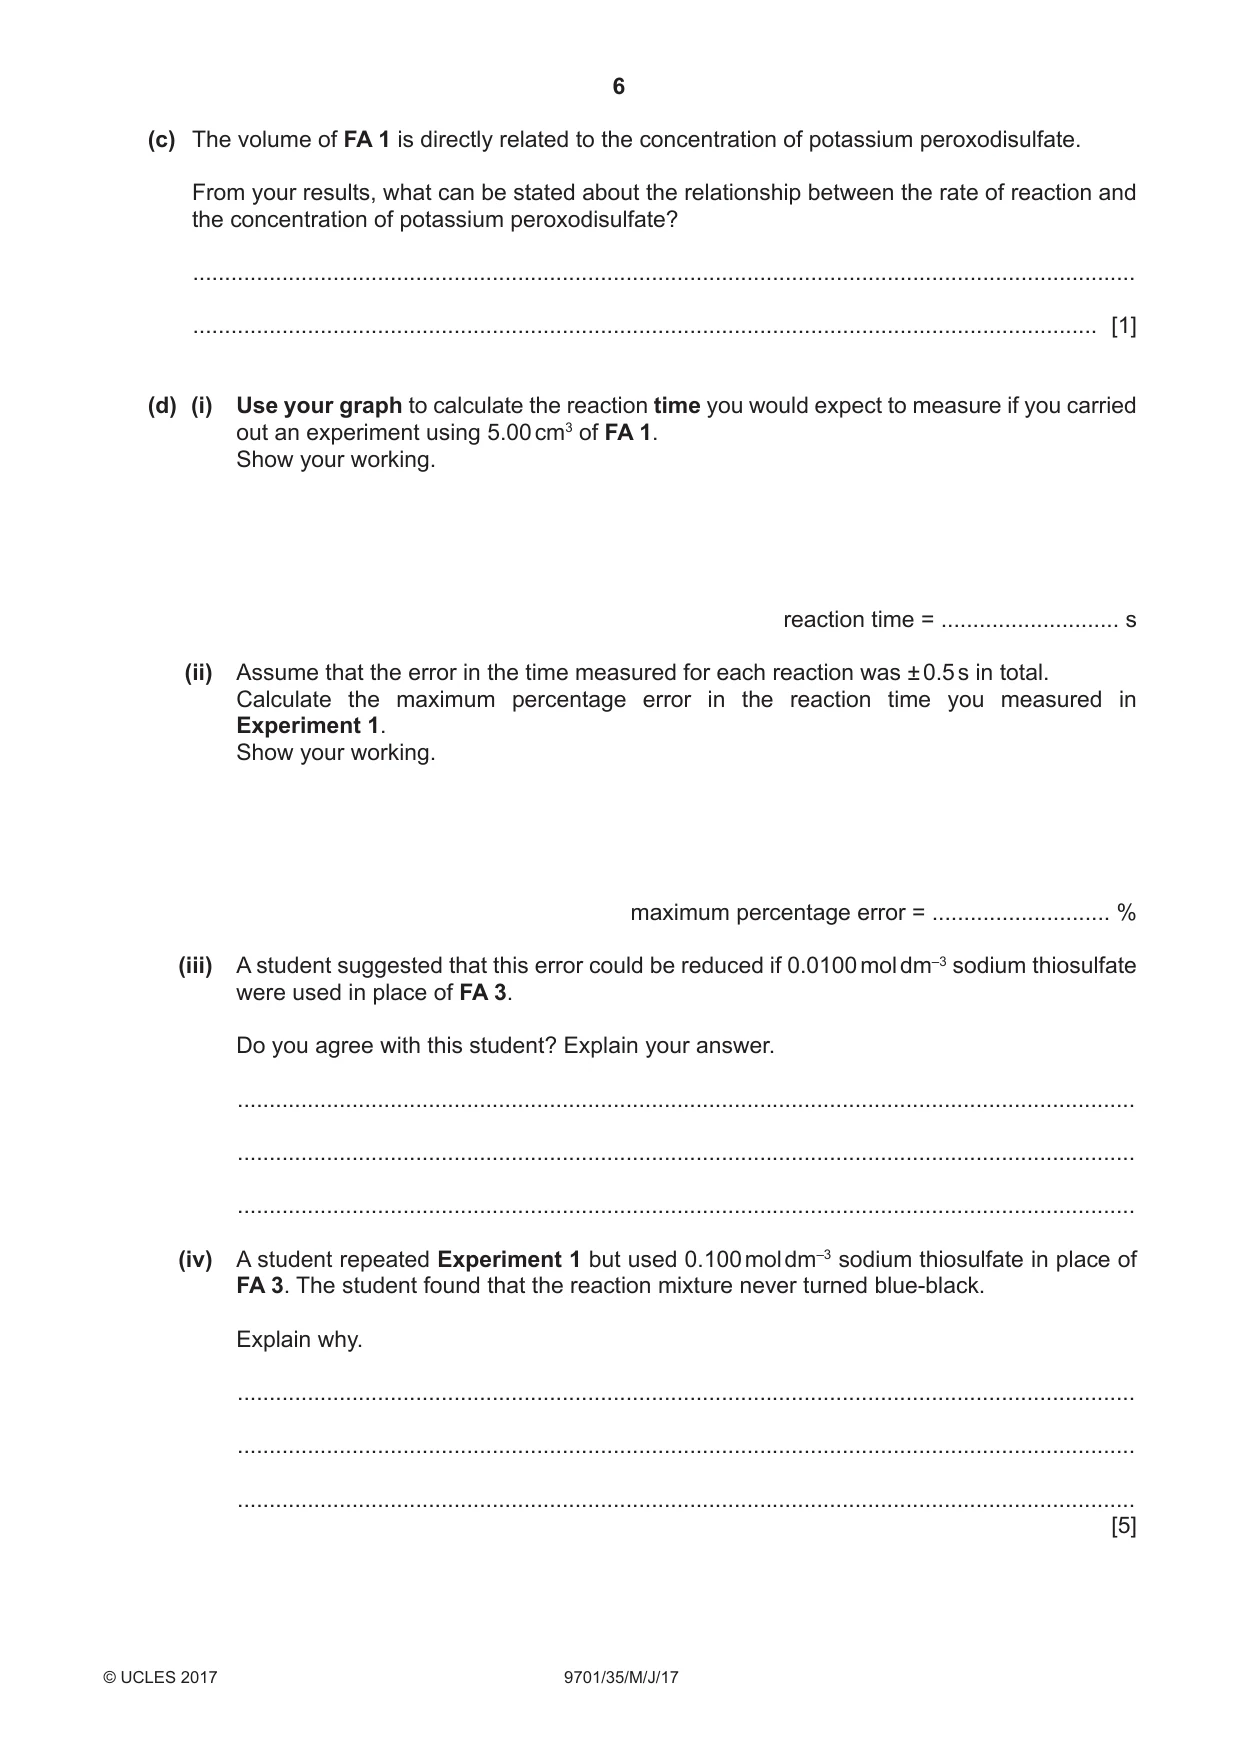
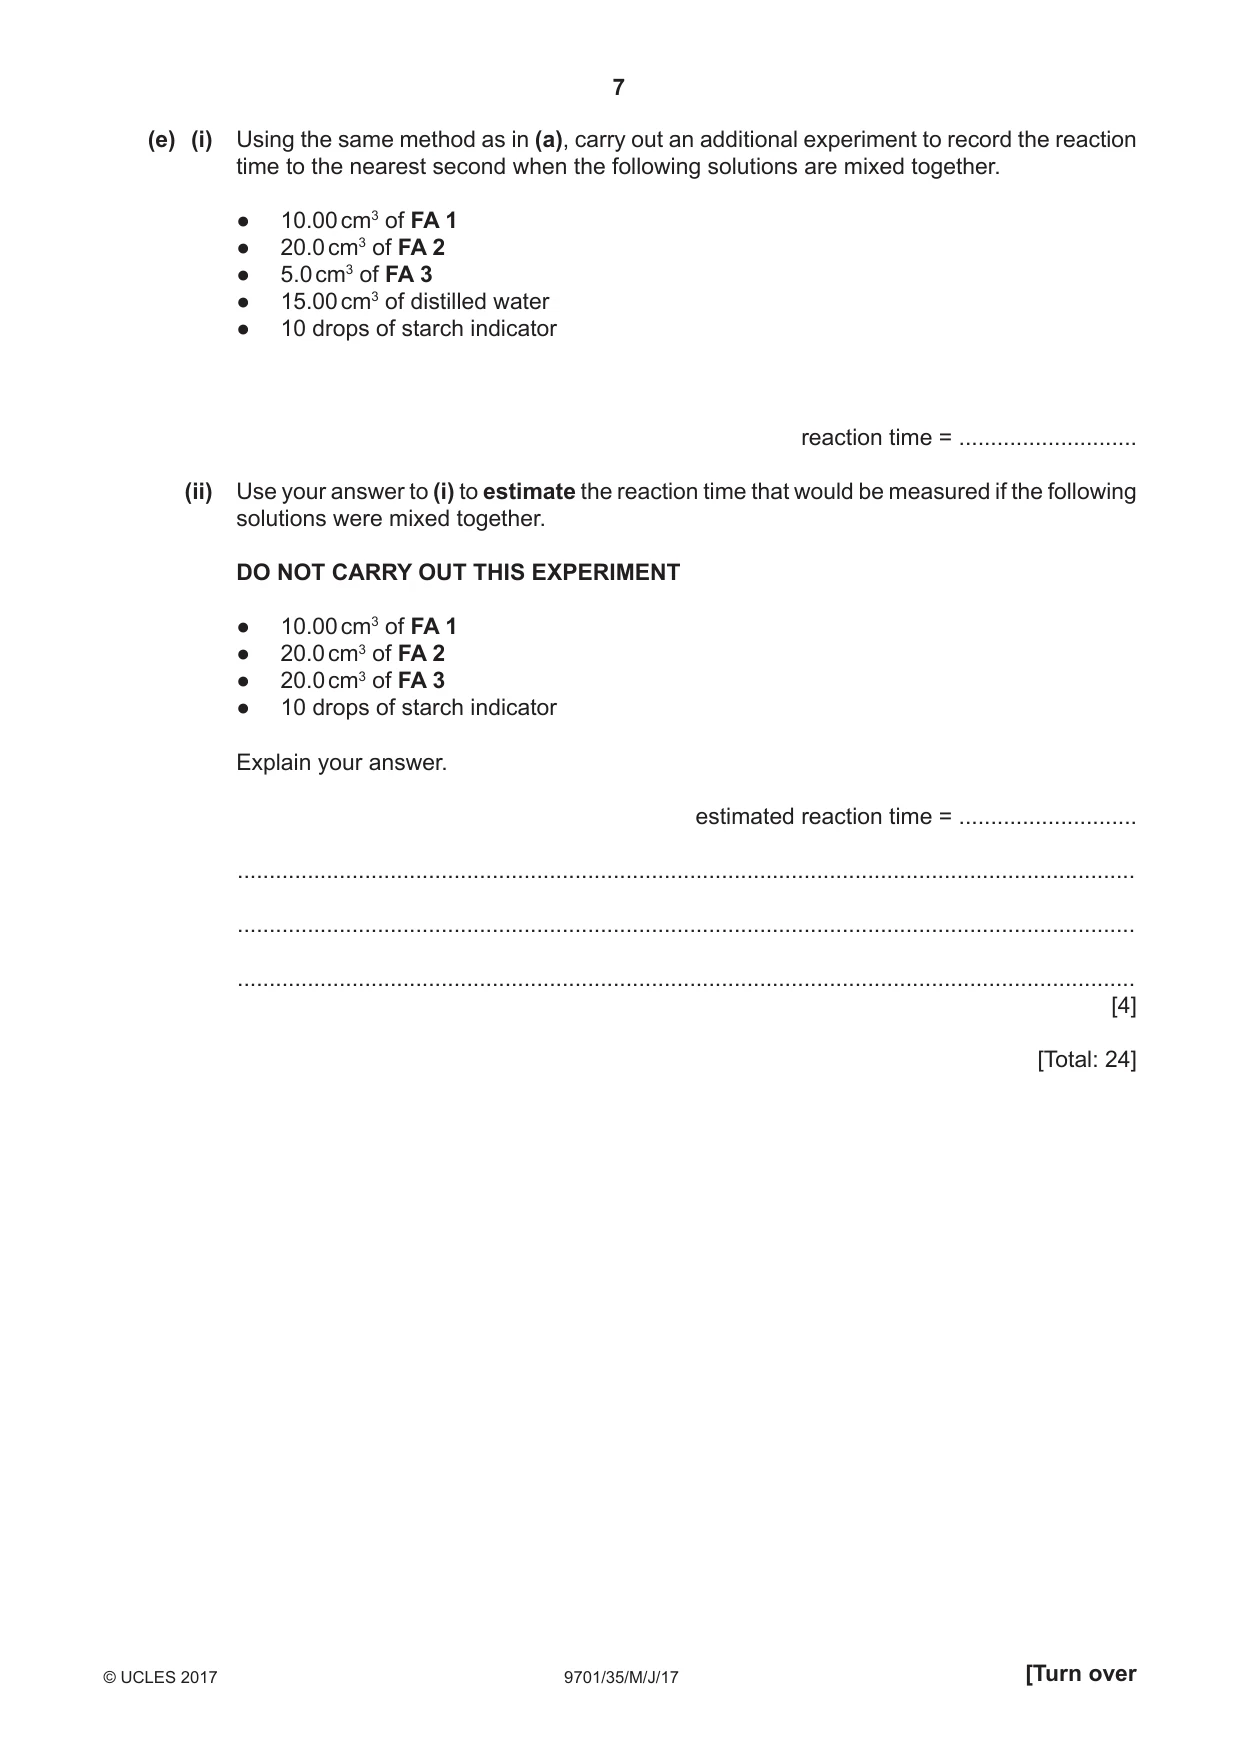
1 Sulfur forms the peroxodisulfate anion, S2O82–. This ion can oxidise iodide ions, I–, to iodine, I2, as shown in the equation. 2I–(aq) + S2O82–(aq) I2(aq) + 2SO42–(aq) You will carry out a series of experiments to investigate how the rate of this reaction is affected by changing the concentration of the solutions. The rate can be measured by adding thiosulfate ions, S2O32–, and starch indicator. As the reaction between S2O82– and I– occurs iodine is produced, but it reacts immediately with the thiosulfate. I2(aq) + 2S2O32–(aq) 2I–(aq) + S4O62–(aq) When all the thiosulfate has reacted, the iodine will remain in the mixture and cause the starch indicator to turn blue-black. The rate of reaction may be determined by timing how long it takes the reaction mixture to turn blue-black. FA 1 is 0.0200 mol dm–3 potassium peroxodisulfate, K2S2O8. FA 2 is 1.00 mol dm–3 potassium iodide, KI. FA 3 is 0.00500 mol dm–3 sodium thiosulfate, Na2S2O3. starch indicator Read through the instructions carefully and prepare a table for your results on page 4 before starting any practical work. (a) Method Experiment 1 ● Fill the burette labelled FA 1 with FA 1. ● Use the pen to label one of the 100 cm3 beakers ‘A’ and the other 100 cm3 beaker ‘B’. ● Run 20.00 cm3 of FA 1 from the burette into beaker A. ● Use the measuring cylinder to add 20.0 cm3 of FA 2 into beaker B. ● Use the measuring cylinder to add 10.0 cm3 of FA 3 to beaker B. ● Add 10 drops of starch indicator to beaker B. ● Add the contents of beaker A to beaker B and start timing immediately. ● Stir the mixture once and place the beaker on a white tile. ● Stop timing as soon as the solution turns blue-black. ● Record this reaction time to the nearest second in your results table. ● Wash out both beakers and shake to remove excess water. Experiment 2 ● Fill a second burette with distilled water. ● Run 10.00 cm3 of FA 1 into beaker A. ● Run 10.00 cm3 of distilled water into beaker A. ● Use the measuring cylinder to add 20.0 cm3 of FA 2 into beaker B. ● Use the measuring cylinder to add 10.0 cm3 of FA 3 to beaker B. ● Add 10 drops of starch indicator to beaker B. ● Add the contents of beaker A to beaker B and start timing immediately. ● Stir the mixture once and place the beaker on a white tile. ● Stop timing as soon as the solution turns blue-black. ● Record this reaction time to the nearest second in your results table. ● Wash out both beakers and shake to remove excess water. Experiments 3-5 ● Carry out three further experiments to investigate how the reaction time changes with different volumes of potassium peroxodisulfate, FA 1. Note that the combined volume of FA 1 and distilled water must always be 20.00 cm3. Do not use a volume of FA 1 that is less than 6.00 cm3. Keep FA 1, FA 2, FA 3 and the starch indicator for use in (e). Calculating the rate of the reaction The rate of the reaction can be represented by the formula shown. 500 rate = reaction time in seconds Use this formula to calculate the rate for each of your five experiments. Record all your results in a single table. You should include the volume of FA 1, the volume of distilled water, the reaction time and the reaction rate for each of your five experiments. I II III IV V VI VII VIII IX X [10] (b) On the grid on page 5, plot the rate (y-axis) against the volume of FA 1 (x-axis). Include the origin in your plot. Draw a straight line of best fit and circle any clearly anomalous points. (c) The volume of FA 1 is directly related to the concentration of potassium peroxodisulfate. From your results, what can be stated about the relationship between the rate of reaction and the concentration of potassium peroxodisulfate? .................................................................................................................................................... .............................................................................................................................................. [1] (d) (i) Use your graph to calculate the reaction time you would expect to measure if you carried out an experiment using 5.00 cm3 of FA 1. Show your working. reaction time = ............................ s (ii) Assume that the error in the time measured for each reaction was ± 0.5 s in total. Calculate the maximum percentage error in the reaction time you measured in Experiment 1. Show your working. maximum percentage error = ............................ % (iii) A student suggested that this error could be reduced if 0.0100 mol dm–3 sodium thiosulfate were used in place of FA 3. Do you agree with this student? Explain your answer. ............................................................................................................................................. ............................................................................................................................................. ............................................................................................................................................. (iv) A student repeated Experiment 1 but used 0.100 mol dm–3 sodium thiosulfate in place of FA 3. The student found that the reaction mixture never turned blue-black. Explain why. ............................................................................................................................................. ............................................................................................................................................. ............................................................................................................................................. [5] (e) (i) Using the same method as in (a), carry out an additional experiment to record the reaction time to the nearest second when the following solutions are mixed together. ● 10.00 cm3 of FA 1 ● 20.0 cm3 of FA 2 ● 5.0 cm3 of FA 3 ● 15.00 cm3 of distilled water ● 10 drops of starch indicator reaction time = ............................ (ii) Use your answer to (i) to estimate the reaction time that would be measured if the following solutions were mixed together. DO NOT CARRY OUT THIS EXPERIMENT ● 10.00 cm3 of FA 1 ● 20.0 cm3 of FA 2 ● 20.0 cm3 of FA 3 ● 10 drops of starch indicator Explain your answer. estimated reaction time = ............................ ............................................................................................................................................. ............................................................................................................................................. ............................................................................................................................................. [4] [Total: 24]
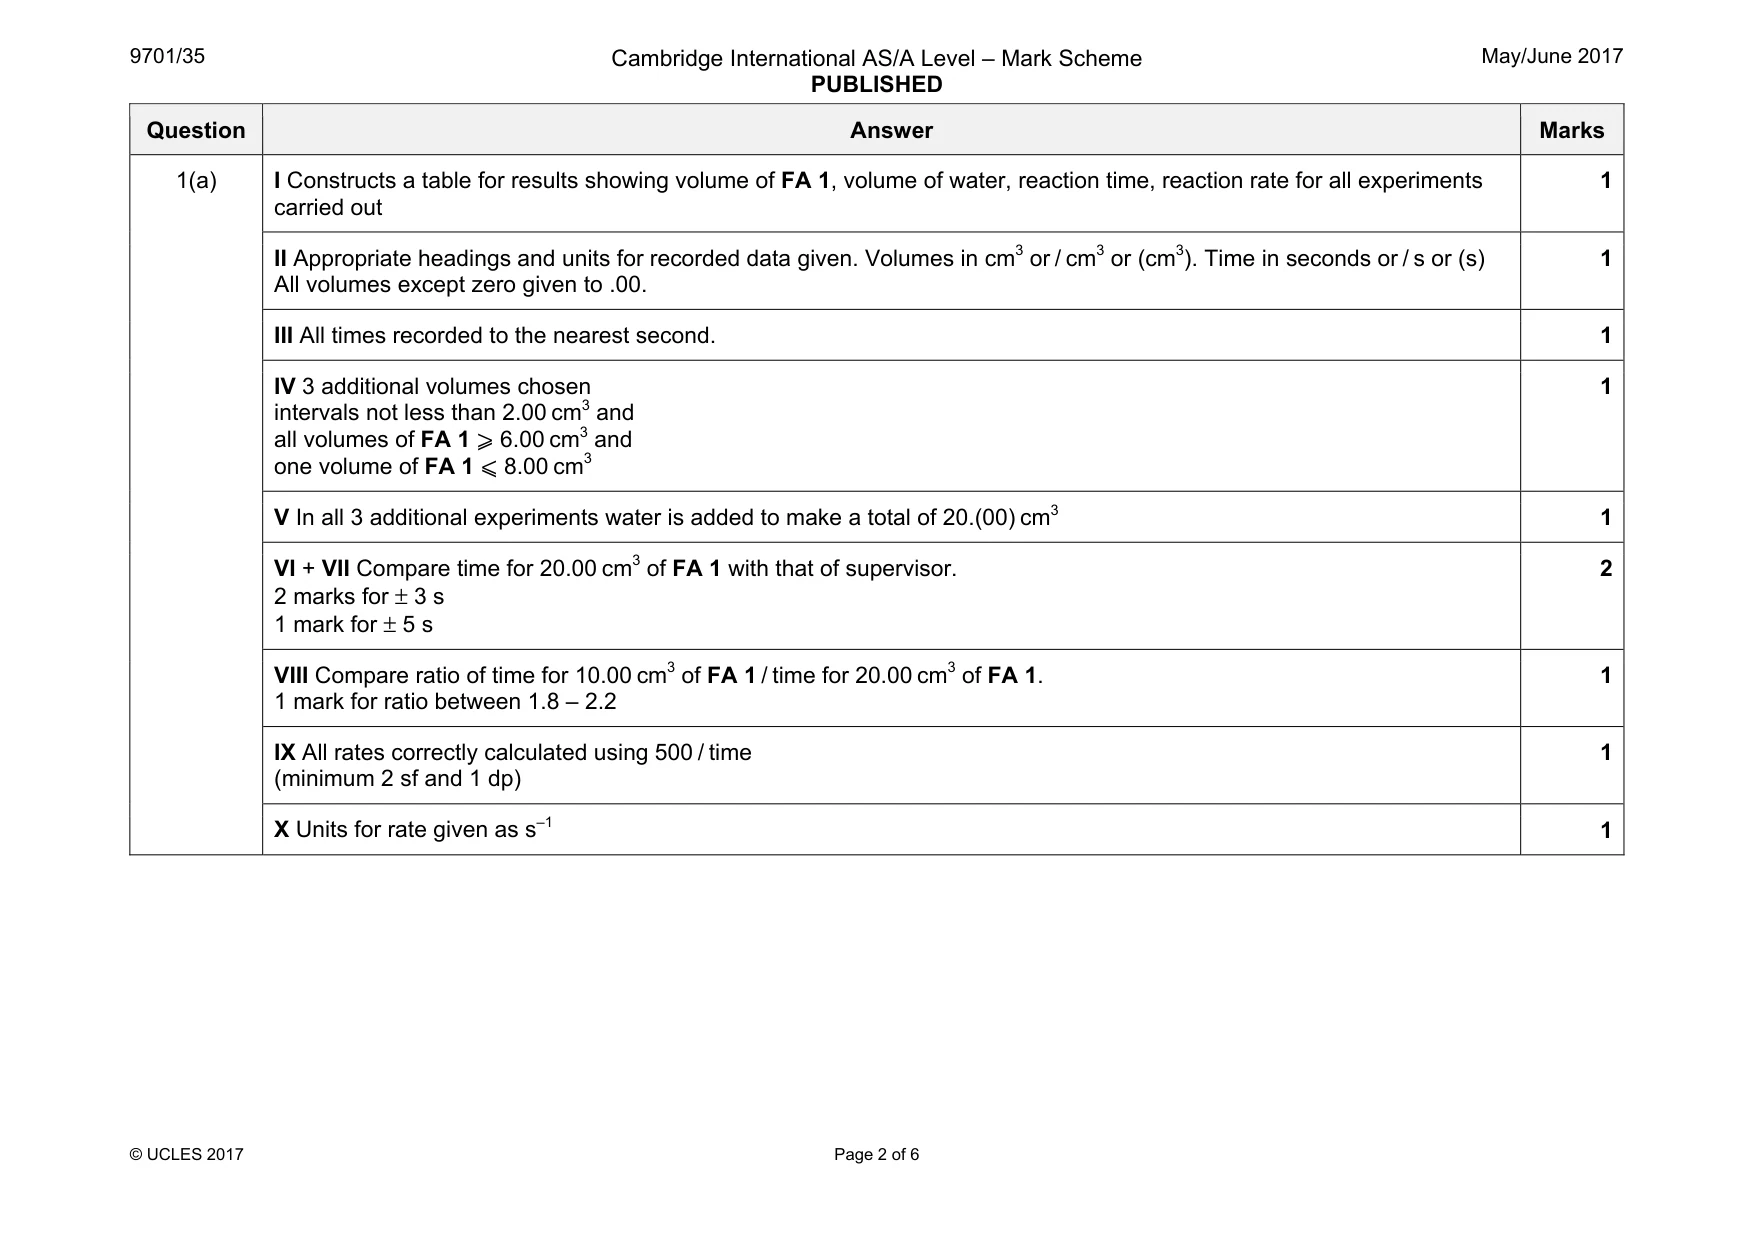
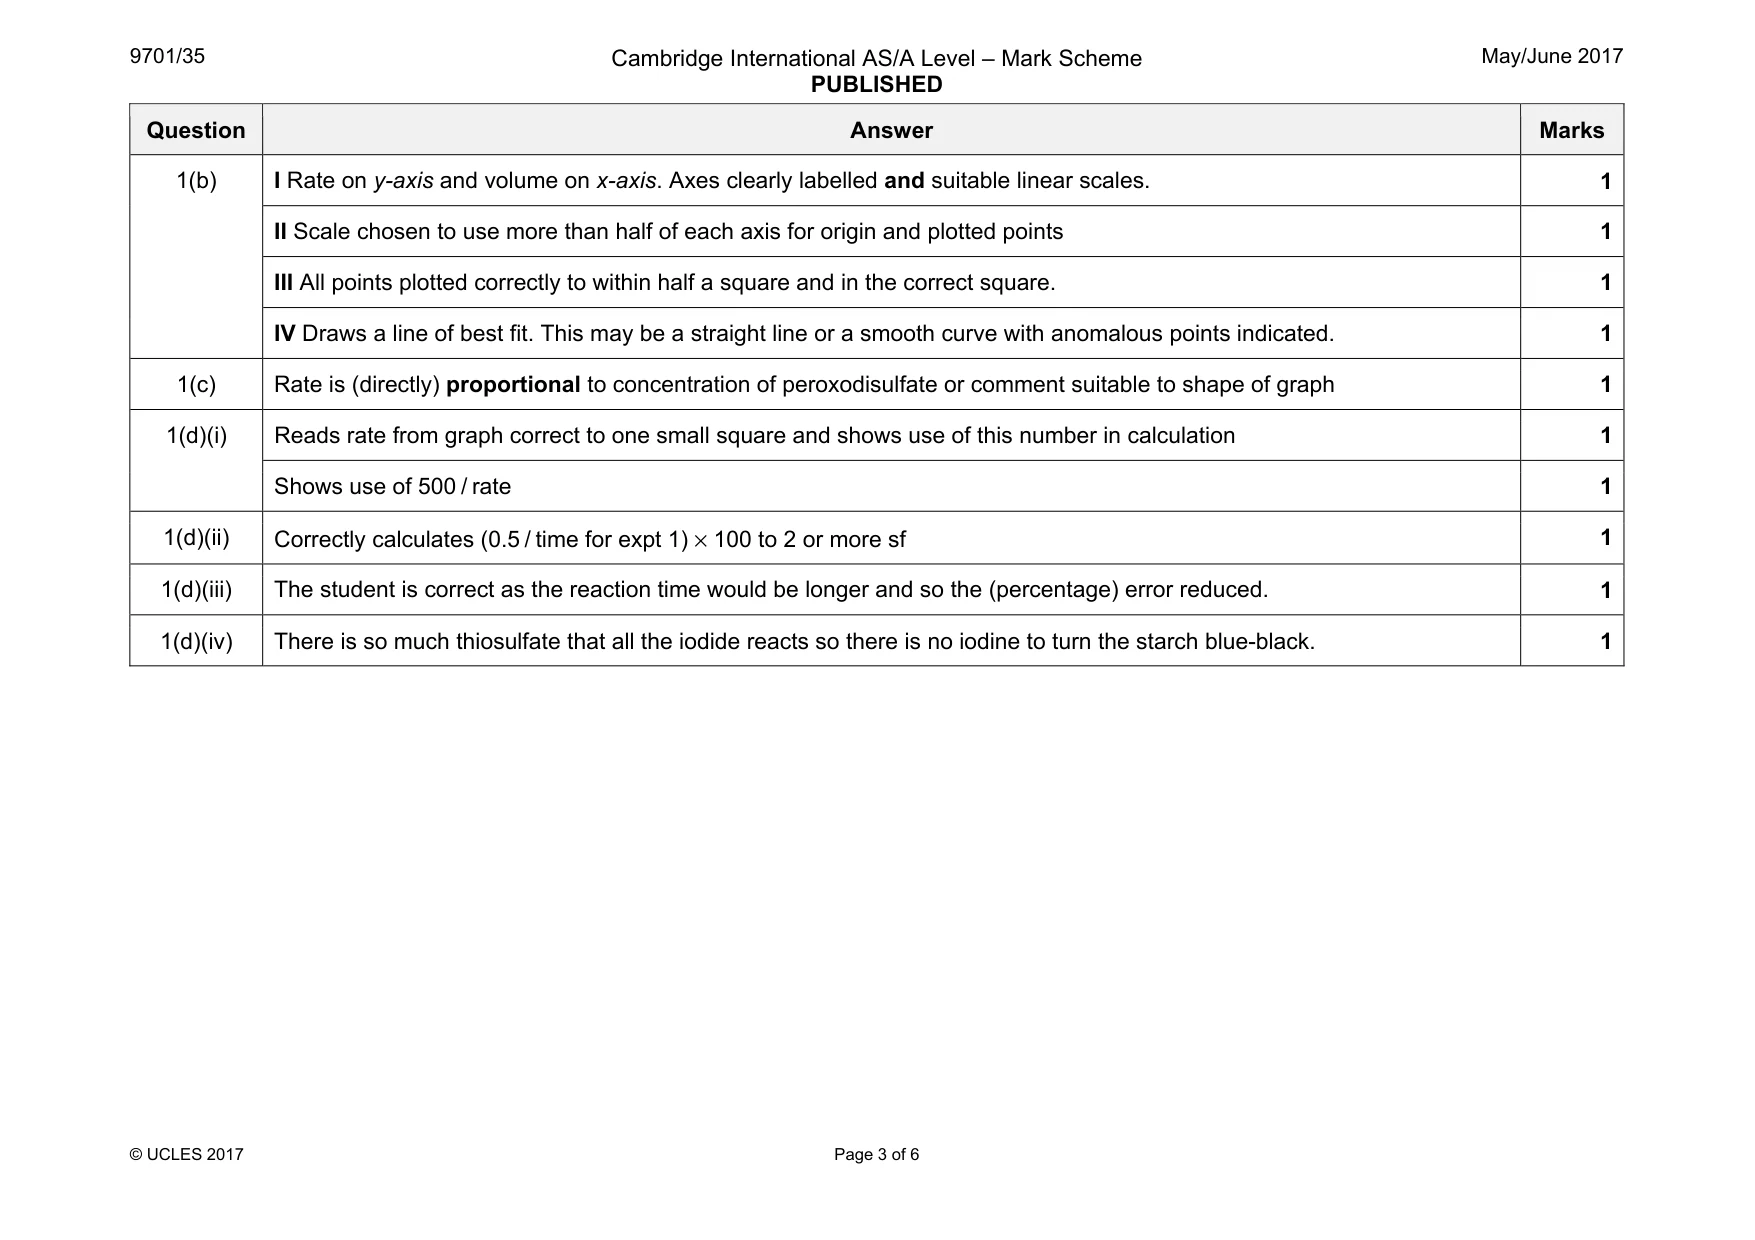
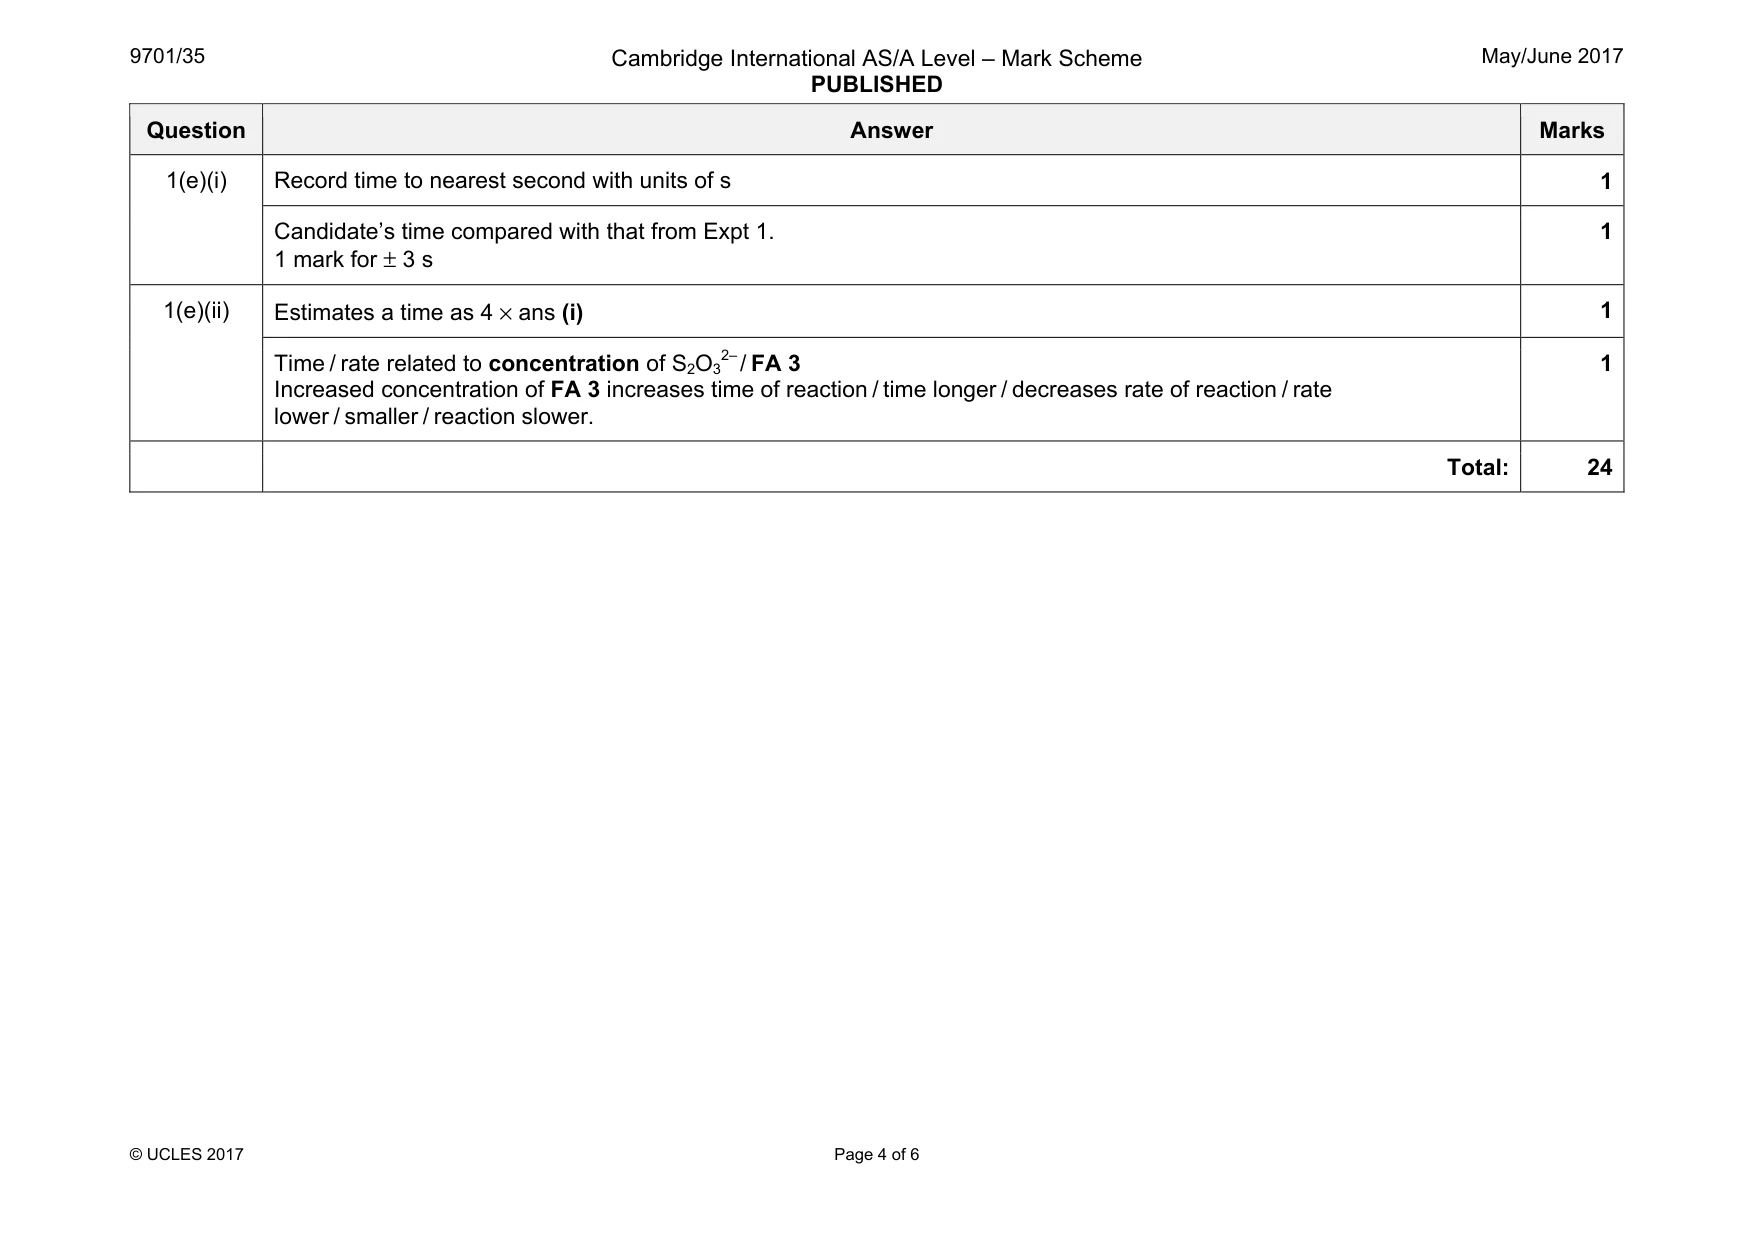
Mark scheme: 1(a) I Constructs a table for results showing volume of FA 1, volume of water, reaction time, reaction rate for all experiments carried out 1 II Appropriate headings and units for recorded data given. Volumes in cm3 or / cm3 or (cm3). Time in seconds or / s or (s) All volumes except zero given to .00. 1 III All times recorded to the nearest second. 1 IV 3 additional volumes chosen intervals not less than 2.00 cm3 and all volumes of FA 1 ⩾ 6.00 cm3 and one volume of FA 1 ⩽ 8.00 cm3 1 V In all 3 additional experiments water is added to make a total of 20.(00) cm3 1 VI + VII Compare time for 20.00 cm3 of FA 1 with that of supervisor. 2 marks for ± 3 s 1 mark for ± 5 s 2 VIII Compare ratio of time for 10.00 cm3 of FA 1 / time for 20.00 cm3 of FA 1. 1 mark for ratio between 1.8 – 2.2 1 IX All rates correctly calculated using 500 / time (minimum 2 sf and 1 dp) 1 X Units for rate given as s–1 1 Question Answer Marks 1(b) I Rate on y-axis and volume on x-axis. Axes clearly labelled and suitable linear scales. 1 II Scale chosen to use more than half of each axis for origin and plotted points 1 III All points plotted correctly to within half a square and in the correct square. 1 IV Draws a line of best fit. This may be a straight line or a smooth curve with anomalous points indicated. 1 1(c) Rate is (directly) proportional to concentration of peroxodisulfate or comment suitable to shape of graph 1 1(d)(i) Reads rate from graph correct to one small square and shows use of this number in calculation 1 Shows use of 500 / rate 1 1(d)(ii) Correctly calculates (0.5 / time for expt 1) × 100 to 2 or more sf 1 1(d)(iii) The student is correct as the reaction time would be longer and so the (percentage) error reduced. 1 1(d)(iv) There is so much thiosulfate that all the iodide reacts so there is no iodine to turn the starch blue-black. 1 Question Answer Marks 1(e)(i) Record time to nearest second with units of s 1 Candidate’s time compared with that from Expt 1. 1 mark for ± 3 s 1 1(e)(ii) Estimates a time as 4 × ans (i) 1 Time / rate related to concentration of S2O3 2–/ FA 3 Increased concentration of FA 3 increases time of reaction / time longer / decreases rate of reaction / rate lower / smaller / reaction slower. 1 Total: 24
Q2 · Qualitative Analysis At each stage of any test you are to record details of the following
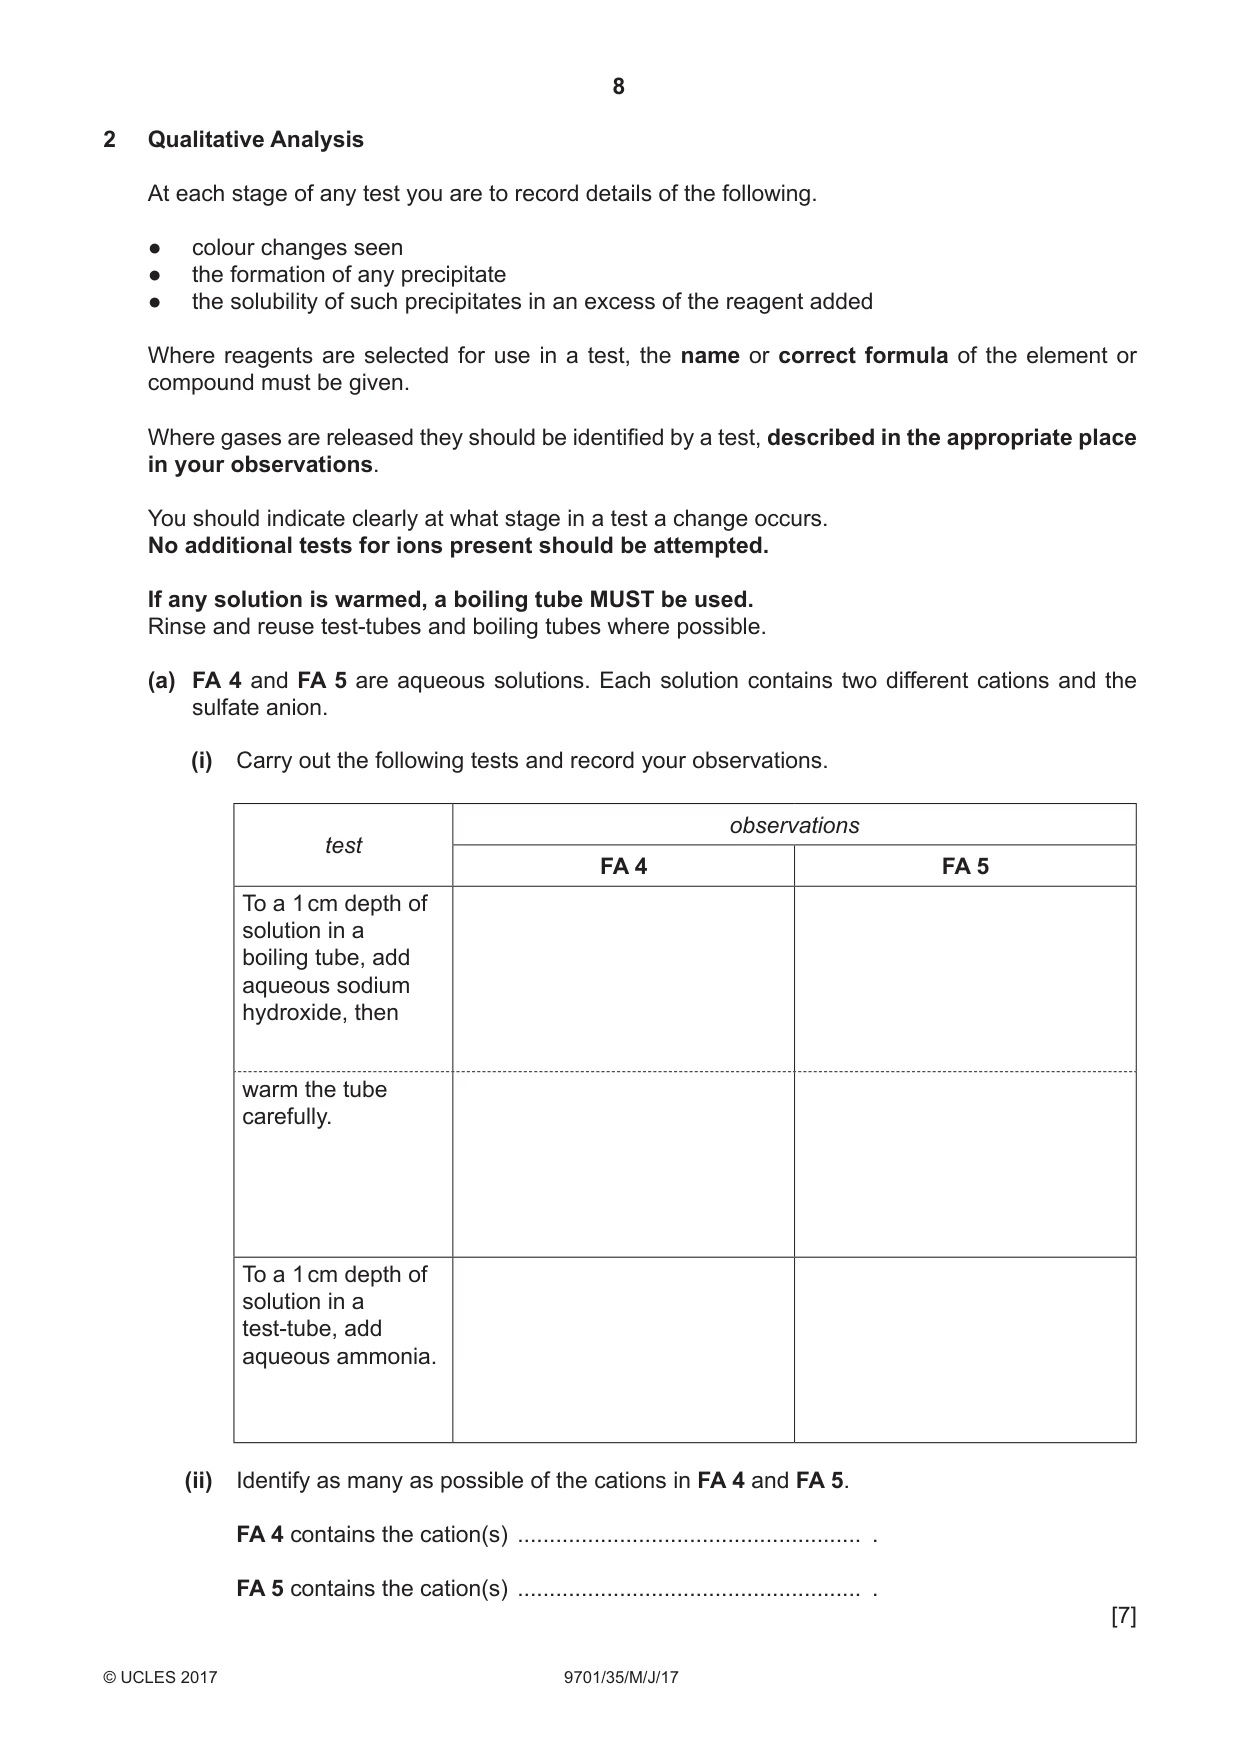
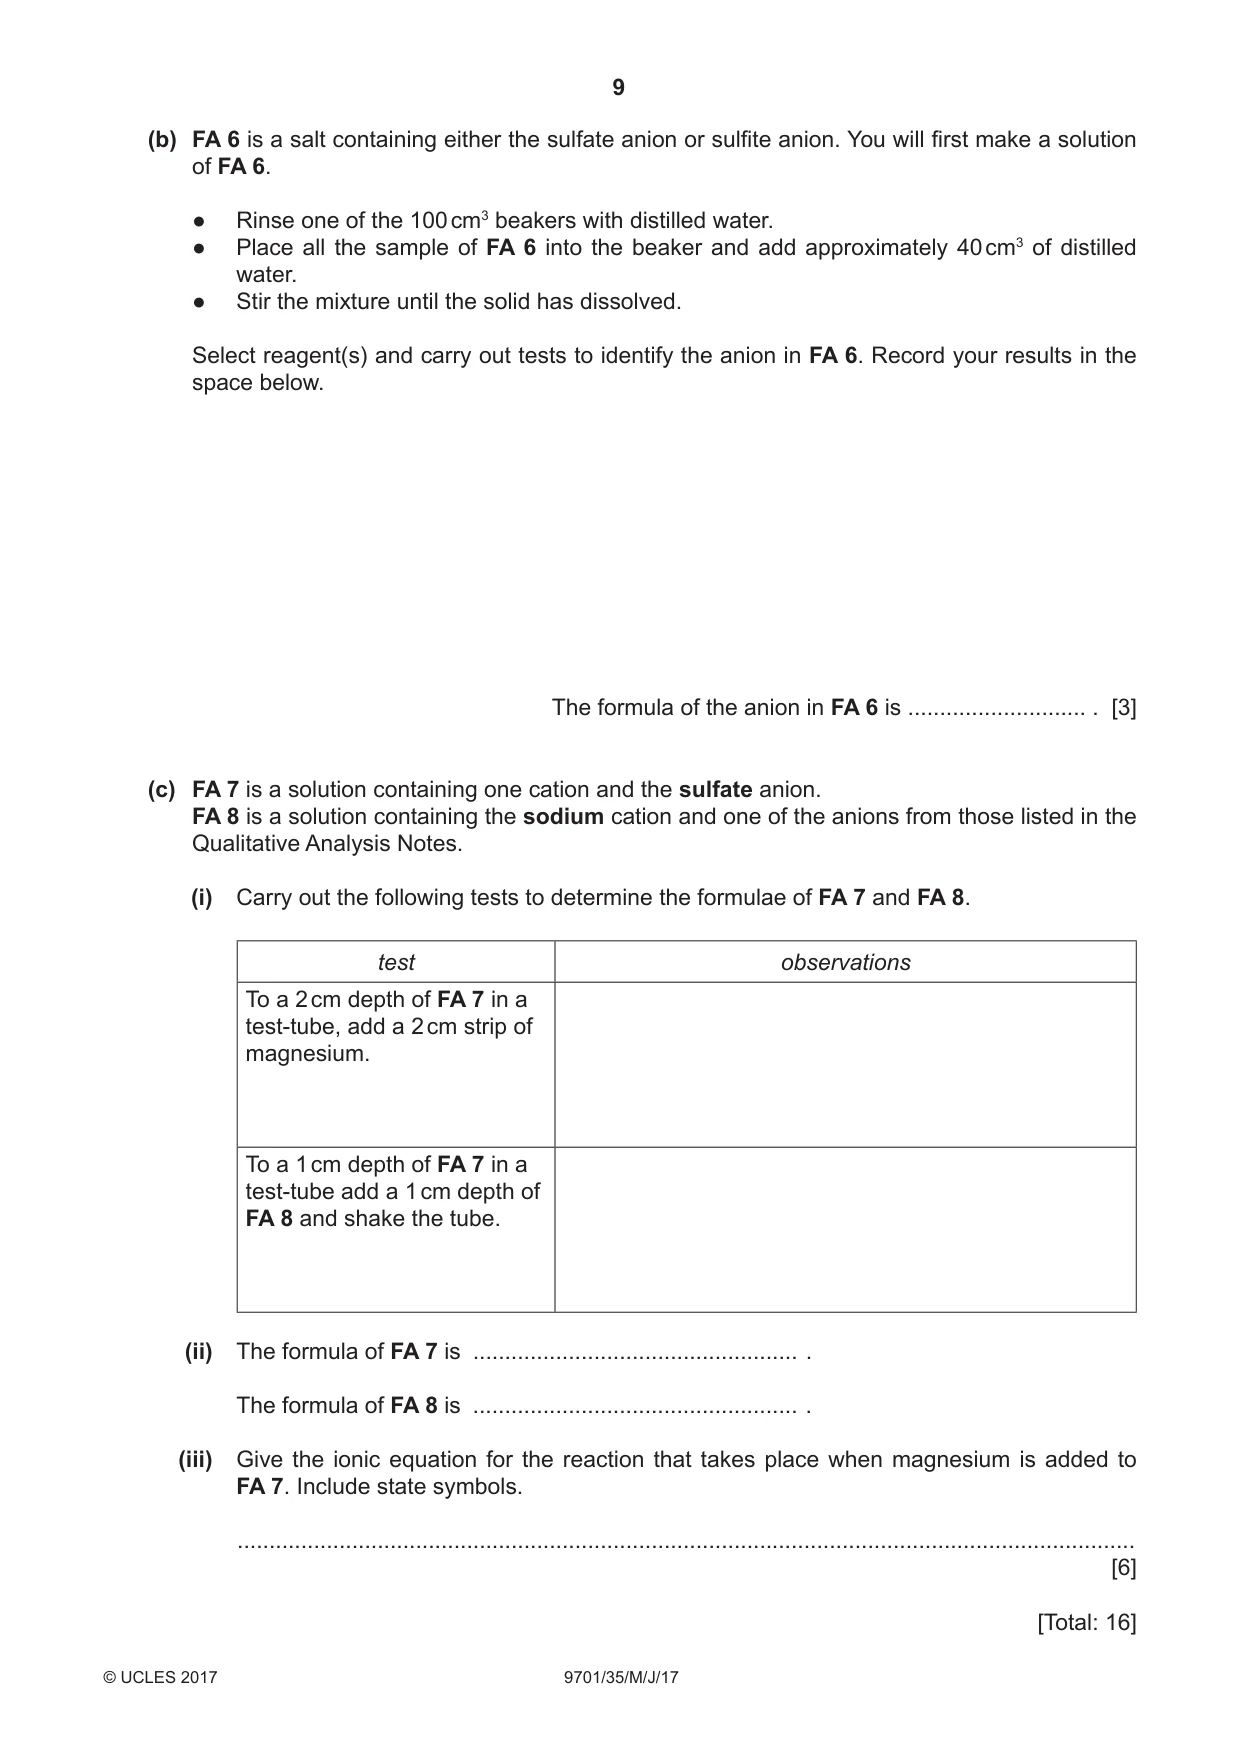
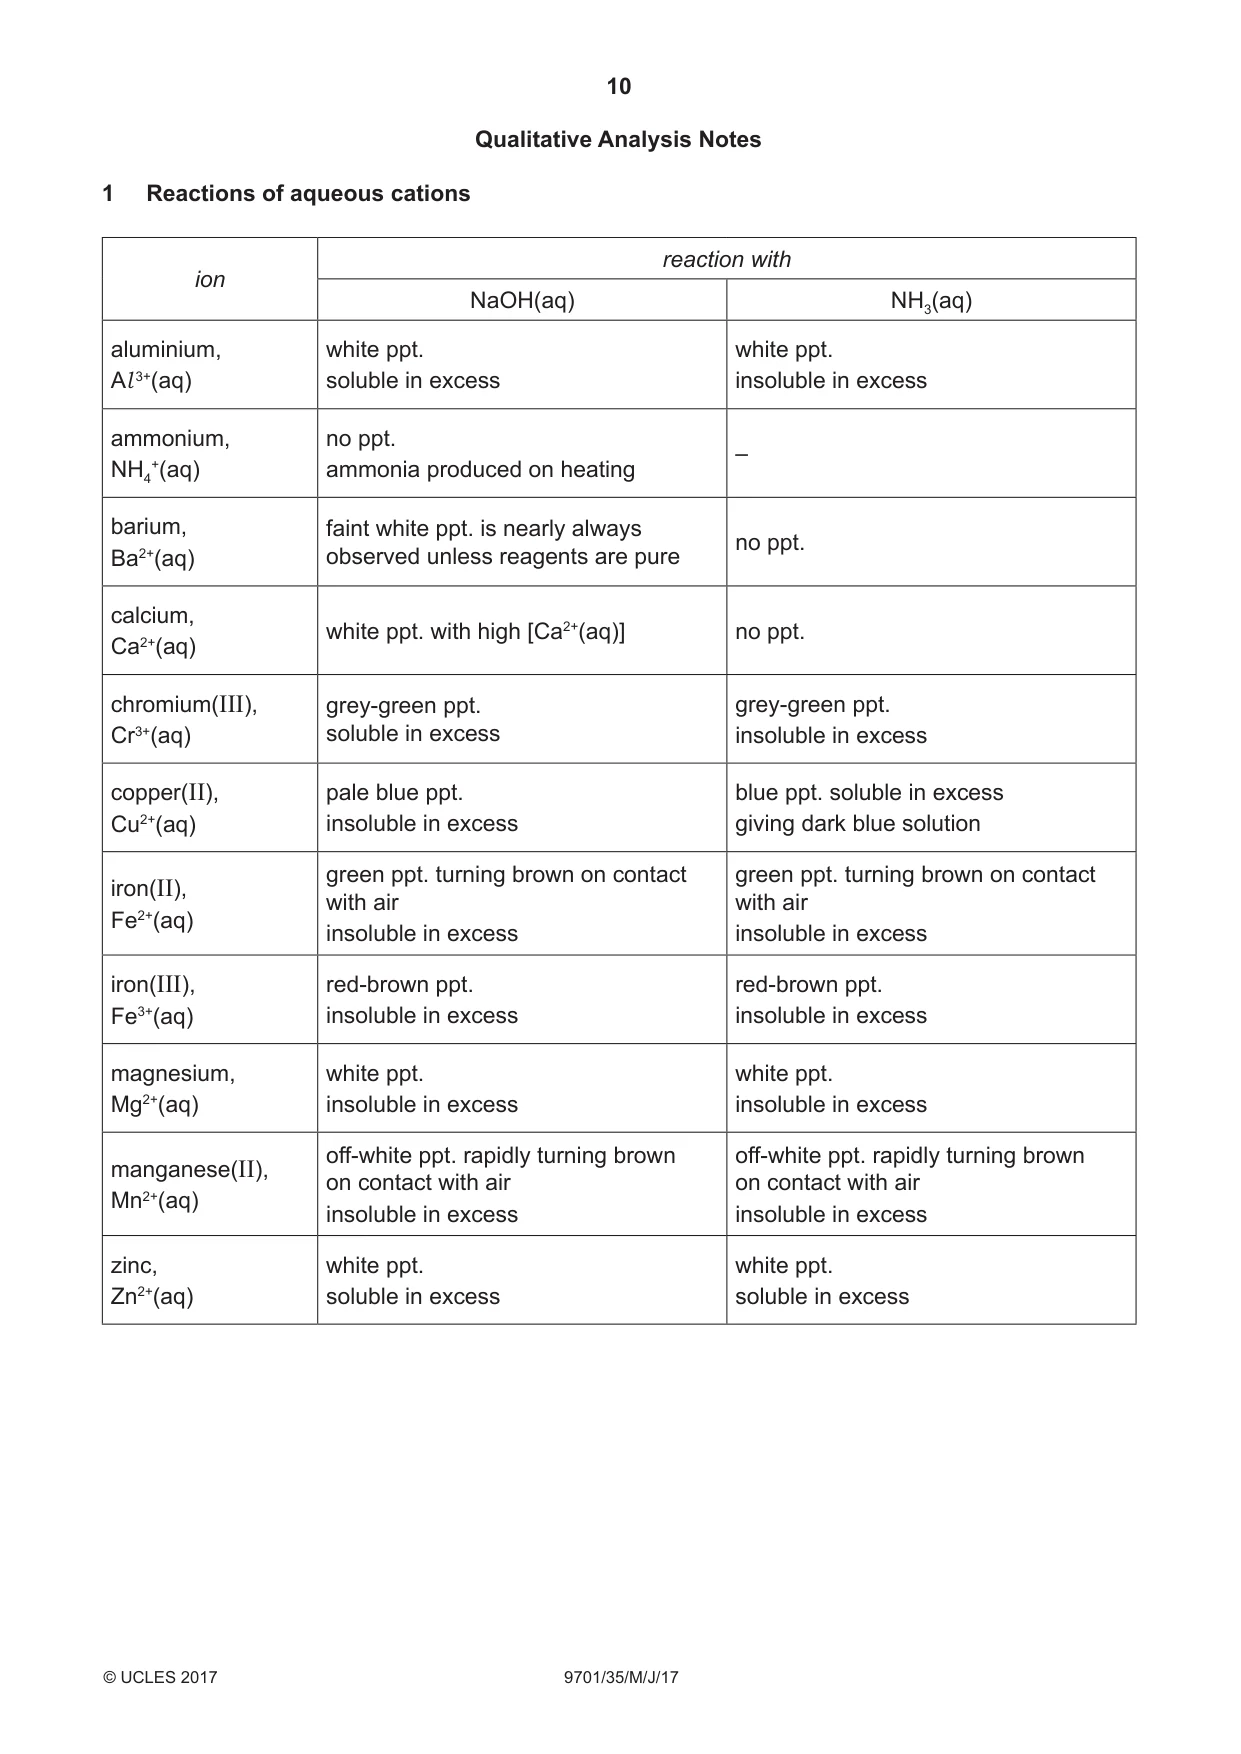
2 Qualitative Analysis At each stage of any test you are to record details of the following. ● colour changes seen ● the formation of any precipitate ● the solubility of such precipitates in an excess of the reagent added Where reagents are selected for use in a test, the name or correct formula of the element or compound must be given. Where gases are released they should be identified by a test, described in the appropriate place in your observations. You should indicate clearly at what stage in a test a change occurs. No additional tests for ions present should be attempted. If any solution is warmed, a boiling tube MUST be used. Rinse and reuse test-tubes and boiling tubes where possible. (a) FA 4 and FA 5 are aqueous solutions. Each solution contains two different cations and the sulfate anion. (i) Carry out the following tests and record your observations. observations test FA 4 FA 5 To a 1 cm depth of solution in a boiling tube, add aqueous sodium hydroxide, then warm the tube carefully. To a 1 cm depth of solution in a test-tube, add aqueous ammonia. (ii) Identify as many as possible of the cations in FA 4 and FA 5. FA 4 contains the cation(s) ....................................................... . FA 5 contains the cation(s) ....................................................... . [7] (b) FA 6 is a salt containing either the sulfate anion or sulfite anion. You will first make a solution of FA 6. ● Rinse one of the 100 cm3 beakers with distilled water. ● Place all the sample of FA 6 into the beaker and add approximately 40 cm3 of distilled water. ● Stir the mixture until the solid has dissolved. Select reagent(s) and carry out tests to identify the anion in FA 6. Record your results in the space below. The formula of the anion in FA 6 is ............................ . [3] (c) FA 7 is a solution containing one cation and the sulfate anion. FA 8 is a solution containing the sodium cation and one of the anions from those listed in the Qualitative Analysis Notes. (i) Carry out the following tests to determine the formulae of FA 7 and FA 8. test observations To a 2 cm depth of FA 7 in a test-tube, add a 2 cm strip of magnesium. To a 1 cm depth of FA 7 in a test-tube add a 1 cm depth of FA 8 and shake the tube. (ii) The formula of FA 7 is .................................................... . The formula of FA 8 is .................................................... . (iii) Give the ionic equation for the reaction that takes place when magnesium is added to FA 7. Include state symbols. ............................................................................................................................................. [6] [Total: 16] Qualitative Analysis Notes 1 Reactions of aqueous cations reaction with ion NaOH(aq) NH3(aq) aluminium, white ppt. white ppt. Al 3+(aq) soluble in excess insoluble in excess ammonium, no ppt. – NH4+(aq) ammonia produced on heating barium, faint white ppt. is nearly always no ppt. Ba2+(aq) observed unless reagents are pure calcium, white ppt. with high [Ca2+(aq)] no ppt. Ca2+(aq) chromium(III), grey-green ppt. grey-green ppt. Cr3+(aq) soluble in excess insoluble in excess copper(II), pale blue ppt. blue ppt. soluble in excess Cu2+(aq) insoluble in excess giving dark blue solution green ppt. turning brown on contact green ppt. turning brown on contact iron(II), with air with air Fe2+(aq) insoluble in excess insoluble in excess iron(III), red-brown ppt. red-brown ppt. Fe3+(aq) insoluble in excess insoluble in excess magnesium, white ppt. white ppt. Mg2+(aq) insoluble in excess insoluble in excess off-white ppt. rapidly turning brown off-white ppt. rapidly turning brown manganese(II), on contact with air on contact with air Mn2+(aq) insoluble in excess insoluble in excess zinc, white ppt. white ppt. Zn2+(aq) soluble in excess soluble in excess
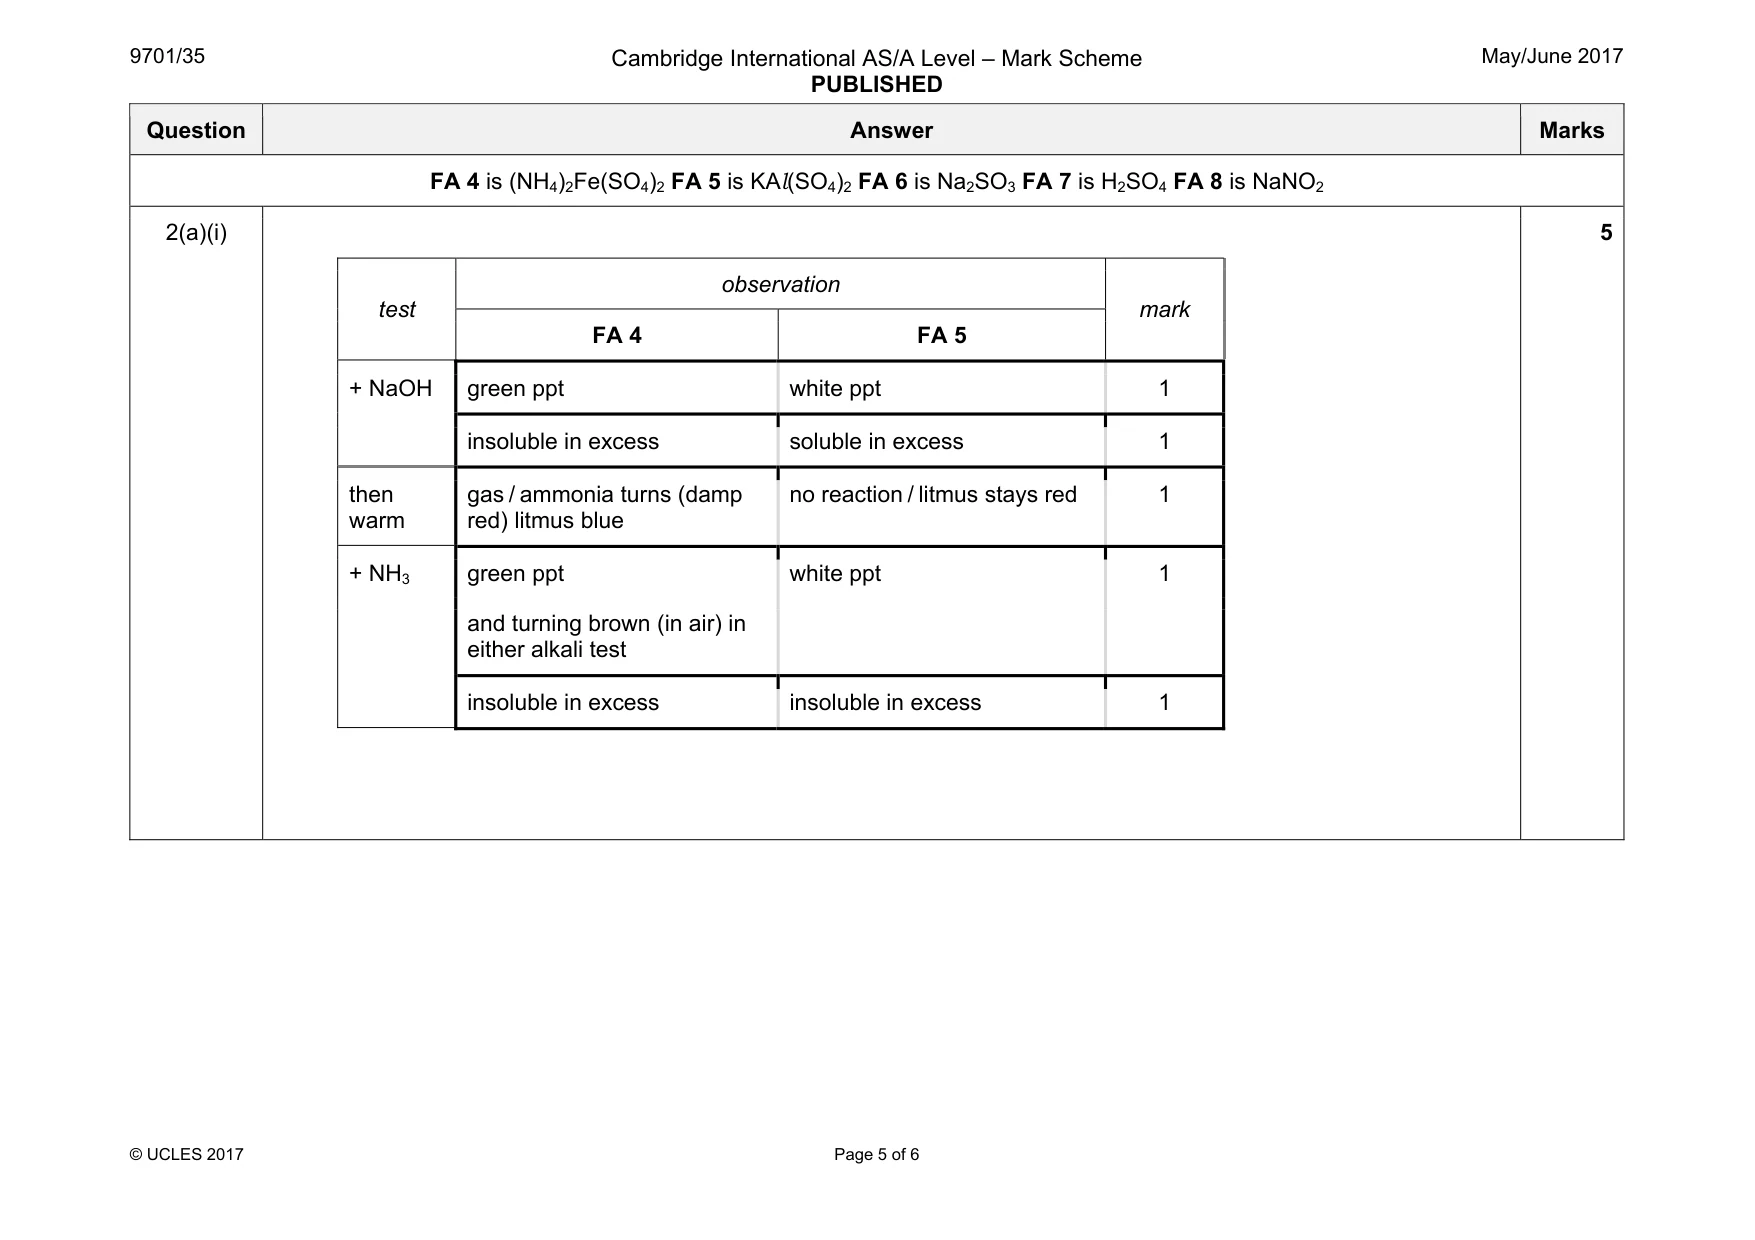
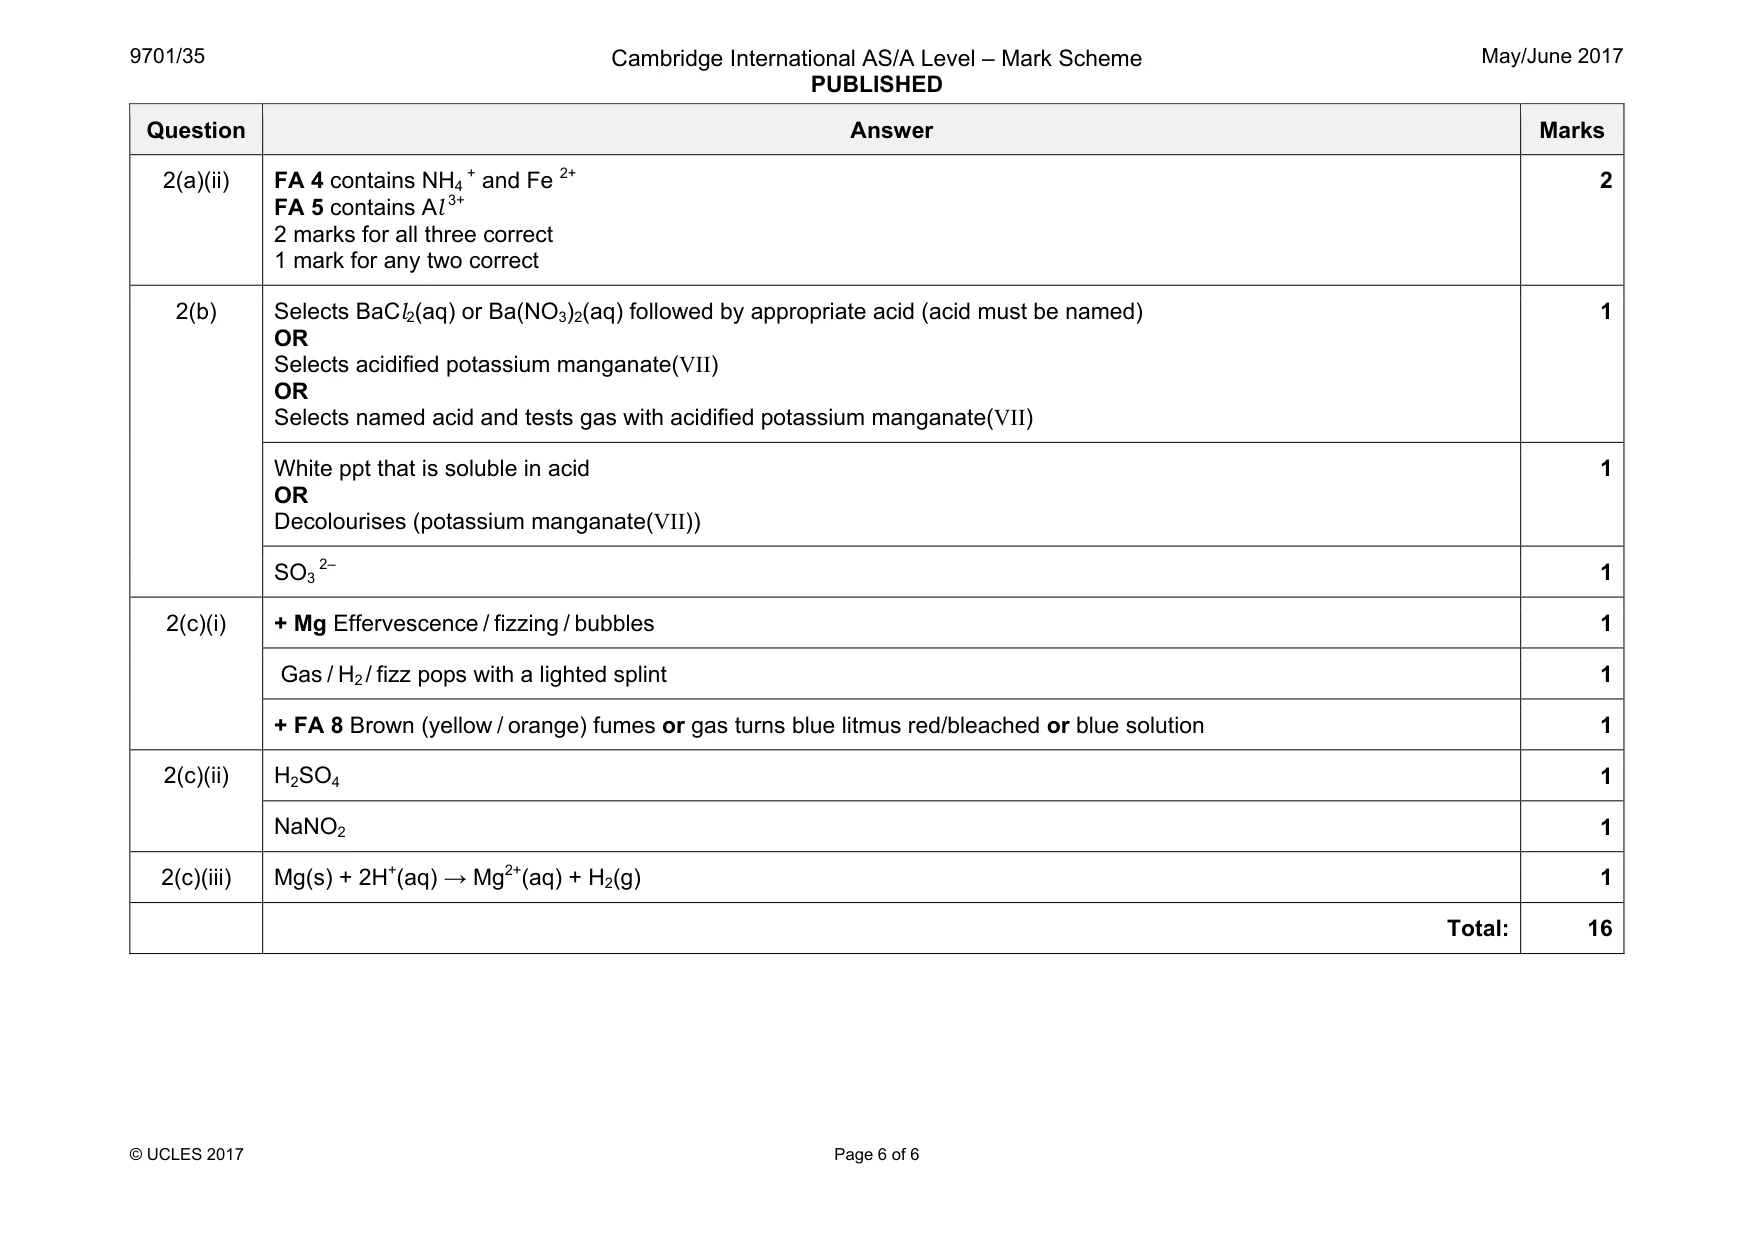
Mark scheme: 2(a)(i) test observation mark FA 4 FA 5 + NaOH green ppt white ppt 1 insoluble in excess soluble in excess 1 then warm gas / ammonia turns (damp red) litmus blue no reaction / litmus stays red 1 + NH3 green ppt white ppt 1 and turning brown (in air) in either alkali test insoluble in excess insoluble in excess 1 5 Question Answer Marks 2(a)(ii) FA 4 contains NH4 + and Fe 2+ FA 5 contains Al 3+ 2 marks for all three correct 1 mark for any two correct 2 2(b) Selects BaCl2(aq) or Ba(NO3)2(aq) followed by appropriate acid (acid must be named) OR Selects acidified potassium manganate(VII) OR Selects named acid and tests gas with acidified potassium manganate(VII) 1 White ppt that is soluble in acid OR Decolourises (potassium manganate(VII)) 1 SO3 2‒ 1 2(c)(i) + Mg Effervescence / fizzing / bubbles 1 Gas / H2/ fizz pops with a lighted splint 1 + FA 8 Brown (yellow / orange) fumes or gas turns blue litmus red/bleached or blue solution 1 2(c)(ii) H2SO4 1 NaNO2 1 2(c)(iii) Mg(s) + 2H+(aq) → Mg2+(aq) + H2(g) 1 Total: 16
What was in this paper
The subtopics covered by these 2 questions, and how many questions each got. Open one in a new tab to see every Cambridge question on it.
What you needed in this session
Cambridge’s own grade thresholds for 2017 May/June, Paper 3 · Variant 5. A higher threshold means an easier paper — the bar moves with how the cohort did.