Cambridge A Level Chemistry 9701 — 2012 Oct/Nov Paper 5 · Variant 3
9701/53/O/N/12 · 30 marks · ≈34 min
The question paper and its mark scheme, free to read here and free to download. This is Cambridge’s own paper, exactly as it was sat.
Question paper8 pages
Mark scheme6 pages
Answers below. Sit the paper first if you are practising.
Paper as text
Question paper, page 1
READ THESE INSTRUCTIONS FIRST Write your Centre number, candidate number and name on all the work you hand in. Write in dark blue or black pen. You may use a soft pencil for any diagrams, graphs or rough working. Do not use staples, paper clips, highlighters, glue or correction fl uid. DO NOT WRITE IN ANY BARCODES. Answer all questions. You may lose marks if you do not show your working or if you do not use appropriate units. Use of a Data Booklet is unnecessary. At the end of the examination, fasten all your work securely together. The number of marks is given in brackets [ ] at the end of each question or part question. CHEMISTRY 9701/53 Paper 5 Planning, Analysis and Evaluation October/November 2012 1 hour 15 minutes Candidates answer on the Question Paper. No Additional Materials are required. UNIVERSITY OF CAMBRIDGE INTERNATIONAL EXAMINATIONS General Certifi cate of Education Advanced Level This document consists of 8 printed pages. [Turn over IB12 11_9701_53/5RP © UCLES 2012 *0337350796* For Examiner’s Use 1 2 3 Total
Question paper, page 2
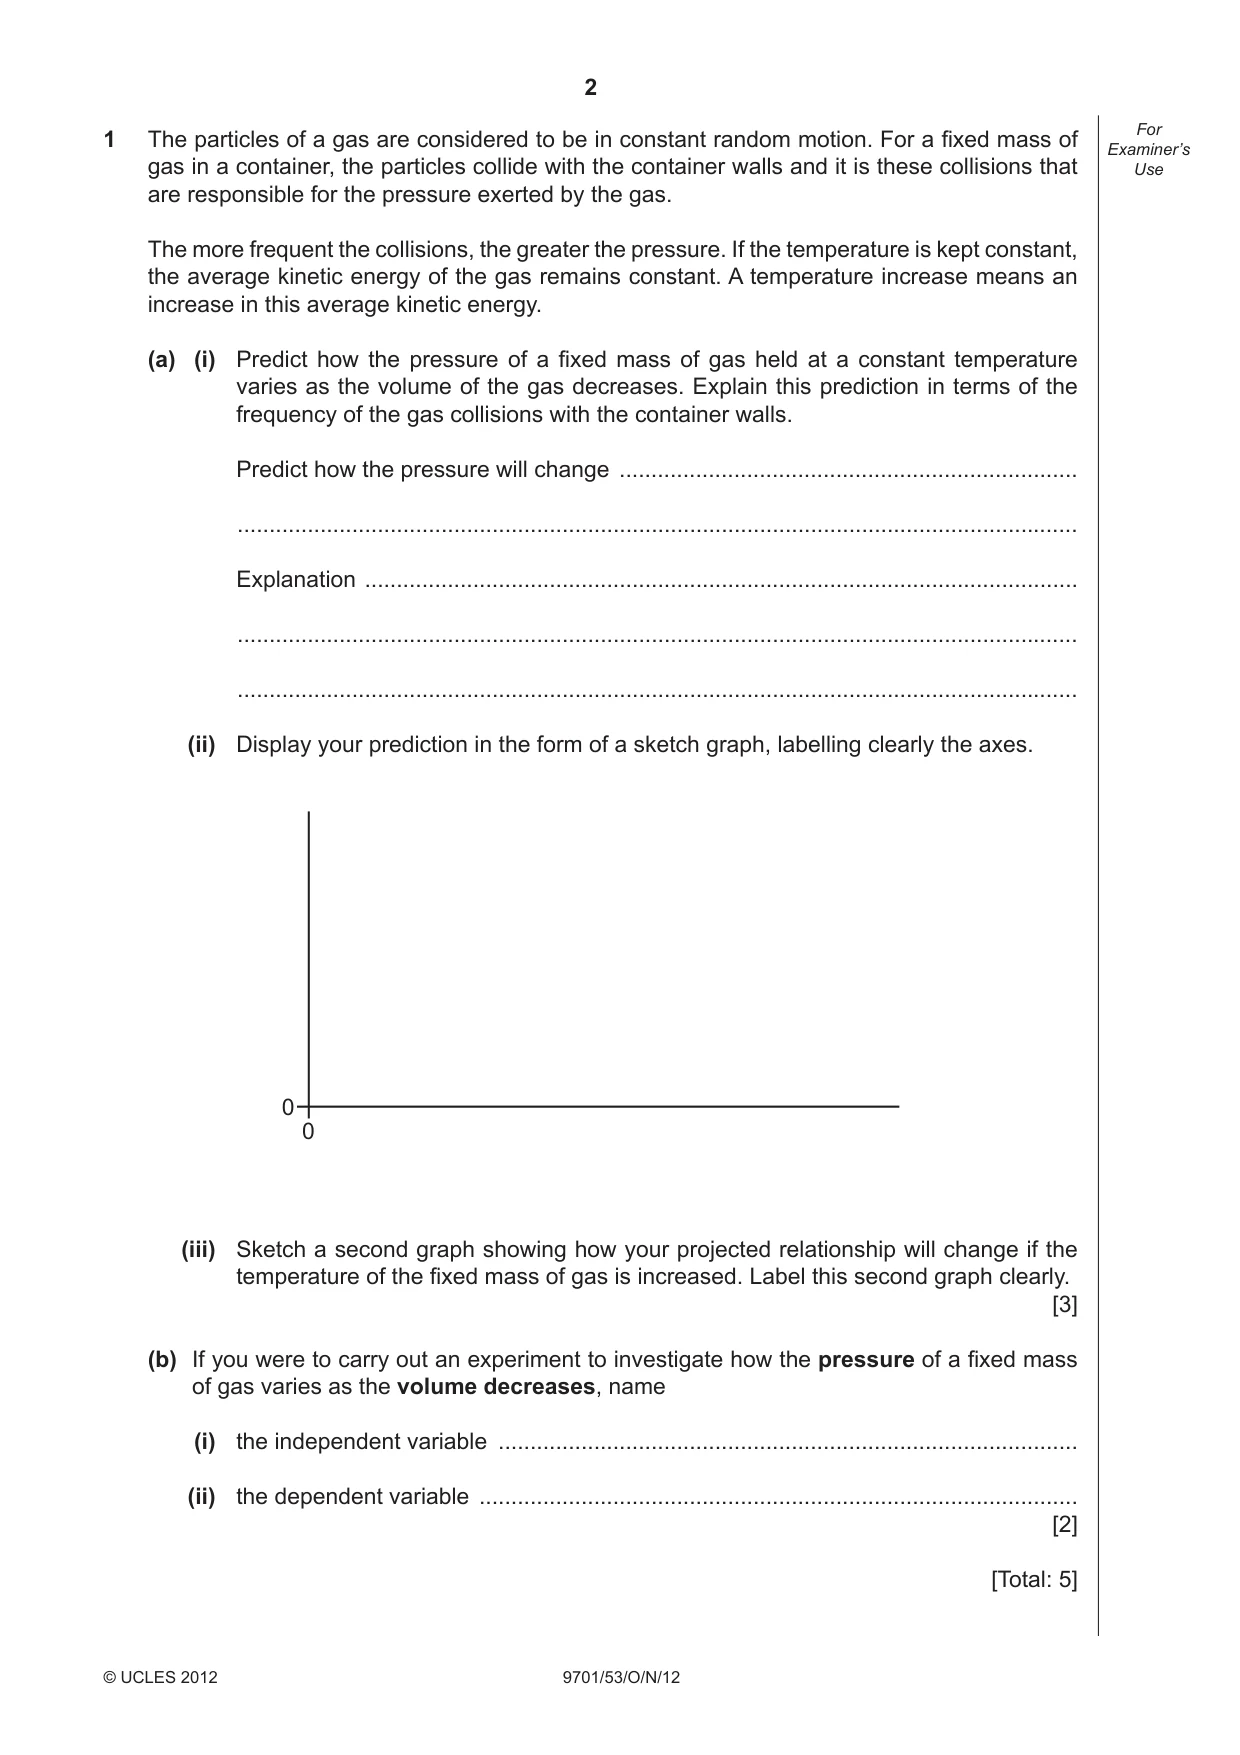
2 9701/53/O/N/12 © UCLES 2012 For Examiner’s Use 1 The particles of a gas are considered to be in constant random motion. For a fi xed mass of gas in a container, the particles collide with the container walls and it is these collisions that are responsible for the pressure exerted by the gas. The more frequent the collisions, the greater the pressure. If the temperature is kept constant, the average kinetic energy of the gas remains constant. A temperature increase means an increase in this average kinetic energy. (a) (i) Predict how the pressure of a fi xed mass of gas held at a constant temperature varies as the volume of the gas decreases. Explain this prediction in terms of the frequency of the gas collisions with the container walls. Predict how the pressure will change … … Explanation … … … (ii) Display your prediction in the form of a sketch graph, labelling clearly the axes. 0 0 (iii) Sketch a second graph showing how your projected relationship will change if the temperature of the fi xed mass of gas is increased. Label this second graph clearly. [3] (b) If you were to carry out an experiment to investigate how the pressure of a fi xed mass of gas varies as the volume decreases, name (i) the independent variable … (ii) the dependent variable … [2] [Total: 5]
Question paper, page 3
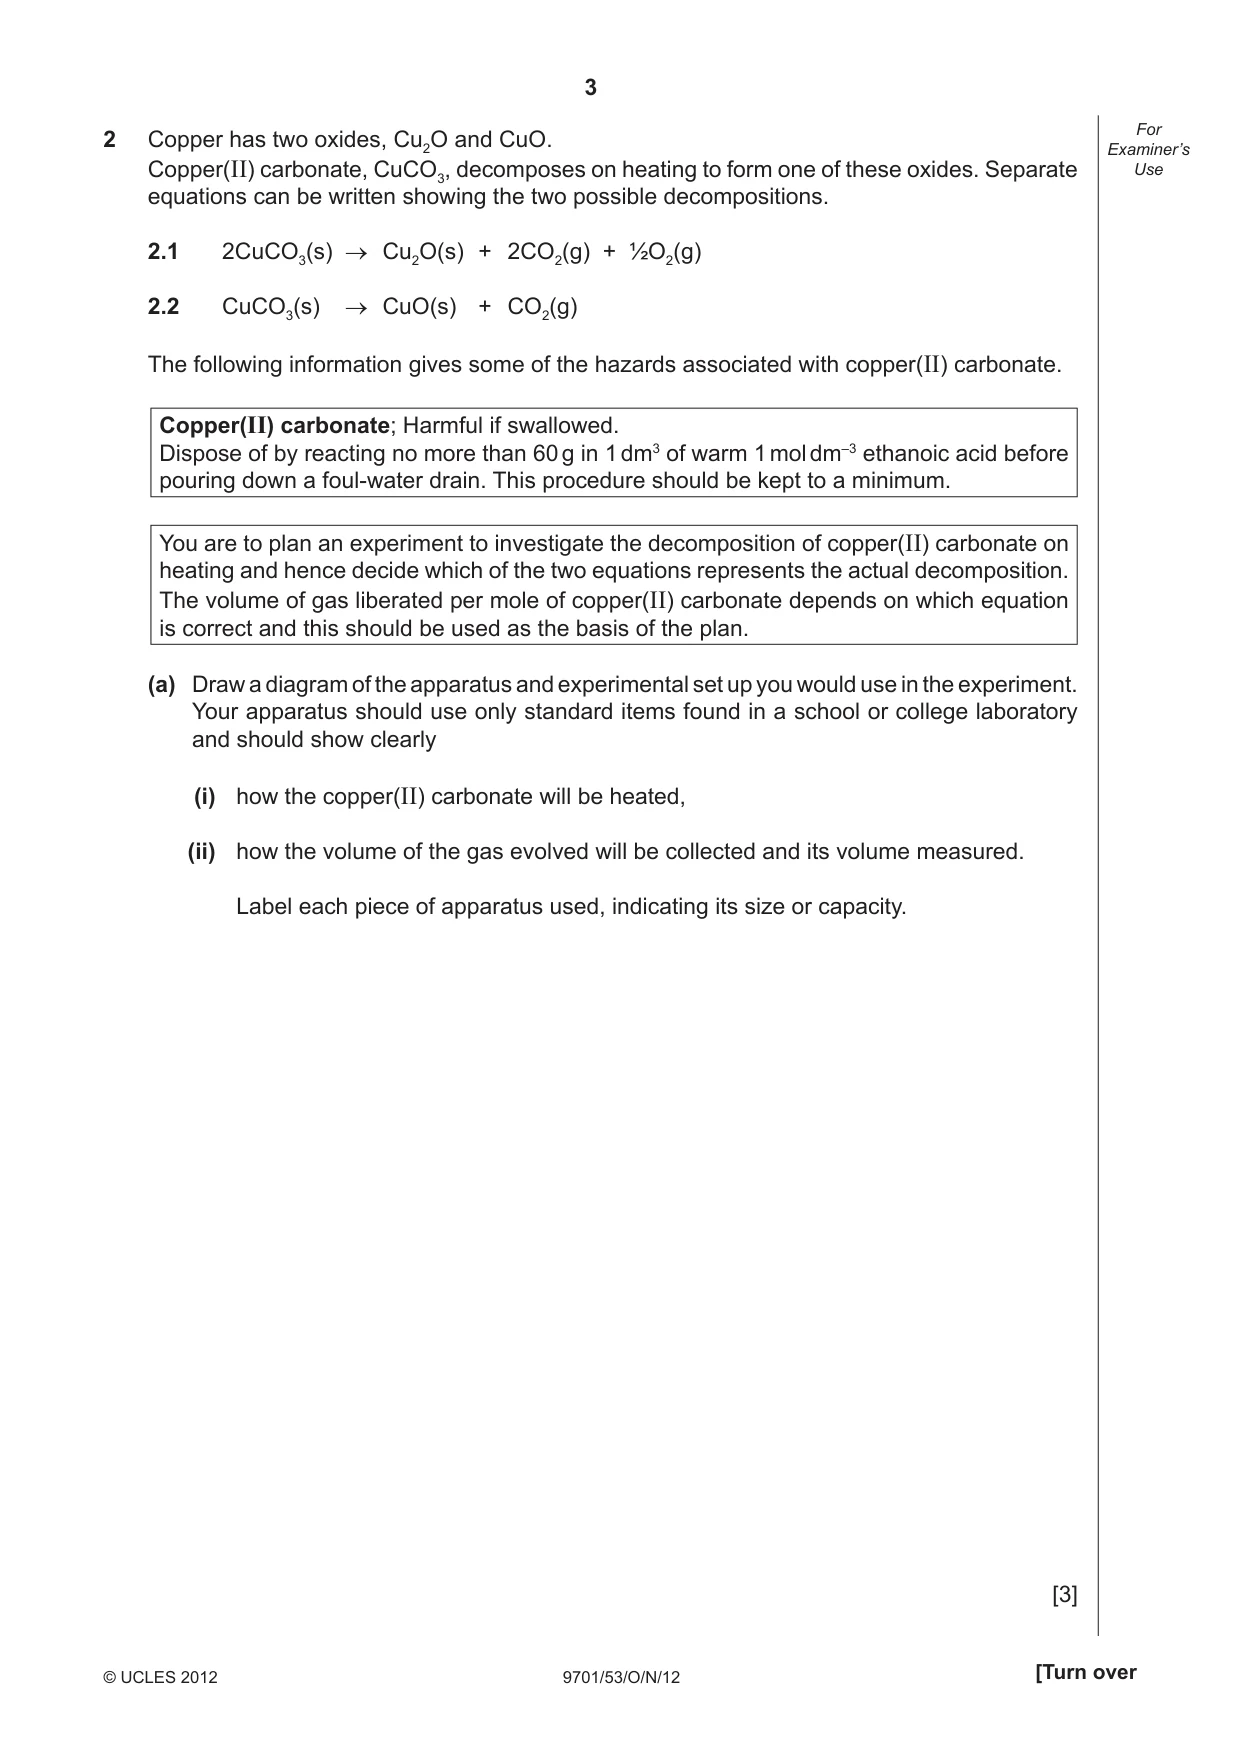
3 9701/53/O/N/12 © UCLES 2012 [Turn over For Examiner’s Use 2 Copper has two oxides, Cu2O and CuO. Copper(II) carbonate, CuCO3, decomposes on heating to form one of these oxides. Separate equations can be written showing the two possible decompositions. 2.1 2CuCO3(s) → Cu2O(s) + 2CO2(g) + ½O2(g) 2.2 CuCO3(s) → CuO(s) + CO2(g) The following information gives some of the hazards associated with copper(II) carbonate. Copper(II) carbonate; Harmful if swallowed. Dispose of by reacting no more than 60 g in 1 dm3 of warm 1 mol dm–3 ethanoic acid before pouring down a foul-water drain. This procedure should be kept to a minimum. You are to plan an experiment to investigate the decomposition of copper(II) carbonate on heating and hence decide which of the two equations represents the actual decomposition. The volume of gas liberated per mole of copper(II) carbonate depends on which equation is correct and this should be used as the basis of the plan. (a) Draw a diagram of the apparatus and experimental set up you would use in the experiment. Your apparatus should use only standard items found in a school or college laboratory and should show clearly (i) how the copper(II) carbonate will be heated, (ii) how the volume of the gas evolved will be collected and its volume measured. Label each piece of apparatus used, indicating its size or capacity. [3]
Question paper, page 4
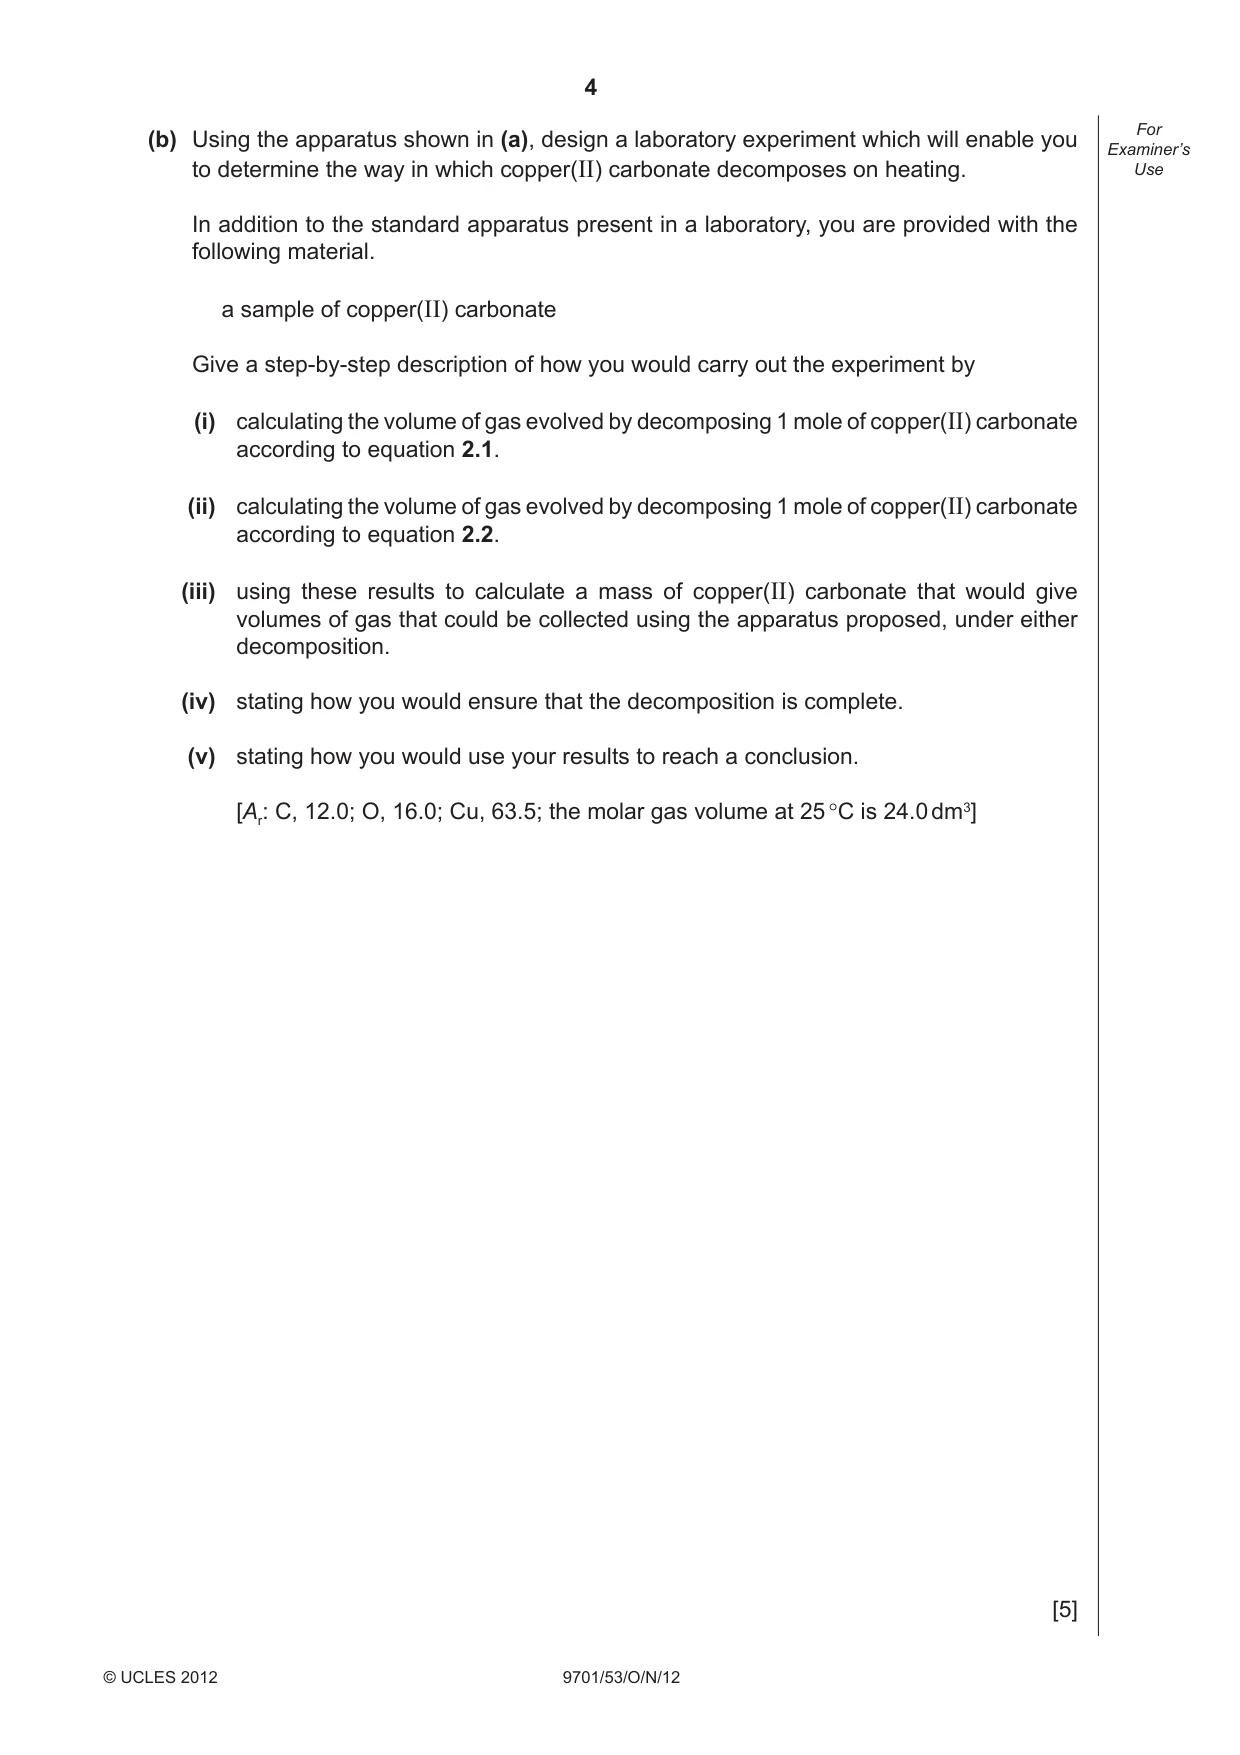
4 9701/53/O/N/12 © UCLES 2012 For Examiner’s Use (b) Using the apparatus shown in (a), design a laboratory experiment which will enable you to determine the way in which copper(II) carbonate decomposes on heating. In addition to the standard apparatus present in a laboratory, you are provided with the following material. a sample of copper(II) carbonate Give a step-by-step description of how you would carry out the experiment by (i) calculating the volume of gas evolved by decomposing 1 mole of copper(II) carbonate according to equation 2.1. (ii) calculating the volume of gas evolved by decomposing 1 mole of copper(II) carbonate according to equation 2.2. (iii) using these results to calculate a mass of copper(II) carbonate that would give volumes of gas that could be collected using the apparatus proposed, under either decomposition. (iv) stating how you would ensure that the decomposition is complete. (v) stating how you would use your results to reach a conclusion. [Ar: C, 12.0; O, 16.0; Cu, 63.5; the molar gas volume at 25 °C is 24.0 dm3] [5]
Question paper, page 5
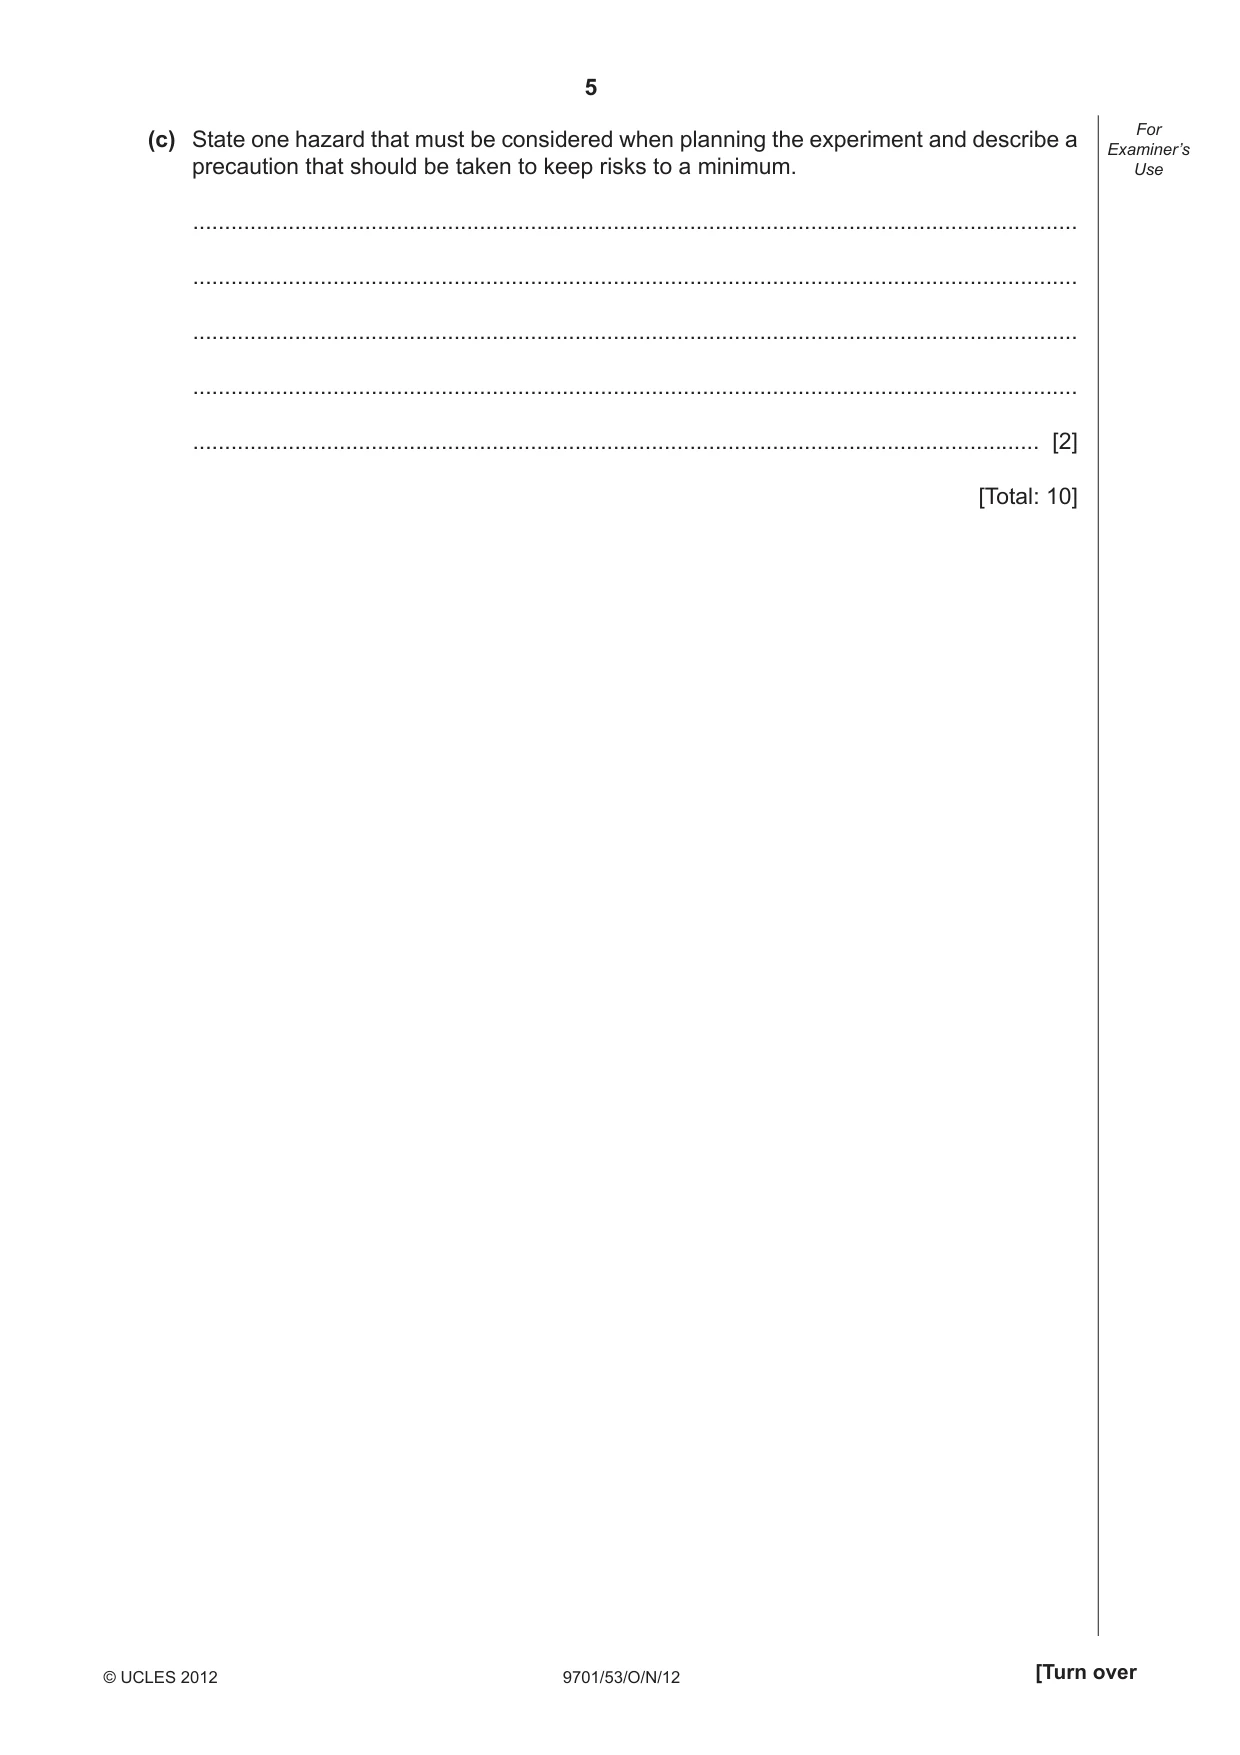
5 9701/53/O/N/12 © UCLES 2012 [Turn over For Examiner’s Use (c) State one hazard that must be considered when planning the experiment and describe a precaution that should be taken to keep risks to a minimum. … … … … … [2] [Total: 10]
Question paper, page 6
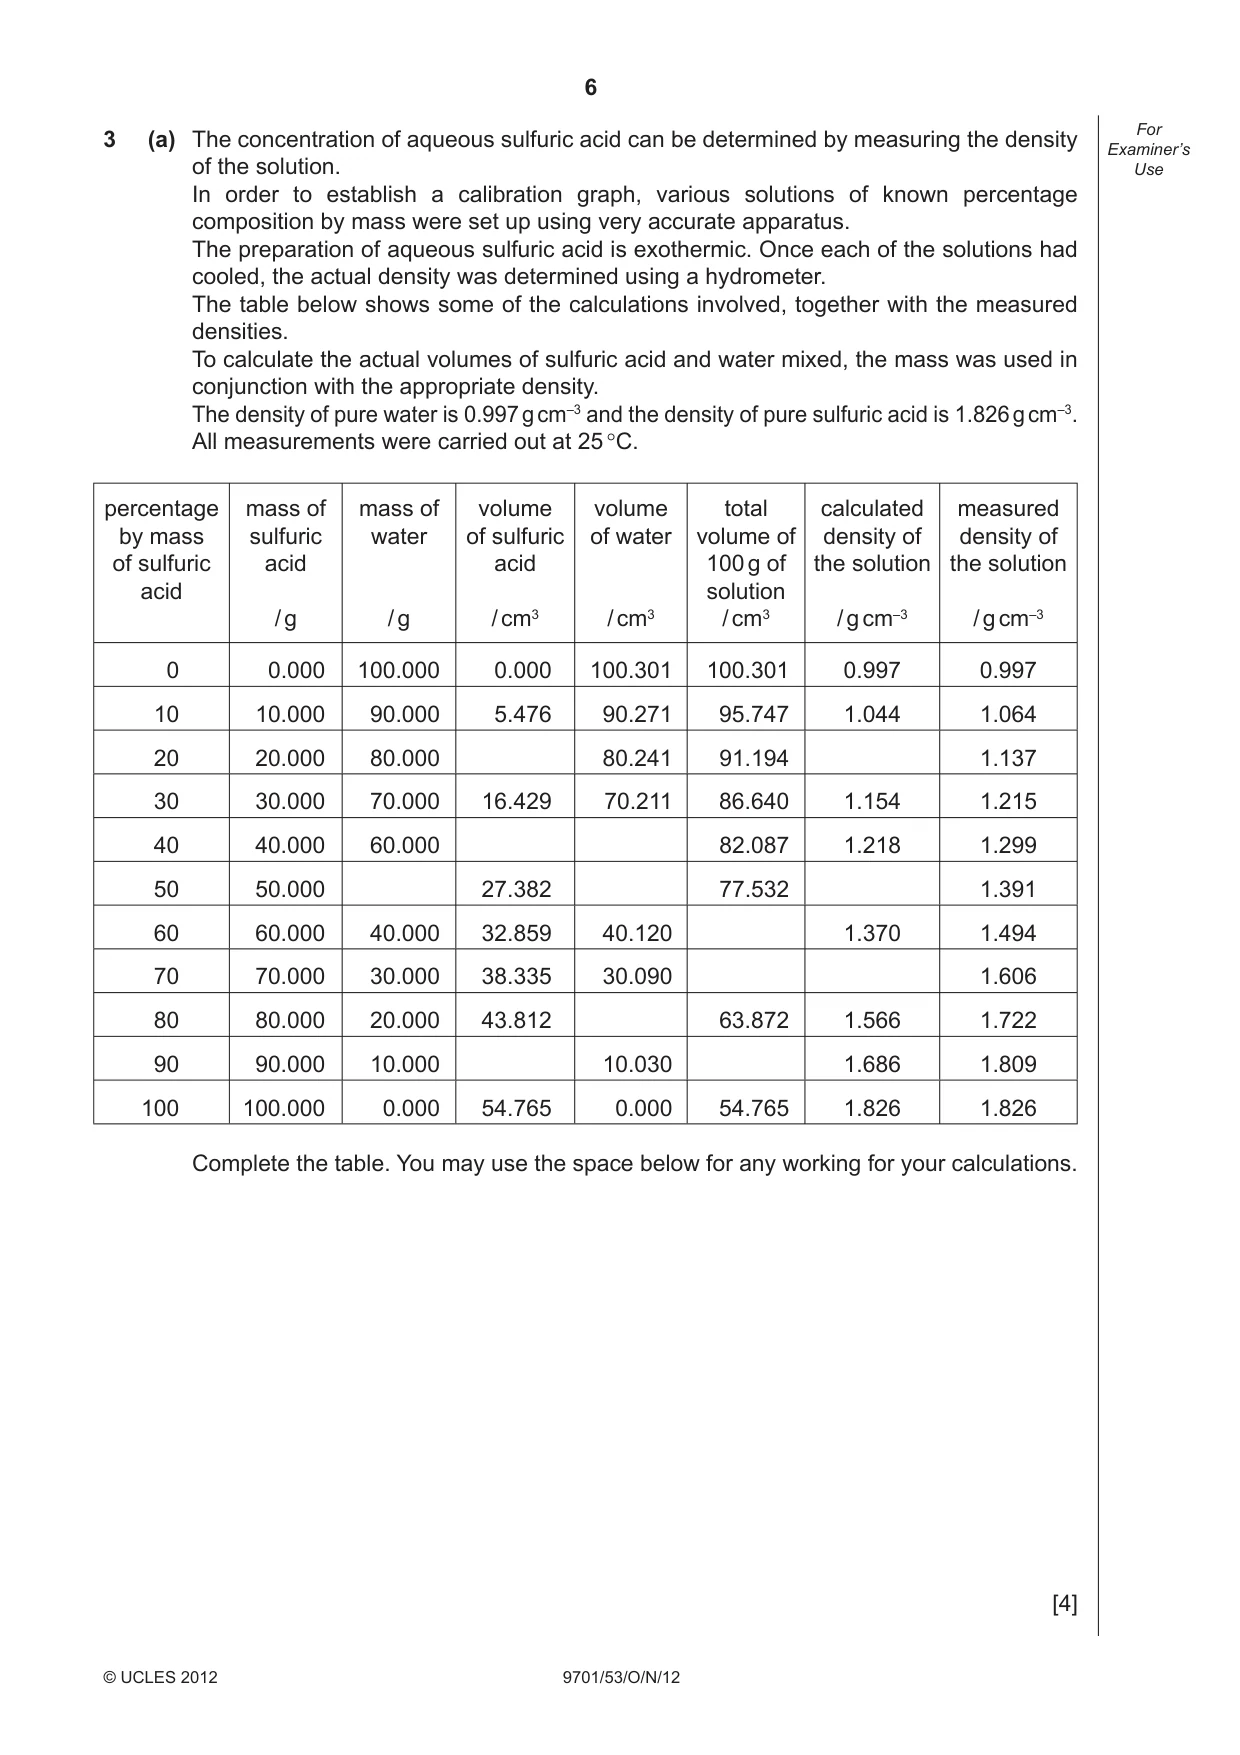
6 9701/53/O/N/12 © UCLES 2012 For Examiner’s Use 3 (a) The concentration of aqueous sulfuric acid can be determined by measuring the density of the solution. In order to establish a calibration graph, various solutions of known percentage composition by mass were set up using very accurate apparatus. The preparation of aqueous sulfuric acid is exothermic. Once each of the solutions had cooled, the actual density was determined using a hydrometer. The table below shows some of the calculations involved, together with the measured densities. To calculate the actual volumes of sulfuric acid and water mixed, the mass was used in conjunction with the appropriate density. The density of pure water is 0.997 g cm–3 and the density of pure sulfuric acid is 1.826 g cm–3. All measurements were carried out at 25 °C. percentage by mass of sulfuric acid mass of sulfuric acid / g mass of water / g volume of sulfuric acid / cm3 volume of water / cm3 total volume of 100 g of solution / cm3 calculated density of the solution / g cm–3 measured density of the solution / g cm–3 0 0.000 100.000 0.000 100.301 100.301 0.997 0.997 10 10.000 90.000 5.476 90.271 95.747 1.044 1.064 20 20.000 80.000 80.241 91.194 1.137 30 30.000 70.000 16.429 70.211 86.640 1.154 1.215 40 40.000 60.000 82.087 1.218 1.299 50 50.000 27.382 77.532 1.391 60 60.000 40.000 32.859 40.120 1.370 1.494 70 70.000 30.000 38.335 30.090 1.606 80 80.000 20.000 43.812 63.872 1.566 1.722 90 90.000 10.000 10.030 1.686 1.809 100 100.000 0.000 54.765 0.000 54.765 1.826 1.826 Complete the table. You may use the space below for any working for your calculations. [4]
Question paper, page 7
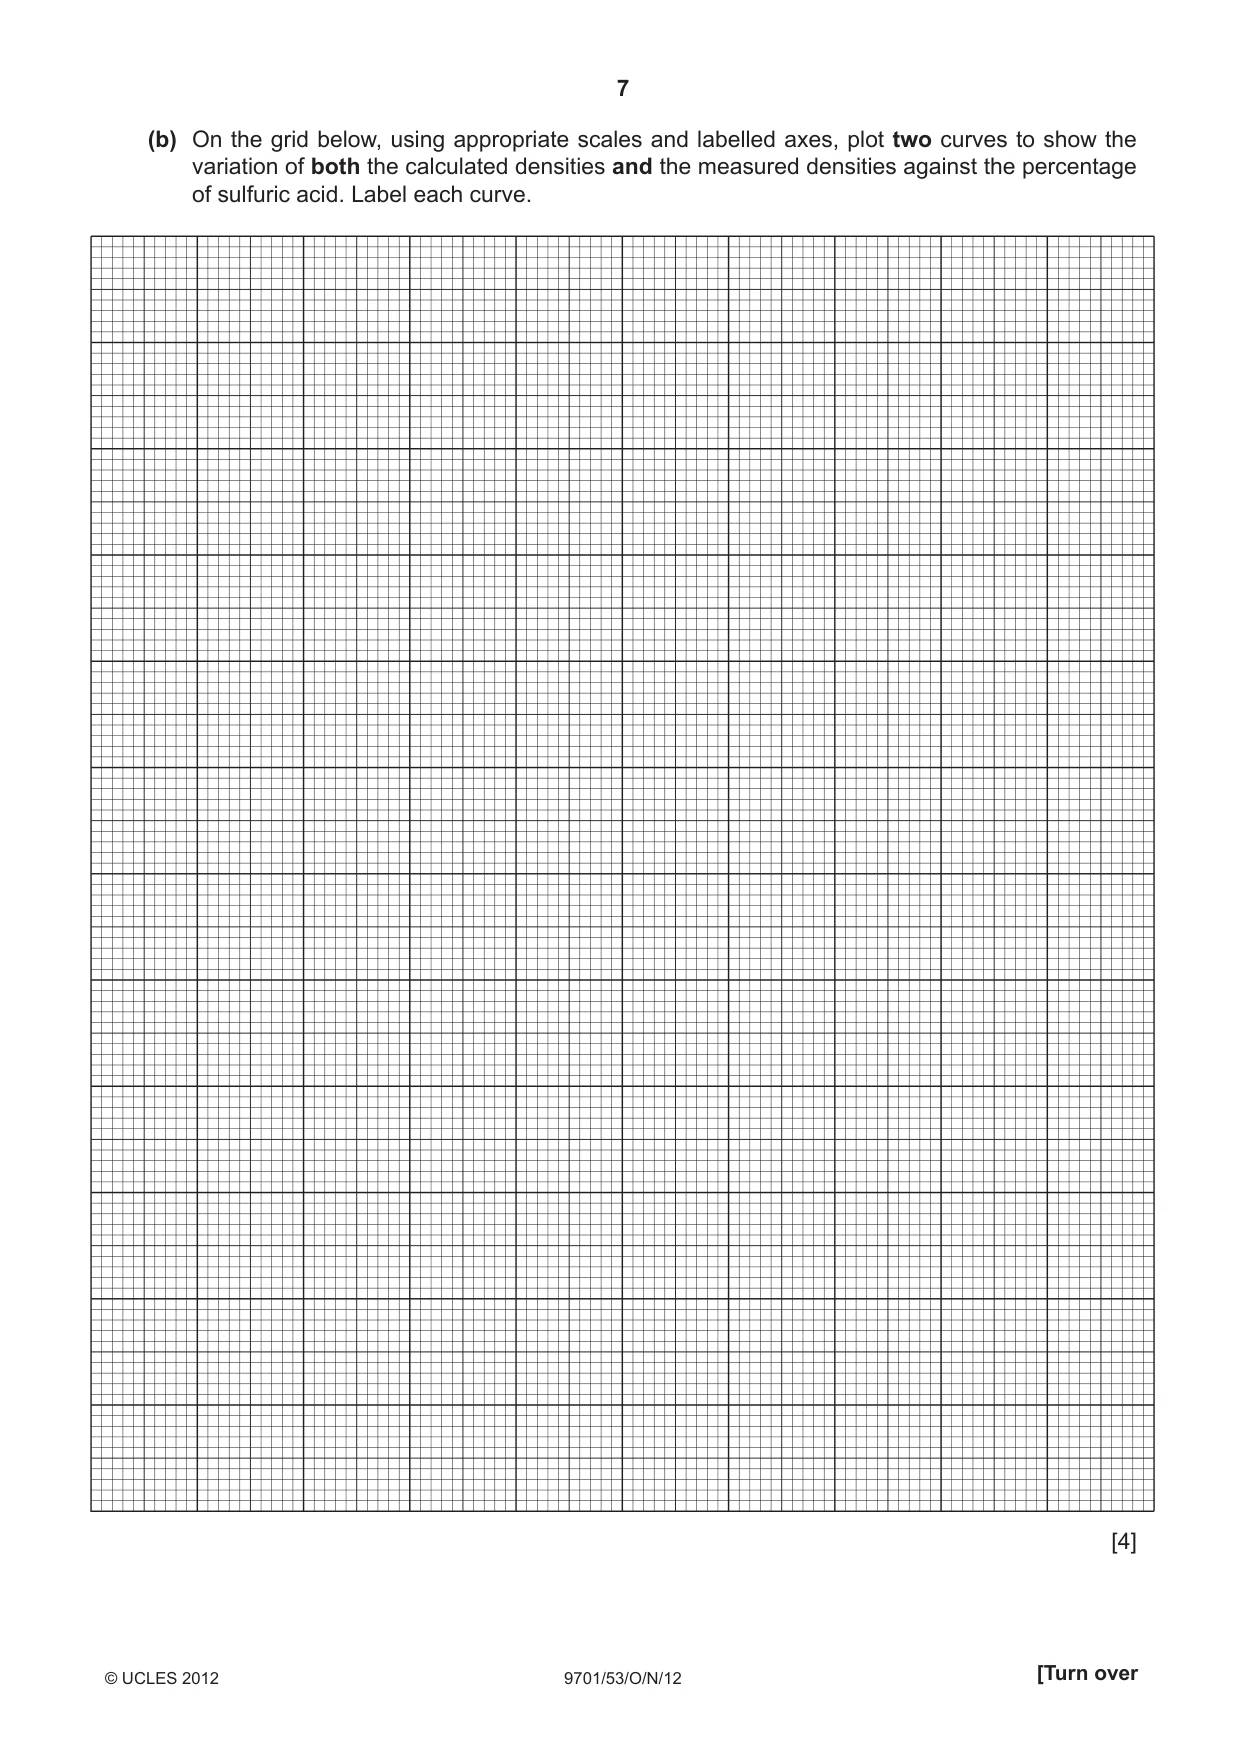
7 9701/53/O/N/12 © UCLES 2012 [Turn over (b) On the grid below, using appropriate scales and labelled axes, plot two curves to show the variation of both the calculated densities and the measured densities against the percentage of sulfuric acid. Label each curve. [4]
Question paper, page 8
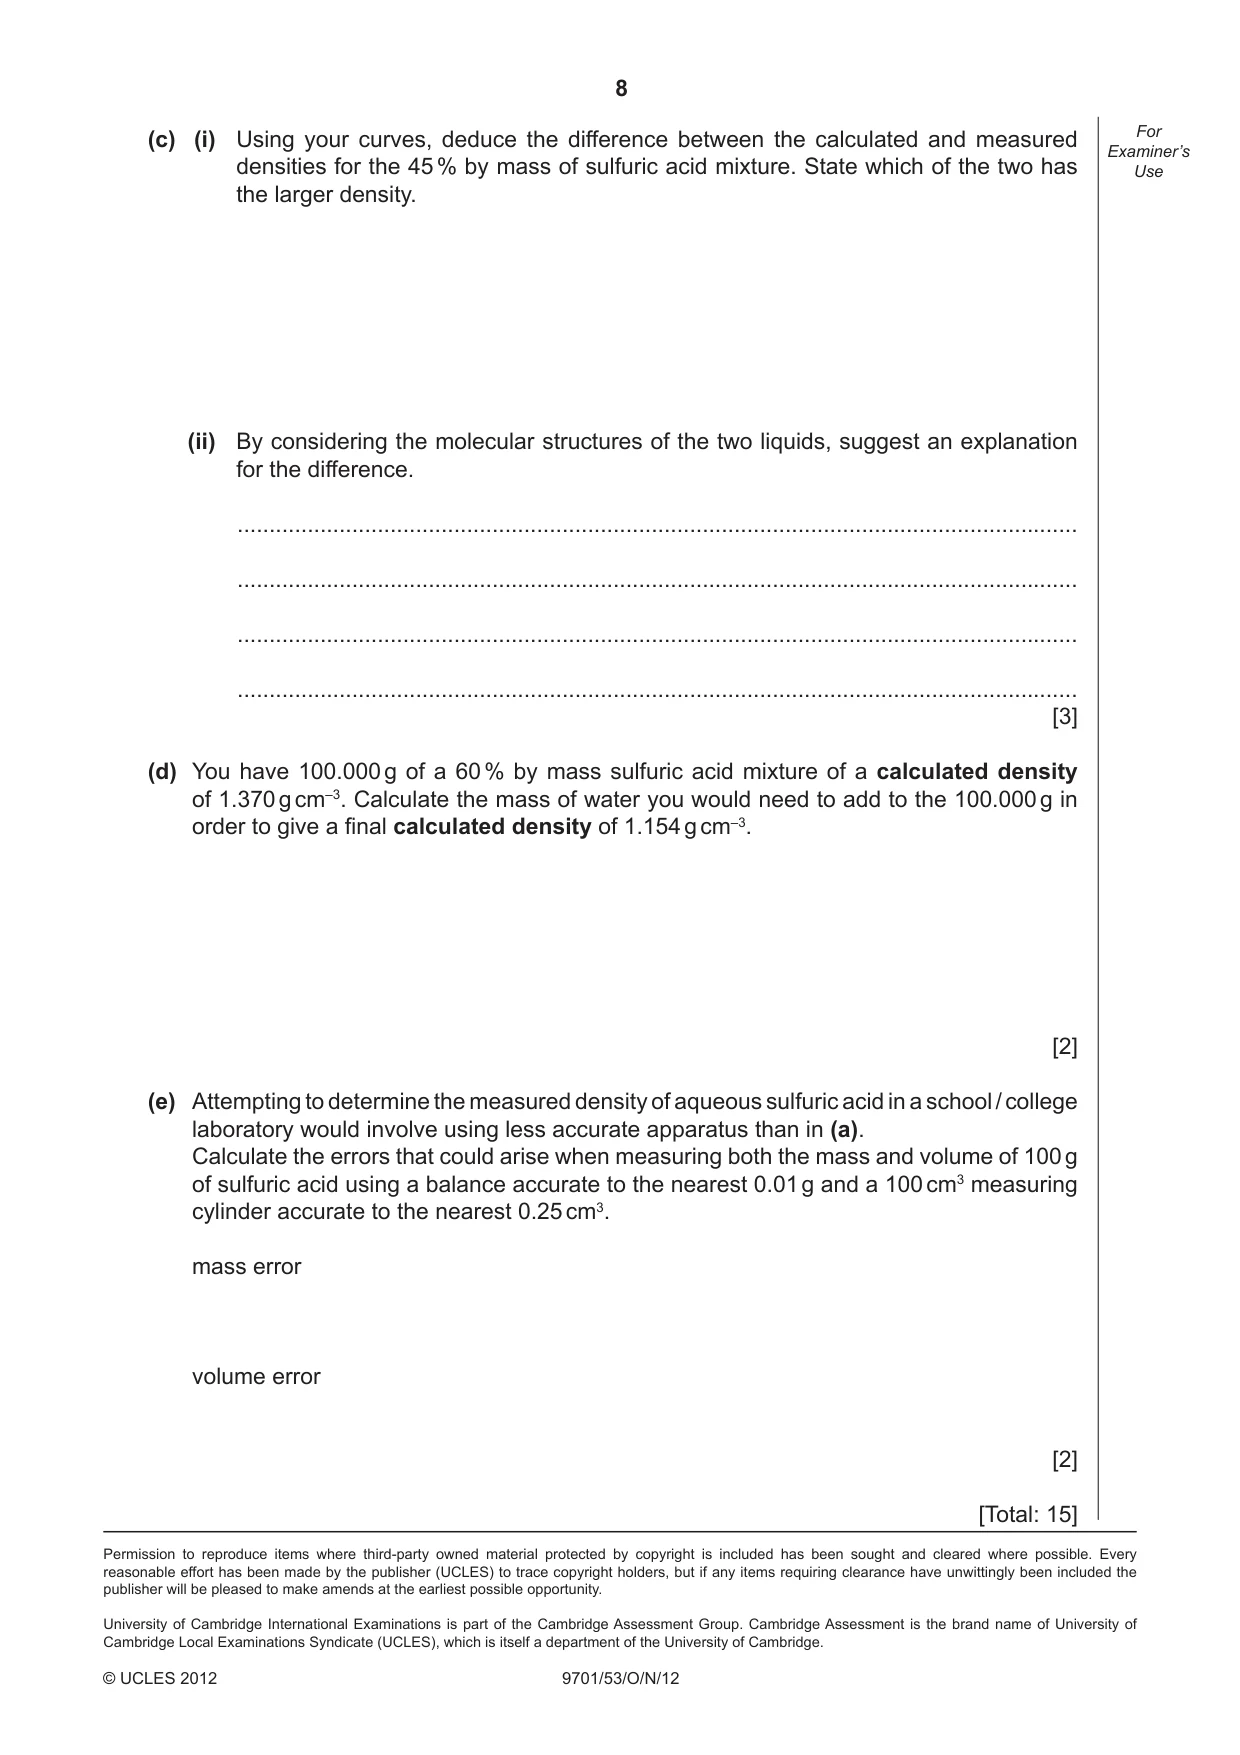
8 Permission to reproduce items where third-party owned material protected by copyright is included has been sought and cleared where possible. Every reasonable effort has been made by the publisher (UCLES) to trace copyright holders, but if any items requiring clearance have unwittingly been included the publisher will be pleased to make amends at the earliest possible opportunity. University of Cambridge International Examinations is part of the Cambridge Assessment Group. Cambridge Assessment is the brand name of University of Cambridge Local Examinations Syndicate (UCLES), which is itself a department of the University of Cambridge. 9701/53/O/N/12 © UCLES 2012 For Examiner’s Use (c) (i) Using your curves, deduce the difference between the calculated and measured densities for the 45 % by mass of sulfuric acid mixture. State which of the two has the larger density. (ii) By considering the molecular structures of the two liquids, suggest an explanation for the difference. … … … … [3] (d) You have 100.000 g of a 60 % by mass sulfuric acid mixture of a calculated density of 1.370 g cm–3. Calculate the mass of water you would need to add to the 100.000 g in order to give a fi nal calculated density of 1.154 g cm–3. [2] (e) Attempting to determine the measured density of aqueous sulfuric acid in a school / college laboratory would involve using less accurate apparatus than in (a). Calculate the errors that could arise when measuring both the mass and volume of 100 g of sulfuric acid using a balance accurate to the nearest 0.01 g and a 100 cm3 measuring cylinder accurate to the nearest 0.25 cm3. mass error volume error [2] [Total: 15]
Mark scheme, page 1
CAMBRIDGE INTERNATIONAL EXAMINATIONS GCE Advanced Level MARK SCHEME for the October/November 2012 series 9701 CHEMISTRY 9701/53 Paper 5 (Planning, Analysis and Evaluation), maximum raw mark 30 This mark scheme is published as an aid to teachers and candidates, to indicate the requirements of the examination. It shows the basis on which Examiners were instructed to award marks. It does not indicate the details of the discussions that took place at an Examiners’ meeting before marking began, which would have considered the acceptability of alternative answers. Mark schemes should be read in conjunction with the question paper and the Principal Examiner Report for Teachers. Cambridge will not enter into discussions about these mark schemes. Cambridge is publishing the mark schemes for the October/November 2012 series for most IGCSE, GCE Advanced Level and Advanced Subsidiary Level components and some Ordinary Level components.
Mark scheme, page 2
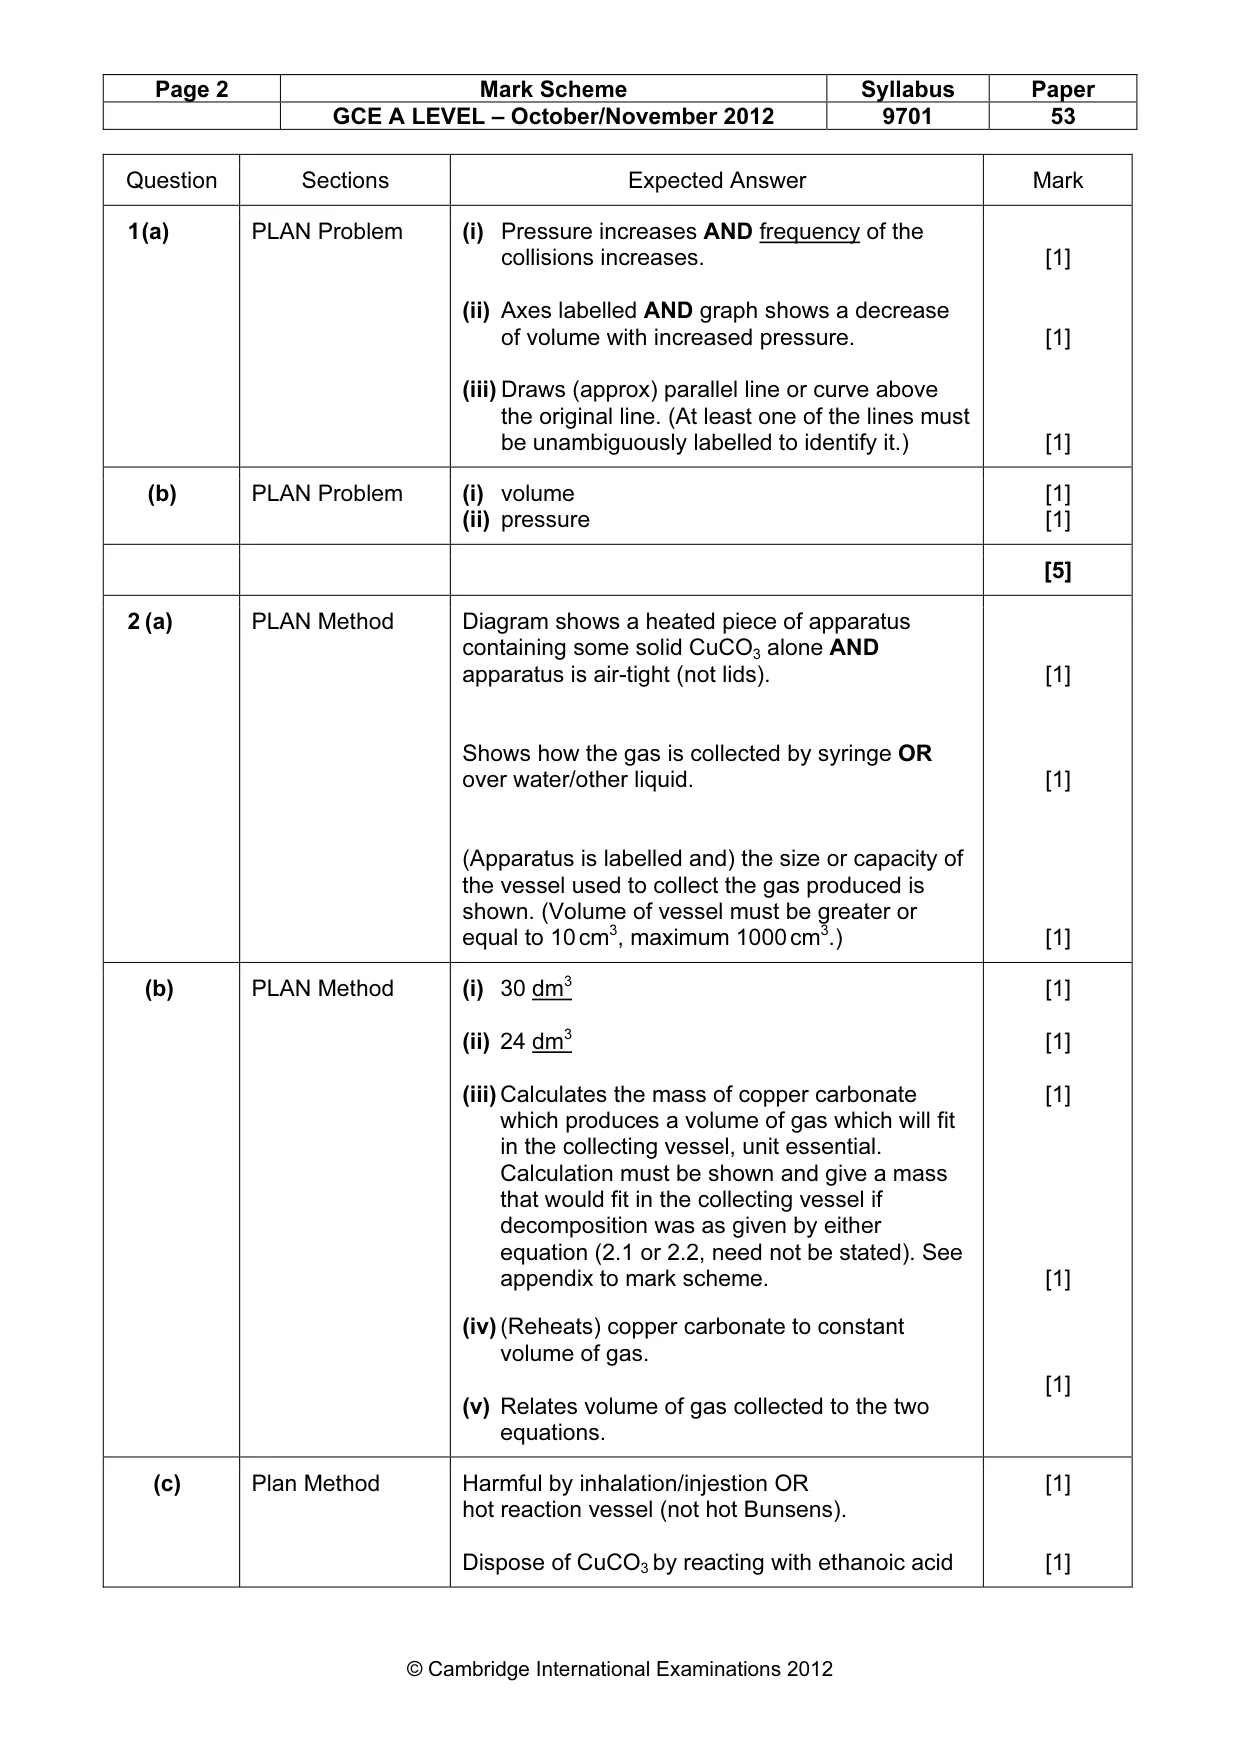
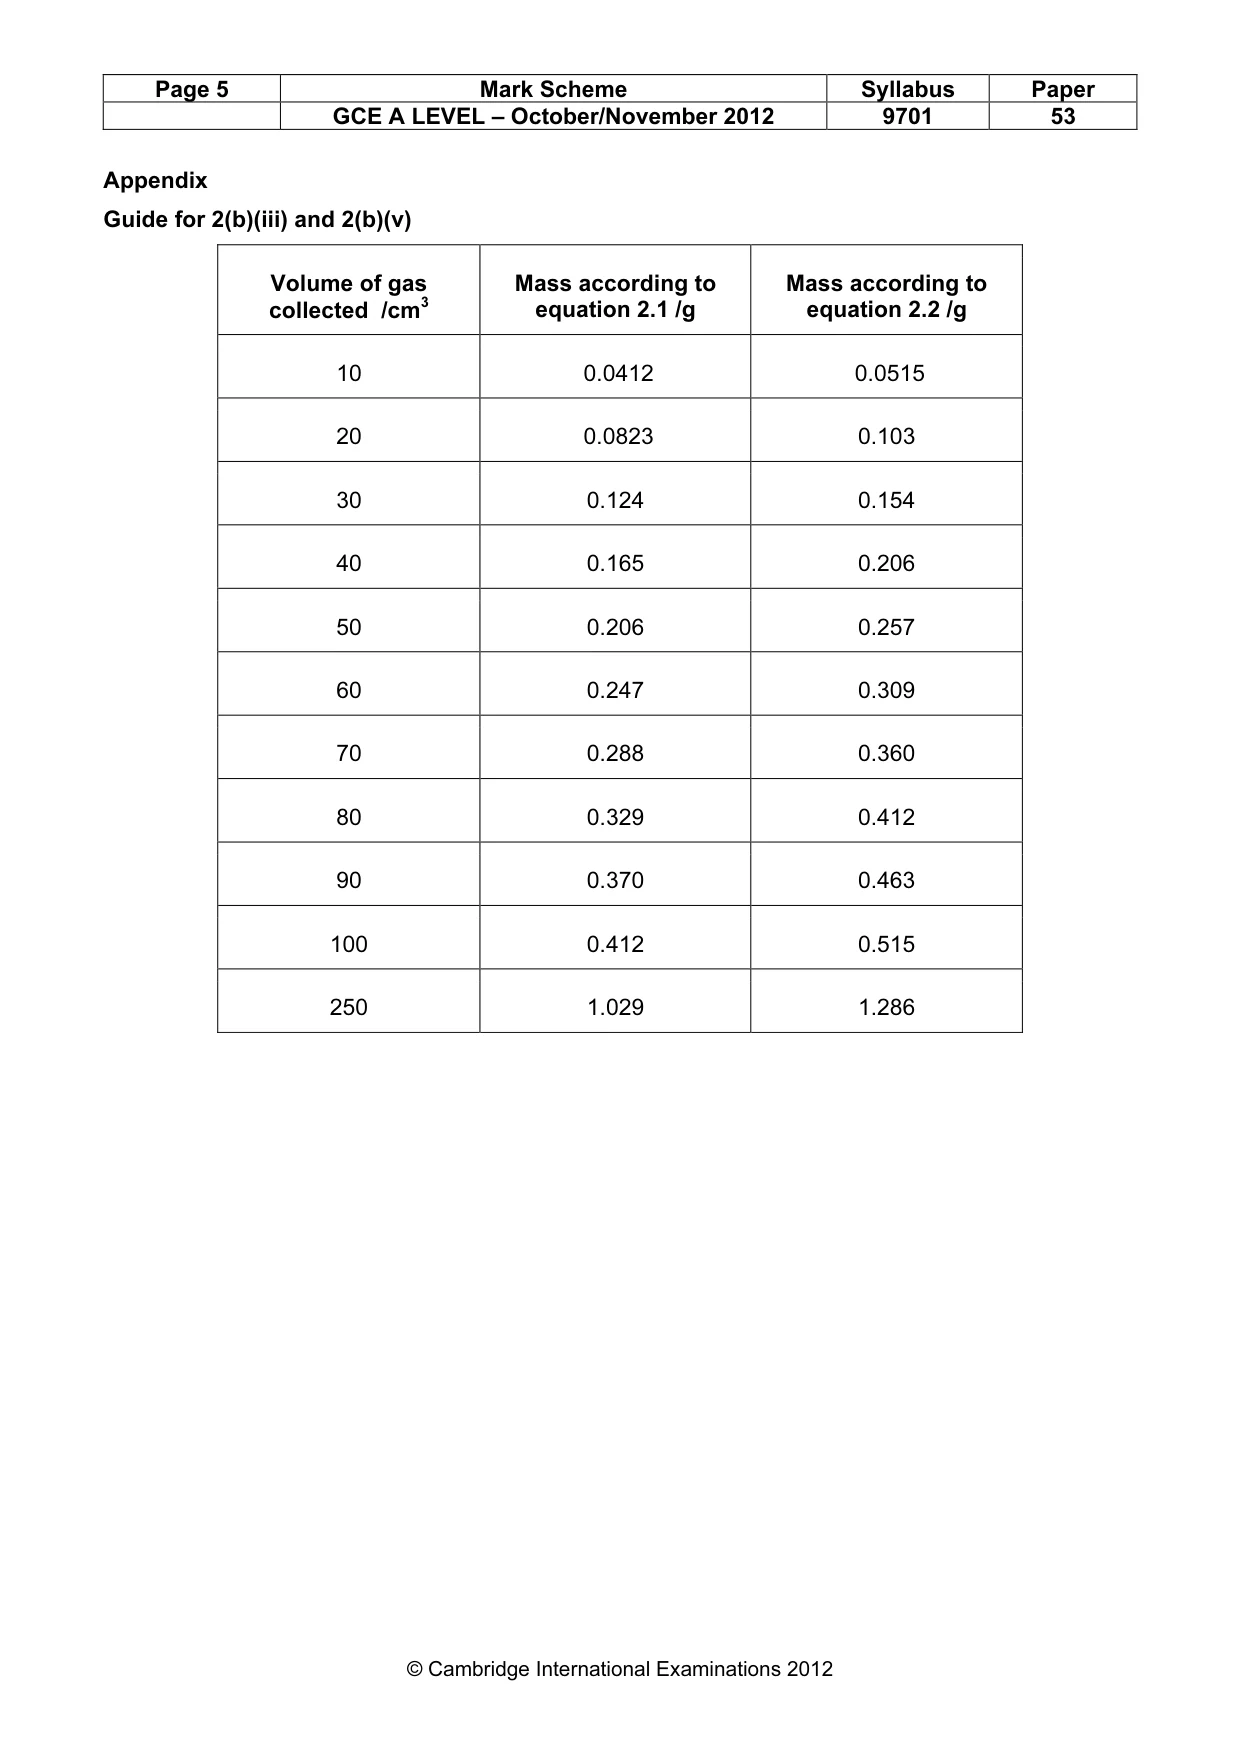
Page 2 Mark Scheme Syllabus Paper GCE A LEVEL – October/November 2012 9701 53 © Cambridge International Examinations 2012 Question Sections Expected Answer Mark 1 (a) PLAN Problem (i) Pressure increases AND frequency of the collisions increases. (ii) Axes labelled AND graph shows a decrease of volume with increased pressure. (iii) Draws (approx) parallel line or curve above the original line. (At least one of the lines must be unambiguously labelled to identify it.) [1] [1] [1] (b) PLAN Problem (i) volume (ii) pressure [1] [1] [5] 2 (a) PLAN Method Diagram shows a heated piece of apparatus containing some solid CuCO3 alone AND apparatus is air-tight (not lids). Shows how the gas is collected by syringe OR over water/other liquid. (Apparatus is labelled and) the size or capacity of the vessel used to collect the gas produced is shown. (Volume of vessel must be greater or equal to 10 cm3, maximum 1000 cm3.) [1] [1] [1] (b) PLAN Method (i) 30 dm3 (ii) 24 dm3 (iii) Calculates the mass of copper carbonate which produces a volume of gas which will fit in the collecting vessel, unit essential. Calculation must be shown and give a mass that would fit in the collecting vessel if decomposition was as given by either equation (2.1 or 2.2, need not be stated). See appendix to mark scheme. (iv) (Reheats) copper carbonate to constant volume of gas. (v) Relates volume of gas collected to the two equations. [1] [1] [1] [1] [1] (c) Plan Method Harmful by inhalation/injestion OR hot reaction vessel (not hot Bunsens). Dispose of CuCO3 by reacting with ethanoic acid [1] [1]
Mark scheme, page 3
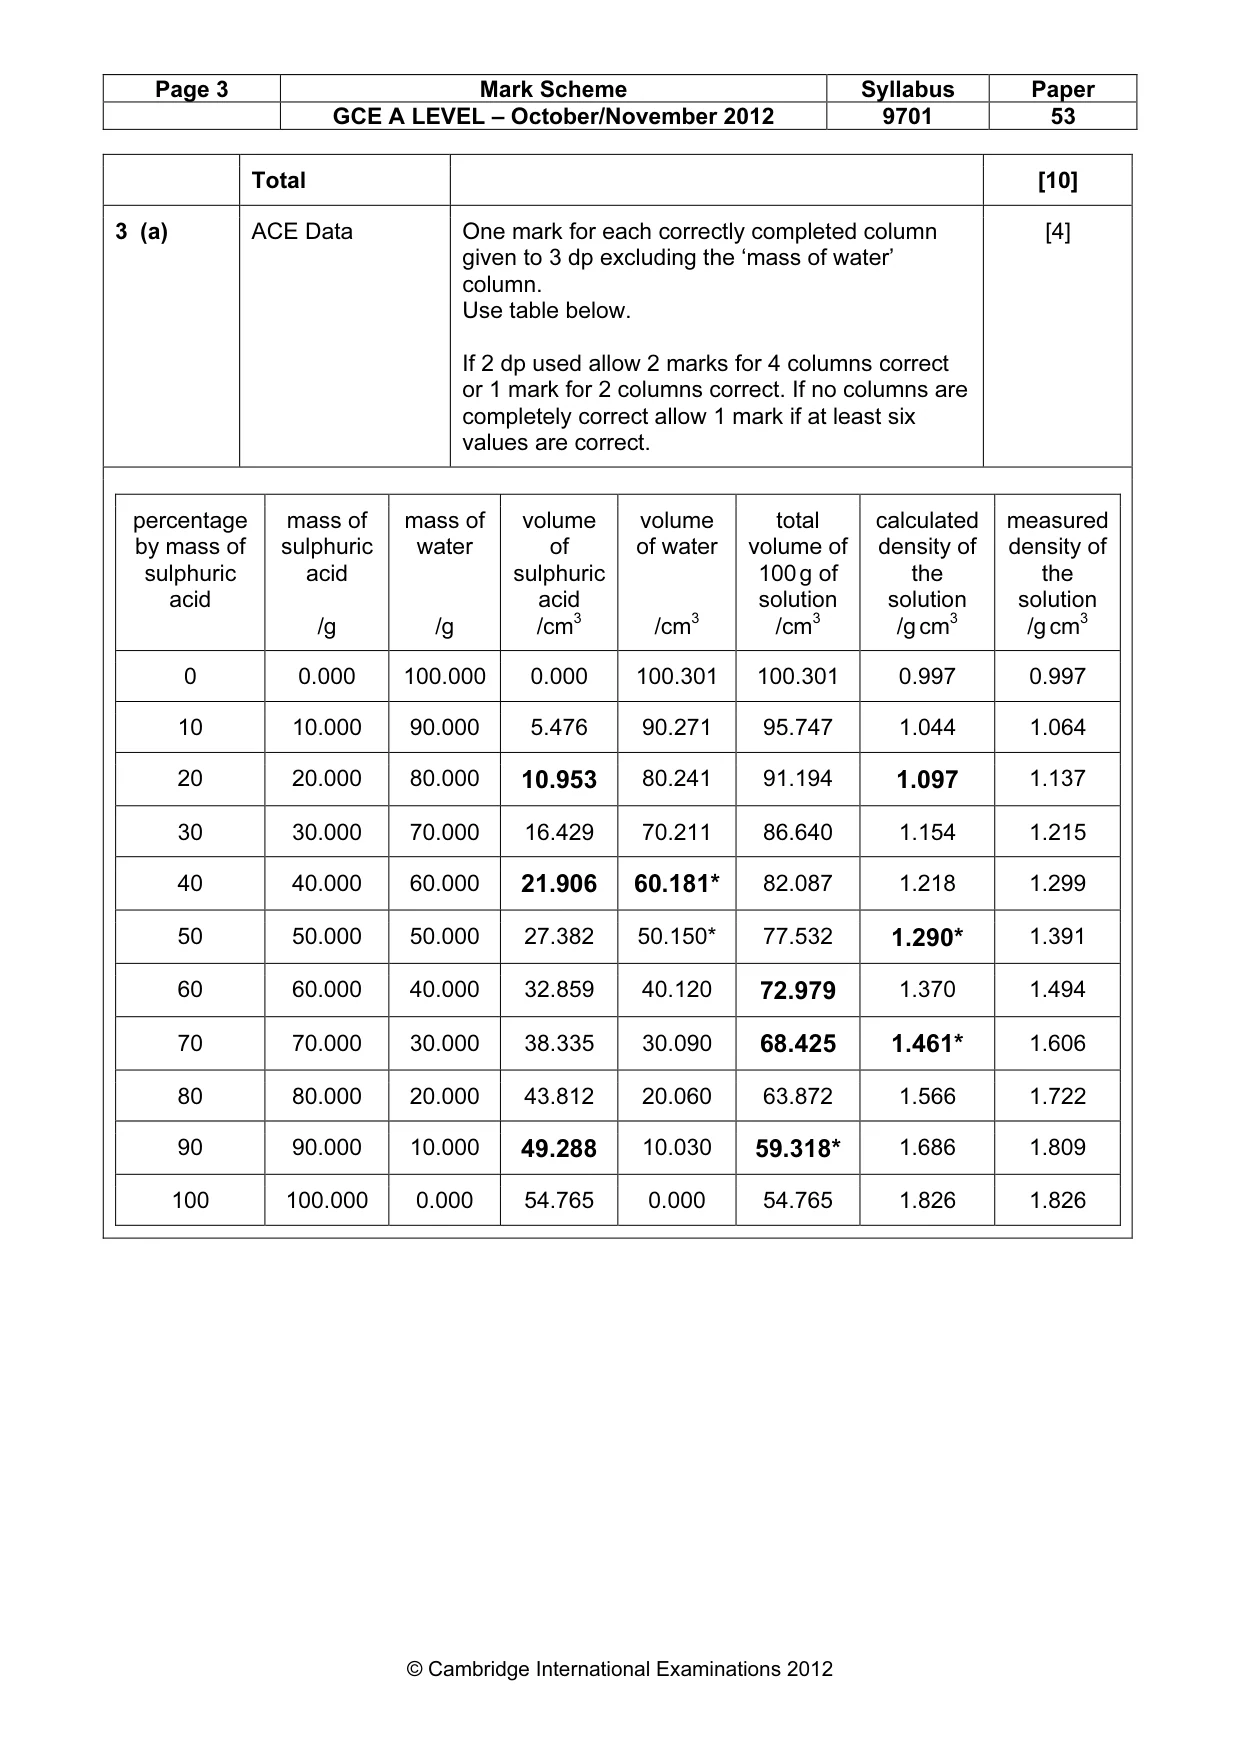
Page 3 Mark Scheme Syllabus Paper GCE A LEVEL – October/November 2012 9701 53 © Cambridge International Examinations 2012 Total [10] 3 (a) ACE Data One mark for each correctly completed column given to 3 dp excluding the ‘mass of water’ column. Use table below. If 2 dp used allow 2 marks for 4 columns correct or 1 mark for 2 columns correct. If no columns are completely correct allow 1 mark if at least six values are correct. [4] percentage by mass of sulphuric acid mass of sulphuric acid /g mass of water /g volume of sulphuric acid /cm3 volume of water /cm3 total volume of 100 g of solution /cm3 calculated density of the solution /g cm3 measured density of the solution /g cm3 0 0.000 100.000 0.000 100.301 100.301 0.997 0.997 10 10.000 90.000 5.476 90.271 95.747 1.044 1.064 20 20.000 80.000 10.953 80.241 91.194 1.097 1.137 30 30.000 70.000 16.429 70.211 86.640 1.154 1.215 40 40.000 60.000 21.906 60.181* 82.087 1.218 1.299 50 50.000 50.000 27.382 50.150* 77.532 1.290* 1.391 60 60.000 40.000 32.859 40.120 72.979 1.370 1.494 70 70.000 30.000 38.335 30.090 68.425 1.461* 1.606 80 80.000 20.000 43.812 20.060 63.872 1.566 1.722 90 90.000 10.000 49.288 10.030 59.318* 1.686 1.809 100 100.000 0.000 54.765 0.000 54.765 1.826 1.826
Mark scheme, page 4
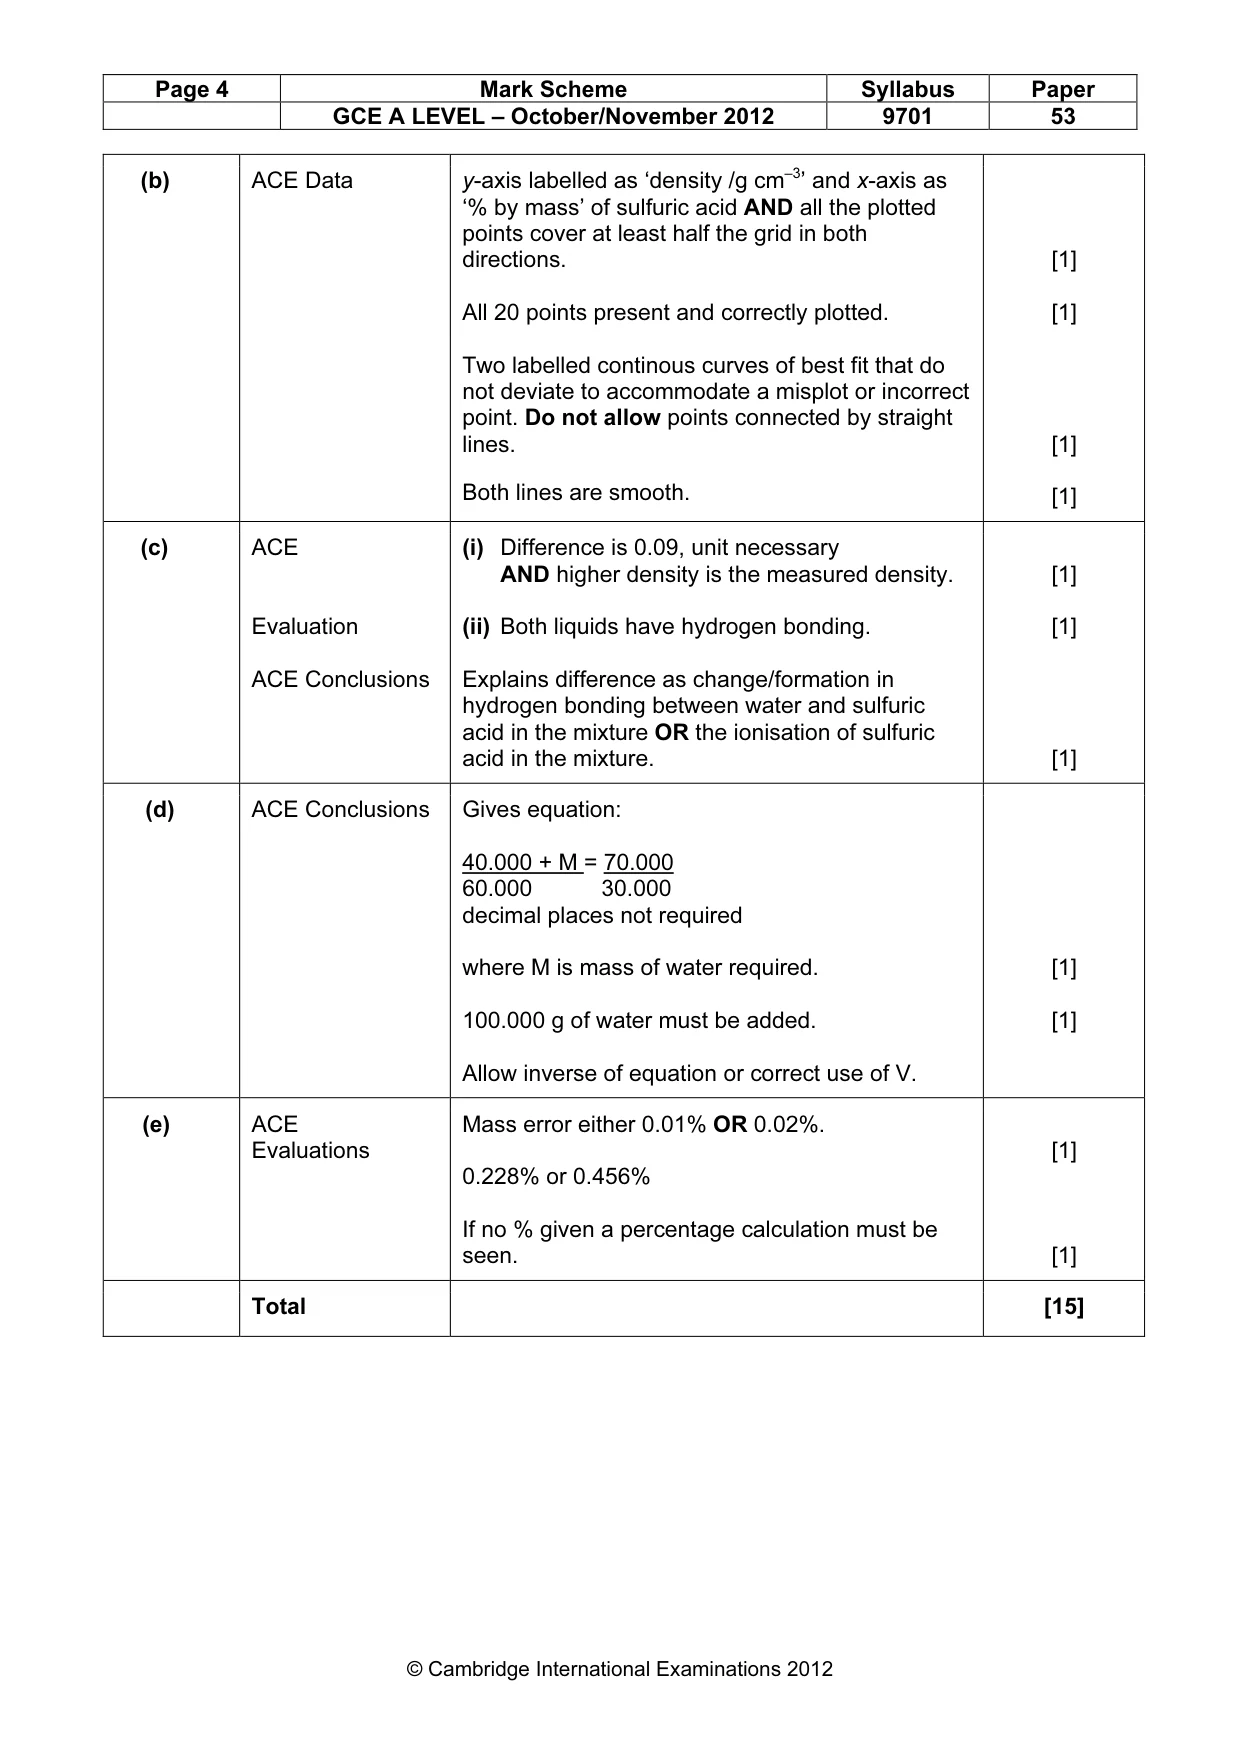
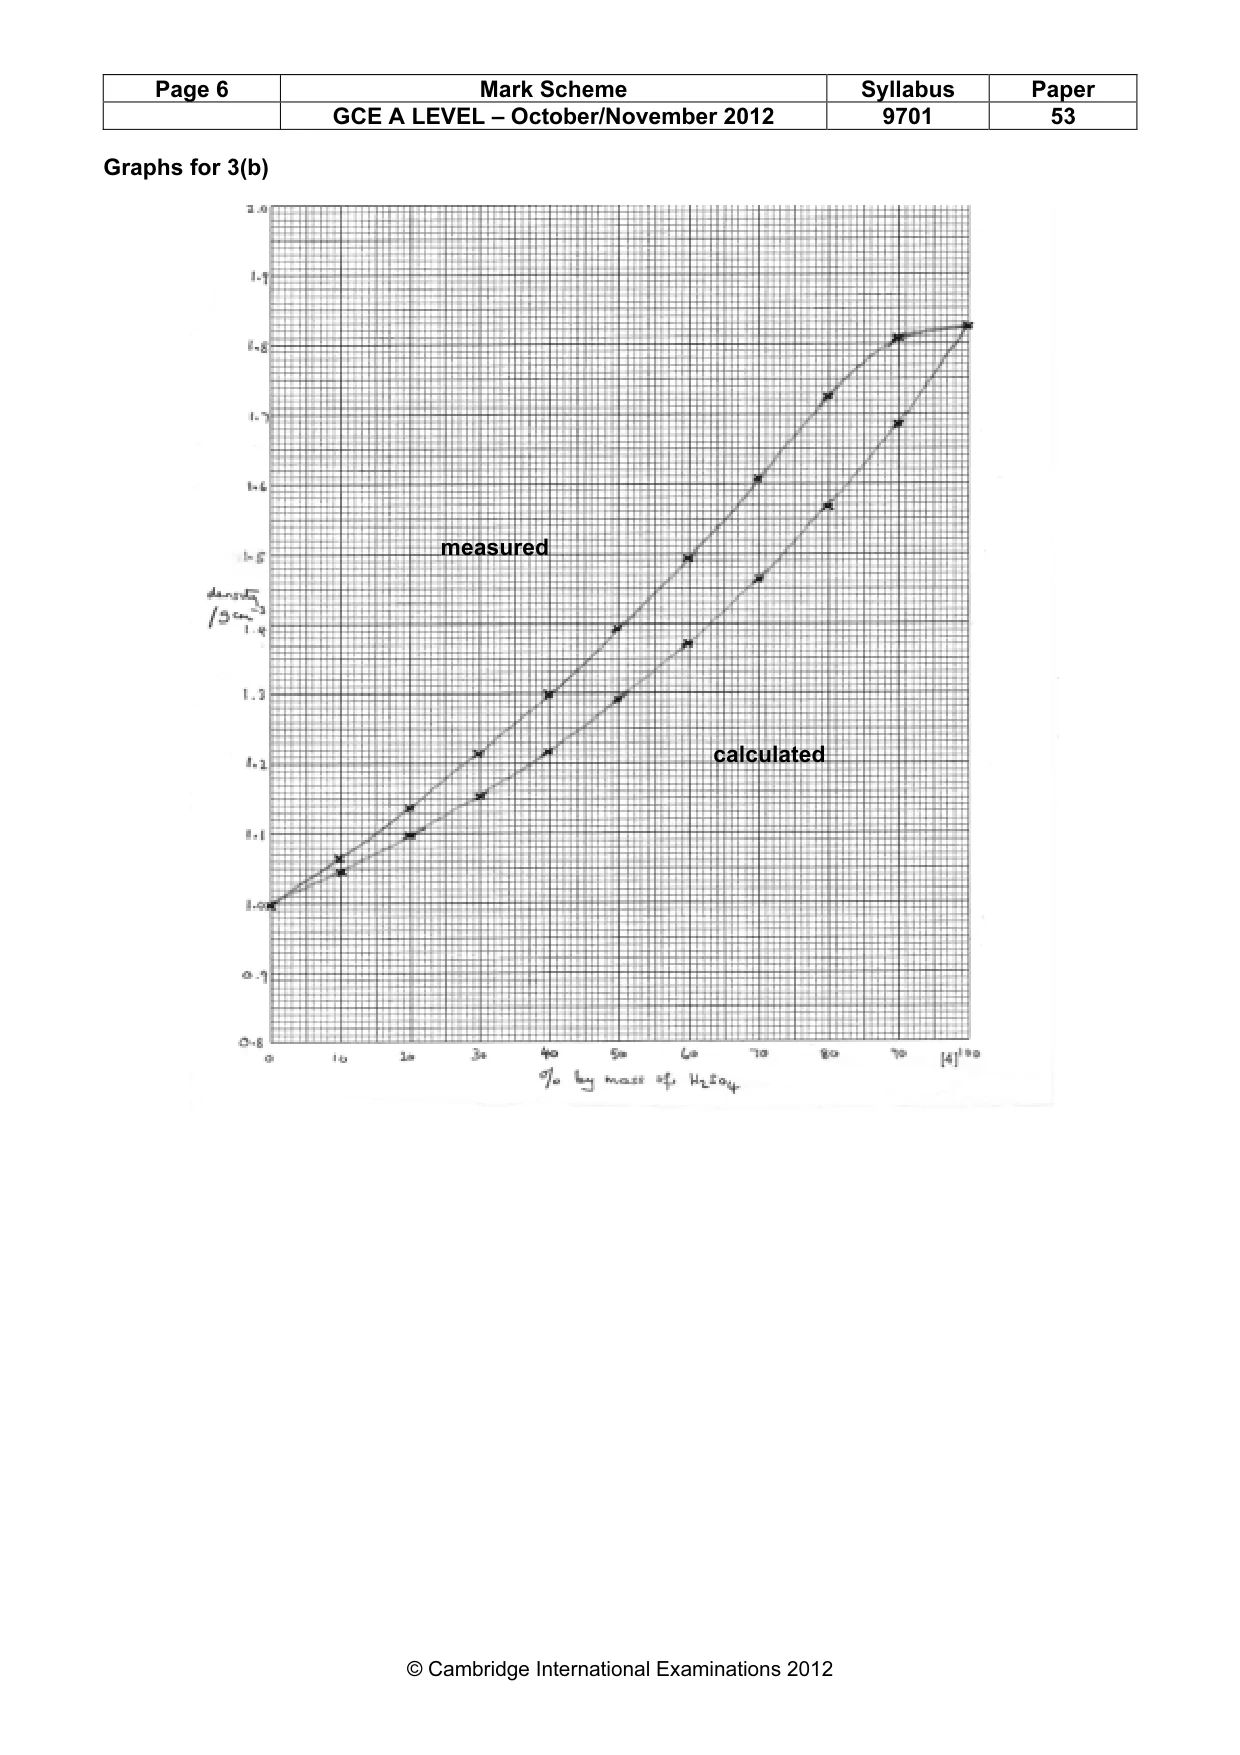
Page 4 Mark Scheme Syllabus Paper GCE A LEVEL – October/November 2012 9701 53 © Cambridge International Examinations 2012 (b) ACE Data y-axis labelled as ‘density /g cm–3’ and x-axis as ‘% by mass’ of sulfuric acid AND all the plotted points cover at least half the grid in both directions. All 20 points present and correctly plotted. Two labelled continous curves of best fit that do not deviate to accommodate a misplot or incorrect point. Do not allow points connected by straight lines. Both lines are smooth. [1] [1] [1] [1] (c) ACE Evaluation ACE Conclusions (i) Difference is 0.09, unit necessary AND higher density is the measured density. (ii) Both liquids have hydrogen bonding. Explains difference as change/formation in hydrogen bonding between water and sulfuric acid in the mixture OR the ionisation of sulfuric acid in the mixture. [1] [1] [1] (d) ACE Conclusions Gives equation: 40.000 + M = 70.000 60.000 30.000 decimal places not required where M is mass of water required. 100.000 g of water must be added. Allow inverse of equation or correct use of V. [1] [1] (e) ACE Evaluations Mass error either 0.01% OR 0.02%. 0.228% or 0.456% If no % given a percentage calculation must be seen. [1] [1] Total [15]
Mark scheme, page 5
Page 5 Mark Scheme Syllabus Paper GCE A LEVEL – October/November 2012 9701 53 © Cambridge International Examinations 2012 Appendix Guide for 2(b)(iii) and 2(b)(v) Volume of gas collected /cm3 Mass according to equation 2.1 /g Mass according to equation 2.2 /g 10 0.0412 0.0515 20 0.0823 0.103 30 0.124 0.154 40 0.165 0.206 50 0.206 0.257 60 0.247 0.309 70 0.288 0.360 80 0.329 0.412 90 0.370 0.463 100 0.412 0.515 250 1.029 1.286
Mark scheme, page 6
Page 6 Mark Scheme Syllabus Paper GCE A LEVEL – October/November 2012 9701 53 © Cambridge International Examinations 2012 Graphs for 3(b) measured calculated calculated measured
What you needed in this session
Cambridge’s own grade thresholds for 2012 Oct/Nov, Paper 5 · Variant 3. A higher threshold means an easier paper — the bar moves with how the cohort did.