Cambridge A Level Chemistry 9701 — 2012 Oct/Nov Paper 5 · Variant 1
9701/51/O/N/12 · 30 marks · ≈34 min
The question paper and its mark scheme, free to read here and free to download. This is Cambridge’s own paper, exactly as it was sat.
Question paper8 pages
Mark scheme4 pages
Answers below. Sit the paper first if you are practising.
Paper as text
Question paper, page 1
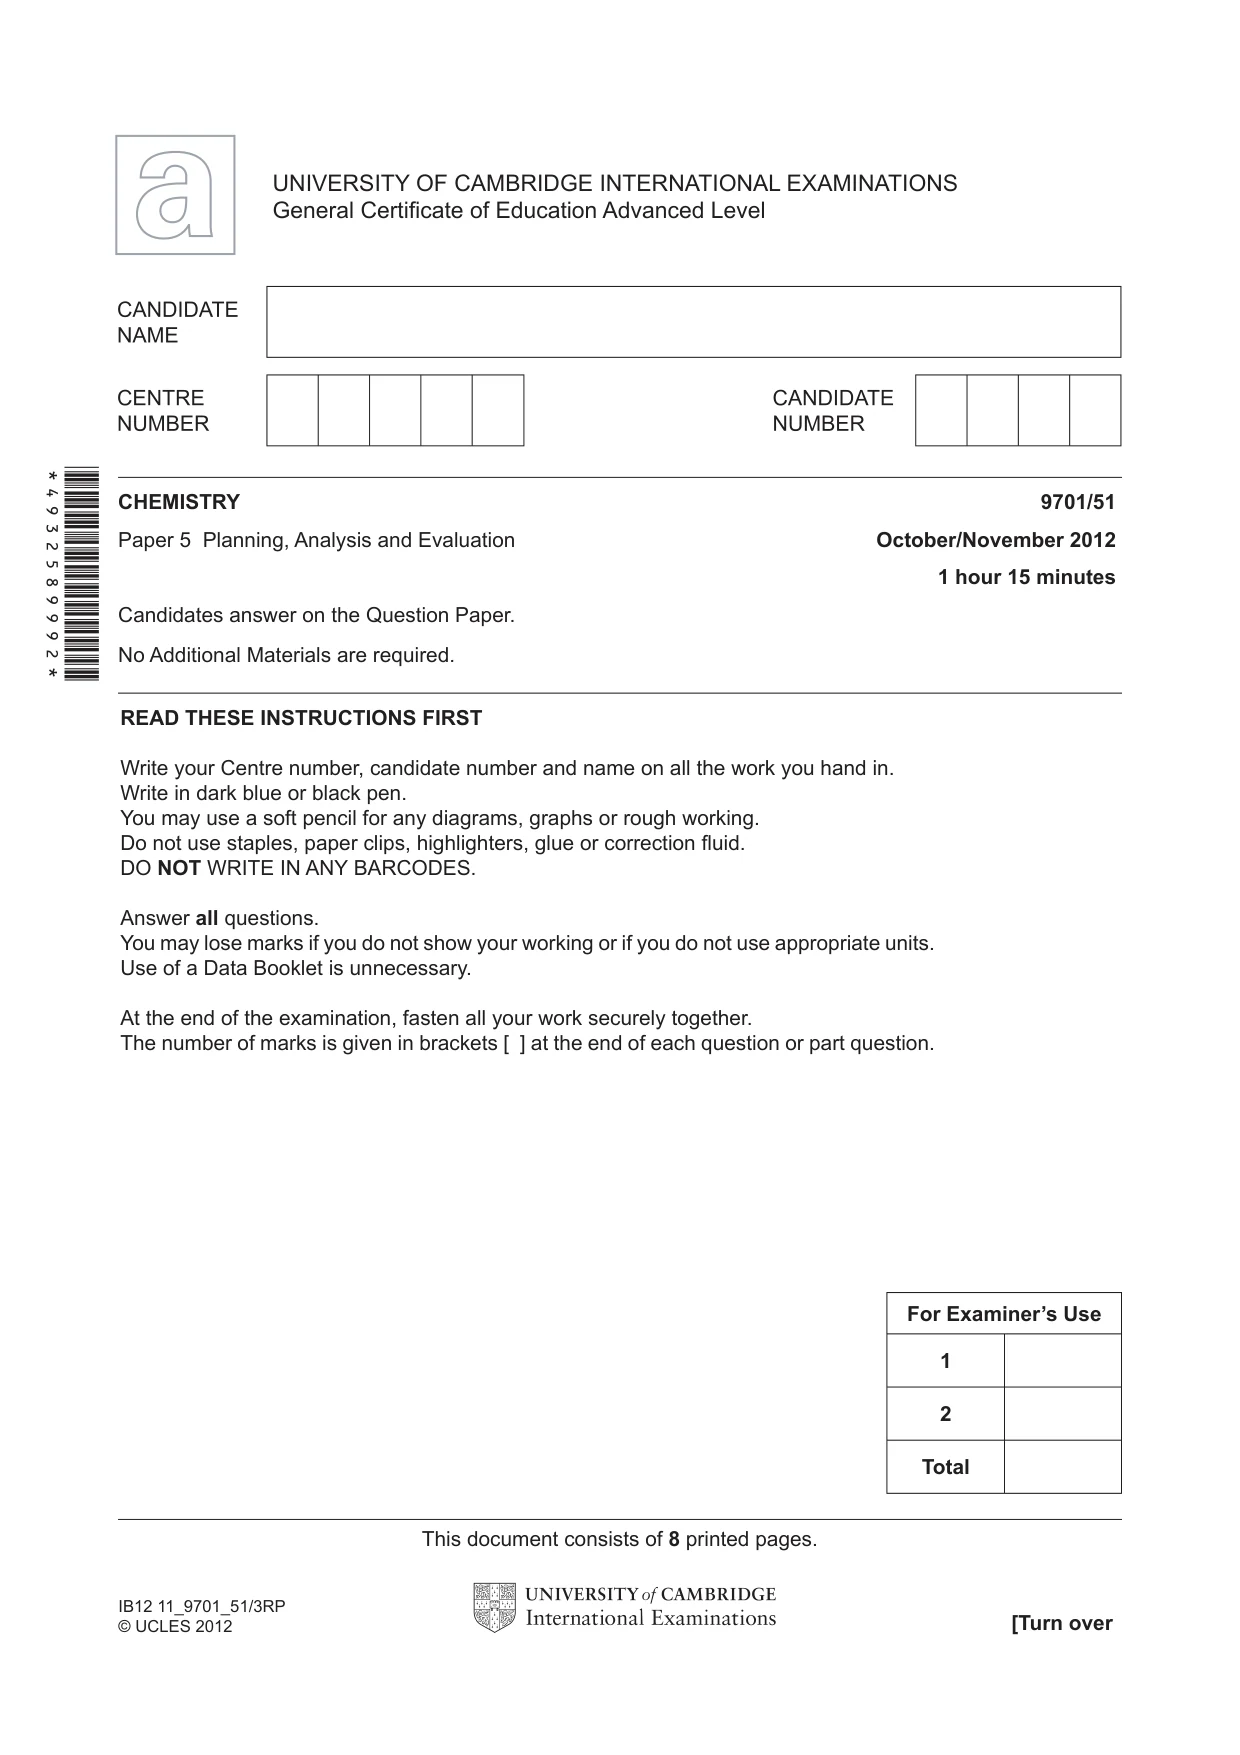
READ THESE INSTRUCTIONS FIRST Write your Centre number, candidate number and name on all the work you hand in. Write in dark blue or black pen. You may use a soft pencil for any diagrams, graphs or rough working. Do not use staples, paper clips, highlighters, glue or correction fl uid. DO NOT WRITE IN ANY BARCODES. Answer all questions. You may lose marks if you do not show your working or if you do not use appropriate units. Use of a Data Booklet is unnecessary. At the end of the examination, fasten all your work securely together. The number of marks is given in brackets [ ] at the end of each question or part question. CHEMISTRY 9701/51 Paper 5 Planning, Analysis and Evaluation October/November 2012 1 hour 15 minutes Candidates answer on the Question Paper. No Additional Materials are required. UNIVERSITY OF CAMBRIDGE INTERNATIONAL EXAMINATIONS General Certifi cate of Education Advanced Level This document consists of 8 printed pages. [Turn over IB12 11_9701_51/3RP © UCLES 2012 *4932589992* For Examiner’s Use 1 2 Total
Question paper, page 2
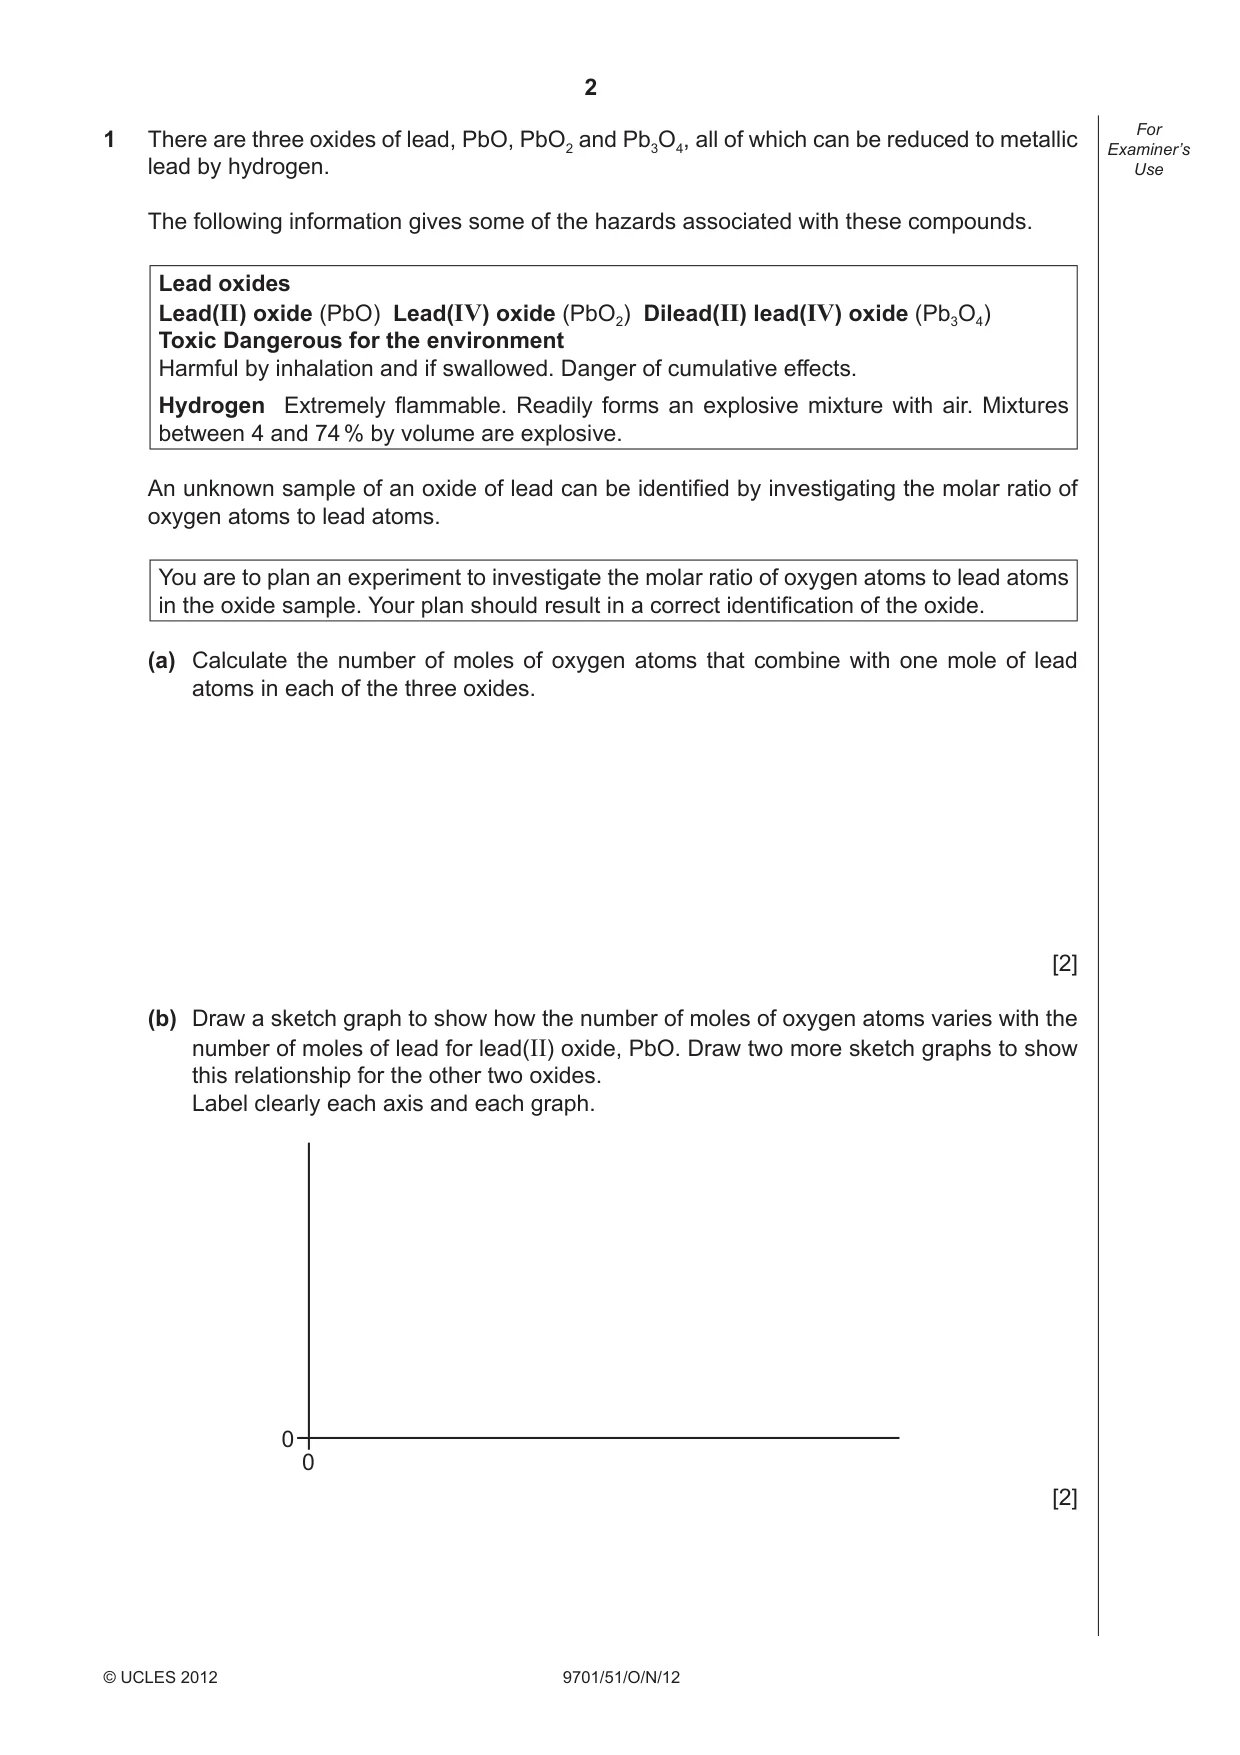
2 9701/51/O/N/12 © UCLES 2012 For Examiner’s Use 1 There are three oxides of lead, PbO, PbO2 and Pb3O4, all of which can be reduced to metallic lead by hydrogen. The following information gives some of the hazards associated with these compounds. Lead oxides Lead(II) oxide (PbO) Lead(IV) oxide (PbO2) Dilead(II) lead(IV) oxide (Pb3O4) Toxic Dangerous for the environment Harmful by inhalation and if swallowed. Danger of cumulative effects. Hydrogen Extremely fl ammable. Readily forms an explosive mixture with air. Mixtures between 4 and 74 % by volume are explosive. An unknown sample of an oxide of lead can be identifi ed by investigating the molar ratio of oxygen atoms to lead atoms. You are to plan an experiment to investigate the molar ratio of oxygen atoms to lead atoms in the oxide sample. Your plan should result in a correct identifi cation of the oxide. (a) Calculate the number of moles of oxygen atoms that combine with one mole of lead atoms in each of the three oxides. [2] (b) Draw a sketch graph to show how the number of moles of oxygen atoms varies with the number of moles of lead for lead(II) oxide, PbO. Draw two more sketch graphs to show this relationship for the other two oxides. Label clearly each axis and each graph. 0 0 [2]
Question paper, page 3
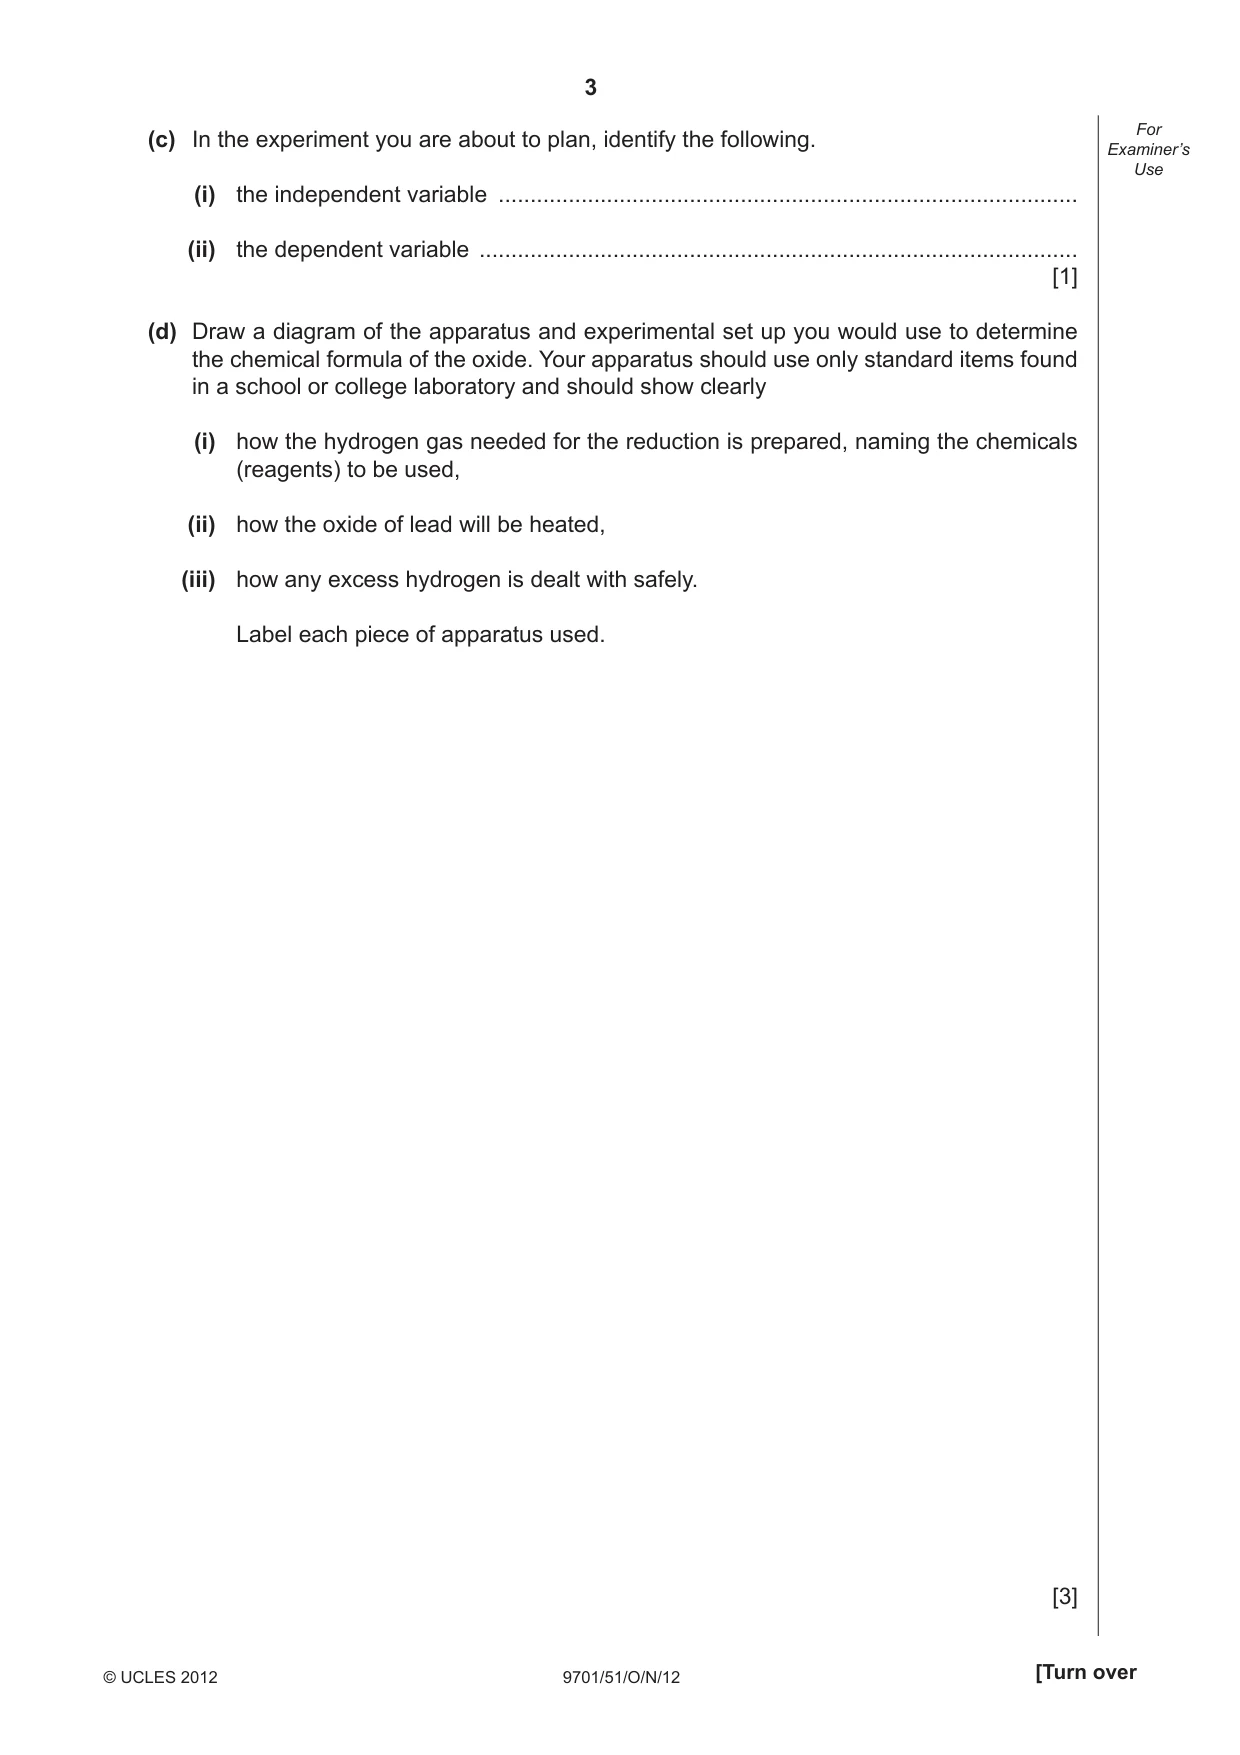
3 9701/51/O/N/12 © UCLES 2012 [Turn over For Examiner’s Use (c) In the experiment you are about to plan, identify the following. (i) the independent variable … (ii) the dependent variable … [1] (d) Draw a diagram of the apparatus and experimental set up you would use to determine the chemical formula of the oxide. Your apparatus should use only standard items found in a school or college laboratory and should show clearly (i) how the hydrogen gas needed for the reduction is prepared, naming the chemicals (reagents) to be used, (ii) how the oxide of lead will be heated, (iii) how any excess hydrogen is dealt with safely. Label each piece of apparatus used. [3]
Question paper, page 4
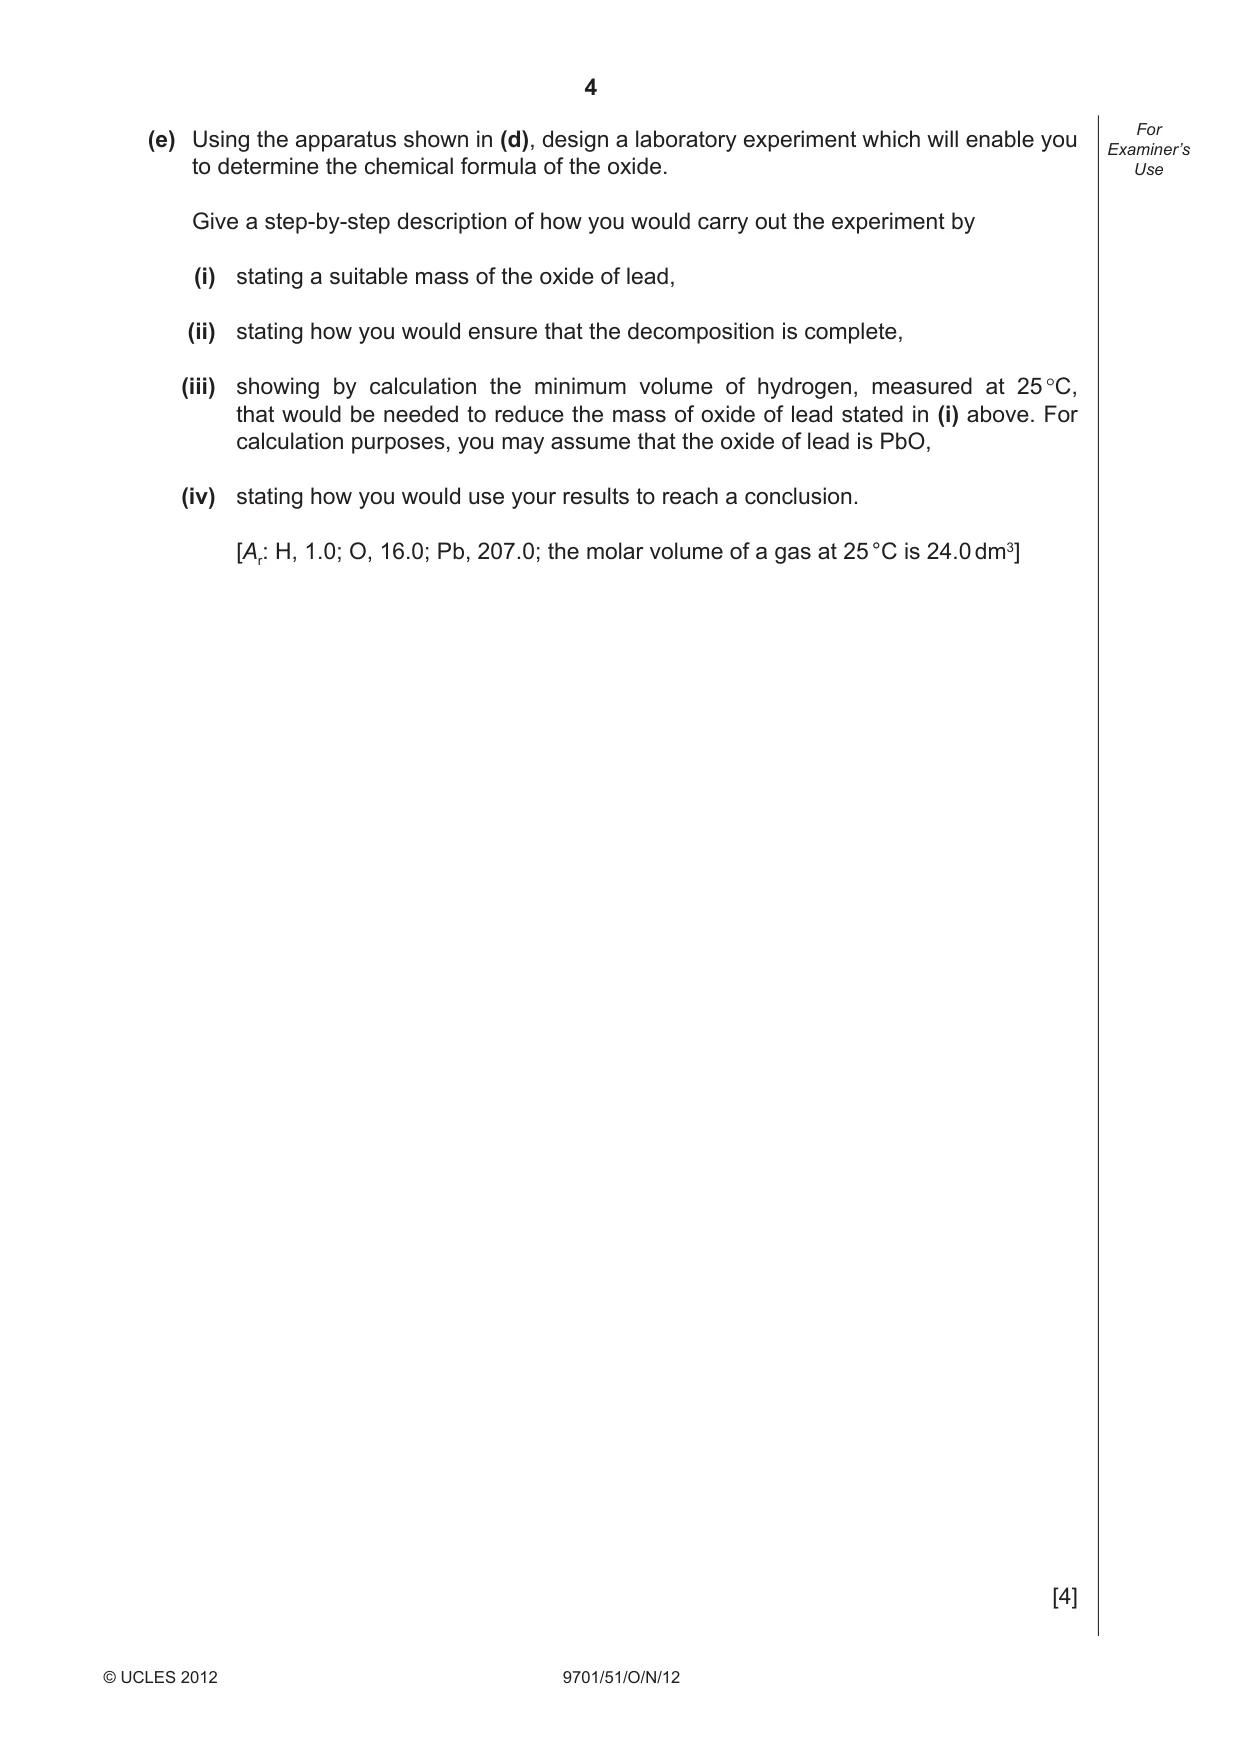
4 9701/51/O/N/12 © UCLES 2012 For Examiner’s Use (e) Using the apparatus shown in (d), design a laboratory experiment which will enable you to determine the chemical formula of the oxide. Give a step-by-step description of how you would carry out the experiment by (i) stating a suitable mass of the oxide of lead, (ii) stating how you would ensure that the decomposition is complete, (iii) showing by calculation the minimum volume of hydrogen, measured at 25 °C, that would be needed to reduce the mass of oxide of lead stated in (i) above. For calculation purposes, you may assume that the oxide of lead is PbO, (iv) stating how you would use your results to reach a conclusion. [Ar: H, 1.0; O, 16.0; Pb, 207.0; the molar volume of a gas at 25 °C is 24.0 dm3] [4]
Question paper, page 5
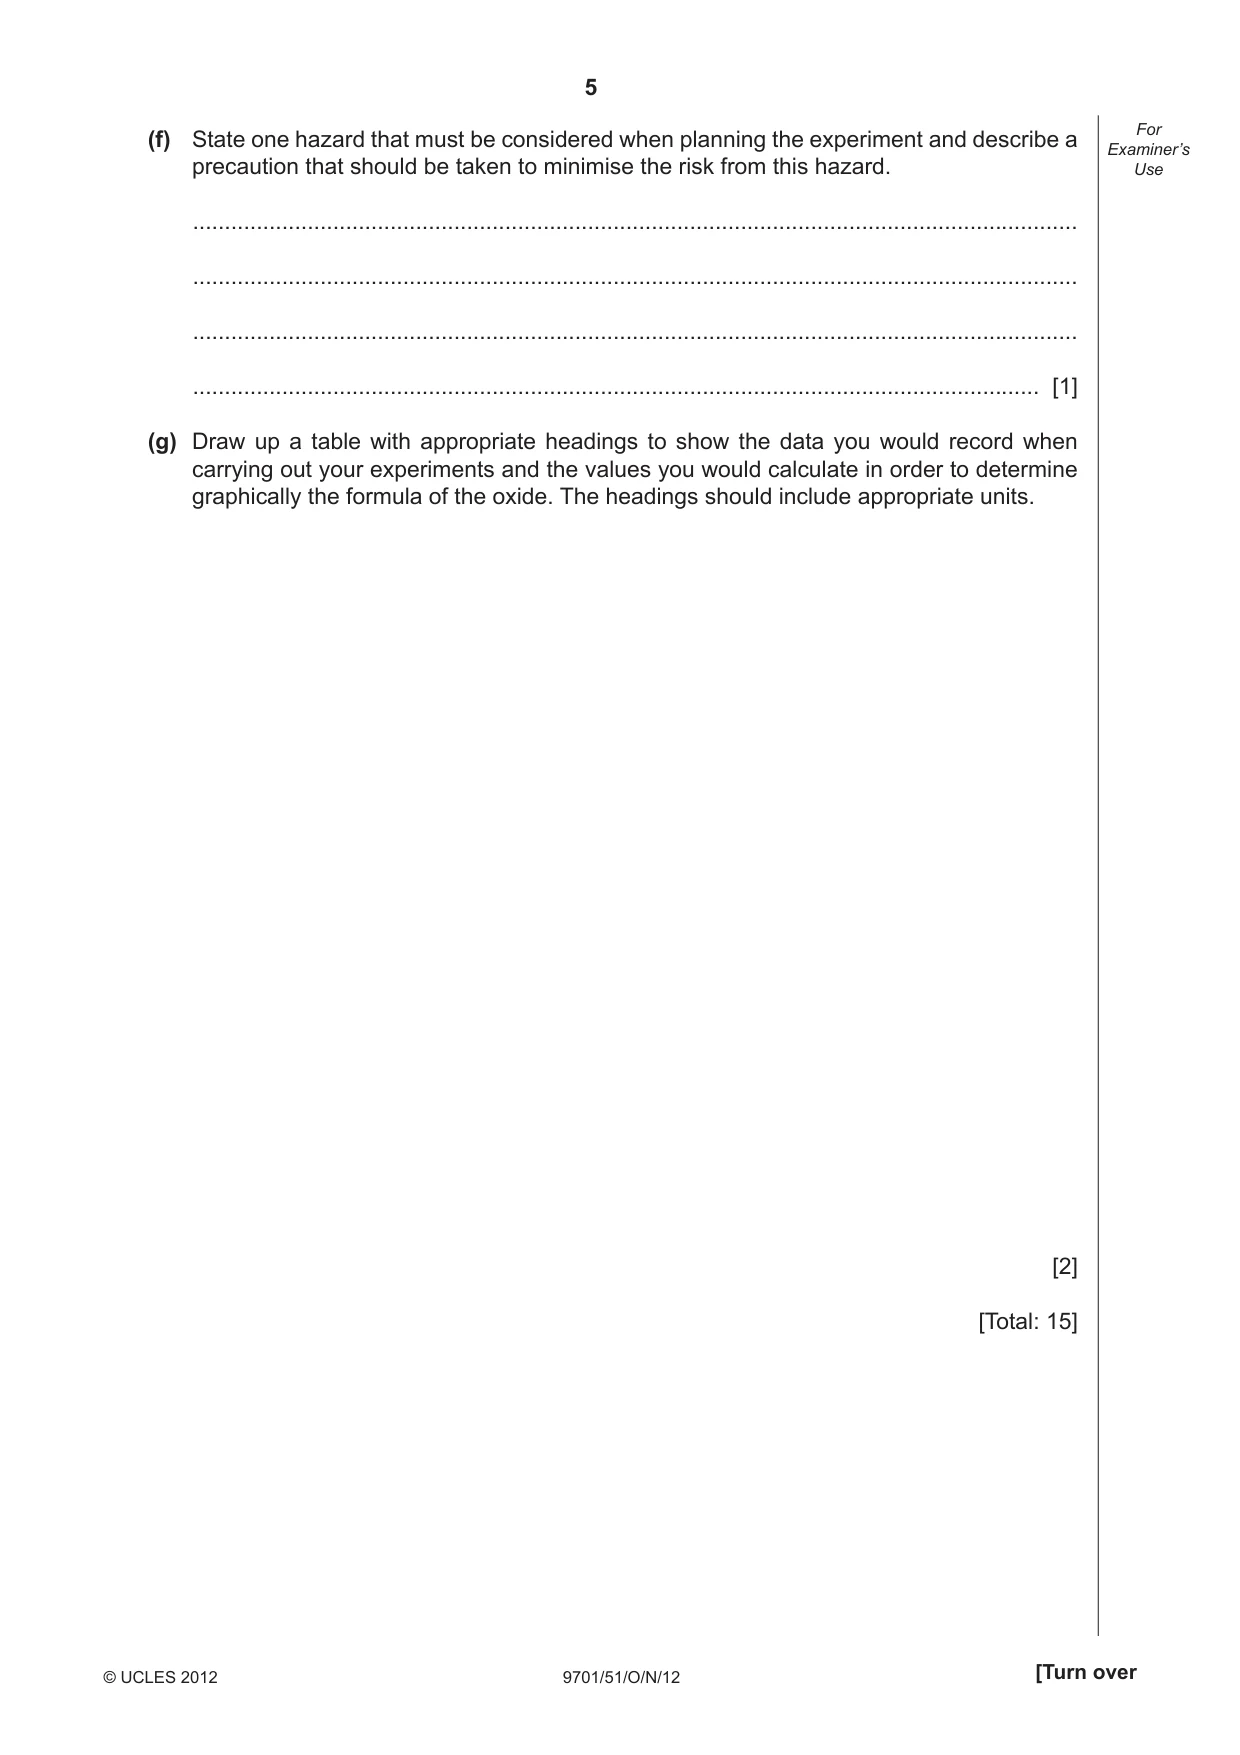
5 9701/51/O/N/12 © UCLES 2012 [Turn over For Examiner’s Use (f) State one hazard that must be considered when planning the experiment and describe a precaution that should be taken to minimise the risk from this hazard. … … … … [1] (g) Draw up a table with appropriate headings to show the data you would record when carrying out your experiments and the values you would calculate in order to determine graphically the formula of the oxide. The headings should include appropriate units. [2] [Total: 15]
Question paper, page 6
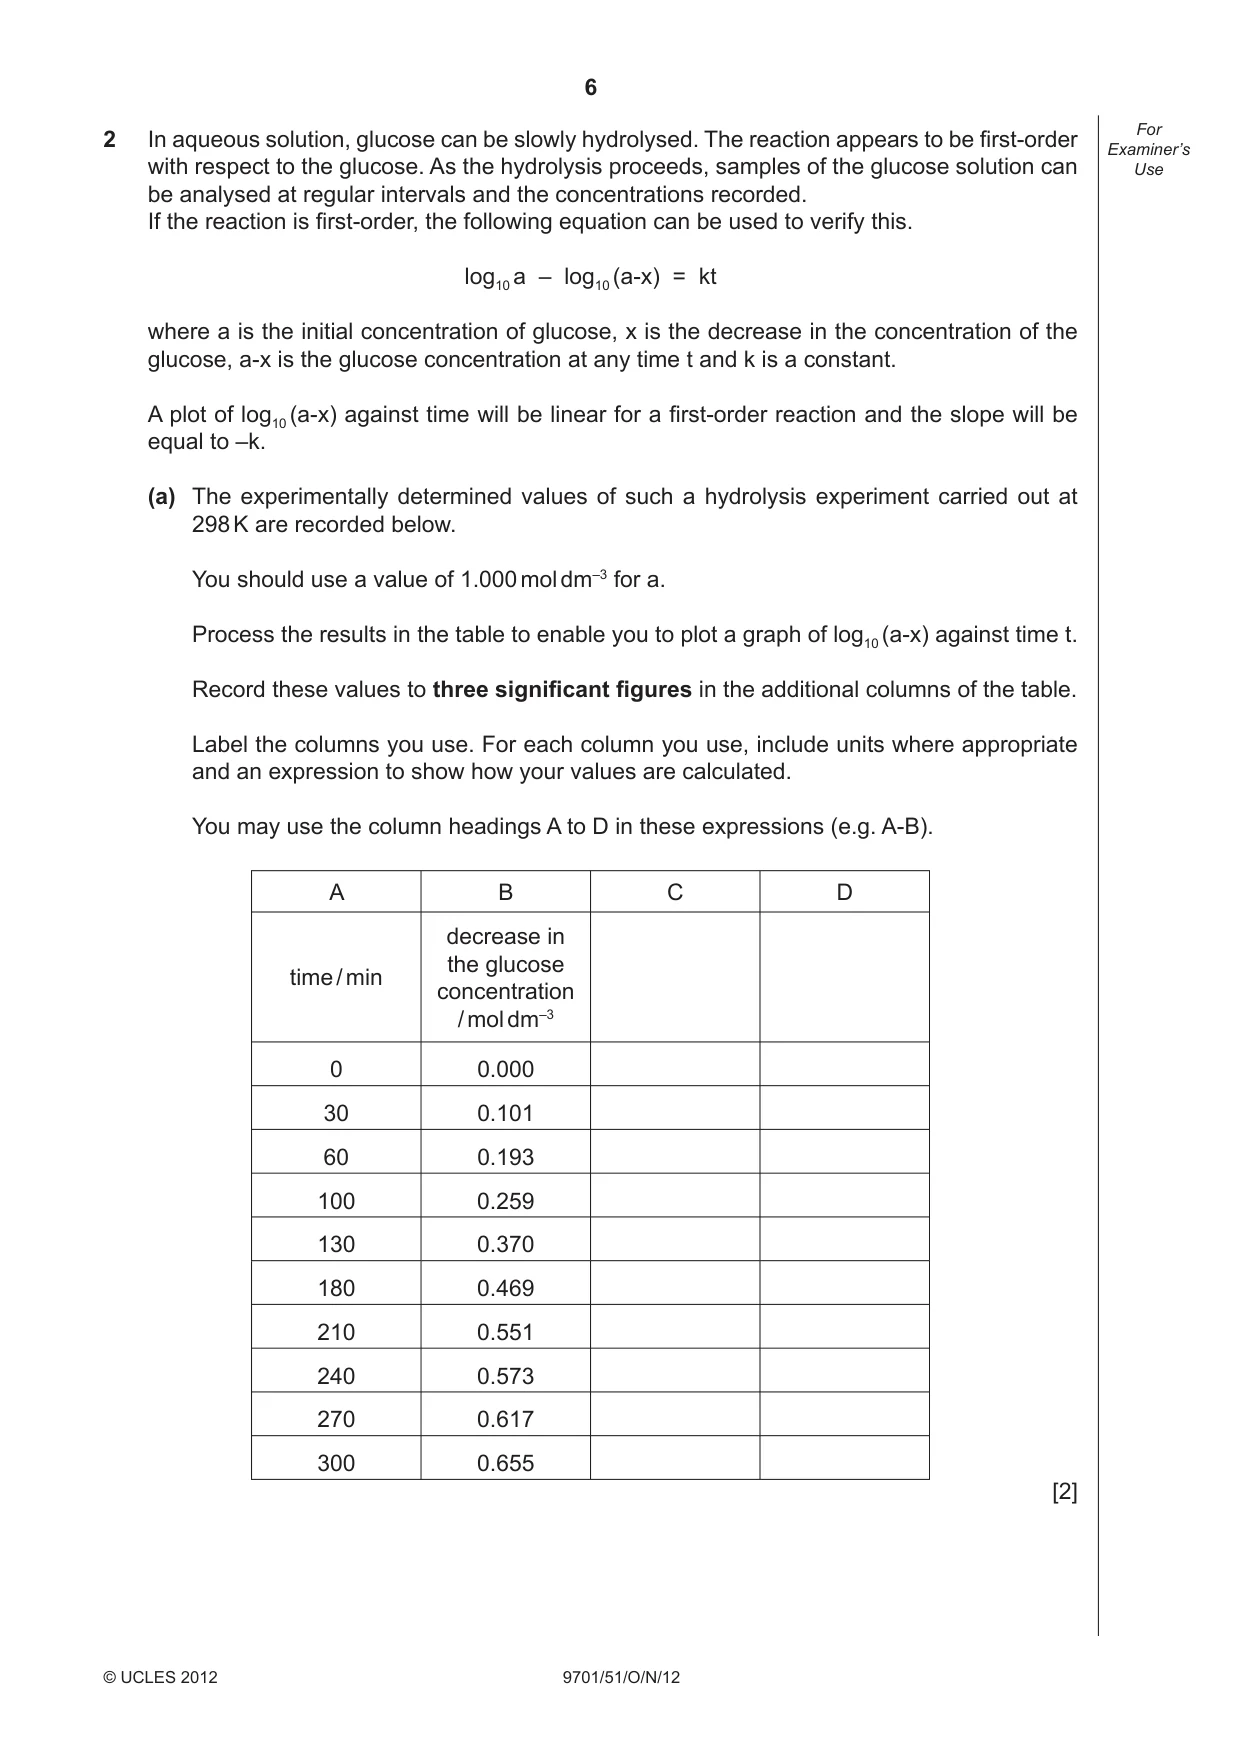
6 9701/51/O/N/12 © UCLES 2012 For Examiner’s Use 2 In aqueous solution, glucose can be slowly hydrolysed. The reaction appears to be fi rst-order with respect to the glucose. As the hydrolysis proceeds, samples of the glucose solution can be analysed at regular intervals and the concentrations recorded. If the reaction is fi rst-order, the following equation can be used to verify this. log10 a – log10 (a-x) = kt where a is the initial concentration of glucose, x is the decrease in the concentration of the glucose, a-x is the glucose concentration at any time t and k is a constant. A plot of log10 (a-x) against time will be linear for a fi rst-order reaction and the slope will be equal to –k. (a) The experimentally determined values of such a hydrolysis experiment carried out at 298 K are recorded below. You should use a value of 1.000 mol dm–3 for a. Process the results in the table to enable you to plot a graph of log10 (a-x) against time t. Record these values to three signifi cant fi gures in the additional columns of the table. Label the columns you use. For each column you use, include units where appropriate and an expression to show how your values are calculated. You may use the column headings A to D in these expressions (e.g. A-B). A B C D time / min decrease in the glucose concentration / mol dm–3 0 0.000 30 0.101 60 0.193 100 0.259 130 0.370 180 0.469 210 0.551 240 0.573 270 0.617 300 0.655 [2]
Question paper, page 7
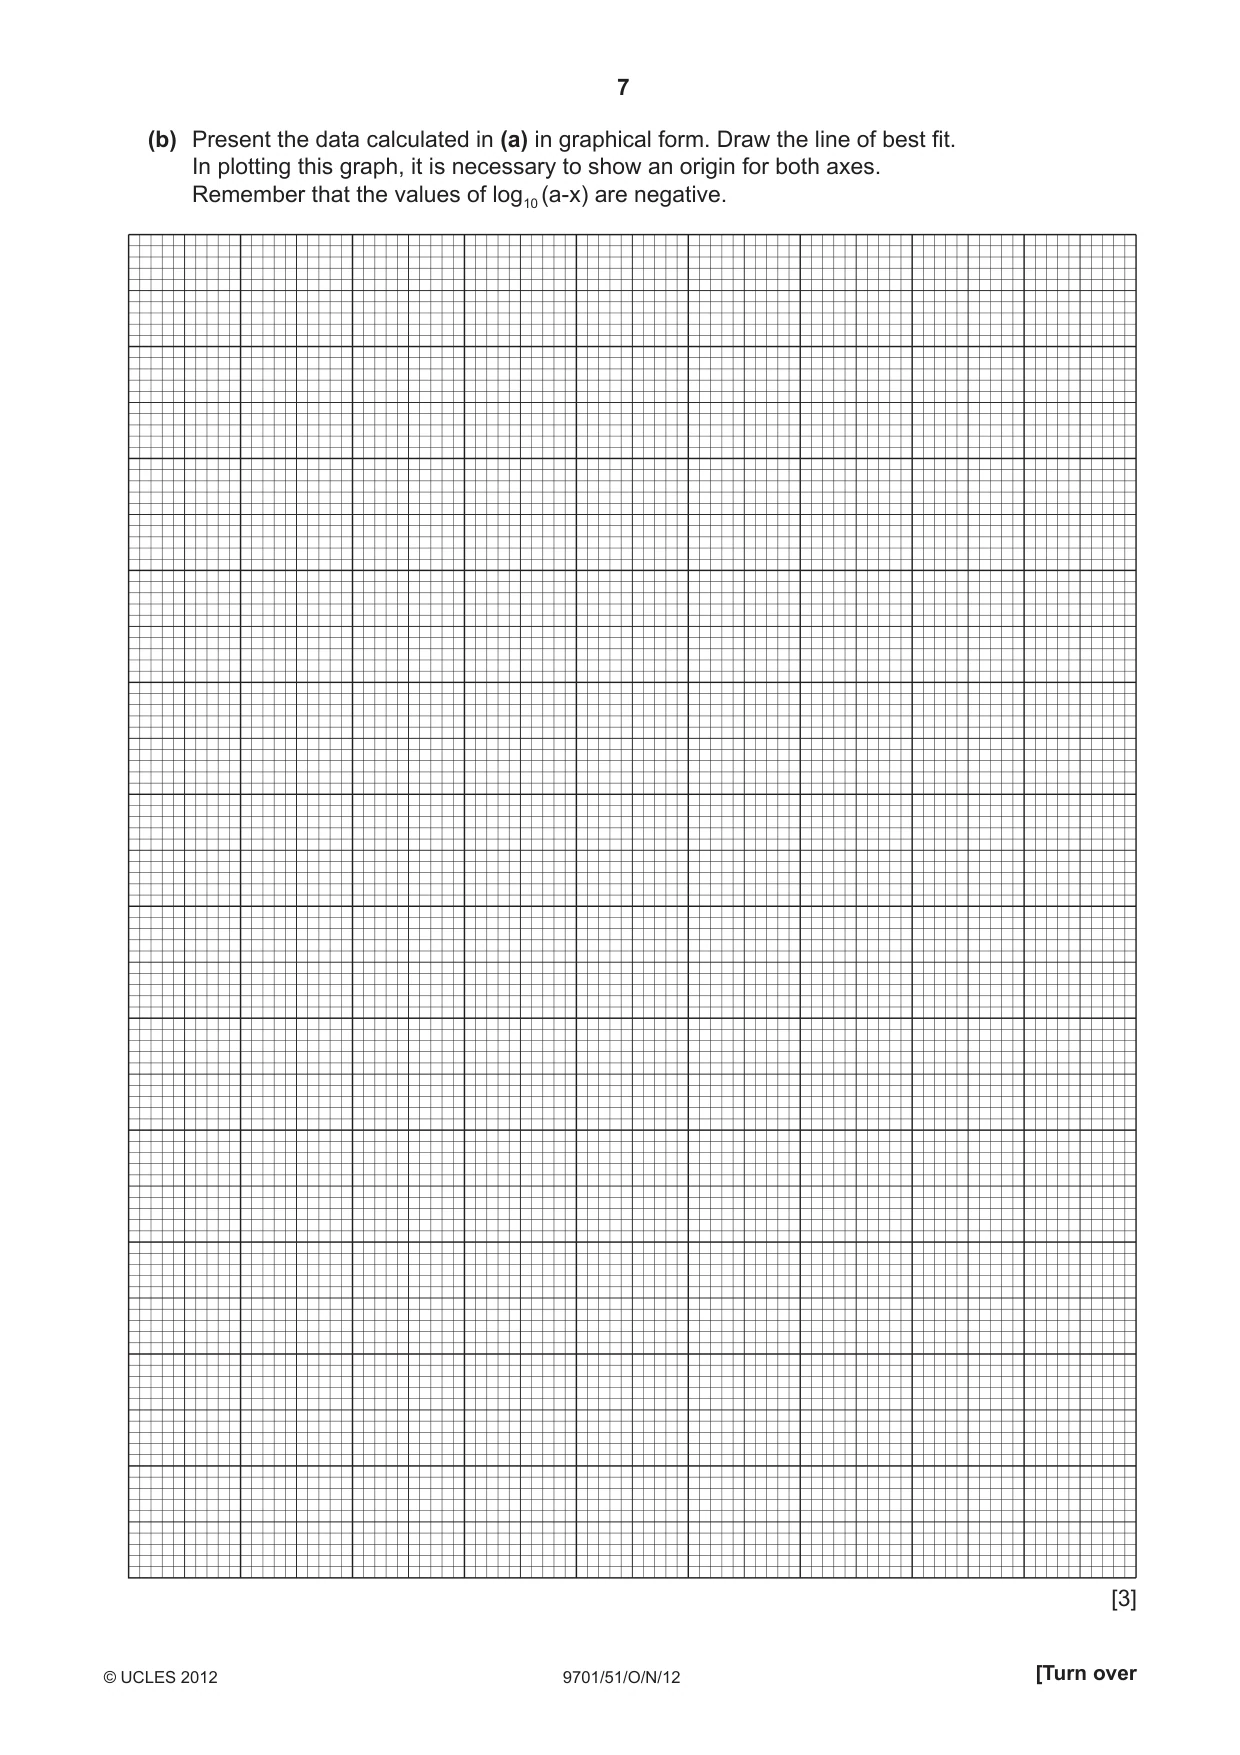
7 9701/51/O/N/12 © UCLES 2012 [Turn over (b) Present the data calculated in (a) in graphical form. Draw the line of best fi t. In plotting this graph, it is necessary to show an origin for both axes. Remember that the values of log10 (a-x) are negative. [3]
Question paper, page 8
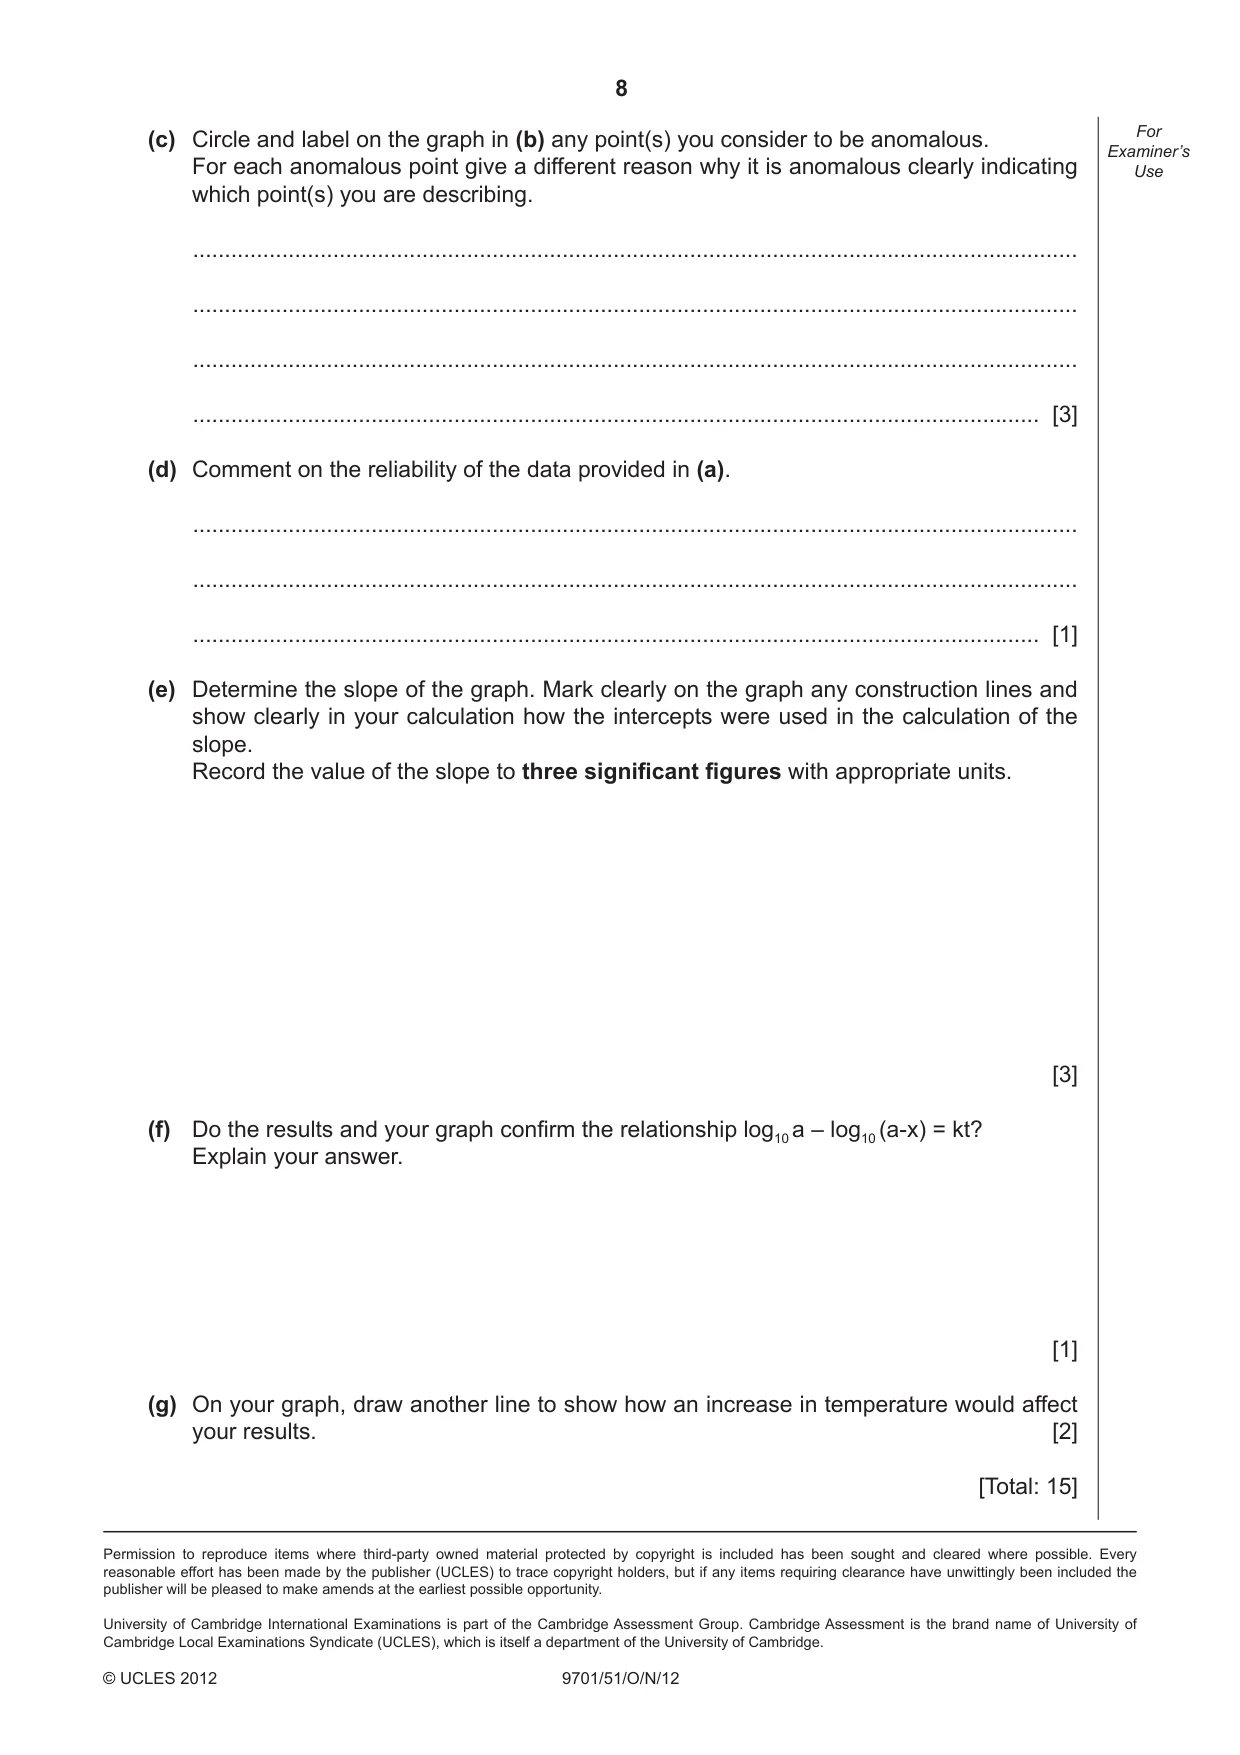
8 Permission to reproduce items where third-party owned material protected by copyright is included has been sought and cleared where possible. Every reasonable effort has been made by the publisher (UCLES) to trace copyright holders, but if any items requiring clearance have unwittingly been included the publisher will be pleased to make amends at the earliest possible opportunity. University of Cambridge International Examinations is part of the Cambridge Assessment Group. Cambridge Assessment is the brand name of University of Cambridge Local Examinations Syndicate (UCLES), which is itself a department of the University of Cambridge. 9701/51/O/N/12 © UCLES 2012 For Examiner’s Use (c) Circle and label on the graph in (b) any point(s) you consider to be anomalous. For each anomalous point give a different reason why it is anomalous clearly indicating which point(s) you are describing. … … … … [3] (d) Comment on the reliability of the data provided in (a). … … … [1] (e) Determine the slope of the graph. Mark clearly on the graph any construction lines and show clearly in your calculation how the intercepts were used in the calculation of the slope. Record the value of the slope to three signifi cant fi gures with appropriate units. [3] (f) Do the results and your graph confi rm the relationship log10 a – log10 (a-x) = kt? Explain your answer. [1] (g) On your graph, draw another line to show how an increase in temperature would affect your results. [2] [Total: 15]
Mark scheme, page 1
CAMBRIDGE INTERNATIONAL EXAMINATIONS GCE Advanced Level MARK SCHEME for the October/November 2012 series 9701 CHEMISTRY 9701/51 Paper 5 (Planning, Analysis and Evaluation), maximum raw mark 30 This mark scheme is published as an aid to teachers and candidates, to indicate the requirements of the examination. It shows the basis on which Examiners were instructed to award marks. It does not indicate the details of the discussions that took place at an Examiners’ meeting before marking began, which would have considered the acceptability of alternative answers. Mark schemes should be read in conjunction with the question paper and the Principal Examiner Report for Teachers. Cambridge will not enter into discussions about these mark schemes. Cambridge is publishing the mark schemes for the October/November 2012 series for most IGCSE, GCE Advanced Level and Advanced Subsidiary Level components and some Ordinary Level components.
Mark scheme, page 2
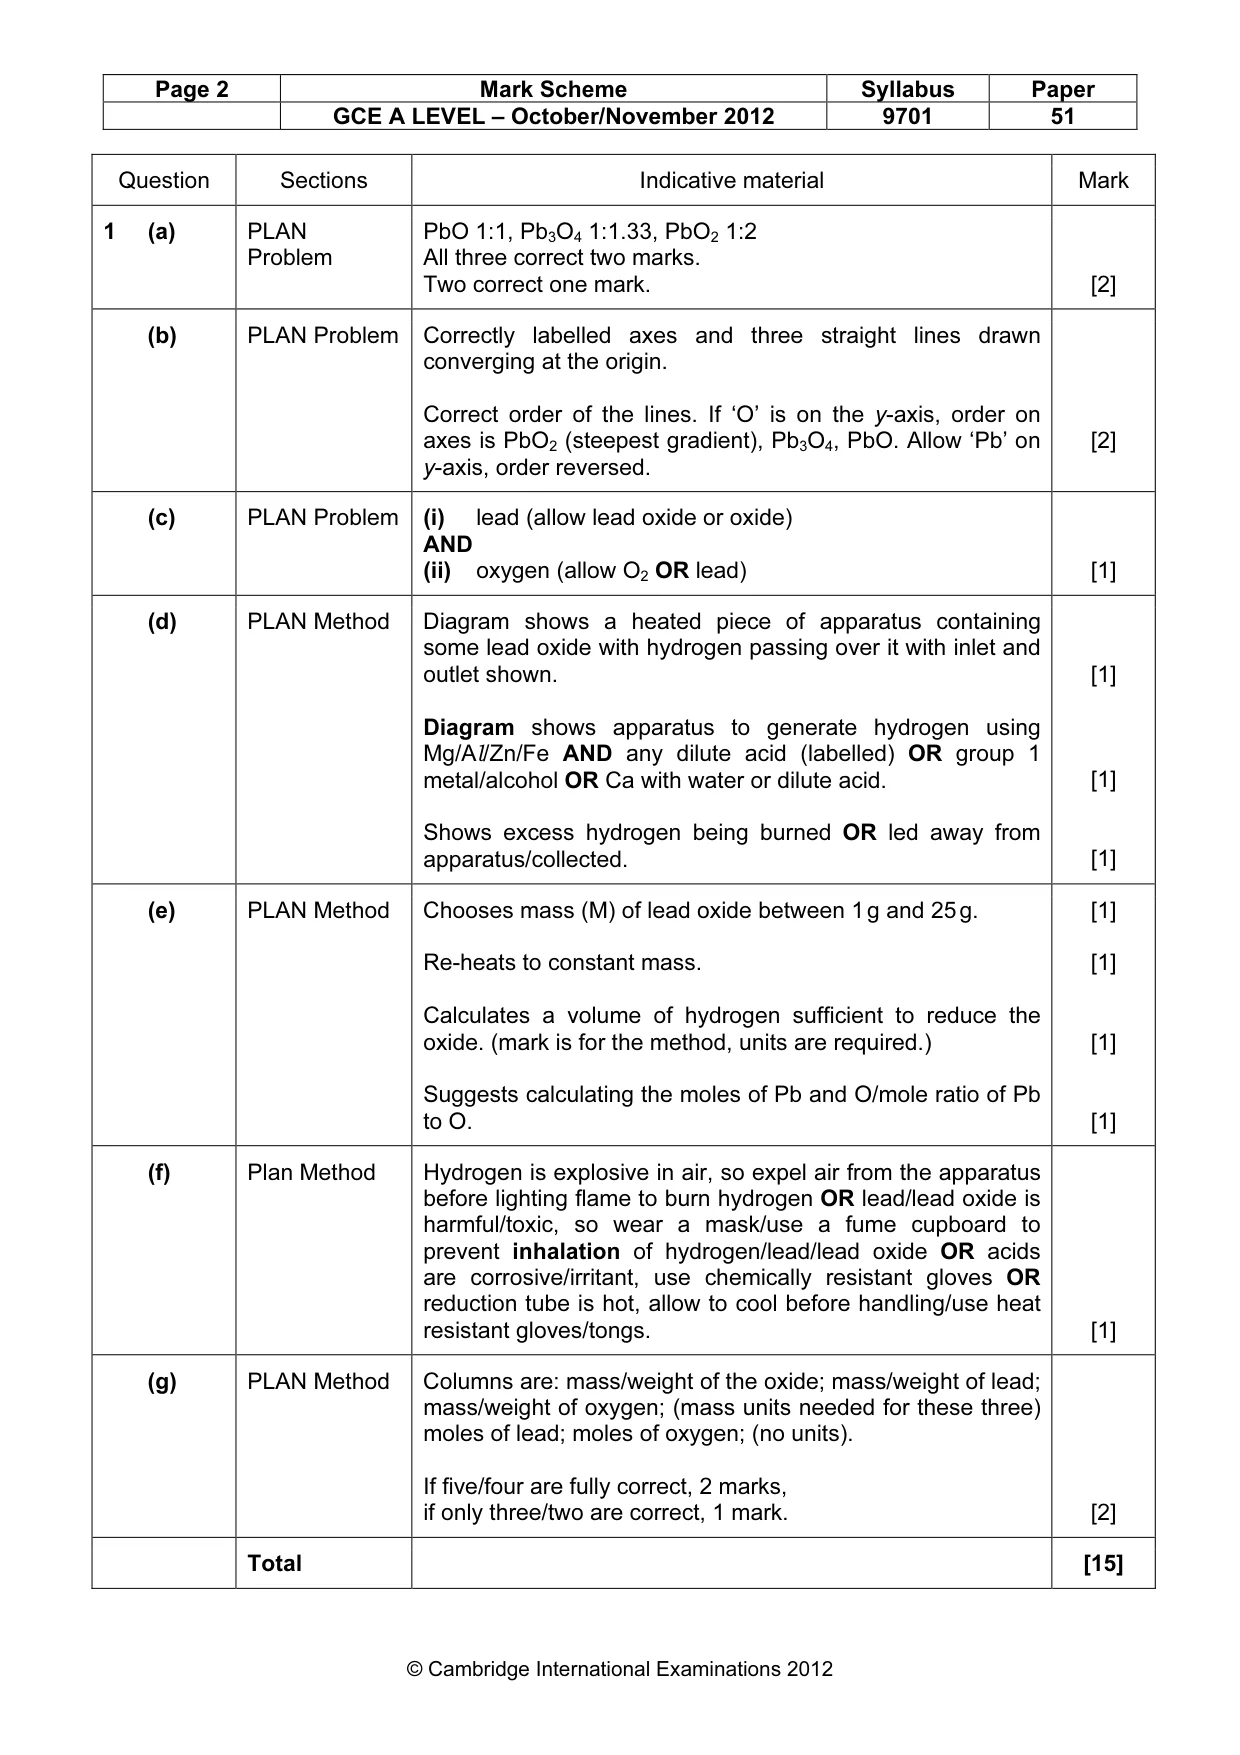
Page 2 Mark Scheme Syllabus Paper GCE A LEVEL – October/November 2012 9701 51 © Cambridge International Examinations 2012 Question Sections Indicative material Mark 1 (a) PLAN Problem PbO 1:1, Pb3O4 1:1.33, PbO2 1:2 All three correct two marks. Two correct one mark. [2] (b) PLAN Problem Correctly labelled axes and three straight lines drawn converging at the origin. Correct order of the lines. If ‘O’ is on the y-axis, order on axes is PbO2 (steepest gradient), Pb3O4, PbO. Allow ‘Pb’ on y-axis, order reversed. [2] (c) PLAN Problem (i) lead (allow lead oxide or oxide) AND (ii) oxygen (allow O2 OR lead) [1] (d) PLAN Method Diagram shows a heated piece of apparatus containing some lead oxide with hydrogen passing over it with inlet and outlet shown. Diagram shows apparatus to generate hydrogen using Mg/Al/Zn/Fe AND any dilute acid (labelled) OR group 1 metal/alcohol OR Ca with water or dilute acid. Shows excess hydrogen being burned OR led away from apparatus/collected. [1] [1] [1] (e) PLAN Method Chooses mass (M) of lead oxide between 1 g and 25 g. Re-heats to constant mass. Calculates a volume of hydrogen sufficient to reduce the oxide. (mark is for the method, units are required.) Suggests calculating the moles of Pb and O/mole ratio of Pb to O. [1] [1] [1] [1] (f) Plan Method Hydrogen is explosive in air, so expel air from the apparatus before lighting flame to burn hydrogen OR lead/lead oxide is harmful/toxic, so wear a mask/use a fume cupboard to prevent inhalation of hydrogen/lead/lead oxide OR acids are corrosive/irritant, use chemically resistant gloves OR reduction tube is hot, allow to cool before handling/use heat resistant gloves/tongs. [1] (g) PLAN Method Columns are: mass/weight of the oxide; mass/weight of lead; mass/weight of oxygen; (mass units needed for these three) moles of lead; moles of oxygen; (no units). If five/four are fully correct, 2 marks, if only three/two are correct, 1 mark. [2] Total [15]
Mark scheme, page 3
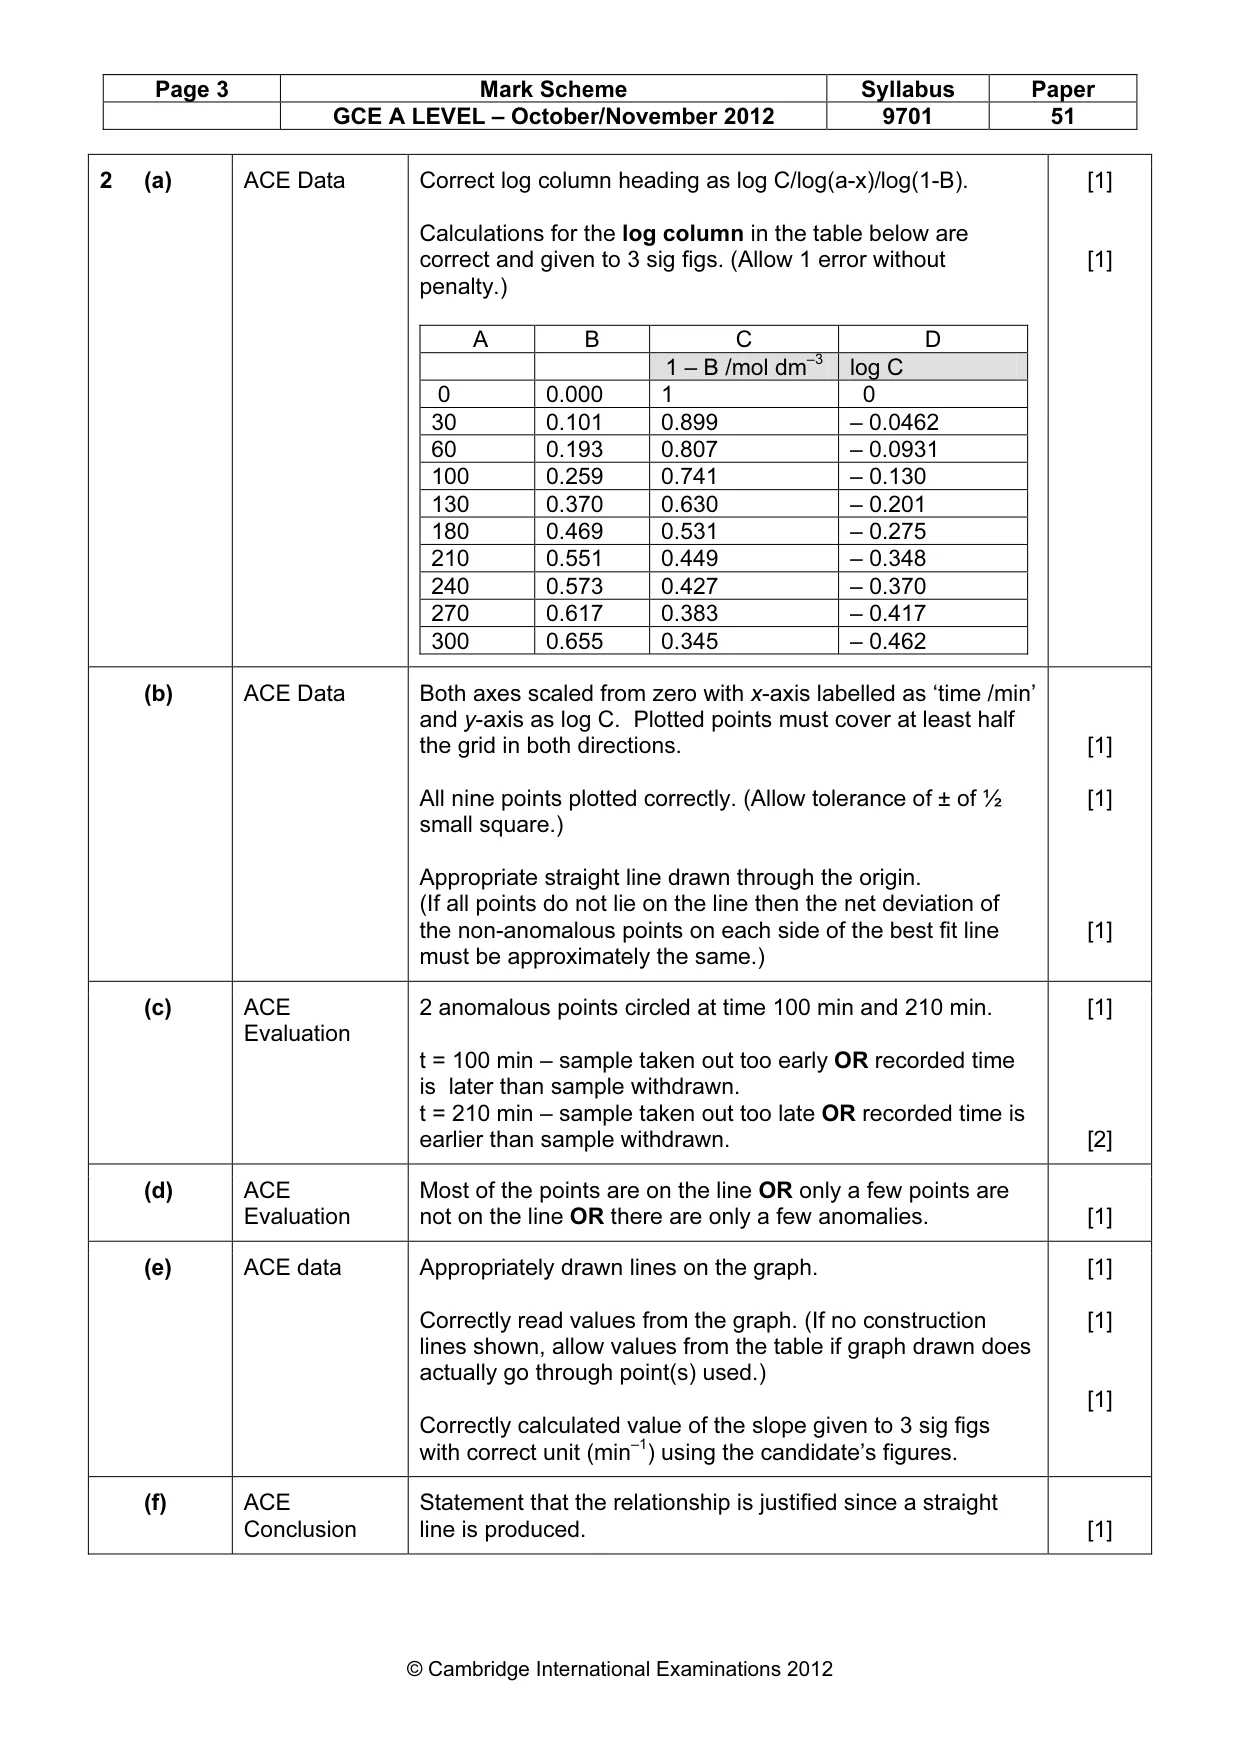
Page 3 Mark Scheme Syllabus Paper GCE A LEVEL – October/November 2012 9701 51 © Cambridge International Examinations 2012 2 (a) ACE Data Correct log column heading as log C/log(a-x)/log(1-B). Calculations for the log column in the table below are correct and given to 3 sig figs. (Allow 1 error without penalty.) A B C D 1 – B /mol dm–3 log C 0 0.000 1 0 30 0.101 0.899 – 0.0462 60 0.193 0.807 – 0.0931 100 0.259 0.741 – 0.130 130 0.370 0.630 – 0.201 180 0.469 0.531 – 0.275 210 0.551 0.449 – 0.348 240 0.573 0.427 – 0.370 270 0.617 0.383 – 0.417 300 0.655 0.345 – 0.462 [1] [1] (b) ACE Data Both axes scaled from zero with x-axis labelled as ‘time /min’ and y-axis as log C. Plotted points must cover at least half the grid in both directions. All nine points plotted correctly. (Allow tolerance of ± of ½ small square.) Appropriate straight line drawn through the origin. (If all points do not lie on the line then the net deviation of the non-anomalous points on each side of the best fit line must be approximately the same.) [1] [1] [1] (c) ACE Evaluation 2 anomalous points circled at time 100 min and 210 min. t = 100 min – sample taken out too early OR recorded time is later than sample withdrawn. t = 210 min – sample taken out too late OR recorded time is earlier than sample withdrawn. [1] [2] (d) ACE Evaluation Most of the points are on the line OR only a few points are not on the line OR there are only a few anomalies. [1] (e) ACE data Appropriately drawn lines on the graph. Correctly read values from the graph. (If no construction lines shown, allow values from the table if graph drawn does actually go through point(s) used.) Correctly calculated value of the slope given to 3 sig figs with correct unit (min–1) using the candidate’s figures. [1] [1] [1] (f) ACE Conclusion Statement that the relationship is justified since a straight line is produced. [1]
Mark scheme, page 4
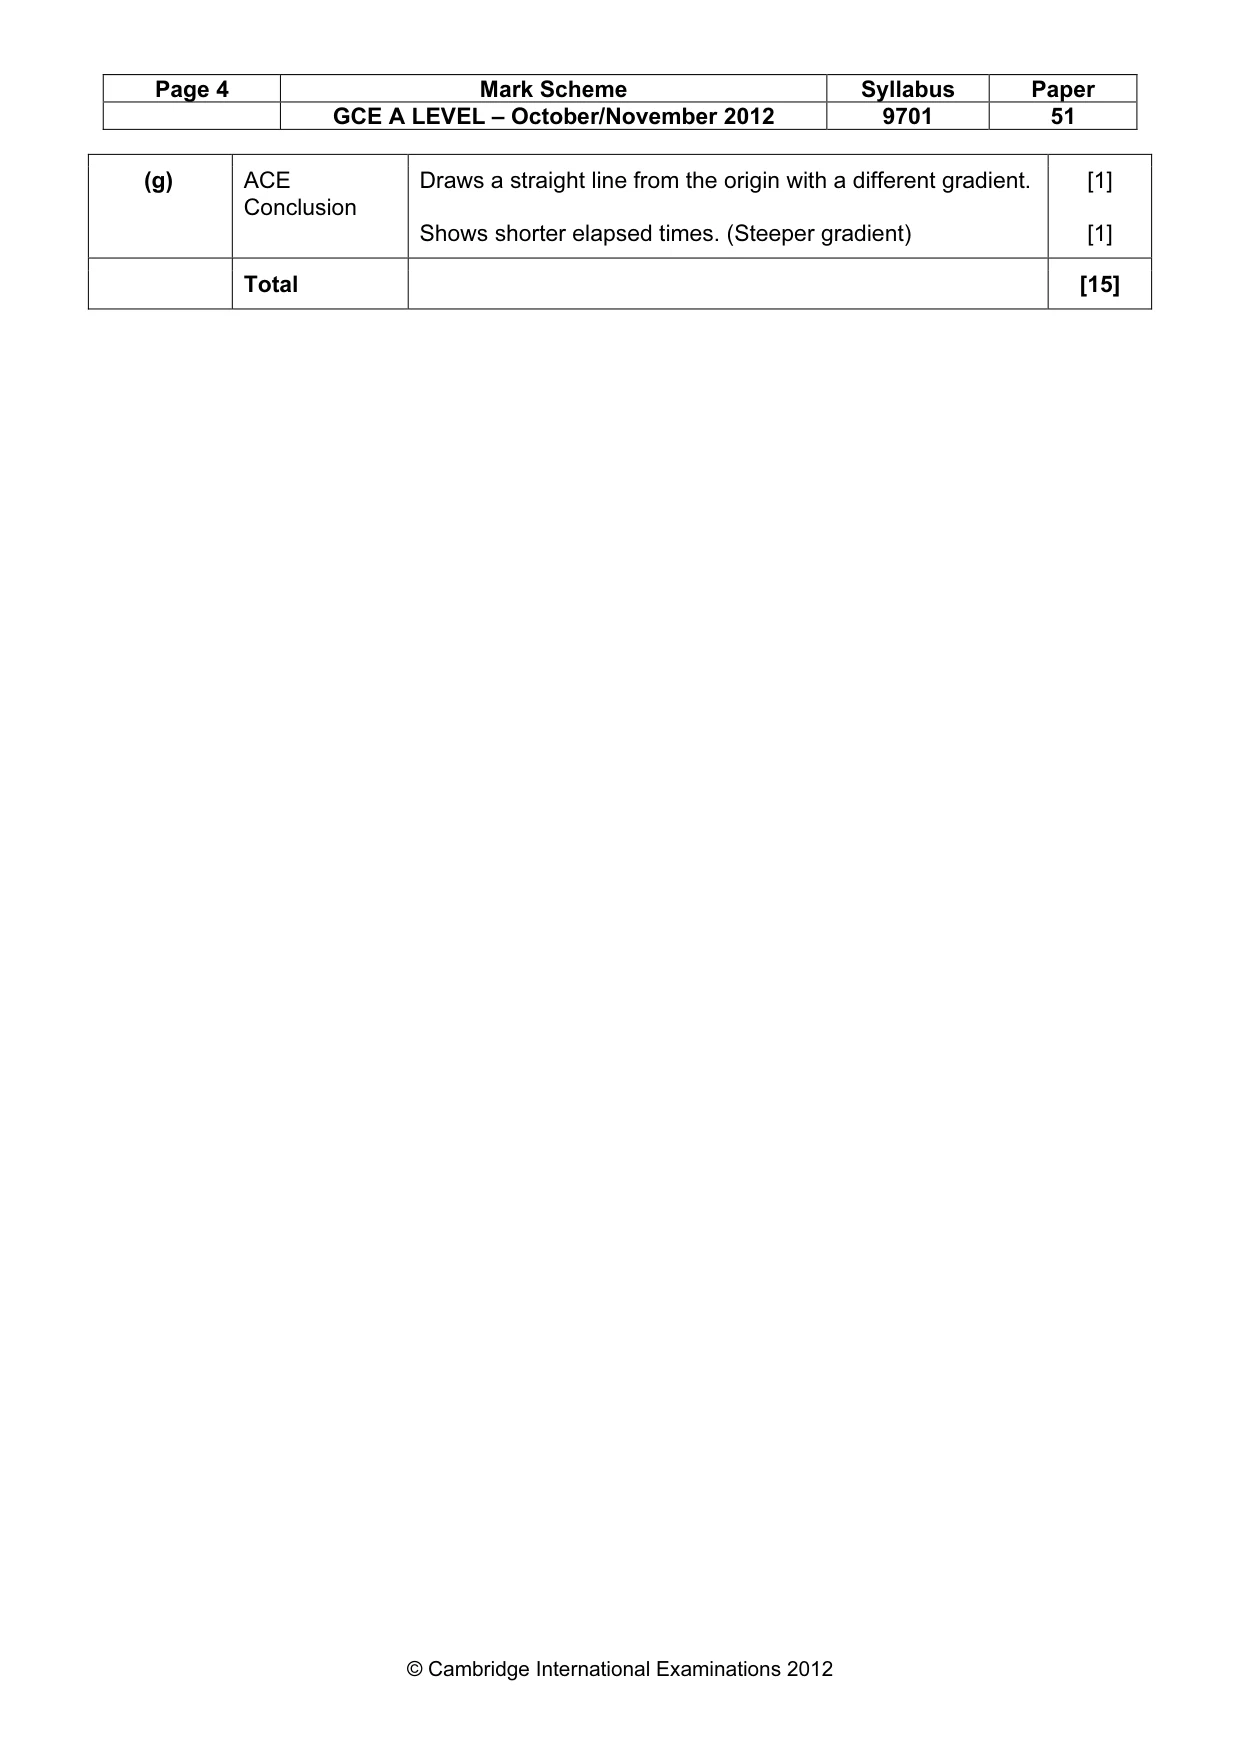
Page 4 Mark Scheme Syllabus Paper GCE A LEVEL – October/November 2012 9701 51 © Cambridge International Examinations 2012 (g) ACE Conclusion Draws a straight line from the origin with a different gradient. Shows shorter elapsed times. (Steeper gradient) [1] [1] Total [15]
What you needed in this session
Cambridge’s own grade thresholds for 2012 Oct/Nov, Paper 5 · Variant 1. A higher threshold means an easier paper — the bar moves with how the cohort did.