Cambridge A Level Biology 9700 — 2025 Oct/Nov Paper 3 · Variant 7
9700/37/O/N/25 · 2 questions · 40 marks · 120 min
The question paper and its mark scheme, free to read here and free to download. This is Cambridge’s own paper, exactly as it was sat.
Question paper20 pages



Mark scheme9 pages
Answers below. Sit the paper first if you are practising.
Questions as text
Q1 · Dialysis tubing is a partially permeable membrane
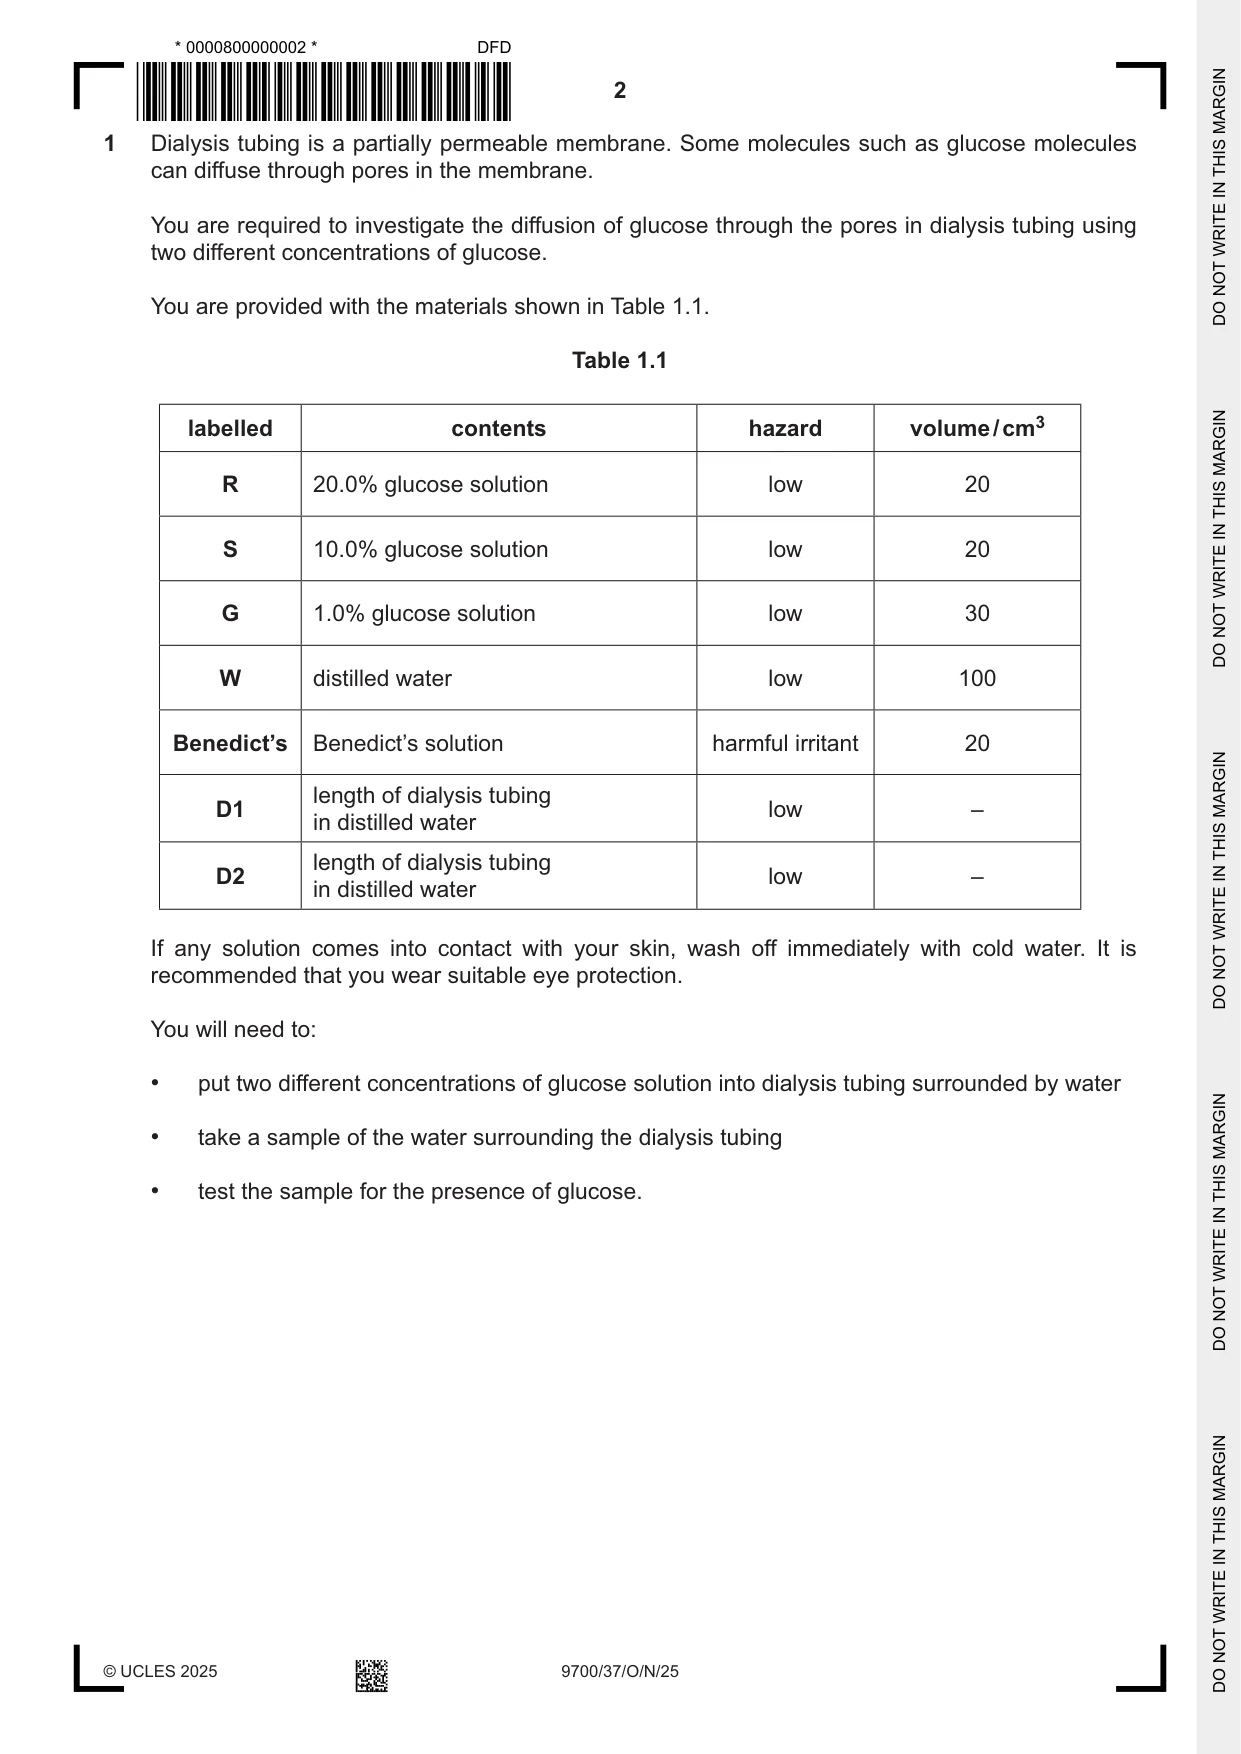
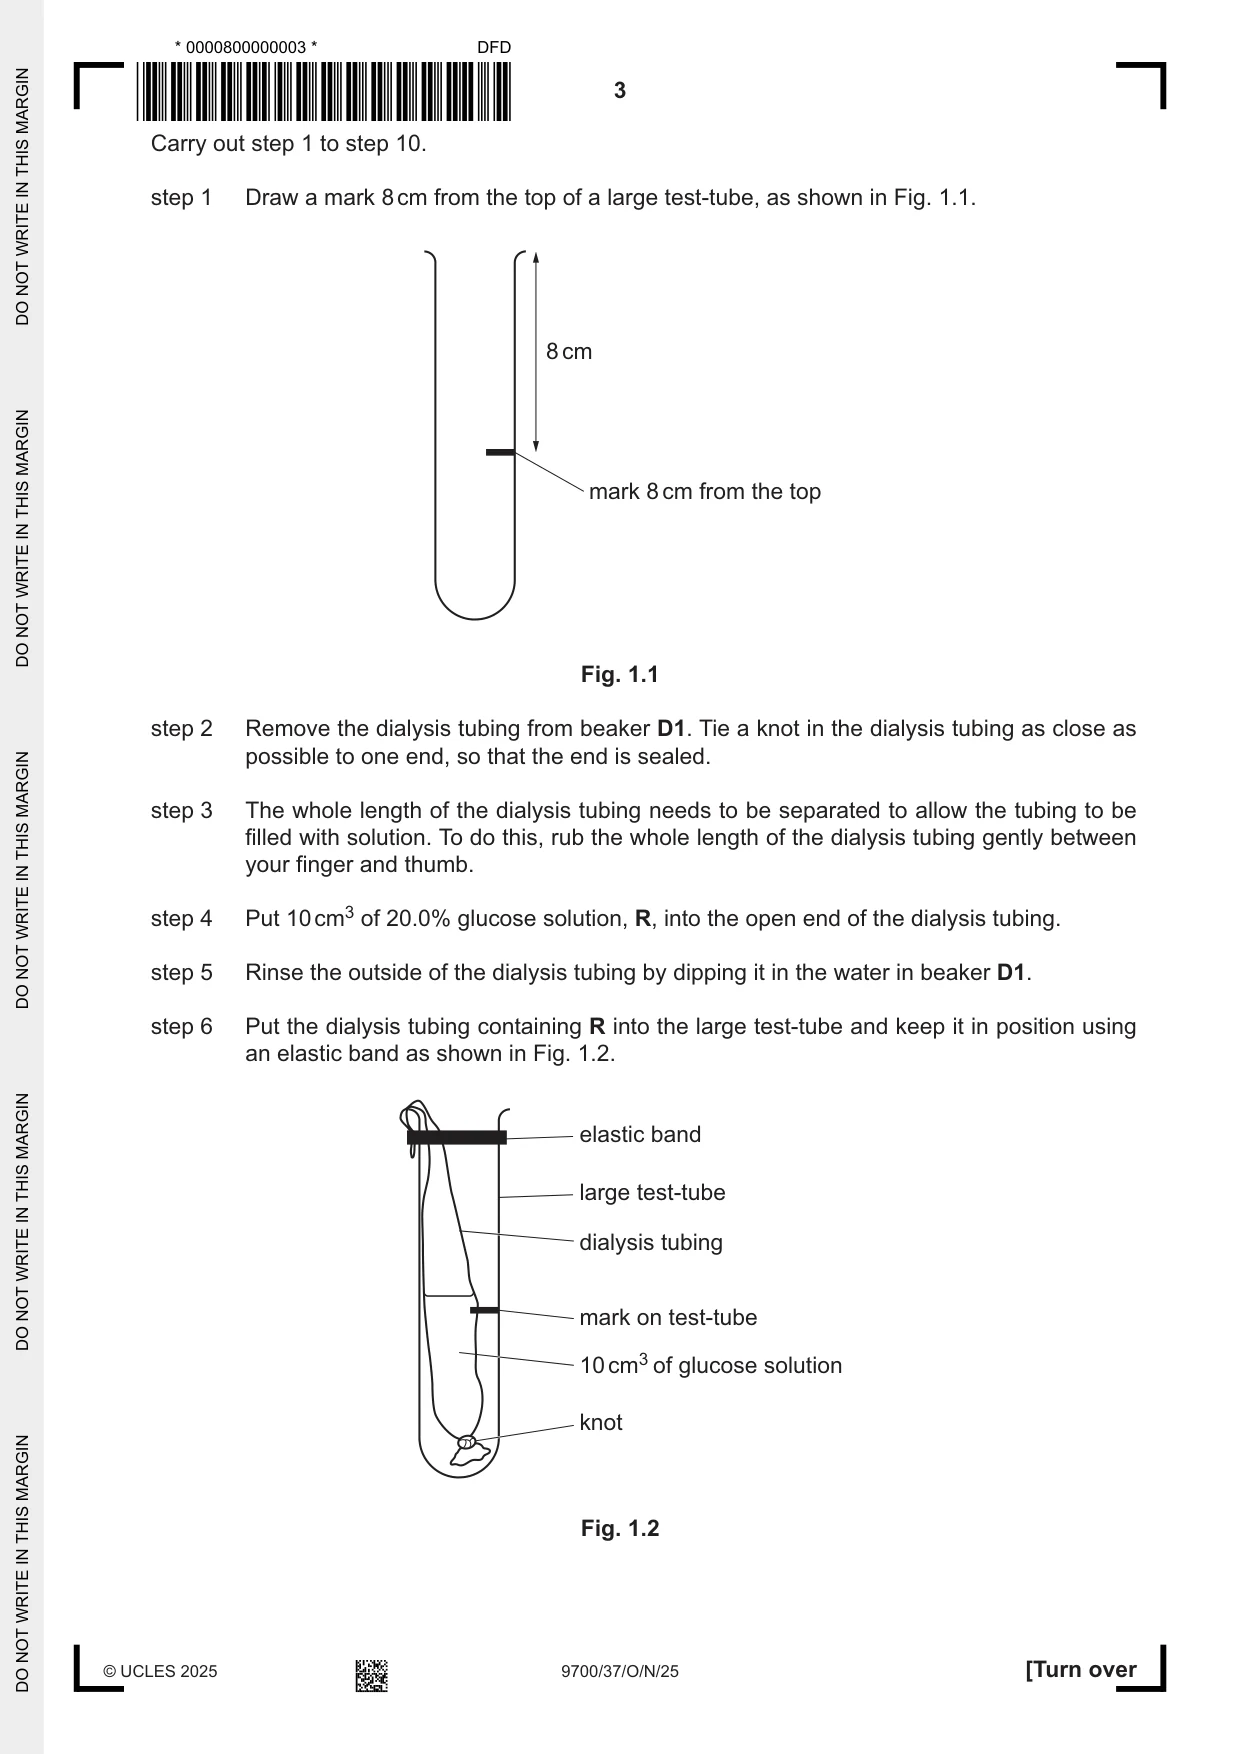
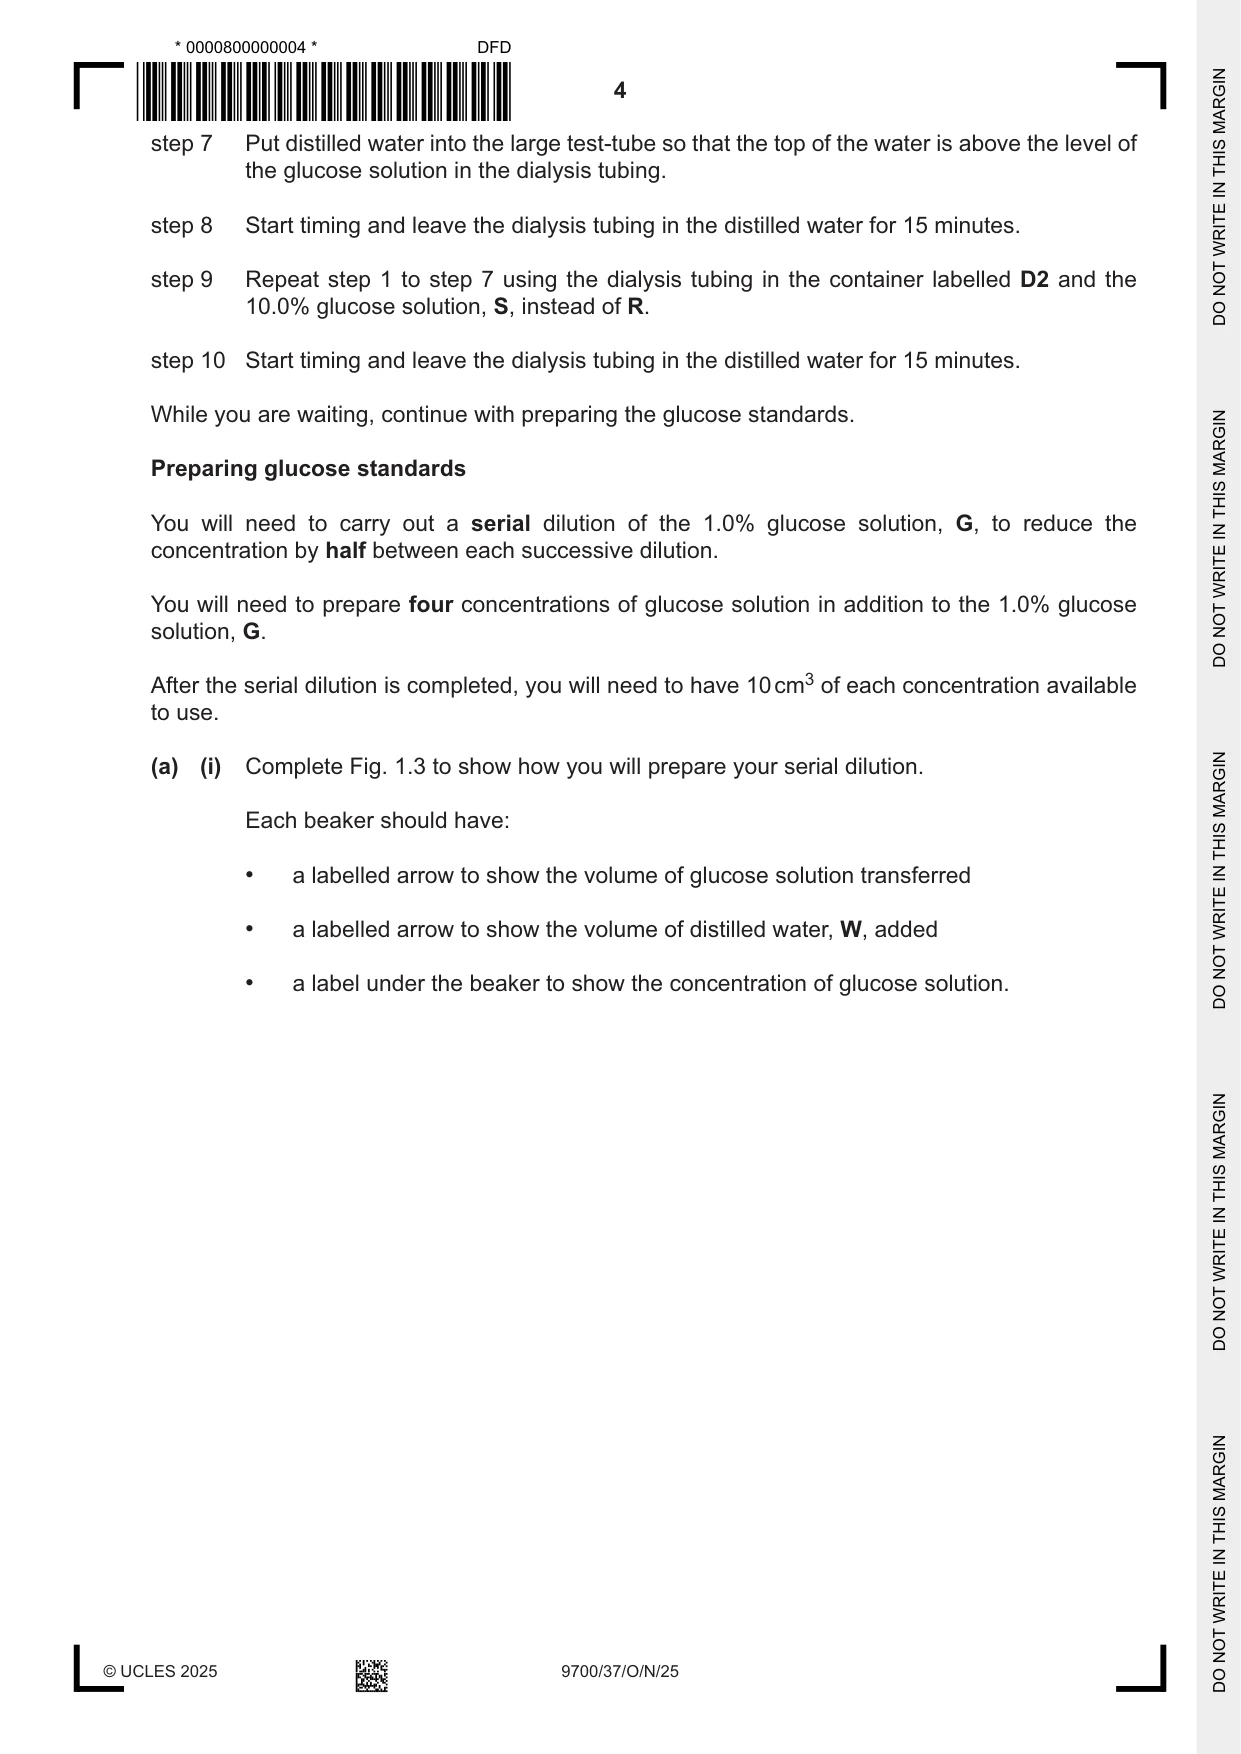
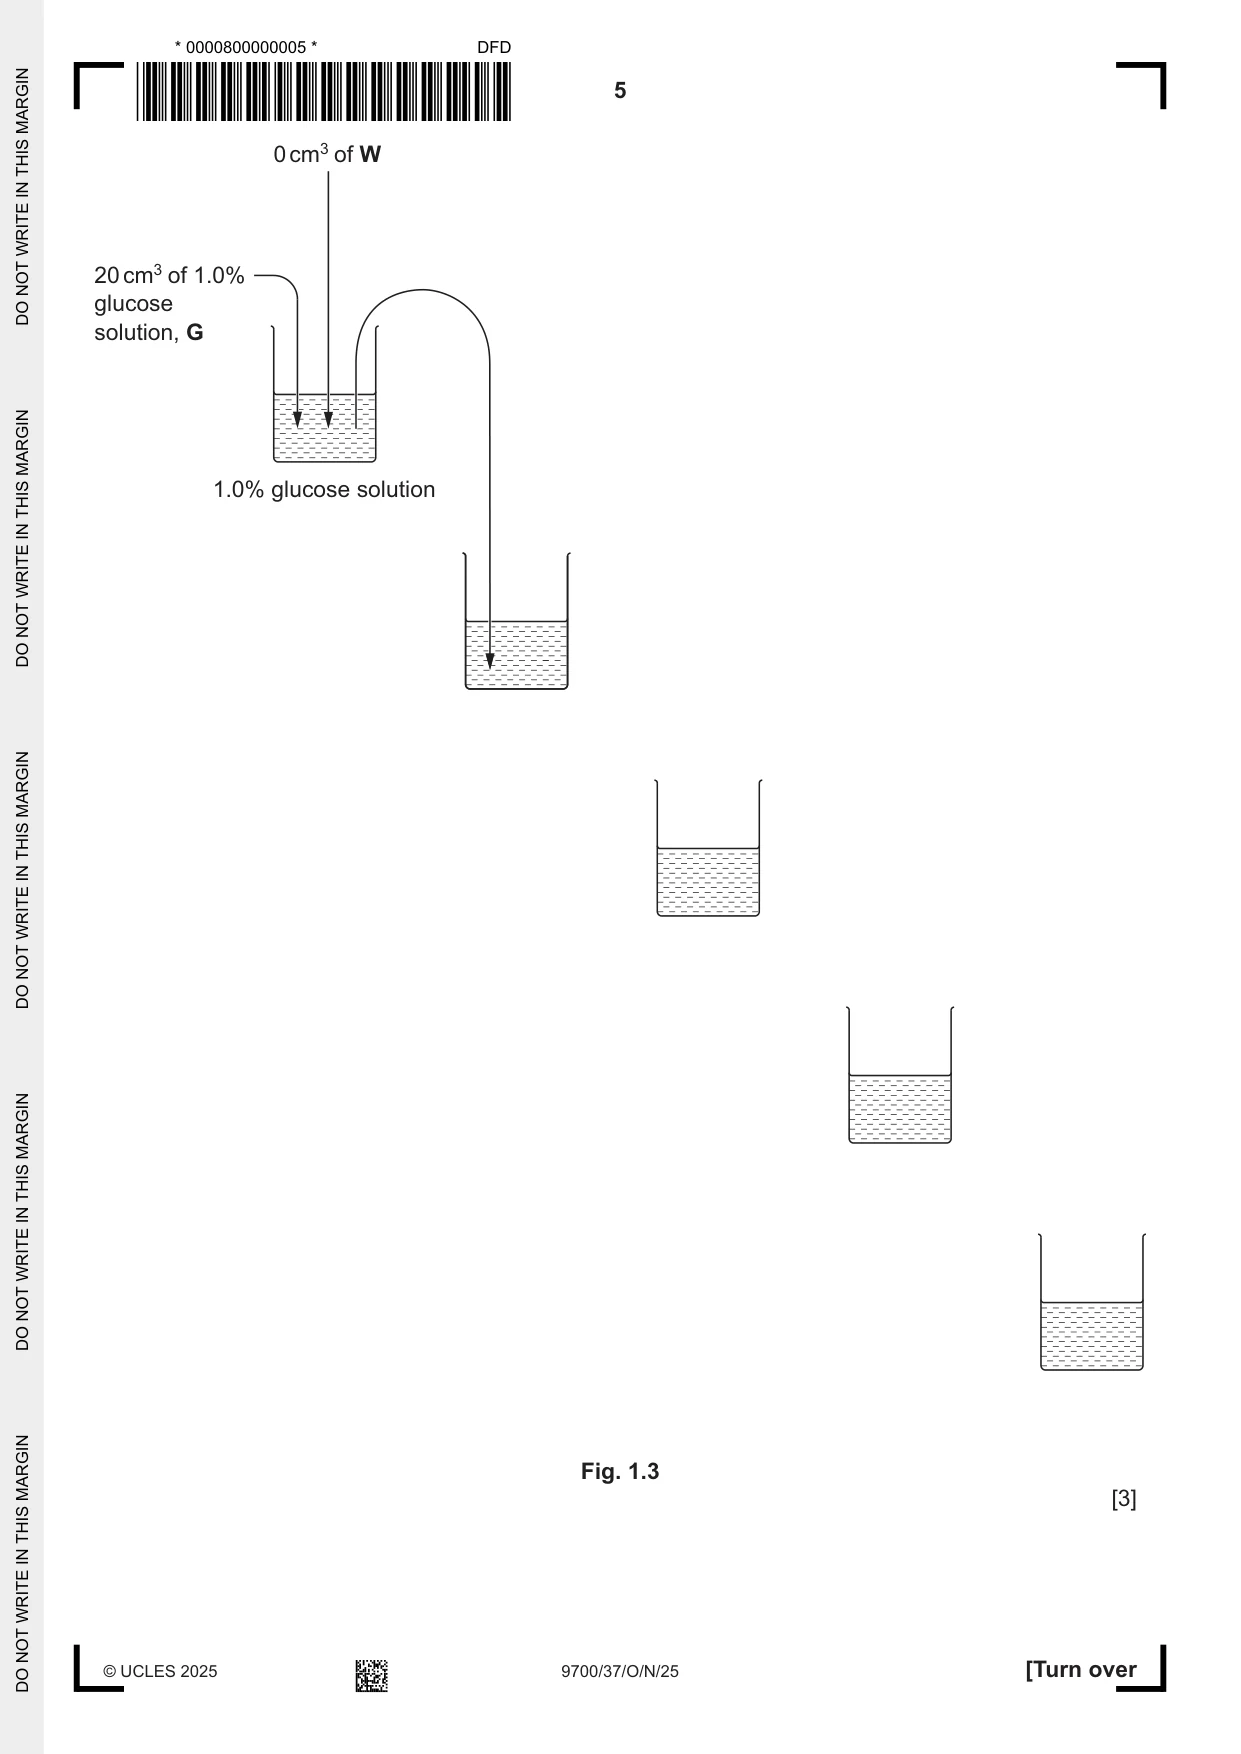
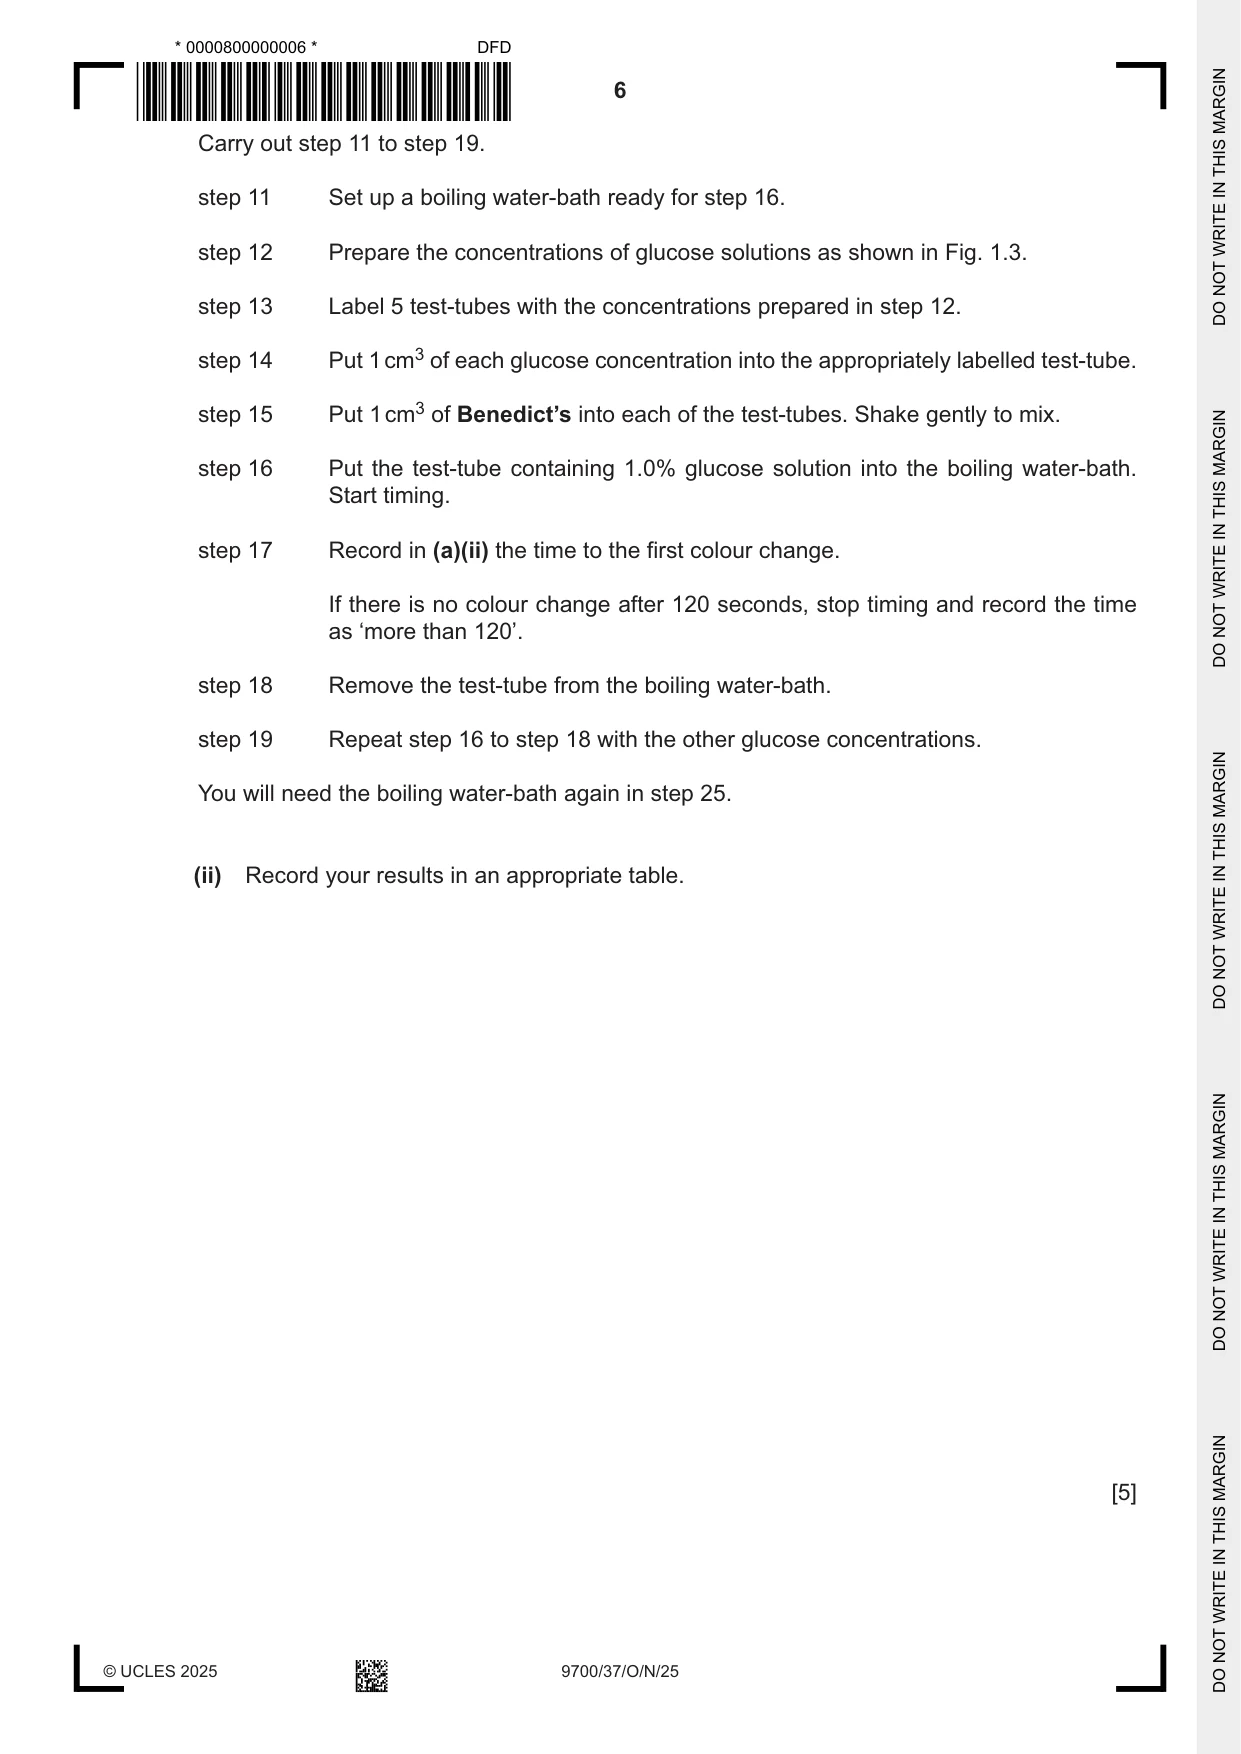
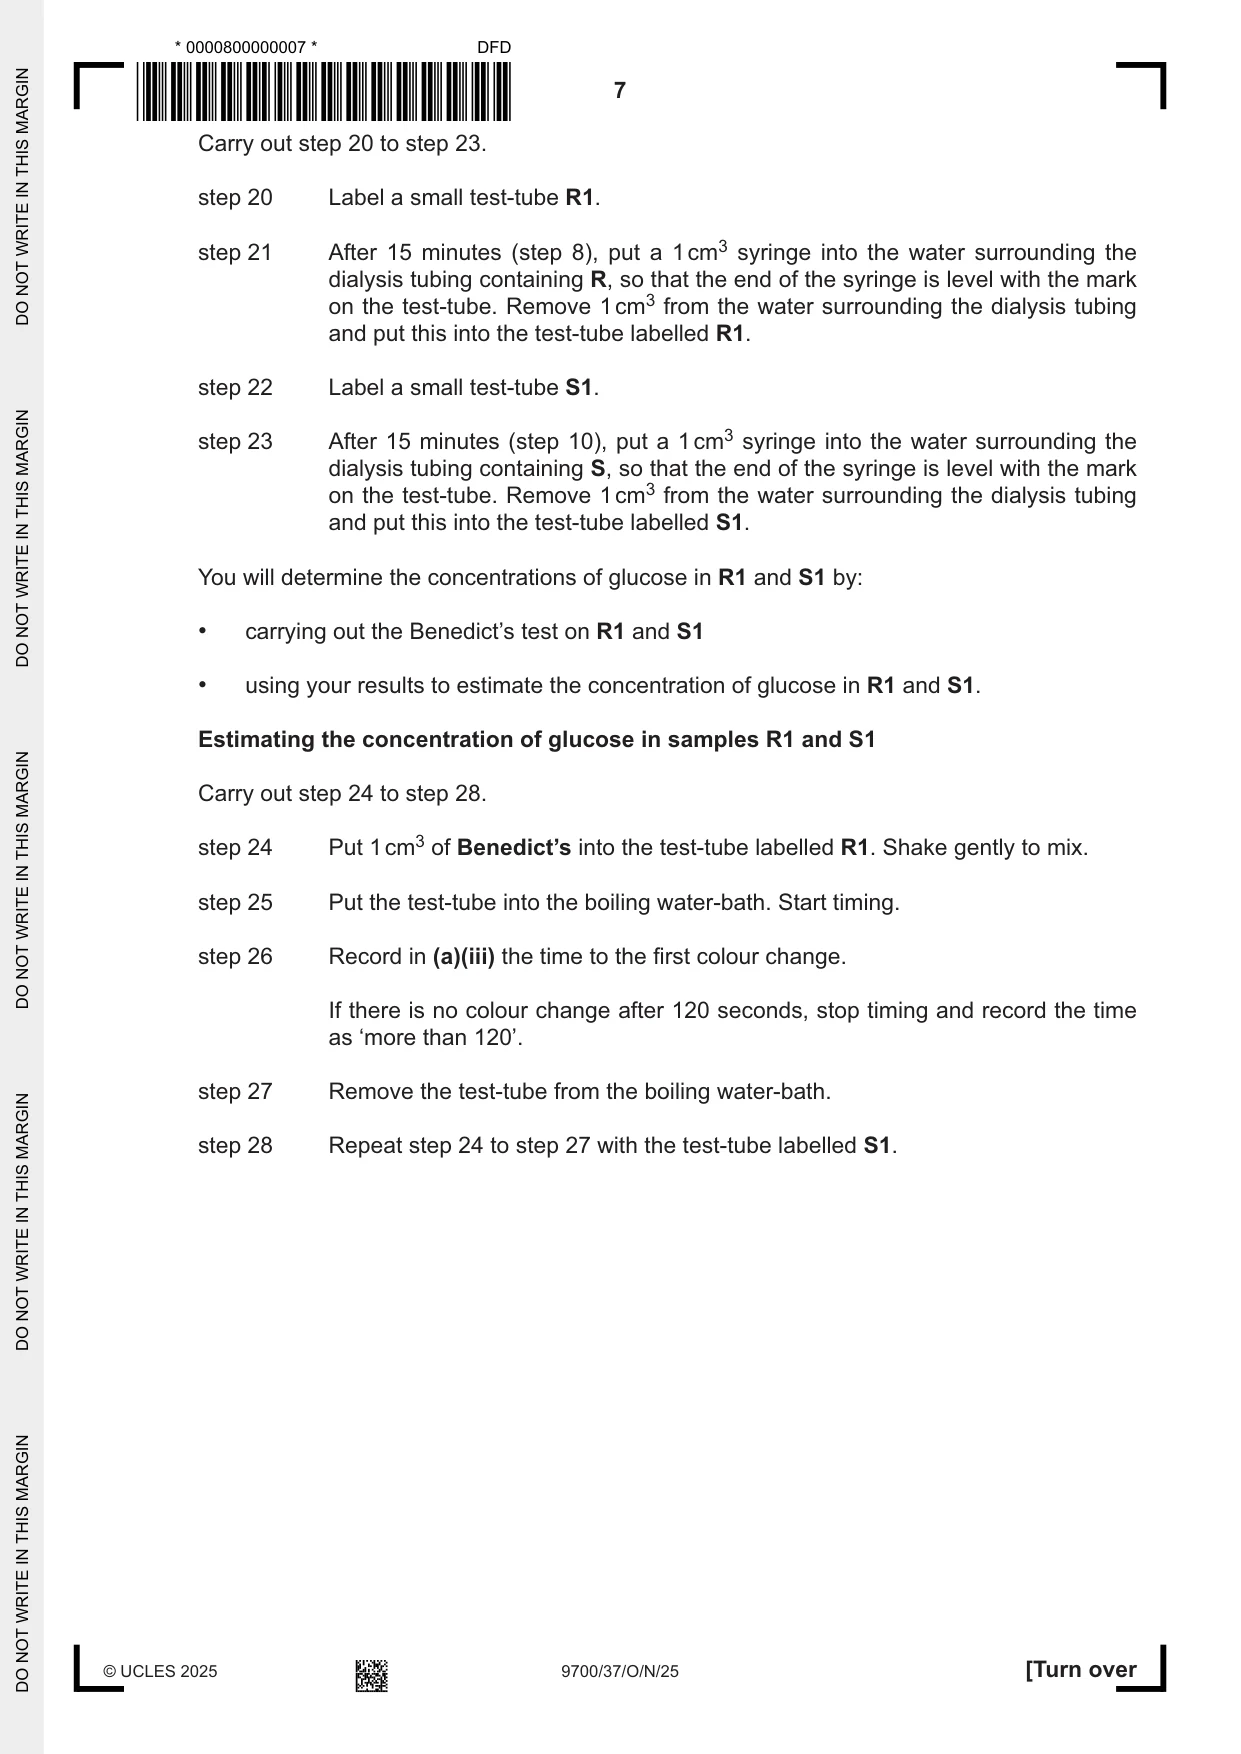
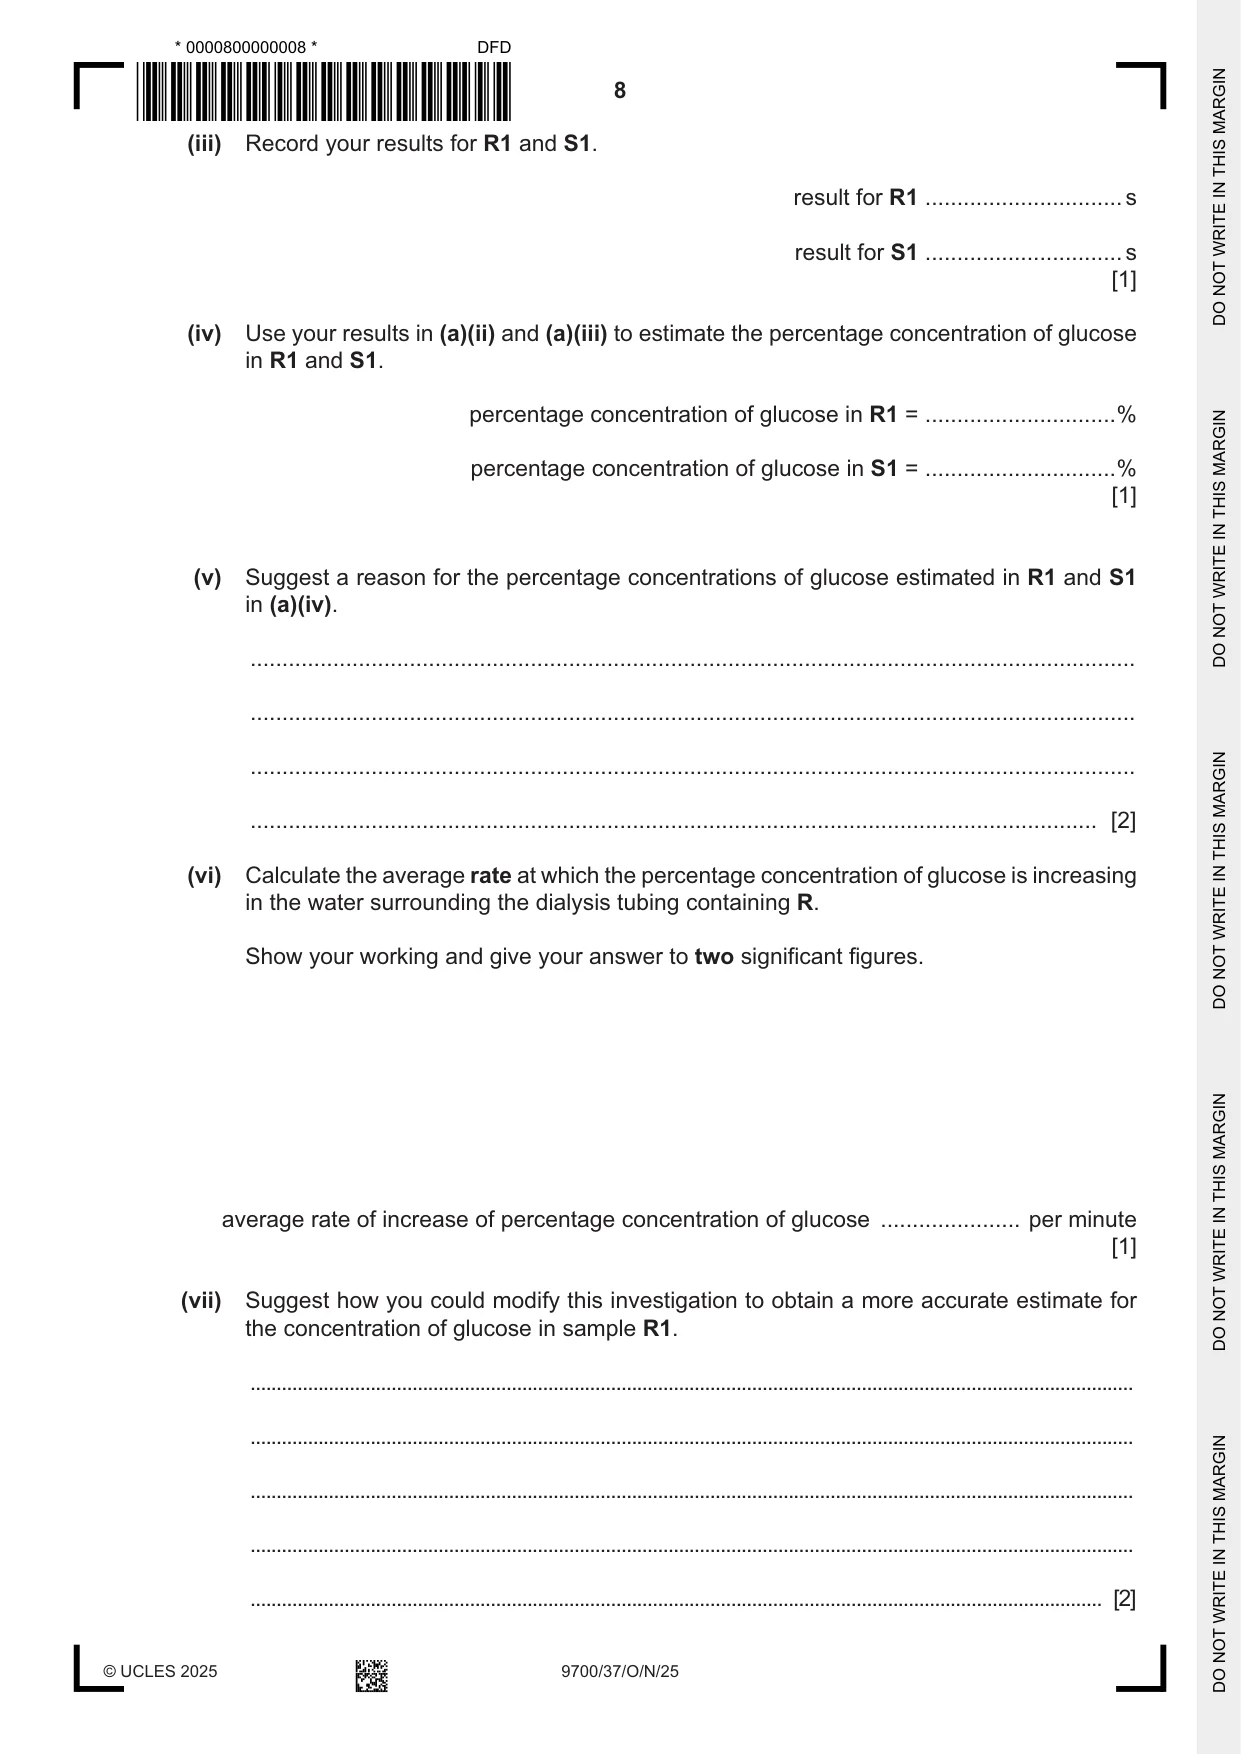
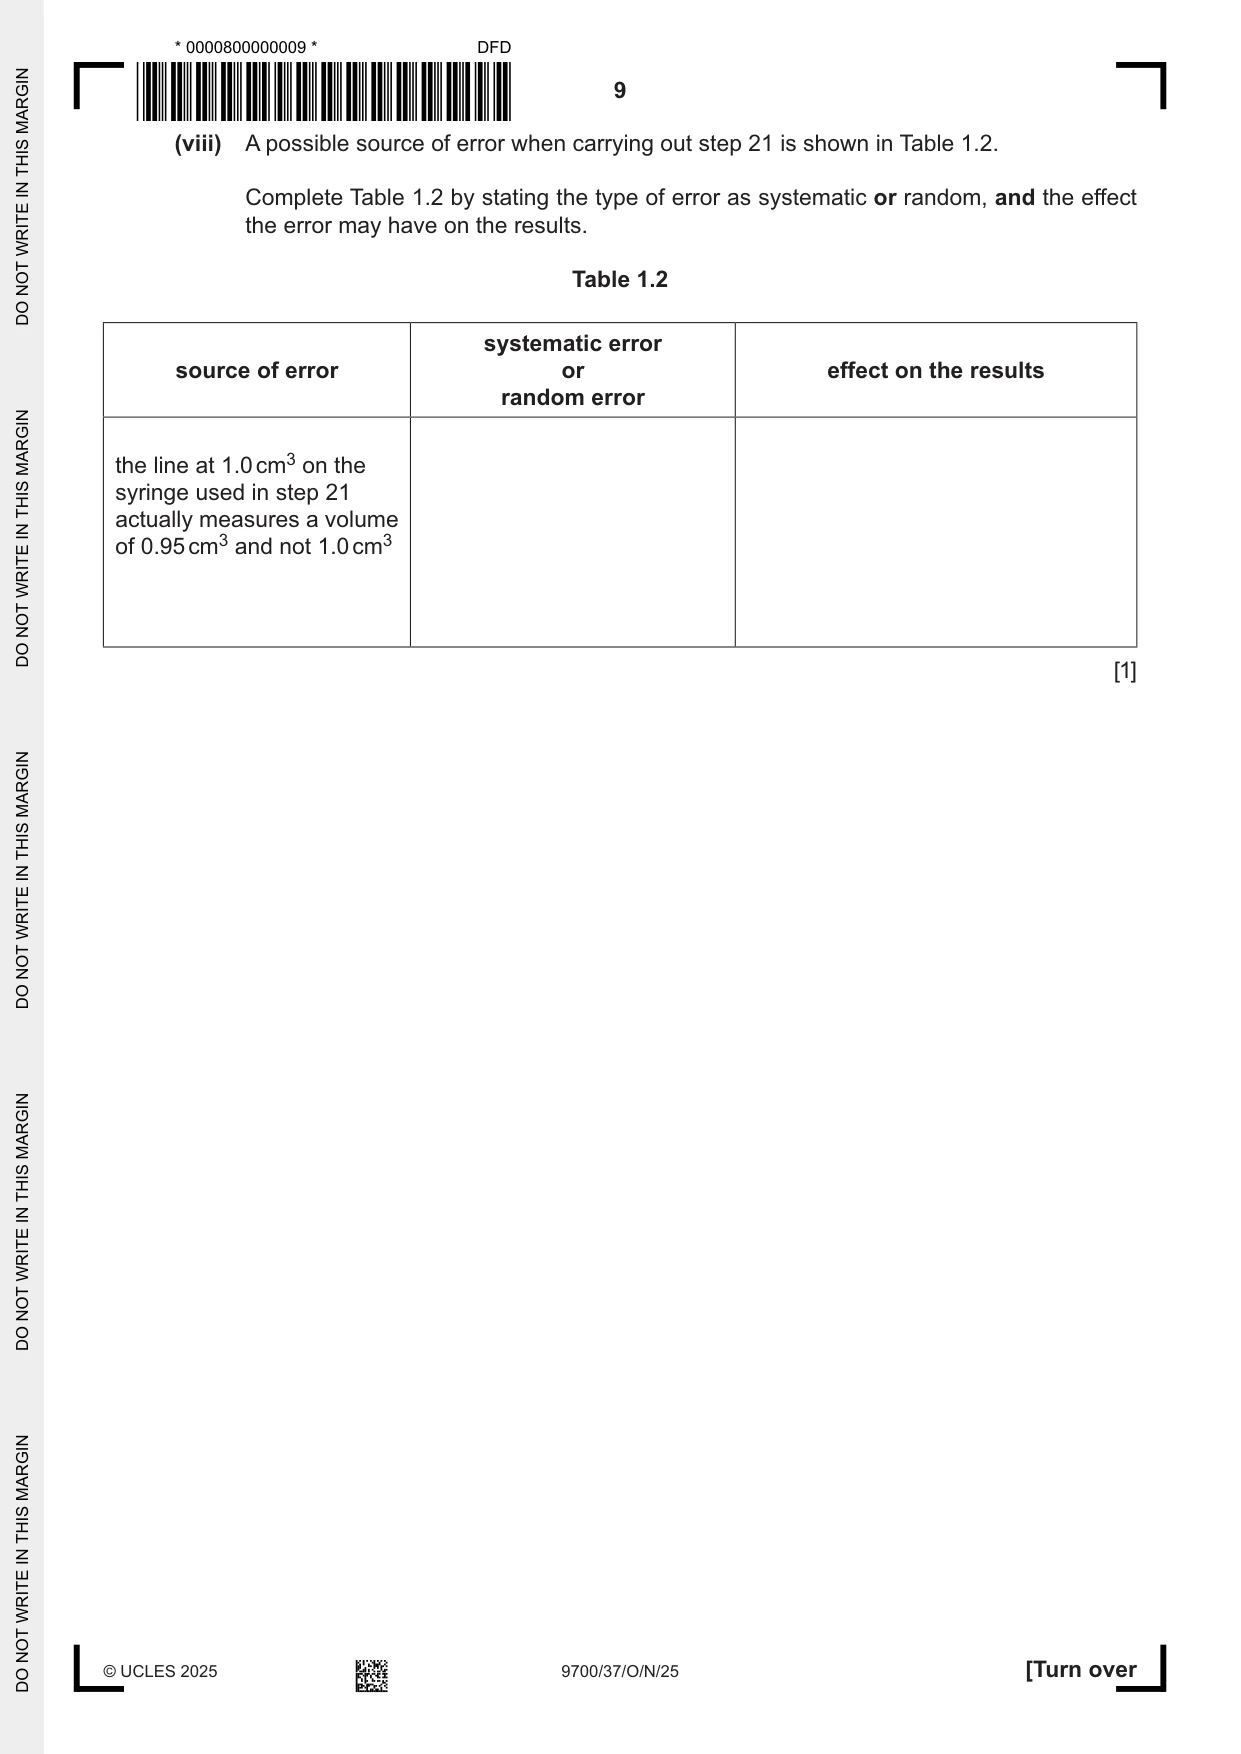
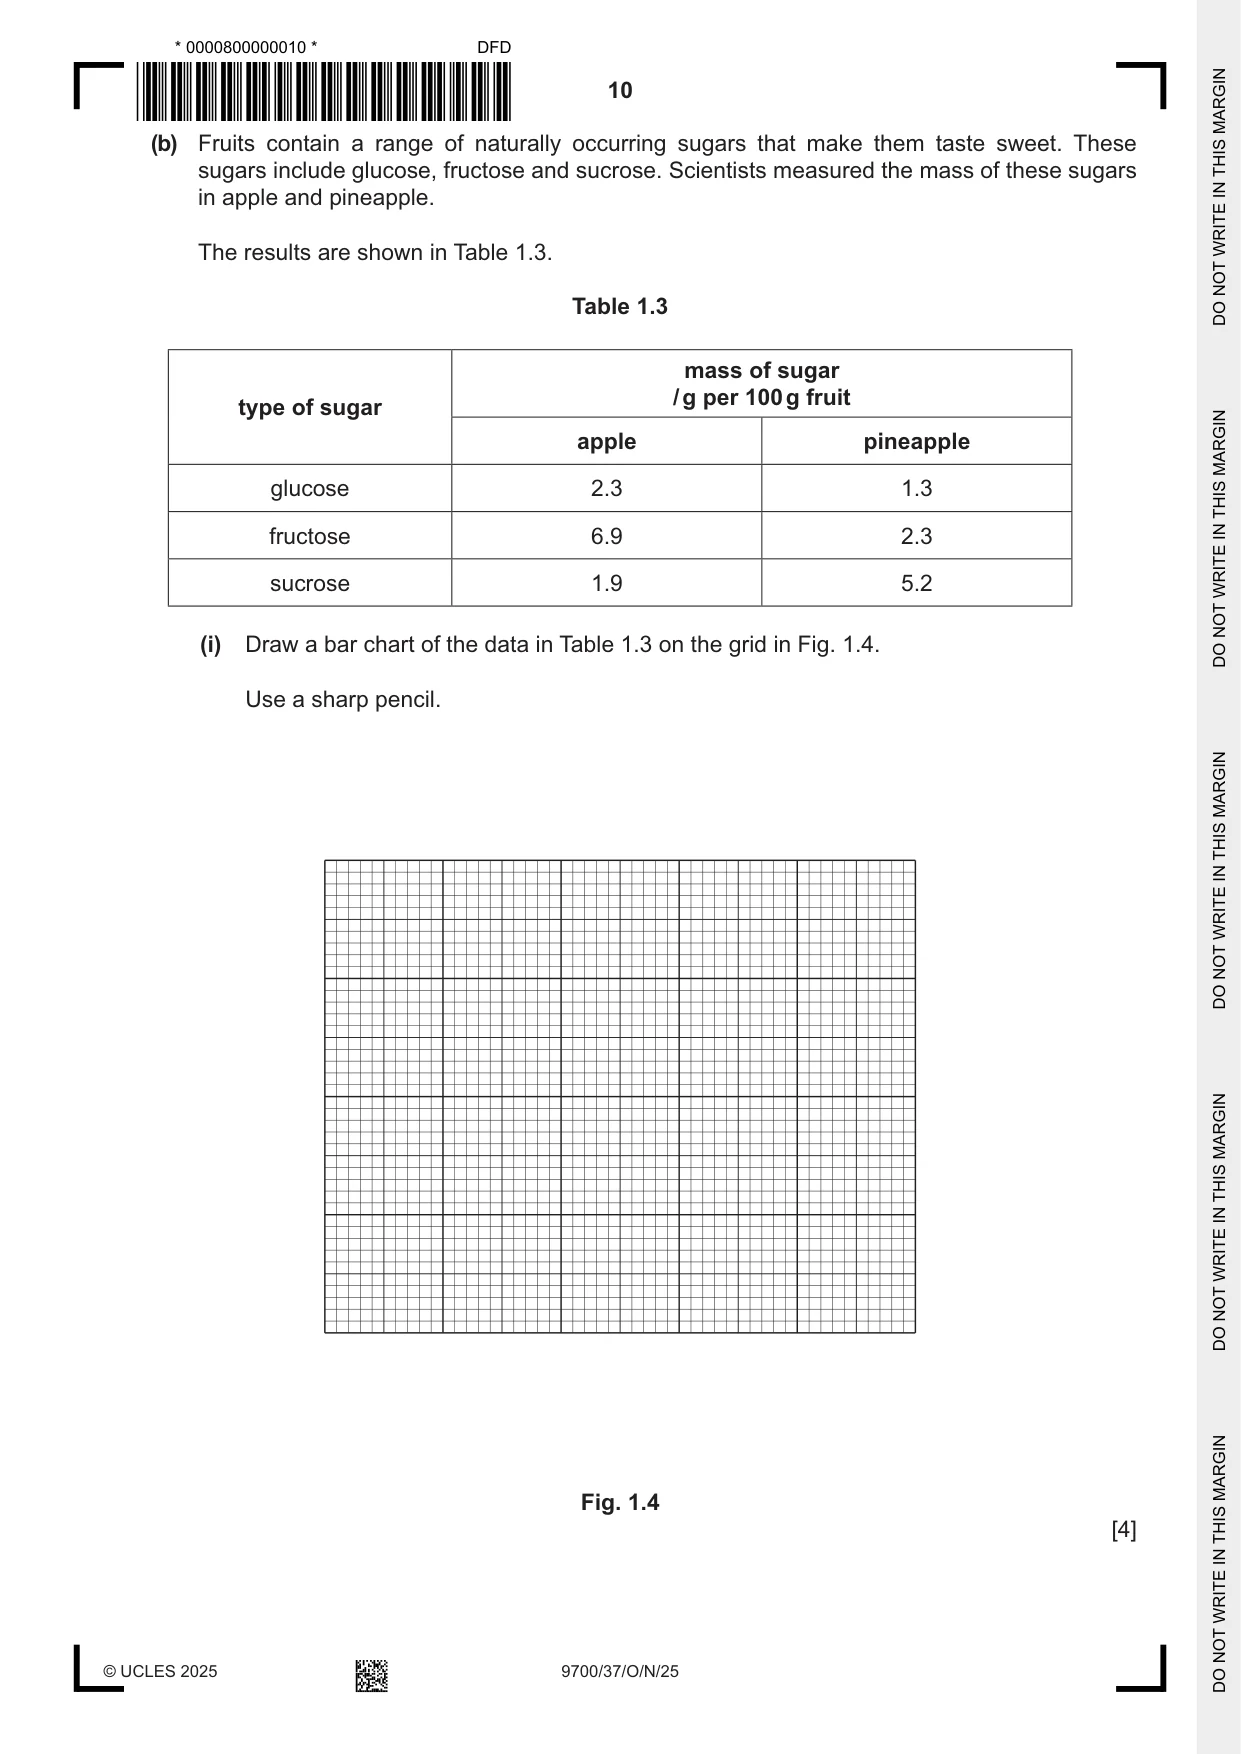
1 Dialysis tubing is a partially permeable membrane. Some molecules such as glucose molecules can diffuse through pores in the membrane. You are required to investigate the diffusion of glucose through the pores in dialysis tubing using two different concentrations of glucose. You are provided with the materials shown in Table 1.1. Table 1.1 labelled contents hazard volume / cm3 R 20.0% glucose solution low 20 S 10.0% glucose solution low 20 G 1.0% glucose solution low 30 W distilled water low 100 Benedict’s Benedict’s solution harmful irritant 20 length of dialysis tubing D1 low – in distilled water length of dialysis tubing D2 low – in distilled water If any solution comes into contact with your skin, wash off immediately with cold water. It is recommended that you wear suitable eye protection. You will need to: • put two different concentrations of glucose solution into dialysis tubing surrounded by water • take a sample of the water surrounding the dialysis tubing • test the sample for the presence of glucose. Carry out step 1 to step 10. step 1 Draw a mark 8 cm from the top of a large test‑tube, as shown in Fig. 1.1. 8 cm mark 8 cm from the top Fig. 1.1 step 2 Remove the dialysis tubing from beaker D1. Tie a knot in the dialysis tubing as close as possible to one end, so that the end is sealed. step 3 The whole length of the dialysis tubing needs to be separated to allow the tubing to be filled with solution. To do this, rub the whole length of the dialysis tubing gently between your finger and thumb. step 4 Put 10 cm3 of 20.0% glucose solution, R, into the open end of the dialysis tubing. step 5 Rinse the outside of the dialysis tubing by dipping it in the water in beaker D1. step 6 Put the dialysis tubing containing R into the large test‑tube and keep it in position using an elastic band as shown in Fig. 1.2. elastic band large test-tube dialysis tubing mark on test-tube 10 cm3 of glucose solution knot Fig. 1.2 step 7 Put distilled water into the large test‑tube so that the top of the water is above the level of the glucose solution in the dialysis tubing. step 8 Start timing and leave the dialysis tubing in the distilled water for 15 minutes. step 9 Repeat step 1 to step 7 using the dialysis tubing in the container labelled D2 and the 10.0% glucose solution, S, instead of R. step 10 Start timing and leave the dialysis tubing in the distilled water for 15 minutes. While you are waiting, continue with preparing the glucose standards. Preparing glucose standards You will need to carry out a serial dilution of the 1.0% glucose solution, G, to reduce the concentration by half between each successive dilution. You will need to prepare four concentrations of glucose solution in addition to the 1.0% glucose solution, G. After the serial dilution is completed, you will need to have 10 cm3 of each concentration available to use. (a) (i) Complete Fig. 1.3 to show how you will prepare your serial dilution. Each beaker should have: • a labelled arrow to show the volume of glucose solution transferred • a labelled arrow to show the volume of distilled water, W, added • a label under the beaker to show the concentration of glucose solution. 0 cm3 of W 20 cm3 of 1.0% glucose solution, G 1.0% glucose solution Fig. 1.3 [3] Carry out step 11 to step 19. step 11 Set up a boiling water‑bath ready for step 16. step 12 Prepare the concentrations of glucose solutions as shown in Fig. 1.3. step 13 Label 5 test‑tubes with the concentrations prepared in step 12. step 14 Put 1 cm3 of each glucose concentration into the appropriately labelled test‑tube. step 15 Put 1 cm3 of Benedict’s into each of the test‑tubes. Shake gently to mix. step 16 Put the test‑tube containing 1.0% glucose solution into the boiling water‑bath. Start timing. step 17 Record in (a)(ii) the time to the first colour change. If there is no colour change after 120 seconds, stop timing and record the time as ‘more than 120’. step 18 Remove the test‑tube from the boiling water‑bath. step 19 Repeat step 16 to step 18 with the other glucose concentrations. You will need the boiling water‑bath again in step 25. (ii) Record your results in an appropriate table. [5] Carry out step 20 to step 23. step 20 Label a small test‑tube R1. step 21 After 15 minutes (step 8), put a 1 cm3 syringe into the water surrounding the dialysis tubing containing R, so that the end of the syringe is level with the mark on the test‑tube. Remove 1 cm3 from the water surrounding the dialysis tubing and put this into the test‑tube labelled R1. step 22 Label a small test‑tube S1. step 23 After 15 minutes (step 10), put a 1 cm3 syringe into the water surrounding the dialysis tubing containing S, so that the end of the syringe is level with the mark on the test‑tube. Remove 1 cm3 from the water surrounding the dialysis tubing and put this into the test‑tube labelled S1. You will determine the concentrations of glucose in R1 and S1 by: • carrying out the Benedict’s test on R1 and S1 • using your results to estimate the concentration of glucose in R1 and S1. Estimating the concentration of glucose in samples R1 and S1 Carry out step 24 to step 28. step 24 Put 1 cm3 of Benedict’s into the test‑tube labelled R1. Shake gently to mix. step 25 Put the test‑tube into the boiling water‑bath. Start timing. step 26 Record in (a)(iii) the time to the first colour change. If there is no colour change after 120 seconds, stop timing and record the time as ‘more than 120’. step 27 Remove the test‑tube from the boiling water‑bath. step 28 Repeat step 24 to step 27 with the test‑tube labelled S1. (iii) Record your results for R1 and S1. result for R1 ............................... s result for S1 ............................... s [1] (iv) Use your results in (a)(ii) and (a)(iii) to estimate the percentage concentration of glucose in R1 and S1. percentage concentration of glucose in R1 = ..............................% percentage concentration of glucose in S1 = ..............................% [1] (v) Suggest a reason for the percentage concentrations of glucose estimated in R1 and S1 in (a)(iv). ........................................................................................................................................... ........................................................................................................................................... ........................................................................................................................................... ..................................................................................................................................... [2] (vi) Calculate the average rate at which the percentage concentration of glucose is increasing in the water surrounding the dialysis tubing containing R. Show your working and give your answer to two significant figures. average rate of increase of percentage concentration of glucose ...................... per minute [1] (vii) Suggest how you could modify this investigation to obtain a more accurate estimate for the concentration of glucose in sample R1. ......................................................................................................................................................................... ......................................................................................................................................................................... ......................................................................................................................................................................... ......................................................................................................................................................................... ................................................................................................................................................................... [2] (viii) A possible source of error when carrying out step 21 is shown in Table 1.2. Complete Table 1.2 by stating the type of error as systematic or random, and the effect the error may have on the results. Table 1.2 systematic error source of error or effect on the results random error the line at 1.0 cm3 on the syringe used in step 21 actually measures a volume of 0.95 cm3 and not 1.0 cm3 [1] (b) Fruits contain a range of naturally occurring sugars that make them taste sweet. These sugars include glucose, fructose and sucrose. Scientists measured the mass of these sugars in apple and pineapple. The results are shown in Table 1.3. Table 1.3 mass of sugar / g per 100 g fruit type of sugar apple pineapple glucose 2.3 1.3 fructose 6.9 2.3 sucrose 1.9 5.2 (i) Draw a bar chart of the data in Table 1.3 on the grid in Fig. 1.4. Use a sharp pencil. Fig. 1.4 [4] (ii) Calculate the percentage difference in the mass of sucrose per 100 g of pineapple compared to the mass of sucrose per 100 g of apple. Show your working. percentage difference in the mass of sucrose = ................................. [1] [Total: 21]
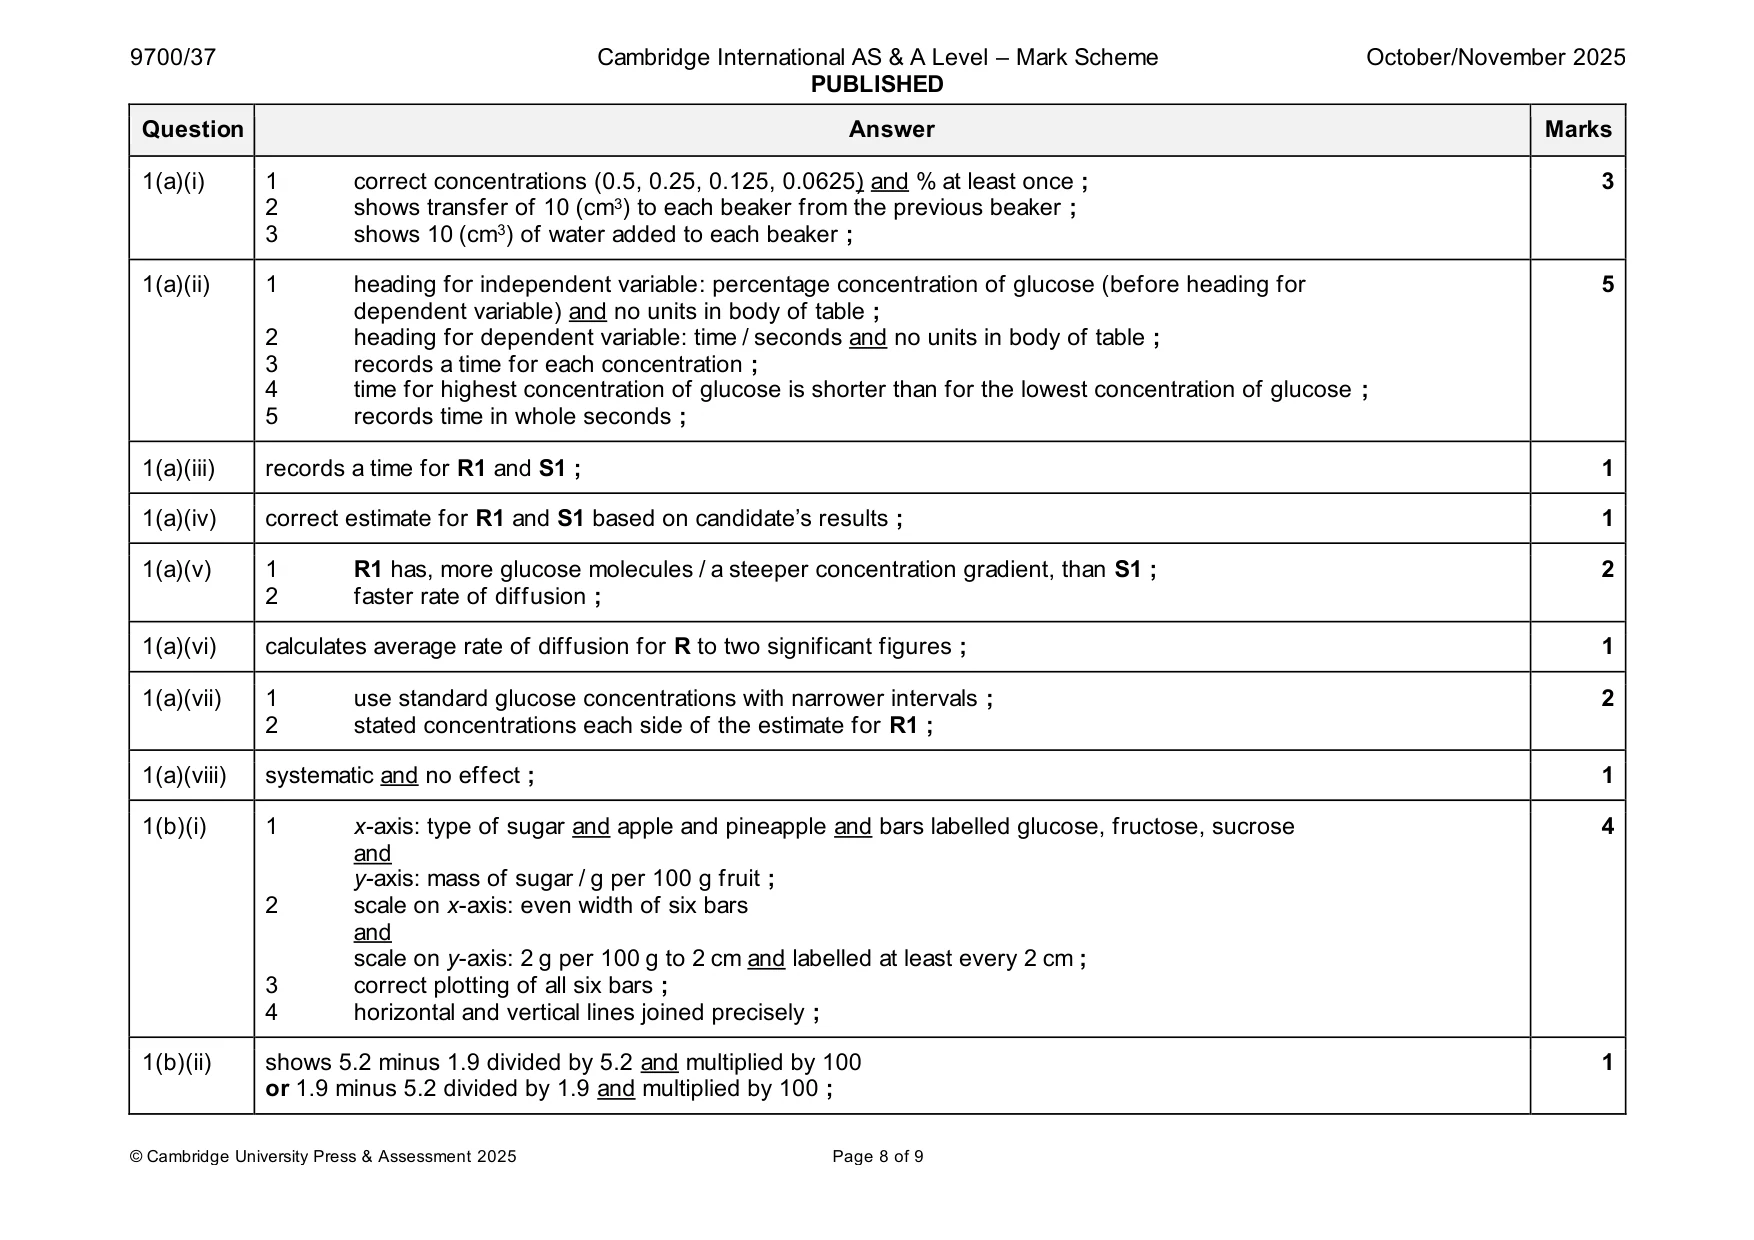
Mark scheme: Question Answer Marks 1(a)(i) 1 correct concentrations (0.5, 0.25, 0.125, 0.0625) and % at least once ; 3 2 shows transfer of 10 (cm3) to each beaker from the previous beaker ; 3 shows 10 (cm3) of water added to each beaker ; 1(a)(ii) 1 heading for independent variable: percentage concentration of glucose (before heading for 5 dependent variable) and no units in body of table ; 2 heading for dependent variable: time / seconds and no units in body of table ; 3 records a time for each concentration ; 4 time for highest concentration of glucose is shorter than for the lowest concentration of glucose ; 5 records time in whole seconds ; 1(a)(iii) records a time for R1 and S1 ; 1 1(a)(iv) correct estimate for R1 and S1 based on candidate’s results ; 1 1(a)(v) 1 R1 has, more glucose molecules / a steeper concentration gradient, than S1 ; 2 2 faster rate of diffusion ; 1(a)(vi) calculates average rate of diffusion for R to two significant figures ; 1 1(a)(vii) 1 use standard glucose concentrations with narrower intervals ; 2 2 stated concentrations each side of the estimate for R1 ; 1(a)(viii) systematic and no effect ; 1 1(b)(i) 1 x-axis: type of sugar and apple and pineapple and bars labelled glucose, fructose, sucrose 4 and y-axis: mass of sugar / g per 100 g fruit ; 2 scale on x-axis: even width of six bars and scale on y-axis: 2 g per 100 g to 2 cm and labelled at least every 2 cm ; 3 correct plotting of all six bars ; 4 horizontal and vertical lines joined precisely ; 1(b)(ii) shows 5.2 minus 1.9 divided by 5.2 and multiplied by 100 1 or 1.9 minus 5.2 divided by 1.9 and multiplied by 100 ;
Q2 · M1 is a slide of a stained transverse section through a plant stem
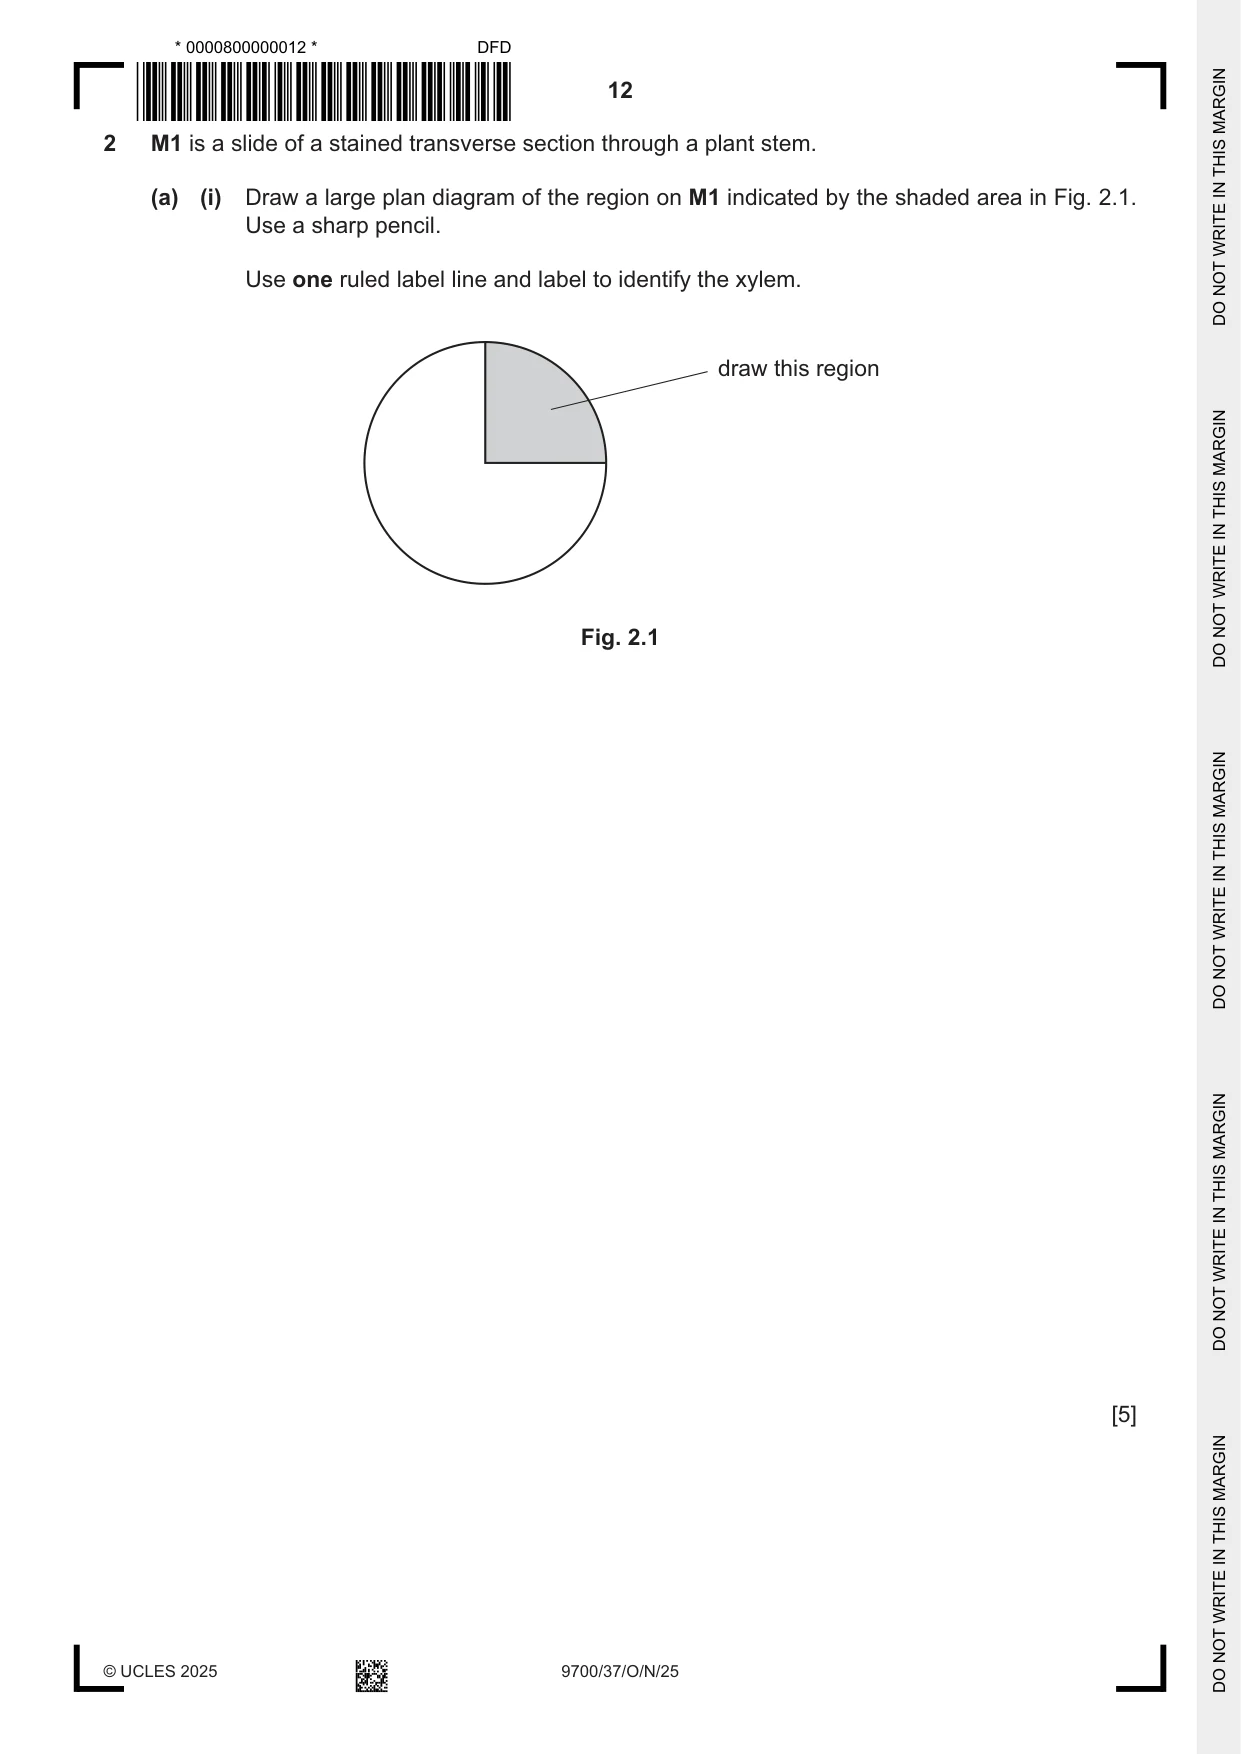
2 M1 is a slide of a stained transverse section through a plant stem. (a) (i) Draw a large plan diagram of the region on M1 indicated by the shaded area in Fig. 2.1. Use a sharp pencil. Use one ruled label line and label to identify the xylem. draw this region Fig. 2.1 [5] (ii) Observe the xylem vessel elements in the stem on M1. Select a group of four adjacent xylem vessel elements. Each xylem vessel element must touch at least one other xylem vessel element. • Make a large drawing of this group of four xylem vessel elements. • Use one ruled label line and label to identify the wall of one xylem vessel element. [5]
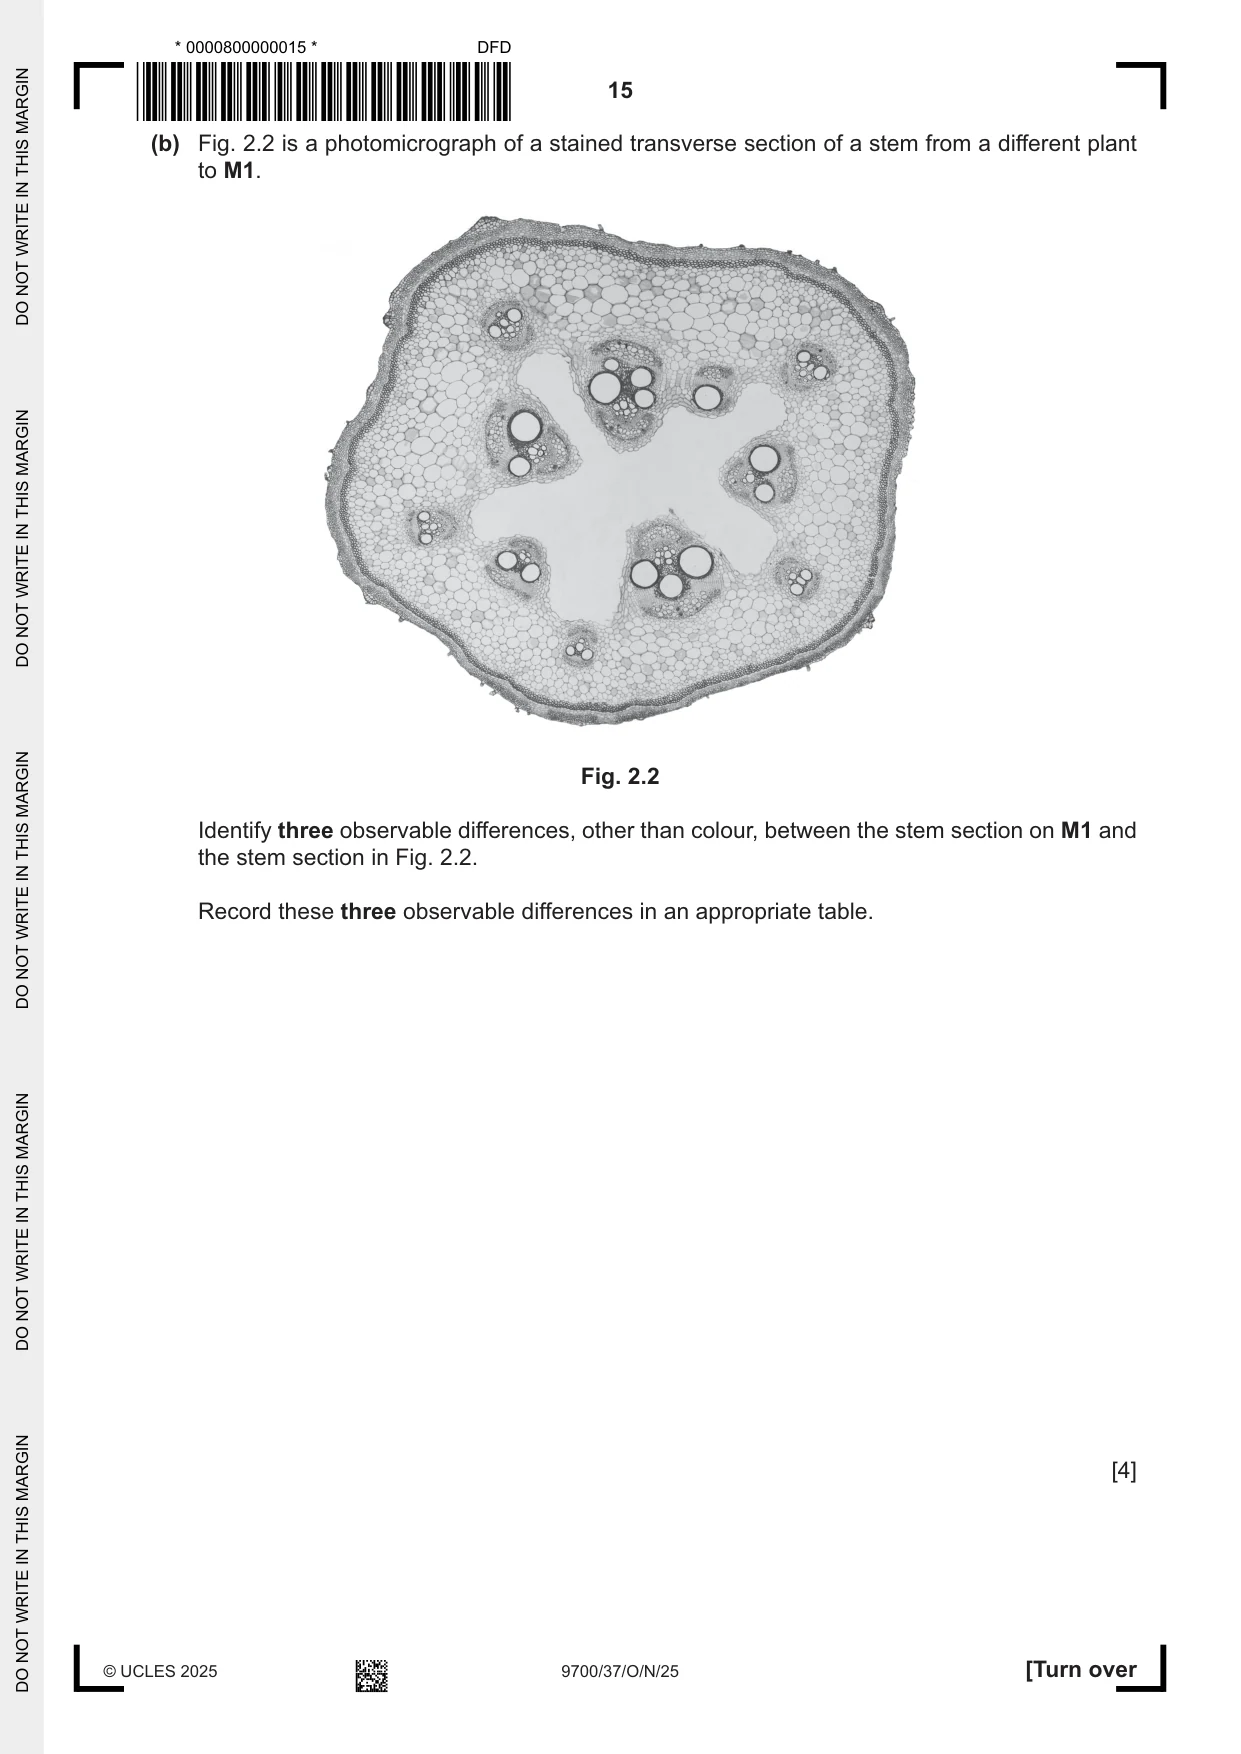
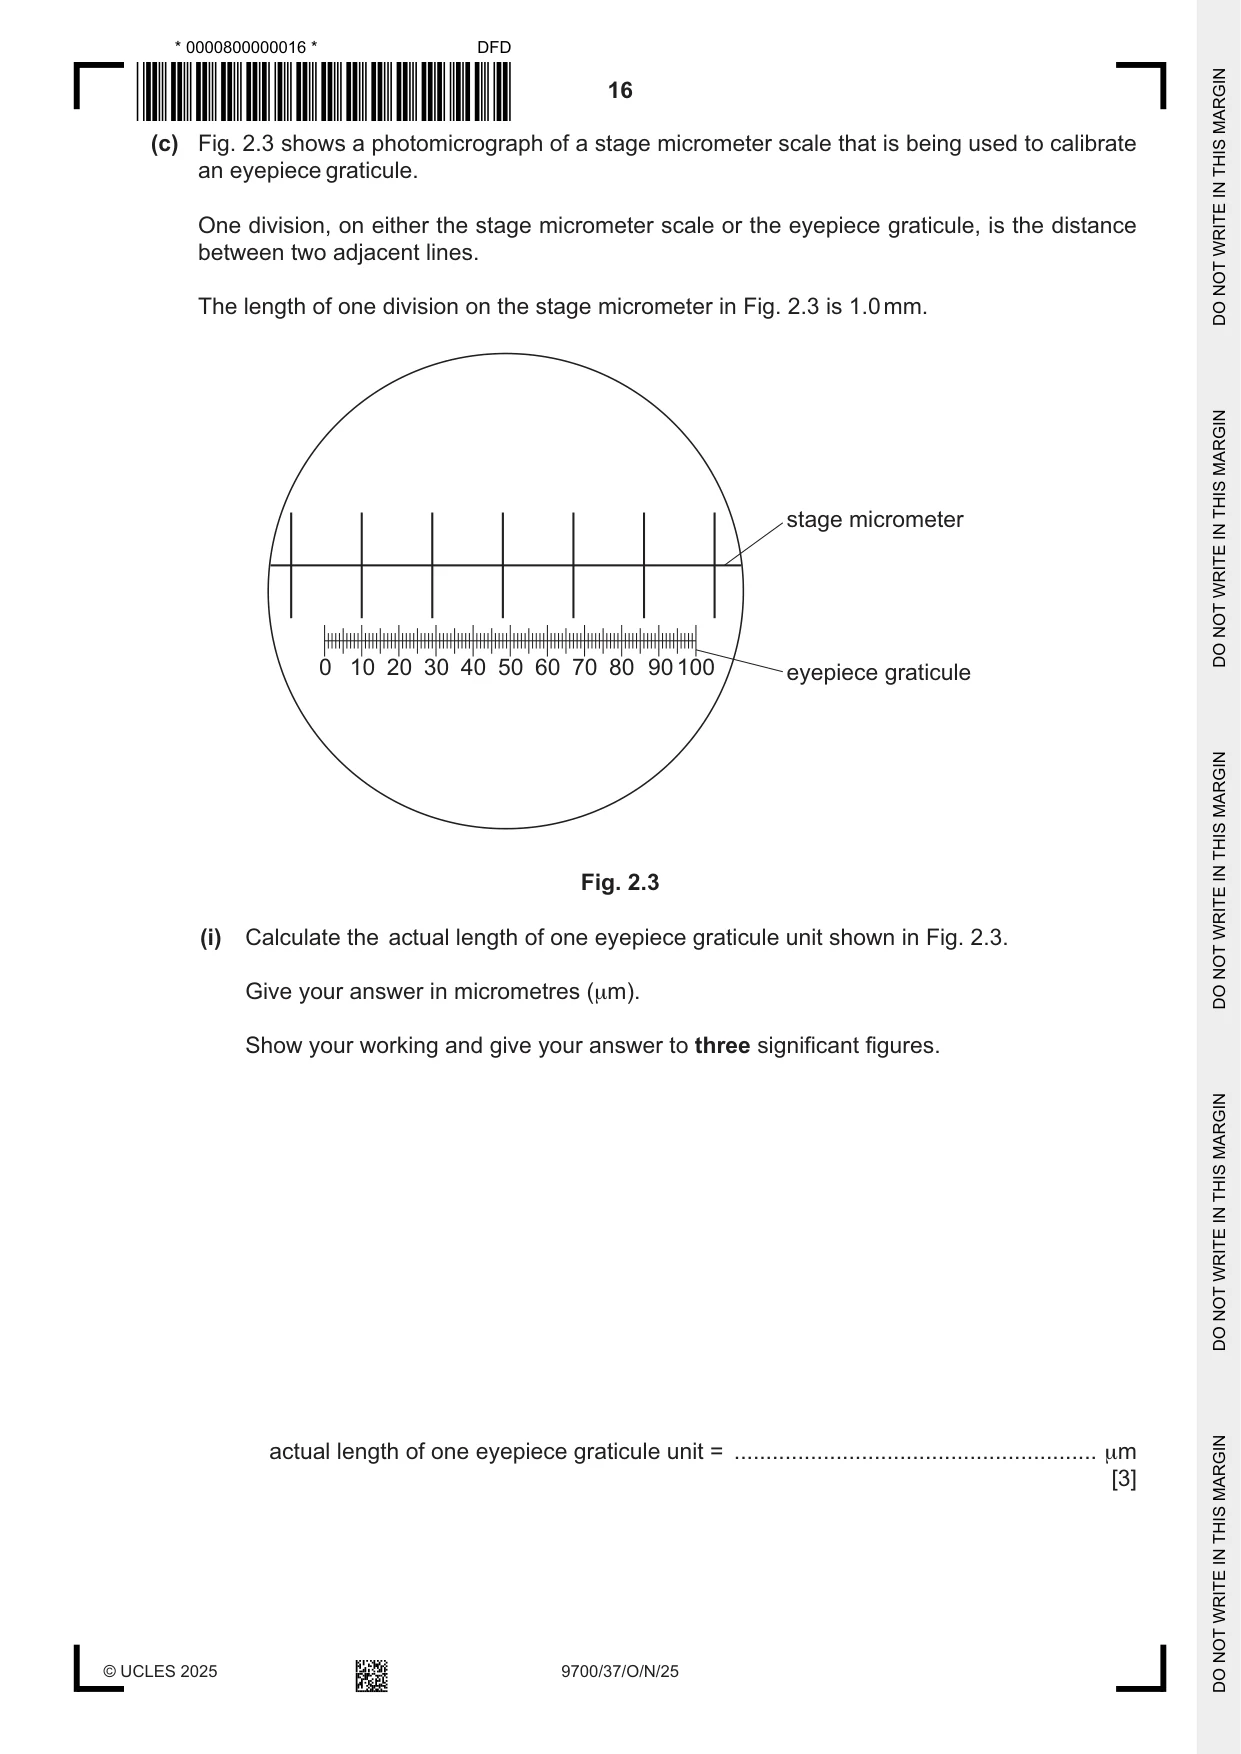
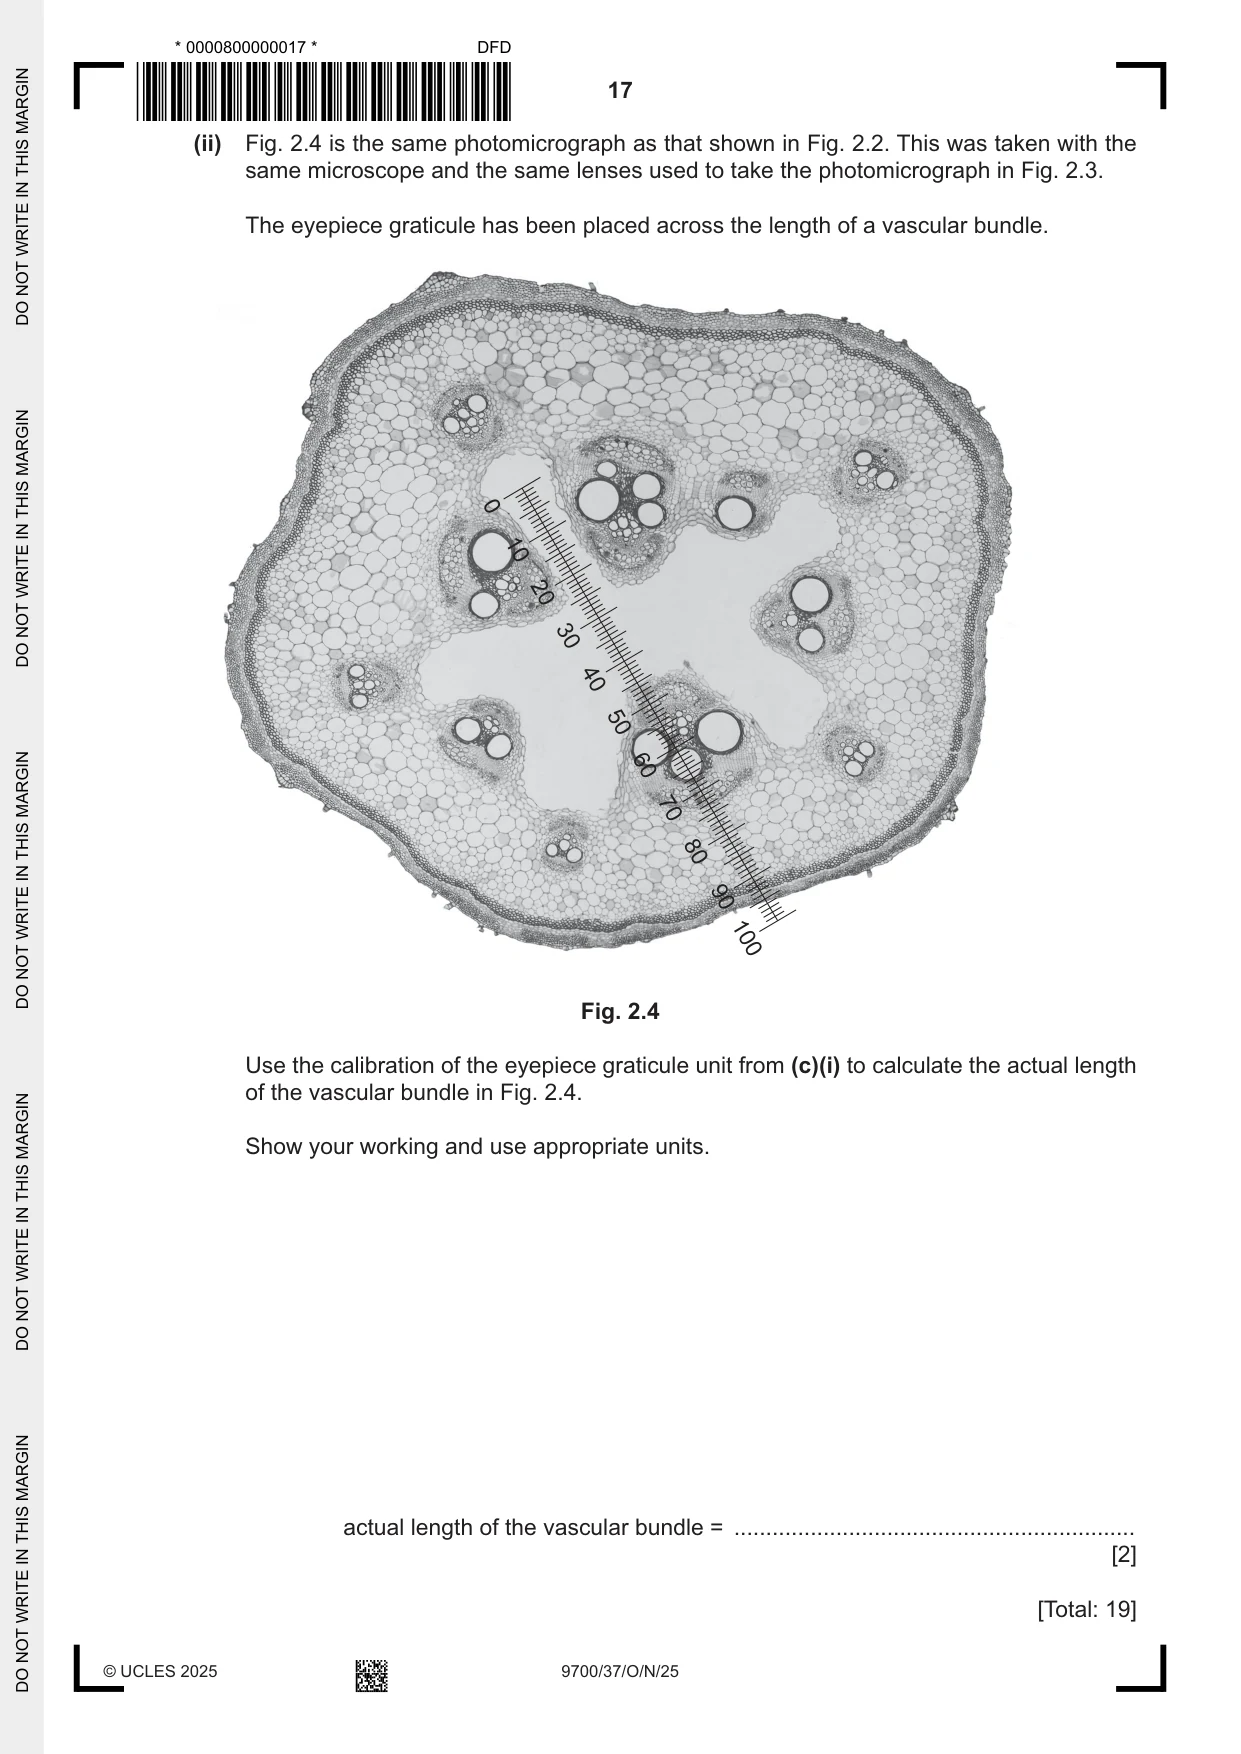
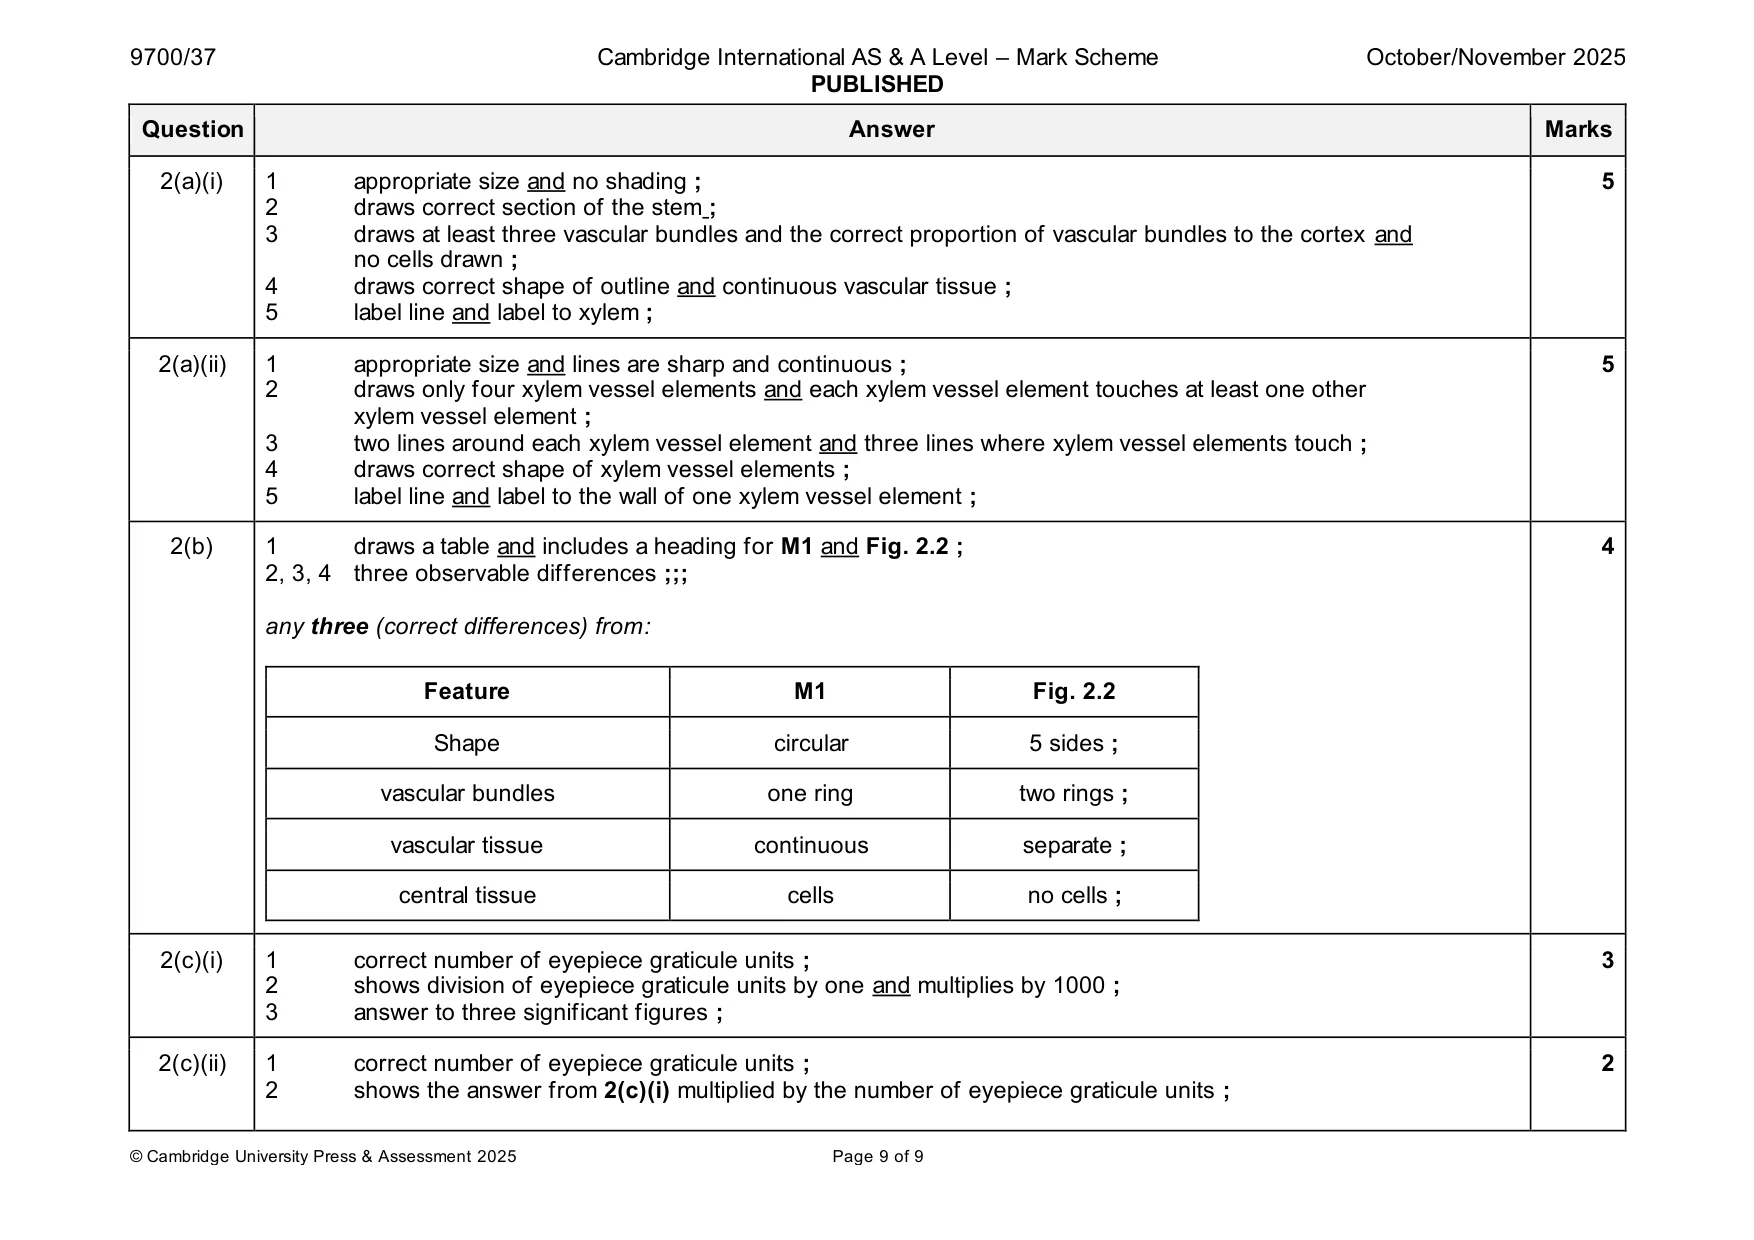
Mark scheme: 2(a)(i) 1 appropriate size and no shading ; 5 2 draws correct section of the stem ; 3 draws at least three vascular bundles and the correct proportion of vascular bundles to the cortex and no cells drawn ; 4 draws correct shape of outline and continuous vascular tissue ; 5 label line and label to xylem ; 2(a)(ii) 1 appropriate size and lines are sharp and continuous ; 5 2 draws only four xylem vessel elements and each xylem vessel element touches at least one other xylem vessel element ; 3 two lines around each xylem vessel element and three lines where xylem vessel elements touch ; 4 draws correct shape of xylem vessel elements ; 5 label line and label to the wall of one xylem vessel element ; 2(b) 1 draws a table and includes a heading for M1 and Fig. 2.2 ; 4 2, 3, 4 three observable differences ;;; any three (correct differences) from: Feature M1 Fig. 2.2 Shape circular 5 sides ; vascular bundles one ring two rings ; vascular tissue continuous separate ; central tissue cells no cells ; 2(c)(i) 1 correct number of eyepiece graticule units ; 3 2 shows division of eyepiece graticule units by one and multiplies by 1000 ; 3 answer to three significant figures ; 2(c)(ii) 1 correct number of eyepiece graticule units ; 2 2 shows the answer from 2(c)(i) multiplied by the number of eyepiece graticule units ;
What was in this paper
The subtopics covered by these 2 questions, and how many questions each got. Open one in a new tab to see every Cambridge question on it.
What you needed in this session
Cambridge’s own grade thresholds for 2025 Oct/Nov, Paper 3 · Variant 7. A higher threshold means an easier paper — the bar moves with how the cohort did.