Cambridge A Level Biology 9700 — 2025 May/June Paper 4 · Variant 4
9700/44/M/J/25 · 10 questions · 100 marks · 120 min
The question paper and its mark scheme, free to read here and free to download. This is Cambridge’s own paper, exactly as it was sat.
Question paper24 pages
Mark scheme27 pages
Answers below. Sit the paper first if you are practising.
Questions as text
Q1 · Describe how a decrease in the water potential of the blood leads to an increase in the…
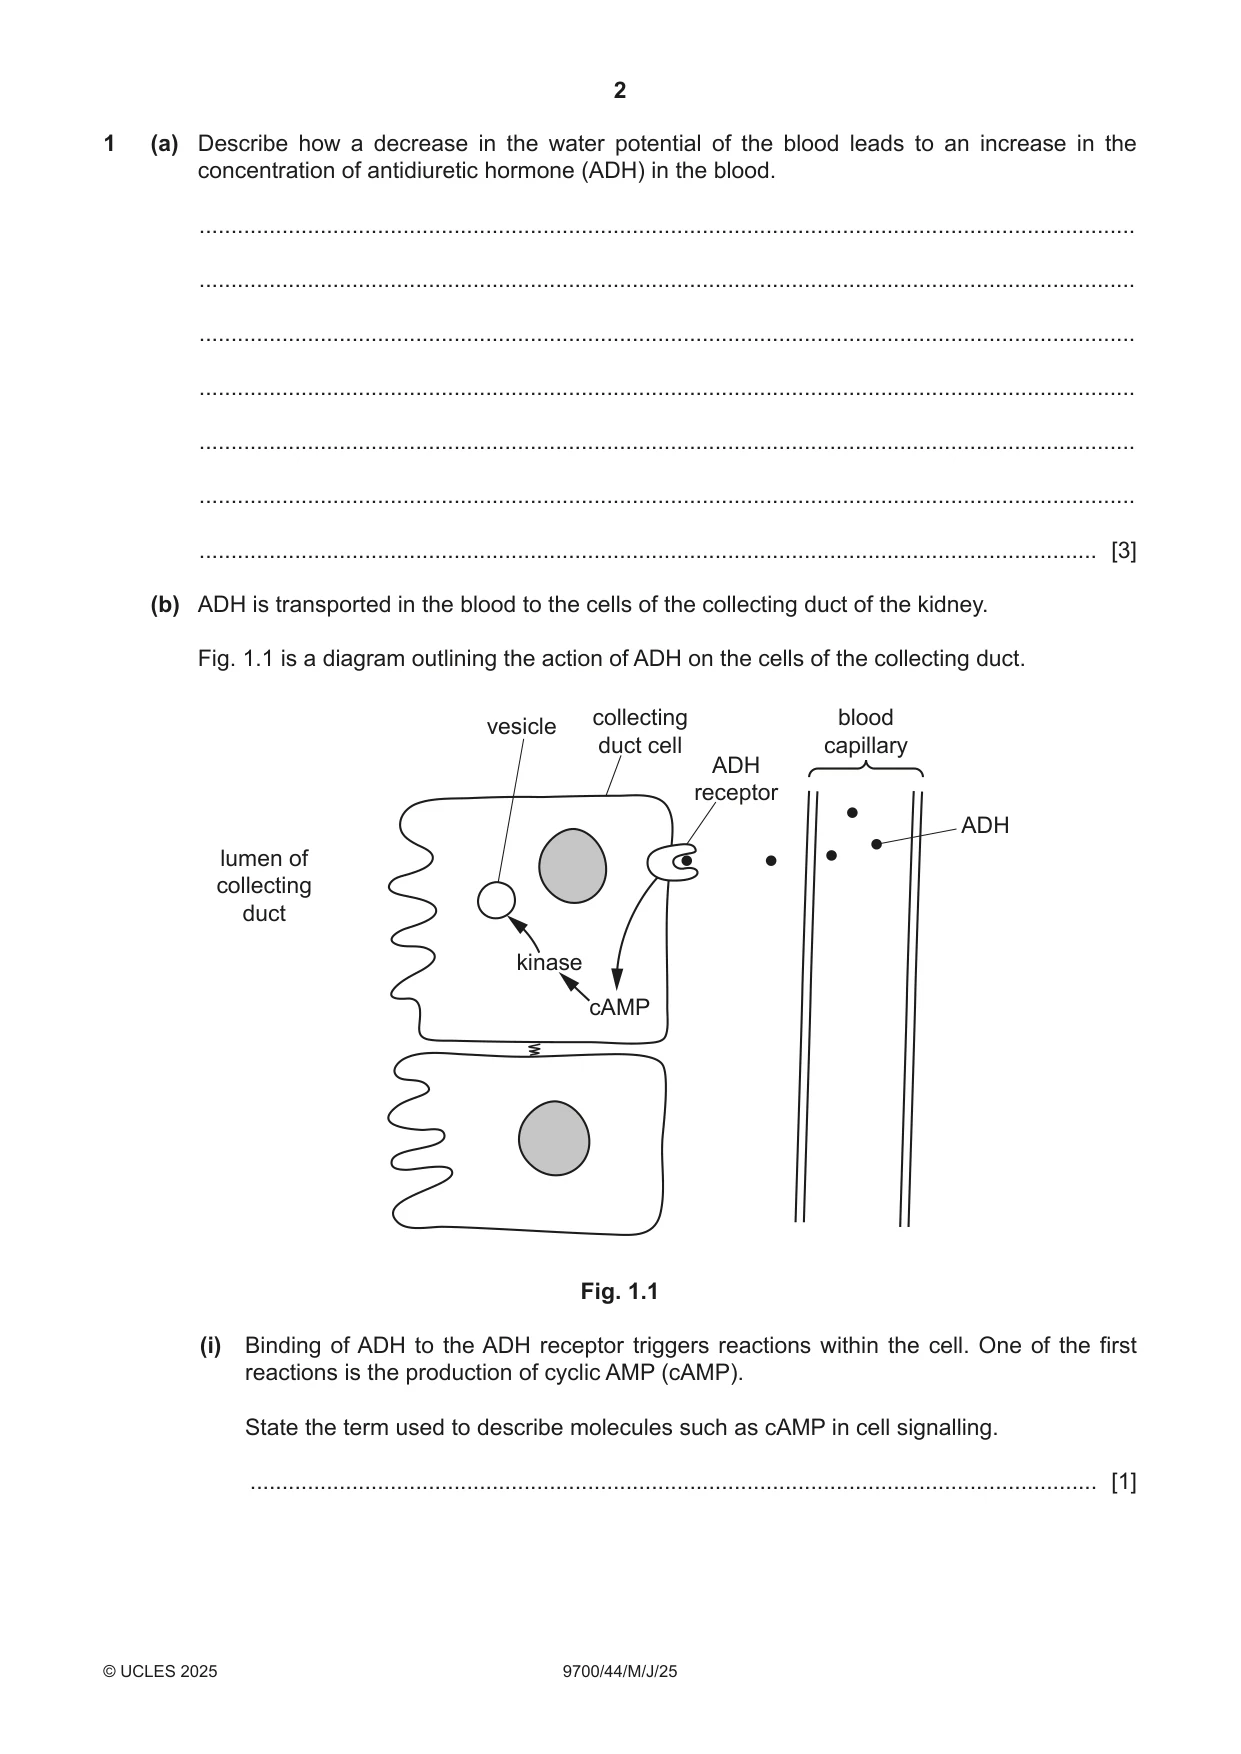
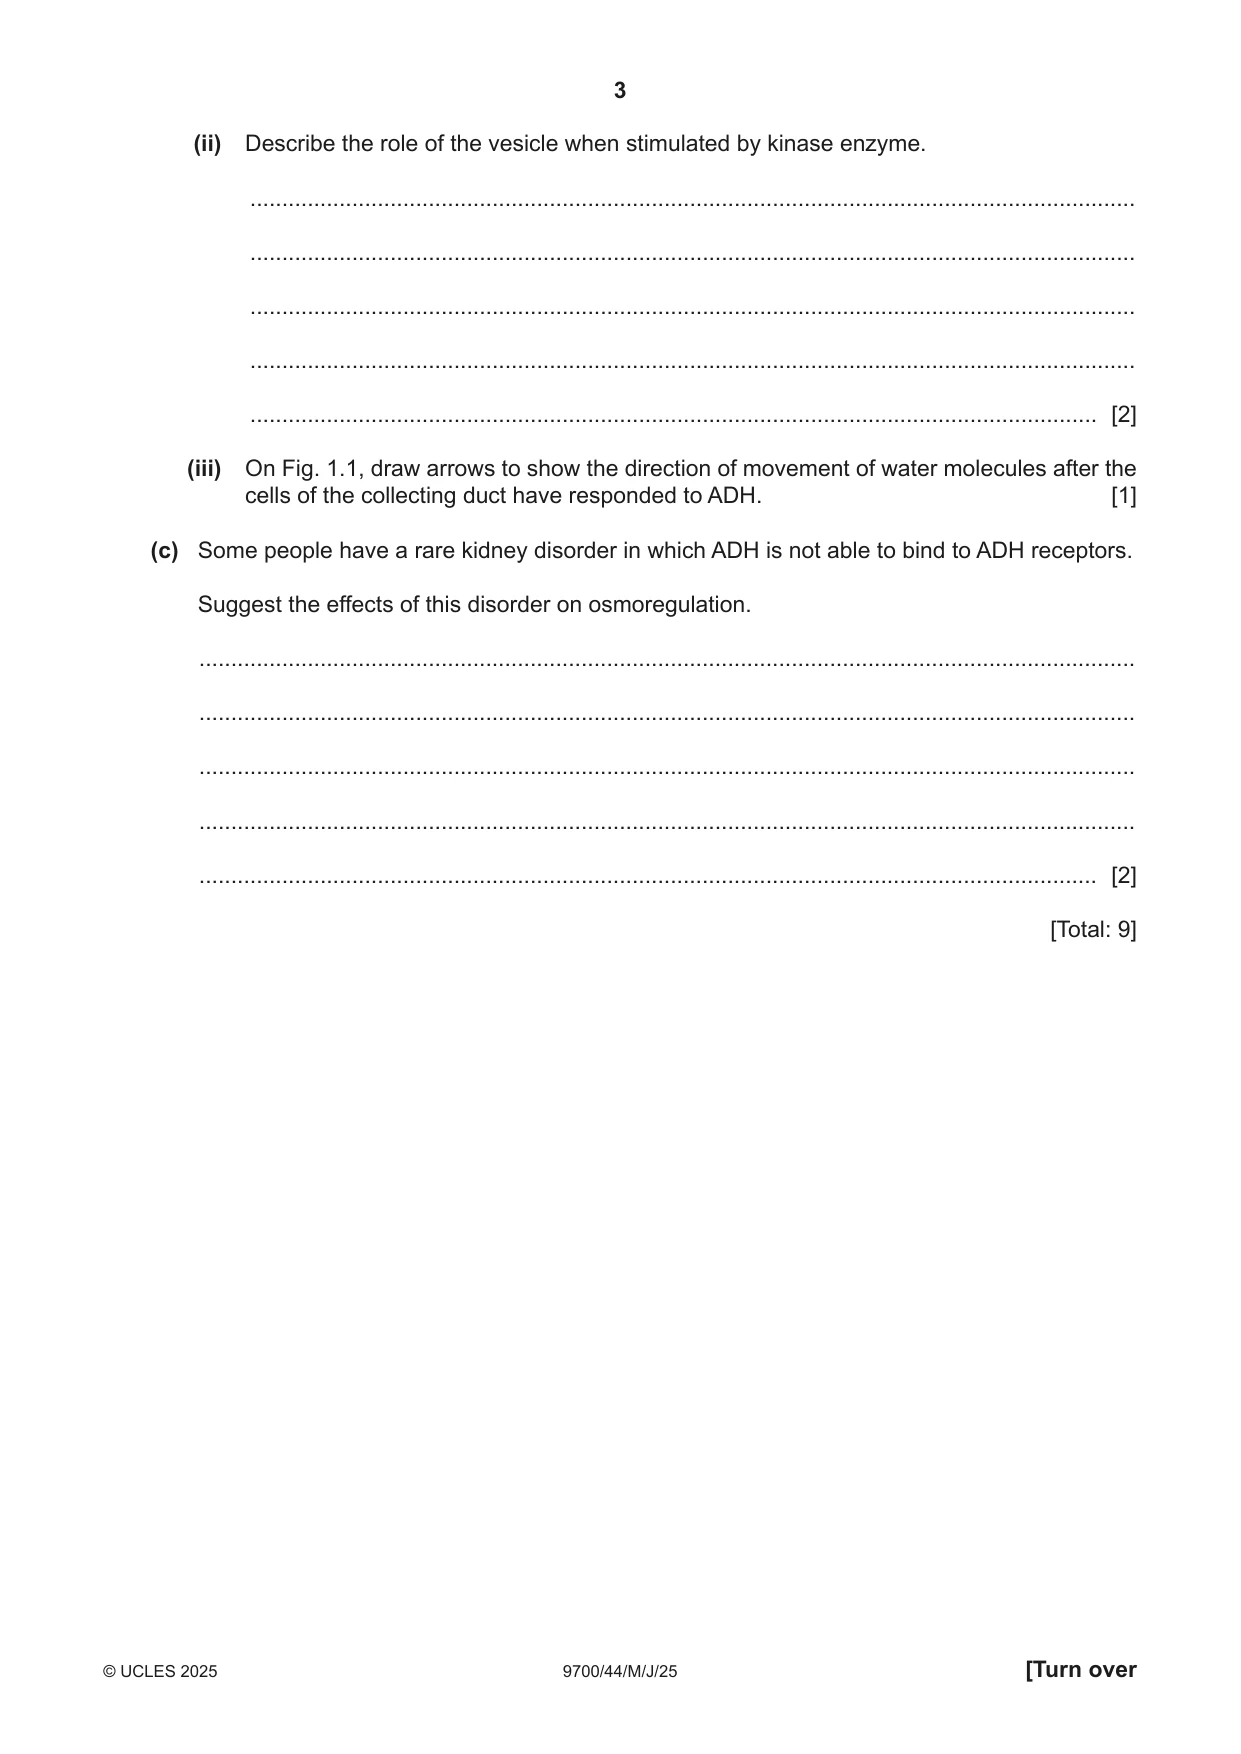
1 (a) Describe how a decrease in the water potential of the blood leads to an increase in the concentration of antidiuretic hormone (ADH) in the blood. ................................................................................................................................................... ................................................................................................................................................... ................................................................................................................................................... ................................................................................................................................................... ................................................................................................................................................... ................................................................................................................................................... ............................................................................................................................................. [3] (b) ADH is transported in the blood to the cells of the collecting duct of the kidney. Fig. 1.1 is a diagram outlining the action of ADH on the cells of the collecting duct. collecting blood vesicle duct cell capillary ADH receptor ADH lumen of collecting duct kinase cAMP Fig. 1.1 (i) Binding of ADH to the ADH receptor triggers reactions within the cell. One of the first reactions is the production of cyclic AMP (cAMP). State the term used to describe molecules such as cAMP in cell signalling. ..................................................................................................................................... [1] (ii) Describe the role of the vesicle when stimulated by kinase enzyme. ........................................................................................................................................... ........................................................................................................................................... ........................................................................................................................................... ........................................................................................................................................... ..................................................................................................................................... [2] (iii) On Fig. 1.1, draw arrows to show the direction of movement of water molecules after the cells of the collecting duct have responded to ADH. [1] (c) Some people have a rare kidney disorder in which ADH is not able to bind to ADH receptors. Suggest the effects of this disorder on osmoregulation. ................................................................................................................................................... ................................................................................................................................................... ................................................................................................................................................... ................................................................................................................................................... ............................................................................................................................................. [2] [Total: 9]
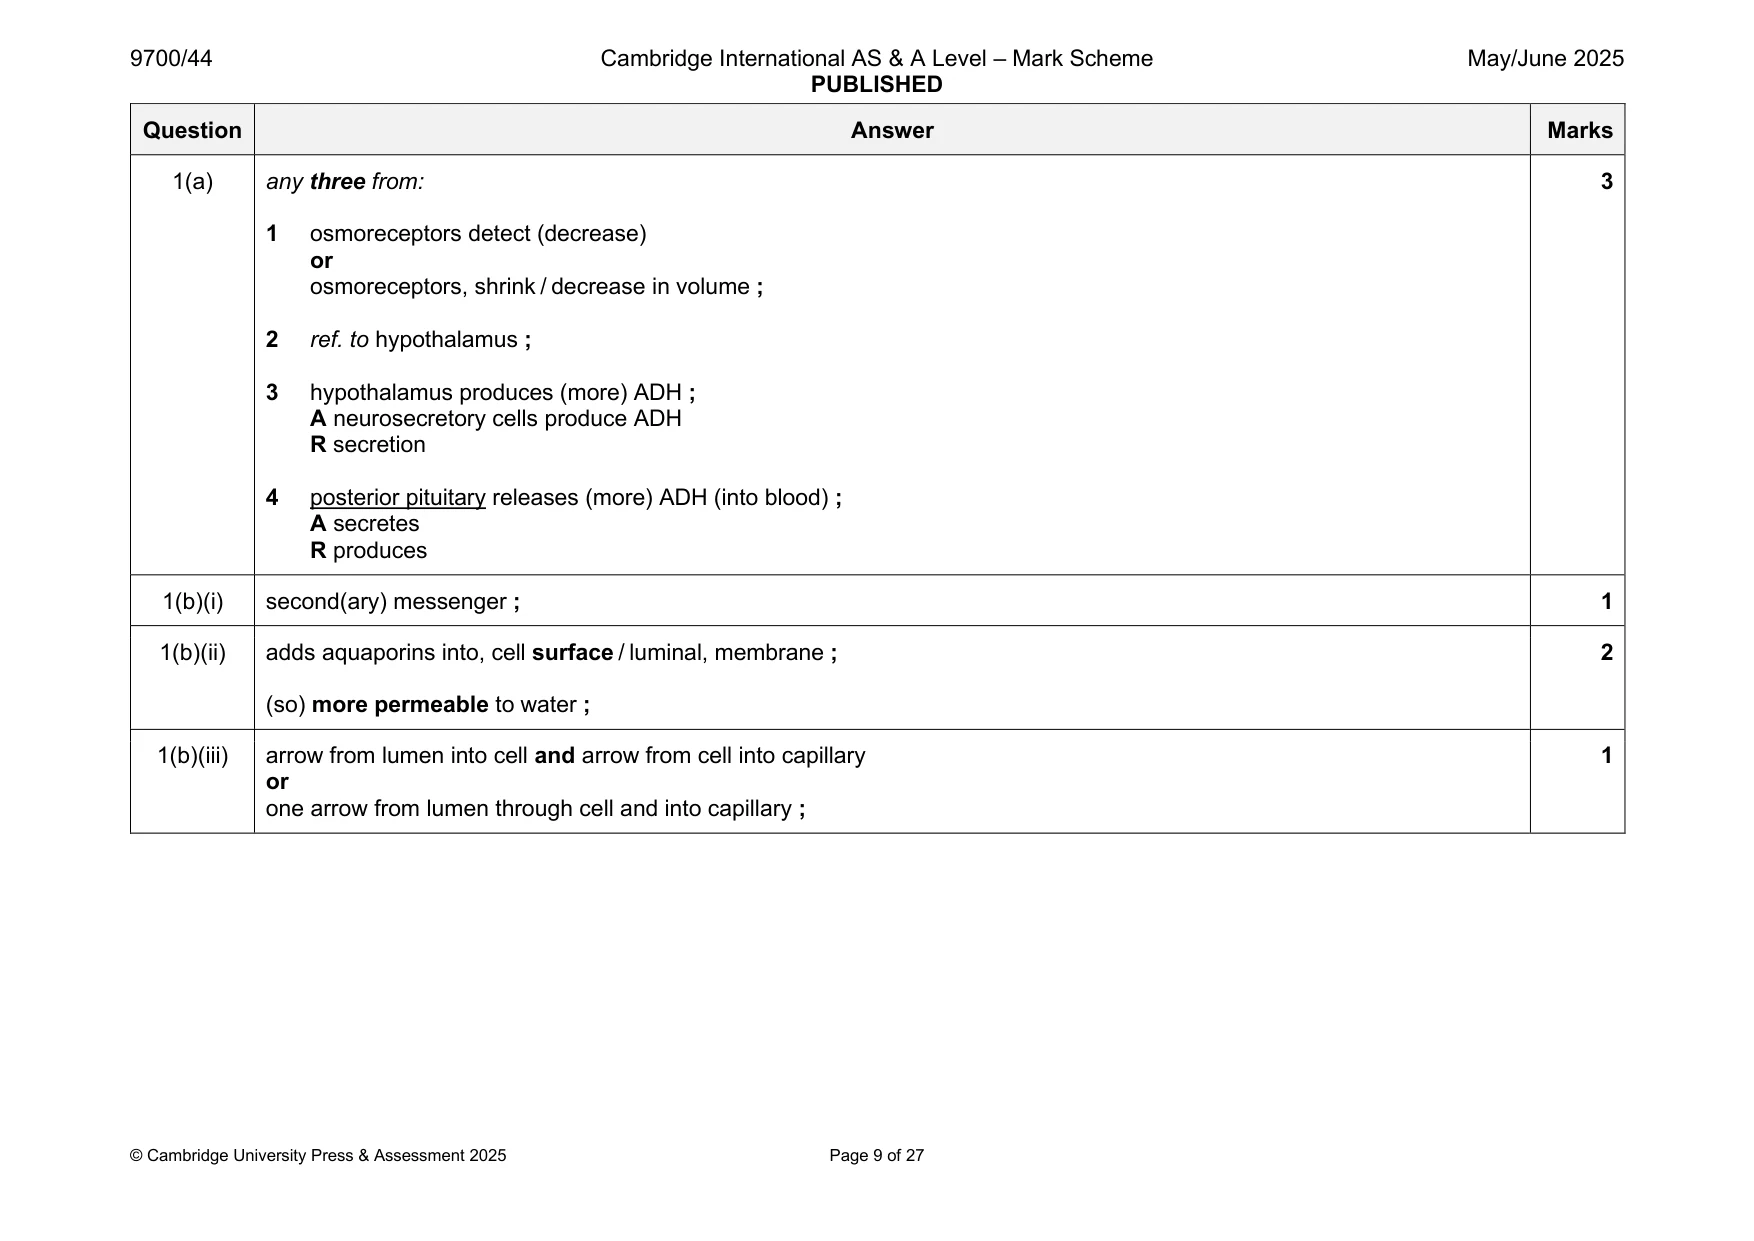
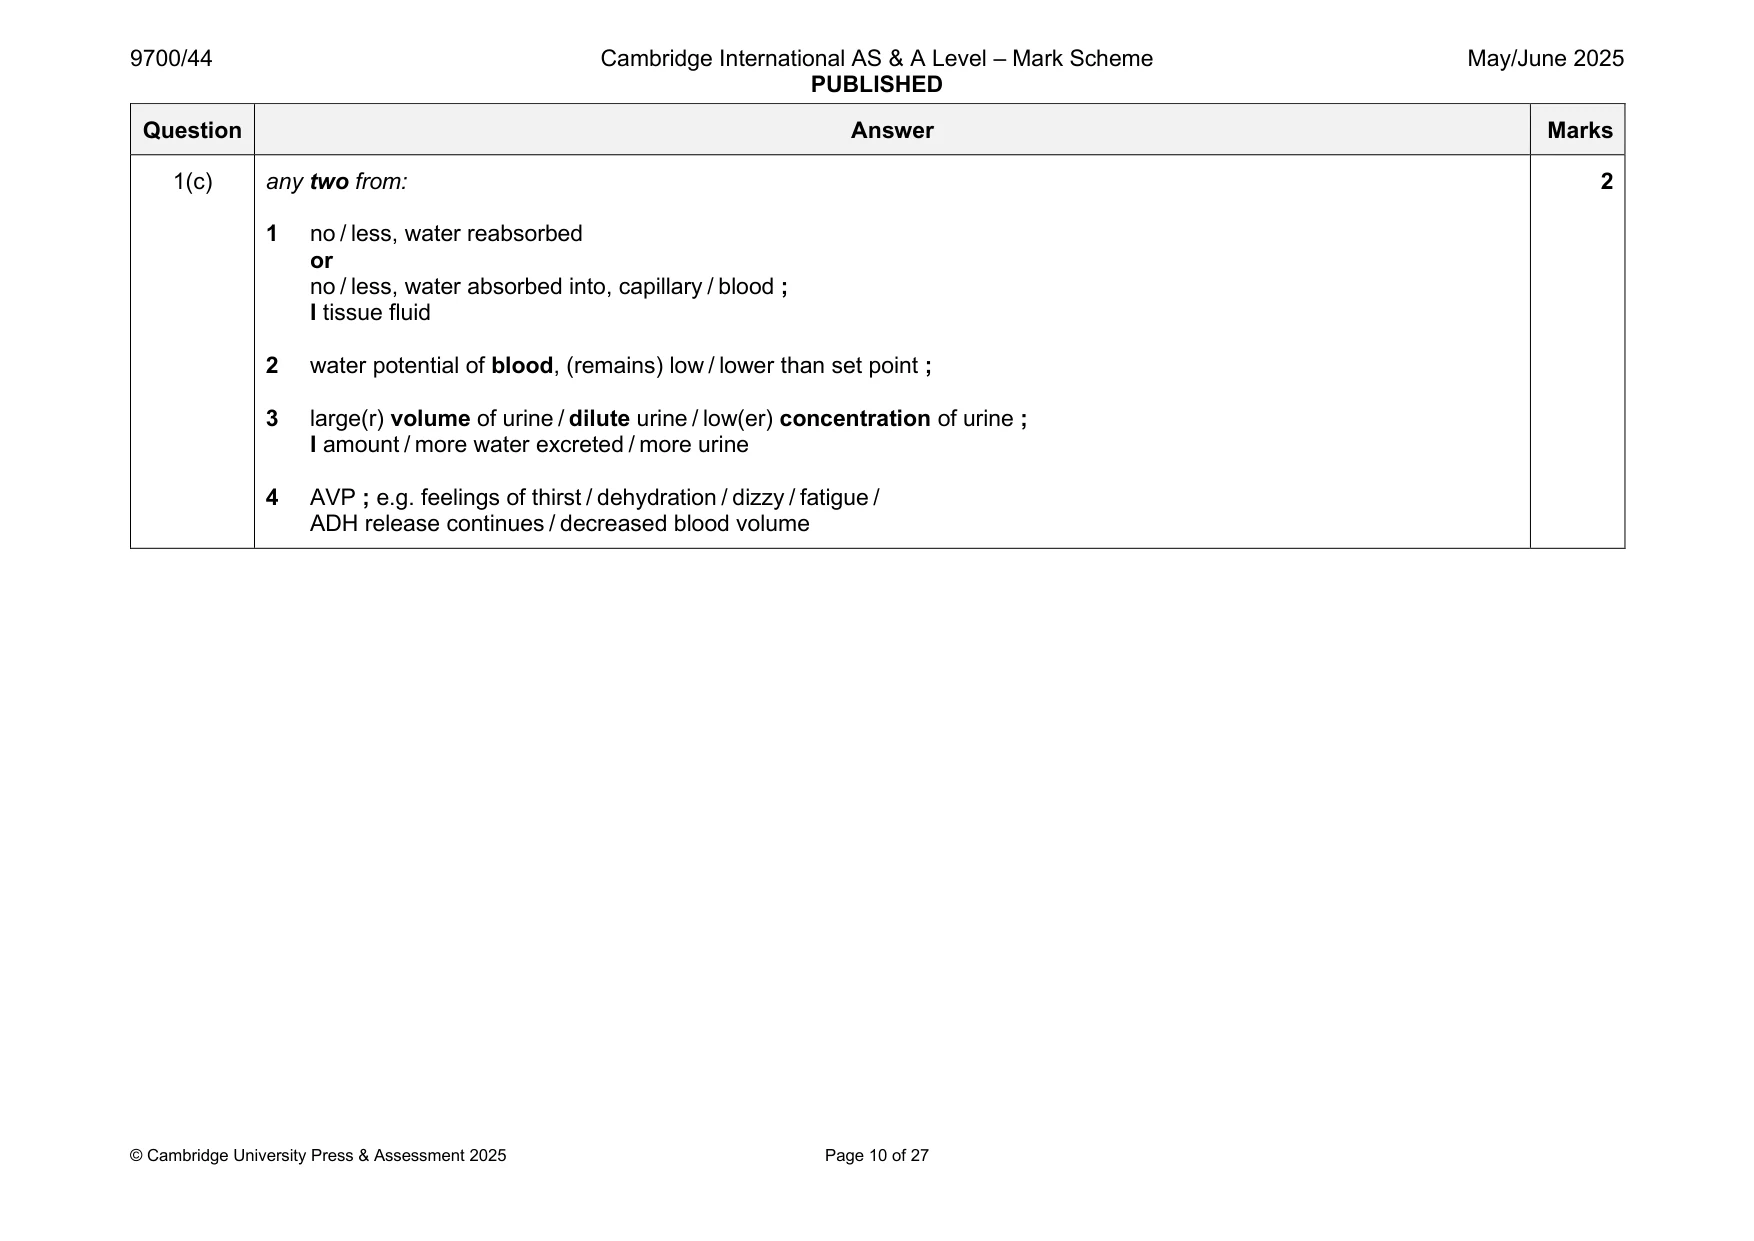
Mark scheme: Question Answer Marks 1(a) any three from: 3 1 osmoreceptors detect (decrease) or osmoreceptors, shrink / decrease in volume ; 2 ref. to hypothalamus ; 3 hypothalamus produces (more) ADH ; A neurosecretory cells produce ADH R secretion 4 posterior pituitary releases (more) ADH (into blood) ; A secretes R produces 1(b)(i) second(ary) messenger ; 1 1(b)(ii) adds aquaporins into, cell surface / luminal, membrane ; 2 (so) more permeable to water ; 1(b)(iii) arrow from lumen into cell and arrow from cell into capillary 1 or one arrow from lumen through cell and into capillary ; 1(c) any two from: 2 1 no / less, water reabsorbed or no / less, water absorbed into, capillary / blood ; I tissue fluid 2 water potential of blood, (remains) low / lower than set point ; 3 large(r) volume of urine / dilute urine / low(er) concentration of urine ; I amount / more water excreted / more urine 4 AVP ; e.g. feelings of thirst / dehydration / dizzy / fatigue / ADH release continues / decreased blood volume
Q2 · Inherited diseases are caused by genetic mutations
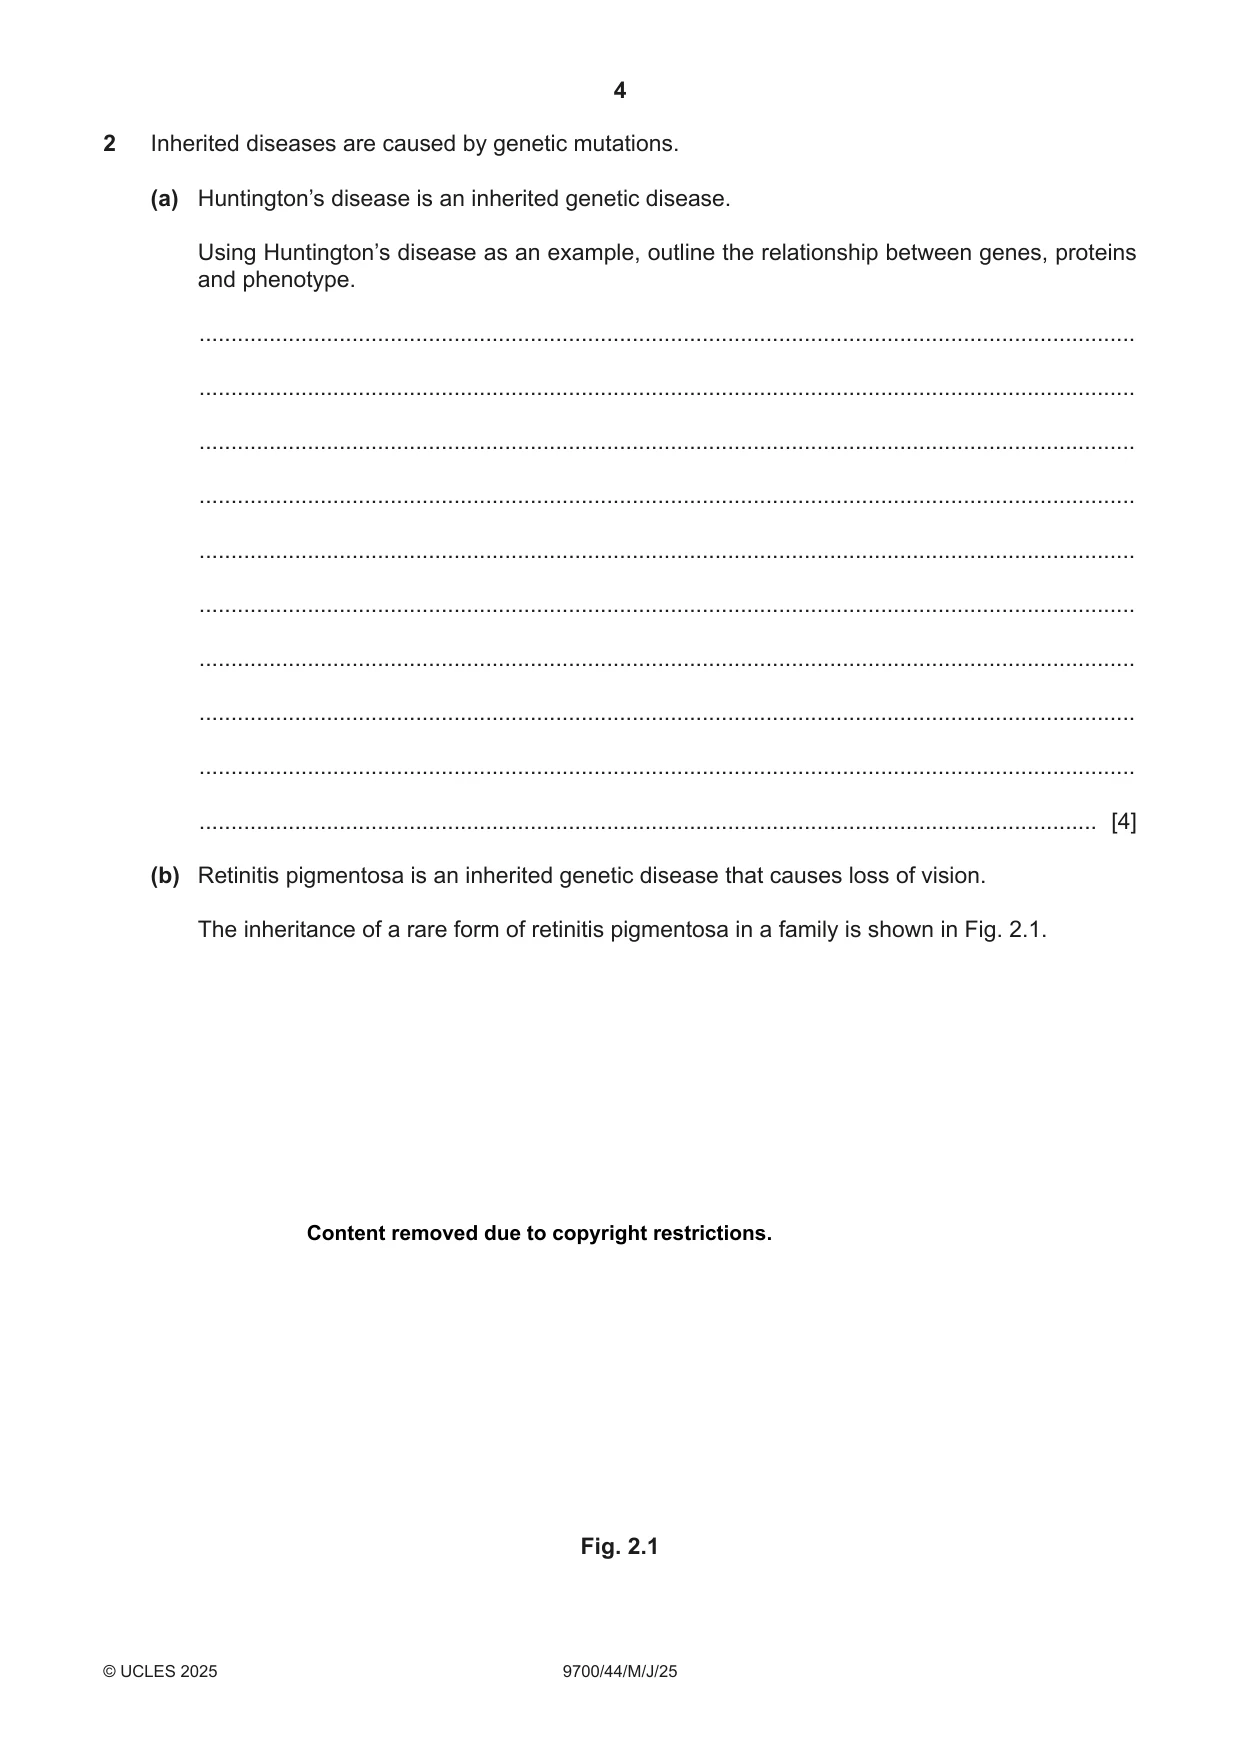
2 Inherited diseases are caused by genetic mutations. (a) Huntington’s disease is an inherited genetic disease. Using Huntington’s disease as an example, outline the relationship between genes, proteins and phenotype. ................................................................................................................................................... ................................................................................................................................................... ................................................................................................................................................... ................................................................................................................................................... ................................................................................................................................................... ................................................................................................................................................... ................................................................................................................................................... ................................................................................................................................................... ................................................................................................................................................... ............................................................................................................................................. [4] (b) Retinitis pigmentosa is an inherited genetic disease that causes loss of vision. The inheritance of a rare form of retinitis pigmentosa in a family is shown in Fig. 2.1. Content removed due to copyright restrictions. Fig. 2.1 Scientists concluded that the inheritance of this rare form of retinitis pigmentosa is linked to the Y chromosome. Using evidence shown in Fig. 2.1, explain why the scientists reached this conclusion. ................................................................................................................................................... ................................................................................................................................................... ................................................................................................................................................... ................................................................................................................................................... ................................................................................................................................................... ................................................................................................................................................... ............................................................................................................................................. [3] (c) Incontinentia pigmenti is a disease that affects the skin, hair and central nervous system. The disease is caused by a dominant allele on the X chromosome. Construct a genetic diagram to determine the expected offspring for a healthy father and a heterozygous mother with incontinentia pigmenti. State the expected phenotypic ratio of the offspring. Use the symbols: XA = allele for incontinentia pigmenti Xa = normal allele offspring genotypes offspring phenotypes expected ratio ........................................................................................................................... [4] (d) Some diseases are caused by mutations in regulatory genes. Suggest how a mutation in a regulatory gene that codes for a repressor protein could cause a disease. ................................................................................................................................................... ................................................................................................................................................... ................................................................................................................................................... ................................................................................................................................................... ................................................................................................................................................... ............................................................................................................................................. [3] [Total: 14]
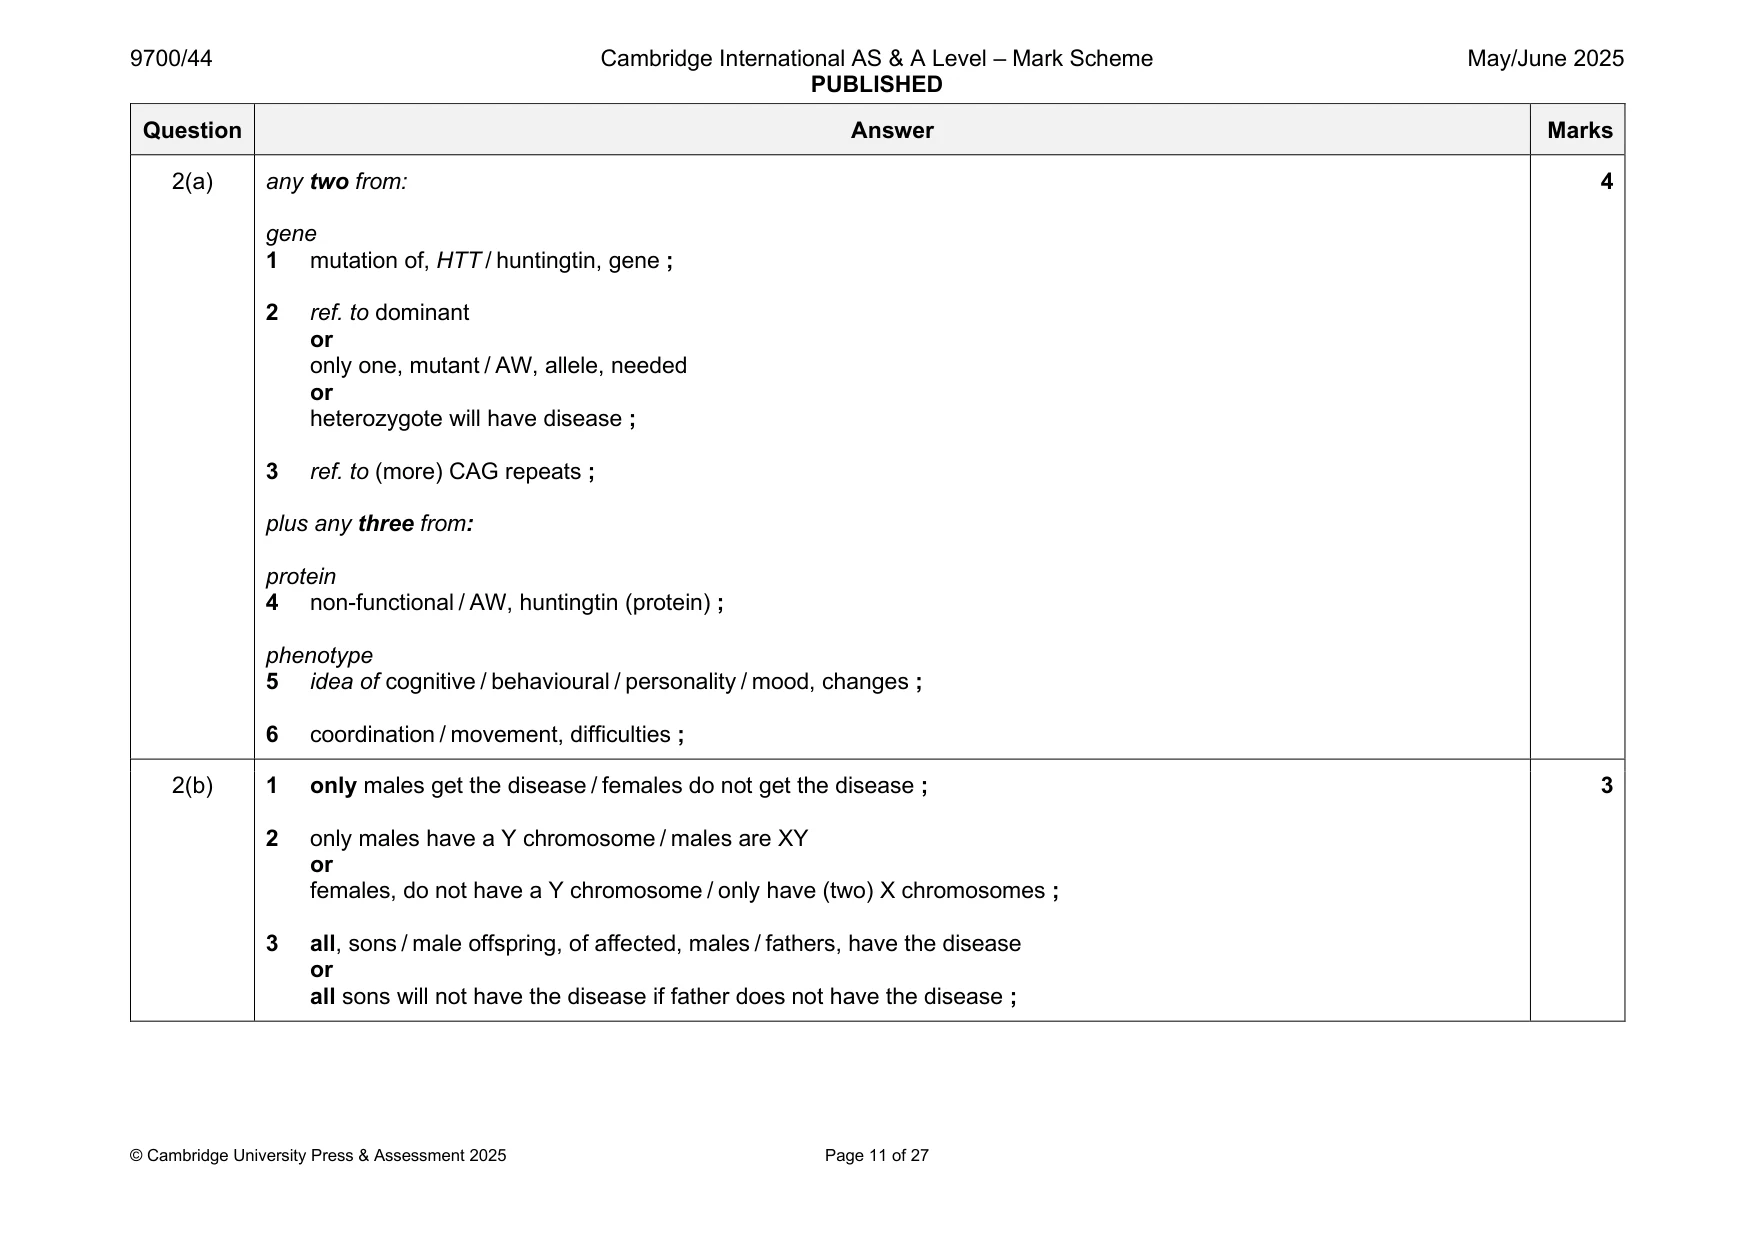
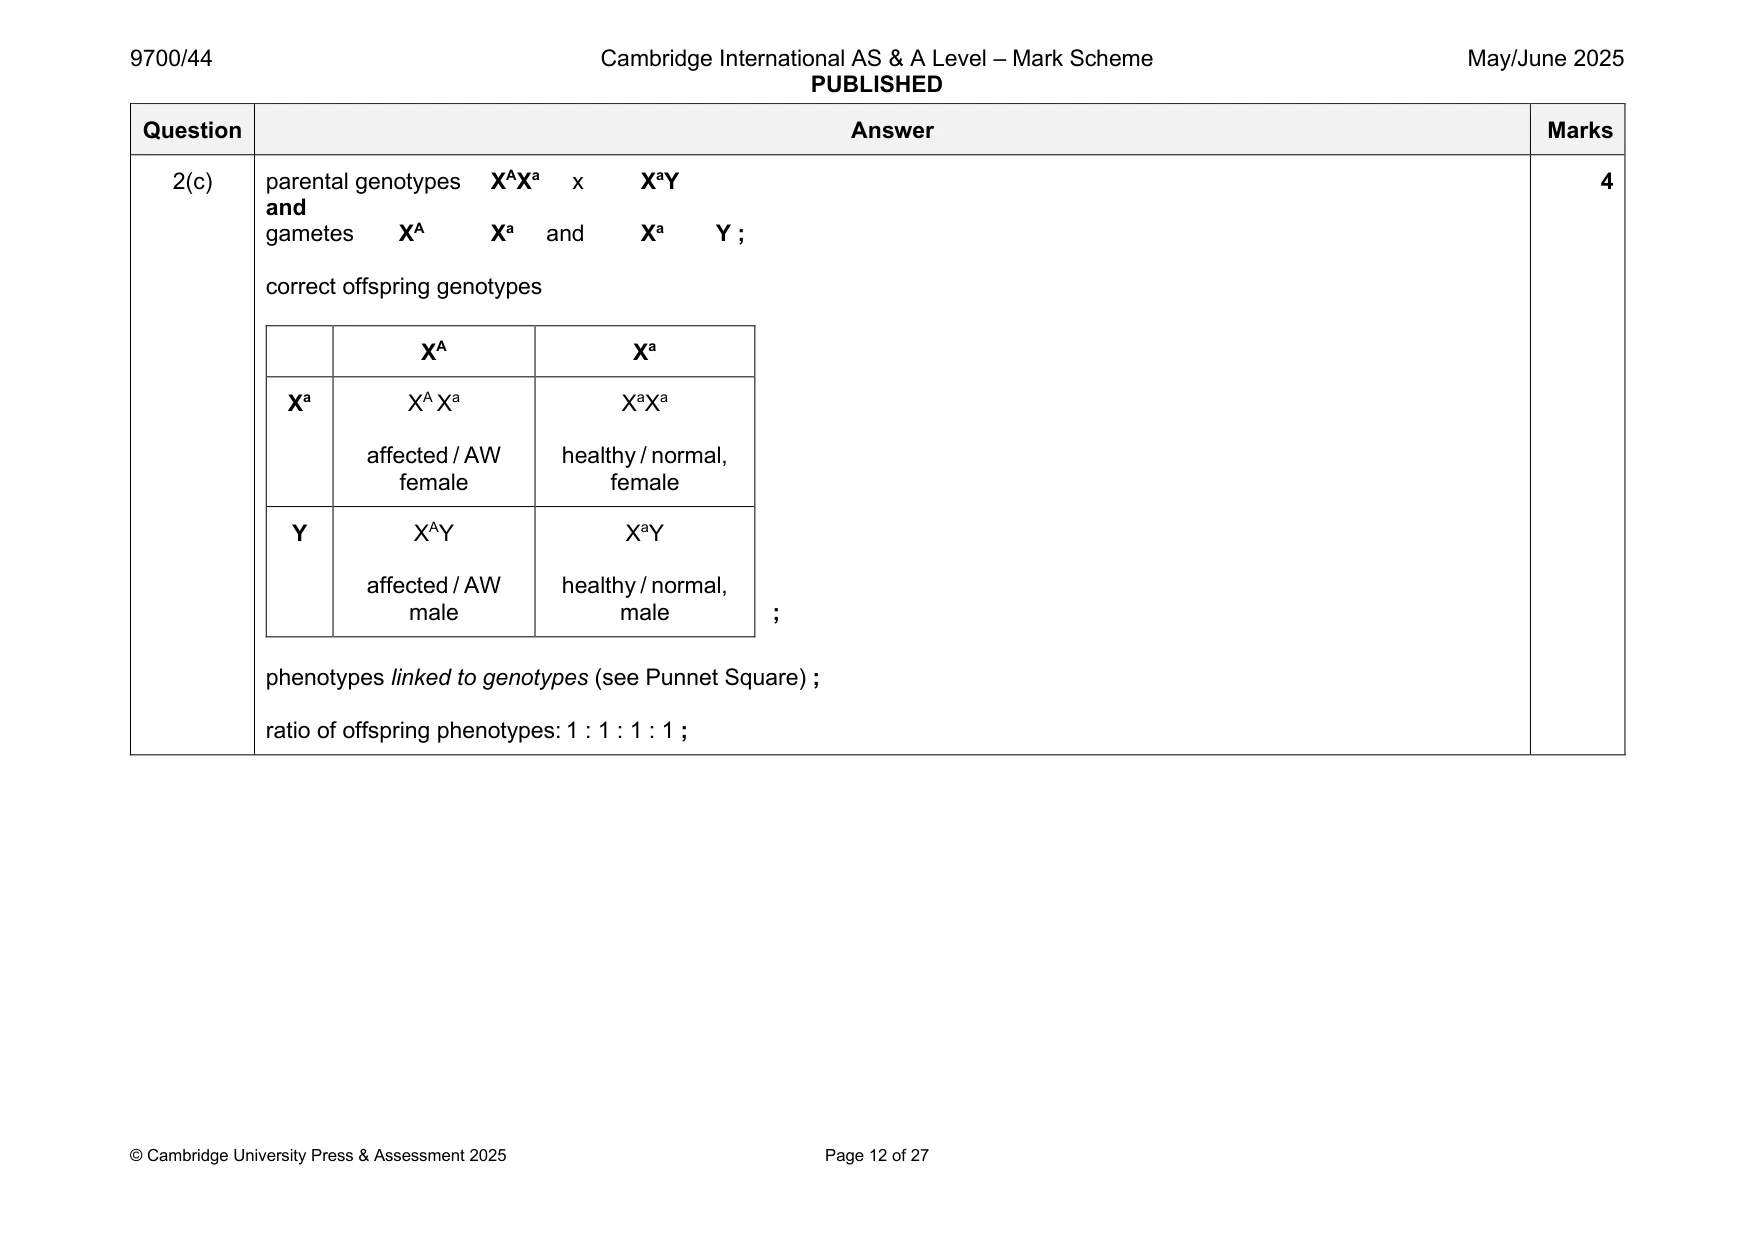
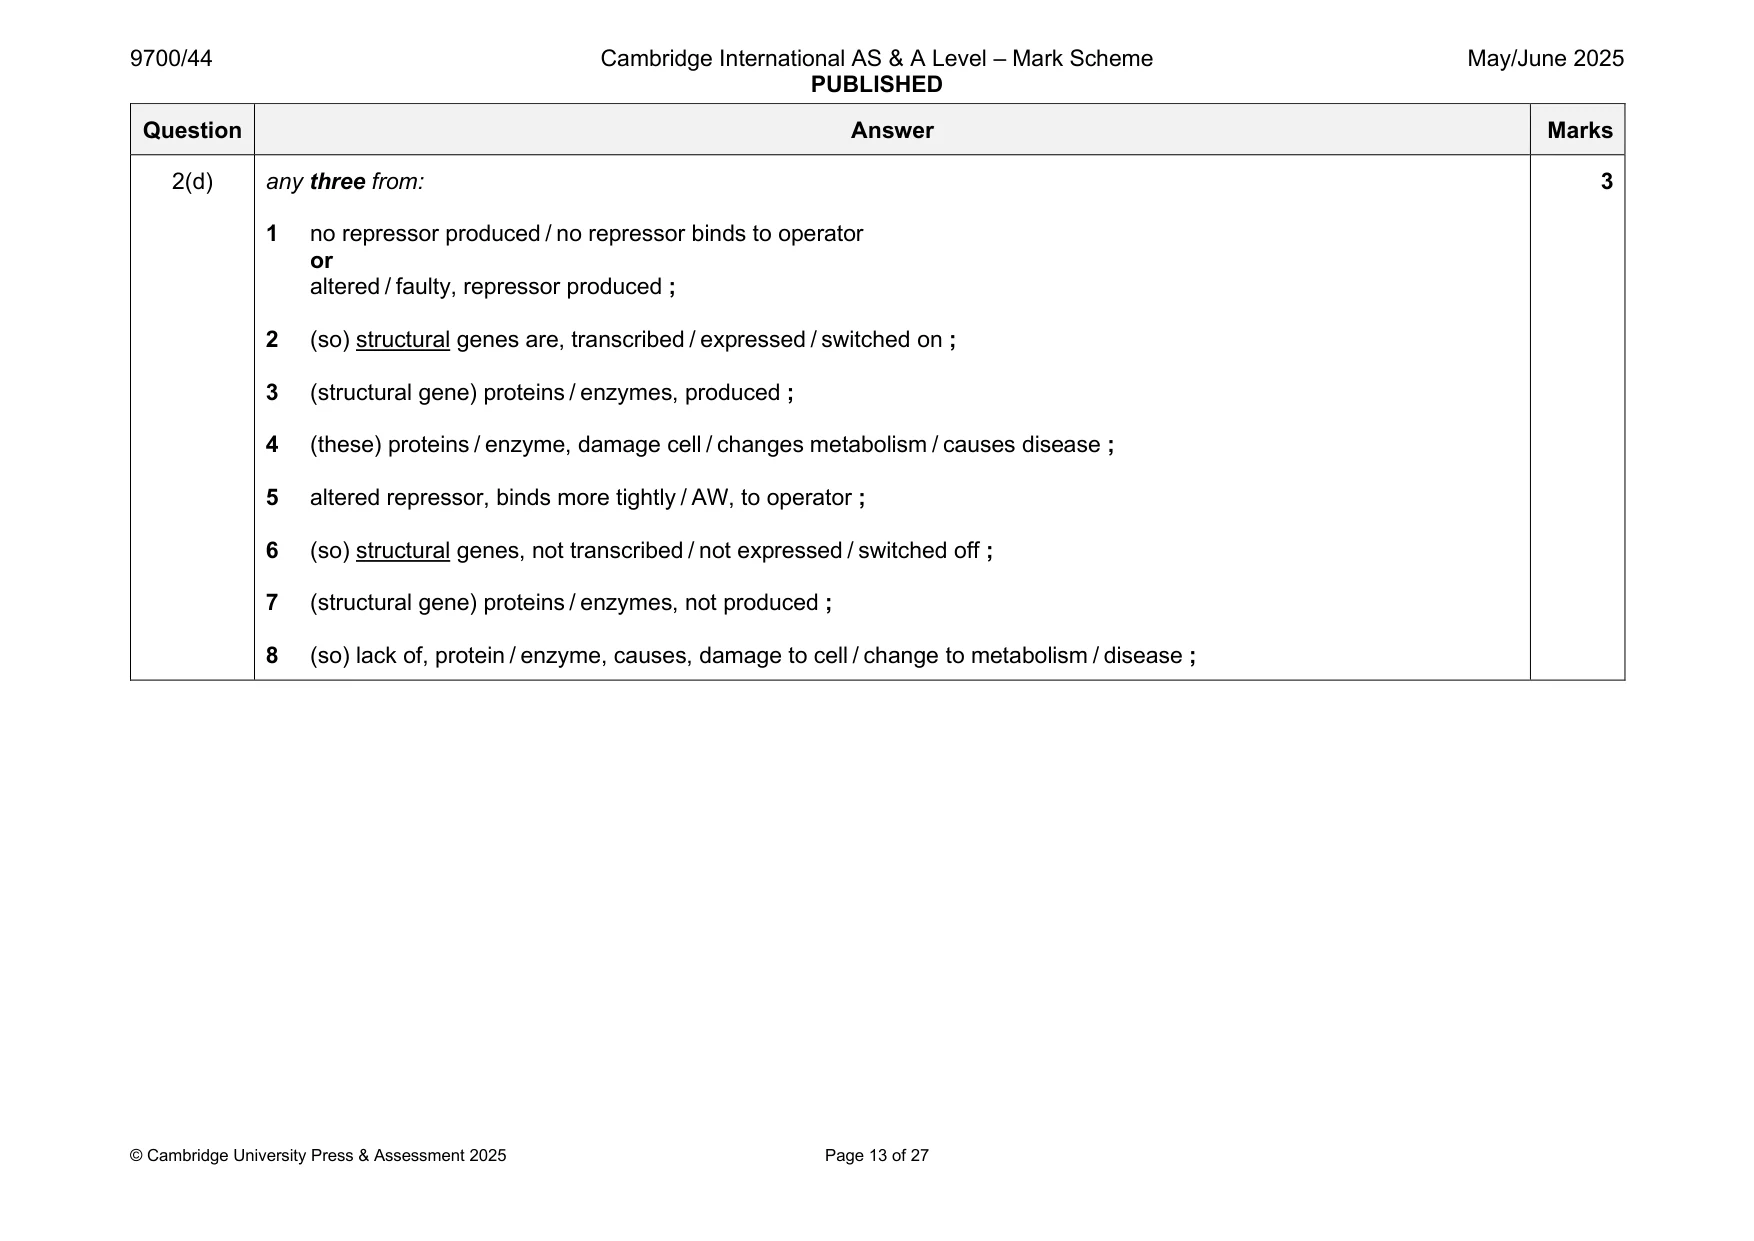
Mark scheme: 2(a) any two from: 4 gene 1 mutation of, HTT / huntingtin, gene ; 2 ref. to dominant or only one, mutant / AW, allele, needed or heterozygote will have disease ; 3 ref. to (more) CAG repeats ; plus any three from: protein 4 non-functional / AW, huntingtin (protein) ; phenotype 5 idea of cognitive / behavioural / personality / mood, changes ; 6 coordination / movement, difficulties ; 2(b) 1 only males get the disease / females do not get the disease ; 3 2 only males have a Y chromosome / males are XY or females, do not have a Y chromosome / only have (two) X chromosomes ; 3 all, sons / male offspring, of affected, males / fathers, have the disease or all sons will not have the disease if father does not have the disease ; 2(c) parental genotypes XAXa x XaY 4 and gametes XA Xa and Xa Y ; correct offspring genotypes XA Xa Xa XA Xa XaXa affected / AW healthy / normal, female female Y XAY XaY affected / AW healthy / normal, male male ; phenotypes linked to genotypes (see Punnet Square) ; ratio of offspring phenotypes: 1 : 1 : 1 : 1 ; 2(d) any three from: 3 1 no repressor produced / no repressor binds to operator or altered / faulty, repressor produced ; 2 (so) structural genes are, transcribed / expressed / switched on ; 3 (structural gene) proteins / enzymes, produced ; 4 (these) proteins / enzyme, damage cell / changes metabolism / causes disease ; 5 altered repressor, binds more tightly / AW, to operator ; 6 (so) structural genes, not transcribed / not expressed / switched off ; 7 (structural gene) proteins / enzymes, not produced ; 8 (so) lack of, protein / enzyme, causes, damage to cell / change to metabolism / disease ;
More questions on Passage of information from parents to offspring
Q3 · The genetics and evolution of the cat family, Felidae, have been studied by scientists
3 The genetics and evolution of the cat family, Felidae, have been studied by scientists. (a) The domestic cat, Felis catus, is a popular pet. Fur length in F. catus is coded for by two alleles, H and h: • the allele for short hair, H, is dominant • the allele for long hair, h, is recessive. (i) The population of domestic cats in a city was studied: • the population consisted of 15 000 cats • 6.8% of these cats were long-haired. Calculate the percentage of cats in the city that were heterozygous for hair length. You should use the Hardy–Weinberg equations in your calculation. p + q = 1 p2 + 2pq + q2 = 1 Show your working. answer = ......................................................... [3] (ii) Give two reasons why the domestic cat population does not meet the conditions needed to apply the Hardy–Weinberg principle. ........................................................................................................................................... ........................................................................................................................................... ........................................................................................................................................... ........................................................................................................................................... ..................................................................................................................................... [2] (b) Some domestic cats have no tails (tailless). The tailless phenotype in cats is genetically controlled. Fig. 3.1 shows a tailless cat. Content removed due to copyright restrictions. Fig. 3.1 A small population of domestic cats, including some tailless cats, was introduced to an island called the Isle of Man in the 1700s. After several generations, without artificial selection from humans, a high proportion of the cat population was tailless. Suggest why the tailless phenotype became common in the small cat population on the Isle of Man. ................................................................................................................................................... ................................................................................................................................................... ................................................................................................................................................... ................................................................................................................................................... ................................................................................................................................................... ................................................................................................................................................... ............................................................................................................................................. [3] (c) Cheetahs, Acinonyx jubatus, are predatory mammals. They have evolved black spots on their fur, which provide camouflage in their habitats. Describe how the spotted fur phenotype of A. jubatas may have evolved through natural selection from a non-spotted ancestor. ................................................................................................................................................... ................................................................................................................................................... ................................................................................................................................................... ................................................................................................................................................... ................................................................................................................................................... ............................................................................................................................................. [3] [Total: 11]
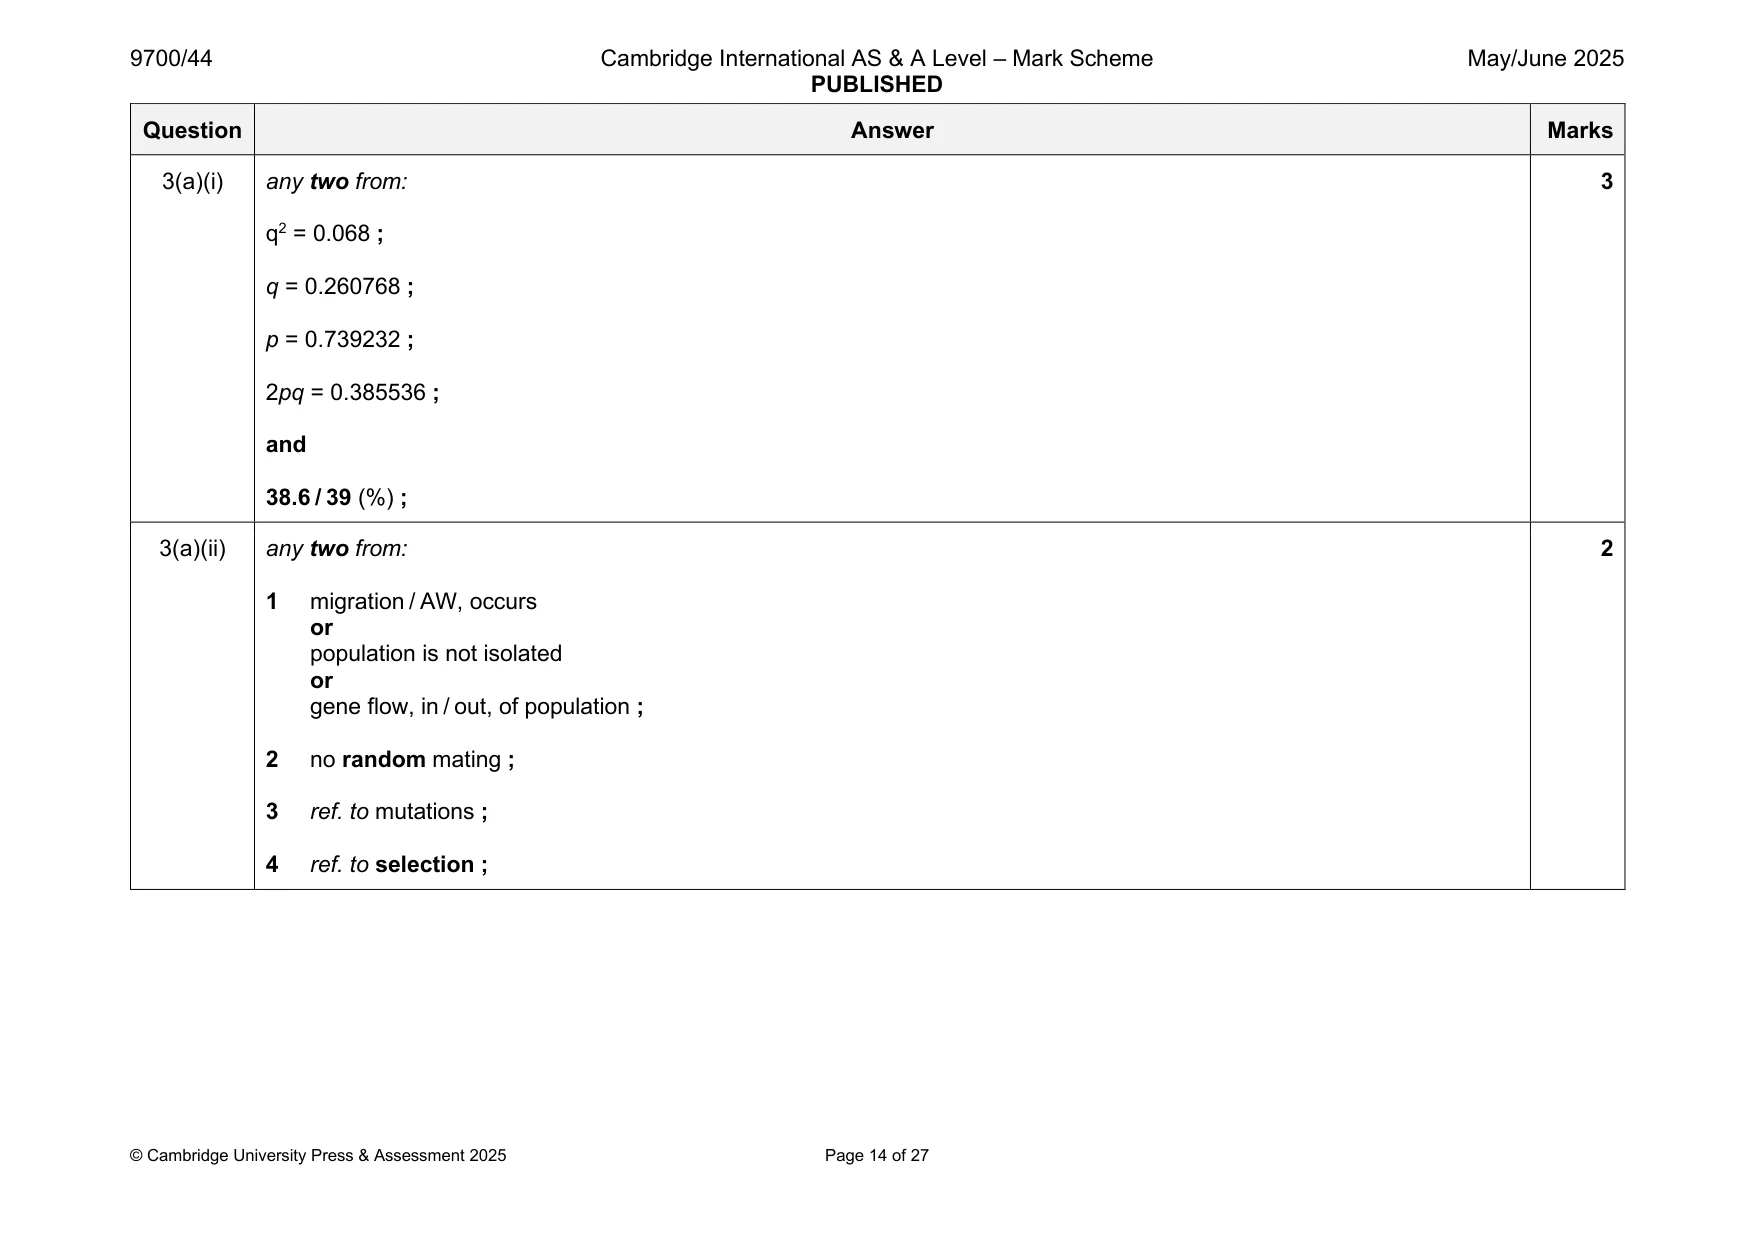
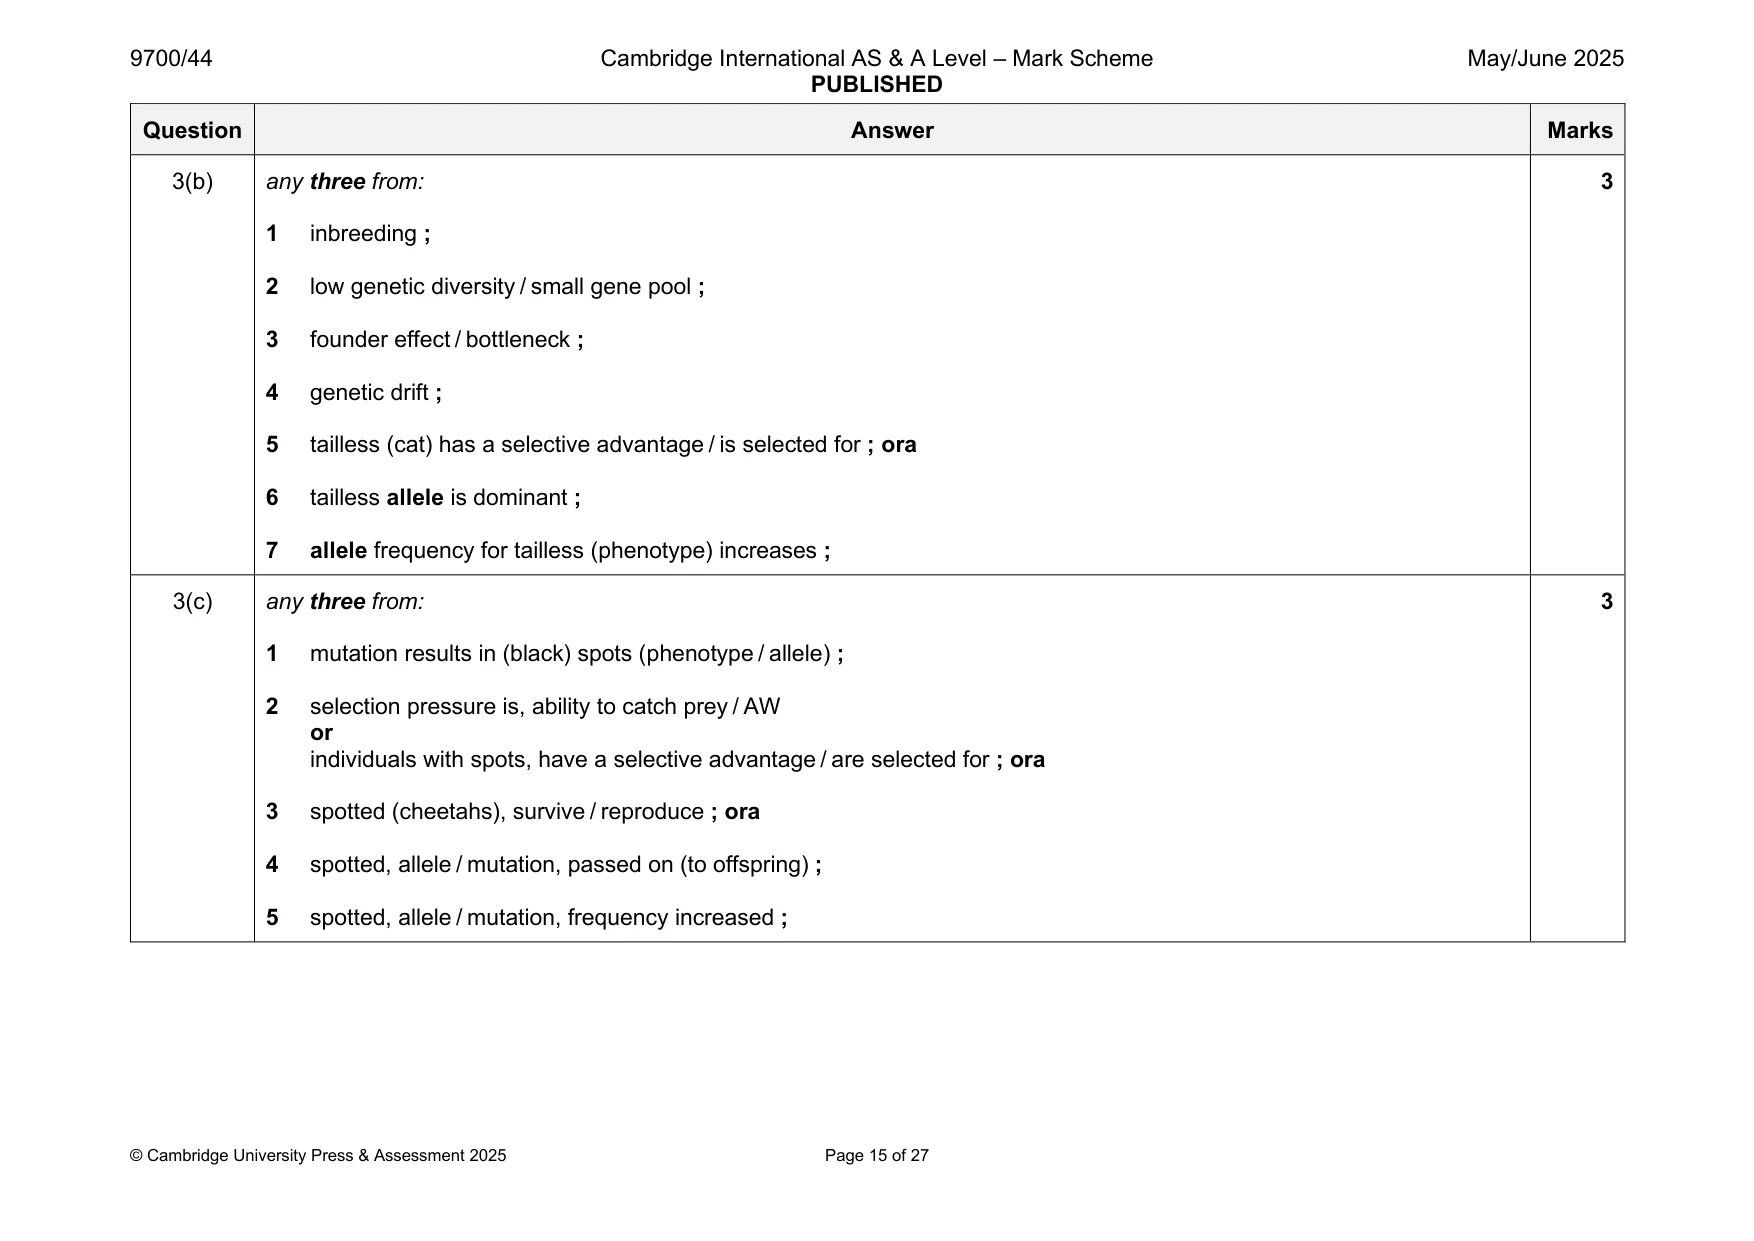
Mark scheme: 3(a)(i) any two from: 3 q2 = 0.068 ; q = 0.260768 ; p = 0.739232 ; 2pq = 0.385536 ; and 38.6 / 39 (%) ; 3(a)(ii) any two from: 2 1 migration / AW, occurs or population is not isolated or gene flow, in / out, of population ; 2 no random mating ; 3 ref. to mutations ; 4 ref. to selection ; 3(b) any three from: 3 1 inbreeding ; 2 low genetic diversity / small gene pool ; 3 founder effect / bottleneck ; 4 genetic drift ; 5 tailless (cat) has a selective advantage / is selected for ; ora 6 tailless allele is dominant ; 7 allele frequency for tailless (phenotype) increases ; 3(c) any three from: 3 1 mutation results in (black) spots (phenotype / allele) ; 2 selection pressure is, ability to catch prey / AW or individuals with spots, have a selective advantage / are selected for ; ora 3 spotted (cheetahs), survive / reproduce ; ora 4 spotted, allele / mutation, passed on (to offspring) ; 5 spotted, allele / mutation, frequency increased ;
Q4 · Organisms are classified in three domains
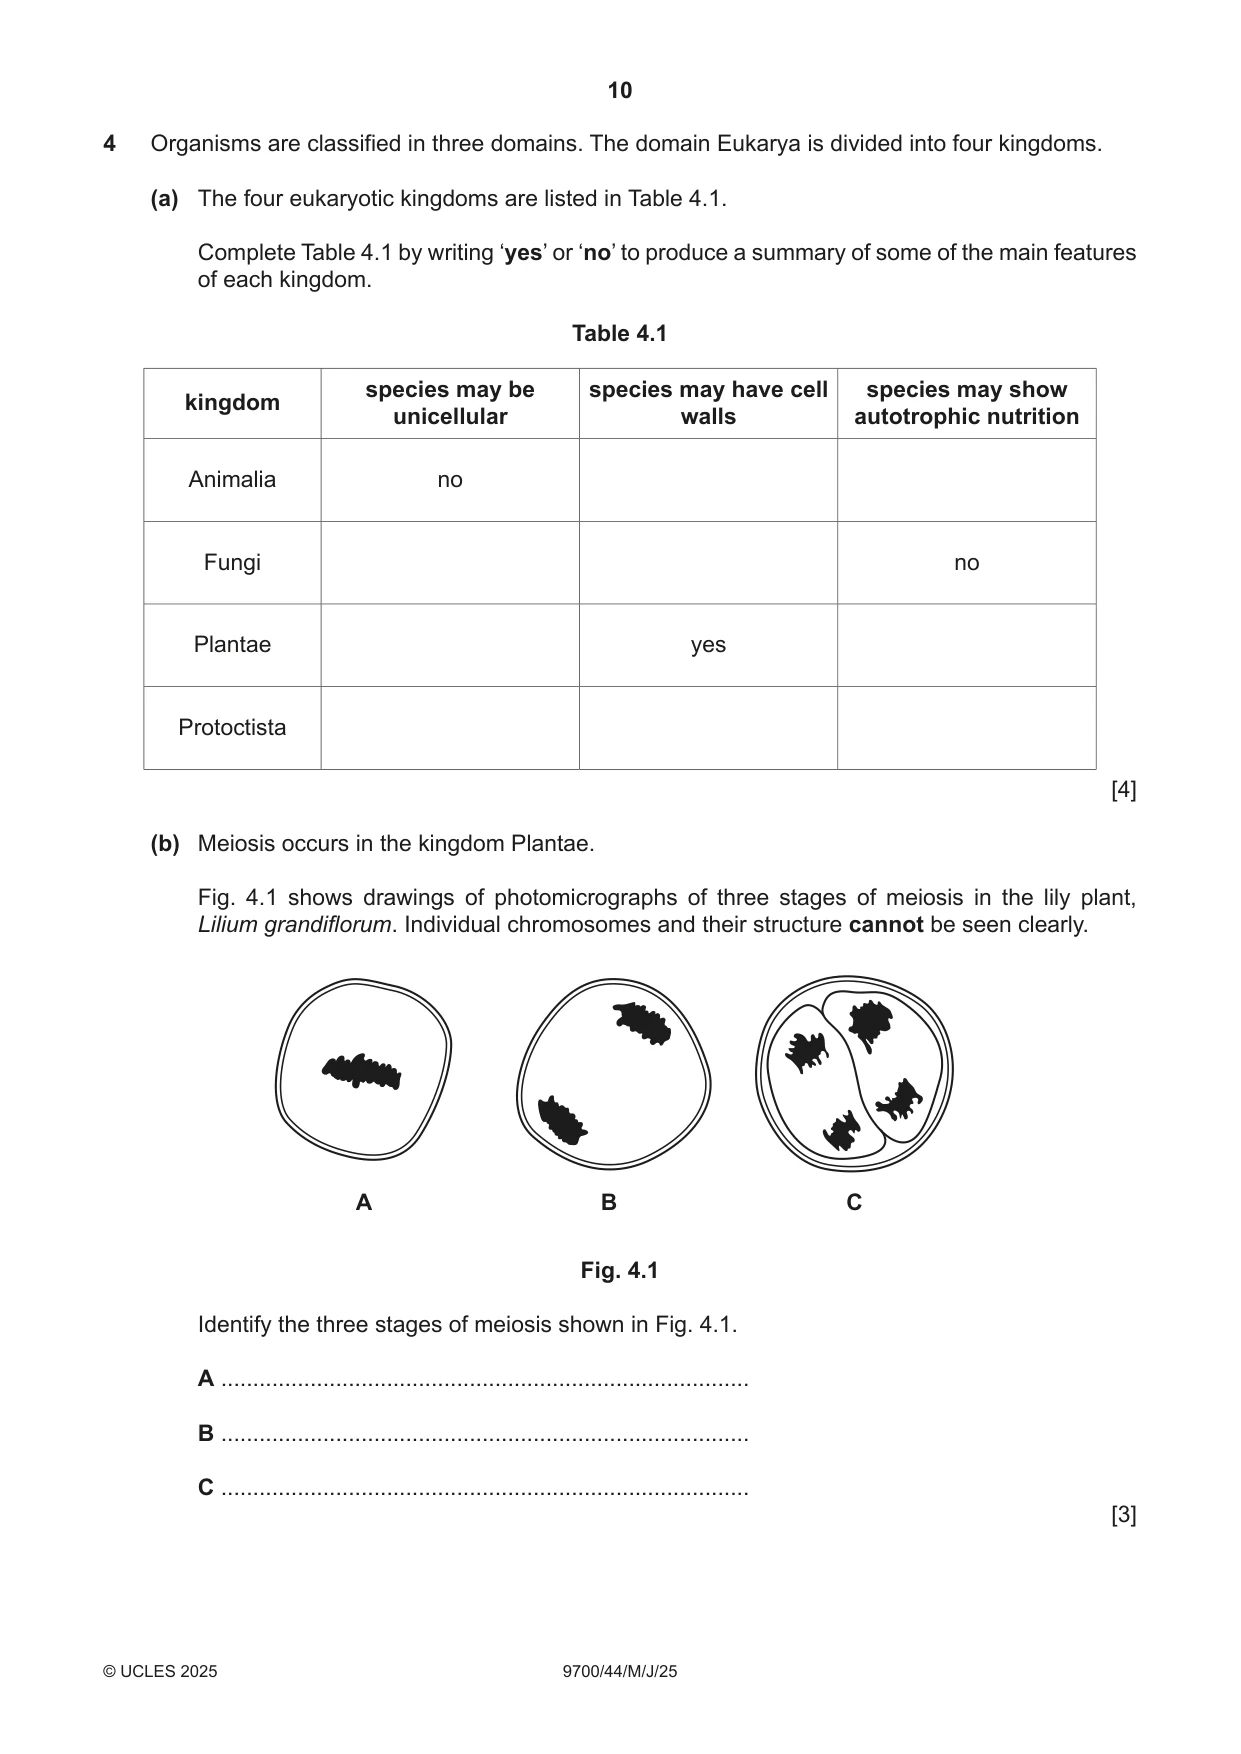
4 Organisms are classified in three domains. The domain Eukarya is divided into four kingdoms. (a) The four eukaryotic kingdoms are listed in Table 4.1. Complete Table 4.1 by writing ‘yes’ or ‘no’ to produce a summary of some of the main features of each kingdom. Table 4.1 species may be species may have cell species may show kingdom unicellular walls autotrophic nutrition Animalia no Fungi no Plantae yes Protoctista [4] (b) Meiosis occurs in the kingdom Plantae. Fig. 4.1 shows drawings of photomicrographs of three stages of meiosis in the lily plant, Lilium grandiflorum. Individual chromosomes and their structure cannot be seen clearly. A B C Fig. 4.1 Identify the three stages of meiosis shown in Fig. 4.1. A ................................................................................... B ................................................................................... C ................................................................................... [3] (c) The organisms in the other domains are prokaryotes. Name the two domains containing prokaryotic organisms and describe differences between these two domains. ................................................................................................................................................... ................................................................................................................................................... ................................................................................................................................................... ................................................................................................................................................... ................................................................................................................................................... ................................................................................................................................................... ............................................................................................................................................. [3] (d) Viruses are not cellular organisms, but they are classified based on their characteristics. Outline how viruses are classified. ................................................................................................................................................... ................................................................................................................................................... ................................................................................................................................................... ............................................................................................................................................. [2] [Total: 12]
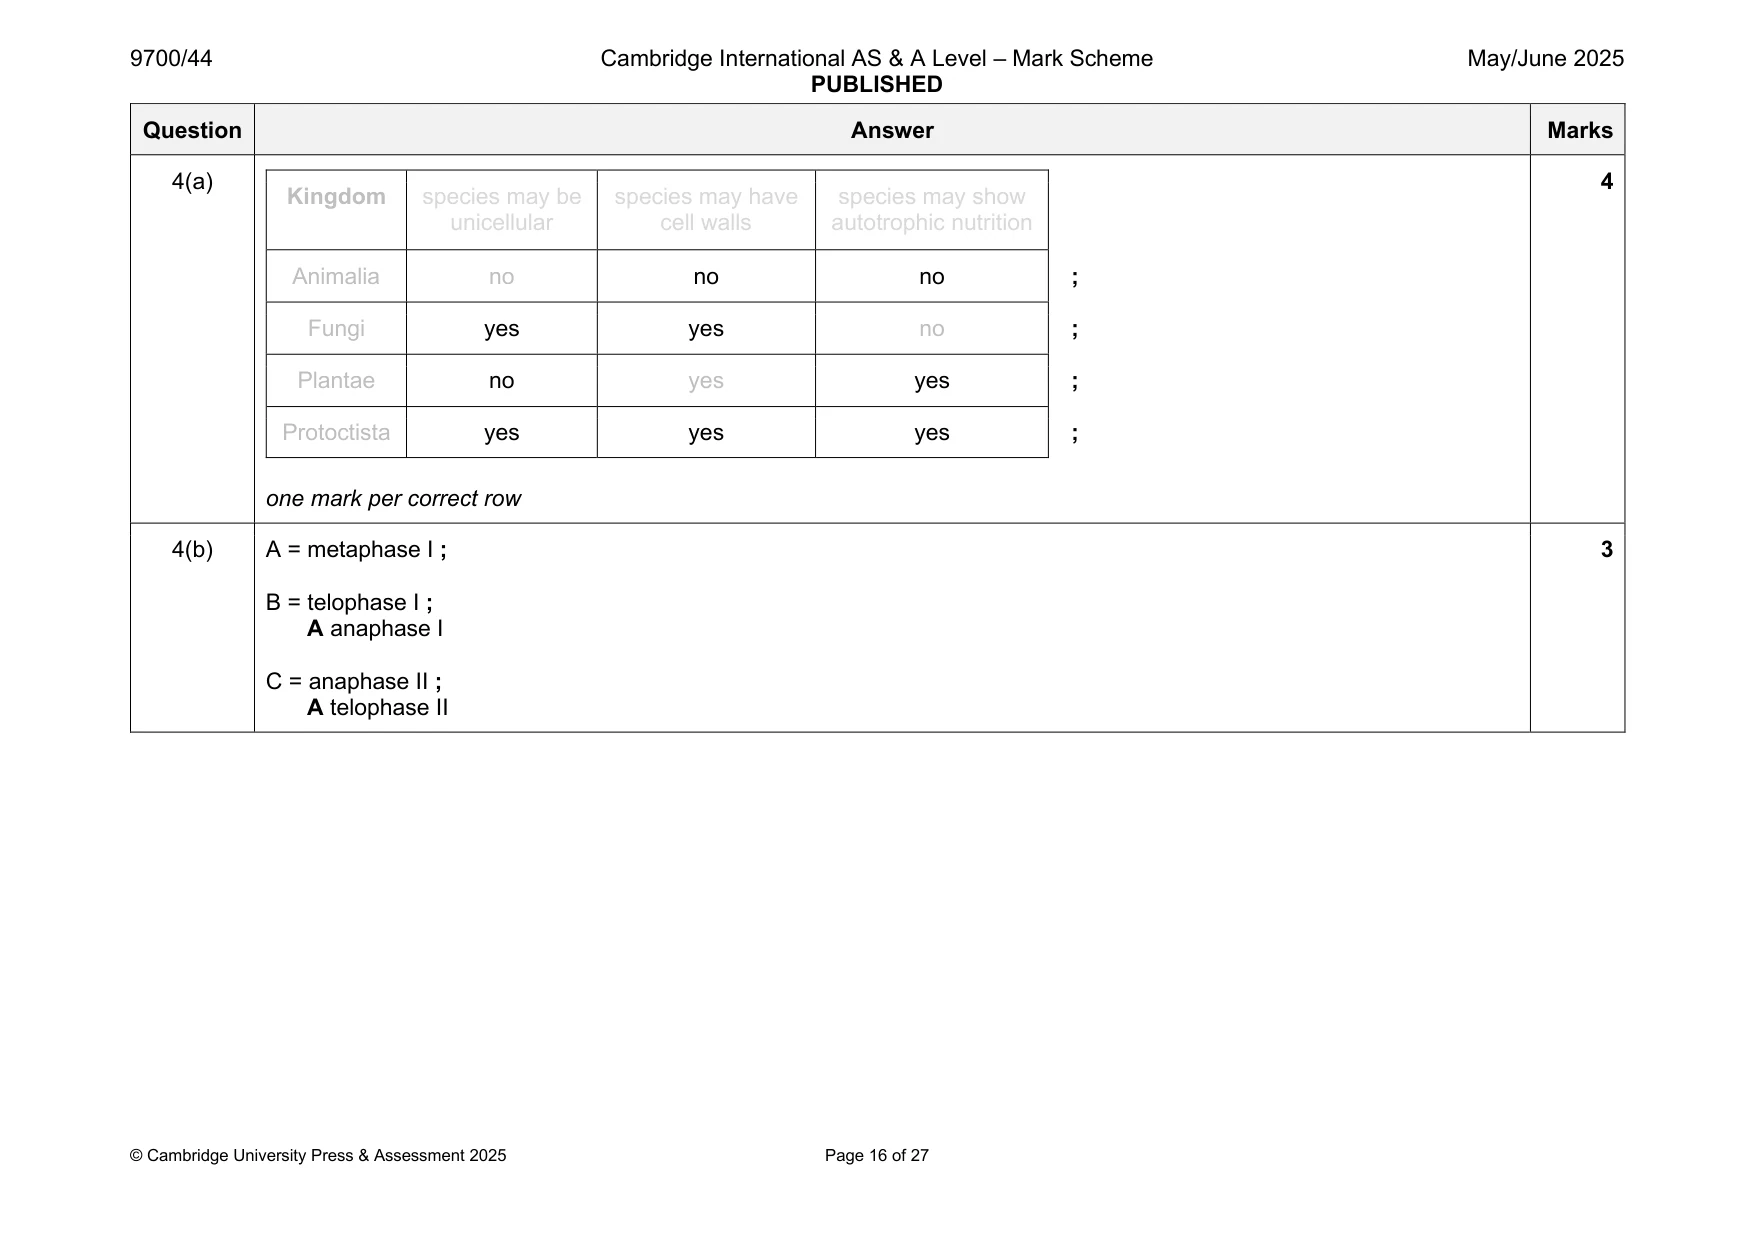
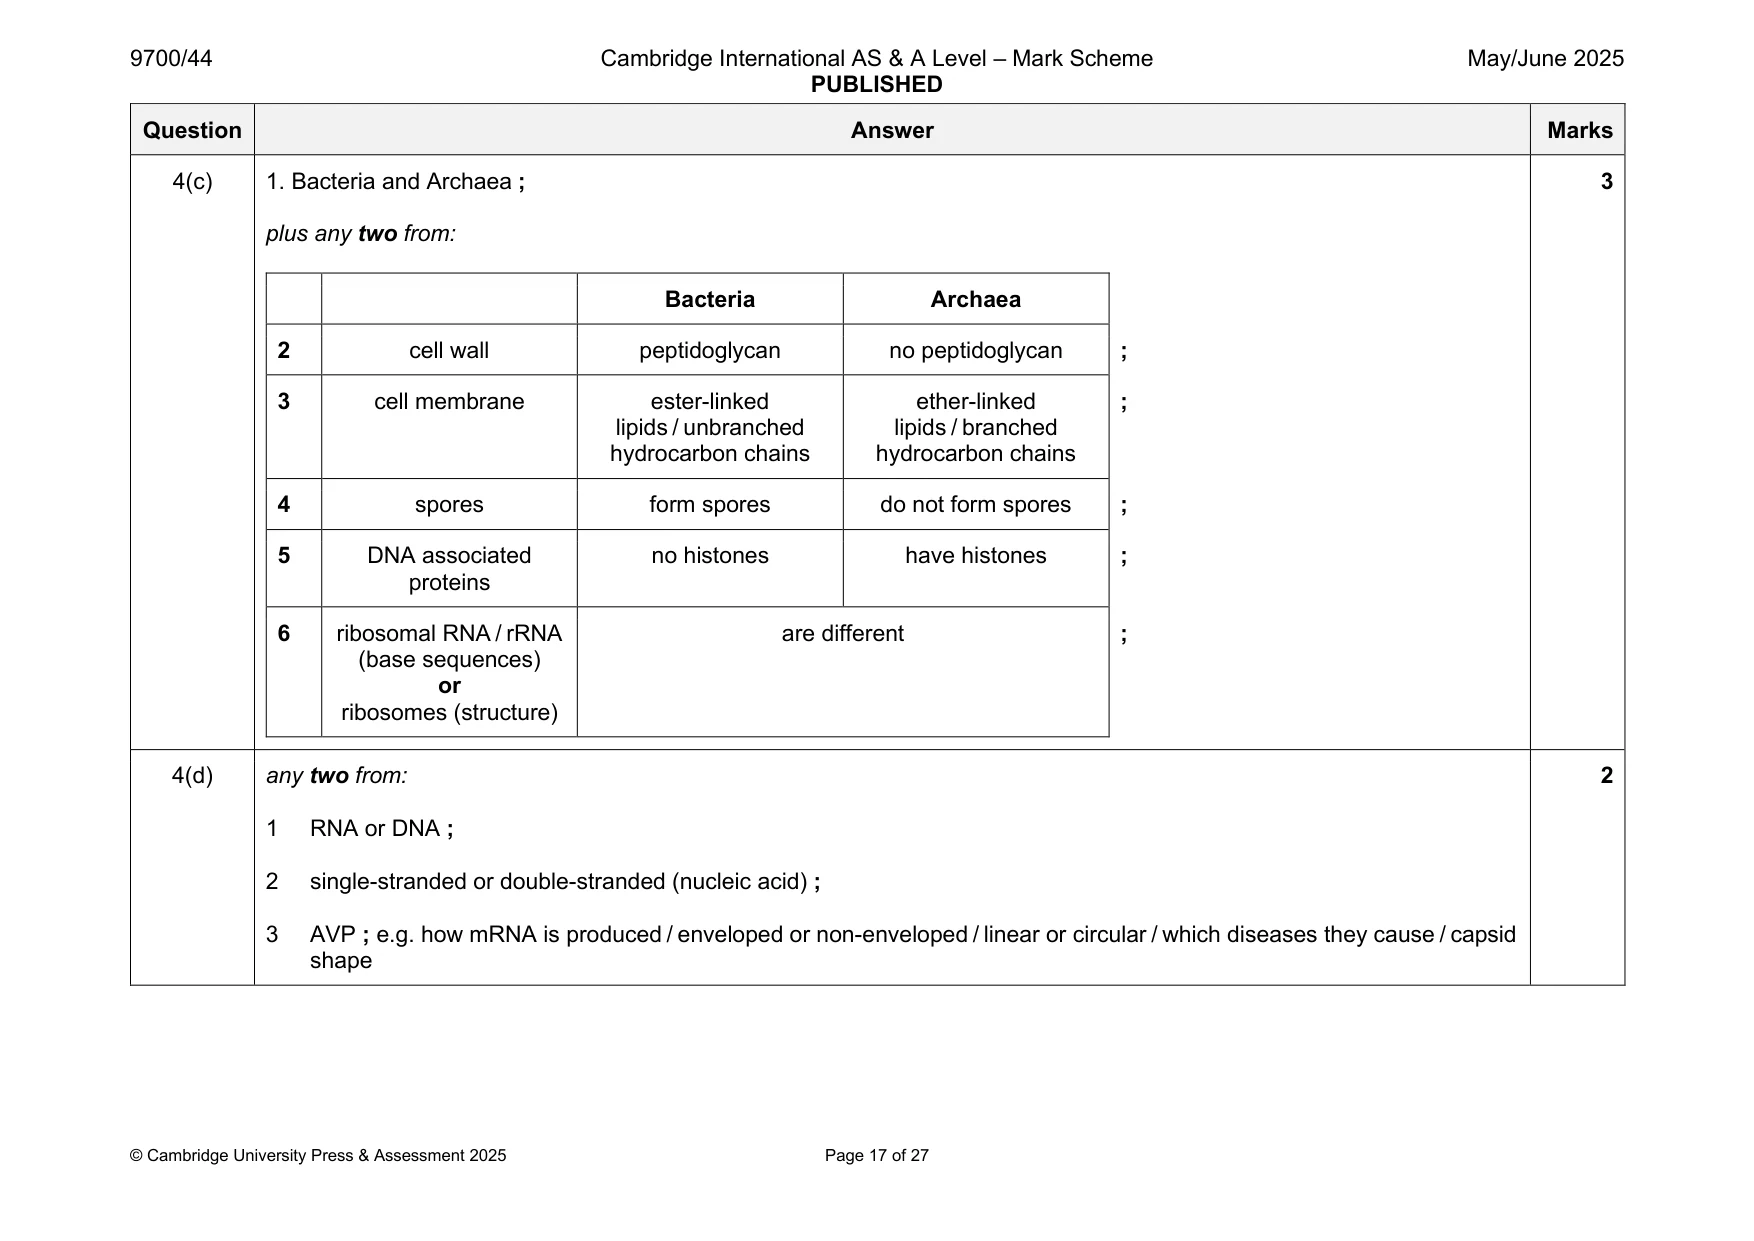
Mark scheme: 4(a) 4 Kingdom species may be species may have species may show unicellular cell walls autotrophic nutrition Animalia no no no ; Fungi yes yes no ; Plantae no yes yes ; Protoctista yes yes yes ; one mark per correct row 4(b) A = metaphase I ; 3 B = telophase I ; A anaphase I C = anaphase II ; A telophase II 4(c) 1. Bacteria and Archaea ; 3 plus any two from: Bacteria Archaea 2 cell wall peptidoglycan no peptidoglycan ; 3 cell membrane ester-linked ether-linked ; lipids / unbranched lipids / branched hydrocarbon chains hydrocarbon chains 4 spores form spores do not form spores ; 5 DNA associated no histones have histones ; proteins 6 ribosomal RNA / rRNA are different ; (base sequences) or ribosomes (structure) 4(d) any two from: 2 1 RNA or DNA ; 2 single-stranded or double-stranded (nucleic acid) ; 3 AVP ; e.g. how mRNA is produced / enveloped or non-enveloped / linear or circular / which diseases they cause / capsid shape
Q5 · Genetic engineering may often involve the transfer of a gene into an organism
5 Genetic engineering may often involve the transfer of a gene into an organism. (a) The polymerase chain reaction (PCR) can be used to produce many copies of a gene for transfer. Describe and explain the steps involved in PCR. ................................................................................................................................................... ................................................................................................................................................... ................................................................................................................................................... ................................................................................................................................................... ................................................................................................................................................... ................................................................................................................................................... ................................................................................................................................................... ................................................................................................................................................... ................................................................................................................................................... ............................................................................................................................................. [5] (b) Some species of Anopheles mosquitoes, such as Anopheles stephensi, transmit malaria. Scientists have created genetically engineered A. stephensi mosquitoes in an attempt to reduce the spread of malaria. A gene called tTav was constructed by scientists and transferred into the eggs of A. stephensi. • tTav consists of DNA sequences from a bacterium, Escherichia coli, and herpes simplex virus, which is a DNA virus. • The gene codes for tTav protein, which stops the expression of genes that are essential to mosquito development. • Genetically engineered A. stephensi do not survive beyond the larval stage and therefore do not develop into adults. • A chemical called tetracycline can stop the action of the tTav protein. Male genetically engineered A. stephensi were released into the wild to breed with females. Their offspring had the tTav gene. (i) Describe how the tTav gene could have been synthesised and transferred into the eggs of A. stephensi. ........................................................................................................................................... ........................................................................................................................................... ........................................................................................................................................... ........................................................................................................................................... ........................................................................................................................................... ........................................................................................................................................... ........................................................................................................................................... ..................................................................................................................................... [4] (ii) Suggest how the tTav protein prevents the expression of other genes in A. stephensi. ........................................................................................................................................... ..................................................................................................................................... [1] (iii) Genetically engineered A. stephensi larvae were exposed to tetracycline in the laboratory. Suggest why A. stephensi larvae were exposed to tetracycline in the laboratory. ........................................................................................................................................... ..................................................................................................................................... [1] [Total: 11]
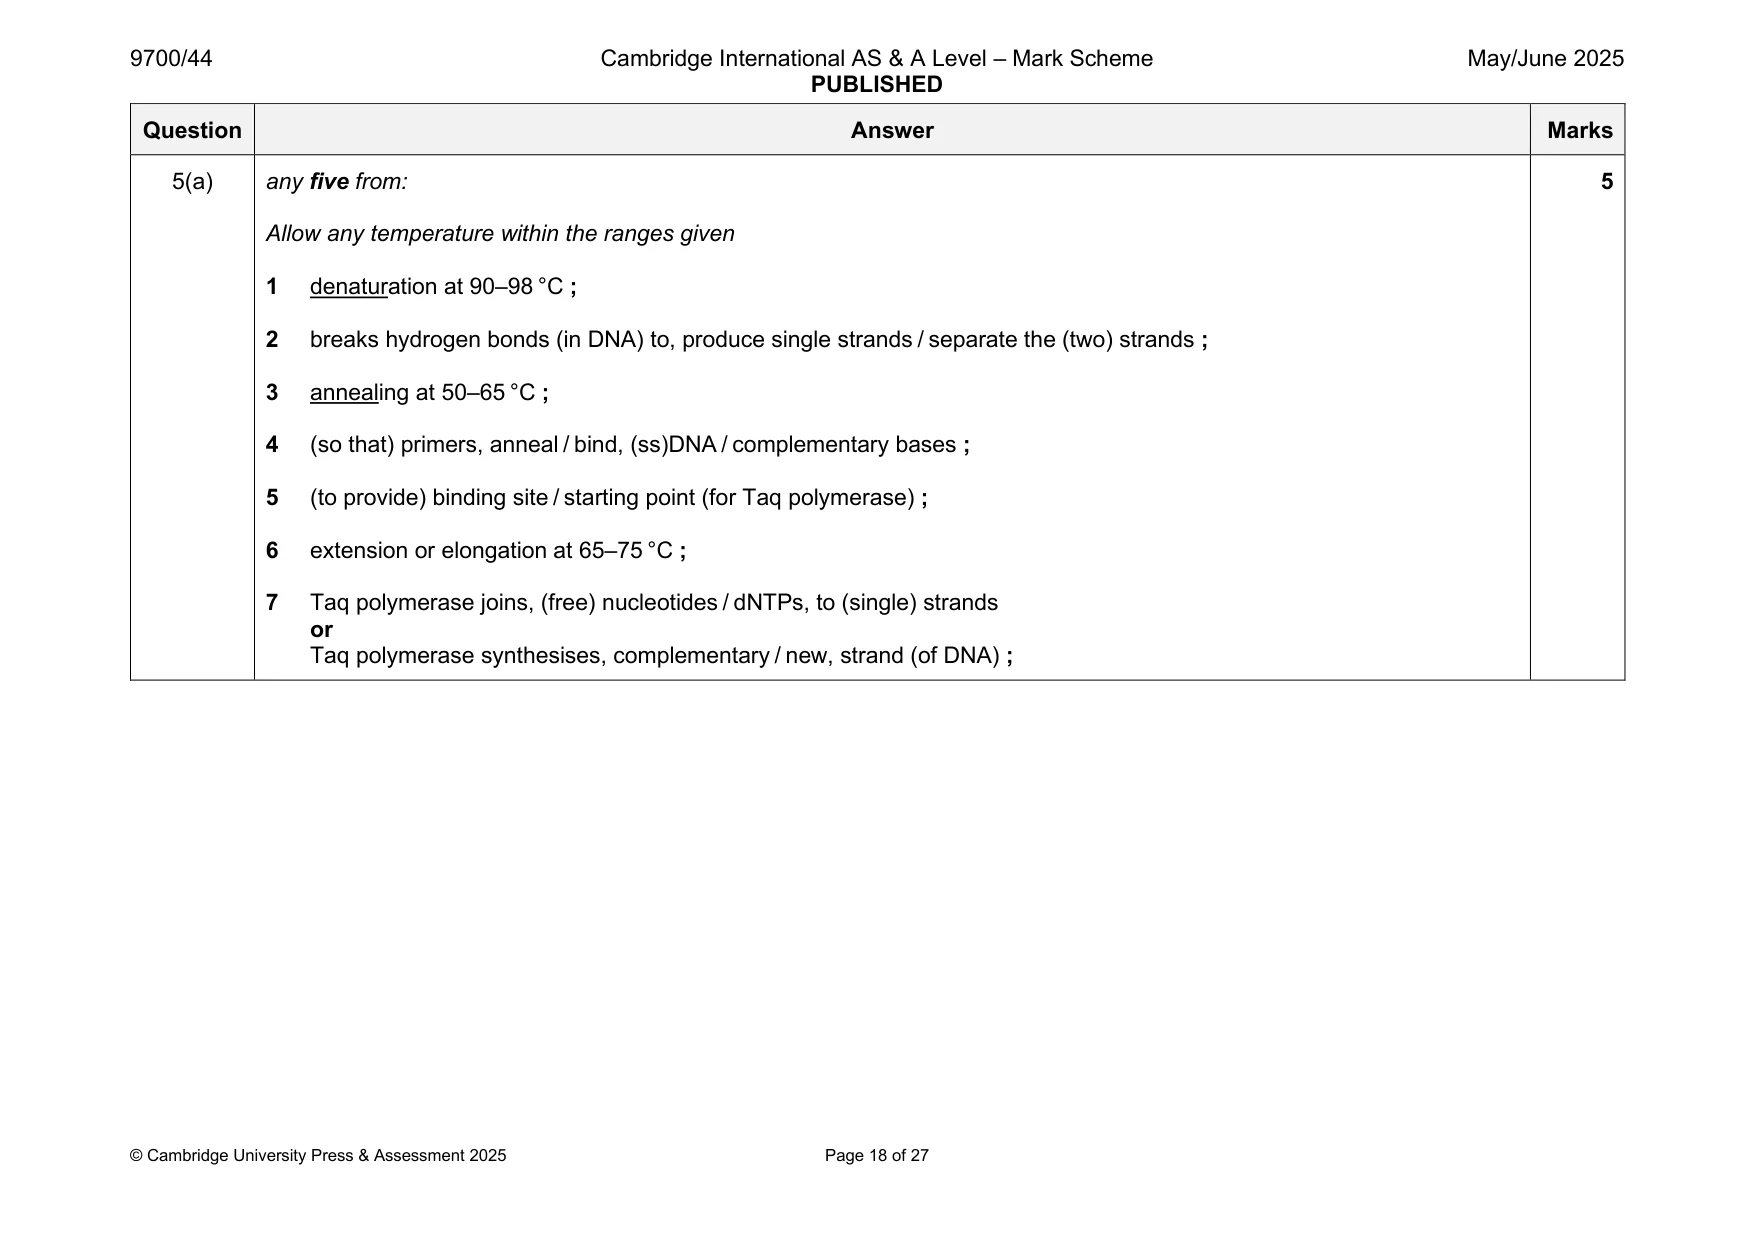
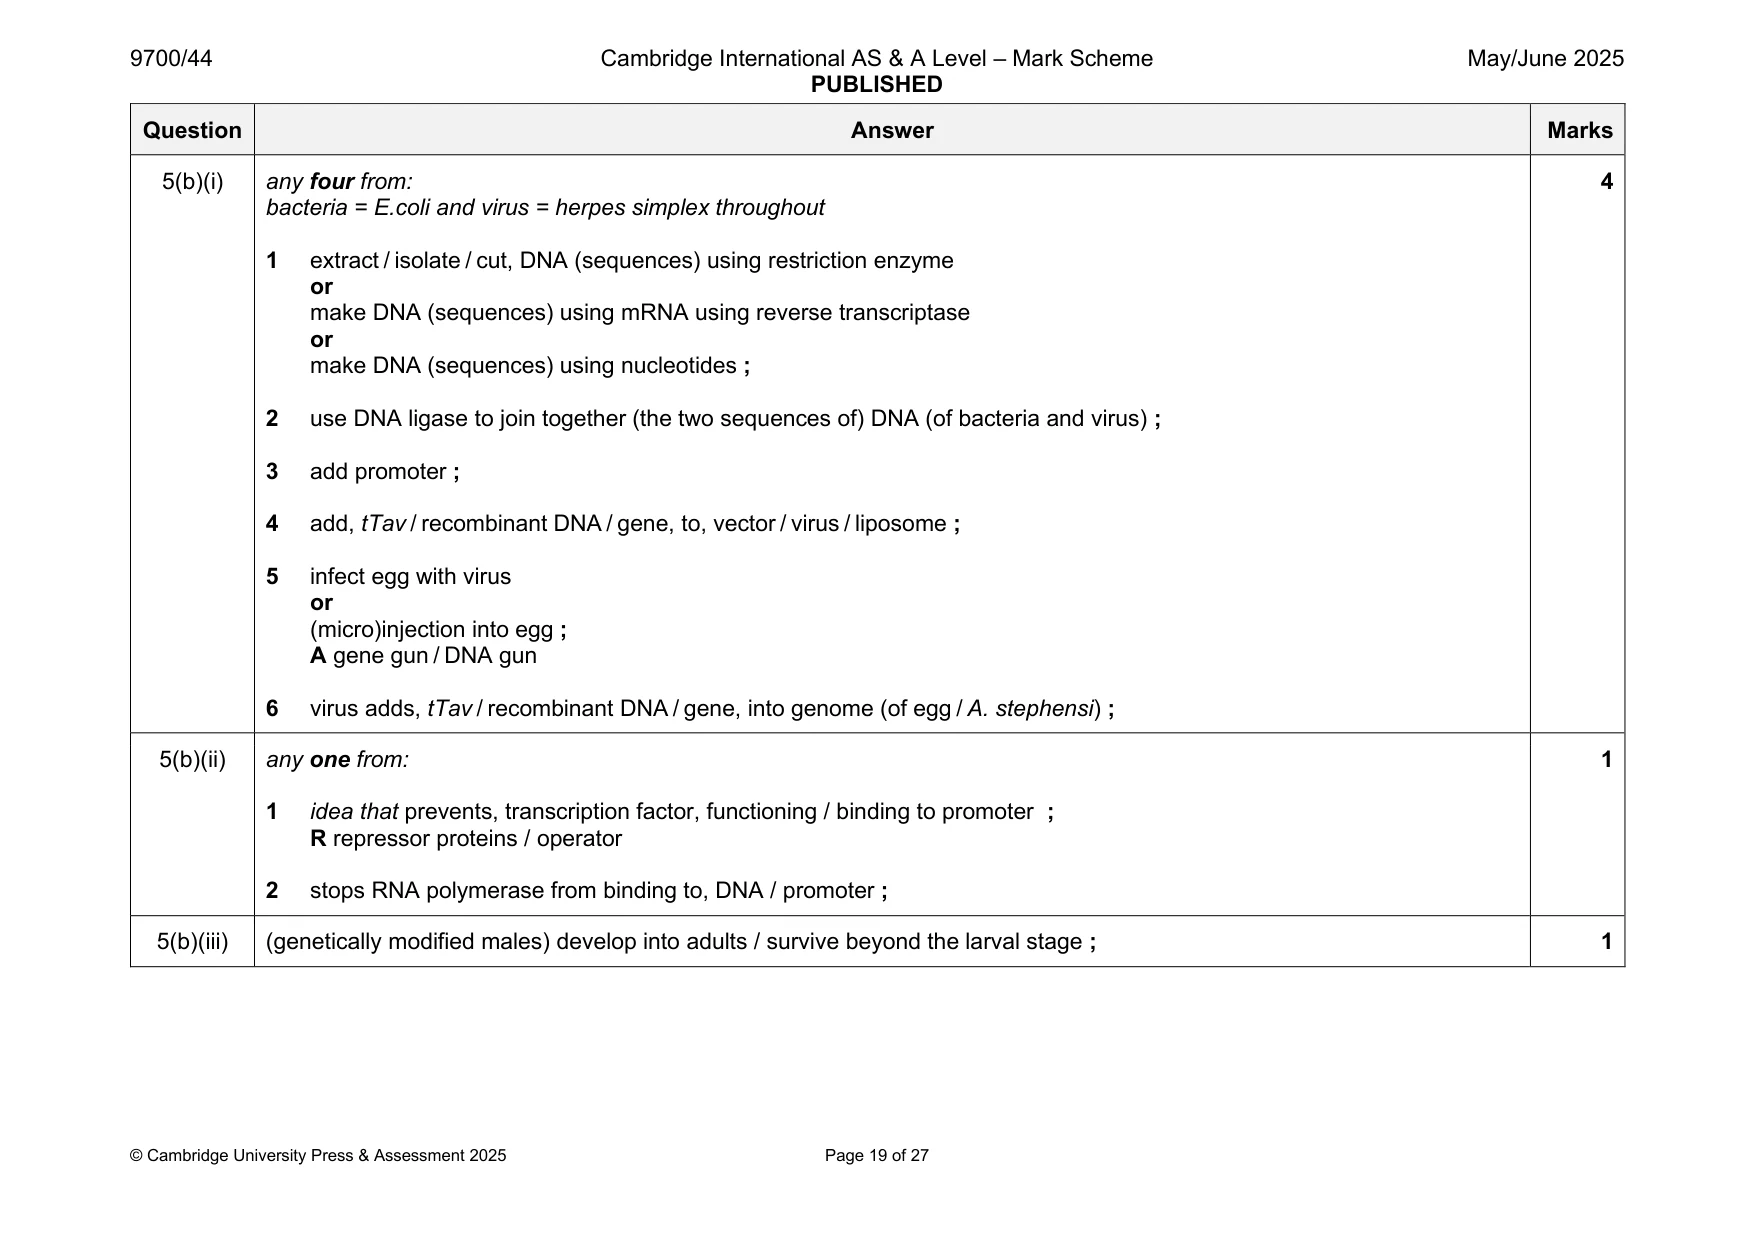
Mark scheme: 5(a) any five from: 5 Allow any temperature within the ranges given 1 denaturation at 90–98 °C ; 2 breaks hydrogen bonds (in DNA) to, produce single strands / separate the (two) strands ; 3 annealing at 50–65 °C ; 4 (so that) primers, anneal / bind, (ss)DNA / complementary bases ; 5 (to provide) binding site / starting point (for Taq polymerase) ; 6 extension or elongation at 65–75 °C ; 7 Taq polymerase joins, (free) nucleotides / dNTPs, to (single) strands or Taq polymerase synthesises, complementary / new, strand (of DNA) ; 5(b)(i) any four from: 4 bacteria = E.coli and virus = herpes simplex throughout 1 extract / isolate / cut, DNA (sequences) using restriction enzyme or make DNA (sequences) using mRNA using reverse transcriptase or make DNA (sequences) using nucleotides ; 2 use DNA ligase to join together (the two sequences of) DNA (of bacteria and virus) ; 3 add promoter ; 4 add, tTav / recombinant DNA / gene, to, vector / virus / liposome ; 5 infect egg with virus or (micro)injection into egg ; A gene gun / DNA gun 6 virus adds, tTav / recombinant DNA / gene, into genome (of egg / A. stephensi) ; 5(b)(ii) any one from: 1 1 idea that prevents, transcription factor, functioning / binding to promoter ; R repressor proteins / operator 2 stops RNA polymerase from binding to, DNA / promoter ; 5(b)(iii) (genetically modified males) develop into adults / survive beyond the larval stage ; 1
Q6 · Ensatina eschscholtzii is a species of salamander that lives in woodland ecosystems in…
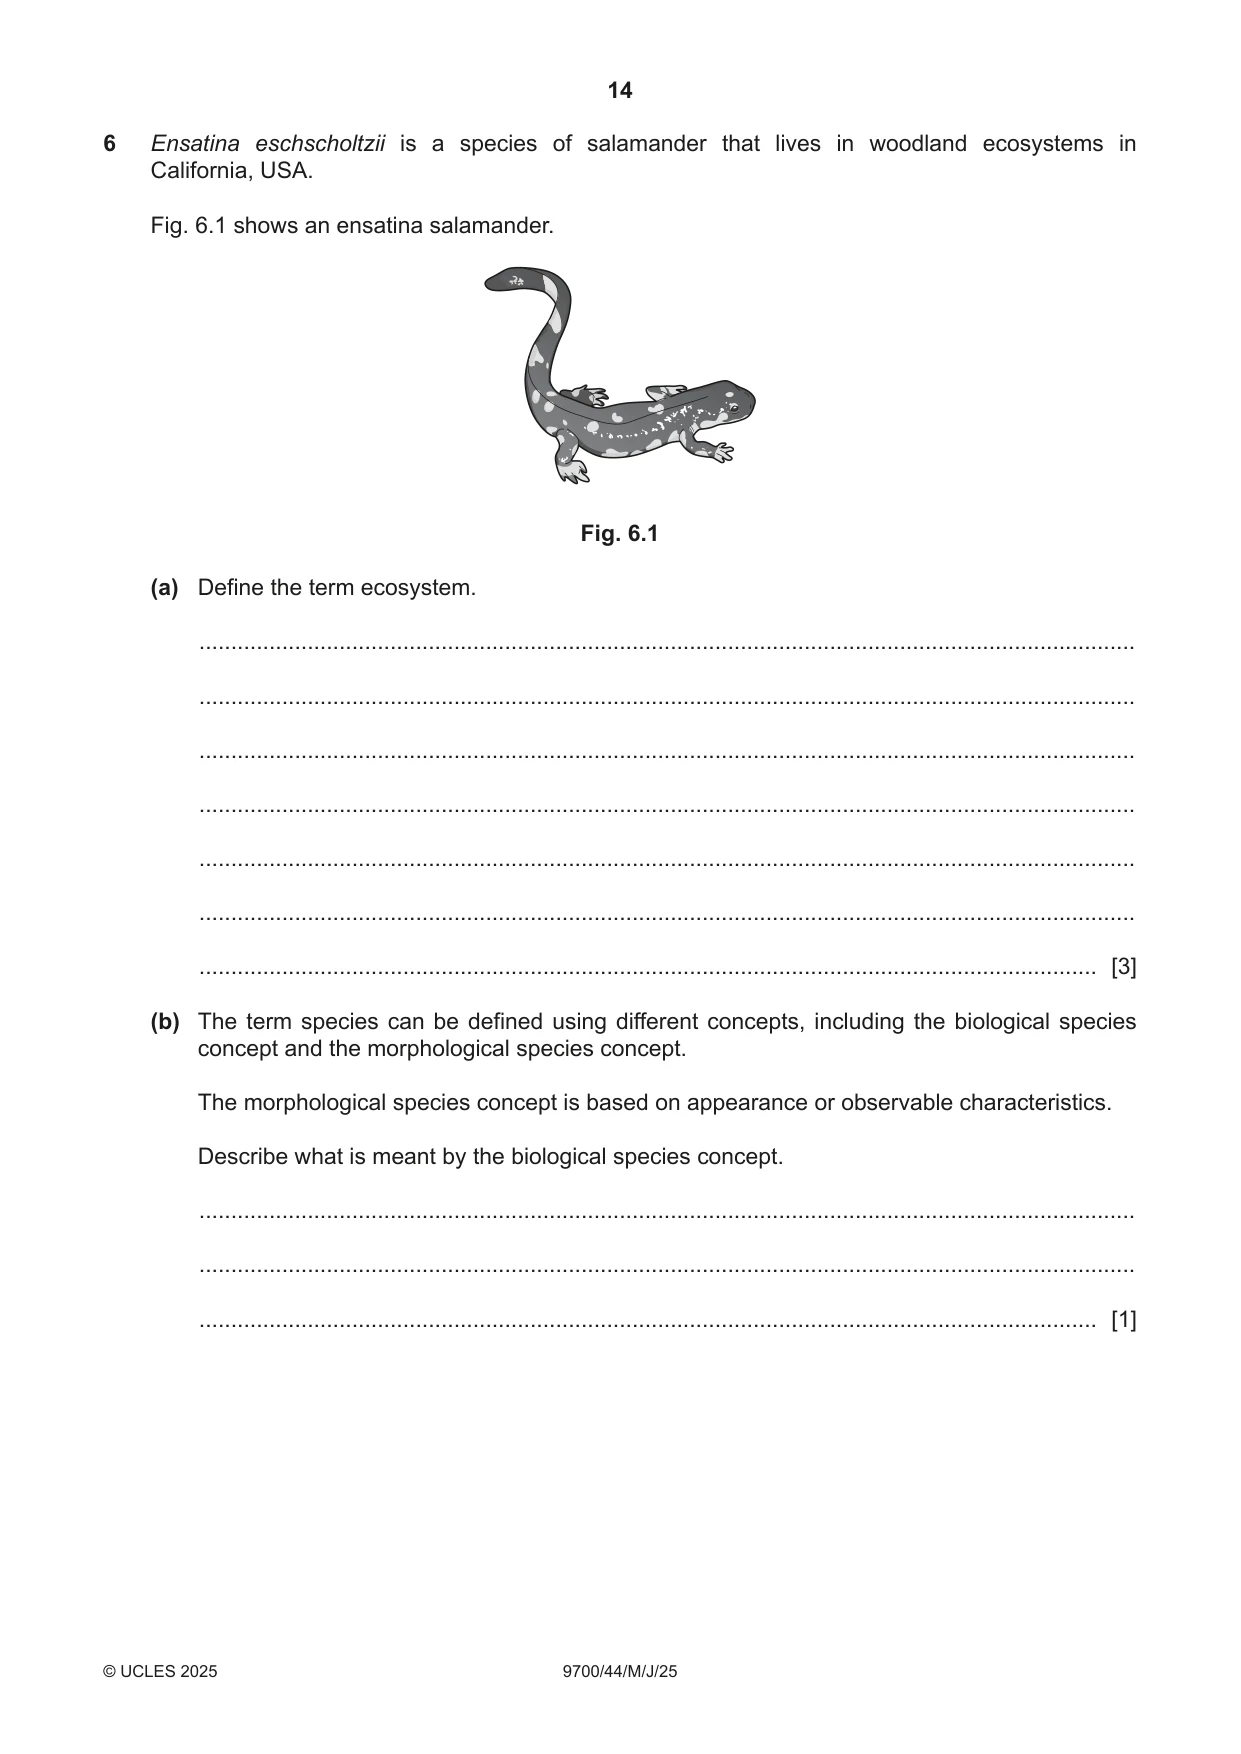
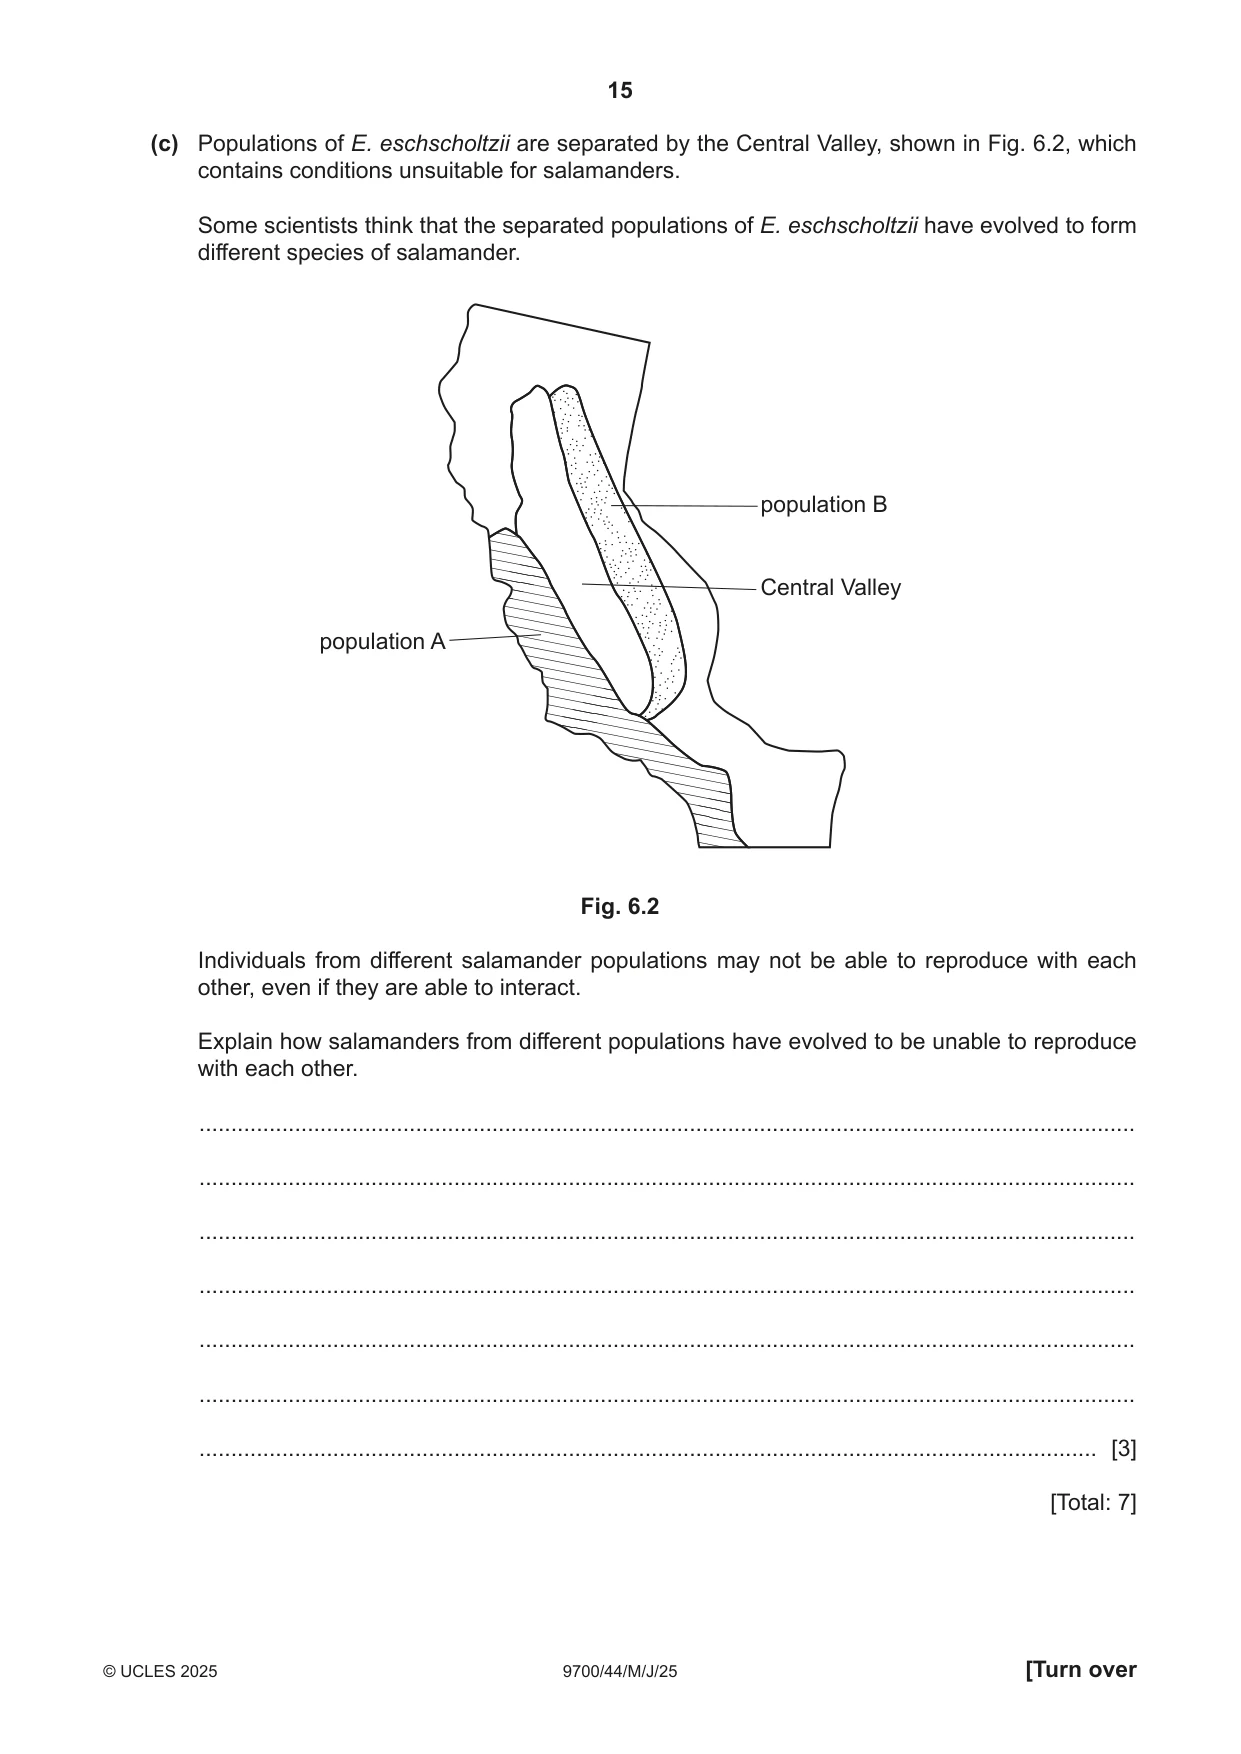
6 Ensatina eschscholtzii is a species of salamander that lives in woodland ecosystems in California, USA. Fig. 6.1 shows an ensatina salamander. Fig. 6.1 (a) Define the term ecosystem. ................................................................................................................................................... ................................................................................................................................................... ................................................................................................................................................... ................................................................................................................................................... ................................................................................................................................................... ................................................................................................................................................... ............................................................................................................................................. [3] (b) The term species can be defined using different concepts, including the biological species concept and the morphological species concept. The morphological species concept is based on appearance or observable characteristics. Describe what is meant by the biological species concept. ................................................................................................................................................... ................................................................................................................................................... ............................................................................................................................................. [1] (c) Populations of E. eschscholtzii are separated by the Central Valley, shown in Fig. 6.2, which contains conditions unsuitable for salamanders. Some scientists think that the separated populations of E. eschscholtzii have evolved to form different species of salamander. population B Central Valley population A Fig. 6.2 Individuals from different salamander populations may not be able to reproduce with each other, even if they are able to interact. Explain how salamanders from different populations have evolved to be unable to reproduce with each other. ................................................................................................................................................... ................................................................................................................................................... ................................................................................................................................................... ................................................................................................................................................... ................................................................................................................................................... ................................................................................................................................................... ............................................................................................................................................. [3] [Total: 7]
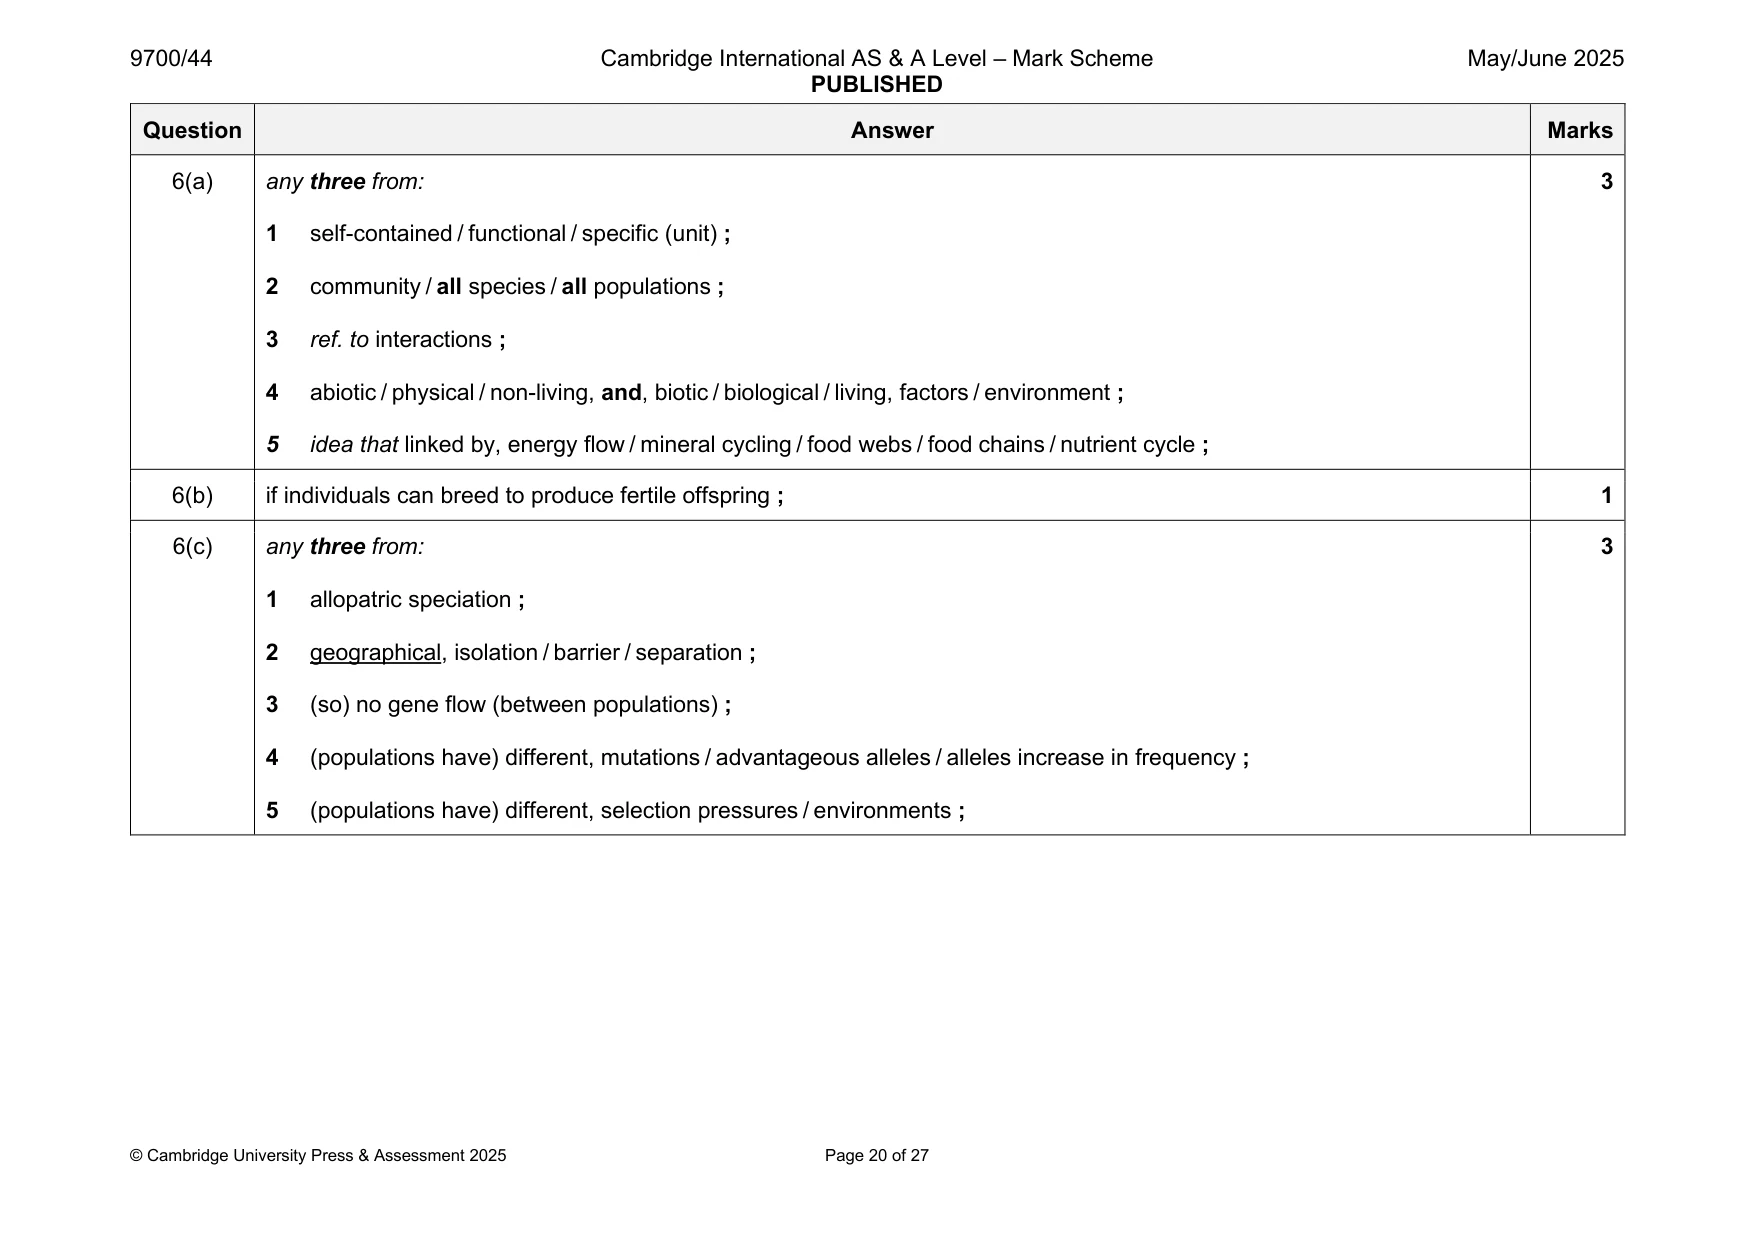
Mark scheme: 6(a) any three from: 3 1 self-contained / functional / specific (unit) ; 2 community / all species / all populations ; 3 ref. to interactions ; 4 abiotic / physical / non-living, and, biotic / biological / living, factors / environment ; 5 idea that linked by, energy flow / mineral cycling / food webs / food chains / nutrient cycle ; 6(b) if individuals can breed to produce fertile offspring ; 1 6(c) any three from: 3 1 allopatric speciation ; 2 geographical, isolation / barrier / separation ; 3 (so) no gene flow (between populations) ; 4 (populations have) different, mutations / advantageous alleles / alleles increase in frequency ; 5 (populations have) different, selection pressures / environments ;
Q7 · The grass Oryza sativa is grown as a food crop to produce rice
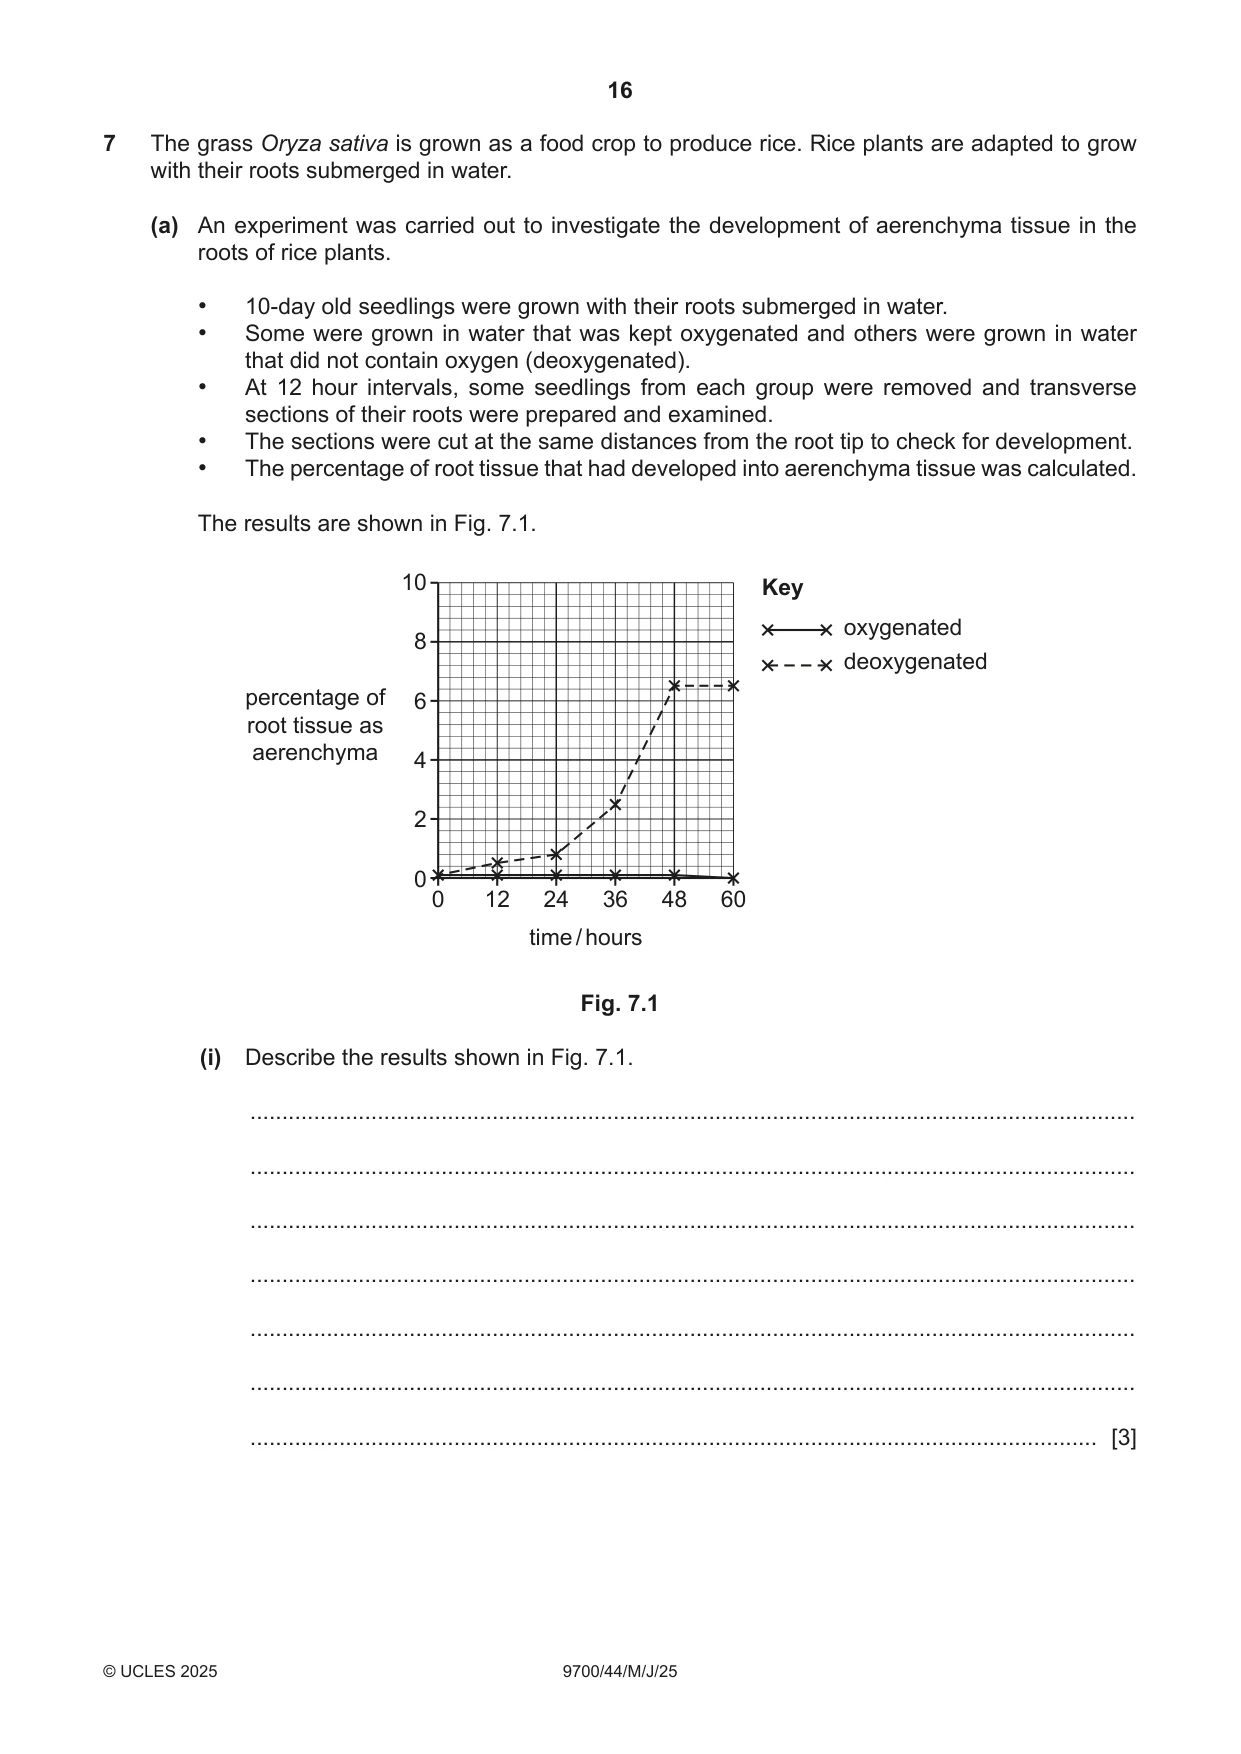
7 The grass Oryza sativa is grown as a food crop to produce rice. Rice plants are adapted to grow with their roots submerged in water. (a) An experiment was carried out to investigate the development of aerenchyma tissue in the roots of rice plants. • 10-day old seedlings were grown with their roots submerged in water. • Some were grown in water that was kept oxygenated and others were grown in water that did not contain oxygen (deoxygenated). • At 12 hour intervals, some seedlings from each group were removed and transverse sections of their roots were prepared and examined. • The sections were cut at the same distances from the root tip to check for development. • The percentage of root tissue that had developed into aerenchyma tissue was calculated. The results are shown in Fig. 7.1. 10 Key oxygenated 8 deoxygenated percentage of 6 root tissue as aerenchyma 4 2 0 0 12 24 36 48 60 time / hours Fig. 7.1 (i) Describe the results shown in Fig. 7.1. ........................................................................................................................................... ........................................................................................................................................... ........................................................................................................................................... ........................................................................................................................................... ........................................................................................................................................... ........................................................................................................................................... ..................................................................................................................................... [3] (ii) Describe the structure of aerenchyma and explain how this is an adaptation that allows roots of rice plants to be submerged in water. ........................................................................................................................................... ........................................................................................................................................... ........................................................................................................................................... ........................................................................................................................................... ........................................................................................................................................... ........................................................................................................................................... ..................................................................................................................................... [3] (b) Describe and explain two other adaptations of rice plants to growing in flooded fields. ................................................................................................................................................... ................................................................................................................................................... ................................................................................................................................................... ................................................................................................................................................... ................................................................................................................................................... ................................................................................................................................................... ............................................................................................................................................. [4] [Total: 10]
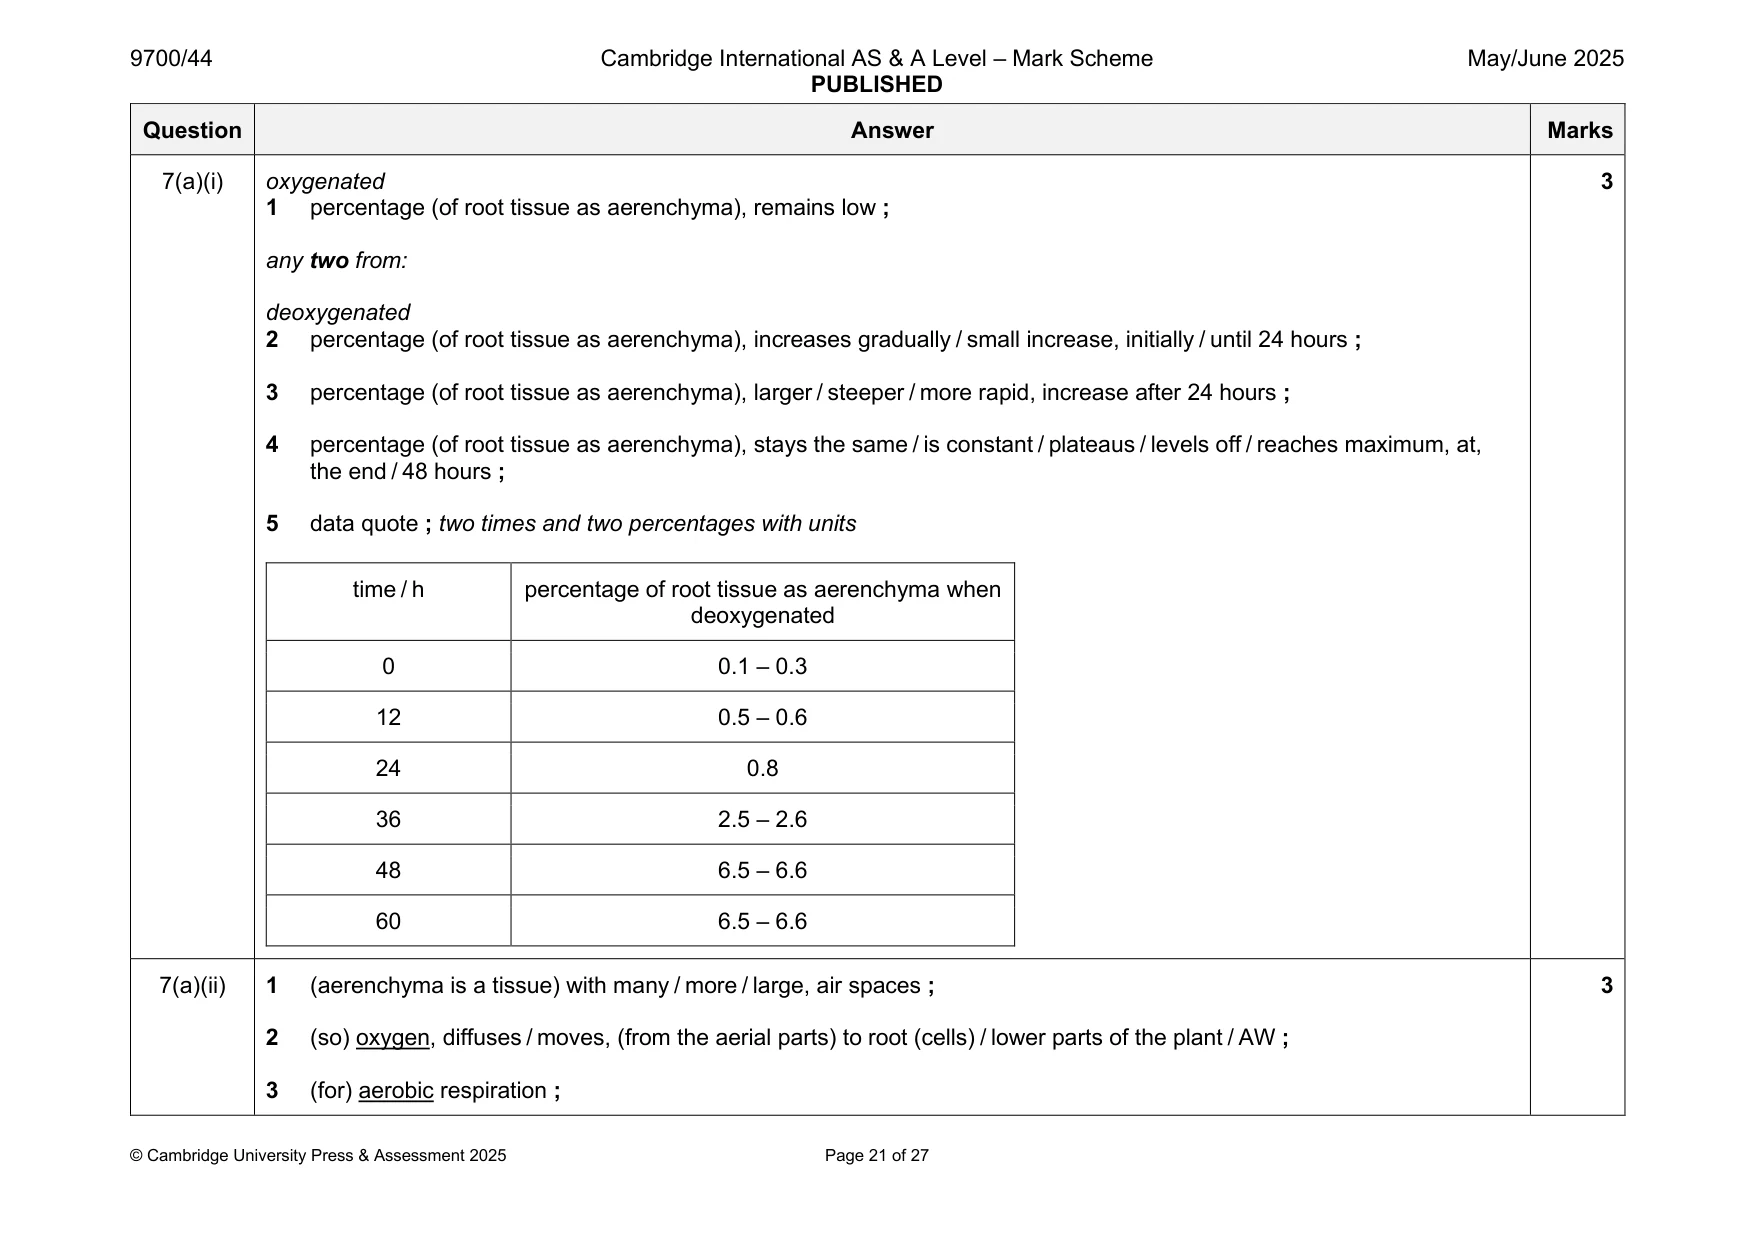
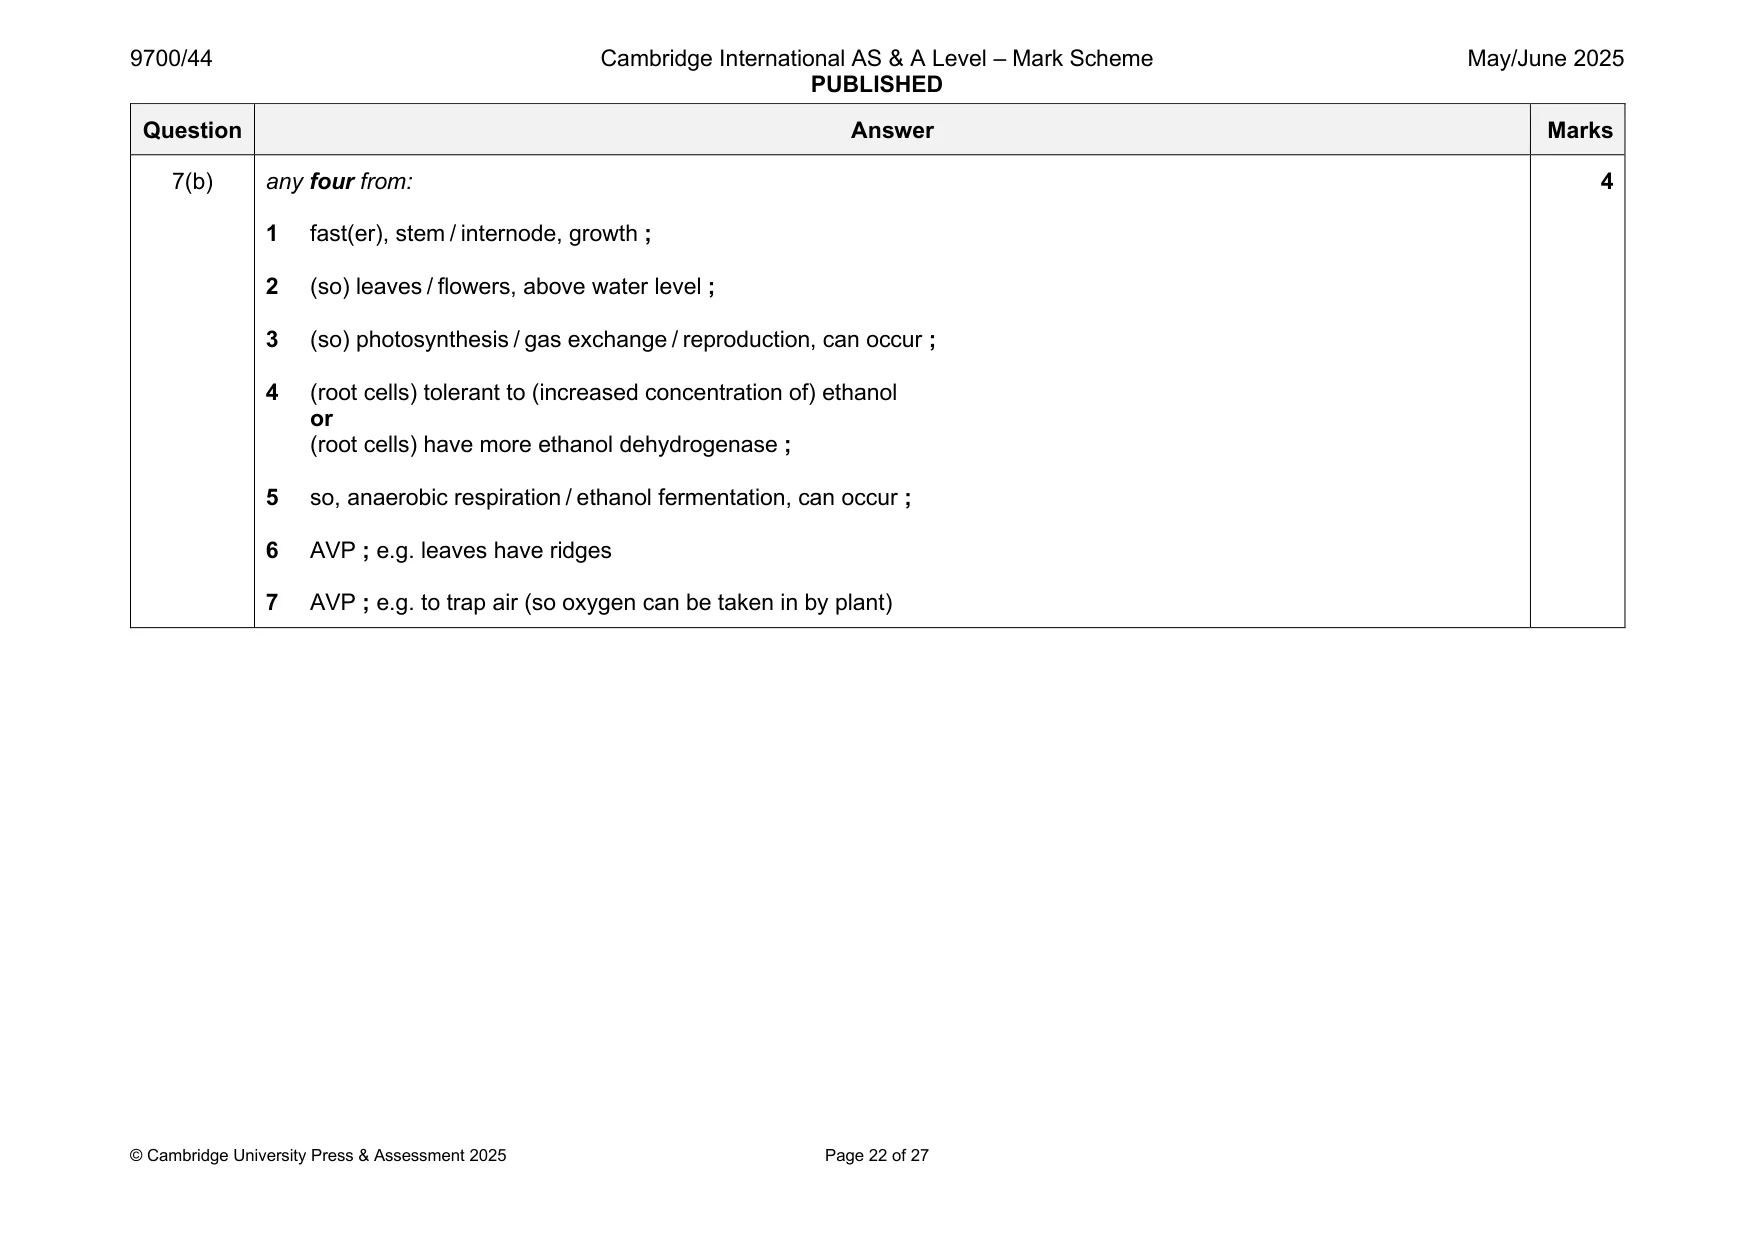
Mark scheme: 7(a)(i) oxygenated 3 1 percentage (of root tissue as aerenchyma), remains low ; any two from: deoxygenated 2 percentage (of root tissue as aerenchyma), increases gradually / small increase, initially / until 24 hours ; 3 percentage (of root tissue as aerenchyma), larger / steeper / more rapid, increase after 24 hours ; 4 percentage (of root tissue as aerenchyma), stays the same / is constant / plateaus / levels off / reaches maximum, at, the end / 48 hours ; 5 data quote ; two times and two percentages with units time / h percentage of root tissue as aerenchyma when deoxygenated 0 0.1 – 0.3 12 0.5 – 0.6 24 0.8 36 2.5 – 2.6 48 6.5 – 6.6 60 6.5 – 6.6 7(a)(ii) 1 (aerenchyma is a tissue) with many / more / large, air spaces ; 3 2 (so) oxygen, diffuses / moves, (from the aerial parts) to root (cells) / lower parts of the plant / AW ; 3 (for) aerobic respiration ; 7(b) any four from: 4 1 fast(er), stem / internode, growth ; 2 (so) leaves / flowers, above water level ; 3 (so) photosynthesis / gas exchange / reproduction, can occur ; 4 (root cells) tolerant to (increased concentration of) ethanol or (root cells) have more ethanol dehydrogenase ; 5 so, anaerobic respiration / ethanol fermentation, can occur ; 6 AVP ; e.g. leaves have ridges 7 AVP ; e.g. to trap air (so oxygen can be taken in by plant)
Q8 · A transmission electron micrograph of striated muscle
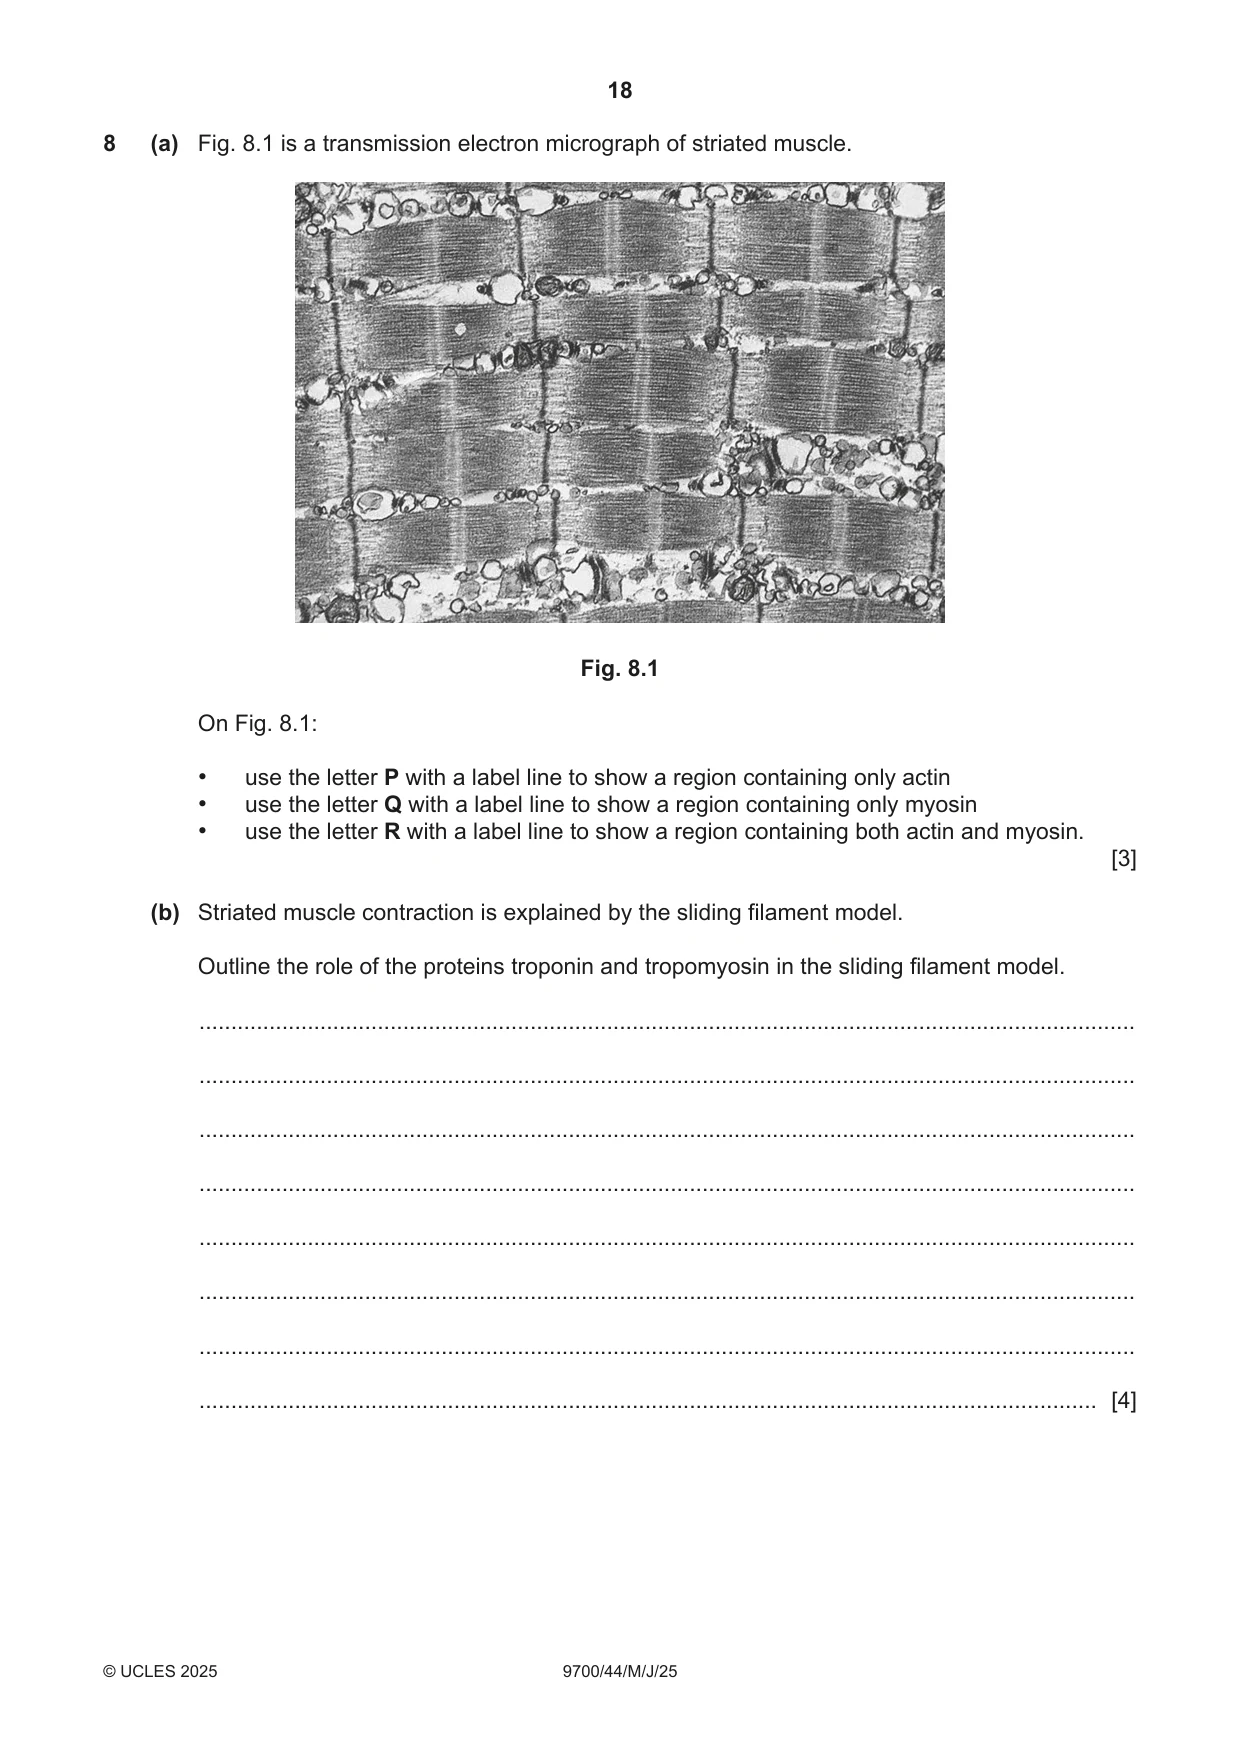
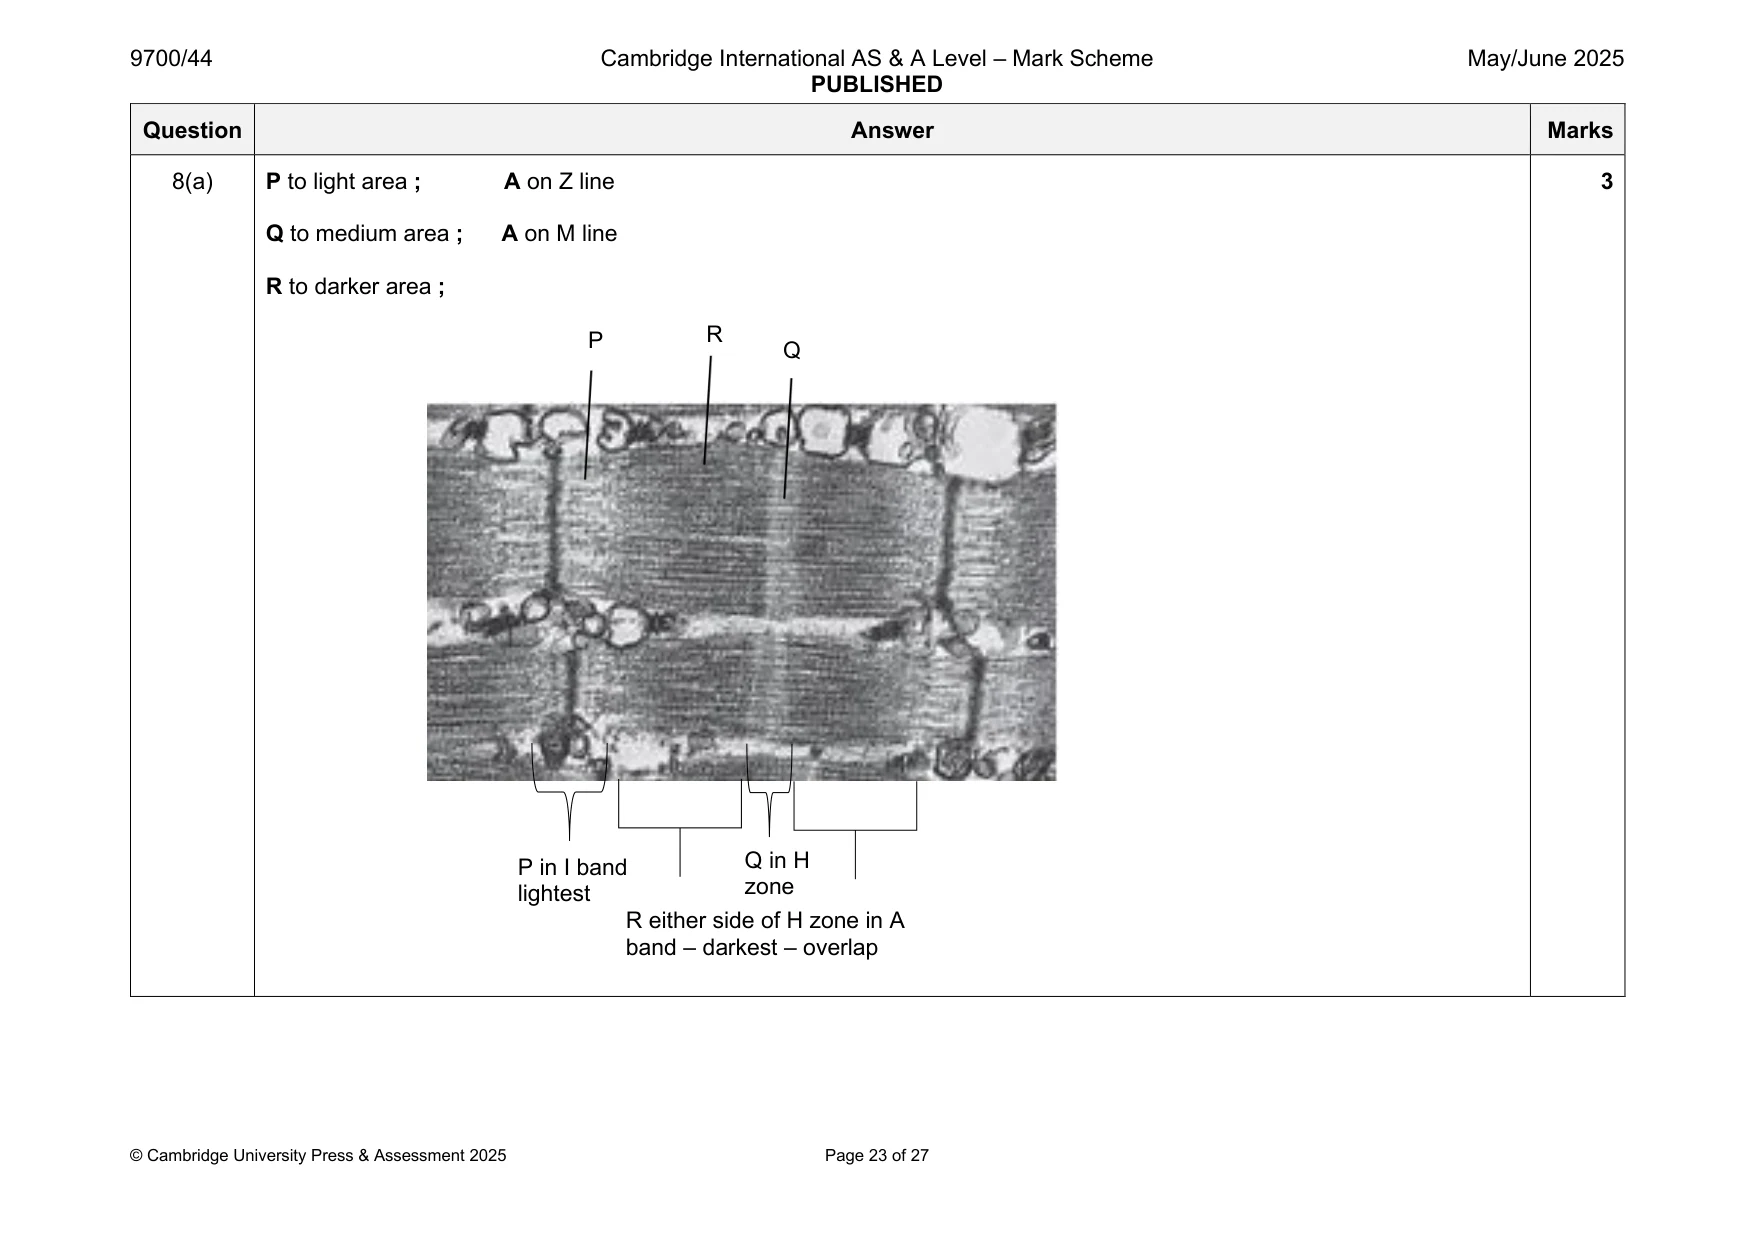
8 (a) Fig. 8.1 is a transmission electron micrograph of striated muscle. Fig. 8.1 On Fig. 8.1: • use the letter P with a label line to show a region containing only actin • use the letter Q with a label line to show a region containing only myosin • use the letter R with a label line to show a region containing both actin and myosin. [3] (b) Striated muscle contraction is explained by the sliding filament model. Outline the role of the proteins troponin and tropomyosin in the sliding filament model. ................................................................................................................................................... ................................................................................................................................................... ................................................................................................................................................... ................................................................................................................................................... ................................................................................................................................................... ................................................................................................................................................... ................................................................................................................................................... ............................................................................................................................................. [4] (c) Striated muscles can sometimes become less efficient at contracting if they have been active for a long time. This is called muscle fatigue. Suggest why muscles may become fatigued. ................................................................................................................................................... ................................................................................................................................................... ................................................................................................................................................... ................................................................................................................................................... ................................................................................................................................................... ................................................................................................................................................... ............................................................................................................................................. [2] [Total: 9]
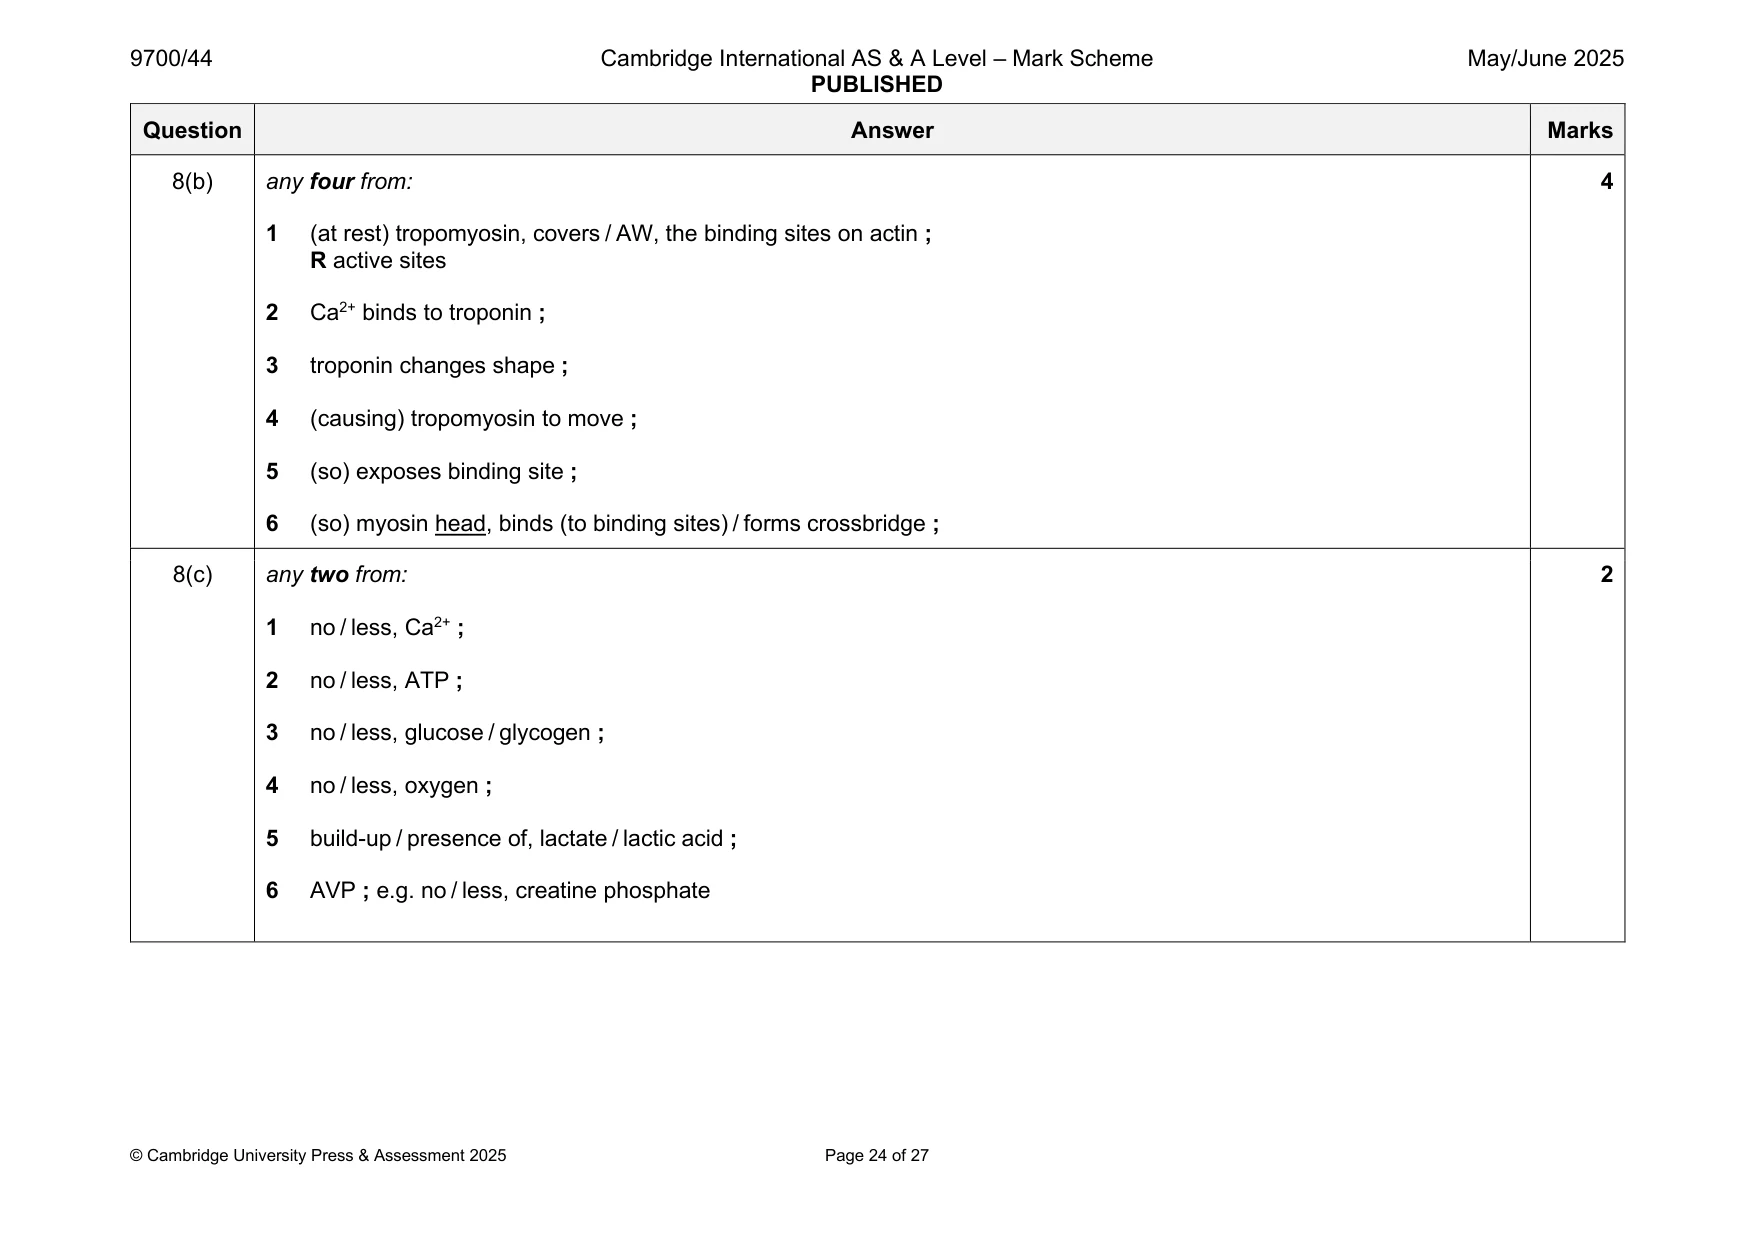
Mark scheme: 8(a) P to light area ; A on Z line 3 Q to medium area ; A on M line R to darker area ; P R Q Q in H P in I band zone lightest R either side of H zone in A band – darkest – overlap 8(b) any four from: 4 1 (at rest) tropomyosin, covers / AW, the binding sites on actin ; R active sites 2 Ca2+ binds to troponin ; 3 troponin changes shape ; 4 (causing) tropomyosin to move ; 5 (so) exposes binding site ; 6 (so) myosin head, binds (to binding sites) / forms crossbridge ; 8(c) any two from: 2 1 no / less, Ca2+ ; 2 no / less, ATP ; 3 no / less, glucose / glycogen ; 4 no / less, oxygen ; 5 build-up / presence of, lactate / lactic acid ; 6 AVP ; e.g. no / less, creatine phosphate
Q9 · A diagram outlining non-cyclic photophosphorylation
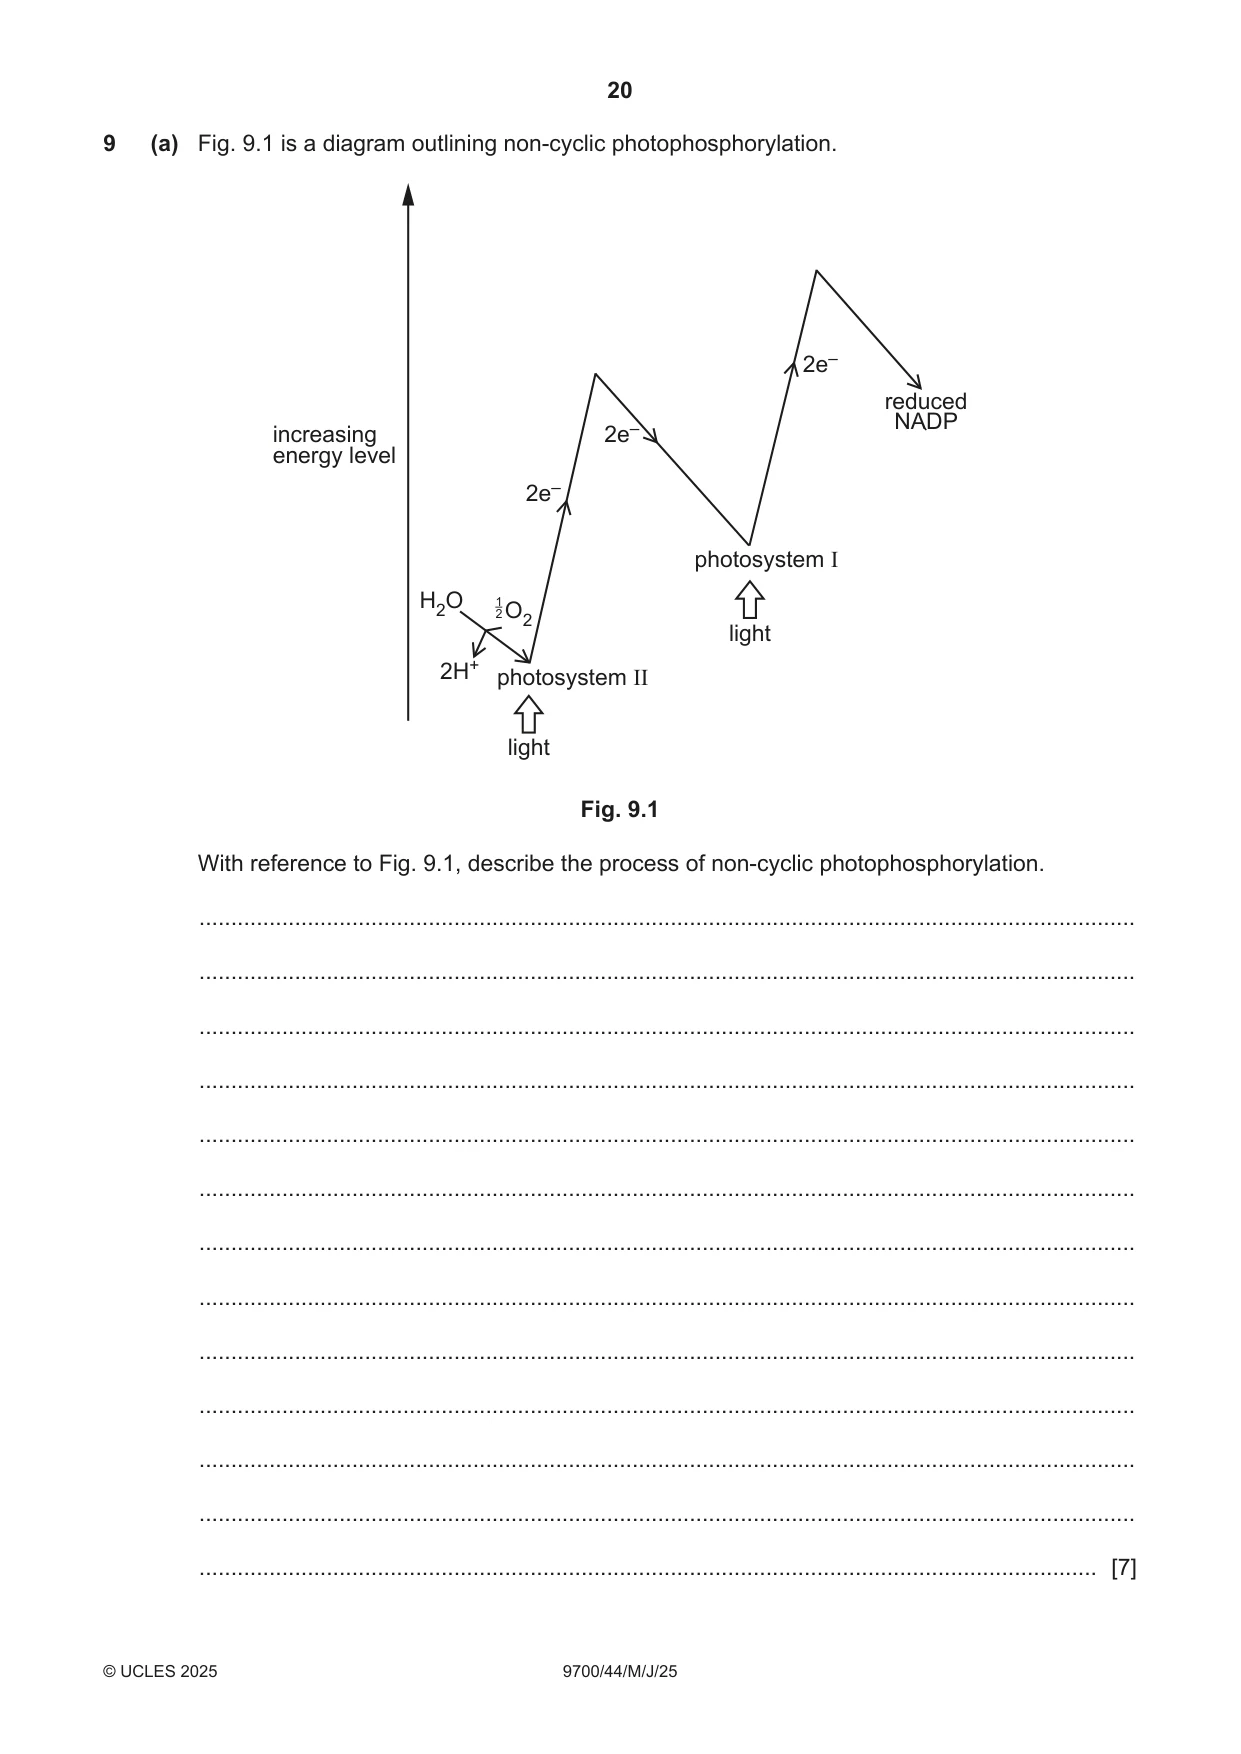
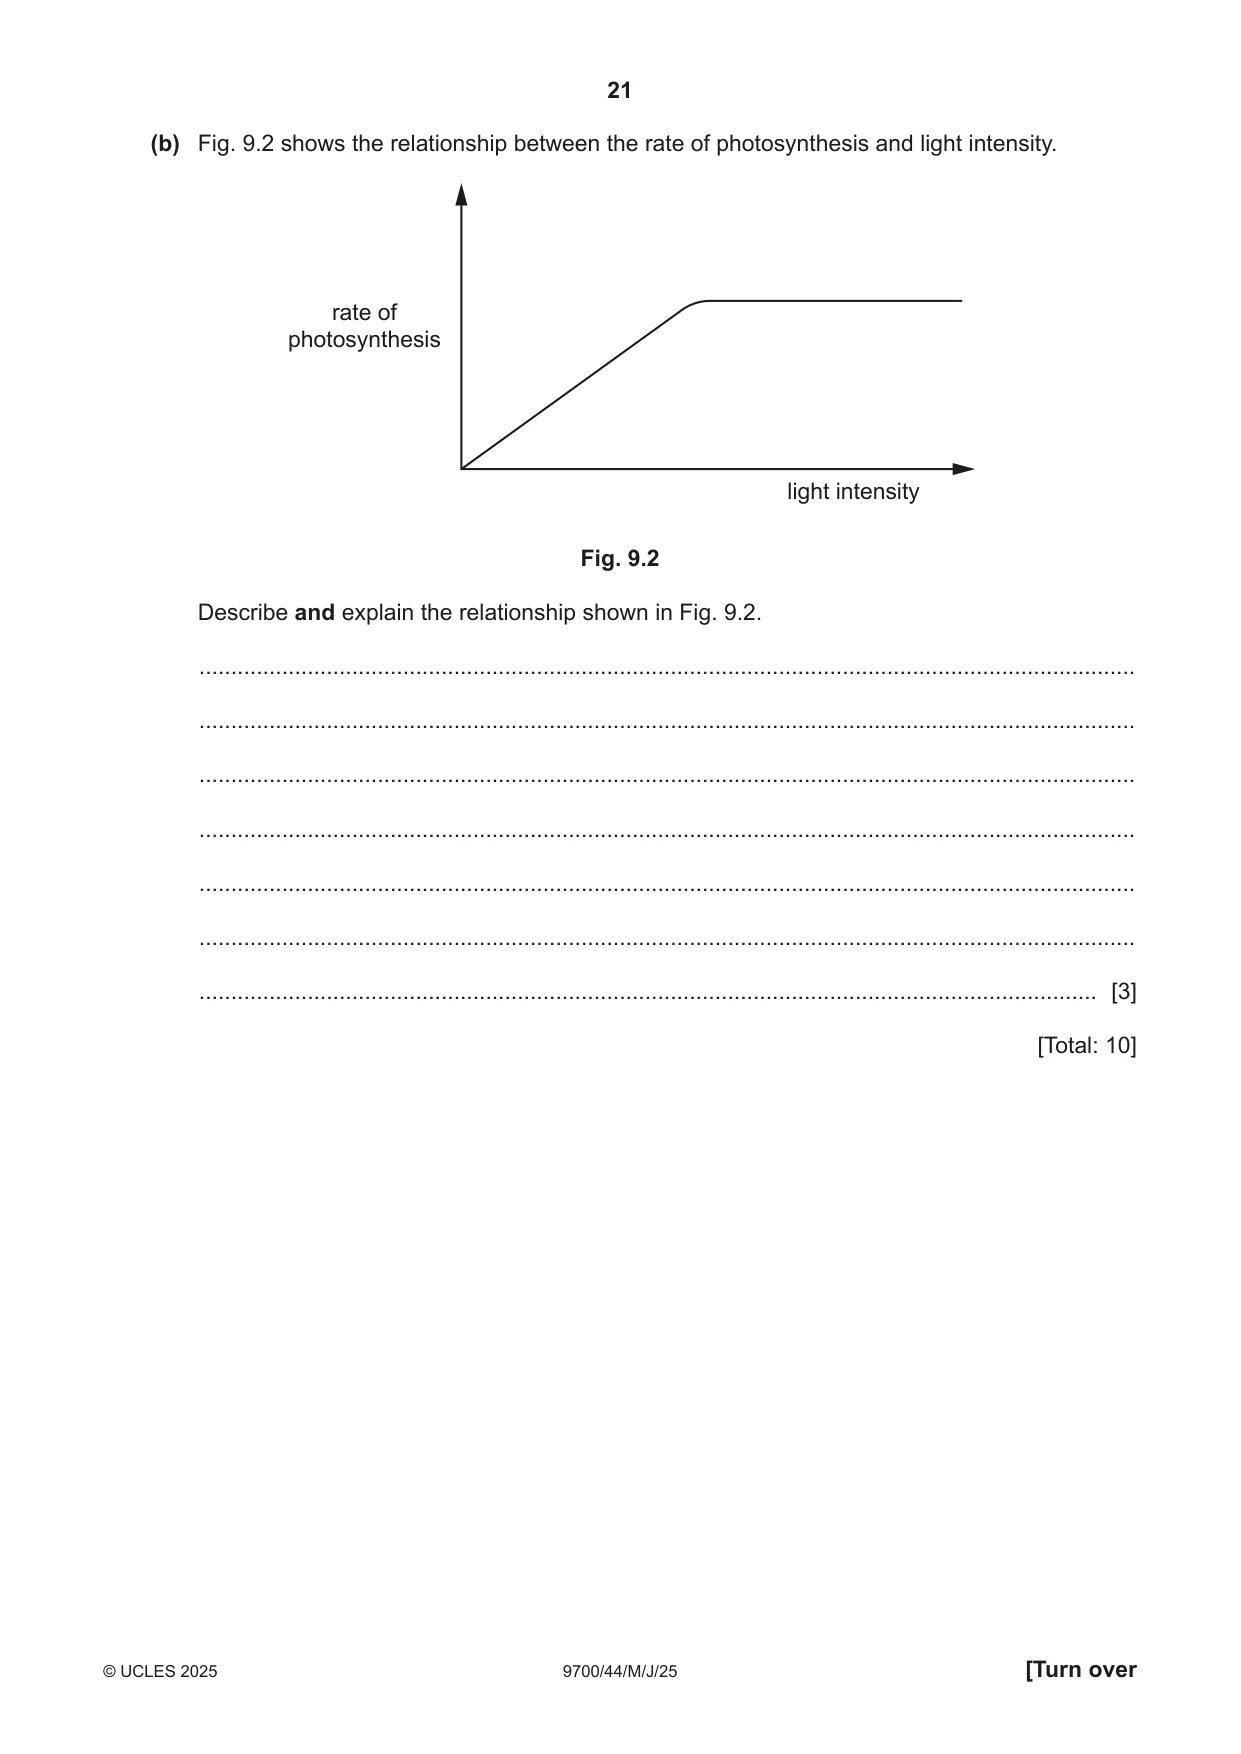
9 (a) Fig. 9.1 is a diagram outlining non-cyclic photophosphorylation. 2e– reduced NADP increasing 2e– energy level 2e– photosystem I 1 H2O 2O2 light 2H+ photosystem II light Fig. 9.1 With reference to Fig. 9.1, describe the process of non-cyclic photophosphorylation. ................................................................................................................................................... ................................................................................................................................................... ................................................................................................................................................... ................................................................................................................................................... ................................................................................................................................................... ................................................................................................................................................... ................................................................................................................................................... ................................................................................................................................................... ................................................................................................................................................... ................................................................................................................................................... ................................................................................................................................................... ................................................................................................................................................... ............................................................................................................................................. [7] (b) Fig. 9.2 shows the relationship between the rate of photosynthesis and light intensity. rate of photosynthesis light intensity Fig. 9.2 Describe and explain the relationship shown in Fig. 9.2. ................................................................................................................................................... ................................................................................................................................................... ................................................................................................................................................... ................................................................................................................................................... ................................................................................................................................................... ................................................................................................................................................... ............................................................................................................................................. [3] [Total: 10]
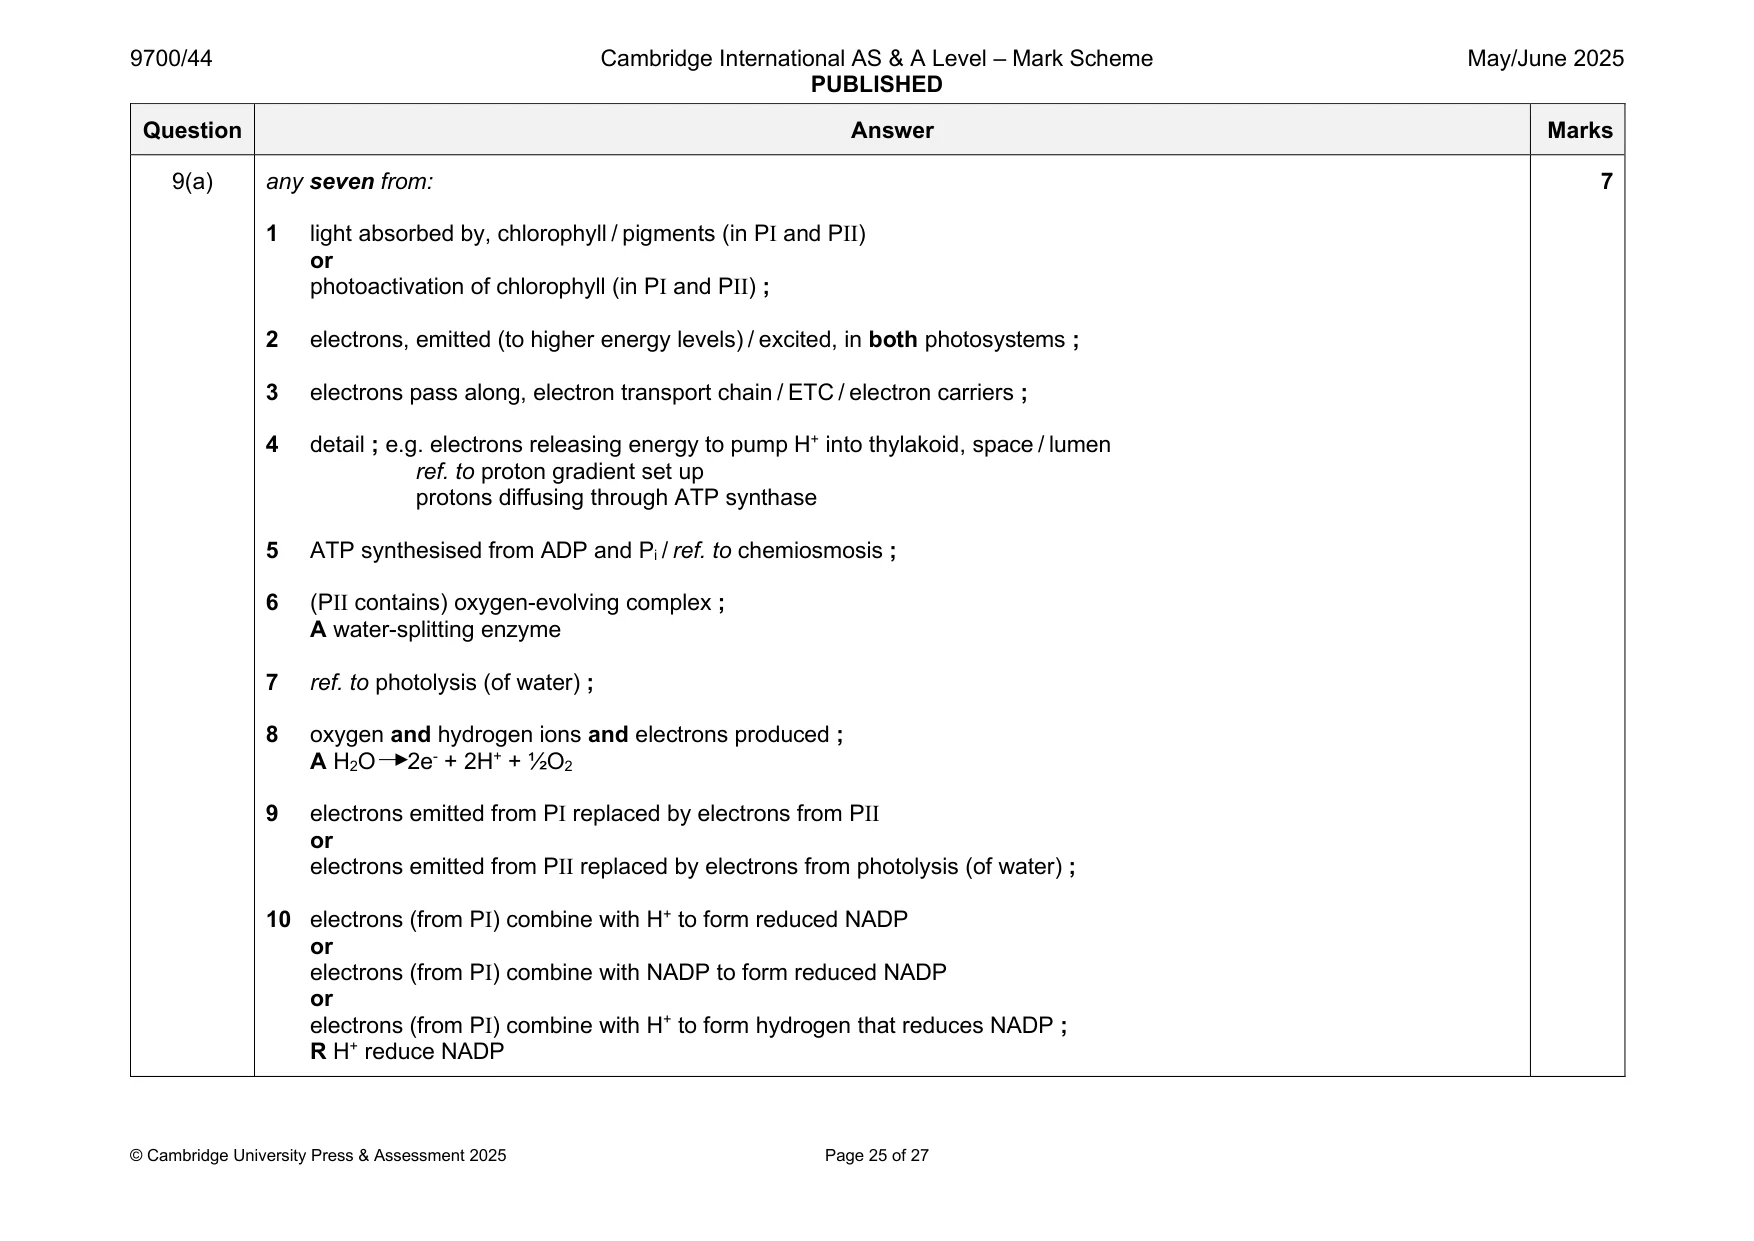
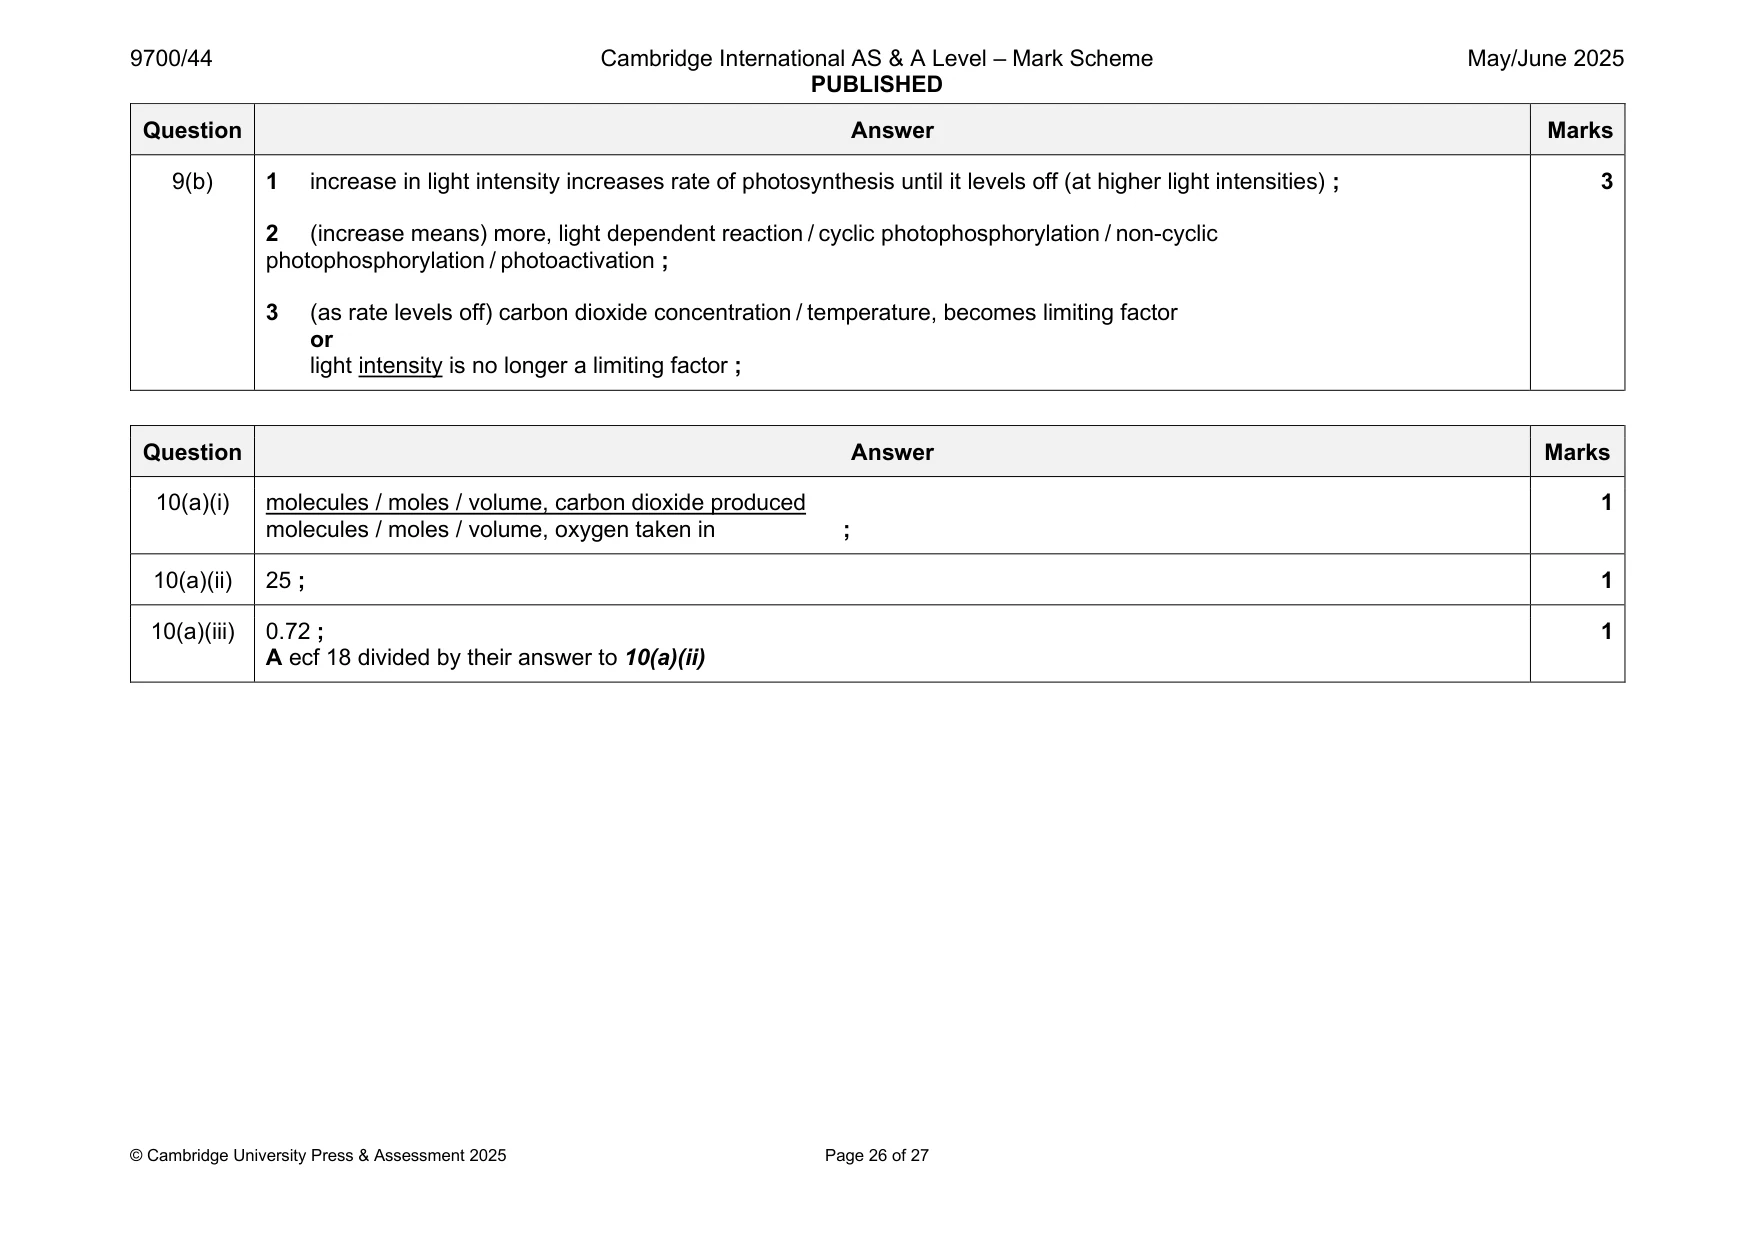
Mark scheme: 9(a) any seven from: 7 1 light absorbed by, chlorophyll / pigments (in PI and PII) or photoactivation of chlorophyll (in PI and PII) ; 2 electrons, emitted (to higher energy levels) / excited, in both photosystems ; 3 electrons pass along, electron transport chain / ETC / electron carriers ; 4 detail ; e.g. electrons releasing energy to pump H+ into thylakoid, space / lumen ref. to proton gradient set up protons diffusing through ATP synthase 5 ATP synthesised from ADP and Pi / ref. to chemiosmosis ; 6 (PII contains) oxygen-evolving complex ; A water-splitting enzyme 7 ref. to photolysis (of water) ; 8 oxygen and hydrogen ions and electrons produced ; A H2O 2e- + 2H+ + ½O2 9 electrons emitted from PI replaced by electrons from PII or electrons emitted from PII replaced by electrons from photolysis (of water) ; 10 electrons (from PI) combine with H+ to form reduced NADP or electrons (from PI) combine with NADP to form reduced NADP or electrons (from PI) combine with H+ to form hydrogen that reduces NADP ; R H+ reduce NADP 9(b) 1 increase in light intensity increases rate of photosynthesis until it levels off (at higher light intensities) ; 3 2 (increase means) more, light dependent reaction / cyclic photophosphorylation / non-cyclic photophosphorylation / photoactivation ; 3 (as rate levels off) carbon dioxide concentration / temperature, becomes limiting factor or light intensity is no longer a limiting factor ;
More questions on Photosynthesis as an energy transfer process
Q10 · The respiratory quotient (RQ) is used to indicate what type of substrate is being…
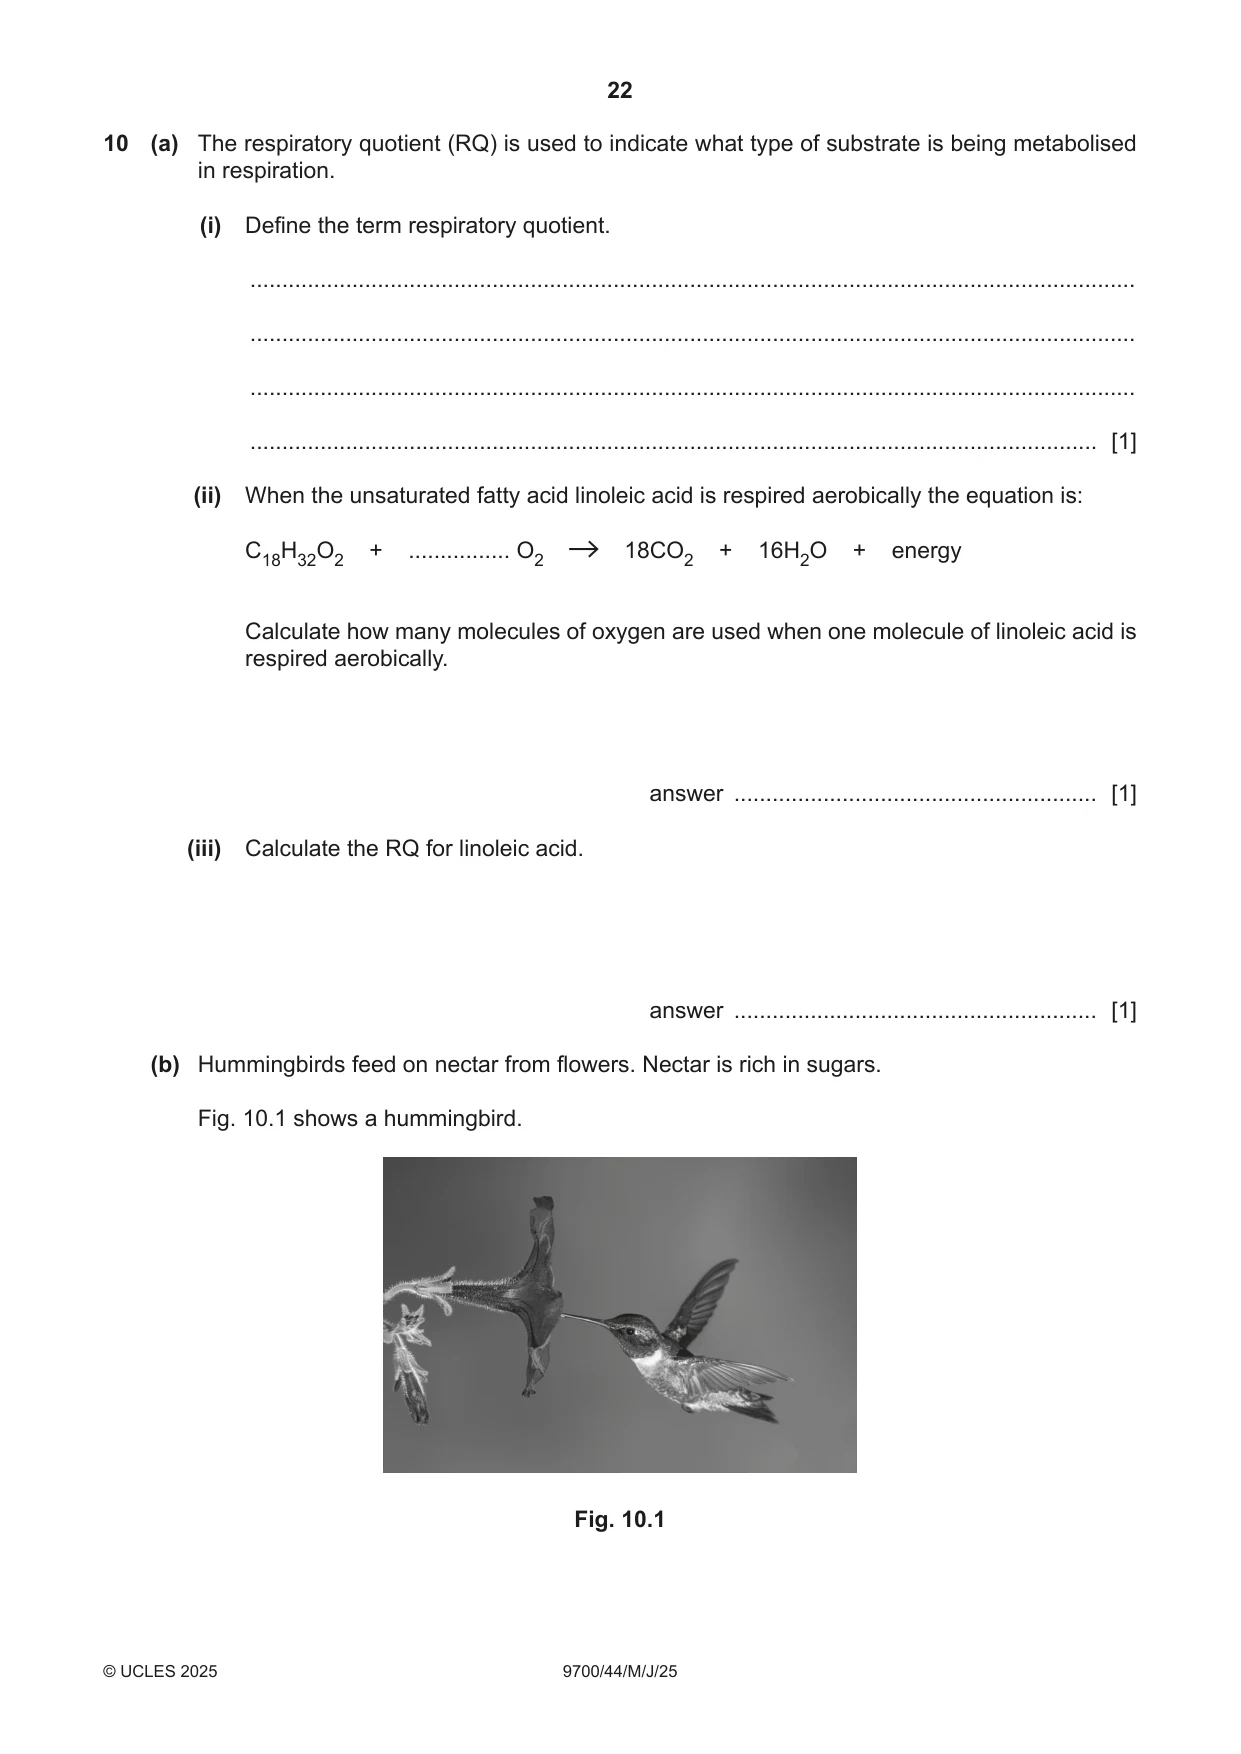
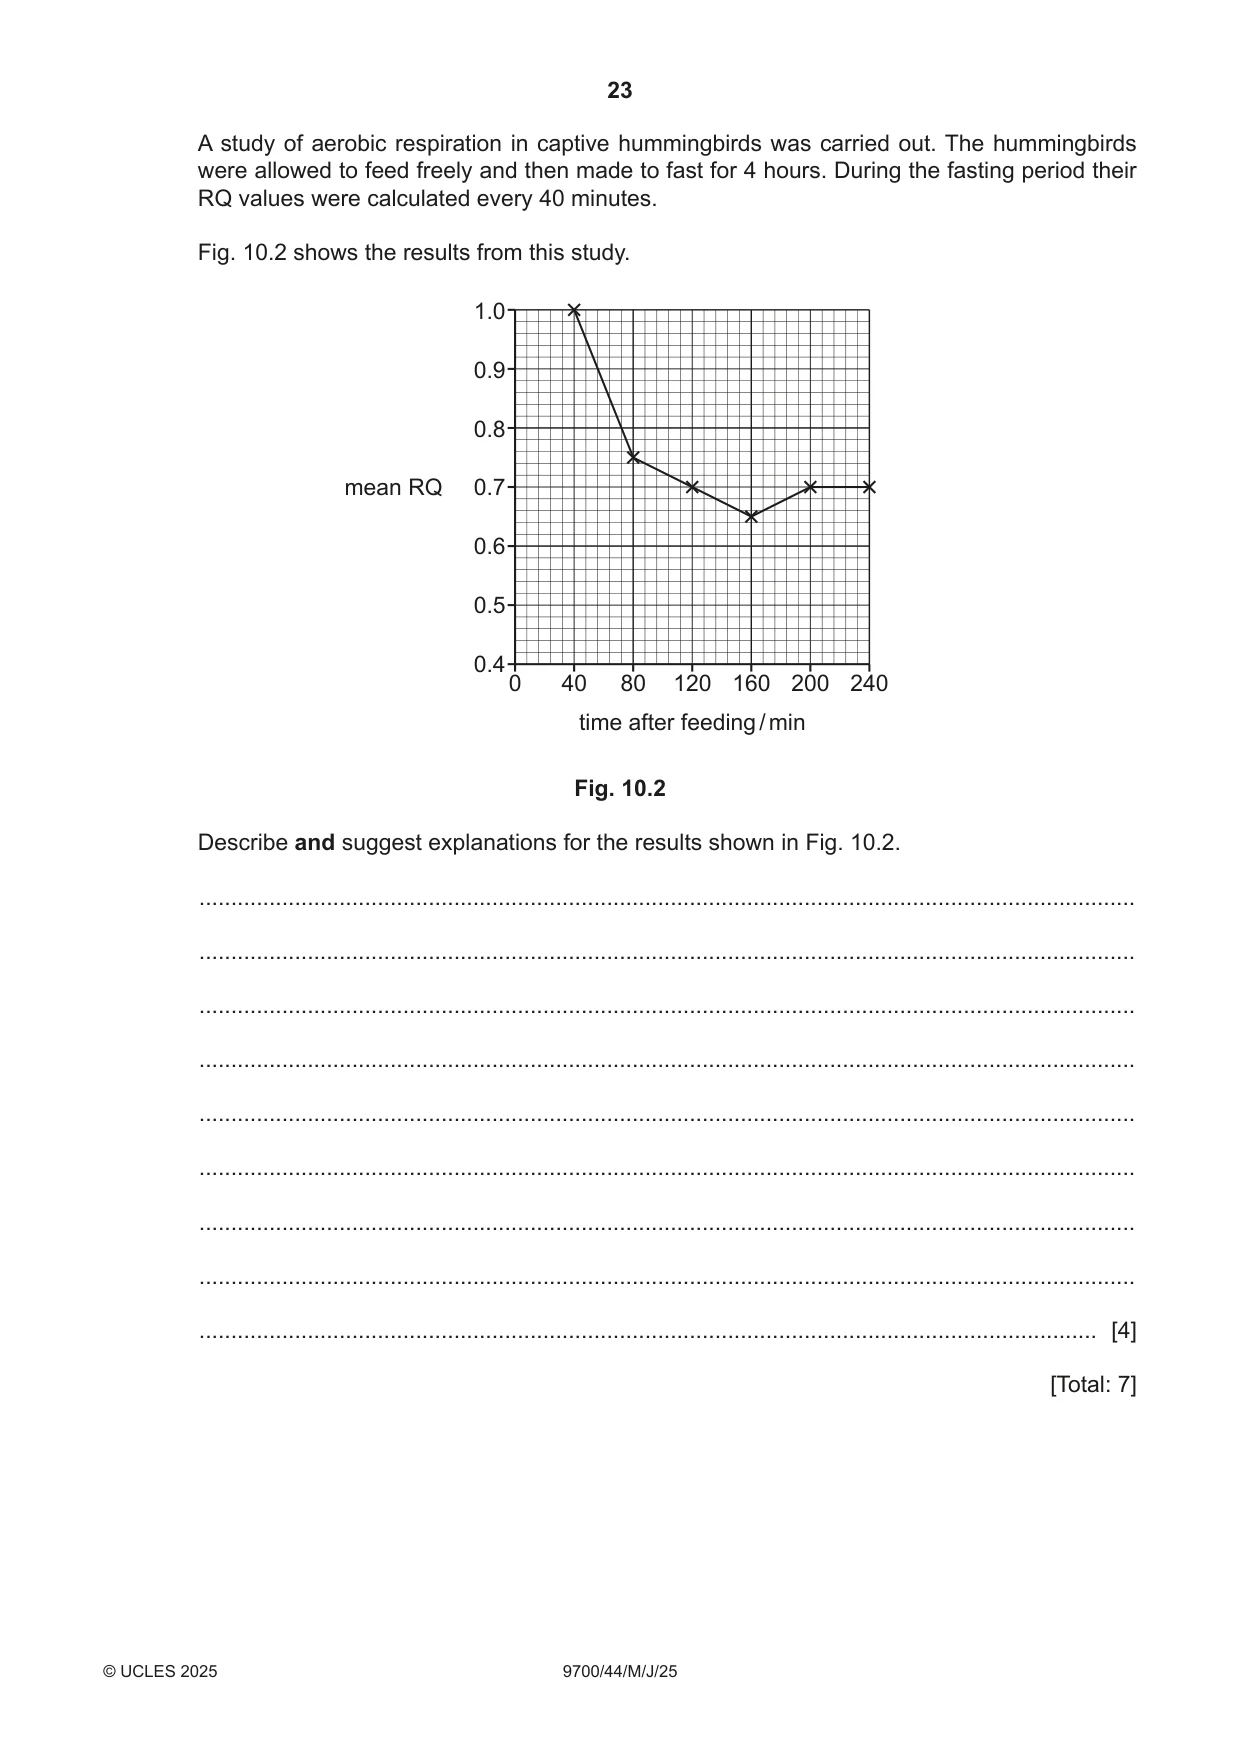
10 (a) The respiratory quotient (RQ) is used to indicate what type of substrate is being metabolised in respiration. (i) Define the term respiratory quotient. ........................................................................................................................................... ........................................................................................................................................... ........................................................................................................................................... ..................................................................................................................................... [1] (ii) When the unsaturated fatty acid linoleic acid is respired aerobically the equation is: C18H32O2 + ................ O2 18CO2 + 16H2O + energy Calculate how many molecules of oxygen are used when one molecule of linoleic acid is respired aerobically. answer ......................................................... [1] (iii) Calculate the RQ for linoleic acid. answer ......................................................... [1] (b) Hummingbirds feed on nectar from flowers. Nectar is rich in sugars. Fig. 10.1 shows a hummingbird. Fig. 10.1 A study of aerobic respiration in captive hummingbirds was carried out. The hummingbirds were allowed to feed freely and then made to fast for 4 hours. During the fasting period their RQ values were calculated every 40 minutes. Fig. 10.2 shows the results from this study. 1.0 0.9 0.8 mean RQ 0.7 0.6 0.5 0.4 0 40 80 120 160 200 240 time after feeding / min Fig. 10.2 Describe and suggest explanations for the results shown in Fig. 10.2. ................................................................................................................................................... ................................................................................................................................................... ................................................................................................................................................... ................................................................................................................................................... ................................................................................................................................................... ................................................................................................................................................... ................................................................................................................................................... ................................................................................................................................................... ............................................................................................................................................. [4] [Total: 7]
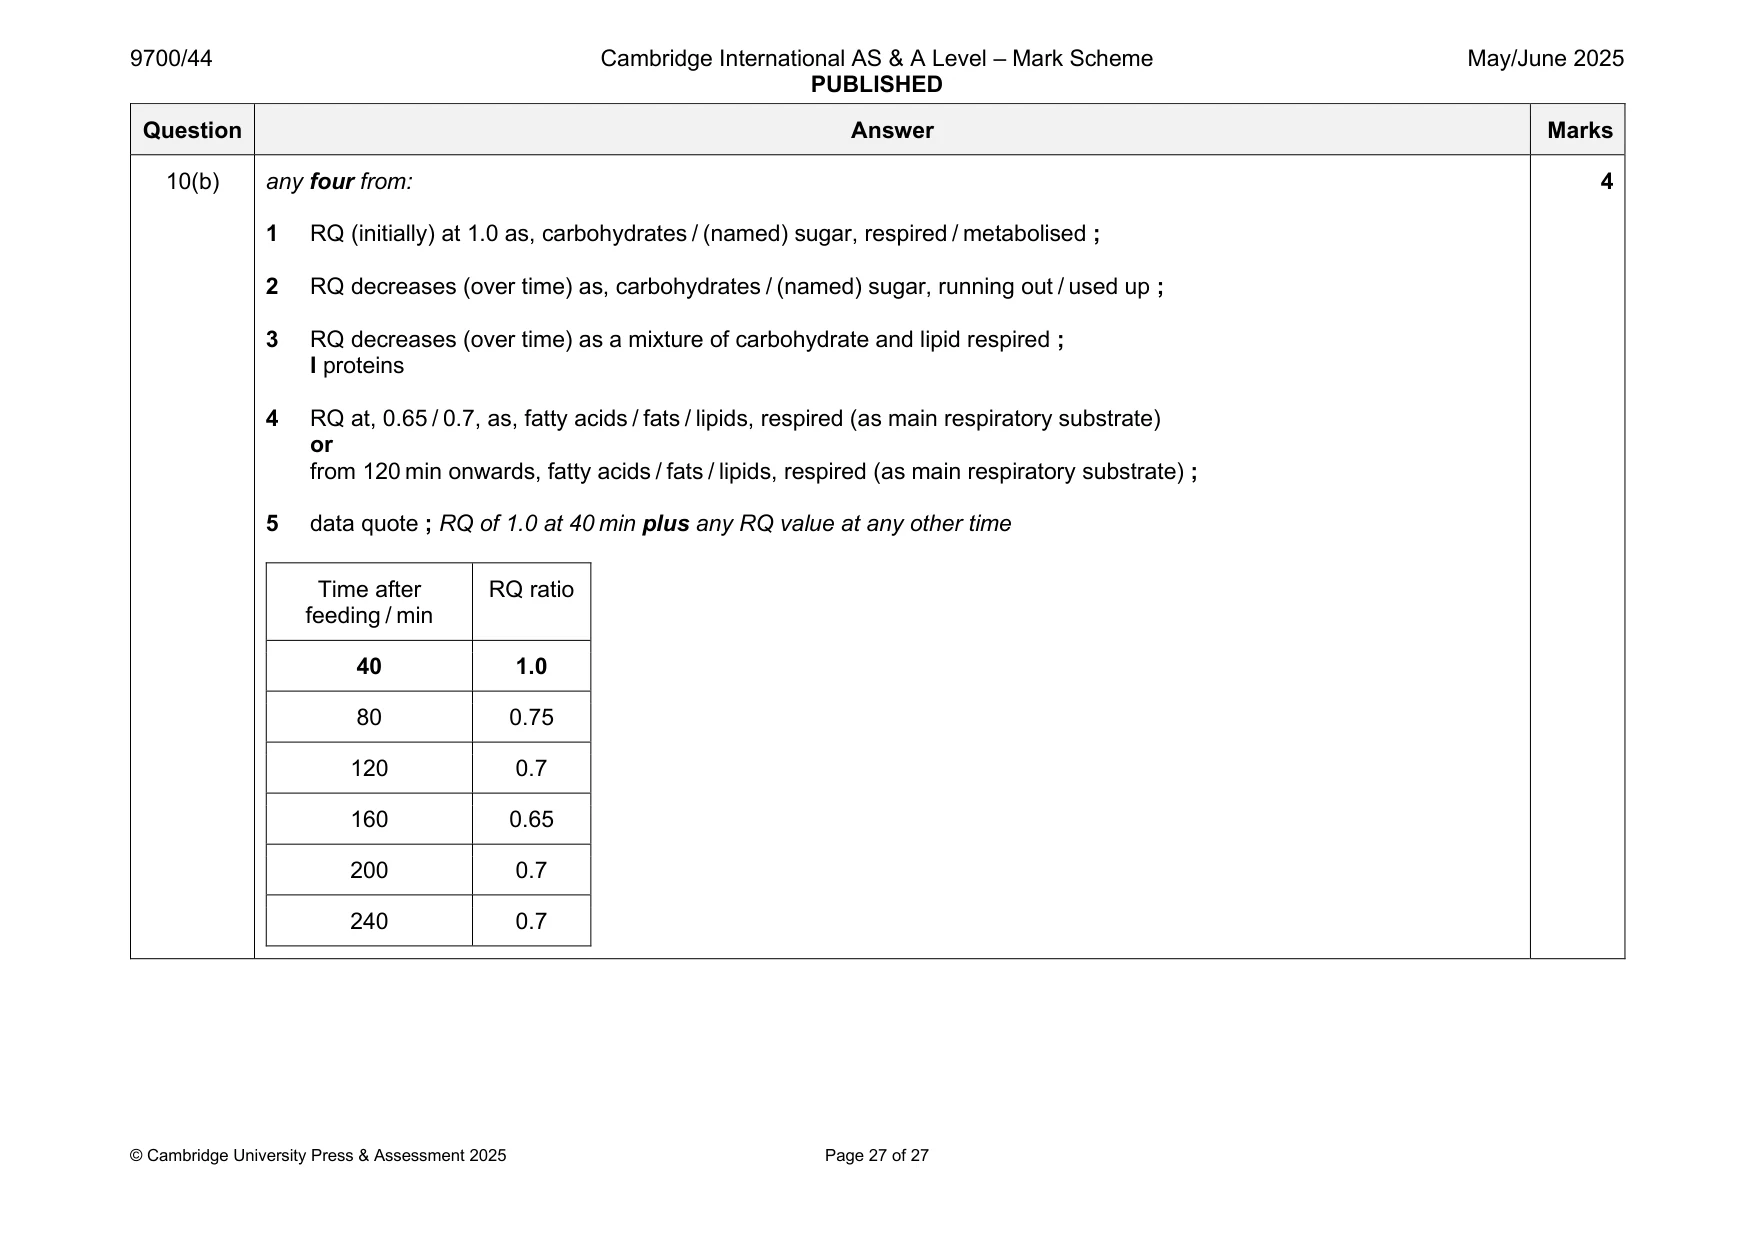
Mark scheme: 10(a)(i) molecules / moles / volume, carbon dioxide produced 1 molecules / moles / volume, oxygen taken in ; 10(a)(ii) 25 ; 1 10(a)(iii) 0.72 ; 1 A ecf 18 divided by their answer to 10(a)(ii) 10(b) any four from: 4 1 RQ (initially) at 1.0 as, carbohydrates / (named) sugar, respired / metabolised ; 2 RQ decreases (over time) as, carbohydrates / (named) sugar, running out / used up ; 3 RQ decreases (over time) as a mixture of carbohydrate and lipid respired ; I proteins 4 RQ at, 0.65 / 0.7, as, fatty acids / fats / lipids, respired (as main respiratory substrate) or from 120 min onwards, fatty acids / fats / lipids, respired (as main respiratory substrate) ; 5 data quote ; RQ of 1.0 at 40 min plus any RQ value at any other time Time after RQ ratio feeding / min 40 1.0 80 0.75 120 0.7 160 0.65 200 0.7 240 0.7
What was in this paper
The subtopics covered by these 10 questions, and how many questions each got. Open one in a new tab to see every Cambridge question on it.
What you needed in this session
Cambridge’s own grade thresholds for 2025 May/June, Paper 4 · Variant 4. A higher threshold means an easier paper — the bar moves with how the cohort did.