Cambridge A Level Biology 9700 — 2022 May/June Paper 3 · Variant 5
9700/35/M/J/22 · 2 questions · 40 marks · ≈45 min
The question paper and its mark scheme, free to read here and free to download. This is Cambridge’s own paper, exactly as it was sat.
Question paper12 pages
Mark scheme7 pages
Answers below. Sit the paper first if you are practising.
Questions as text
Q1 · The enzyme invertase catalyses the hydrolysis (breakdown) of sucrose to fructose and…
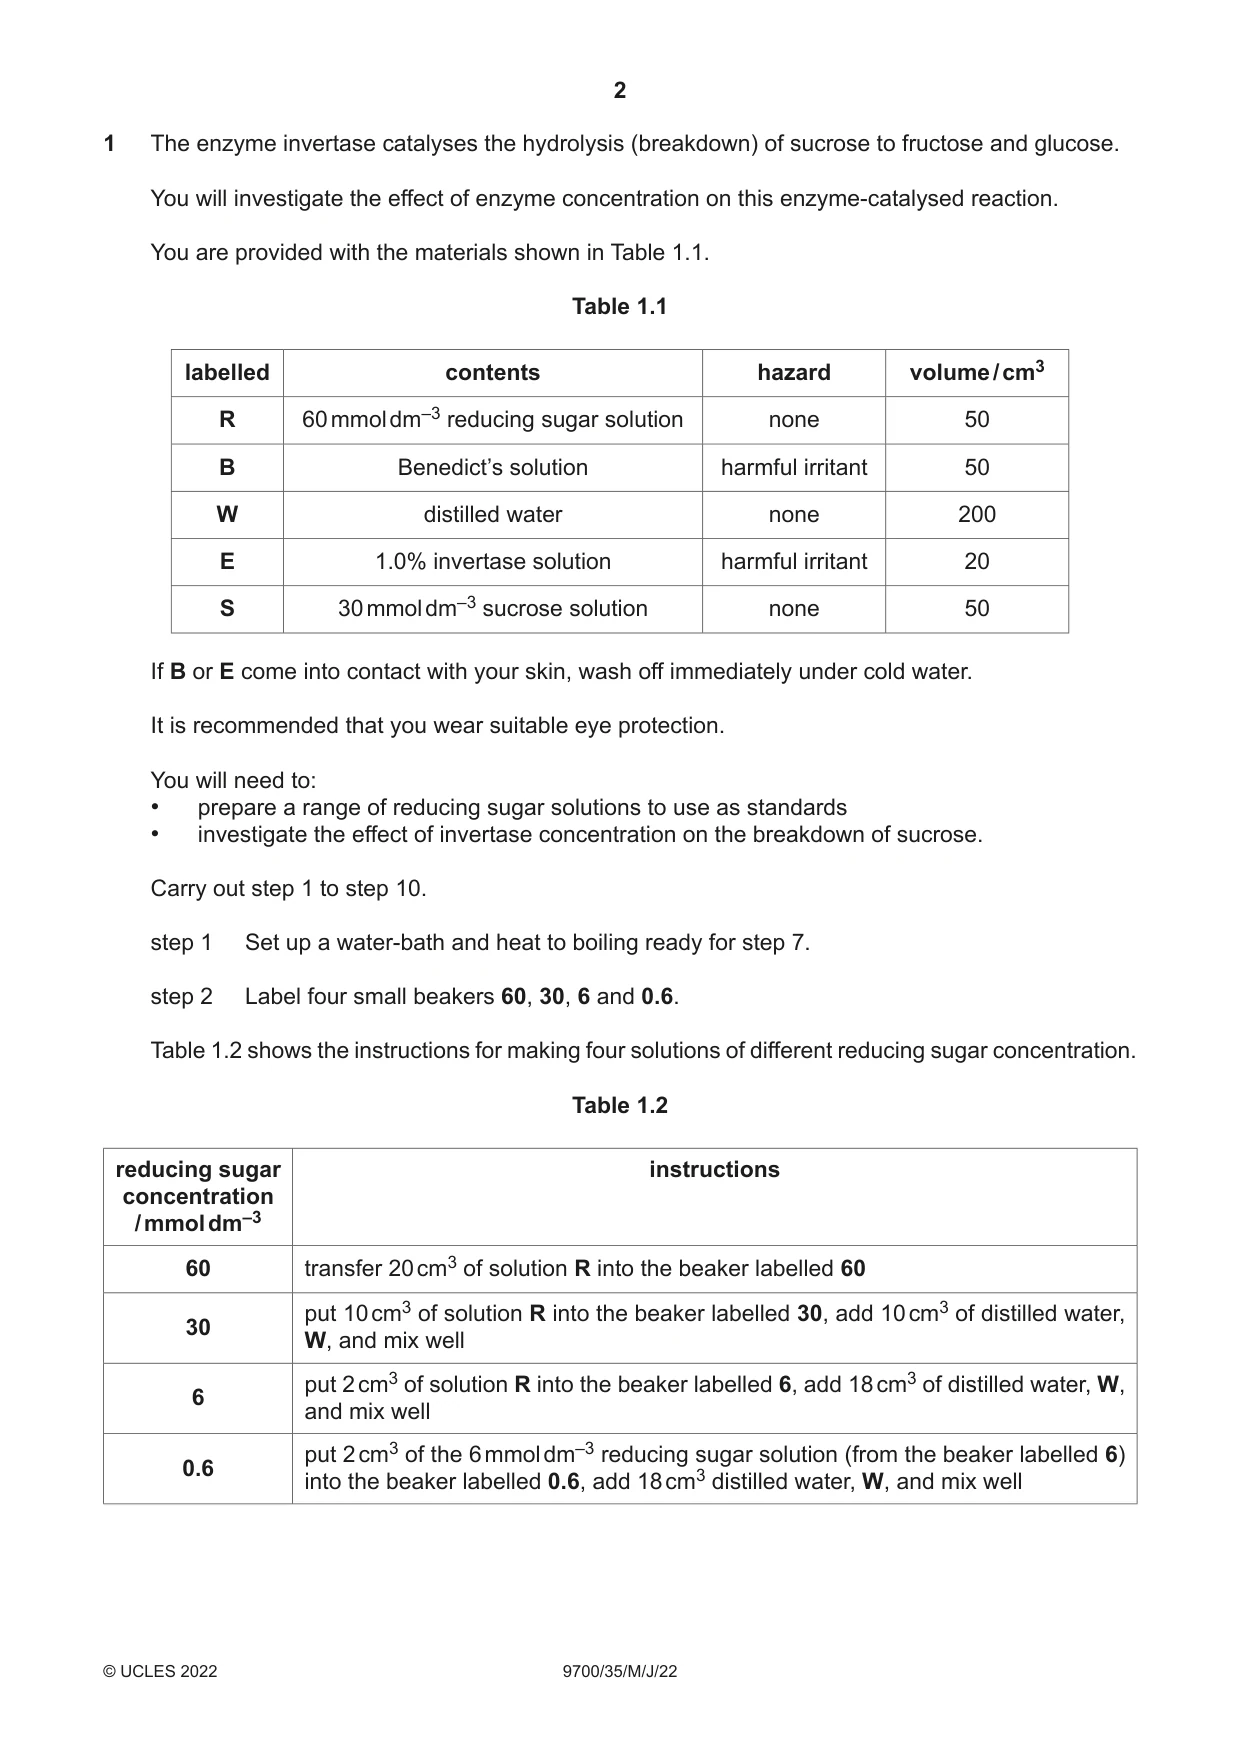
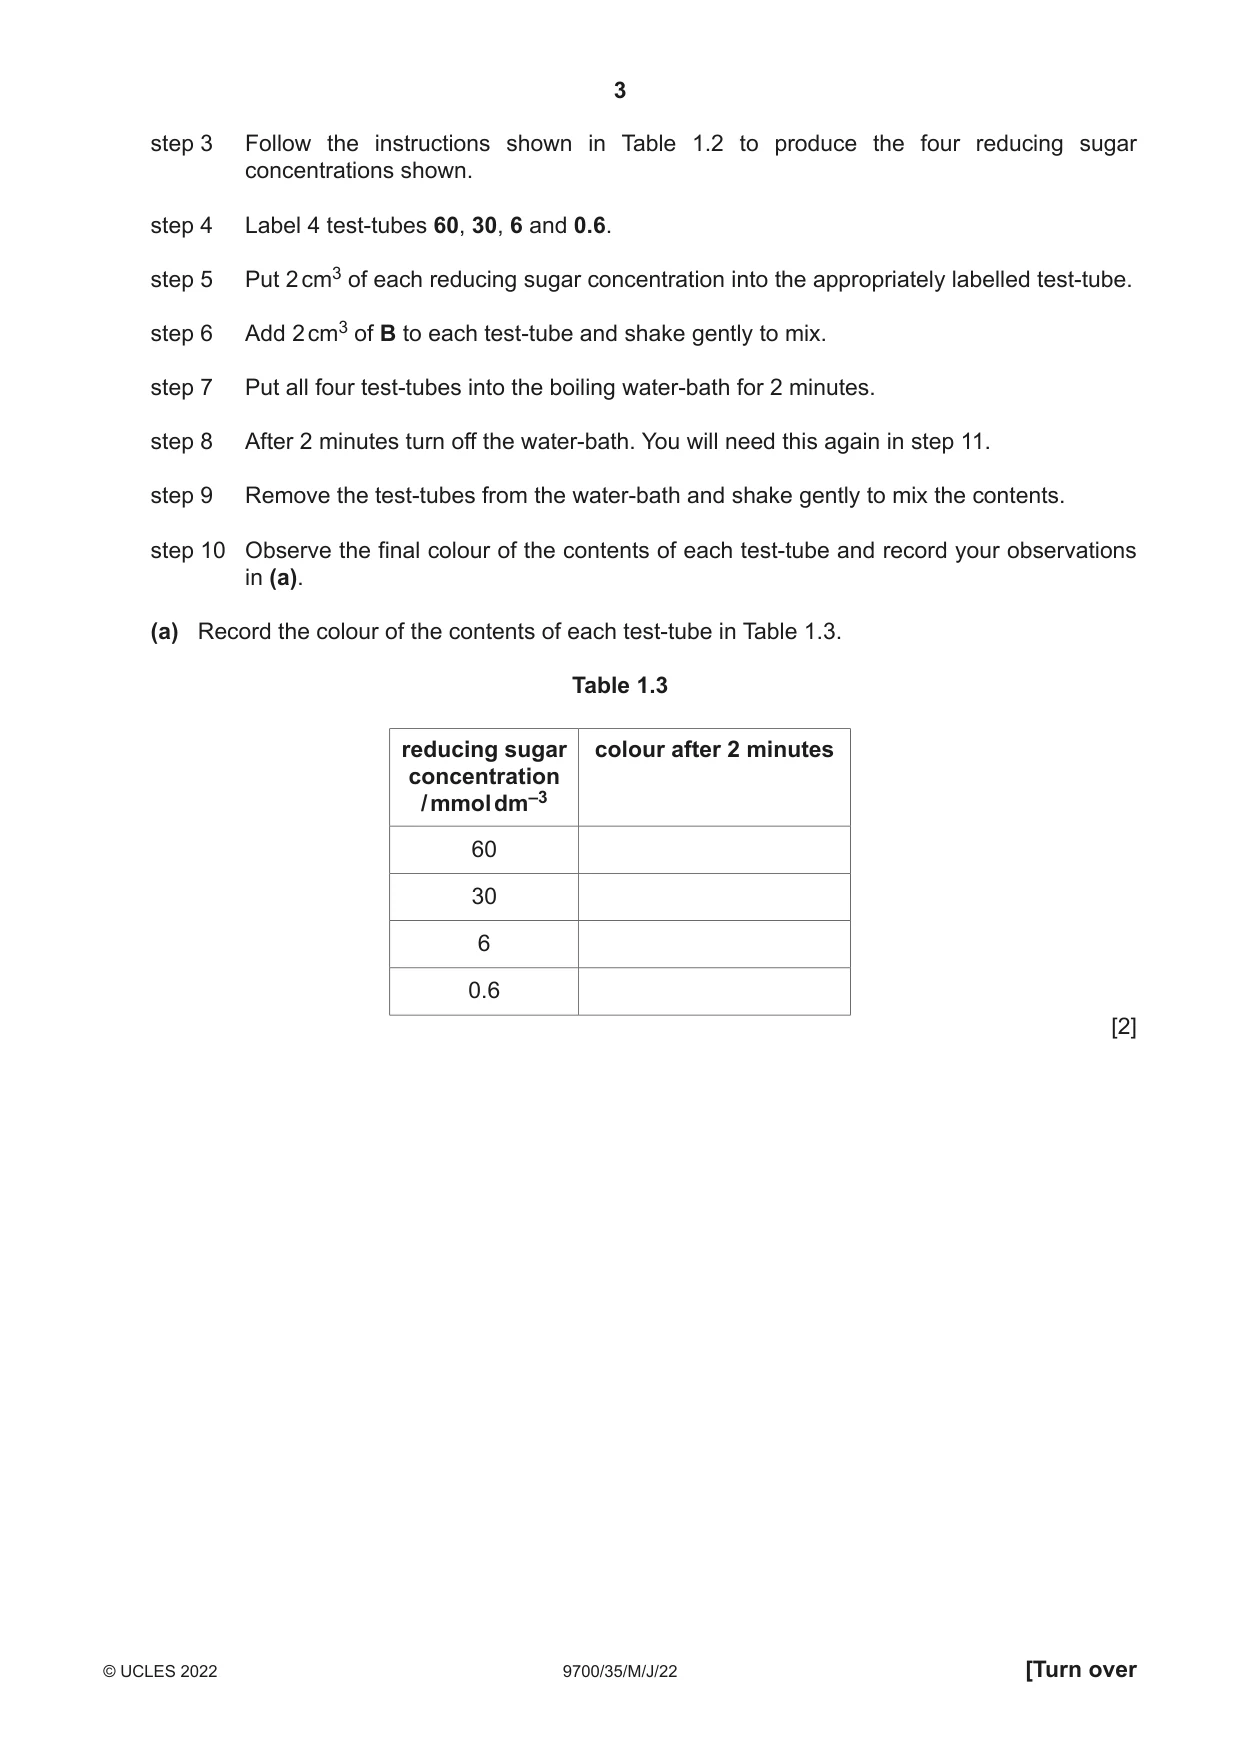
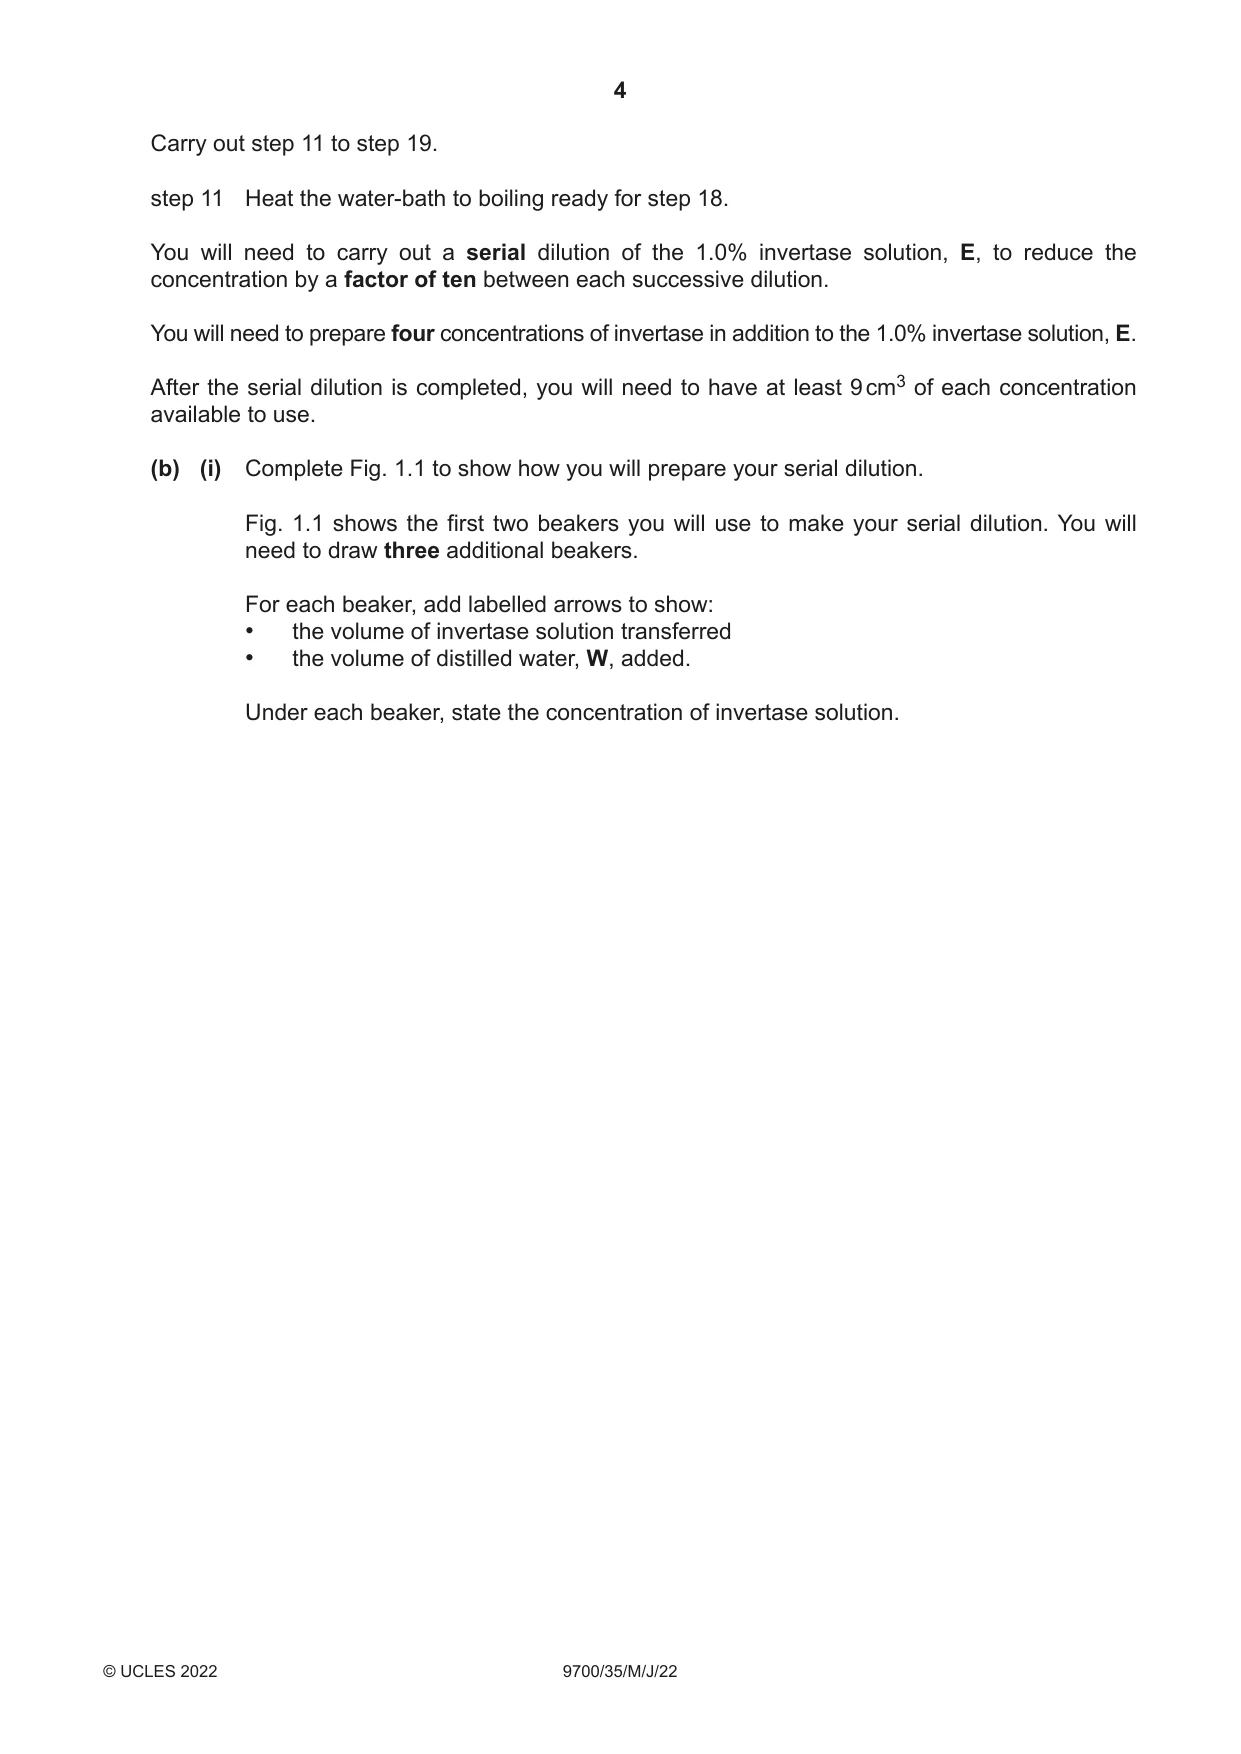
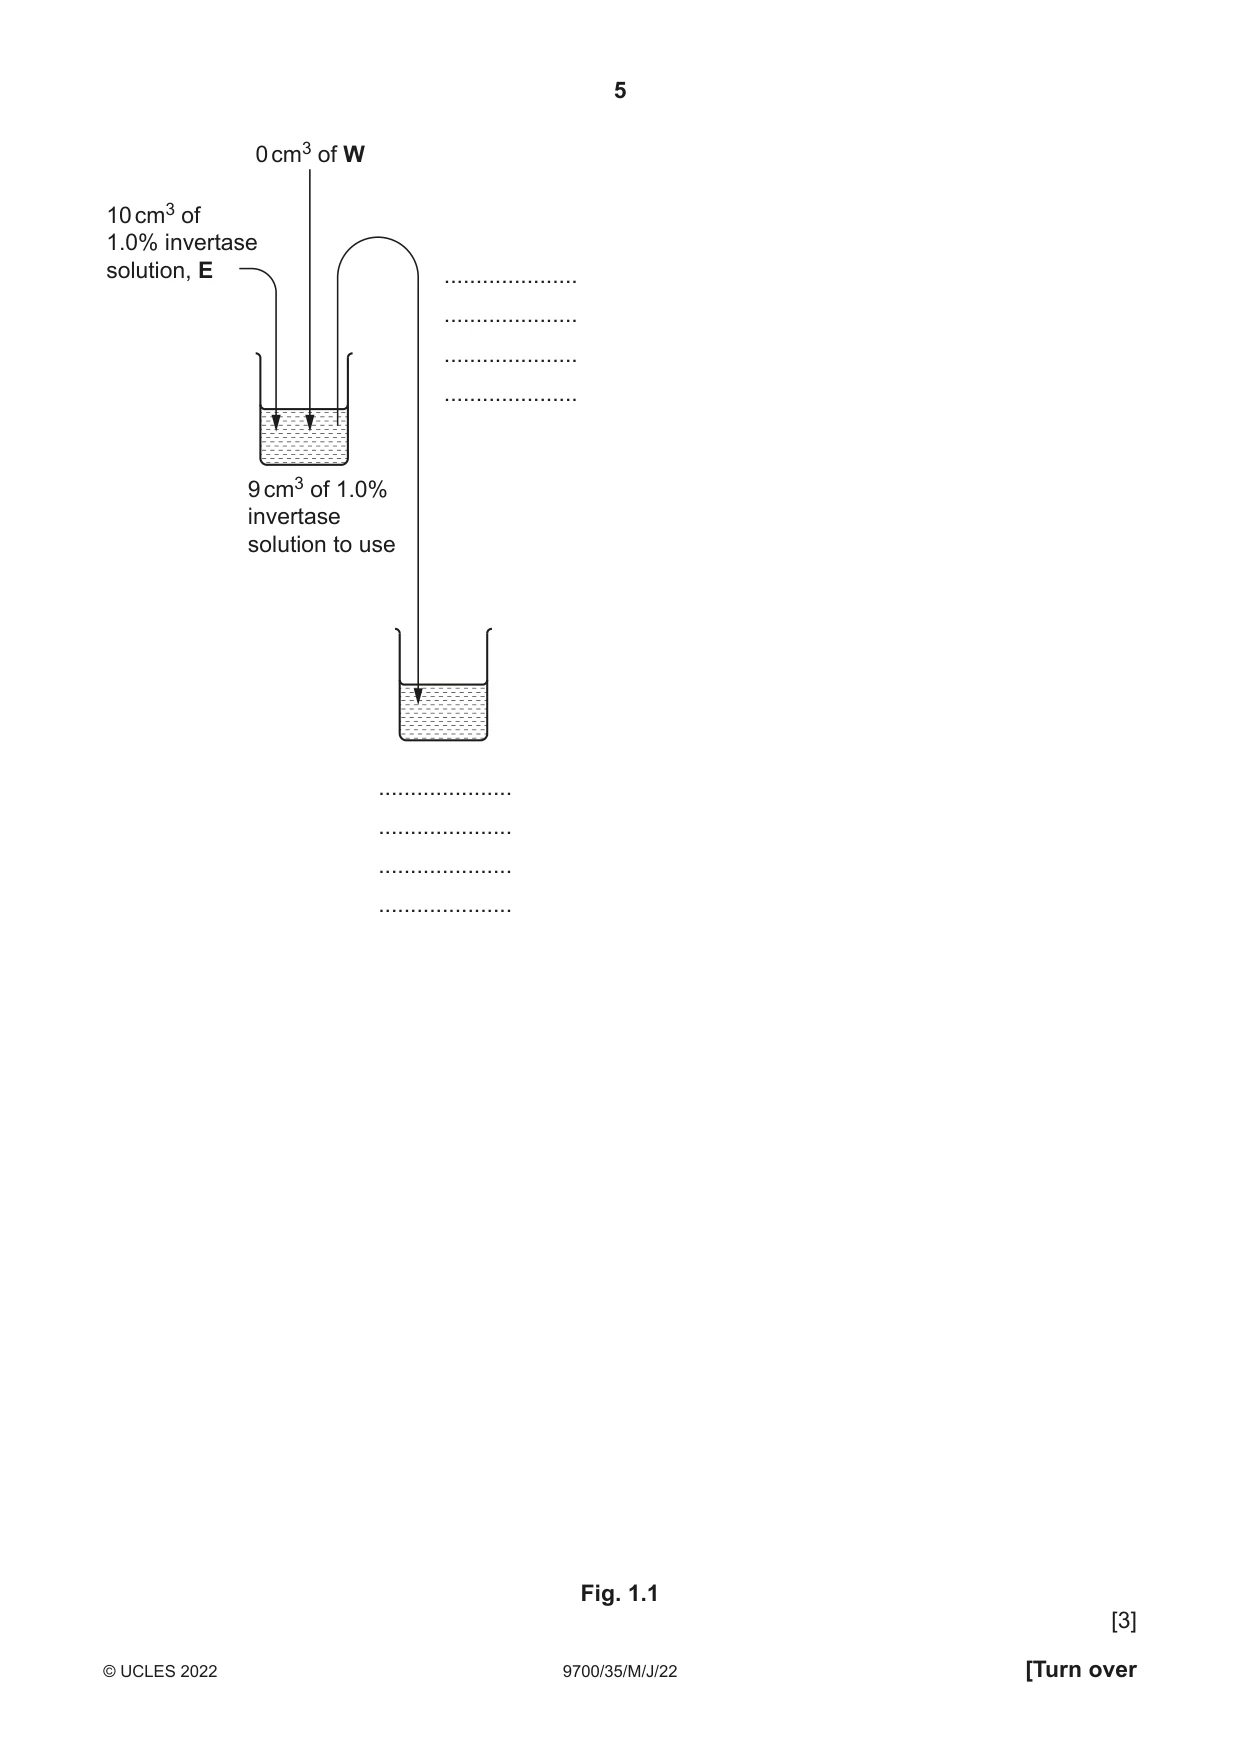
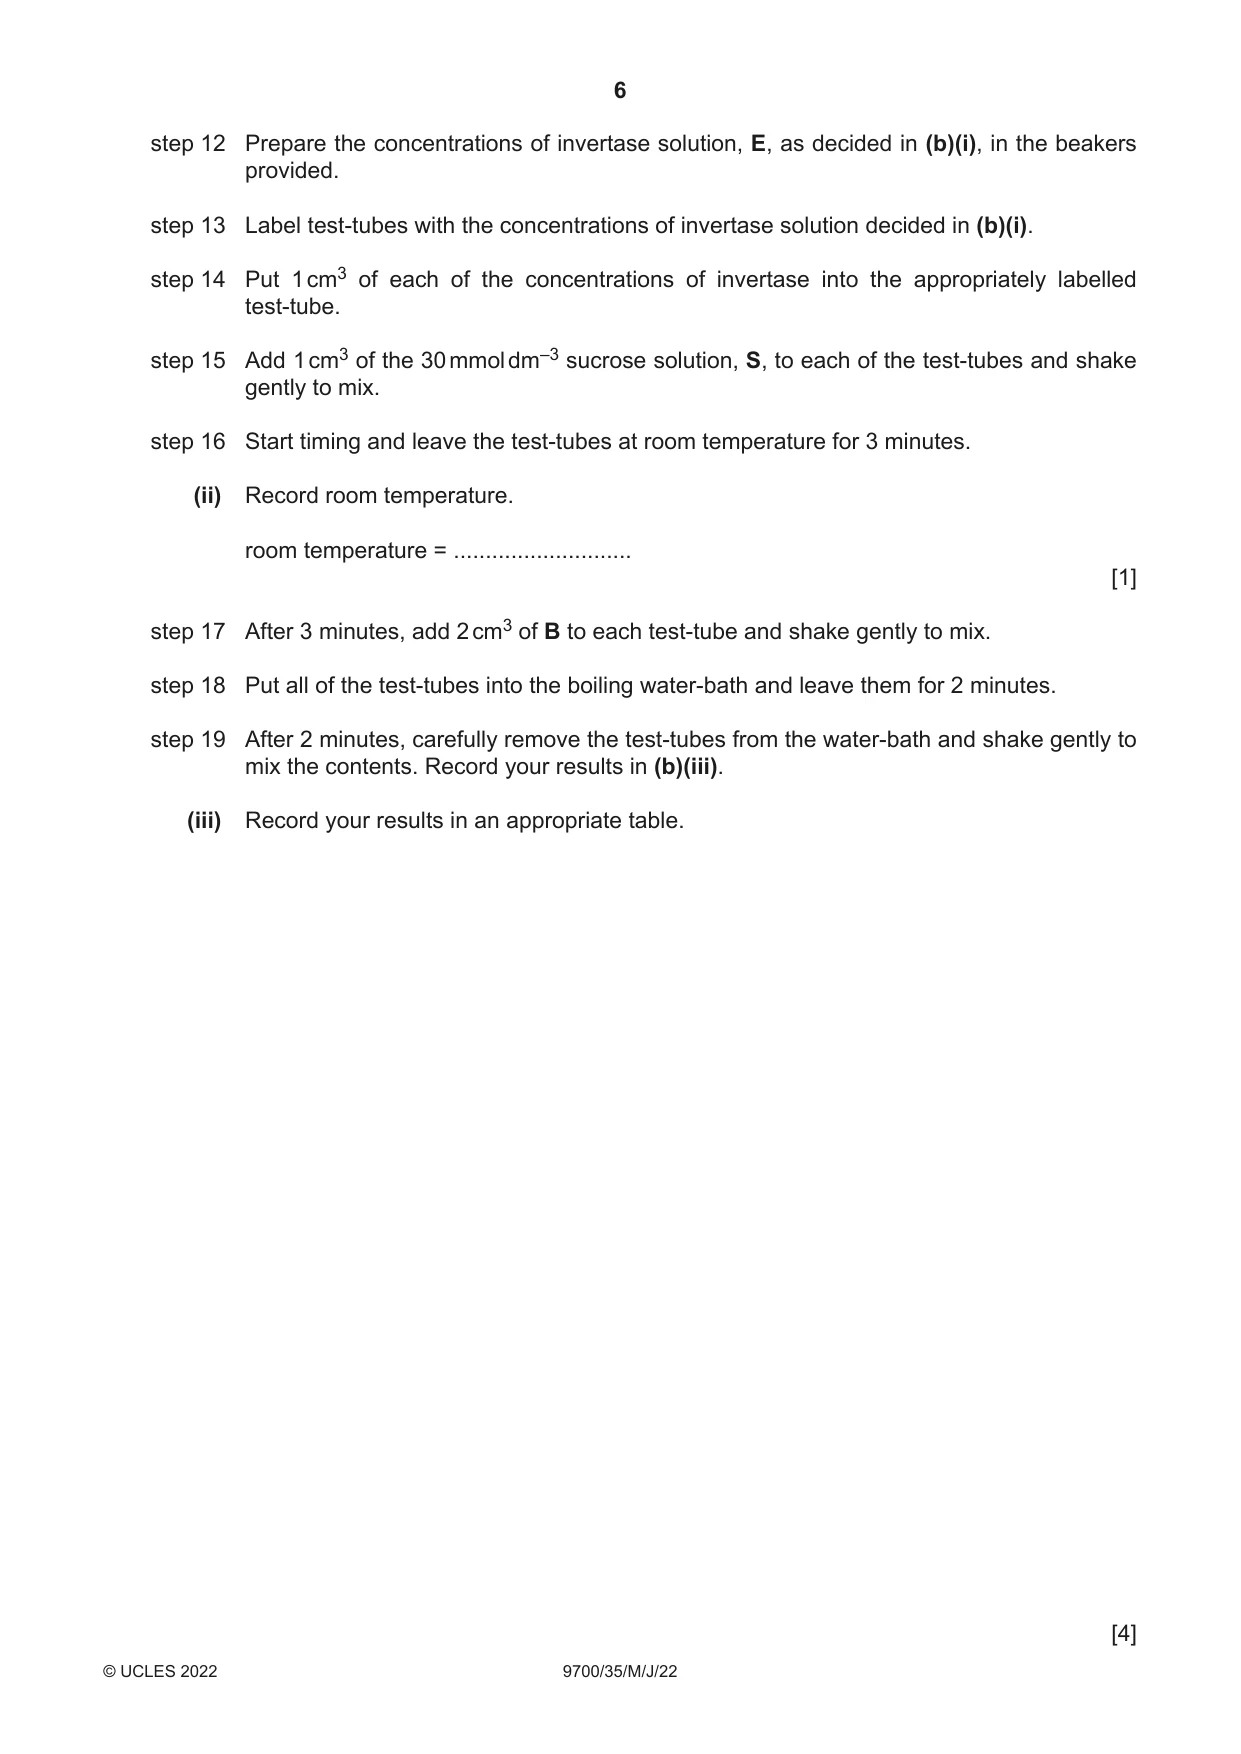
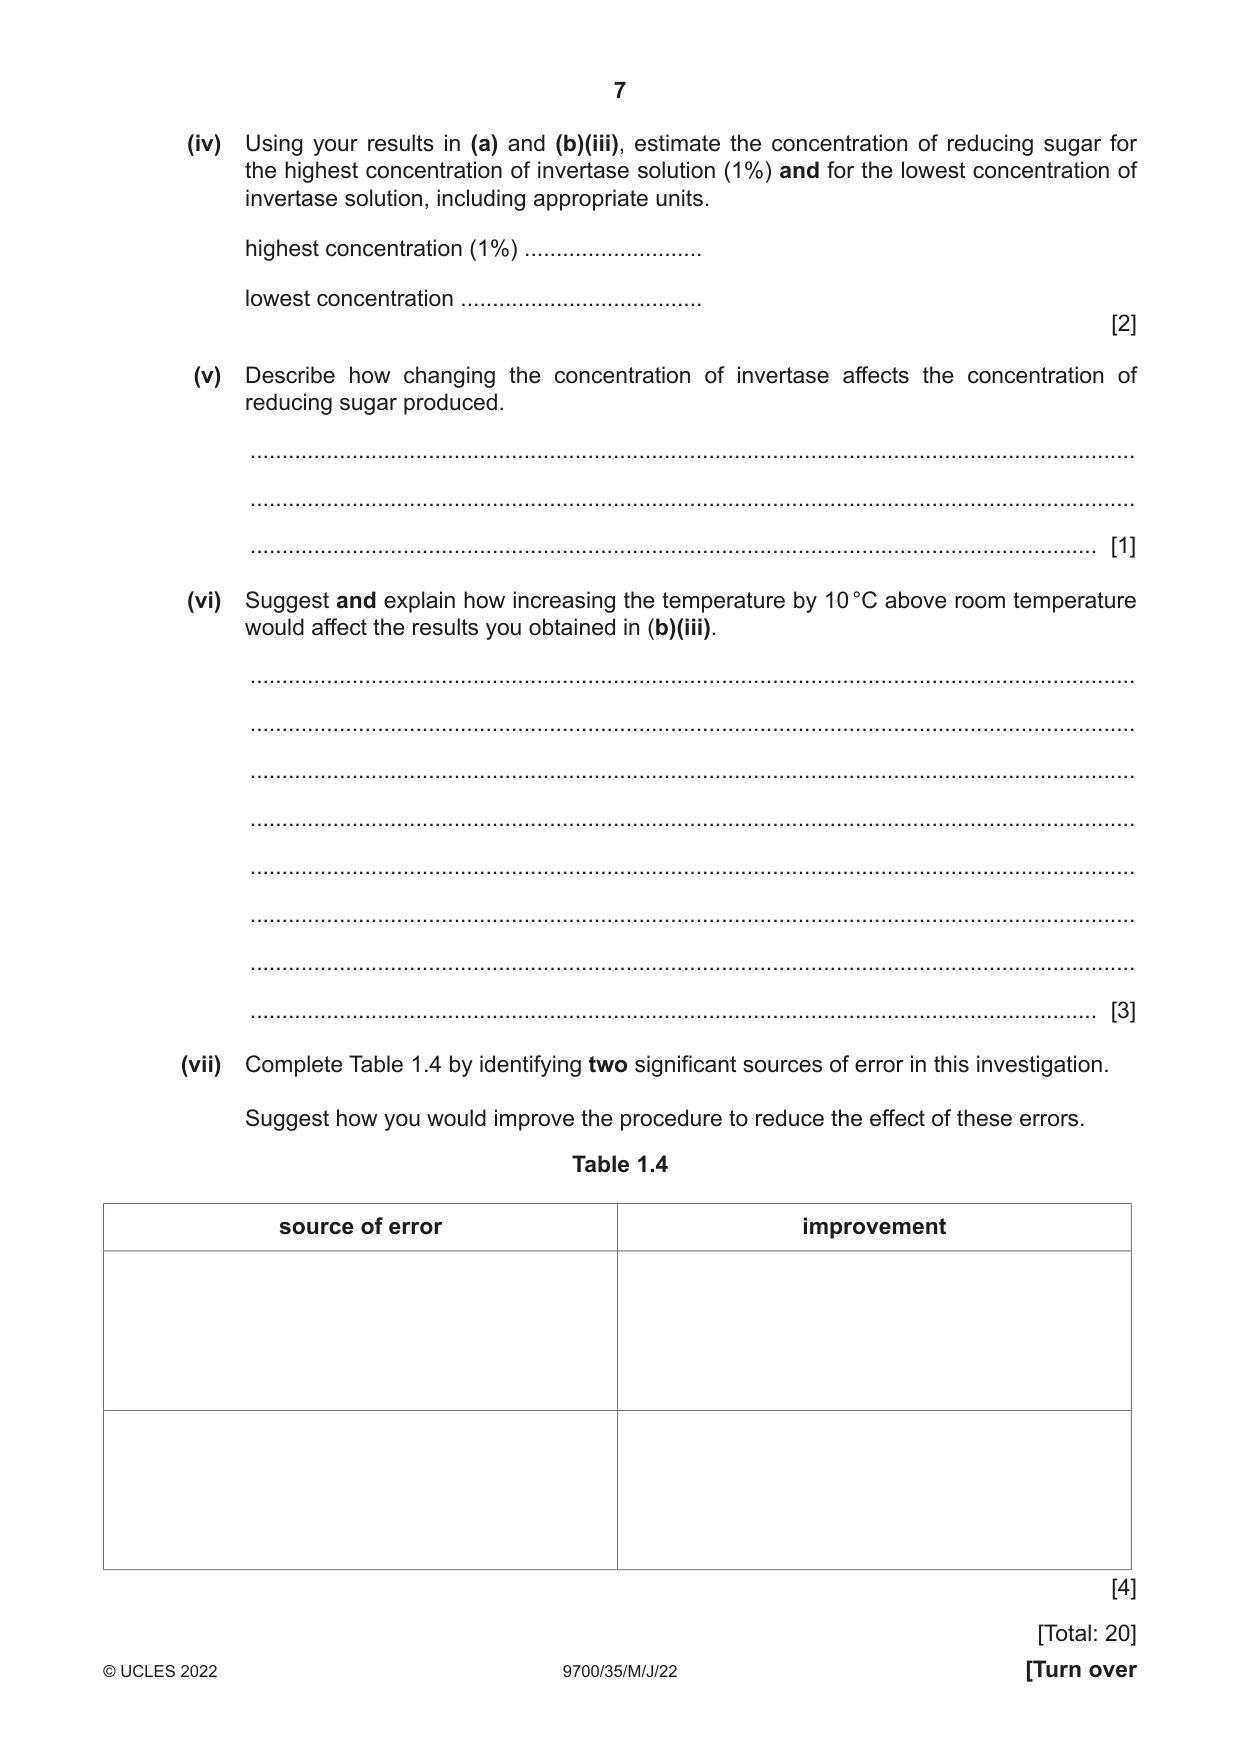
1 The enzyme invertase catalyses the hydrolysis (breakdown) of sucrose to fructose and glucose. You will investigate the effect of enzyme concentration on this enzyme-catalysed reaction. You are provided with the materials shown in Table 1.1. Table 1.1 labelled contents hazard volume / cm3 R 60 mmol dm–3 reducing sugar solution none 50 B Benedict’s solution harmful irritant 50 W distilled water none 200 E 1.0% invertase solution harmful irritant 20 S 30 mmol dm–3 sucrose solution none 50 If B or E come into contact with your skin, wash off immediately under cold water. It is recommended that you wear suitable eye protection. You will need to: • prepare a range of reducing sugar solutions to use as standards • investigate the effect of invertase concentration on the breakdown of sucrose. Carry out step 1 to step 10. step 1 Set up a water-bath and heat to boiling ready for step 7. step 2 Label four small beakers 60, 30, 6 and 0.6. Table 1.2 shows the instructions for making four solutions of different reducing sugar concentration. Table 1.2 reducing sugar instructions concentration / mmol dm–3 60 transfer 20 cm3 of solution R into the beaker labelled 60 put 10 cm3 of solution R into the beaker labelled 30, add 10 cm3 of distilled water, 30 W, and mix well put 2 cm3 of solution R into the beaker labelled 6, add 18 cm3 of distilled water, W, 6 and mix well put 2 cm3 of the 6 mmol dm–3 reducing sugar solution (from the beaker labelled 6) 0.6 into the beaker labelled 0.6, add 18 cm3 distilled water, W, and mix well step 3 Follow the instructions shown in Table 1.2 to produce the four reducing sugar concentrations shown. step 4 Label 4 test-tubes 60, 30, 6 and 0.6. step 5 Put 2 cm3 of each reducing sugar concentration into the appropriately labelled test-tube. step 6 Add 2 cm3 of B to each test-tube and shake gently to mix. step 7 Put all four test-tubes into the boiling water-bath for 2 minutes. step 8 After 2 minutes turn off the water-bath. You will need this again in step 11. step 9 Remove the test-tubes from the water-bath and shake gently to mix the contents. step 10 Observe the final colour of the contents of each test-tube and record your observations in (a). (a) Record the colour of the contents of each test-tube in Table 1.3. Table 1.3 reducing sugar colour after 2 minutes concentration / mmol dm–3 60 30 6 0.6 [2] Carry out step 11 to step 19. step 11 Heat the water-bath to boiling ready for step 18. You will need to carry out a serial dilution of the 1.0% invertase solution, E, to reduce the concentration by a factor of ten between each successive dilution. You will need to prepare four concentrations of invertase in addition to the 1.0% invertase solution, E. After the serial dilution is completed, you will need to have at least 9 cm3 of each concentration available to use. (b) (i) Complete Fig. 1.1 to show how you will prepare your serial dilution. Fig. 1.1 shows the first two beakers you will use to make your serial dilution. You will need to draw three additional beakers. For each beaker, add labelled arrows to show: • the volume of invertase solution transferred • the volume of distilled water, W, added. Under each beaker, state the concentration of invertase solution. 0 cm3 of W 10 cm3 of 1.0% invertase solution, E ..................... ..................... ..................... ..................... 9 cm3 of 1.0% invertase solution to use ..................... ..................... ..................... ..................... Fig. 1.1 [3] step 12 Prepare the concentrations of invertase solution, E, as decided in (b)(i), in the beakers provided. step 13 Label test-tubes with the concentrations of invertase solution decided in (b)(i). step 14 Put 1 cm3 of each of the concentrations of invertase into the appropriately labelled test-tube. step 15 Add 1 cm3 of the 30 mmol dm–3 sucrose solution, S, to each of the test-tubes and shake gently to mix. step 16 Start timing and leave the test-tubes at room temperature for 3 minutes. (ii) Record room temperature. room temperature = ............................ [1] step 17 After 3 minutes, add 2 cm3 of B to each test-tube and shake gently to mix. step 18 Put all of the test-tubes into the boiling water-bath and leave them for 2 minutes. step 19 After 2 minutes, carefully remove the test-tubes from the water-bath and shake gently to mix the contents. Record your results in (b)(iii). (iii) Record your results in an appropriate table. [4] (iv) Using your results in (a) and (b)(iii), estimate the concentration of reducing sugar for the highest concentration of invertase solution (1%) and for the lowest concentration of invertase solution, including appropriate units. highest concentration (1%) ............................ lowest concentration ...................................... [2] (v) Describe how changing the concentration of invertase affects the concentration of reducing sugar produced. ........................................................................................................................................... ........................................................................................................................................... ..................................................................................................................................... [1] (vi) Suggest and explain how increasing the temperature by 10 °C above room temperature would affect the results you obtained in (b)(iii). ........................................................................................................................................... ........................................................................................................................................... ........................................................................................................................................... ........................................................................................................................................... ........................................................................................................................................... ........................................................................................................................................... ........................................................................................................................................... ..................................................................................................................................... [3] (vii) Complete Table 1.4 by identifying two significant sources of error in this investigation. Suggest how you would improve the procedure to reduce the effect of these errors. Table 1.4 source of error improvement [4] [Total: 20]
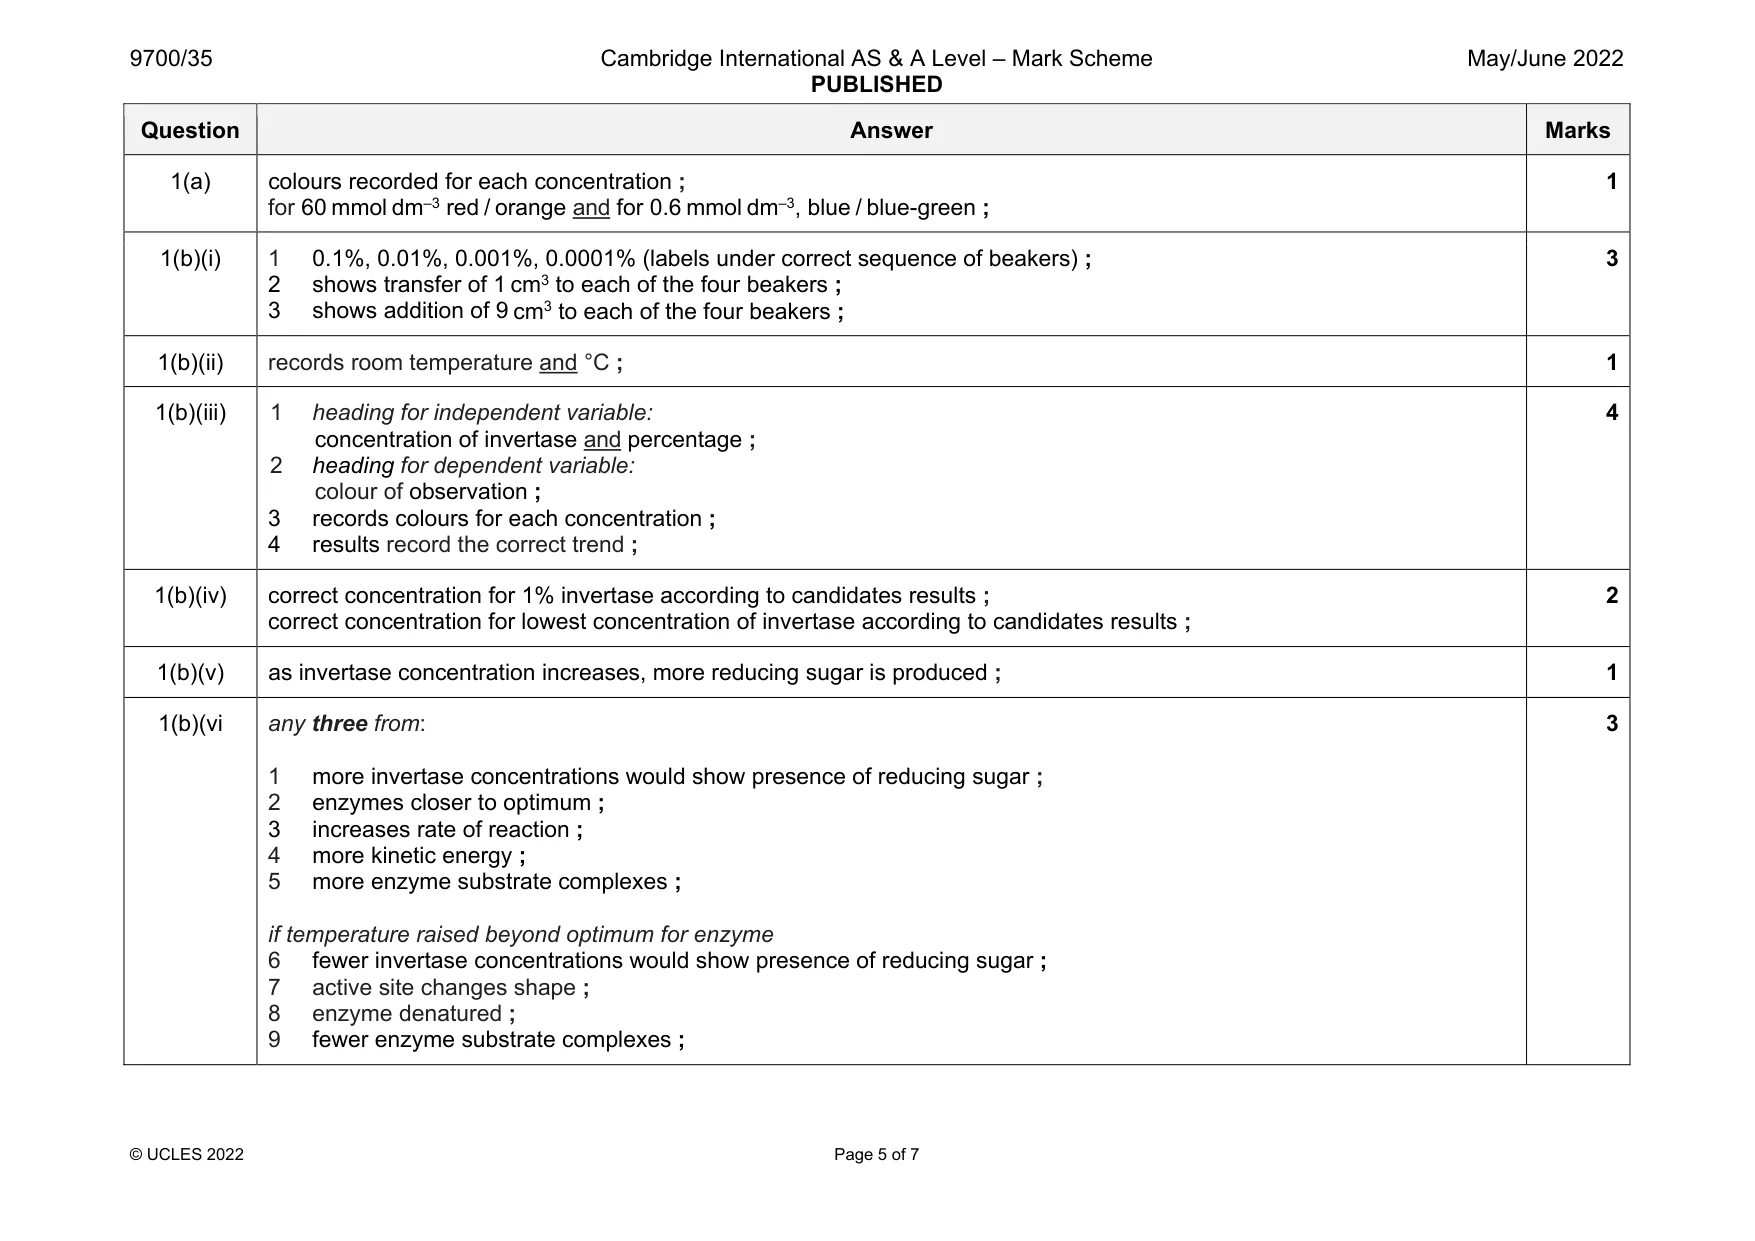
Mark scheme: 1(a) colours recorded for each concentration ; for 60 mmol dm–3 red / orange and for 0.6 mmol dm–3, blue / blue-green ; 1 1(b)(i) 1 0.1%, 0.01%, 0.001%, 0.0001% (labels under correct sequence of beakers) ; 2 shows transfer of 1 cm3 to each of the four beakers ; 3 shows addition of 9 cm3 to each of the four beakers ; 3 1(b)(ii) records room temperature and °C ; 1 1(b)(iii) 1 heading for independent variable: concentration of invertase and percentage ; 2 heading for dependent variable: colour of observation ; 3 records colours for each concentration ; 4 results record the correct trend ; 4 1(b)(iv) correct concentration for 1% invertase according to candidates results ; correct concentration for lowest concentration of invertase according to candidates results ; 2 1(b)(v) as invertase concentration increases, more reducing sugar is produced ; 1 1(b)(vi any three from: 1 more invertase concentrations would show presence of reducing sugar ; 2 enzymes closer to optimum ; 3 increases rate of reaction ; 4 more kinetic energy ; 5 more enzyme substrate complexes ; if temperature raised beyond optimum for enzyme 6 fewer invertase concentrations would show presence of reducing sugar ; 7 active site changes shape ; 8 enzyme denatured ; 9 fewer enzyme substrate complexes ; 3 Question Answer Marks 1(b)(vii) 1 error: subjective colour scale ; 2 improvement: use colour standards ; 3 error: different lengths of time for each concentration ; 4 improvement: carry out each test separately ; 4
Q2 · N1 is a slide of a stained transverse section through a plant stem
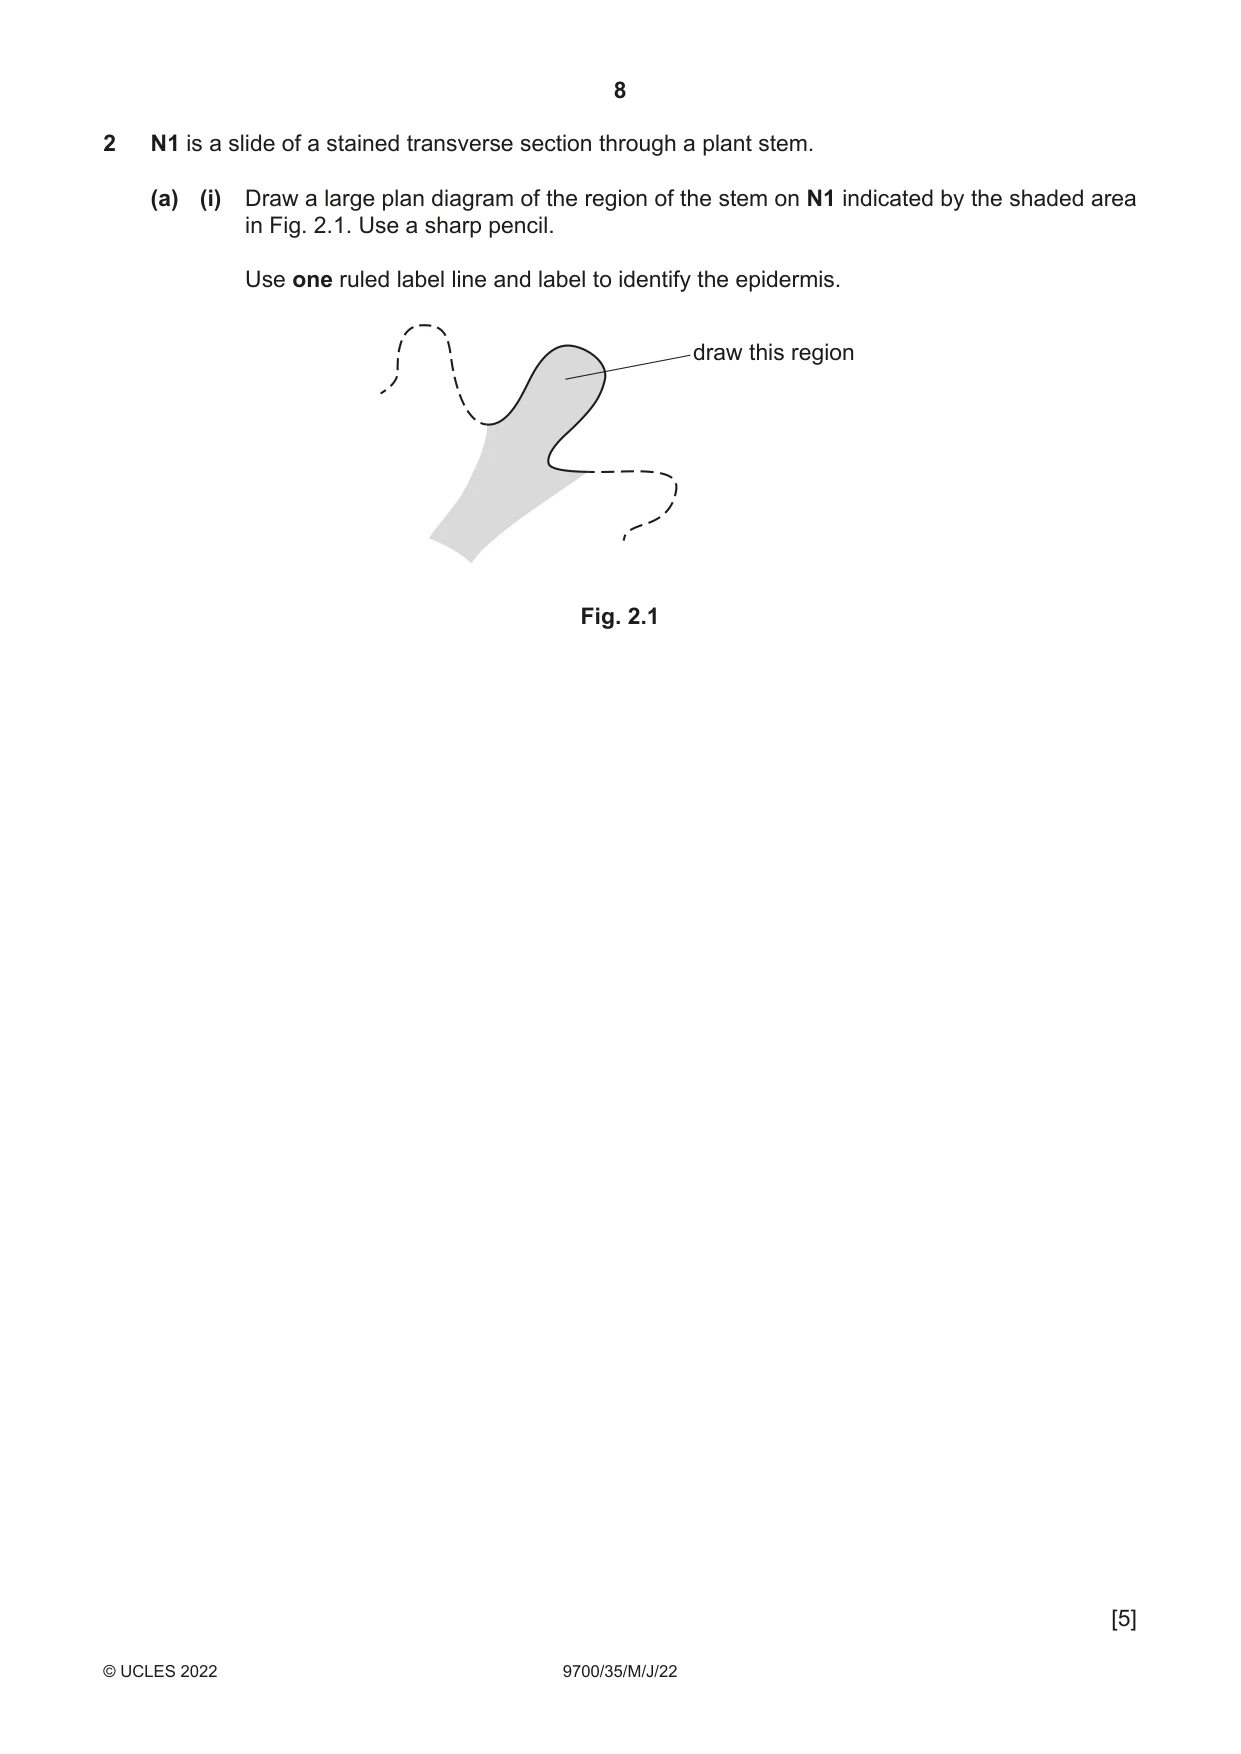
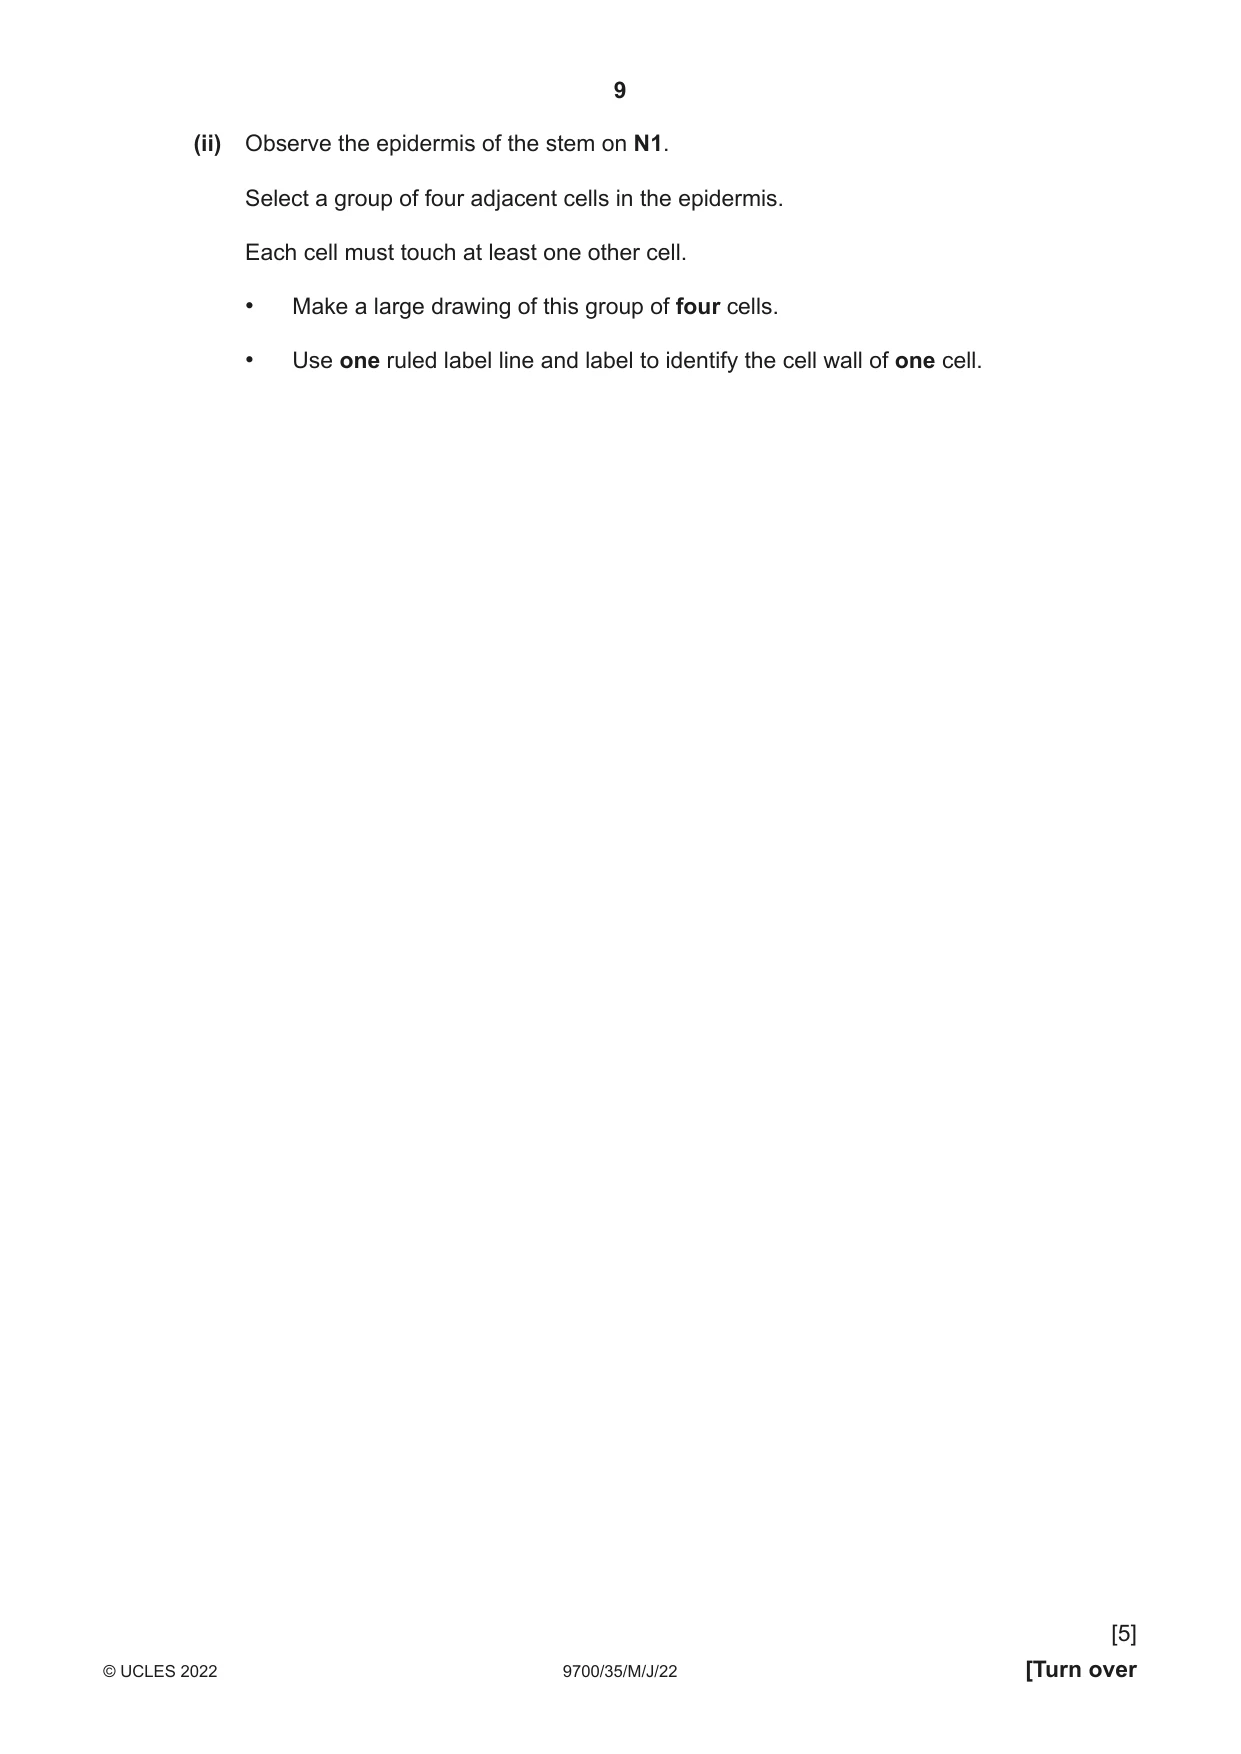
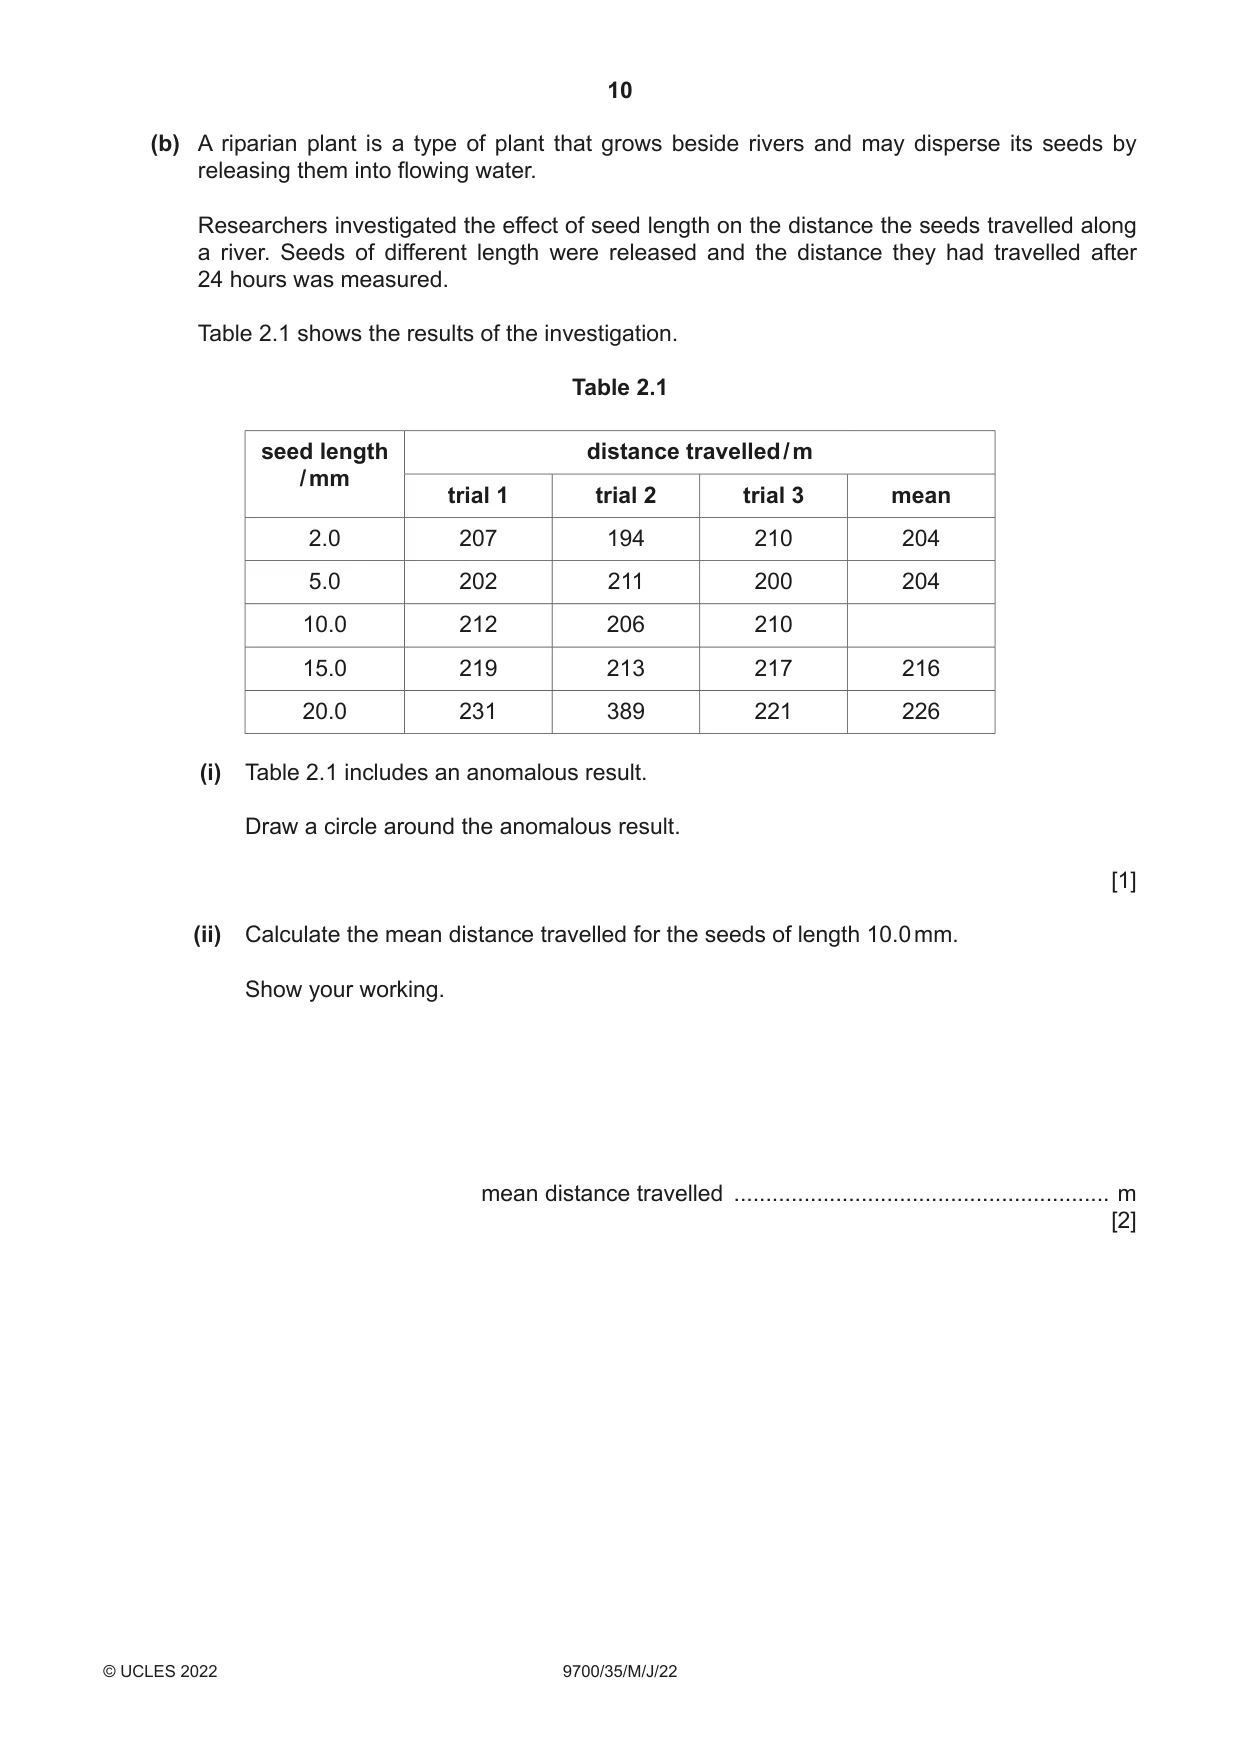
2 N1 is a slide of a stained transverse section through a plant stem. (a) (i) Draw a large plan diagram of the region of the stem on N1 indicated by the shaded area in Fig. 2.1. Use a sharp pencil. Use one ruled label line and label to identify the epidermis. draw this region Fig. 2.1 [5] (ii) Observe the epidermis of the stem on N1. Select a group of four adjacent cells in the epidermis. Each cell must touch at least one other cell. • Make a large drawing of this group of four cells. • Use one ruled label line and label to identify the cell wall of one cell. [5] (b) A riparian plant is a type of plant that grows beside rivers and may disperse its seeds by releasing them into flowing water. Researchers investigated the effect of seed length on the distance the seeds travelled along a river. Seeds of different length were released and the distance they had travelled after 24 hours was measured. Table 2.1 shows the results of the investigation. Table 2.1 seed length distance travelled / m / mm trial 1 trial 2 trial 3 mean 2.0 207 194 210 204 5.0 202 211 200 204 10.0 212 206 210 15.0 219 213 217 216 20.0 231 389 221 226 (i) Table 2.1 includes an anomalous result. Draw a circle around the anomalous result. [1] (ii) Calculate the mean distance travelled for the seeds of length 10.0 mm. Show your working. mean distance travelled ........................................................... m [2]
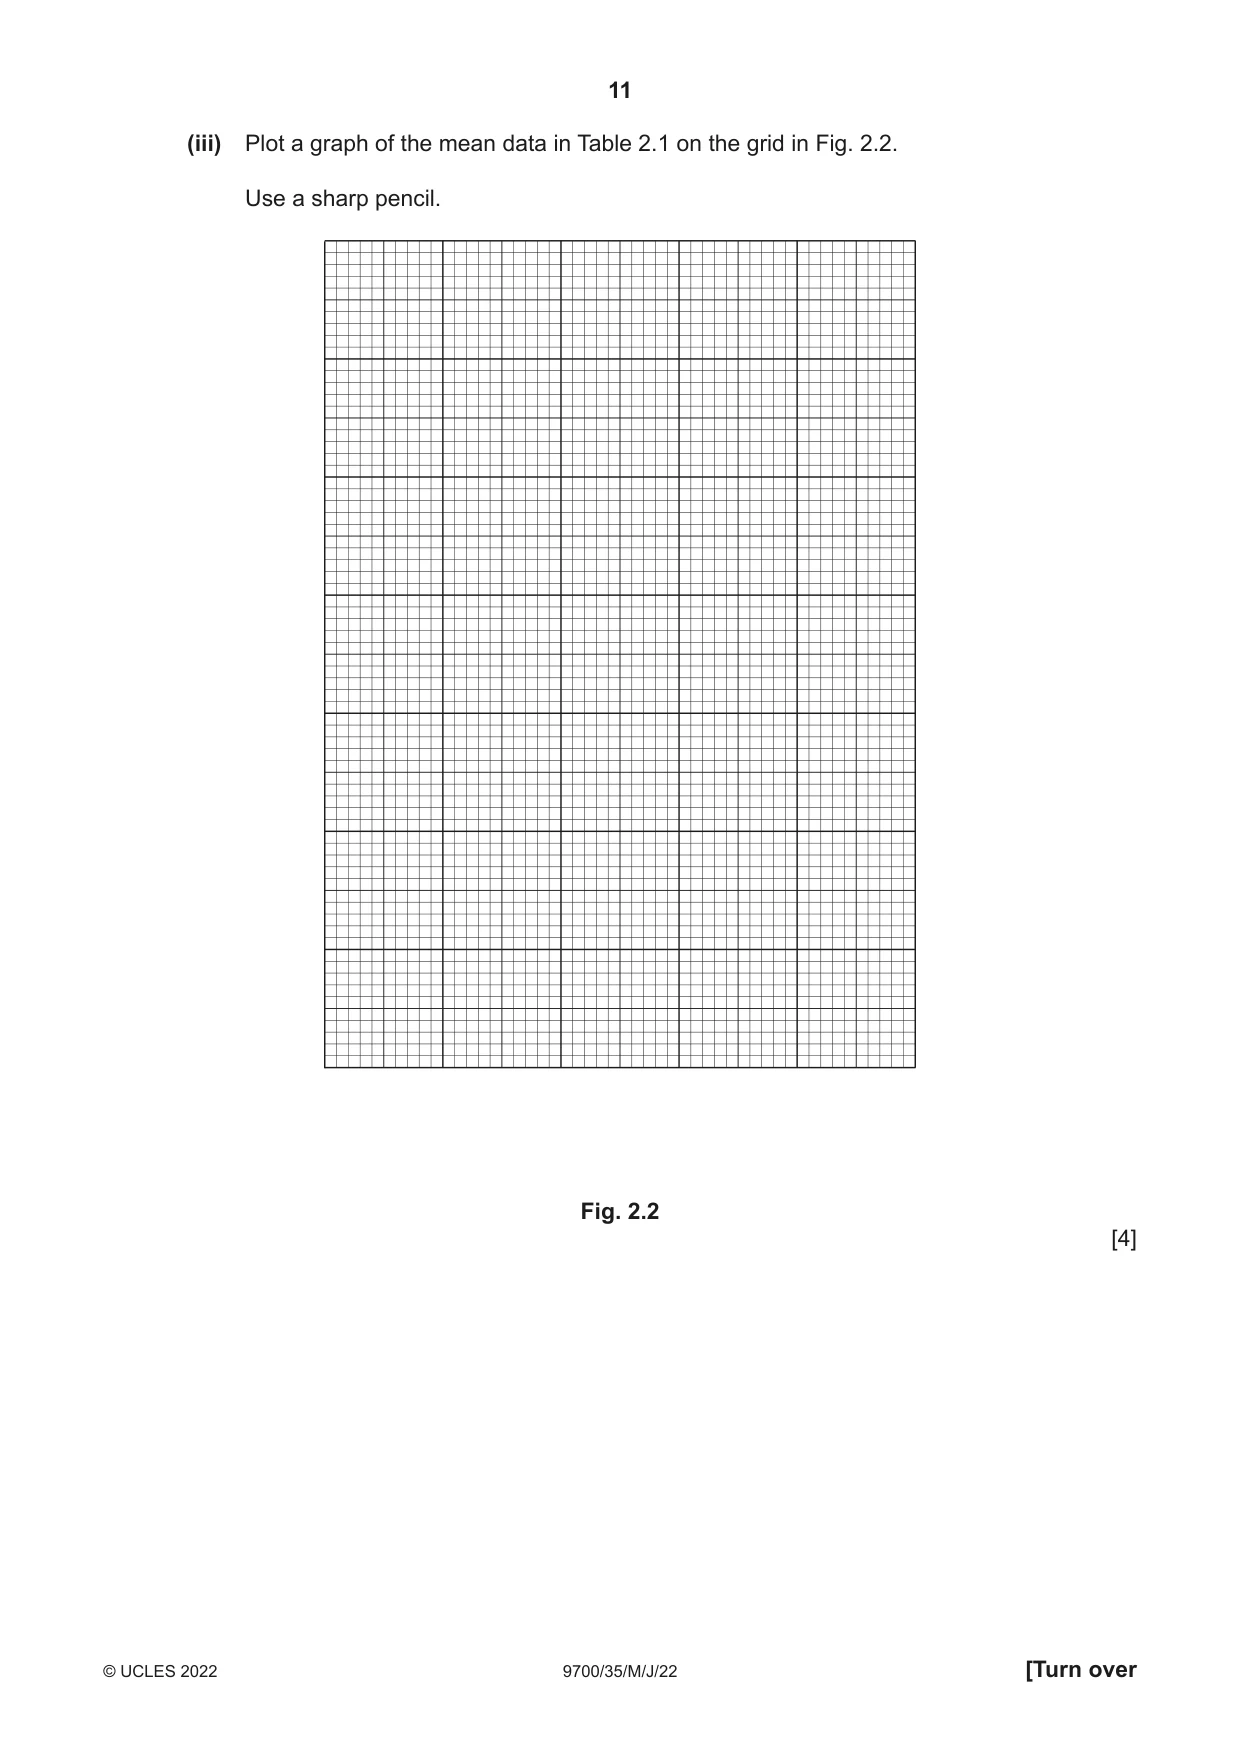
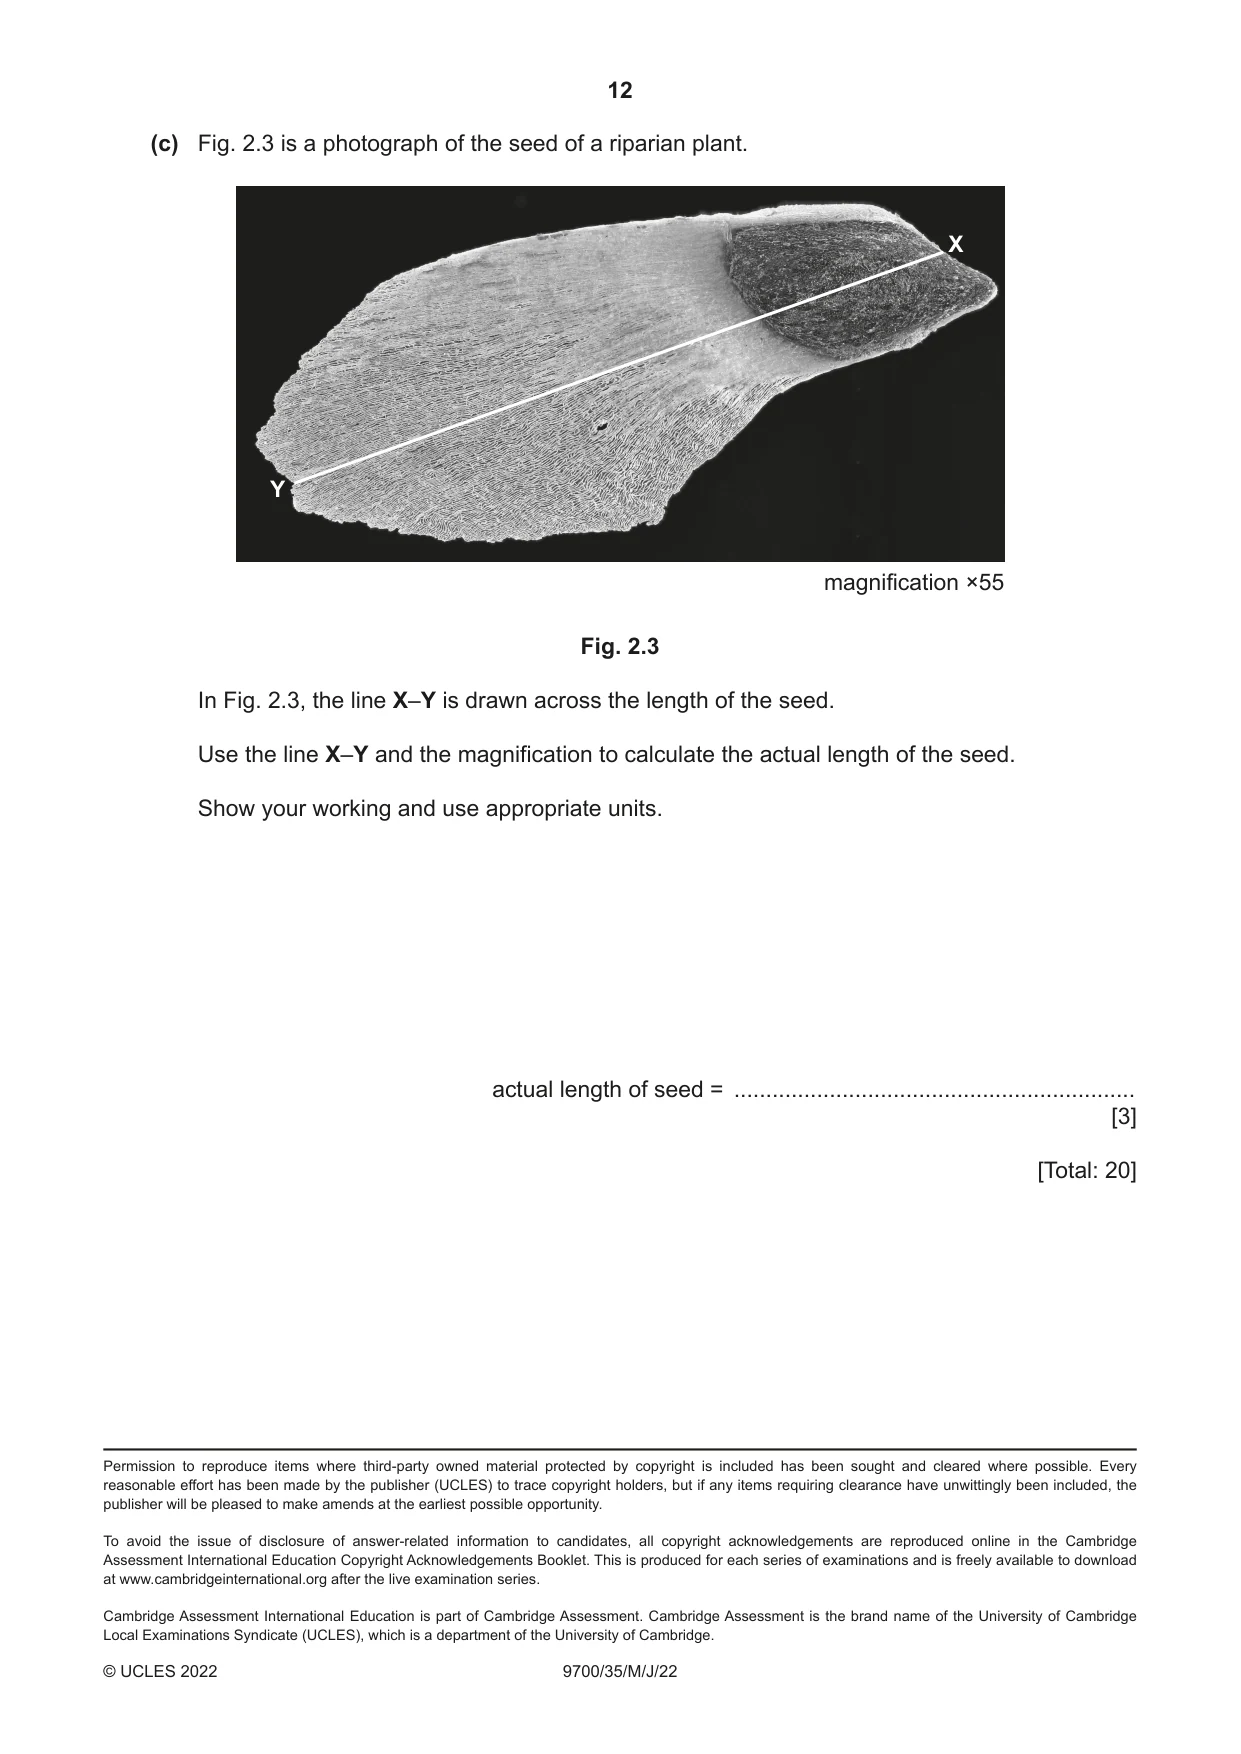
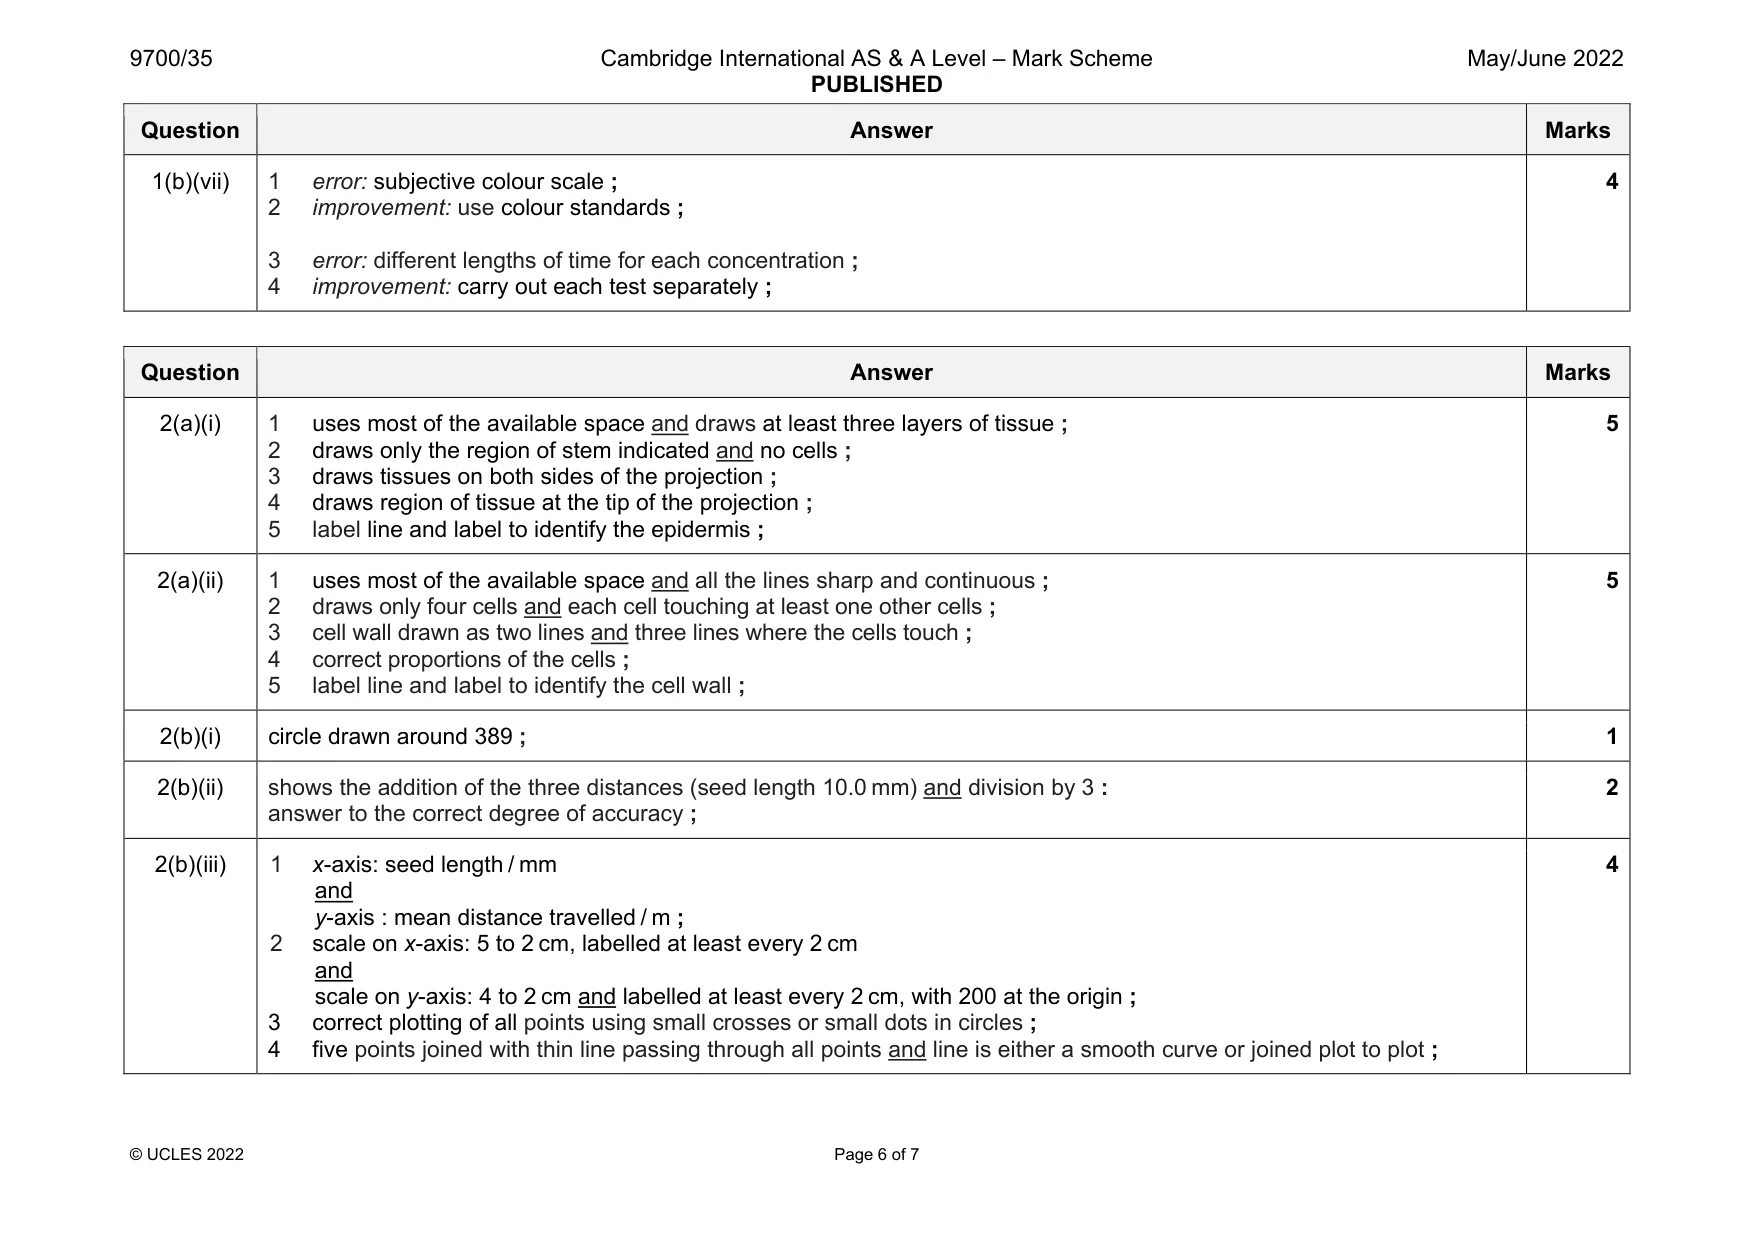
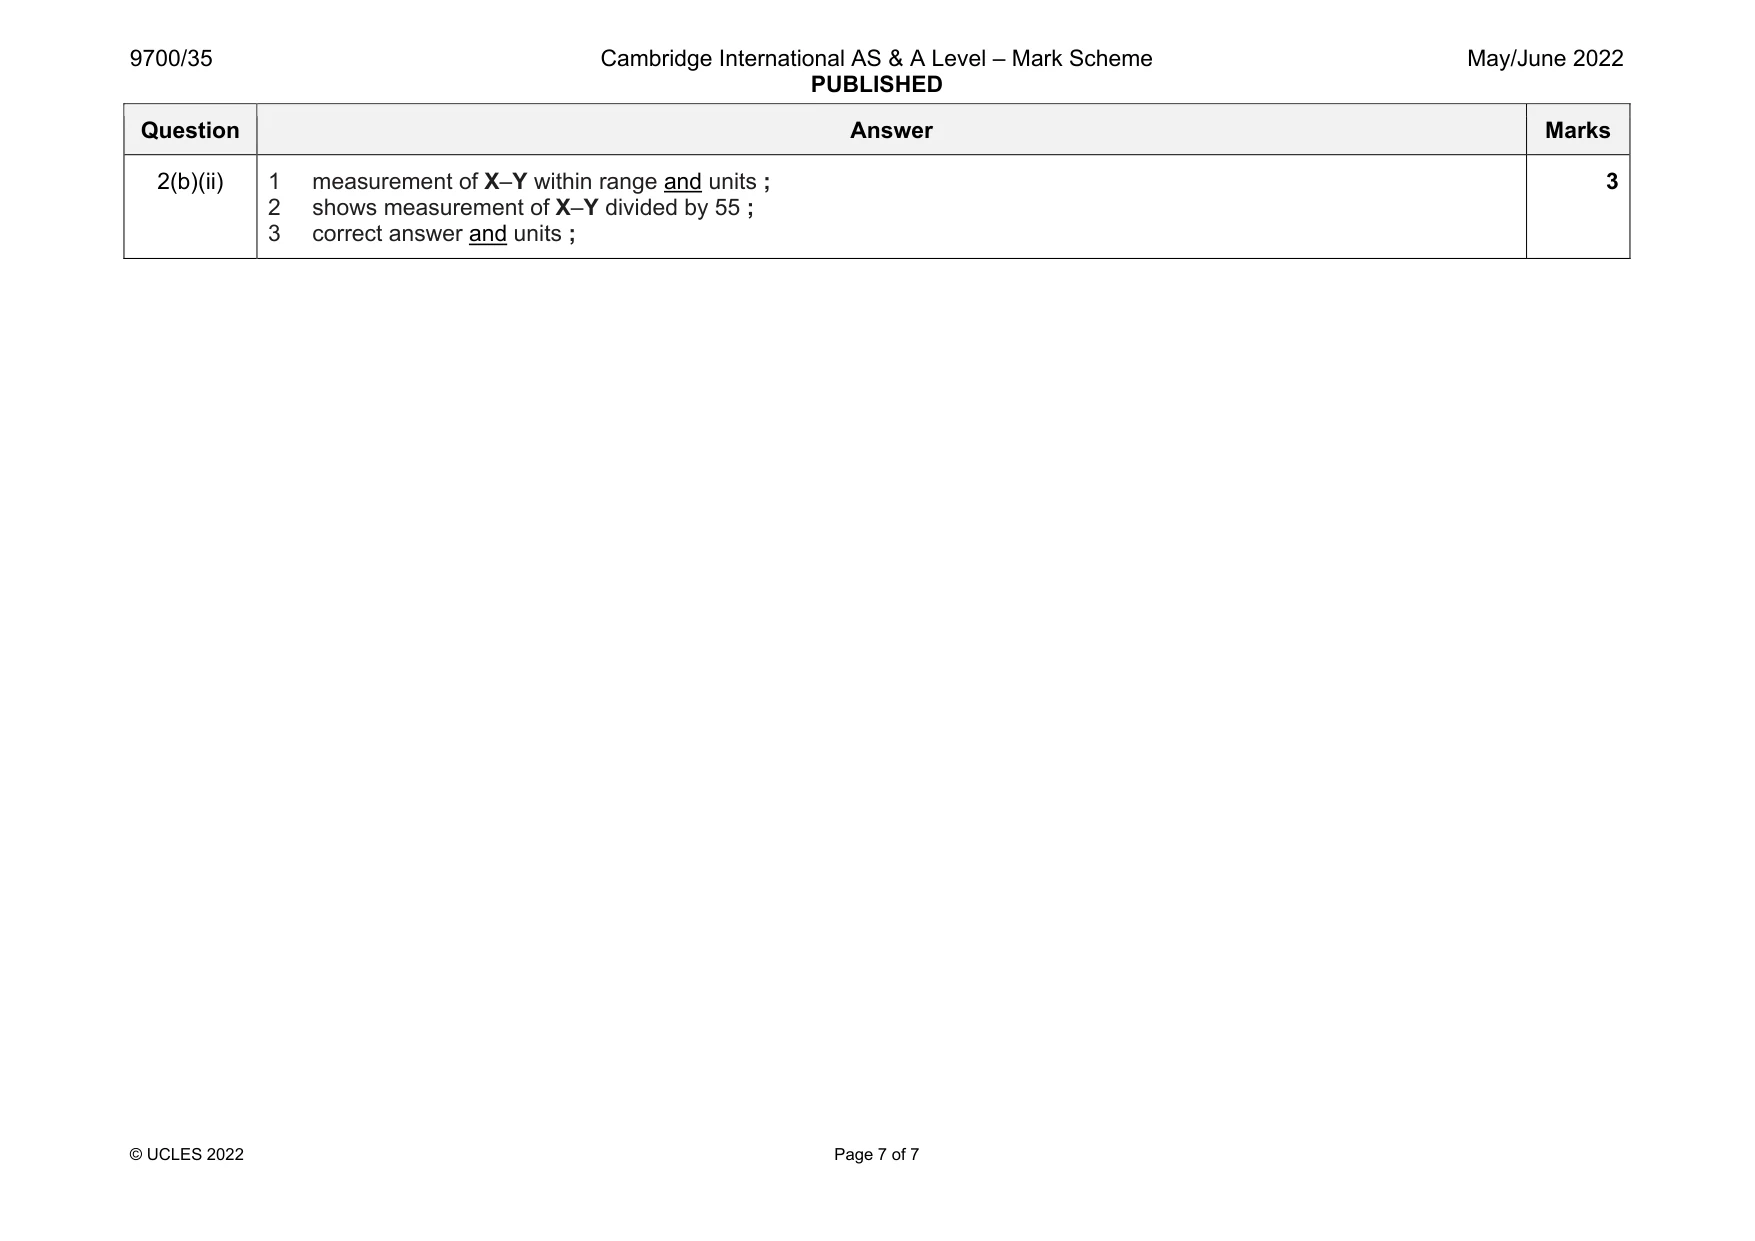
Mark scheme: 2(a)(i) 1 uses most of the available space and draws at least three layers of tissue ; 2 draws only the region of stem indicated and no cells ; 3 draws tissues on both sides of the projection ; 4 draws region of tissue at the tip of the projection ; 5 label line and label to identify the epidermis ; 2(a)(ii) 1 uses most of the available space and all the lines sharp and continuous ; 2 draws only four cells and each cell touching at least one other cells ; 3 cell wall drawn as two lines and three lines where the cells touch ; 4 correct proportions of the cells ; 5 label line and label to identify the cell wall ; 5 2(b)(i) circle drawn around 389 ; 1 2(b)(ii) shows the addition of the three distances (seed length 10.0 mm) and division by 3 : answer to the correct degree of accuracy ; 2 2(b)(iii) 1 x-axis: seed length / mm and y-axis : mean distance travelled / m ; 2 scale on x-axis: 5 to 2 cm, labelled at least every 2 cm and scale on y-axis: 4 to 2 cm and labelled at least every 2 cm, with 200 at the origin ; 3 correct plotting of all points using small crosses or small dots in circles ; 4 five points joined with thin line passing through all points and line is either a smooth curve or joined plot to plot ; 4 Question Answer Marks 2(b)(ii) 1 measurement of X–Y within range and units ; 2 shows measurement of X–Y divided by 55 ; 3 correct answer and units ; 3
More questions on Cells as the basic units of living organisms
What was in this paper
The subtopics covered by these 2 questions, and how many questions each got. Open one in a new tab to see every Cambridge question on it.
What you needed in this session
Cambridge’s own grade thresholds for 2022 May/June, Paper 3 · Variant 5. A higher threshold means an easier paper — the bar moves with how the cohort did.