Cambridge A Level Biology 9700 — 2022 May/June Paper 4 · Variant 3
9700/43/M/J/22 · 10 questions · 100 marks · ≈113 min
The question paper and its mark scheme, free to read here and free to download. This is Cambridge’s own paper, exactly as it was sat.
Question paper24 pages

Mark scheme23 pages
Answers below. Sit the paper first if you are practising.
Questions as text
Q1 · The water potential of mammalian blood needs to be maintained within narrow limits so…
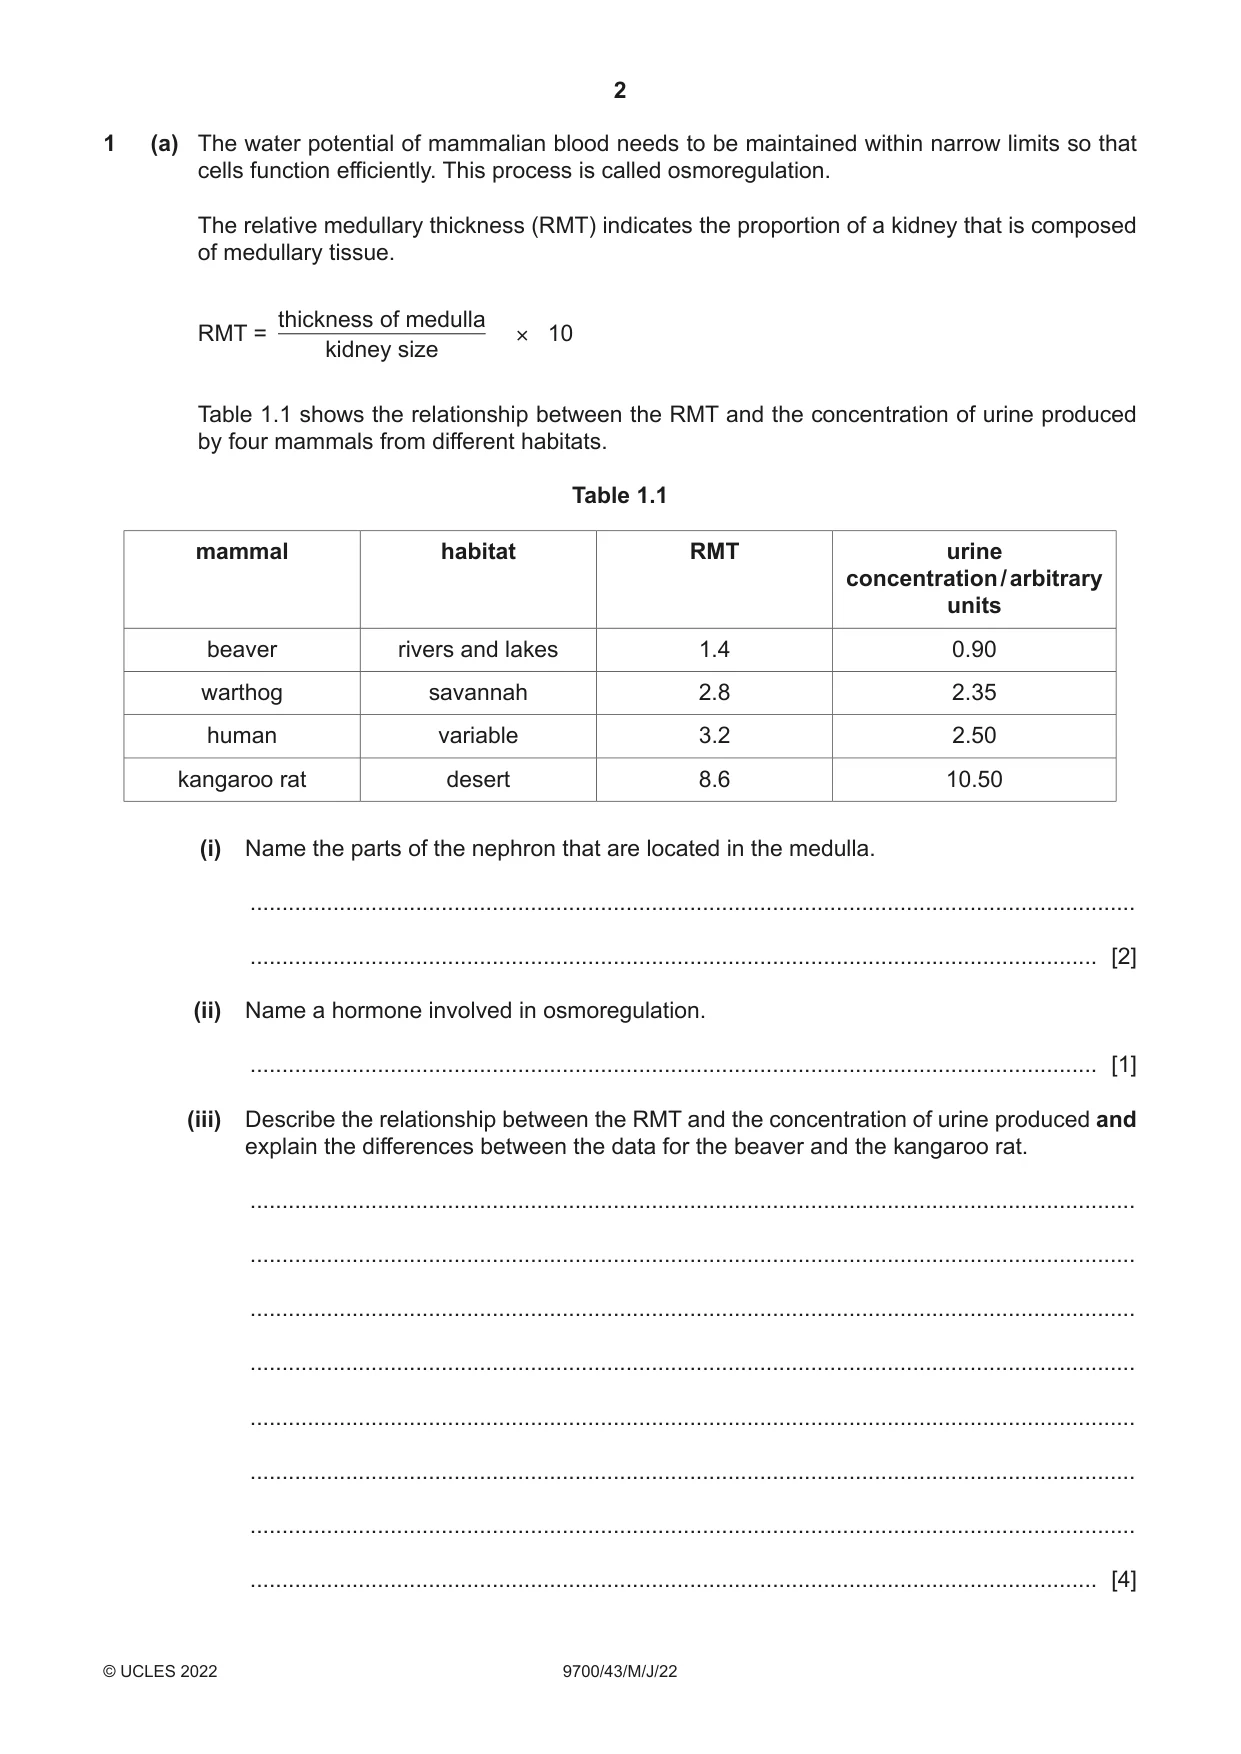
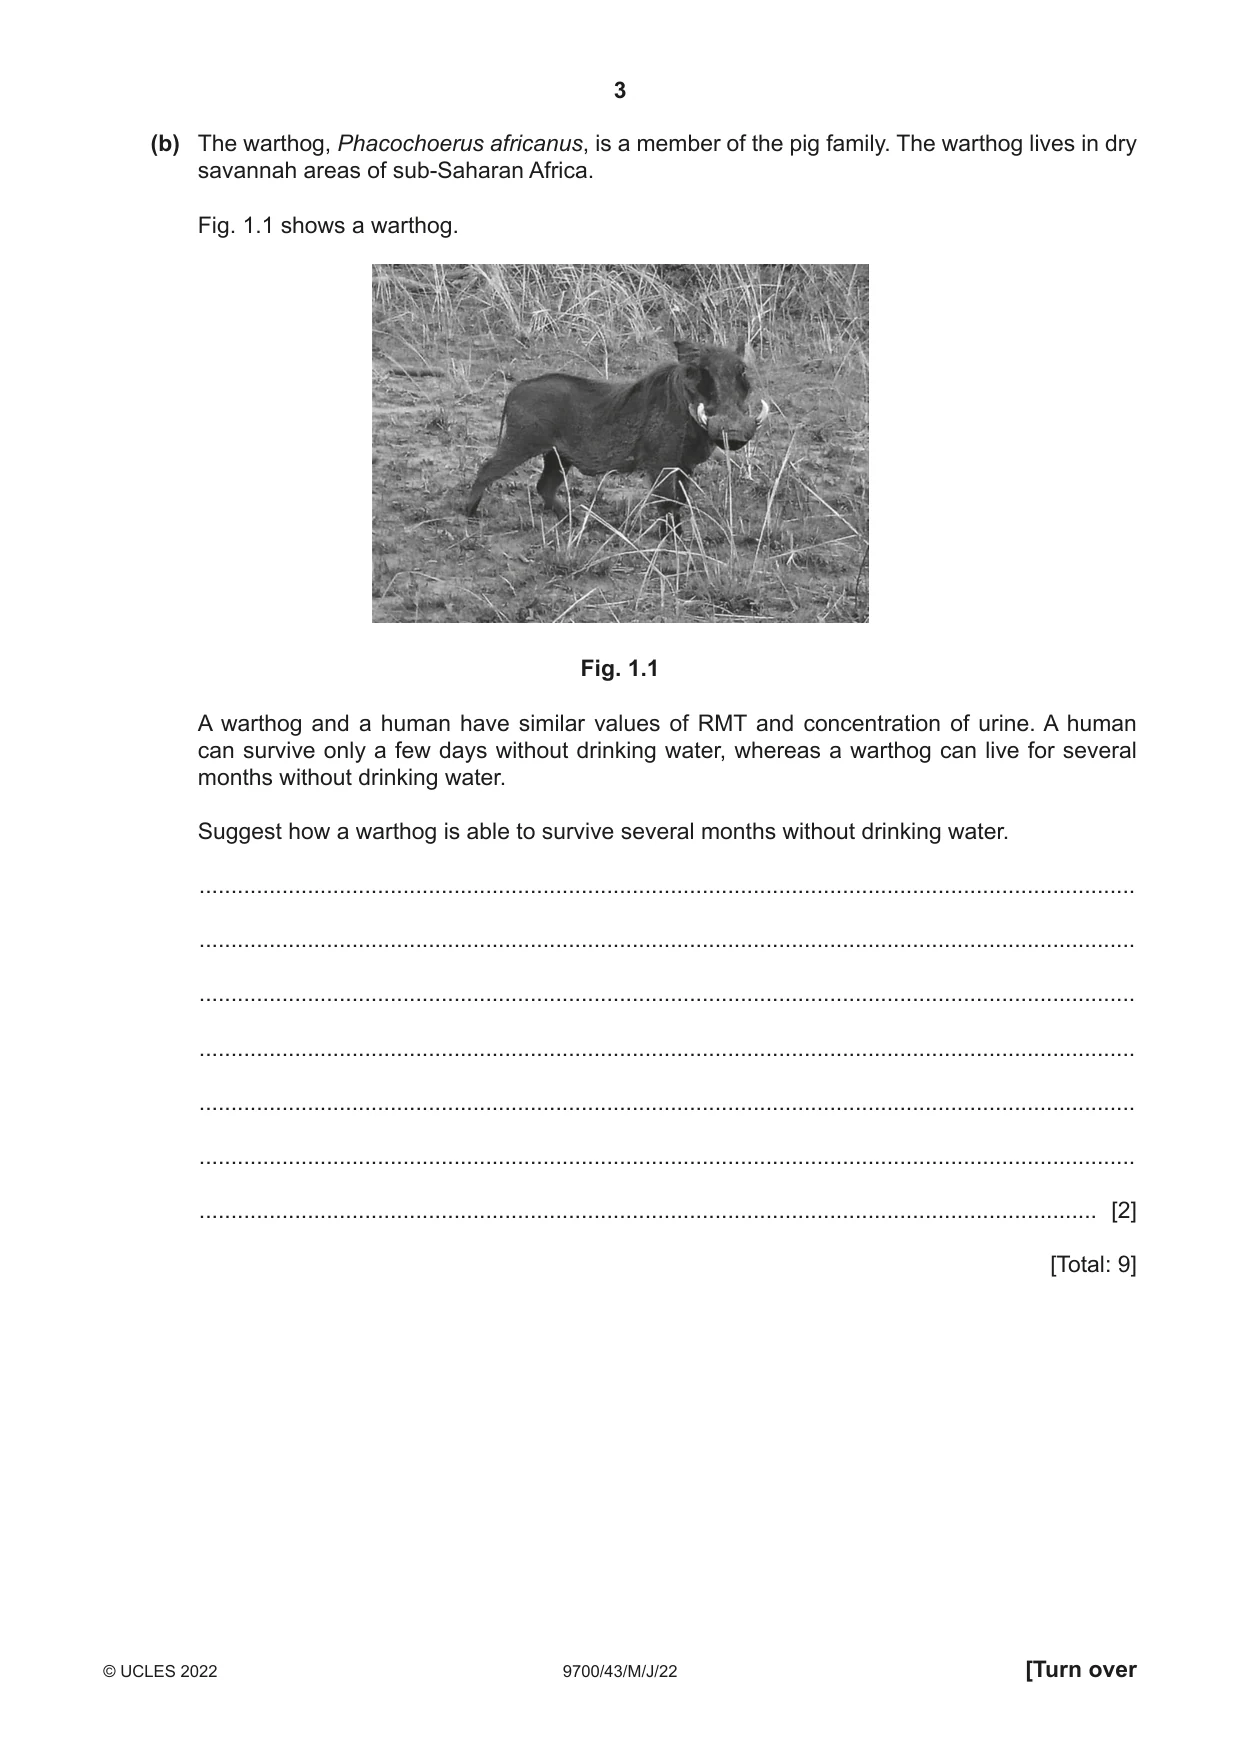
1 (a) The water potential of mammalian blood needs to be maintained within narrow limits so that cells function efficiently. This process is called osmoregulation. The relative medullary thickness (RMT) indicates the proportion of a kidney that is composed of medullary tissue. thickness of medulla RMT = × 10 kidney size Table 1.1 shows the relationship between the RMT and the concentration of urine produced by four mammals from different habitats. Table 1.1 mammal habitat RMT urine concentration / arbitrary units beaver rivers and lakes 1.4 0.90 warthog savannah 2.8 2.35 human variable 3.2 2.50 kangaroo rat desert 8.6 10.50 (i) Name the parts of the nephron that are located in the medulla. ........................................................................................................................................... ..................................................................................................................................... [2] (ii) Name a hormone involved in osmoregulation. ..................................................................................................................................... [1] (iii) Describe the relationship between the RMT and the concentration of urine produced and explain the differences between the data for the beaver and the kangaroo rat. ........................................................................................................................................... ........................................................................................................................................... ........................................................................................................................................... ........................................................................................................................................... ........................................................................................................................................... ........................................................................................................................................... ........................................................................................................................................... ..................................................................................................................................... [4] (b) The warthog, Phacochoerus africanus, is a member of the pig family. The warthog lives in dry savannah areas of sub-Saharan Africa. Fig. 1.1 shows a warthog. Fig. 1.1 A warthog and a human have similar values of RMT and concentration of urine. A human can survive only a few days without drinking water, whereas a warthog can live for several months without drinking water. Suggest how a warthog is able to survive several months without drinking water. ................................................................................................................................................... ................................................................................................................................................... ................................................................................................................................................... ................................................................................................................................................... ................................................................................................................................................... ................................................................................................................................................... ............................................................................................................................................. [2] [Total: 9]
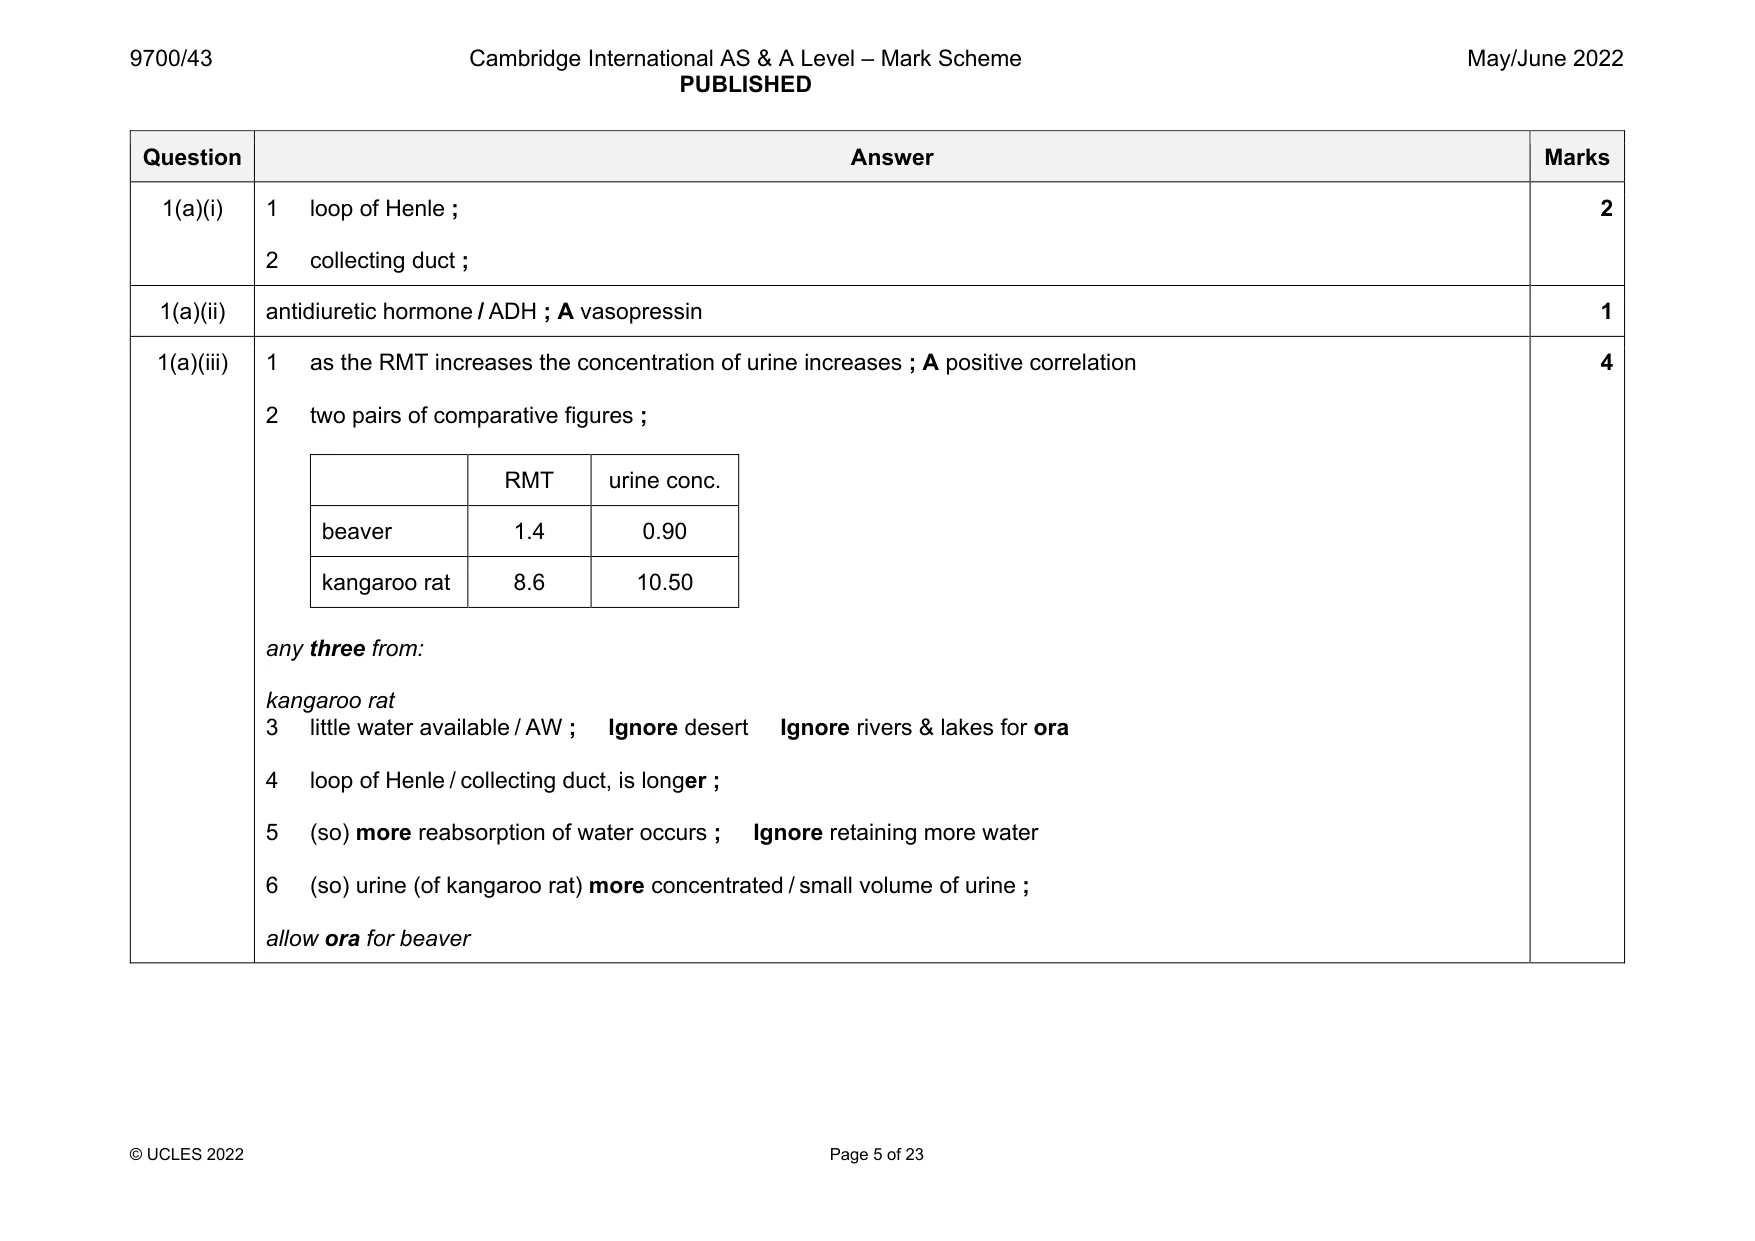
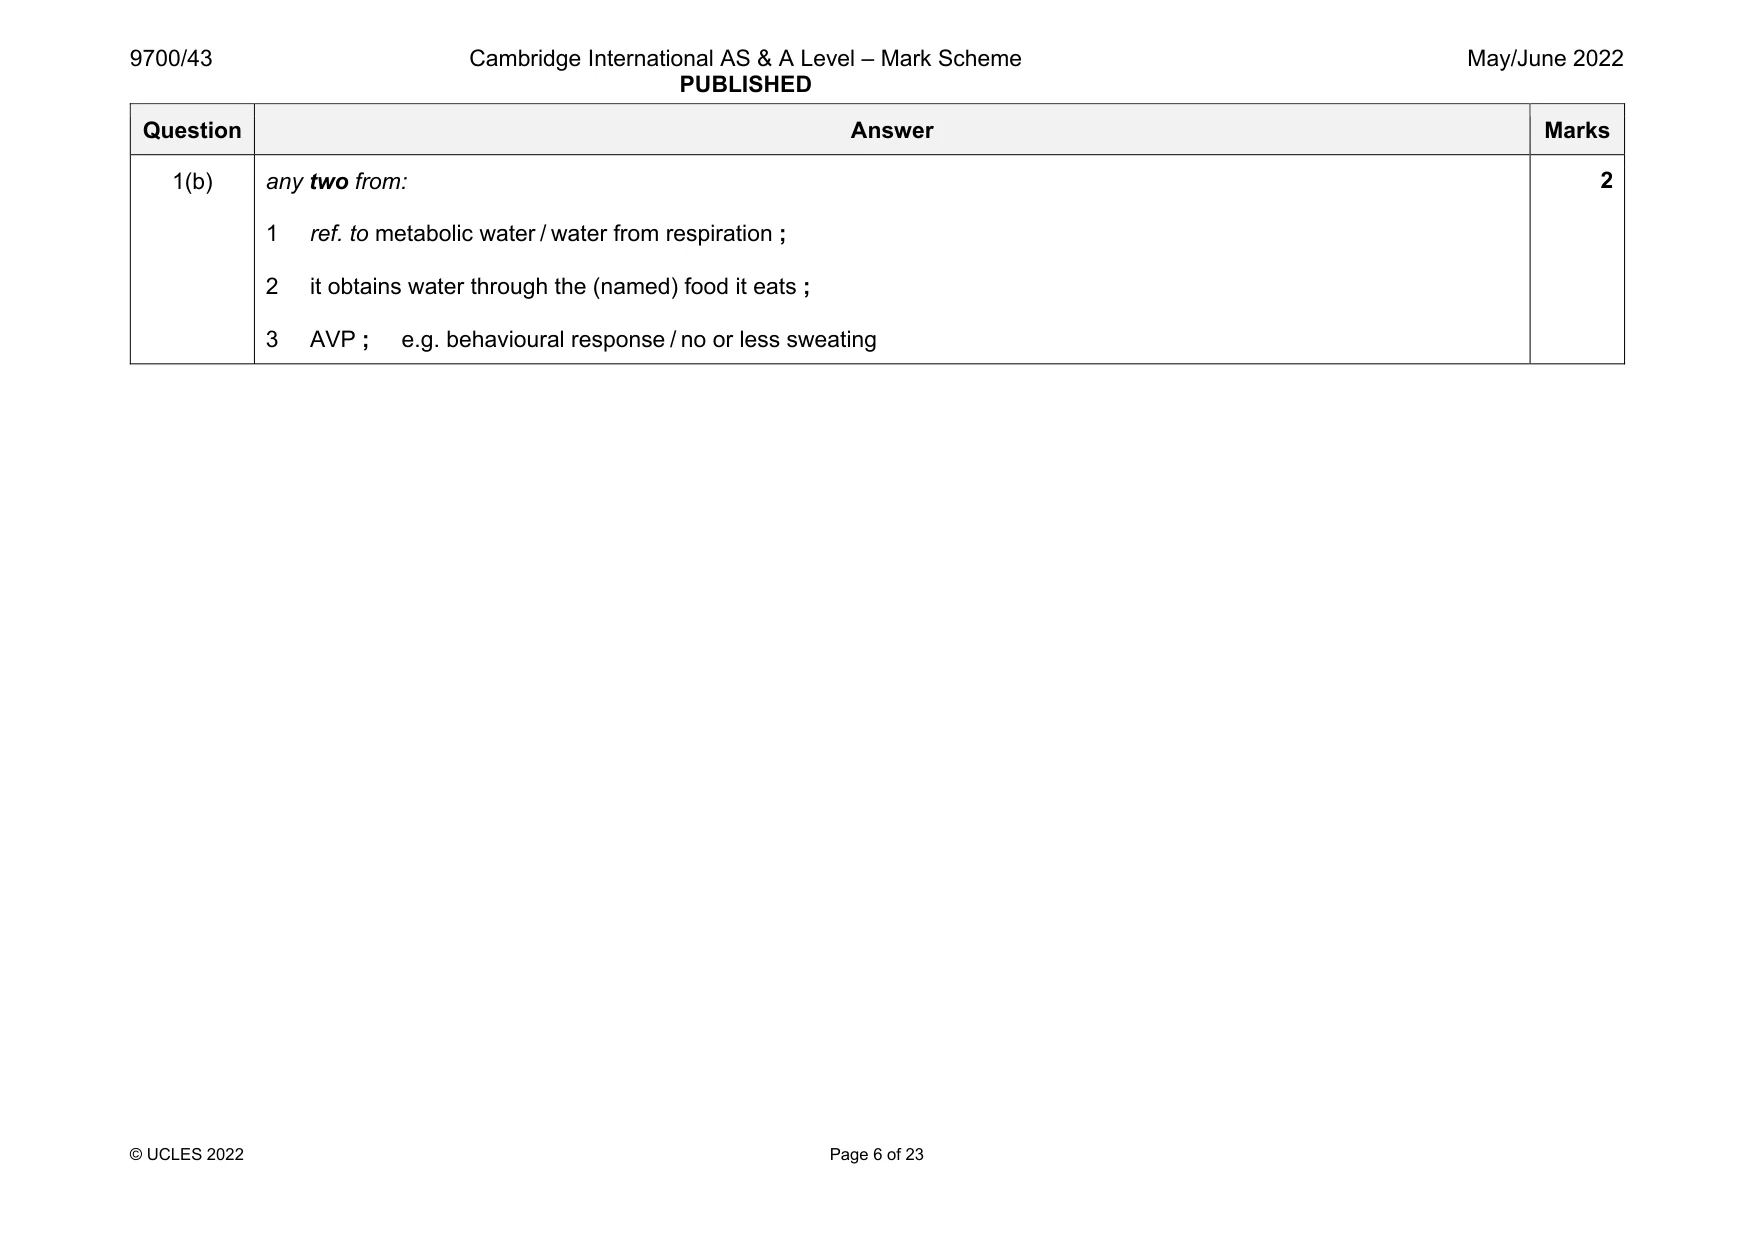
Mark scheme: 1(a)(i) 1 loop of Henle ; 2 collecting duct ; 2 1(a)(ii) antidiuretic hormone / ADH ; A vasopressin 1 1(a)(iii) 1 as the RMT increases the concentration of urine increases ; A positive correlation 2 two pairs of comparative figures ; RMT urine conc. beaver 1.4 0.90 kangaroo rat 8.6 10.50 any three from: kangaroo rat 3 little water available / AW ; Ignore desert Ignore rivers & lakes for ora 4 loop of Henle / collecting duct, is longer ; 5 (so) more reabsorption of water occurs ; Ignore retaining more water 6 (so) urine (of kangaroo rat) more concentrated / small volume of urine ; allow ora for beaver 4 Question Answer Marks 1(b) any two from: 1 ref. to metabolic water / water from respiration ; 2 it obtains water through the (named) food it eats ; 3 AVP ; e.g. behavioural response / no or less sweating 2
Q2 · Photosynthesis is an energy transfer process that results in the production of…
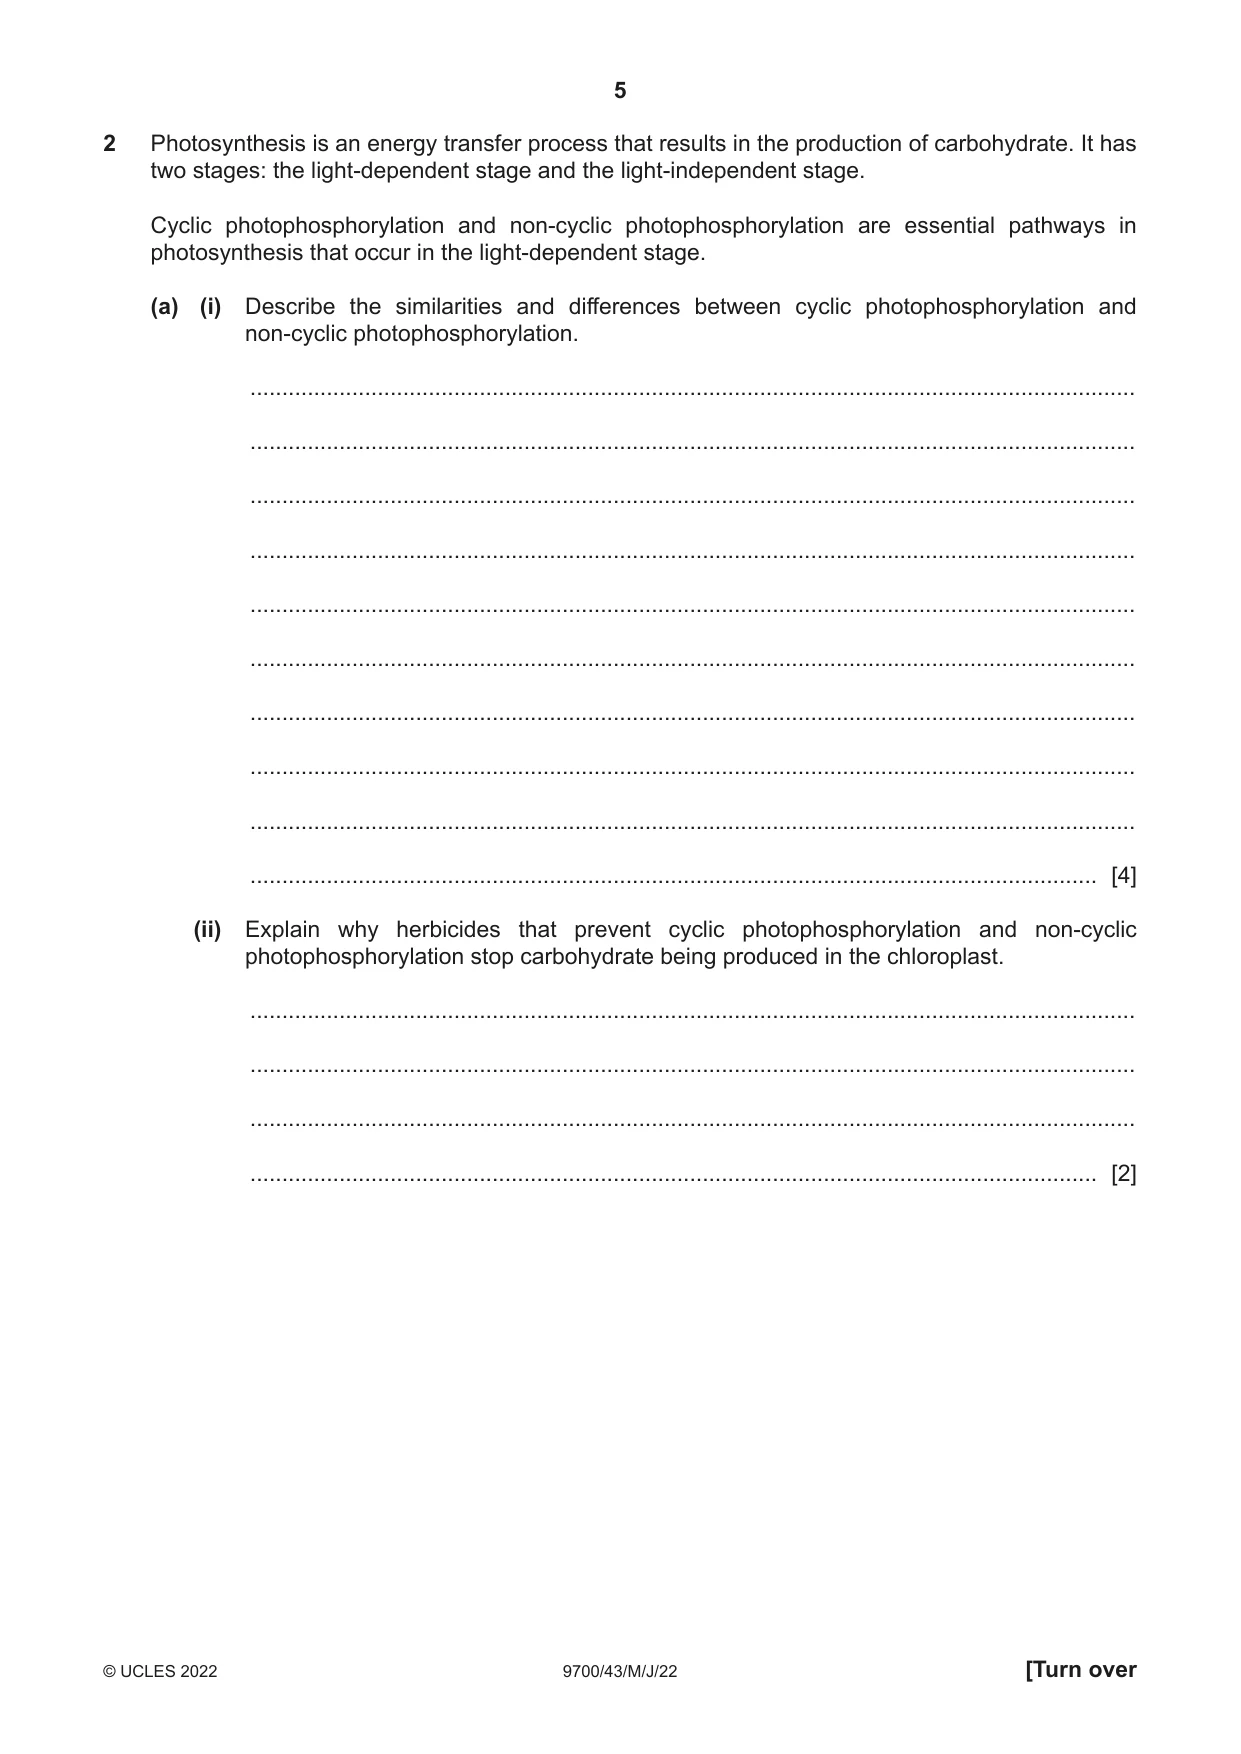
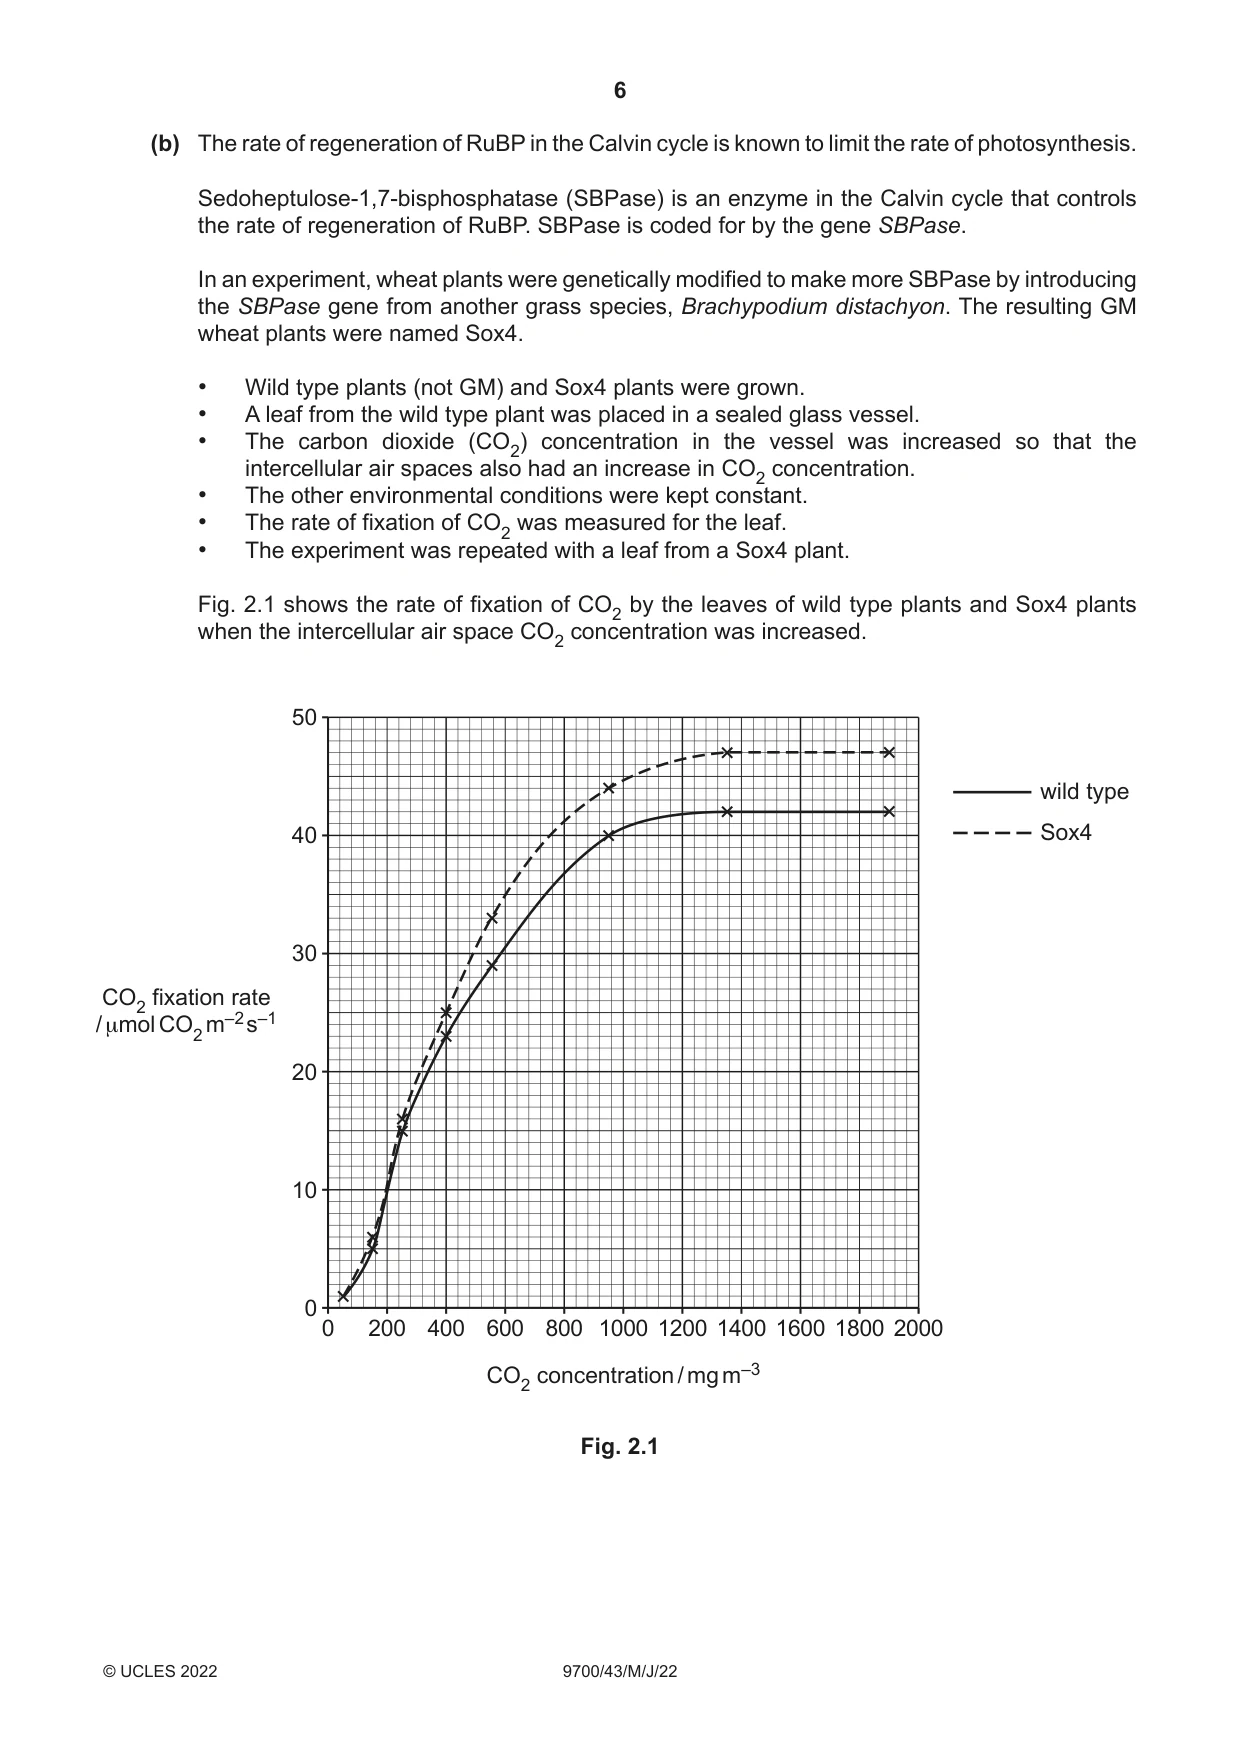
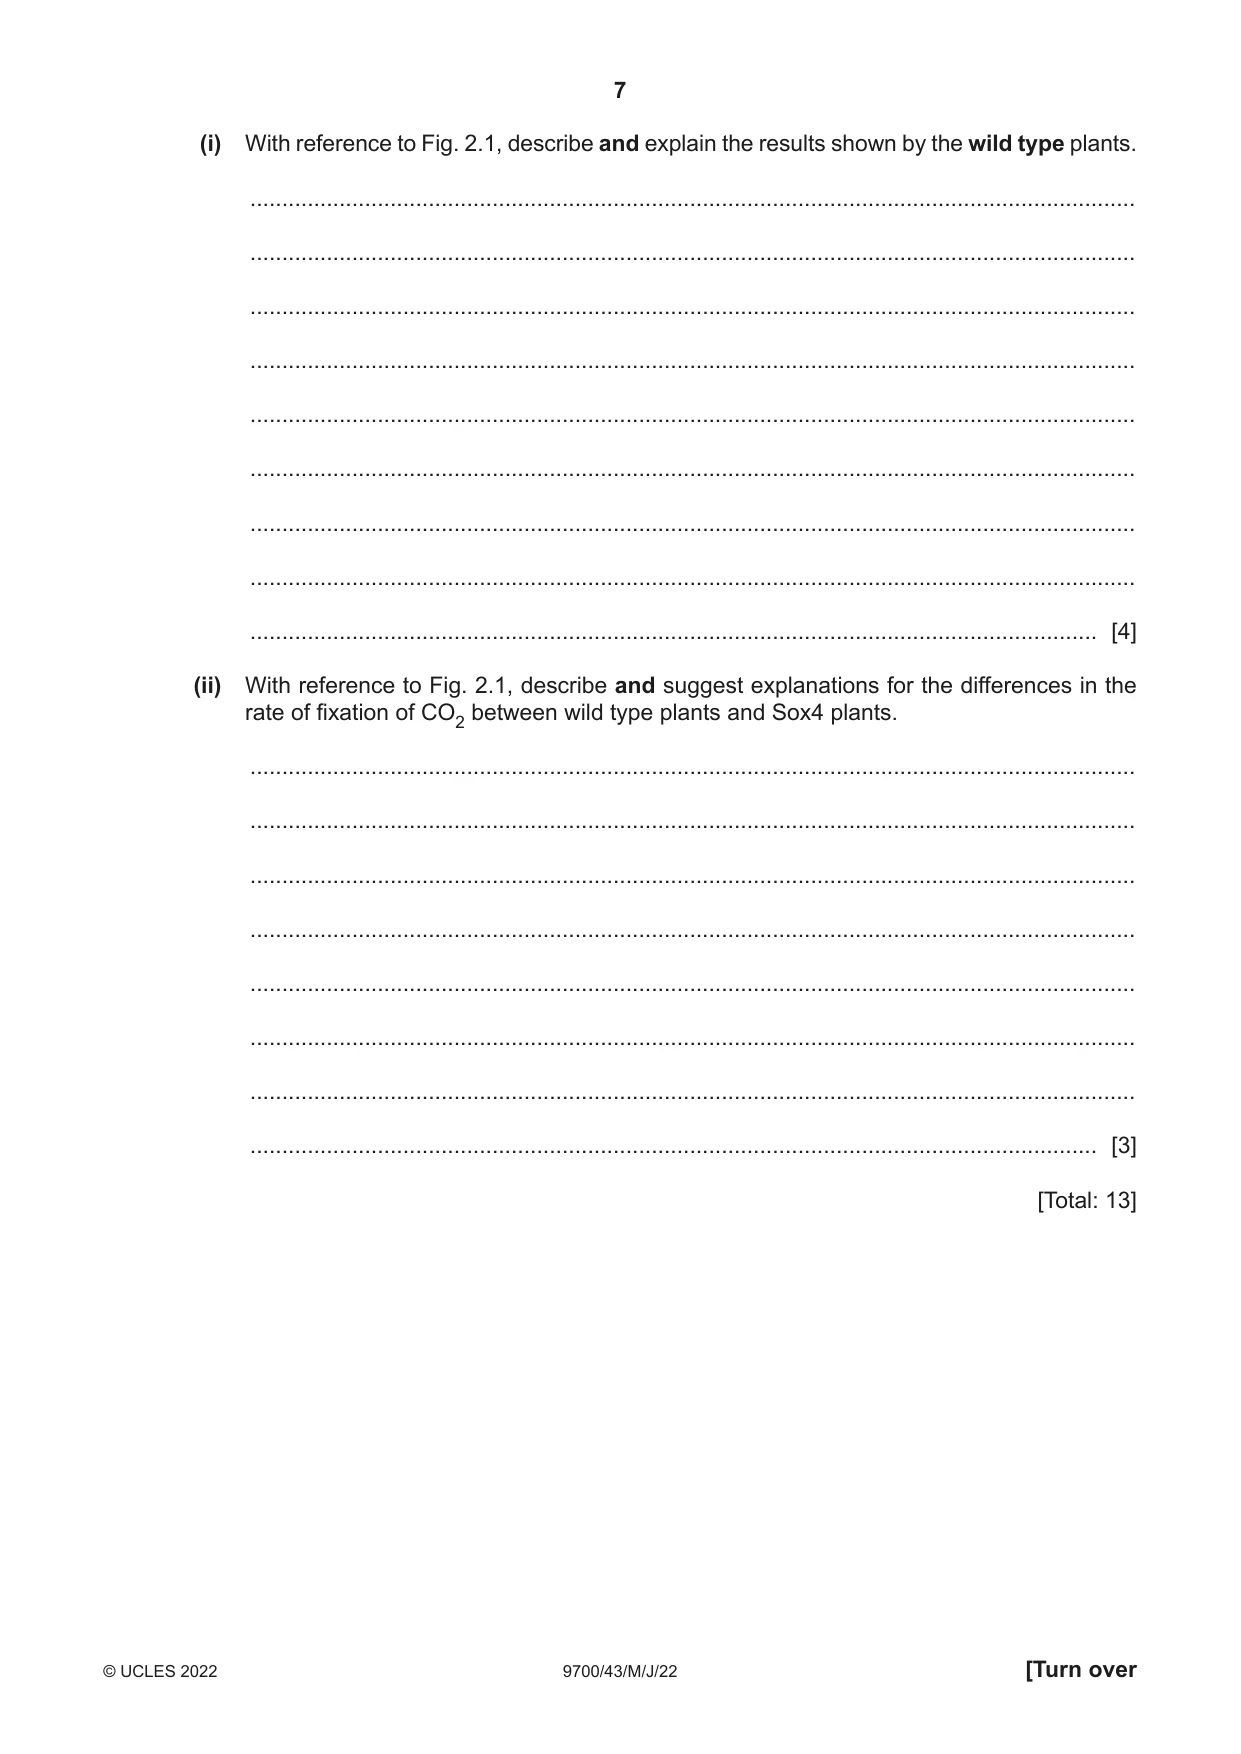
2 Photosynthesis is an energy transfer process that results in the production of carbohydrate. It has two stages: the light-dependent stage and the light-independent stage. Cyclic photophosphorylation and non-cyclic photophosphorylation are essential pathways in photosynthesis that occur in the light-dependent stage. (a) (i) Describe the similarities and differences between cyclic photophosphorylation and non-cyclic photophosphorylation. ........................................................................................................................................... ........................................................................................................................................... ........................................................................................................................................... ........................................................................................................................................... ........................................................................................................................................... ........................................................................................................................................... ........................................................................................................................................... ........................................................................................................................................... ........................................................................................................................................... ..................................................................................................................................... [4] (ii) Explain why herbicides that prevent cyclic photophosphorylation and non-cyclic photophosphorylation stop carbohydrate being produced in the chloroplast. ........................................................................................................................................... ........................................................................................................................................... ........................................................................................................................................... ..................................................................................................................................... [2] (b) The rate of regeneration of RuBP in the Calvin cycle is known to limit the rate of photosynthesis. Sedoheptulose-1,7-bisphosphatase (SBPase) is an enzyme in the Calvin cycle that controls the rate of regeneration of RuBP. SBPase is coded for by the gene SBPase. In an experiment, wheat plants were genetically modified to make more SBPase by introducing the SBPase gene from another grass species, Brachypodium distachyon. The resulting GM wheat plants were named Sox4. • Wild type plants (not GM) and Sox4 plants were grown. • A leaf from the wild type plant was placed in a sealed glass vessel. • The carbon dioxide (CO2) concentration in the vessel was increased so that the intercellular air spaces also had an increase in CO2 concentration. • The other environmental conditions were kept constant. • The rate of fixation of CO2 was measured for the leaf. • The experiment was repeated with a leaf from a Sox4 plant. Fig. 2.1 shows the rate of fixation of CO2 by the leaves of wild type plants and Sox4 plants when the intercellular air space CO2 concentration was increased. 50 wild type 40 Sox4 30 CO2 fixation rate / μmol CO2 m–2 s–1 20 10 0 0 200 400 600 800 1000 1200 1400 1600 1800 2000 CO2 concentration / mg m–3 Fig. 2.1 (i) With reference to Fig. 2.1, describe and explain the results shown by the wild type plants. ........................................................................................................................................... ........................................................................................................................................... ........................................................................................................................................... ........................................................................................................................................... ........................................................................................................................................... ........................................................................................................................................... ........................................................................................................................................... ........................................................................................................................................... ..................................................................................................................................... [4] (ii) With reference to Fig. 2.1, describe and suggest explanations for the differences in the rate of fixation of CO2 between wild type plants and Sox4 plants. ........................................................................................................................................... ........................................................................................................................................... ........................................................................................................................................... ........................................................................................................................................... ........................................................................................................................................... ........................................................................................................................................... ........................................................................................................................................... ..................................................................................................................................... [3] [Total: 13]
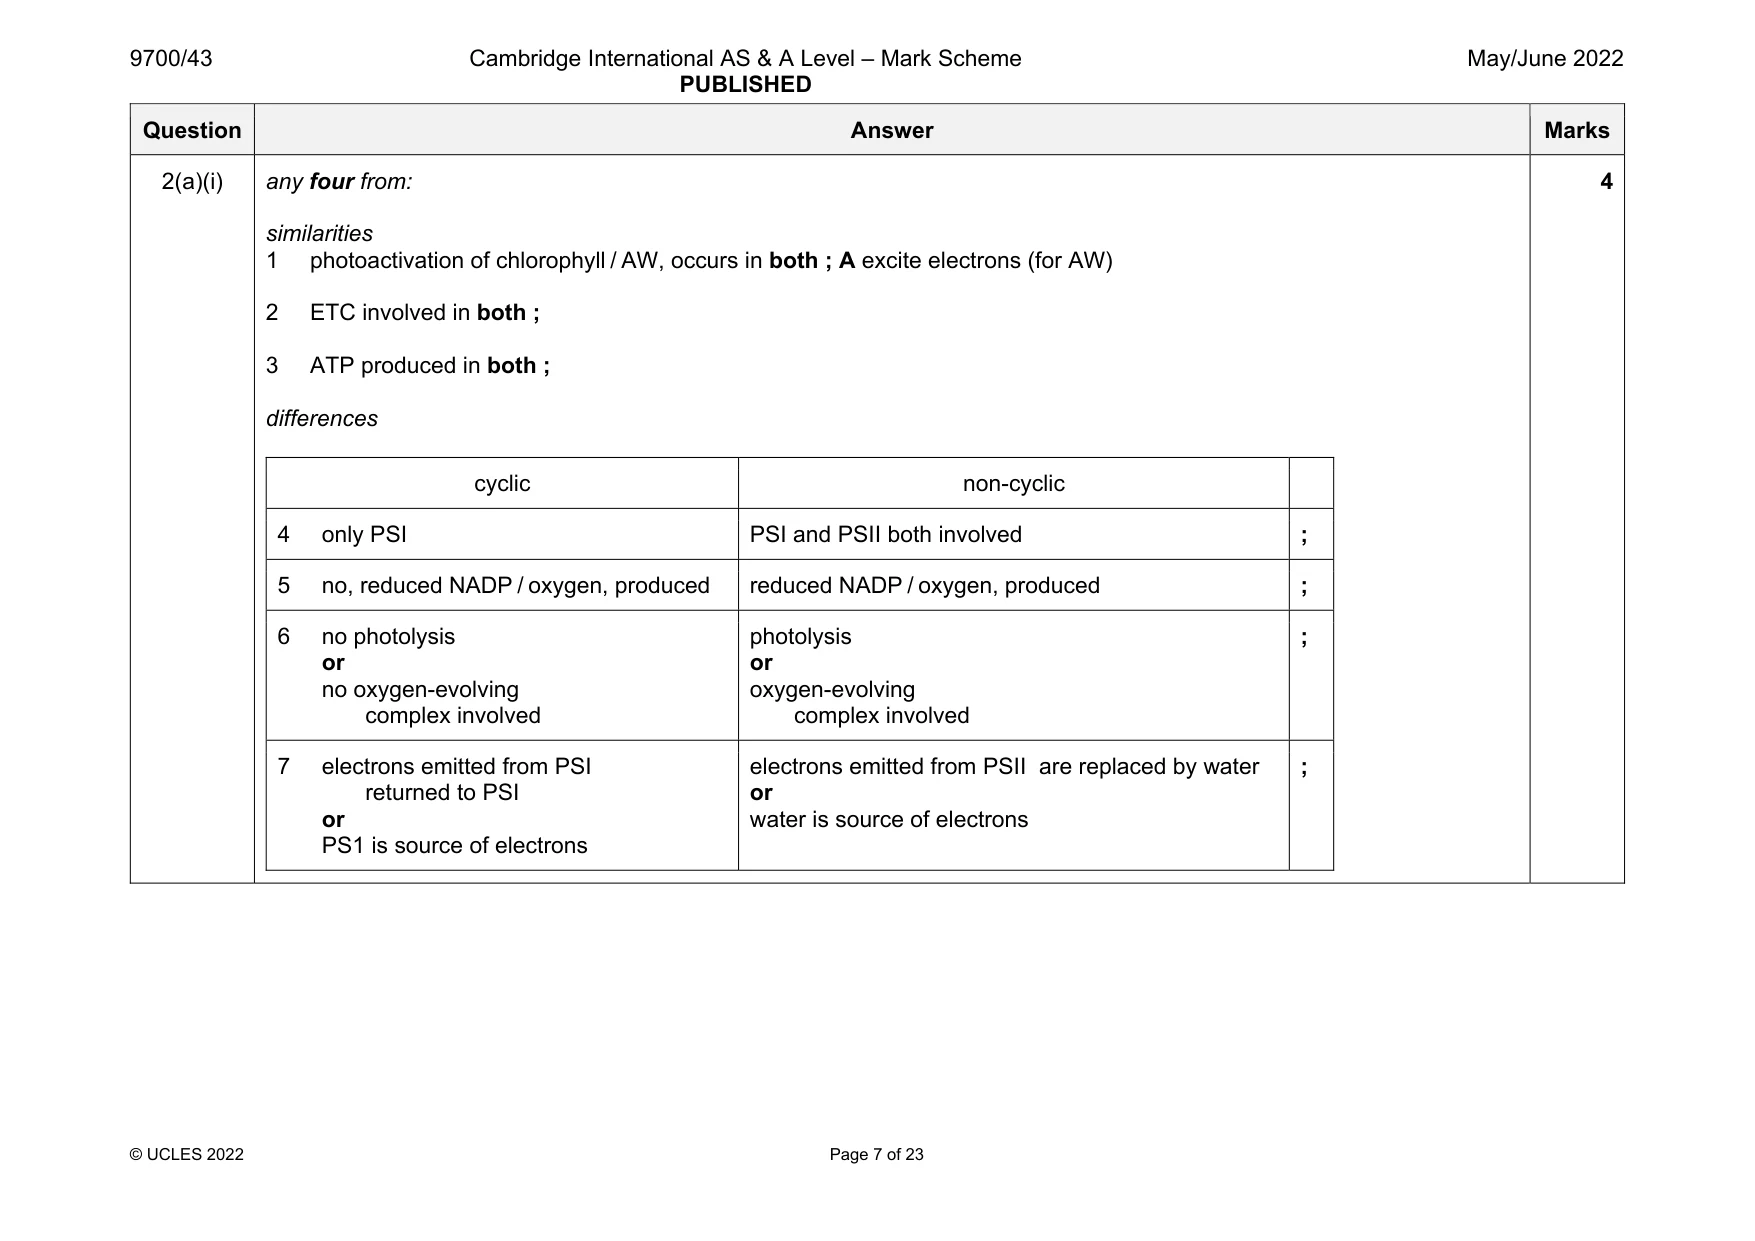
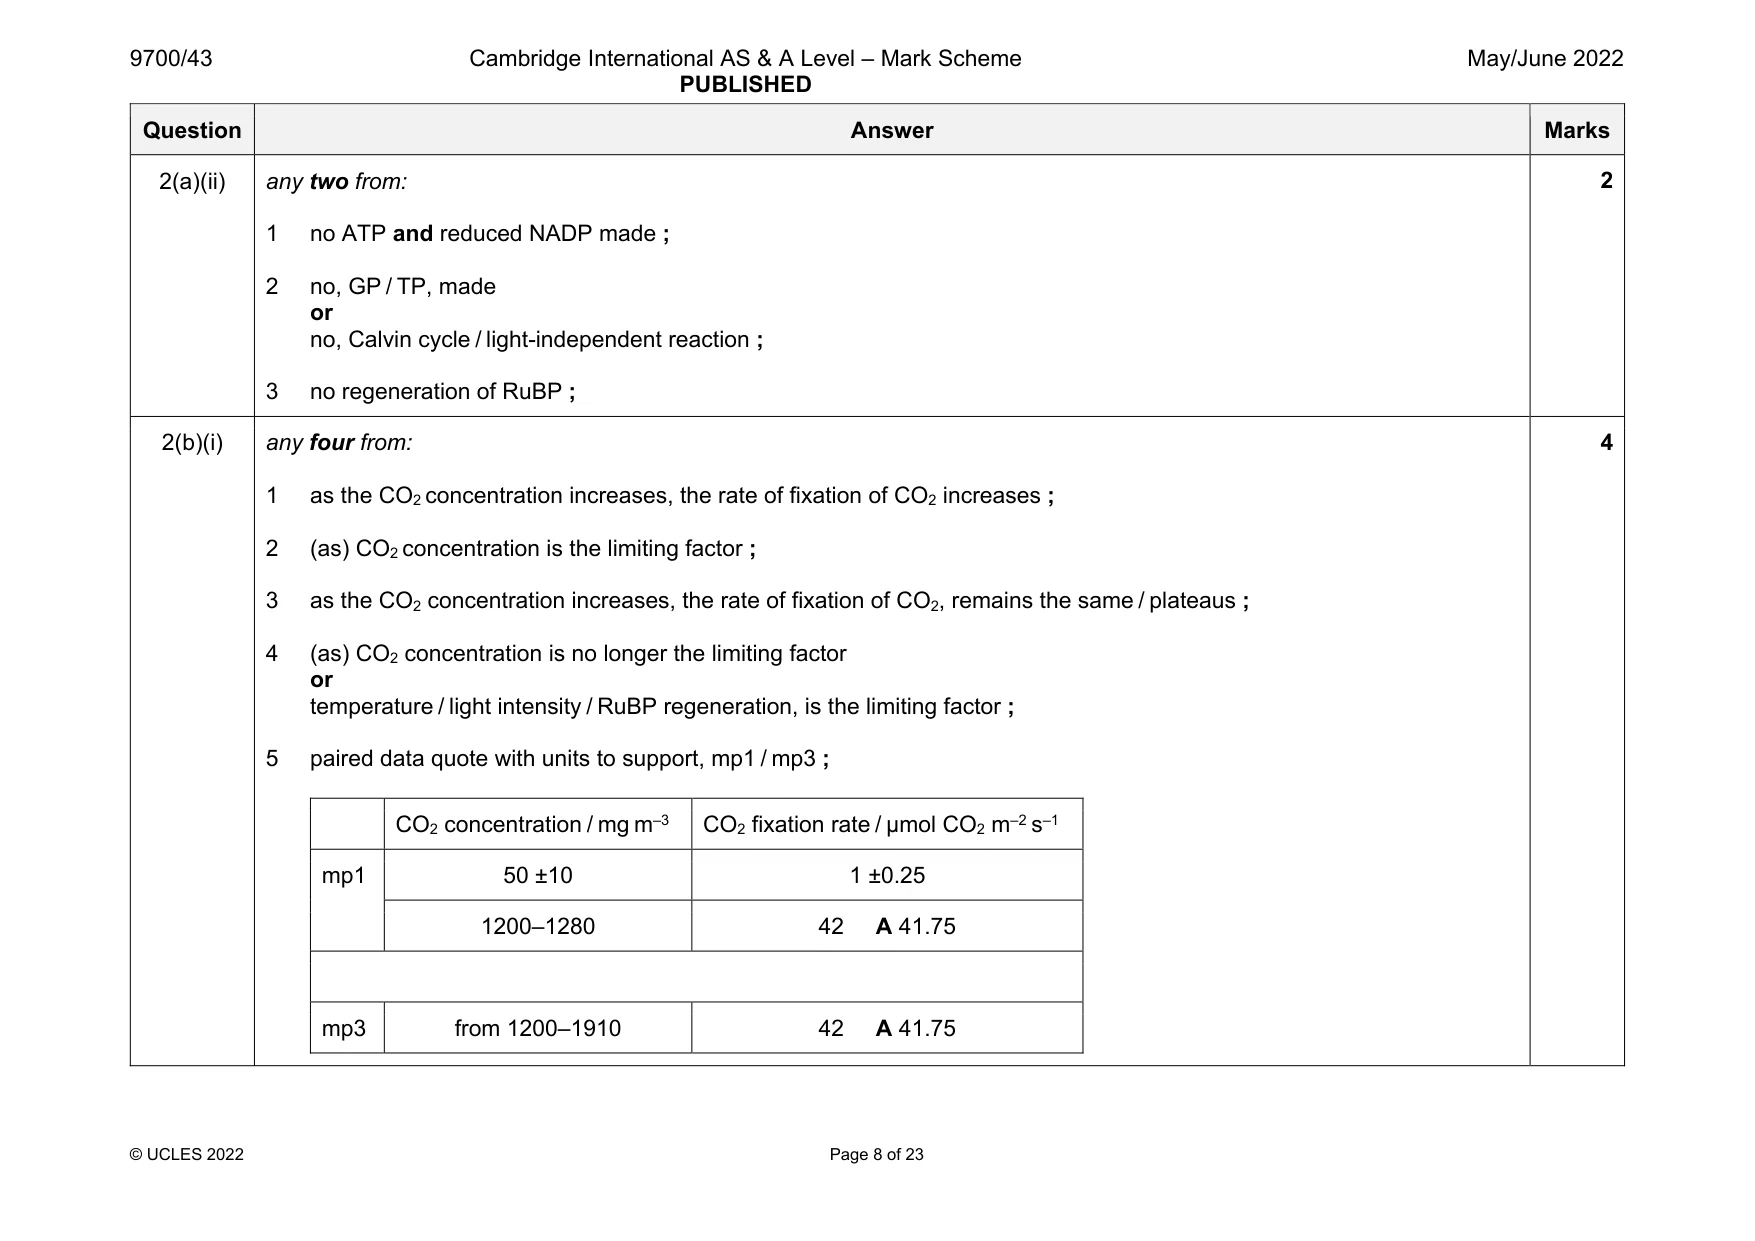
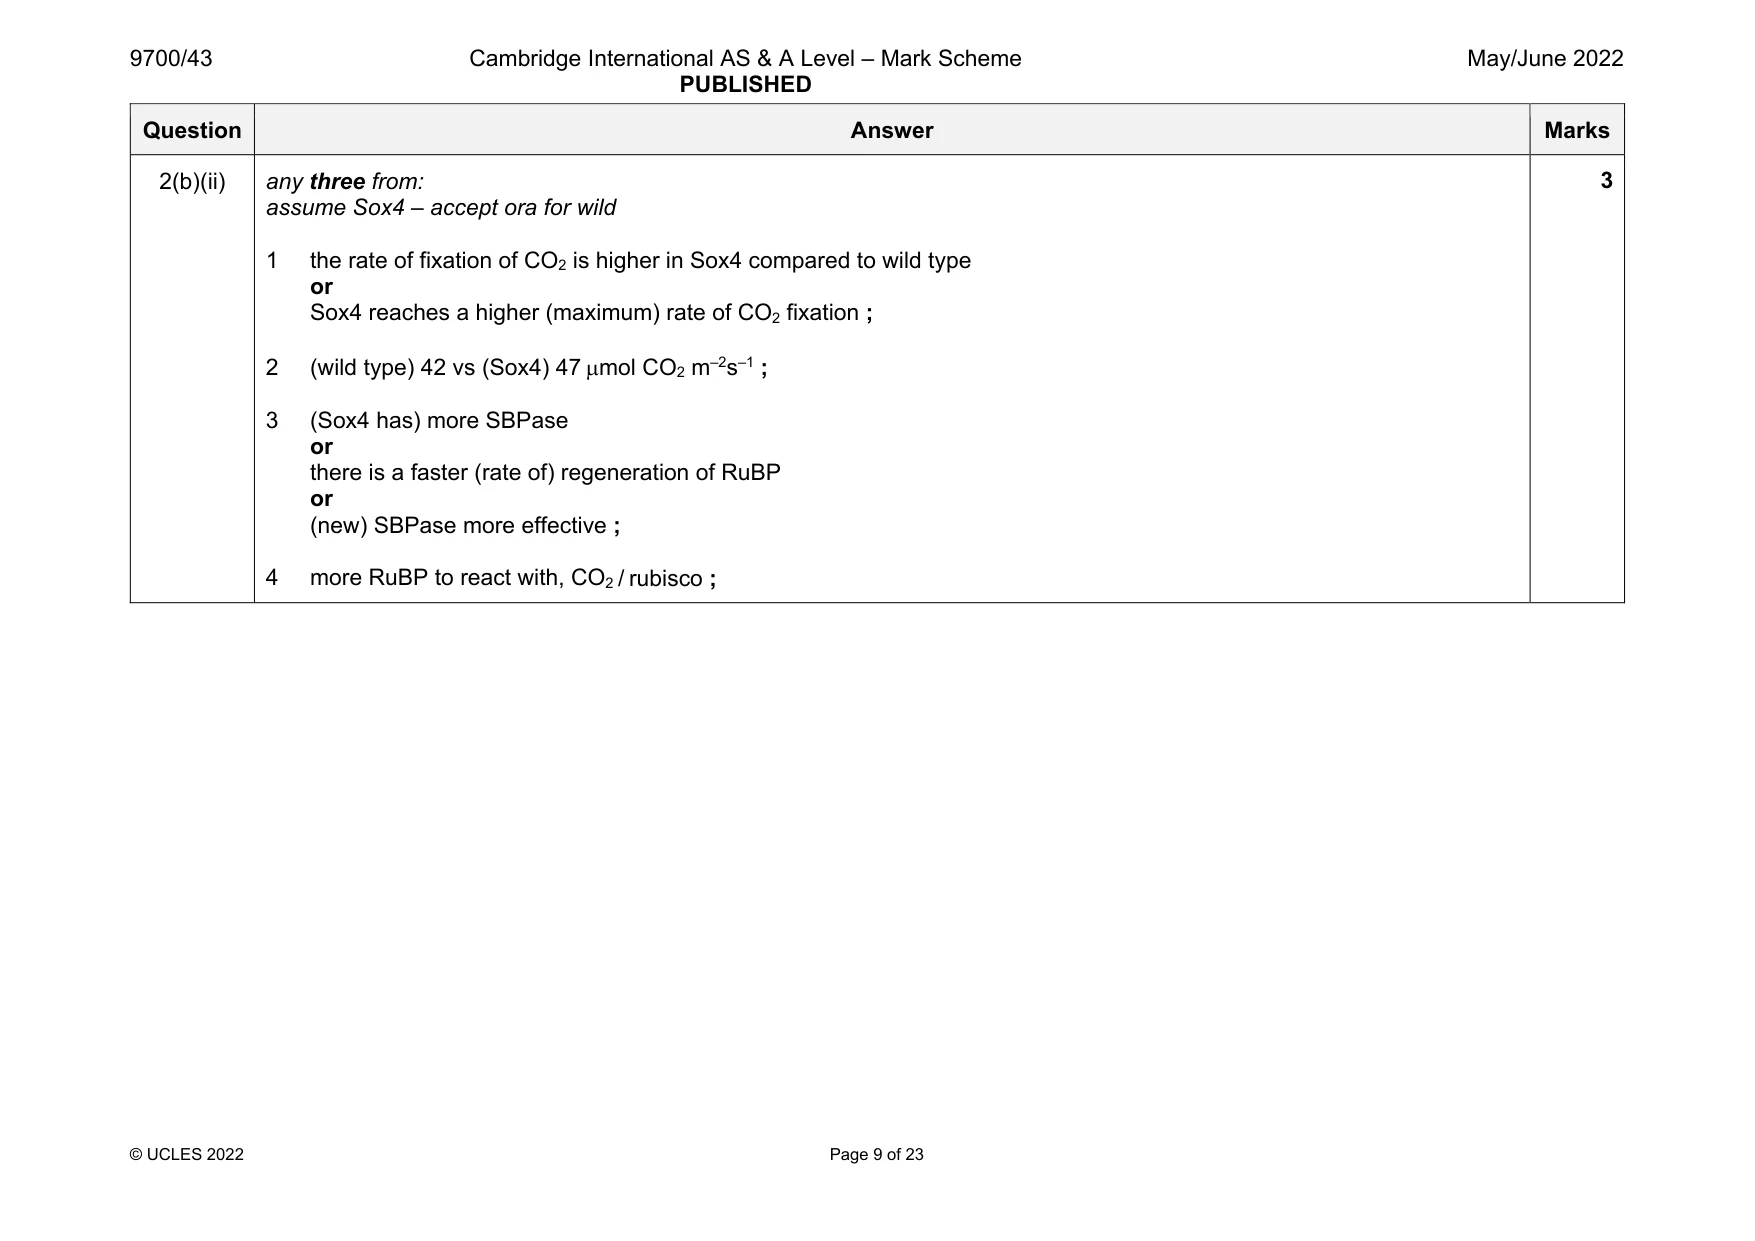
Mark scheme: 2(a)(i) any four from: similarities 1 photoactivation of chlorophyll / AW, occurs in both ; A excite electrons (for AW) 2 ETC involved in both ; 3 ATP produced in both ; differences cyclic non-cyclic 4 only PSI PSI and PSII both involved ; 5 no, reduced NADP / oxygen, produced reduced NADP / oxygen, produced ; 6 no photolysis or no oxygen-evolving complex involved photolysis or oxygen-evolving complex involved ; 7 electrons emitted from PSI returned to PSI or PS1 is source of electrons electrons emitted from PSII are replaced by water or water is source of electrons ; 4 Question Answer Marks 2(a)(ii) any two from: 1 no ATP and reduced NADP made ; 2 no, GP / TP, made or no, Calvin cycle / light-independent reaction ; 3 no regeneration of RuBP ; 2 2(b)(i) any four from: 1 as the CO2 concentration increases, the rate of fixation of CO2 increases ; 2 (as) CO2 concentration is the limiting factor ; 3 as the CO2 concentration increases, the rate of fixation of CO2, remains the same / plateaus ; 4 (as) CO2 concentration is no longer the limiting factor or temperature / light intensity / RuBP regeneration, is the limiting factor ; 5 paired data quote with units to support, mp1 / mp3 ; CO2 concentration / mg m–3 CO2 fixation rate / µmol CO2 m–2 s–1 mp1 50 ±10 1 ±0.25 1200–1280 42 A 41.75 mp3 from 1200–1910 42 A 41.75 4 Question Answer Marks 2(b)(ii) any three from: assume Sox4 – accept ora for wild 1 the rate of fixation of CO2 is higher in Sox4 compared to wild type or Sox4 reaches a higher (maximum) rate of CO2 fixation ; 2 (wild type) 42 vs (Sox4) 47 mol CO2 m–2s–1 ; 3 (Sox4 has) more SBPase or there is a faster (rate of) regeneration of RuBP or (new) SBPase more effective ; 4 more RuBP to react with, CO2 / rubisco ; 3
More questions on Photosynthesis as an energy transfer process
Q3 · ATP is synthesised from ADP and Pi in a phosphorylation reaction
3 (a) ATP is synthesised from ADP and Pi in a phosphorylation reaction. State the two different ways in which this phosphorylation reaction occurs in aerobic respiration. ................................................................................................................................................... ............................................................................................................................................. [2] (b) Coenzymes are important in all four stages of aerobic respiration. Describe and explain the role of the coenzymes NAD and FAD in aerobic respiration. ................................................................................................................................................... ................................................................................................................................................... ................................................................................................................................................... ................................................................................................................................................... ................................................................................................................................................... ................................................................................................................................................... ................................................................................................................................................... ................................................................................................................................................... ................................................................................................................................................... ................................................................................................................................................... ................................................................................................................................................... ............................................................................................................................................. [6] (c) The enzyme pyruvate dehydrogenase catalyses the link reaction. Pyruvate dehydrogenase is inhibited when the ratio of acetyl coenzyme A to coenzyme A increases. Suggest the importance of this inhibition to the functioning of the cell. ................................................................................................................................................... ................................................................................................................................................... ................................................................................................................................................... ................................................................................................................................................... ............................................................................................................................................. [2] [Total: 10]
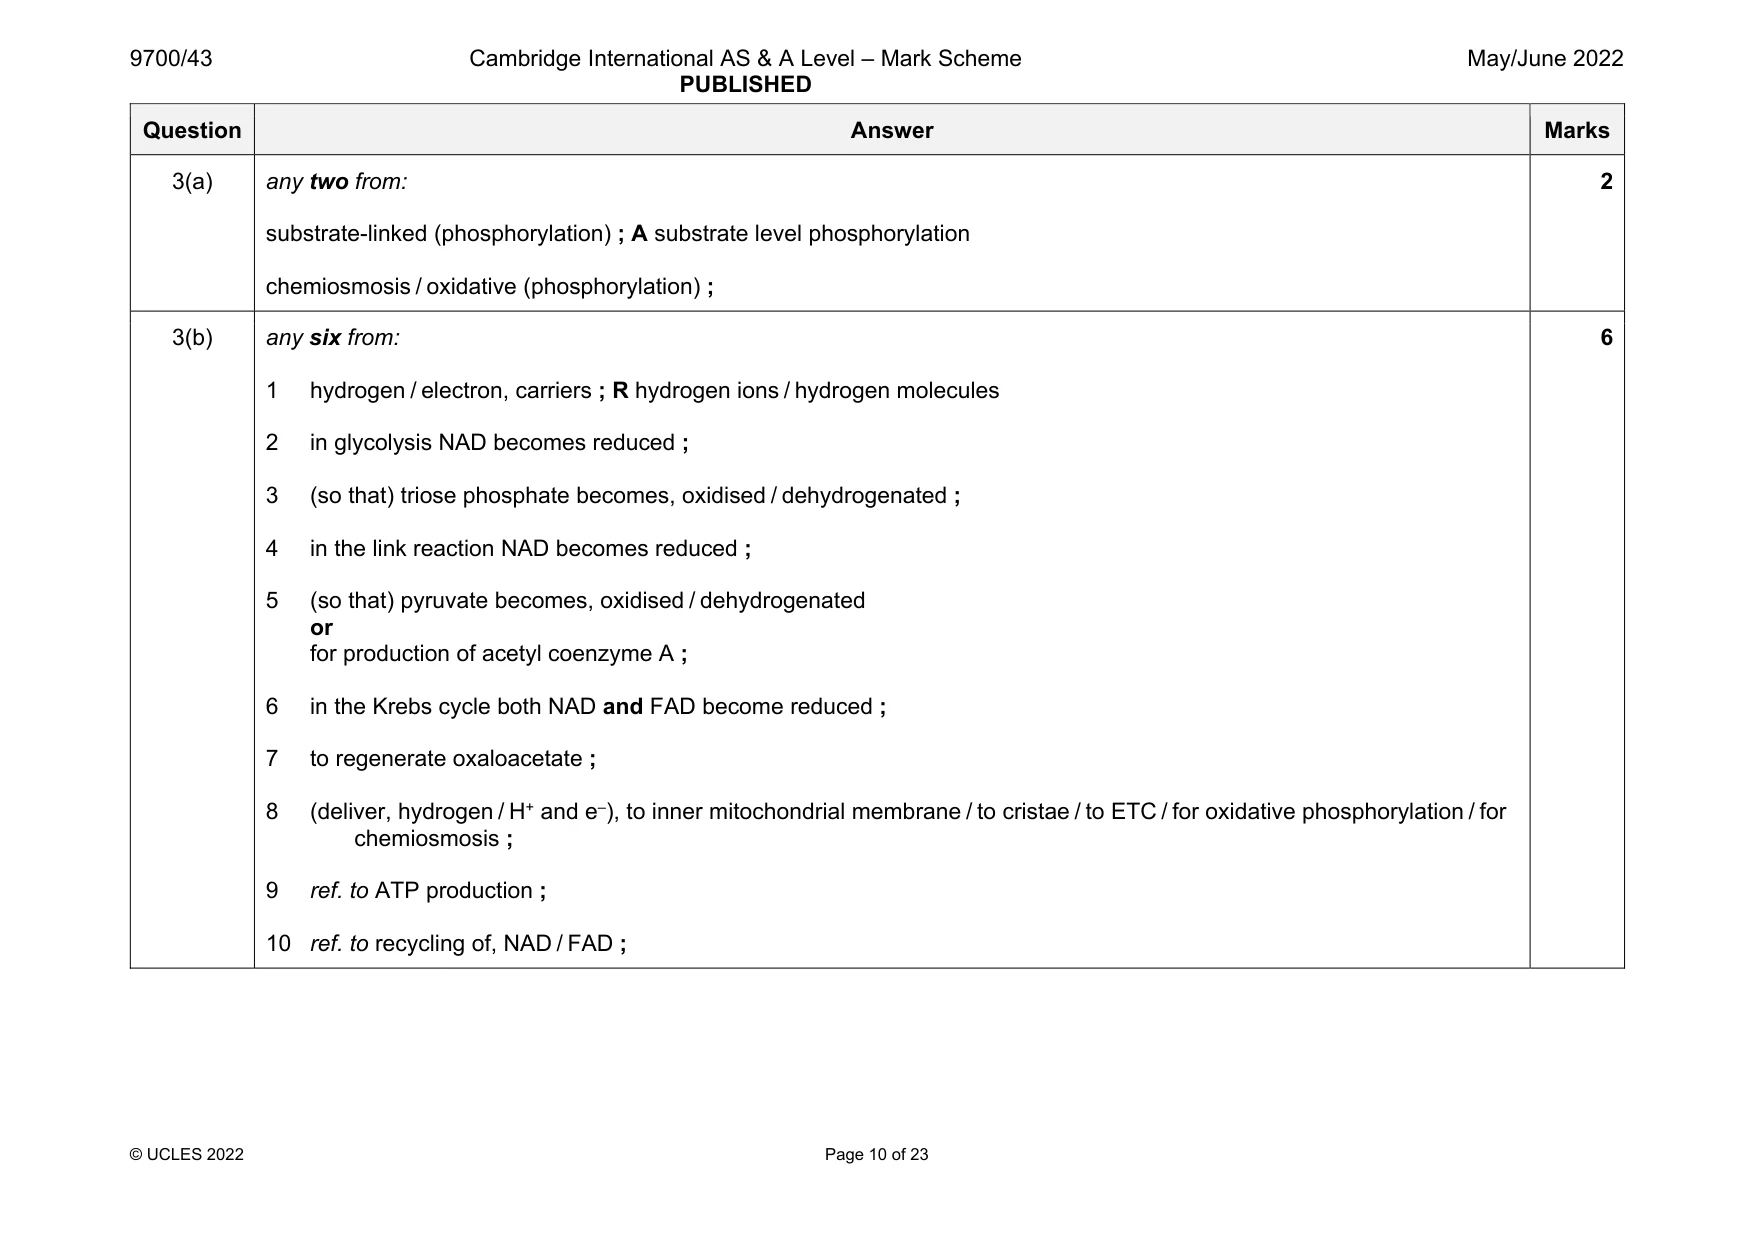
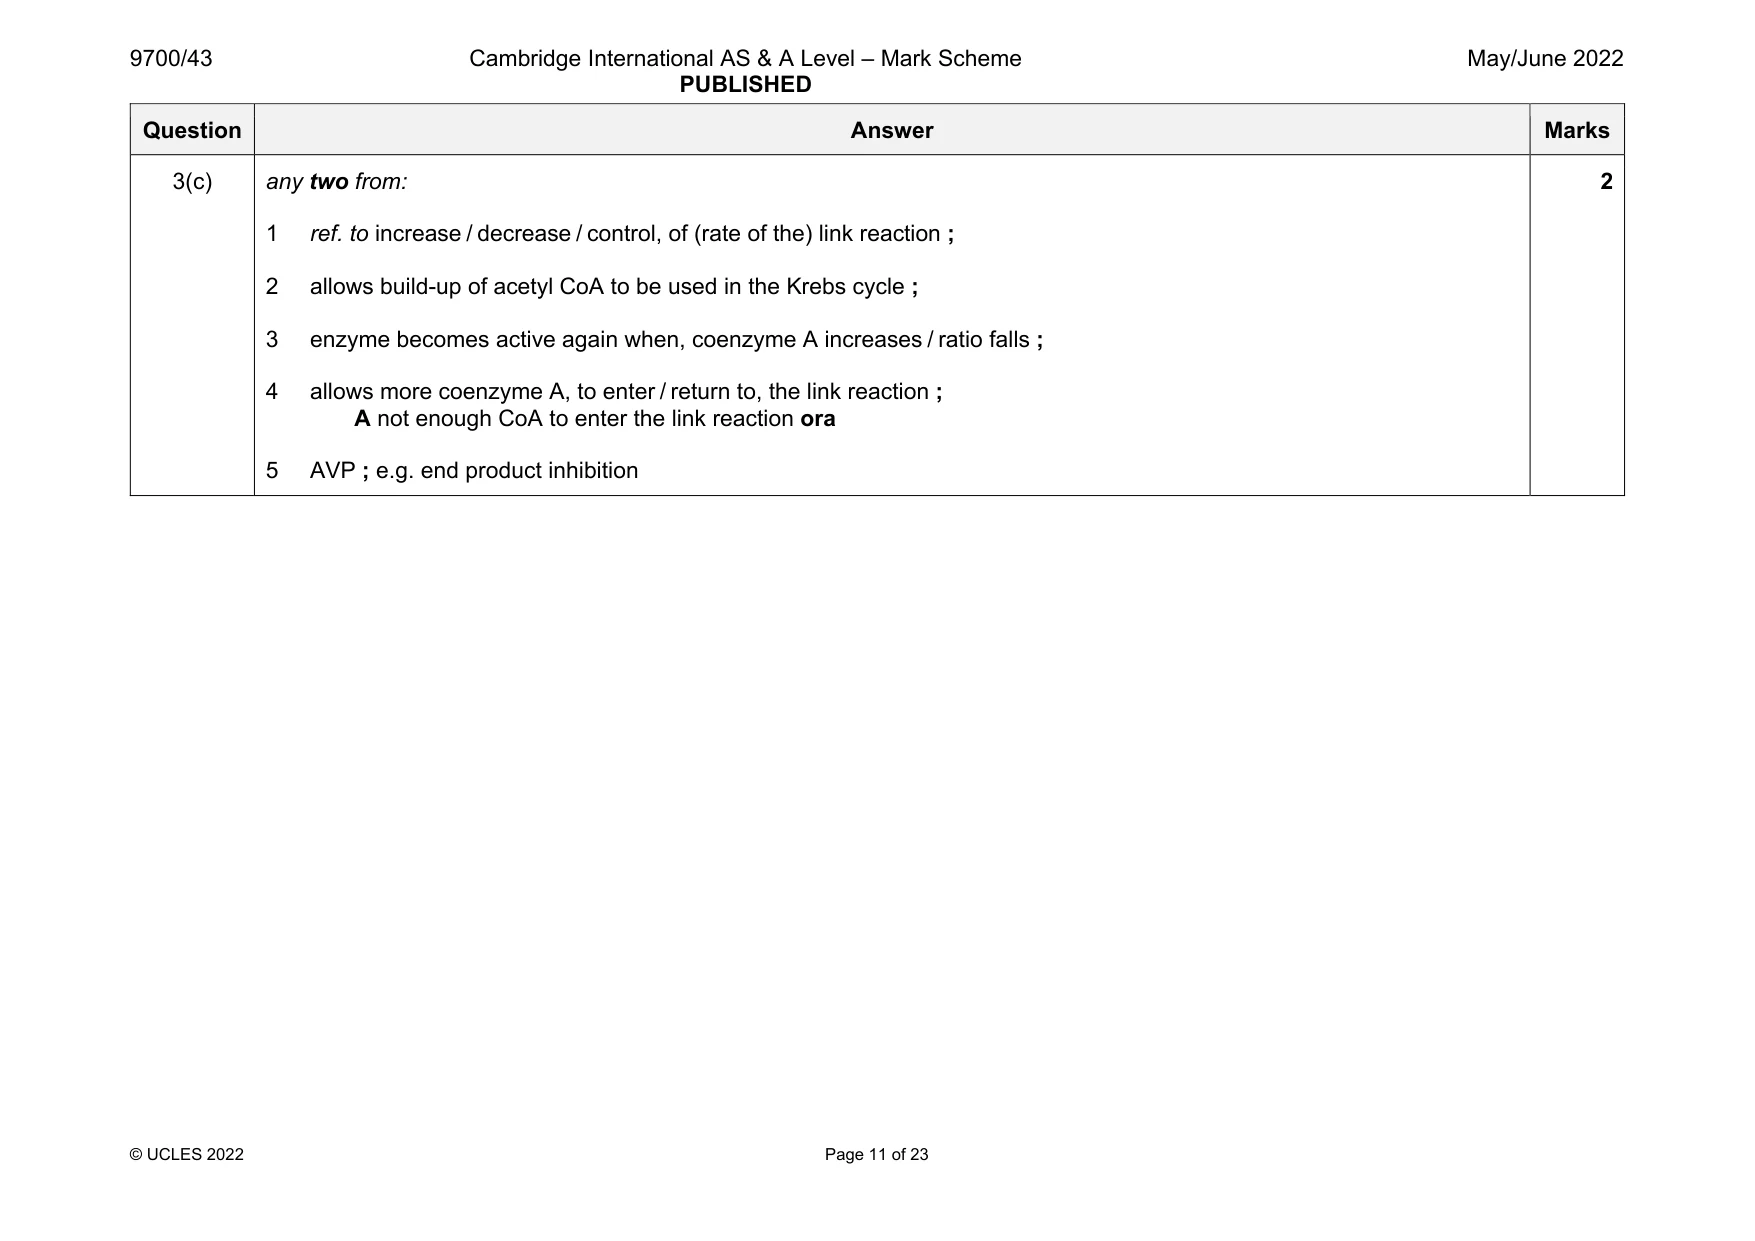
Mark scheme: 3(a) any two from: substrate-linked (phosphorylation) ; A substrate level phosphorylation chemiosmosis / oxidative (phosphorylation) ; 2 3(b) any six from: 1 hydrogen / electron, carriers ; R hydrogen ions / hydrogen molecules 2 in glycolysis NAD becomes reduced ; 3 (so that) triose phosphate becomes, oxidised / dehydrogenated ; 4 in the link reaction NAD becomes reduced ; 5 (so that) pyruvate becomes, oxidised / dehydrogenated or for production of acetyl coenzyme A ; 6 in the Krebs cycle both NAD and FAD become reduced ; 7 to regenerate oxaloacetate ; 8 (deliver, hydrogen / H+ and e–), to inner mitochondrial membrane / to cristae / to ETC / for oxidative phosphorylation / for chemiosmosis ; 9 ref. to ATP production ; 10 ref. to recycling of, NAD / FAD ; 6 Question Answer Marks 3(c) any two from: 1 ref. to increase / decrease / control, of (rate of the) link reaction ; 2 allows build-up of acetyl CoA to be used in the Krebs cycle ; 3 enzyme becomes active again when, coenzyme A increases / ratio falls ; 4 allows more coenzyme A, to enter / return to, the link reaction ; A not enough CoA to enter the link reaction ora 5 AVP ; e.g. end product inhibition 2
Q4 · In 1973, a technique for genetic engineering was used for the first time
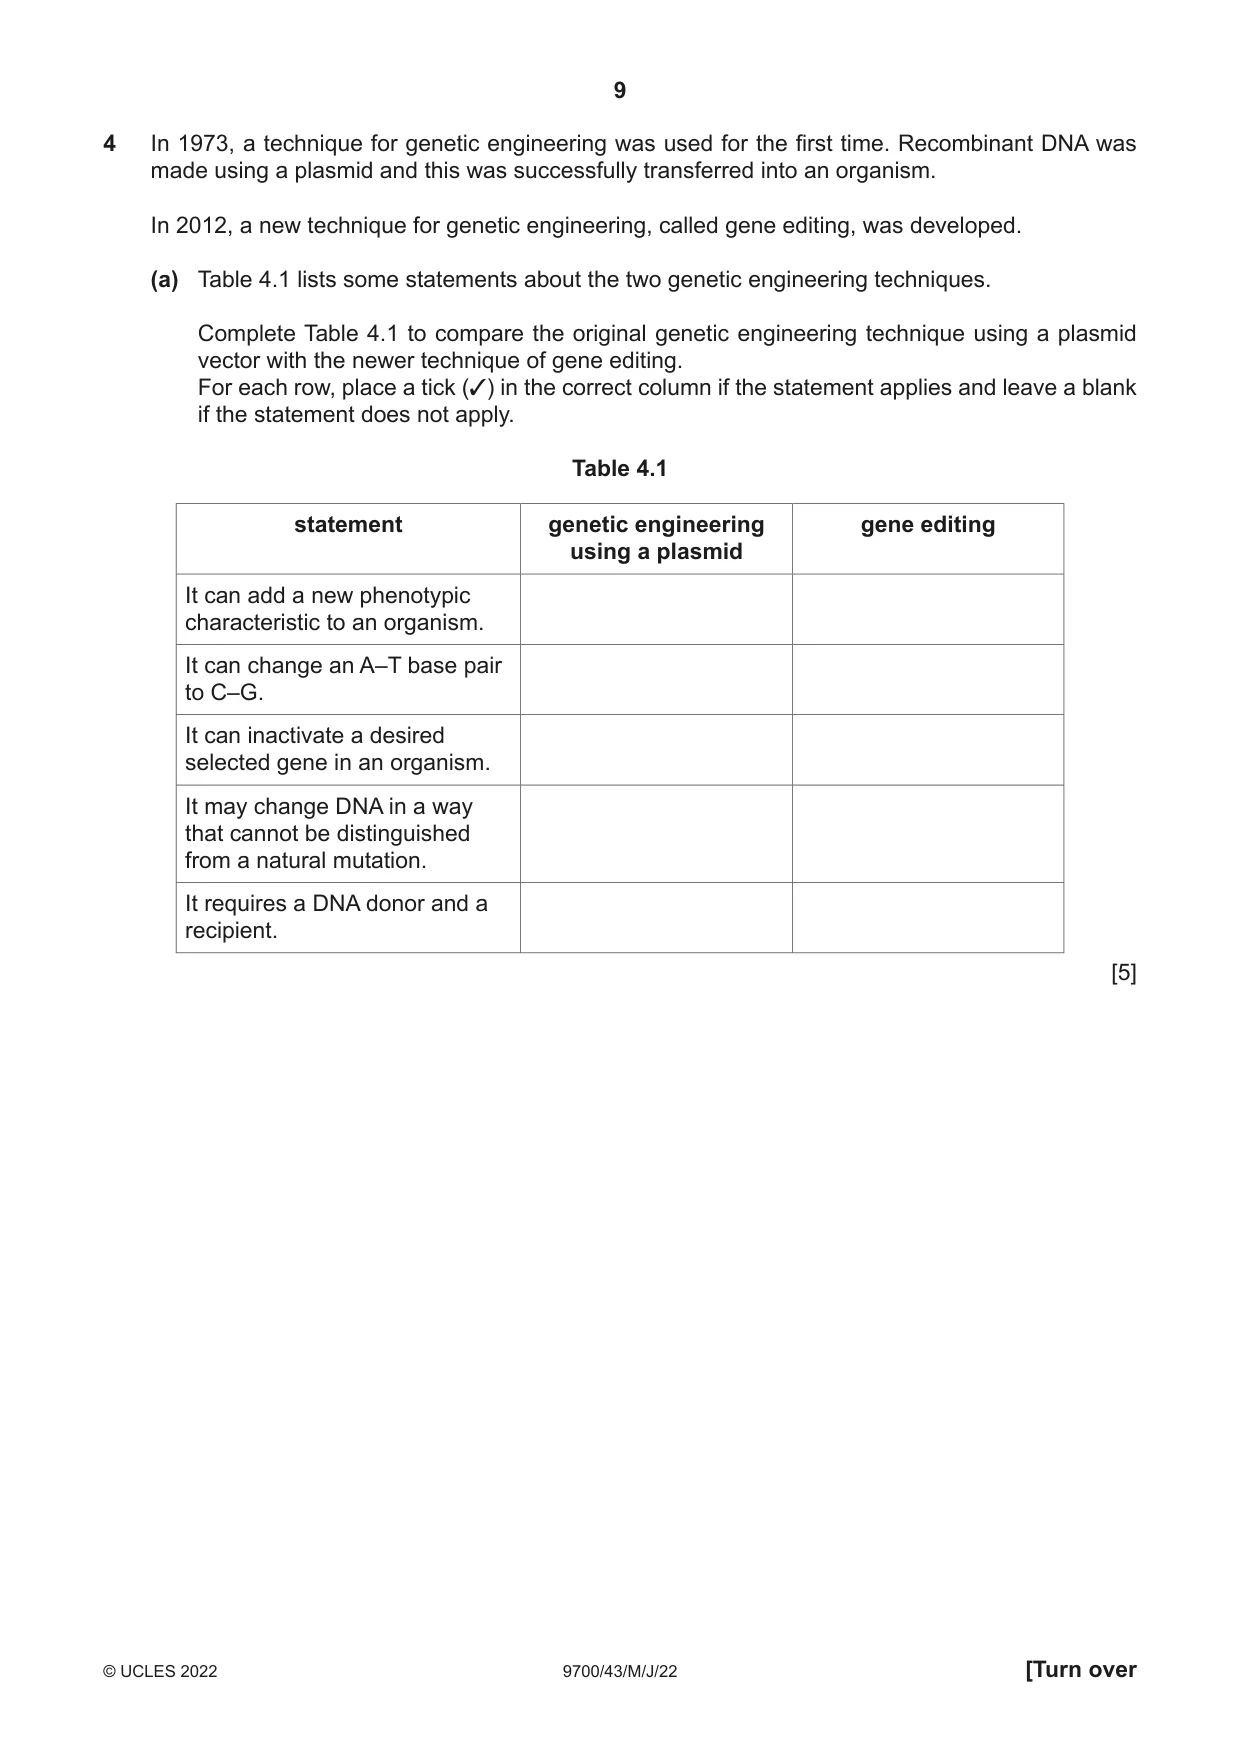
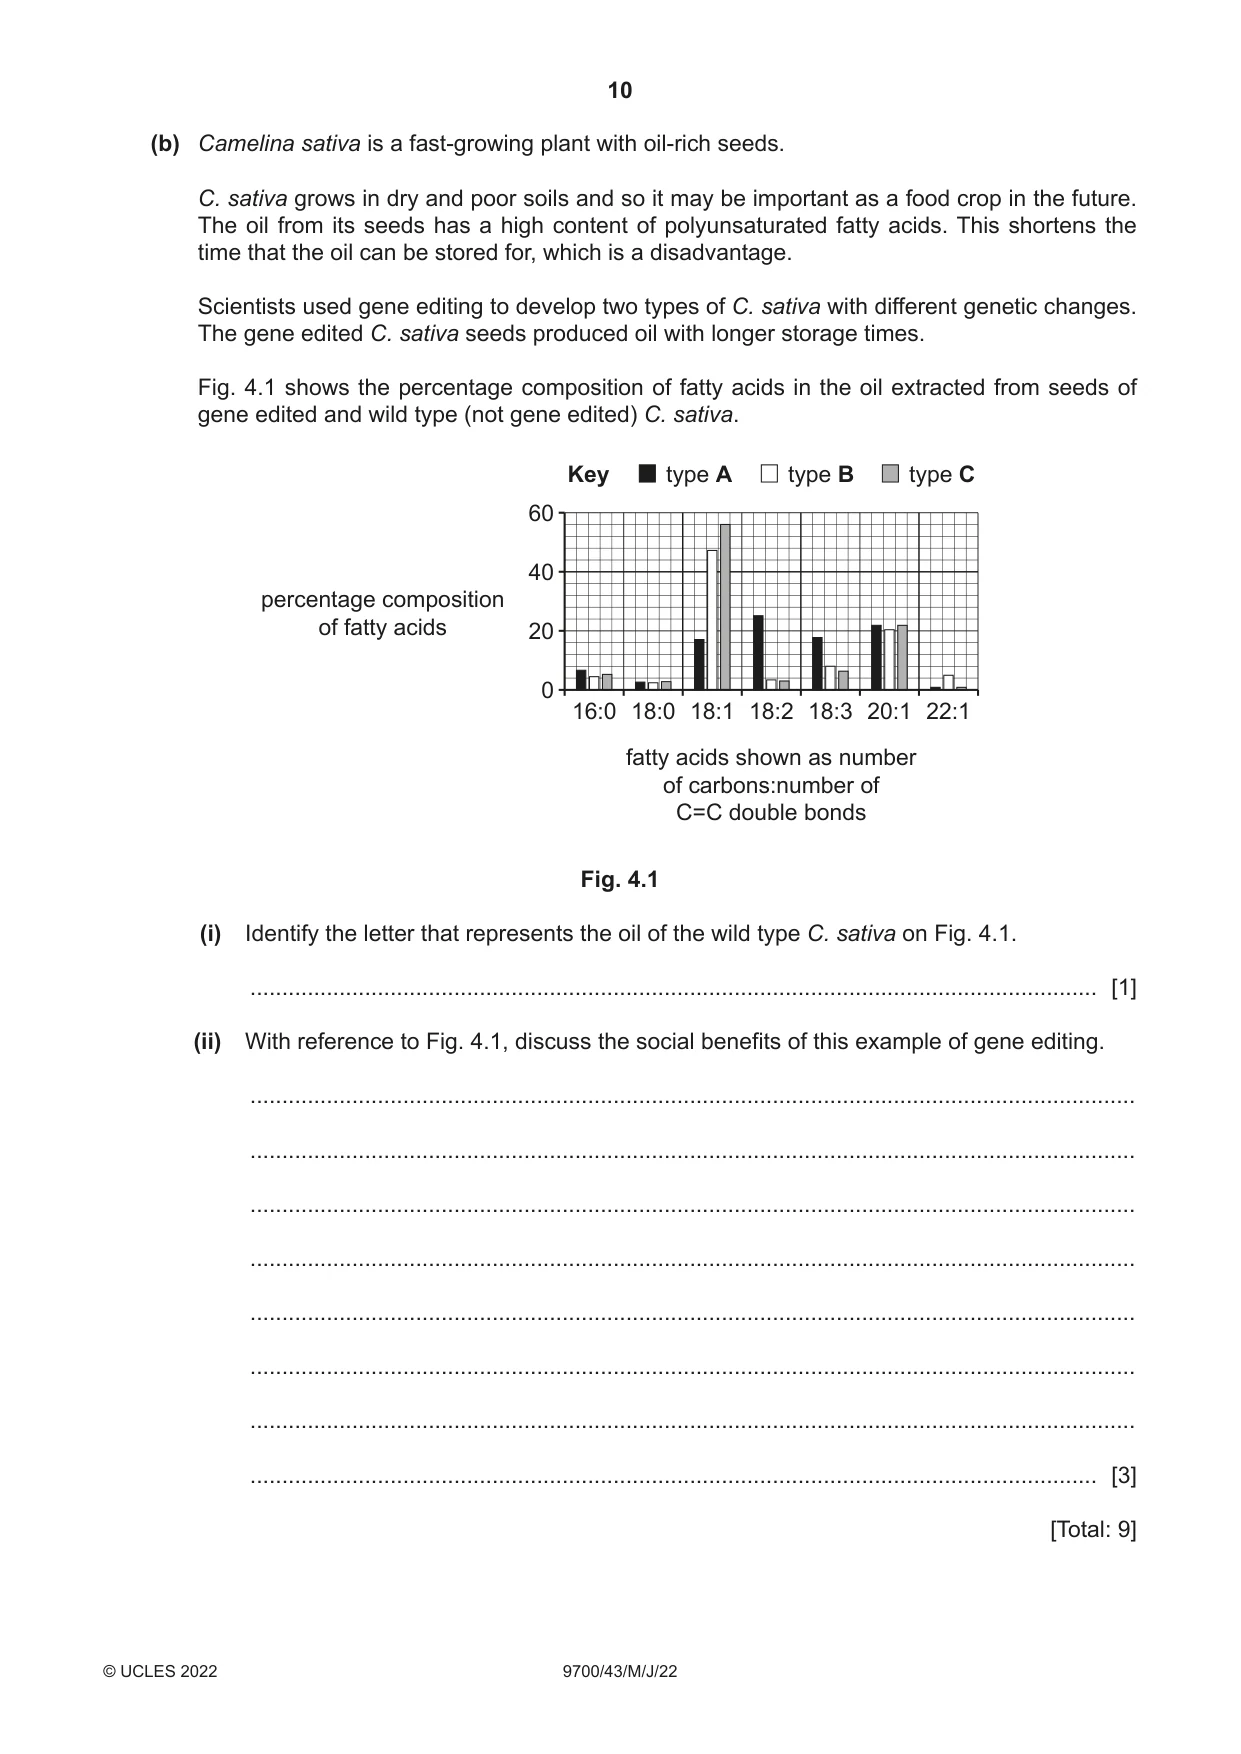
4 In 1973, a technique for genetic engineering was used for the first time. Recombinant DNA was made using a plasmid and this was successfully transferred into an organism. In 2012, a new technique for genetic engineering, called gene editing, was developed. (a) Table 4.1 lists some statements about the two genetic engineering techniques. Complete Table 4.1 to compare the original genetic engineering technique using a plasmid vector with the newer technique of gene editing. For each row, place a tick (3) in the correct column if the statement applies and leave a blank if the statement does not apply. Table 4.1 statement genetic engineering gene editing using a plasmid It can add a new phenotypic characteristic to an organism. It can change an A–T base pair to C–G. It can inactivate a desired selected gene in an organism. It may change DNA in a way that cannot be distinguished from a natural mutation. It requires a DNA donor and a recipient. [5] (b) Camelina sativa is a fast-growing plant with oil-rich seeds. C. sativa grows in dry and poor soils and so it may be important as a food crop in the future. The oil from its seeds has a high content of polyunsaturated fatty acids. This shortens the time that the oil can be stored for, which is a disadvantage. Scientists used gene editing to develop two types of C. sativa with different genetic changes. The gene edited C. sativa seeds produced oil with longer storage times. Fig. 4.1 shows the percentage composition of fatty acids in the oil extracted from seeds of gene edited and wild type (not gene edited) C. sativa. Key type A type B type C 60 40 percentage composition of fatty acids 20 0 16:0 18:0 18:1 18:2 18:3 20:1 22:1 fatty acids shown as number of carbons:number of C=C double bonds Fig. 4.1 (i) Identify the letter that represents the oil of the wild type C. sativa on Fig. 4.1. ..................................................................................................................................... [1] (ii) With reference to Fig. 4.1, discuss the social benefits of this example of gene editing. ........................................................................................................................................... ........................................................................................................................................... ........................................................................................................................................... ........................................................................................................................................... ........................................................................................................................................... ........................................................................................................................................... ........................................................................................................................................... ..................................................................................................................................... [3] [Total: 9]
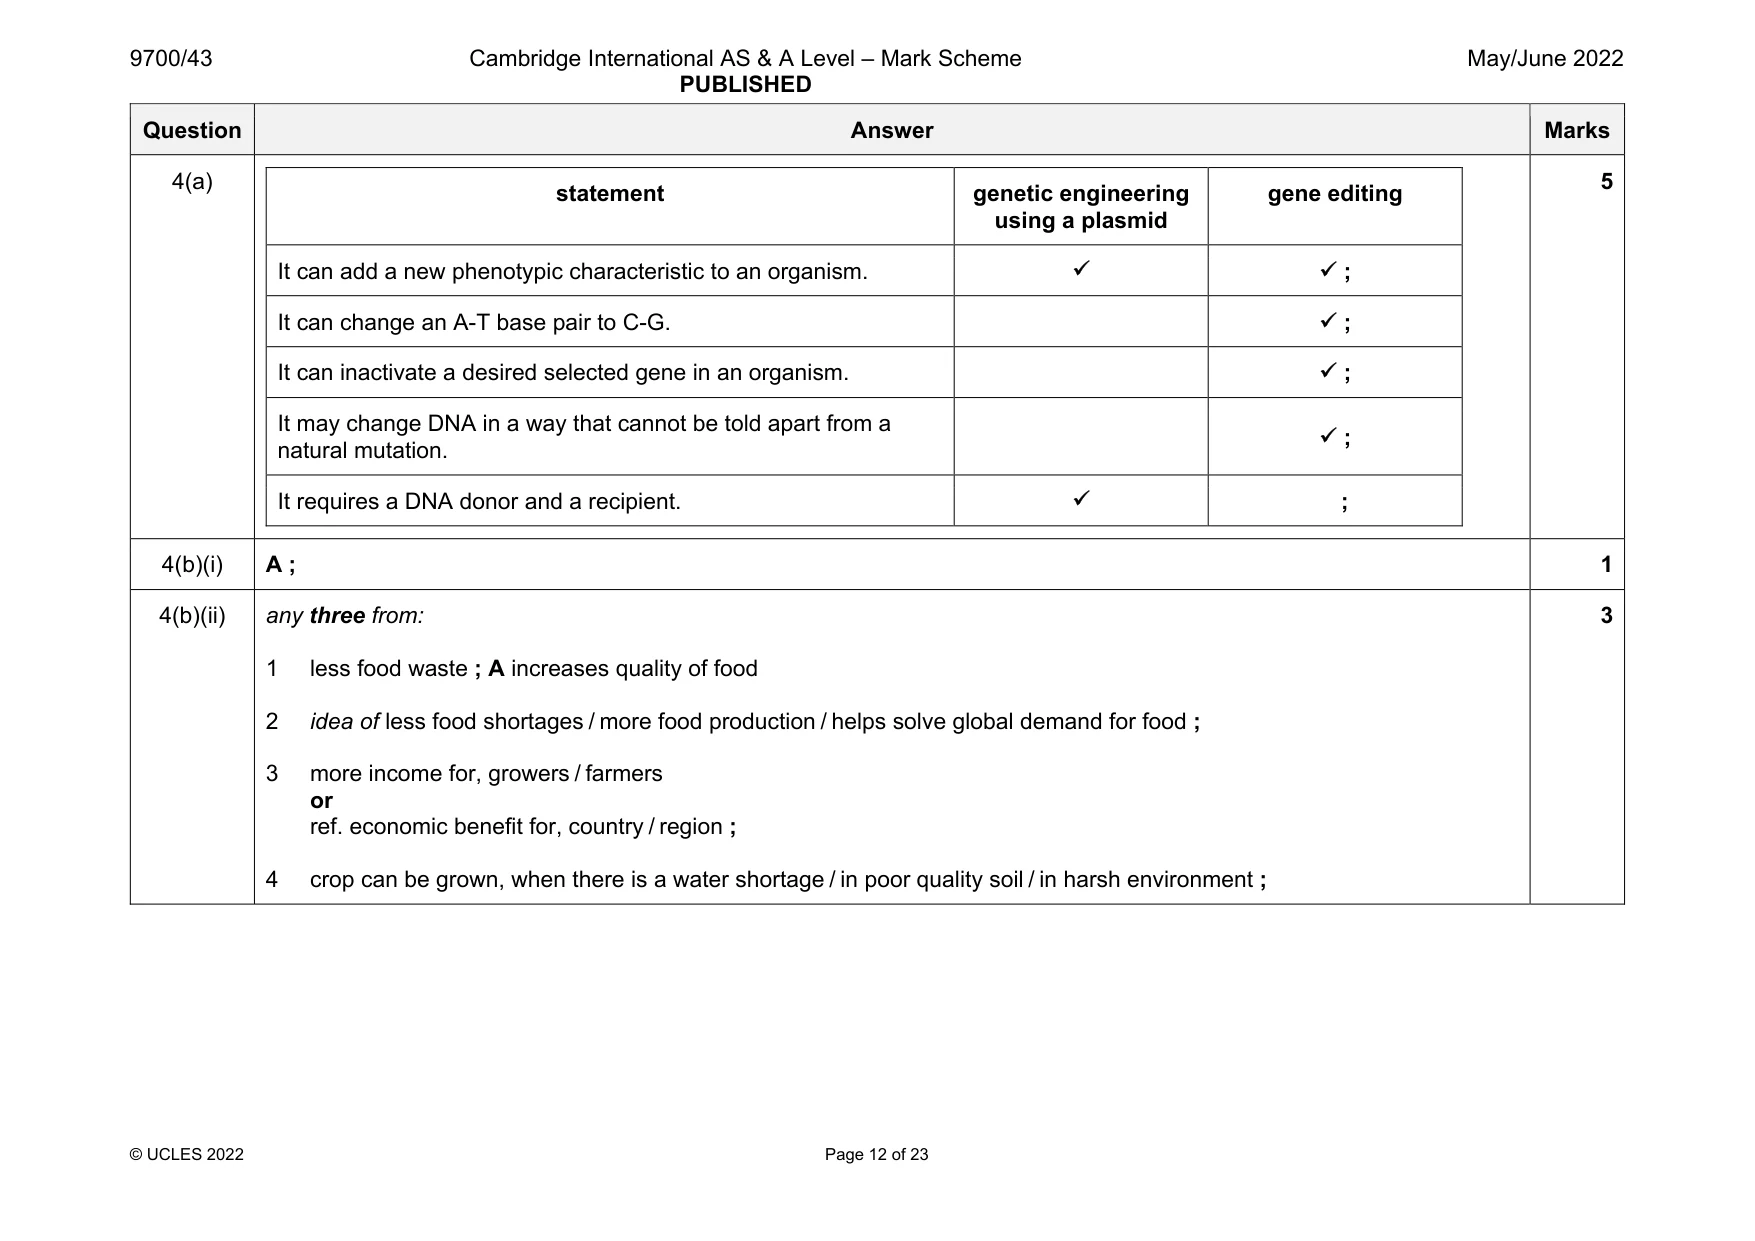
Mark scheme: 4(a) statement genetic engineering using a plasmid gene editing It can add a new phenotypic characteristic to an organism. ; It can change an A-T base pair to C-G. ; It can inactivate a desired selected gene in an organism. ; It may change DNA in a way that cannot be told apart from a natural mutation. ; It requires a DNA donor and a recipient. ; 5 4(b)(i) A ; 1 4(b)(ii) any three from: 1 less food waste ; A increases quality of food 2 idea of less food shortages / more food production / helps solve global demand for food ; 3 more income for, growers / farmers or ref. economic benefit for, country / region ; 4 crop can be grown, when there is a water shortage / in poor quality soil / in harsh environment ; 3
Q5 · The puma, Puma concolor, lives in North and South America
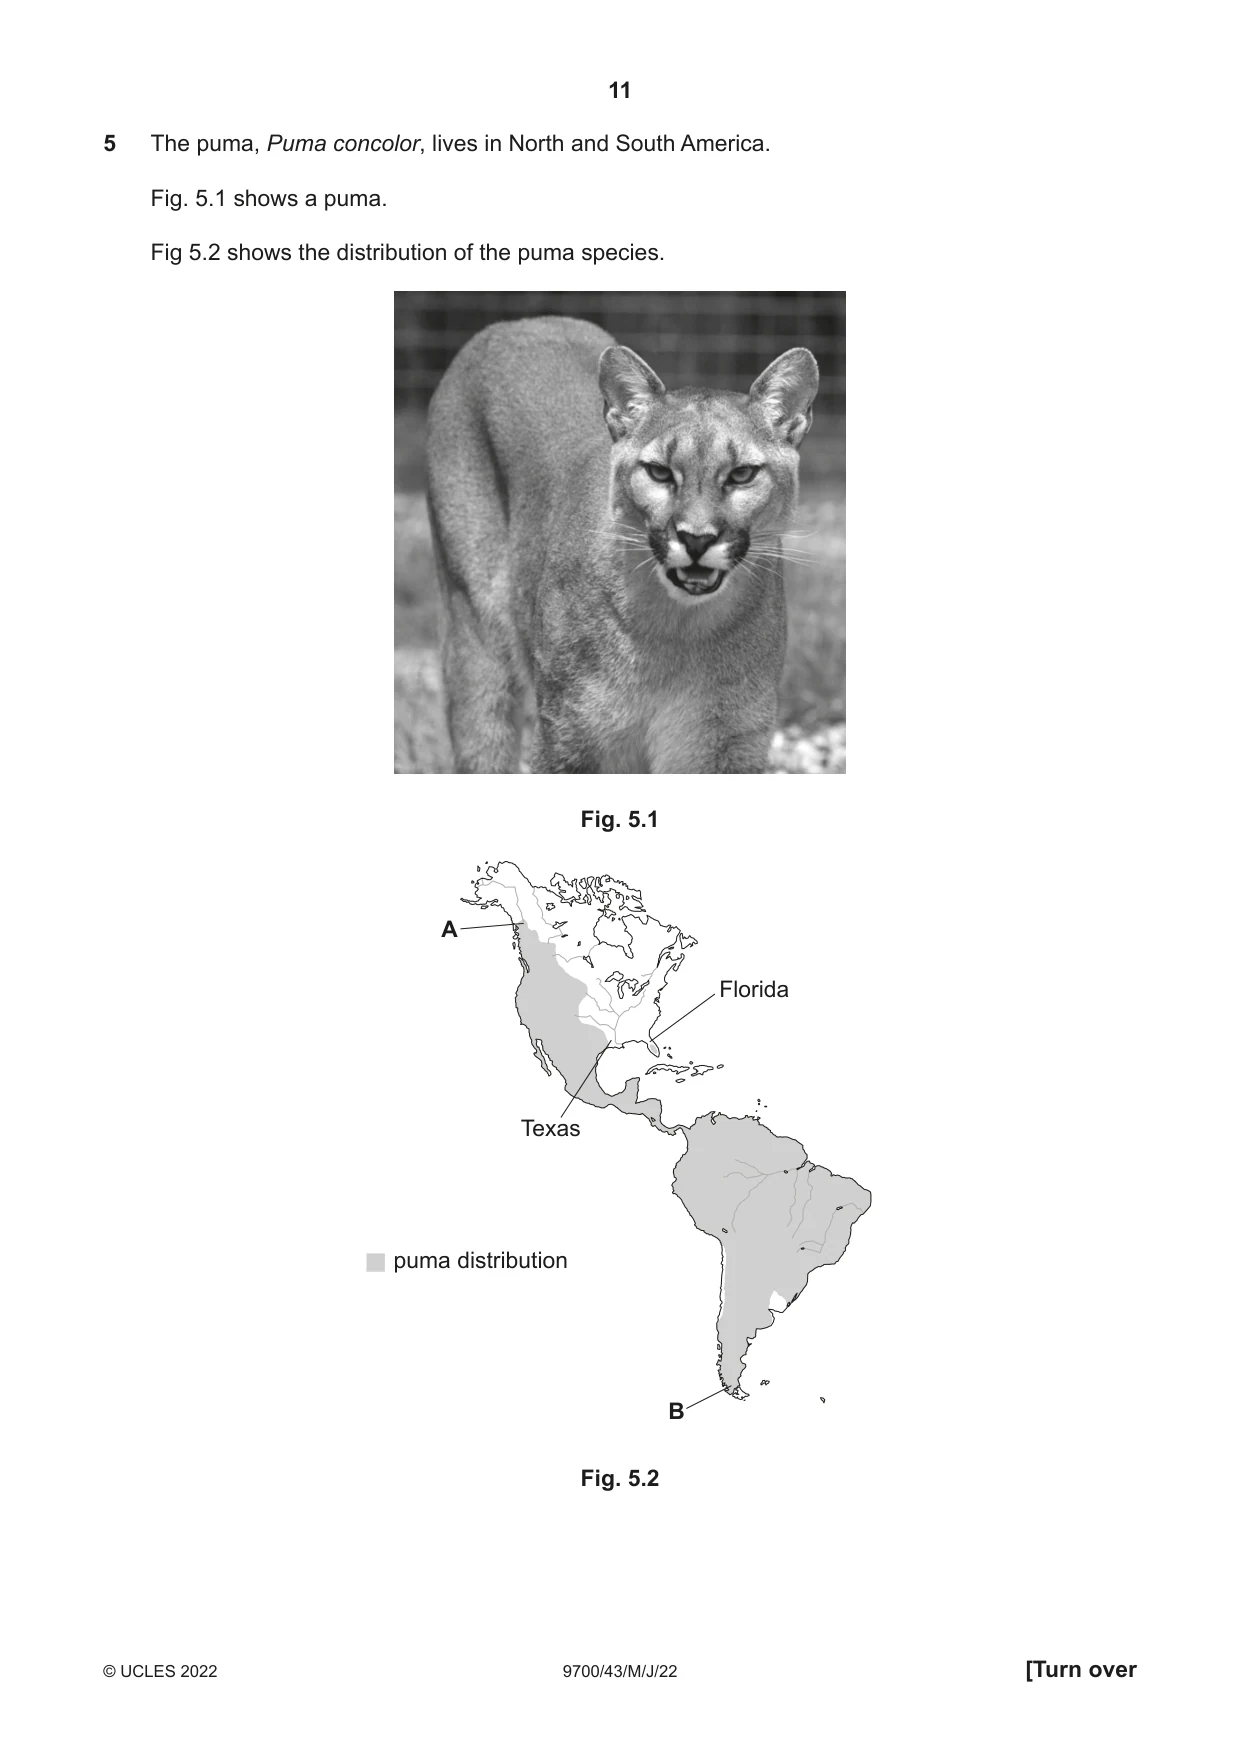
5 The puma, Puma concolor, lives in North and South America. Fig. 5.1 shows a puma. Fig 5.2 shows the distribution of the puma species. Fig. 5.1 A Florida Texas puma distribution B Fig. 5.2 (a) Members of different subspecies belong to the same species but have some morphological differences and are found in different geographical locations. In the past the puma has been divided into 32 subspecies. The subspecies of puma varied in body size, coat colour and behaviour to adapt each population to its environment. Explain how the different subspecies of puma evolved. ................................................................................................................................................... ................................................................................................................................................... ................................................................................................................................................... ................................................................................................................................................... ................................................................................................................................................... ................................................................................................................................................... ................................................................................................................................................... ................................................................................................................................................... ................................................................................................................................................... ............................................................................................................................................. [4] In 2016, genetic analysis concluded that there are only two genetically distinct subspecies of puma, one in North and Central America and one in South America. (b) Outline how practical techniques could be used to conduct a genetic analysis of the puma species. ................................................................................................................................................... ................................................................................................................................................... ................................................................................................................................................... ................................................................................................................................................... ................................................................................................................................................... ................................................................................................................................................... ................................................................................................................................................... ................................................................................................................................................... ............................................................................................................................................. [3] (c) Fig. 5.2 shows the location of an isolated puma population in Florida. In 1990, the size of this population was very small, with fewer than 30 individuals. Three phenotypic features that vary in pumas are the shape of the tail, the pattern of hair growth on the back and the position of the testes in male pumas. Variant forms of these phenotypic features that are normally rare occur at a high frequency in the small Florida population. These variant forms are: • bent tail • abnormal pattern of hair growth on the back • testes remain in abdomen (undescended) in some male pumas. (i) Predict, with reasons, whether these phenotypic features show a continuous or a discontinuous pattern of variation. ........................................................................................................................................... ........................................................................................................................................... ........................................................................................................................................... ........................................................................................................................................... ........................................................................................................................................... ..................................................................................................................................... [2] (ii) Explain how the small size of the Florida population resulted in a high frequency of these normally rare variant forms. ........................................................................................................................................... ........................................................................................................................................... ........................................................................................................................................... ........................................................................................................................................... ........................................................................................................................................... ........................................................................................................................................... ..................................................................................................................................... [3] (iii) In 1995, eight puma females from Texas were introduced to Florida to increase the breeding success and future size of the puma population in Florida. In the next 20 years the population grew substantially. Suggest why the introduced females were taken from Texas and not from points A or B on Fig. 5.2. ........................................................................................................................................... ........................................................................................................................................... ........................................................................................................................................... ........................................................................................................................................... ..................................................................................................................................... [2] [Total: 14]
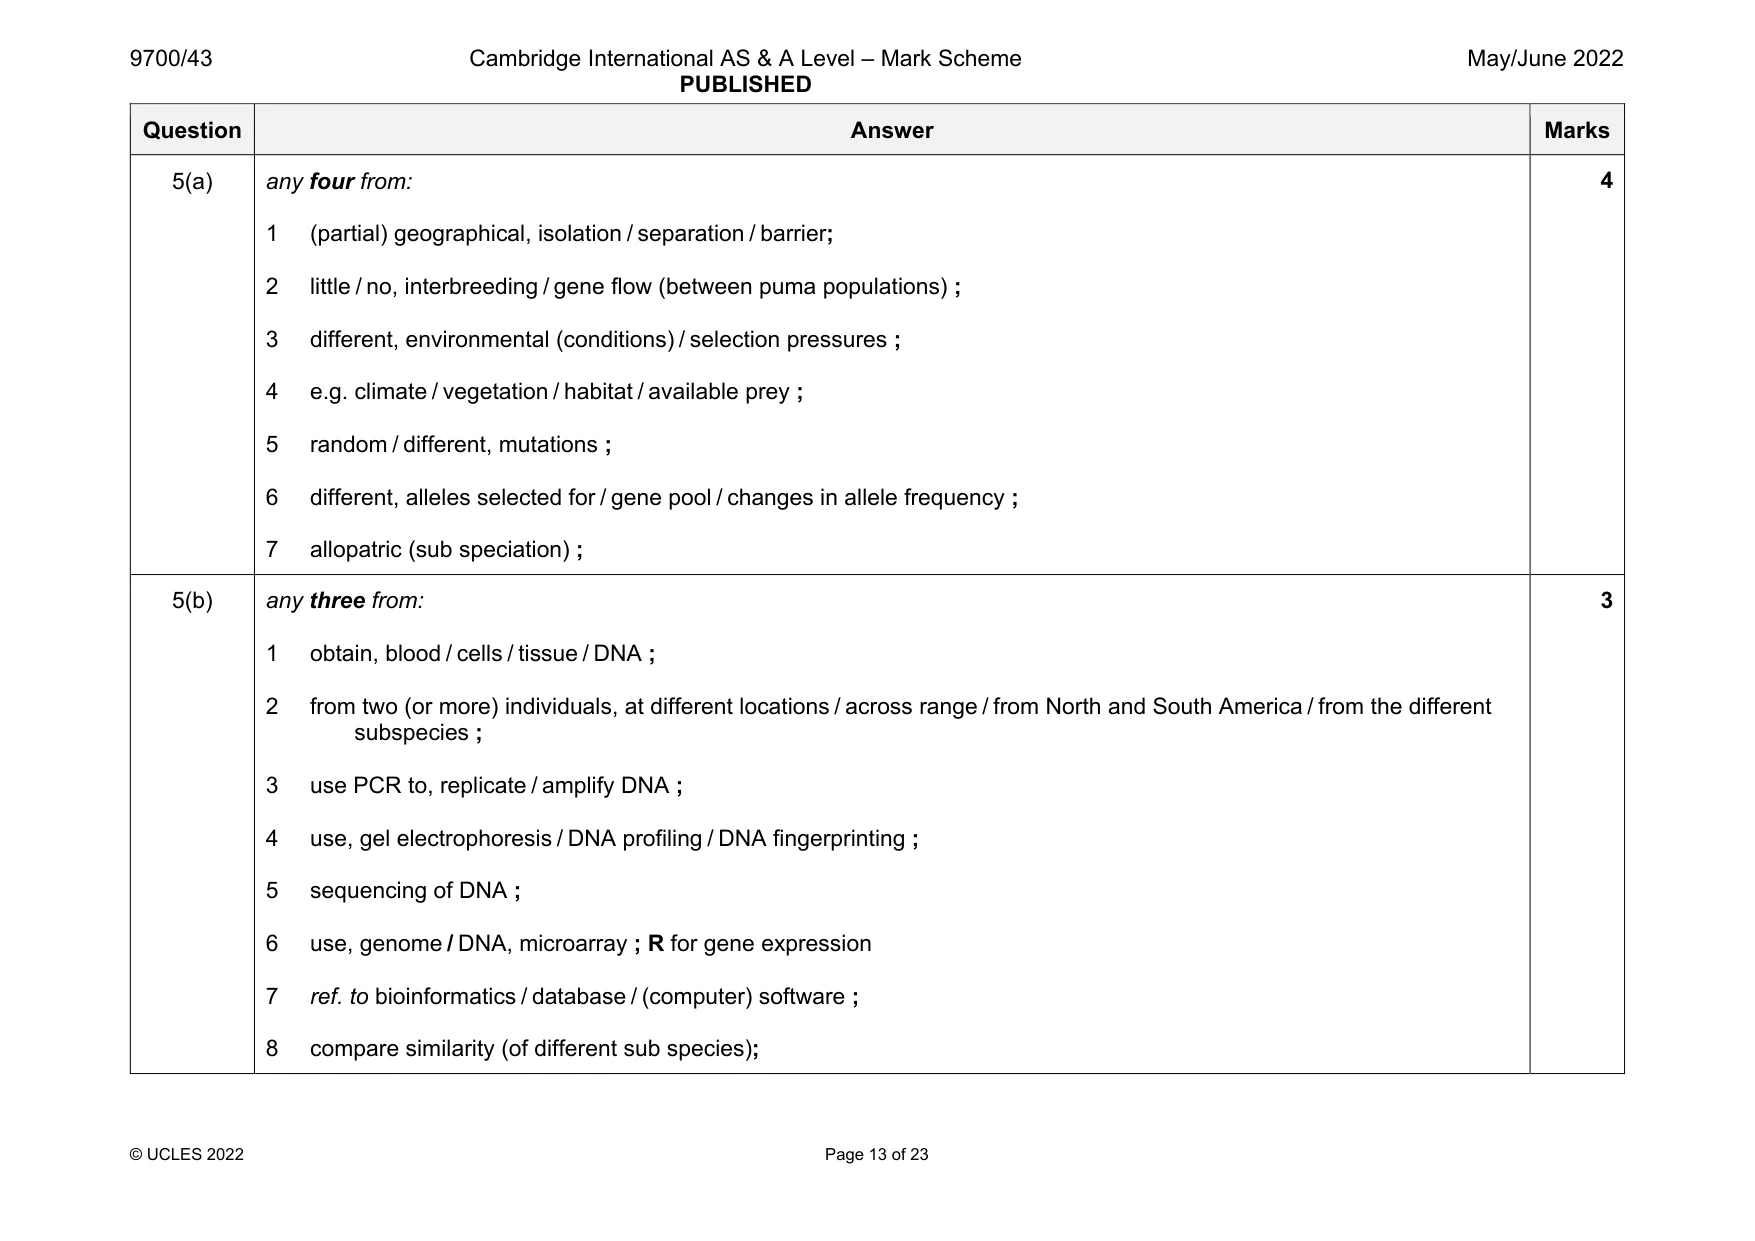
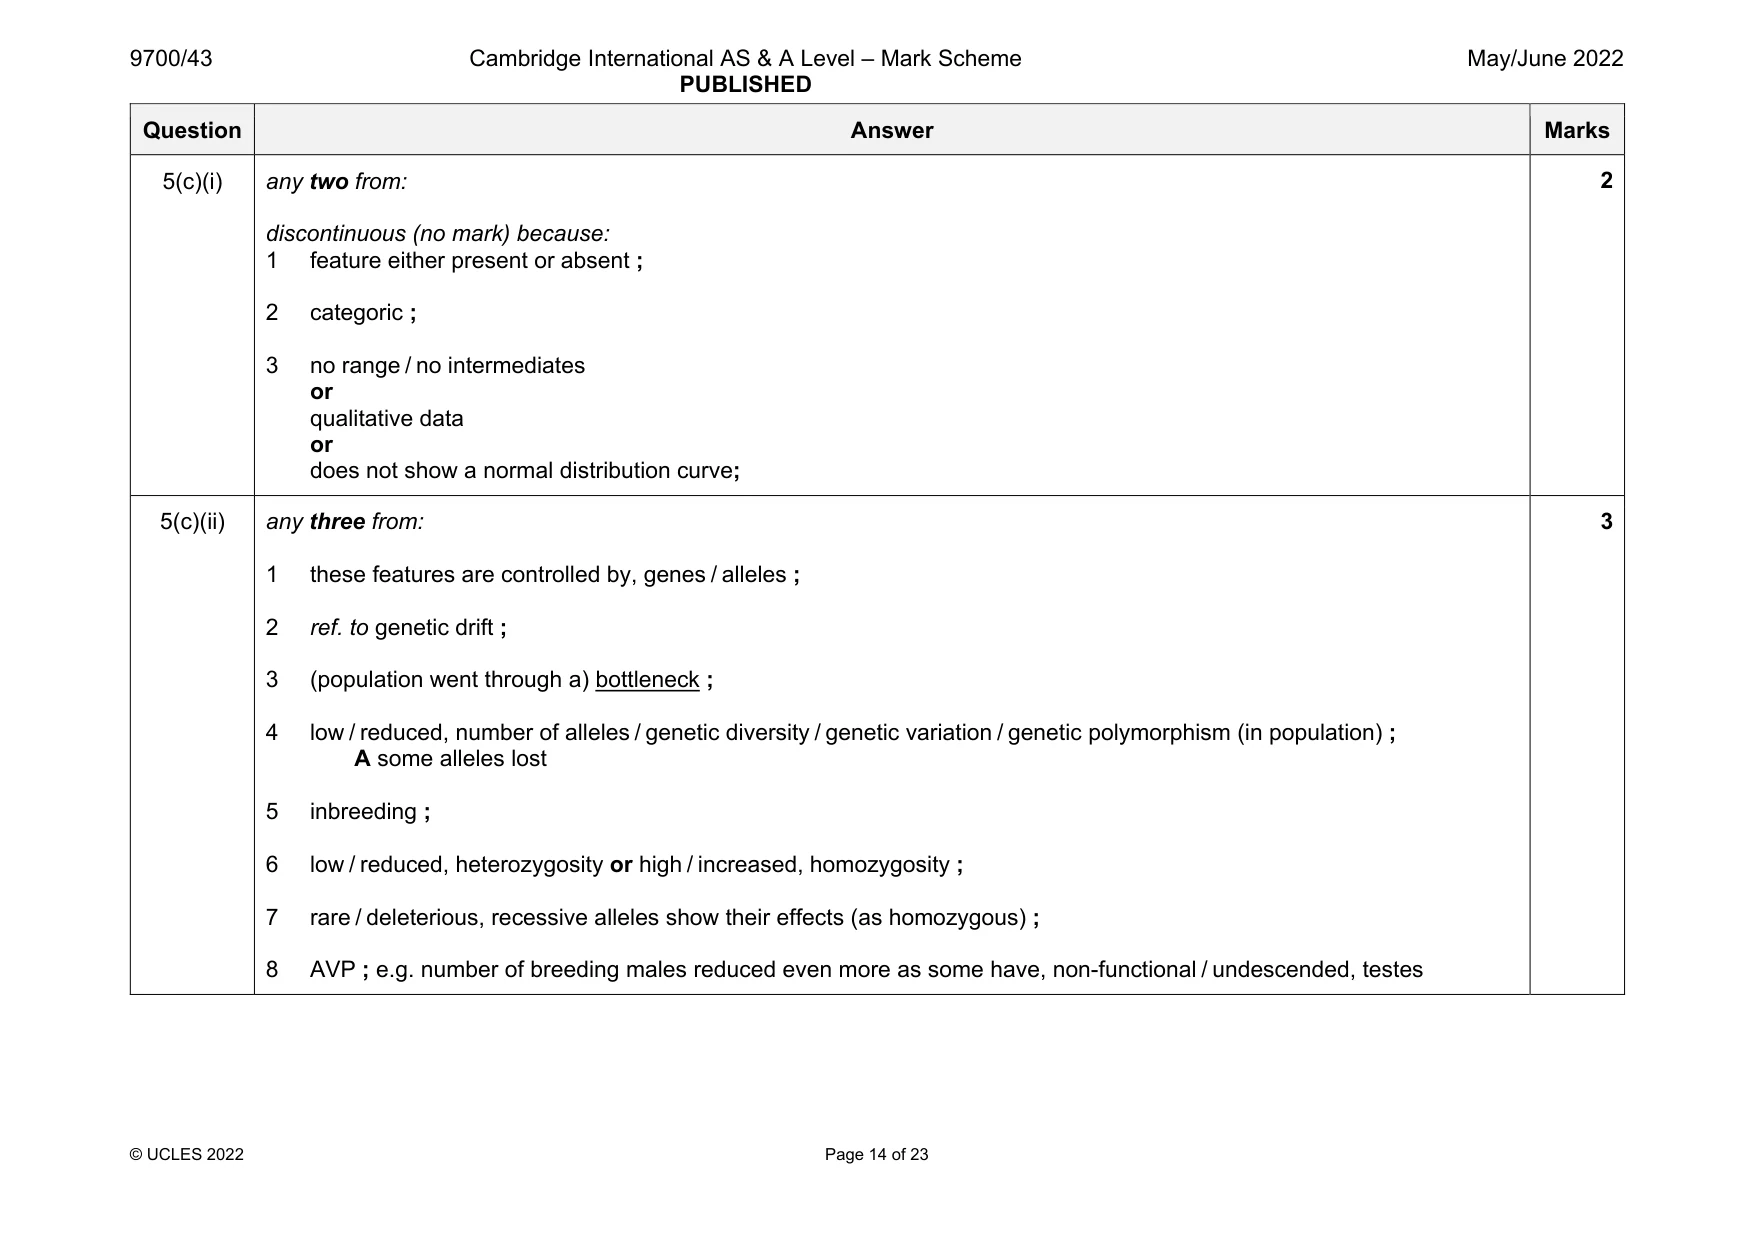
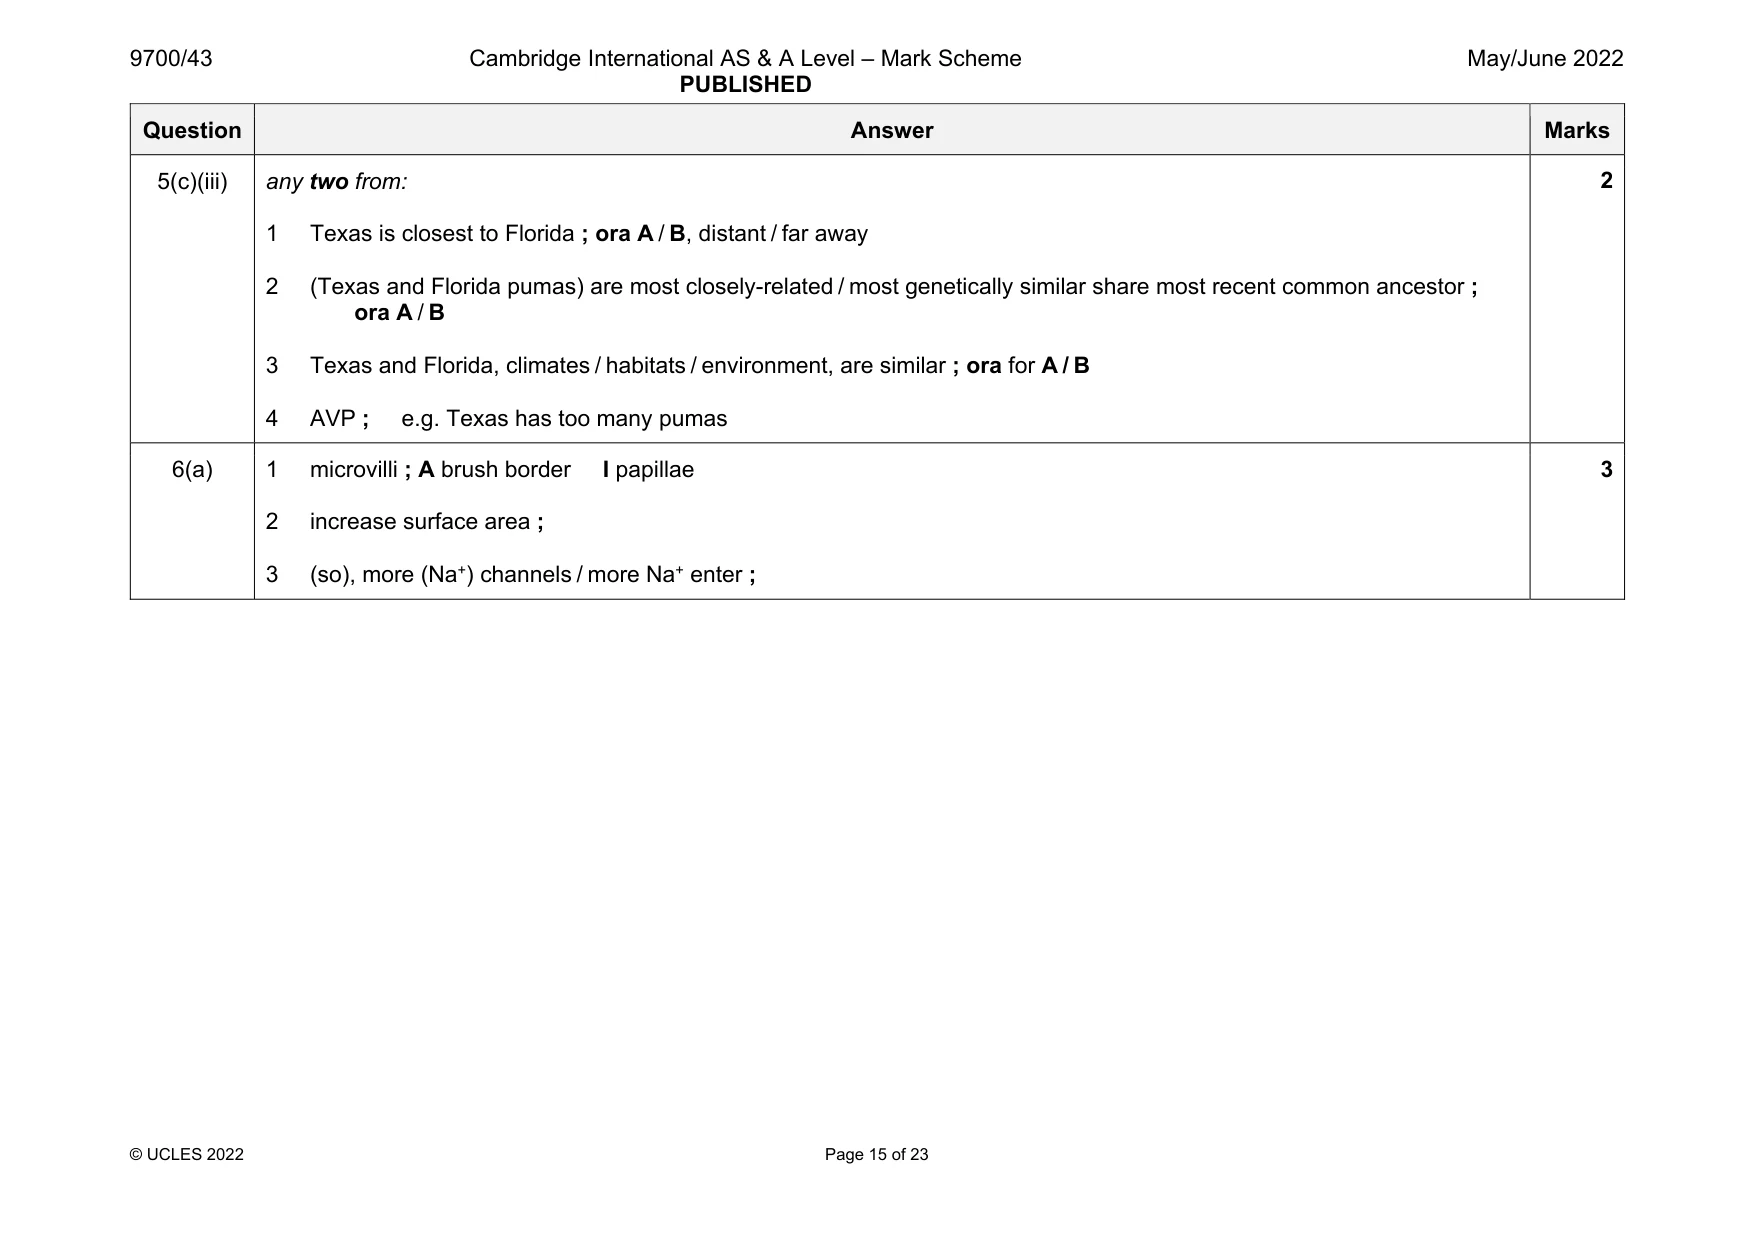
Mark scheme: 5(a) any four from: 1 (partial) geographical, isolation / separation / barrier; 2 little / no, interbreeding / gene flow (between puma populations) ; 3 different, environmental (conditions) / selection pressures ; 4 e.g. climate / vegetation / habitat / available prey ; 5 random / different, mutations ; 6 different, alleles selected for / gene pool / changes in allele frequency ; 7 allopatric (sub speciation) ; 5(b) any three from: 1 obtain, blood / cells / tissue / DNA ; 2 from two (or more) individuals, at different locations / across range / from North and South America / from the different subspecies ; 3 use PCR to, replicate / amplify DNA ; 4 use, gel electrophoresis / DNA profiling / DNA fingerprinting ; 5 sequencing of DNA ; 6 use, genome / DNA, microarray ; R for gene expression 7 ref. to bioinformatics / database / (computer) software ; 8 compare similarity (of different sub species); 3 Question Answer Marks 5(c)(i) any two from: discontinuous (no mark) because: 1 feature either present or absent ; 2 categoric ; 3 no range / no intermediates or qualitative data or does not show a normal distribution curve; 2 5(c)(ii) any three from: 1 these features are controlled by, genes / alleles ; 2 ref. to genetic drift ; 3 (population went through a) bottleneck ; 4 low / reduced, number of alleles / genetic diversity / genetic variation / genetic polymorphism (in population) ; A some alleles lost 5 inbreeding ; 6 low / reduced, heterozygosity or high / increased, homozygosity ; 7 rare / deleterious, recessive alleles show their effects (as homozygous) ; 8 AVP ; e.g. number of breeding males reduced even more as some have, non-functional / undescended, testes 3 Question Answer Marks 5(c)(iii) any two from: 1 Texas is closest to Florida ; ora A / B, distant / far away 2 (Texas and Florida pumas) are most closely-related / most genetically similar share most recent common ancestor ; ora A / B 3 Texas and Florida, climates / habitats / environment, are similar ; ora for A / B 4 AVP ; e.g. Texas has too many pumas 2
Q6 · The role of sensory receptor cells in mammals is to detect stimuli and generate action…
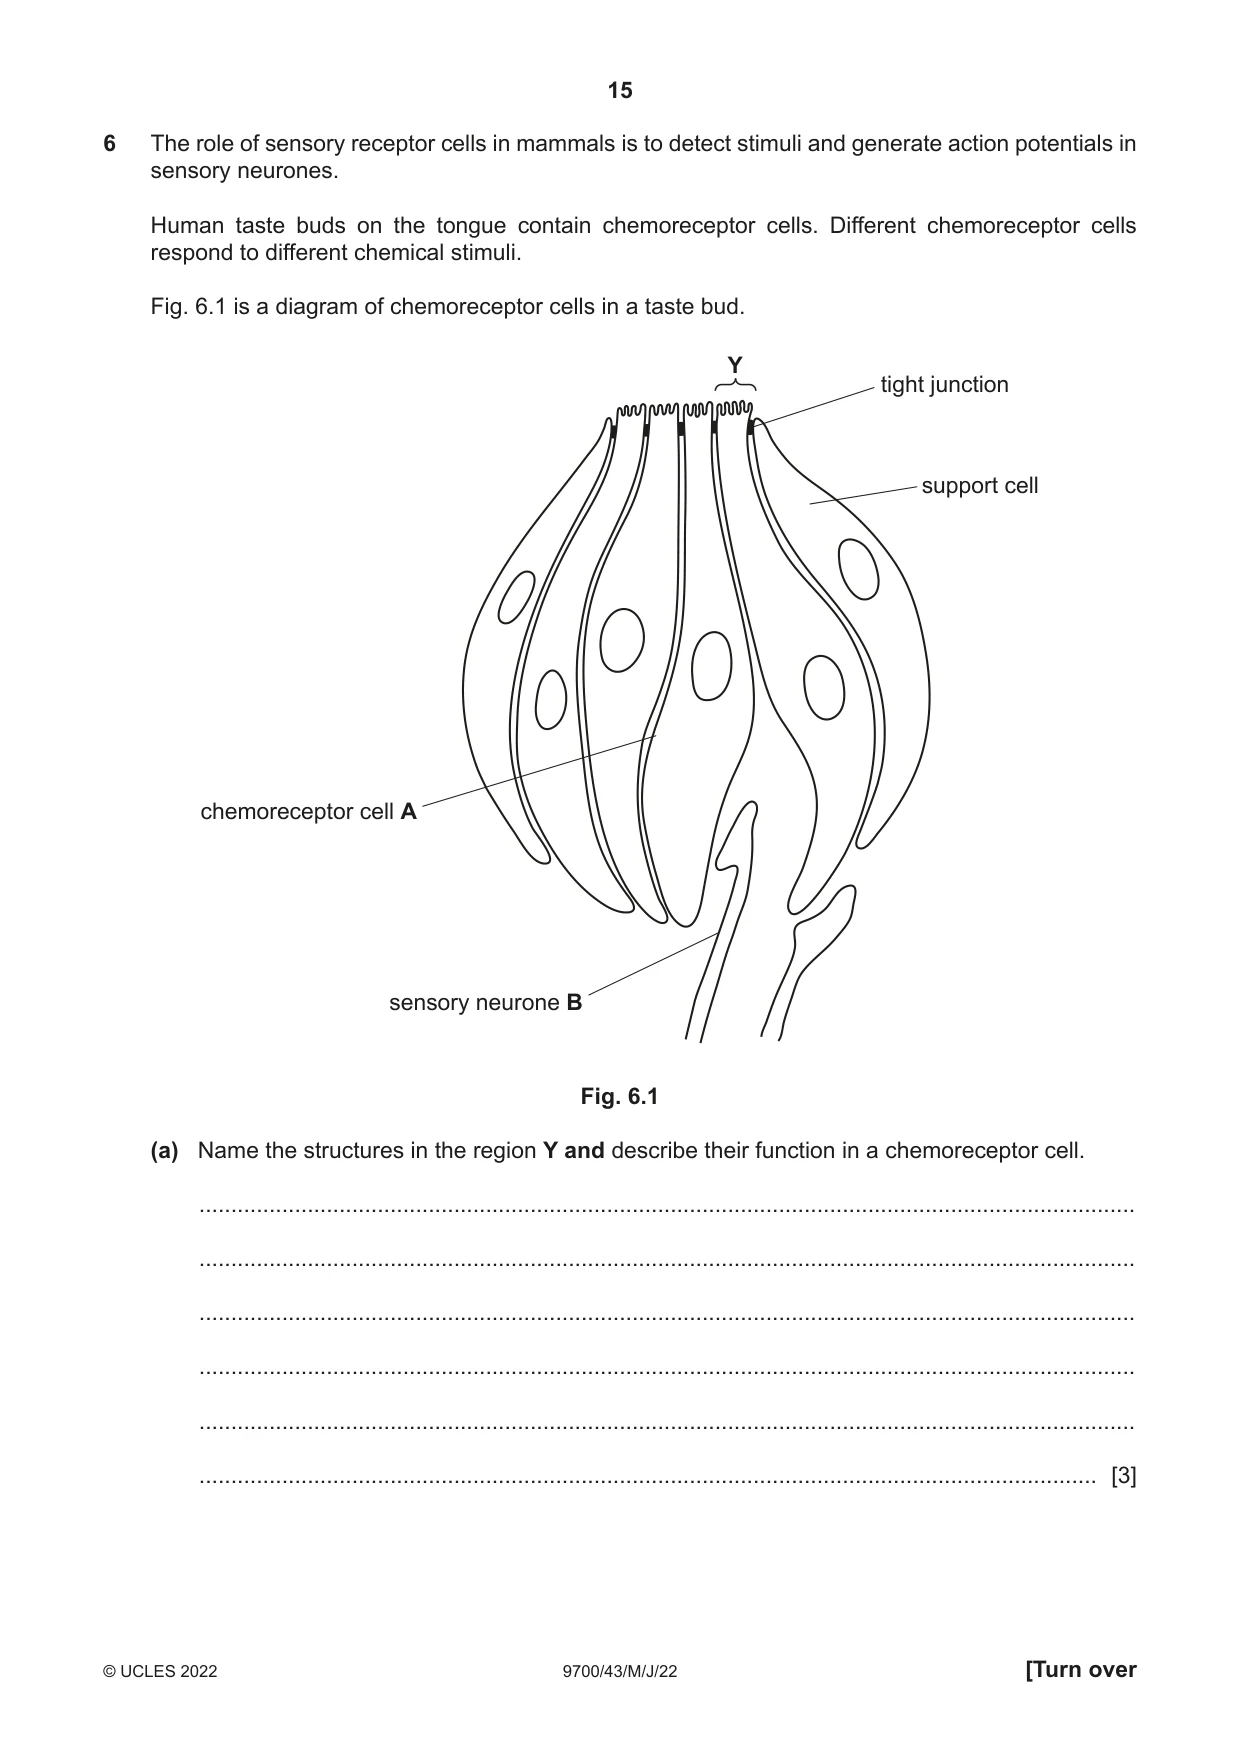
6 The role of sensory receptor cells in mammals is to detect stimuli and generate action potentials in sensory neurones. Human taste buds on the tongue contain chemoreceptor cells. Different chemoreceptor cells respond to different chemical stimuli. Fig. 6.1 is a diagram of chemoreceptor cells in a taste bud. Y tight junction support cell chemoreceptor cell A sensory neurone B Fig. 6.1 (a) Name the structures in the region Y and describe their function in a chemoreceptor cell. ................................................................................................................................................... ................................................................................................................................................... ................................................................................................................................................... ................................................................................................................................................... ................................................................................................................................................... ............................................................................................................................................. [3] (b) When a sugar molecule binds to a receptor protein on the cell surface membrane of cell A, calcium ions are released into the cytoplasm of the cell by the endoplasmic reticulum. Explain how the release of calcium ions will lead to an action potential being generated in sensory neurone B. ................................................................................................................................................... ................................................................................................................................................... ................................................................................................................................................... ................................................................................................................................................... ................................................................................................................................................... ................................................................................................................................................... ................................................................................................................................................... ................................................................................................................................................... ................................................................................................................................................... ................................................................................................................................................... ................................................................................................................................................... ................................................................................................................................................... ............................................................................................................................................. [6] [Total: 9]
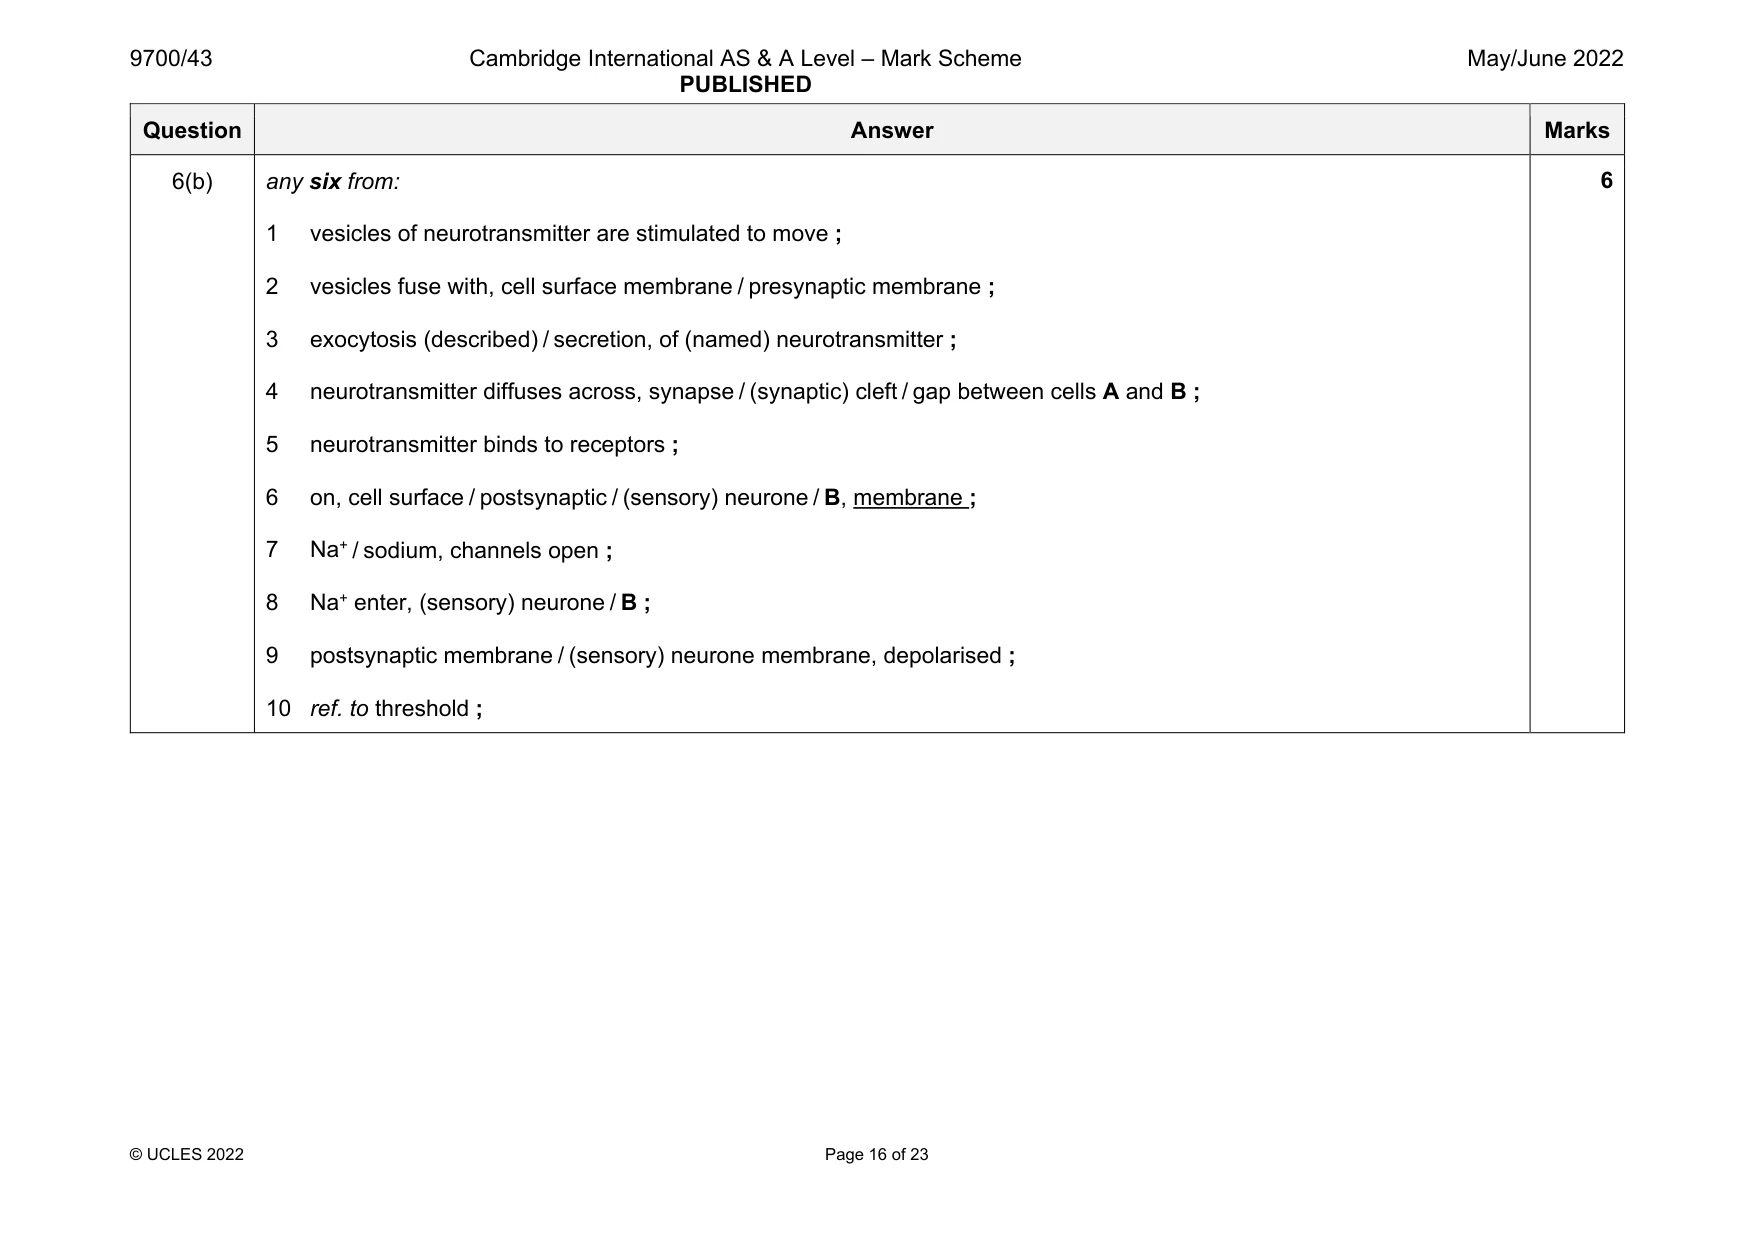
Mark scheme: 6(a) 1 microvilli ; A brush border I papillae 2 increase surface area ; 3 (so), more (Na+) channels / more Na+ enter ; 3 Question Answer Marks 6(b) any six from: 1 vesicles of neurotransmitter are stimulated to move ; 2 vesicles fuse with, cell surface membrane / presynaptic membrane ; 3 exocytosis (described) / secretion, of (named) neurotransmitter ; 4 neurotransmitter diffuses across, synapse / (synaptic) cleft / gap between cells A and B ; 5 neurotransmitter binds to receptors ; 6 on, cell surface / postsynaptic / (sensory) neurone / B, membrane ; 7 Na+ / sodium, channels open ; 8 Na+ enter, (sensory) neurone / B ; 9 postsynaptic membrane / (sensory) neurone membrane, depolarised ; 10 ref. to threshold ; 6
Q7 · Epistasis occurs when a gene at one locus can affect the expression of a gene at another…
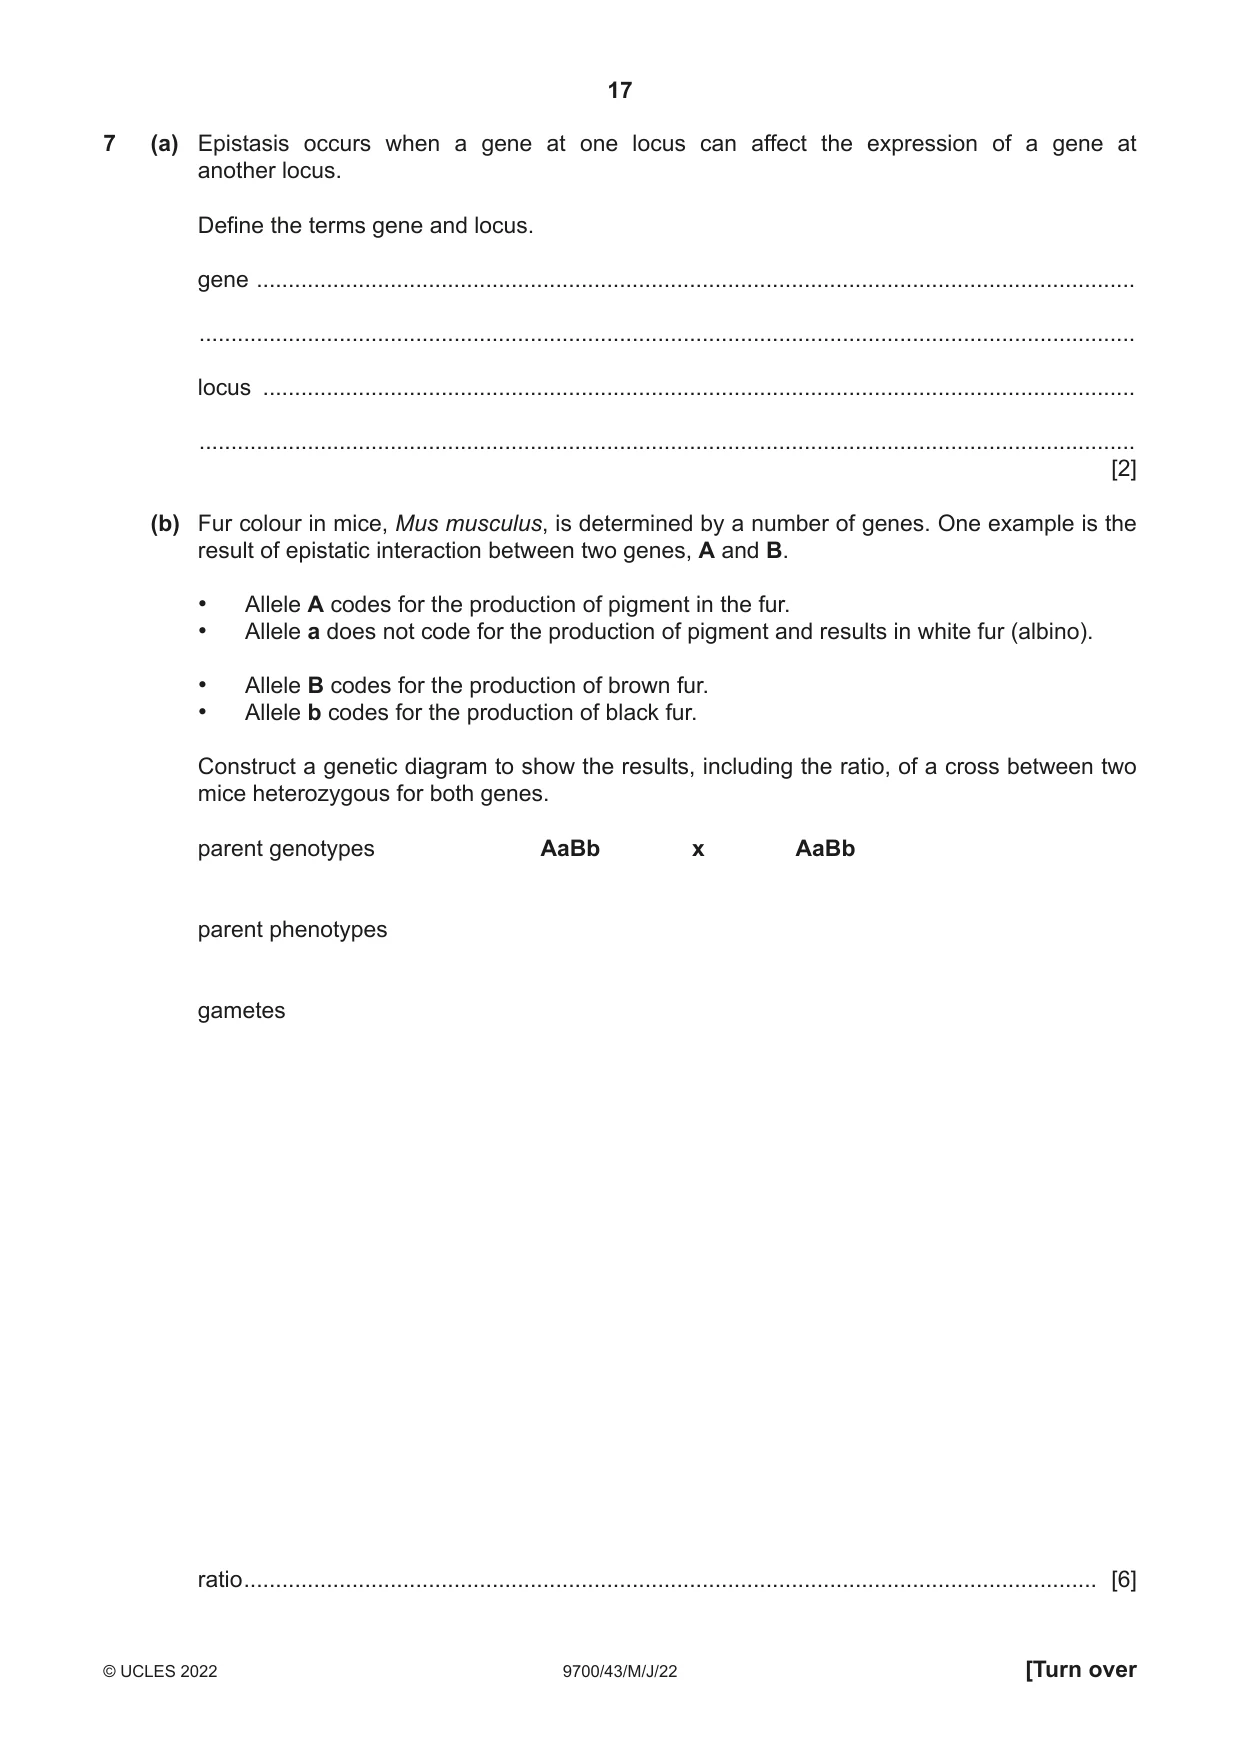
7 (a) Epistasis occurs when a gene at one locus can affect the expression of a gene at another locus. Define the terms gene and locus. gene .......................................................................................................................................... ................................................................................................................................................... locus ......................................................................................................................................... ................................................................................................................................................... [2] (b) Fur colour in mice, Mus musculus, is determined by a number of genes. One example is the result of epistatic interaction between two genes, A and B. • Allele A codes for the production of pigment in the fur. • Allele a does not code for the production of pigment and results in white fur (albino). • Allele B codes for the production of brown fur. • Allele b codes for the production of black fur. Construct a genetic diagram to show the results, including the ratio, of a cross between two mice heterozygous for both genes. parent genotypes AaBb x AaBb parent phenotypes gametes ratio ...................................................................................................................................... [6] (c) White fur is due to a mutation of the TYR gene. This is called albinism. Explain how a mutation of the TYR gene can result in albinism. ................................................................................................................................................... ................................................................................................................................................... ................................................................................................................................................... ................................................................................................................................................... ................................................................................................................................................... ................................................................................................................................................... ............................................................................................................................................. [3] [Total: 11]
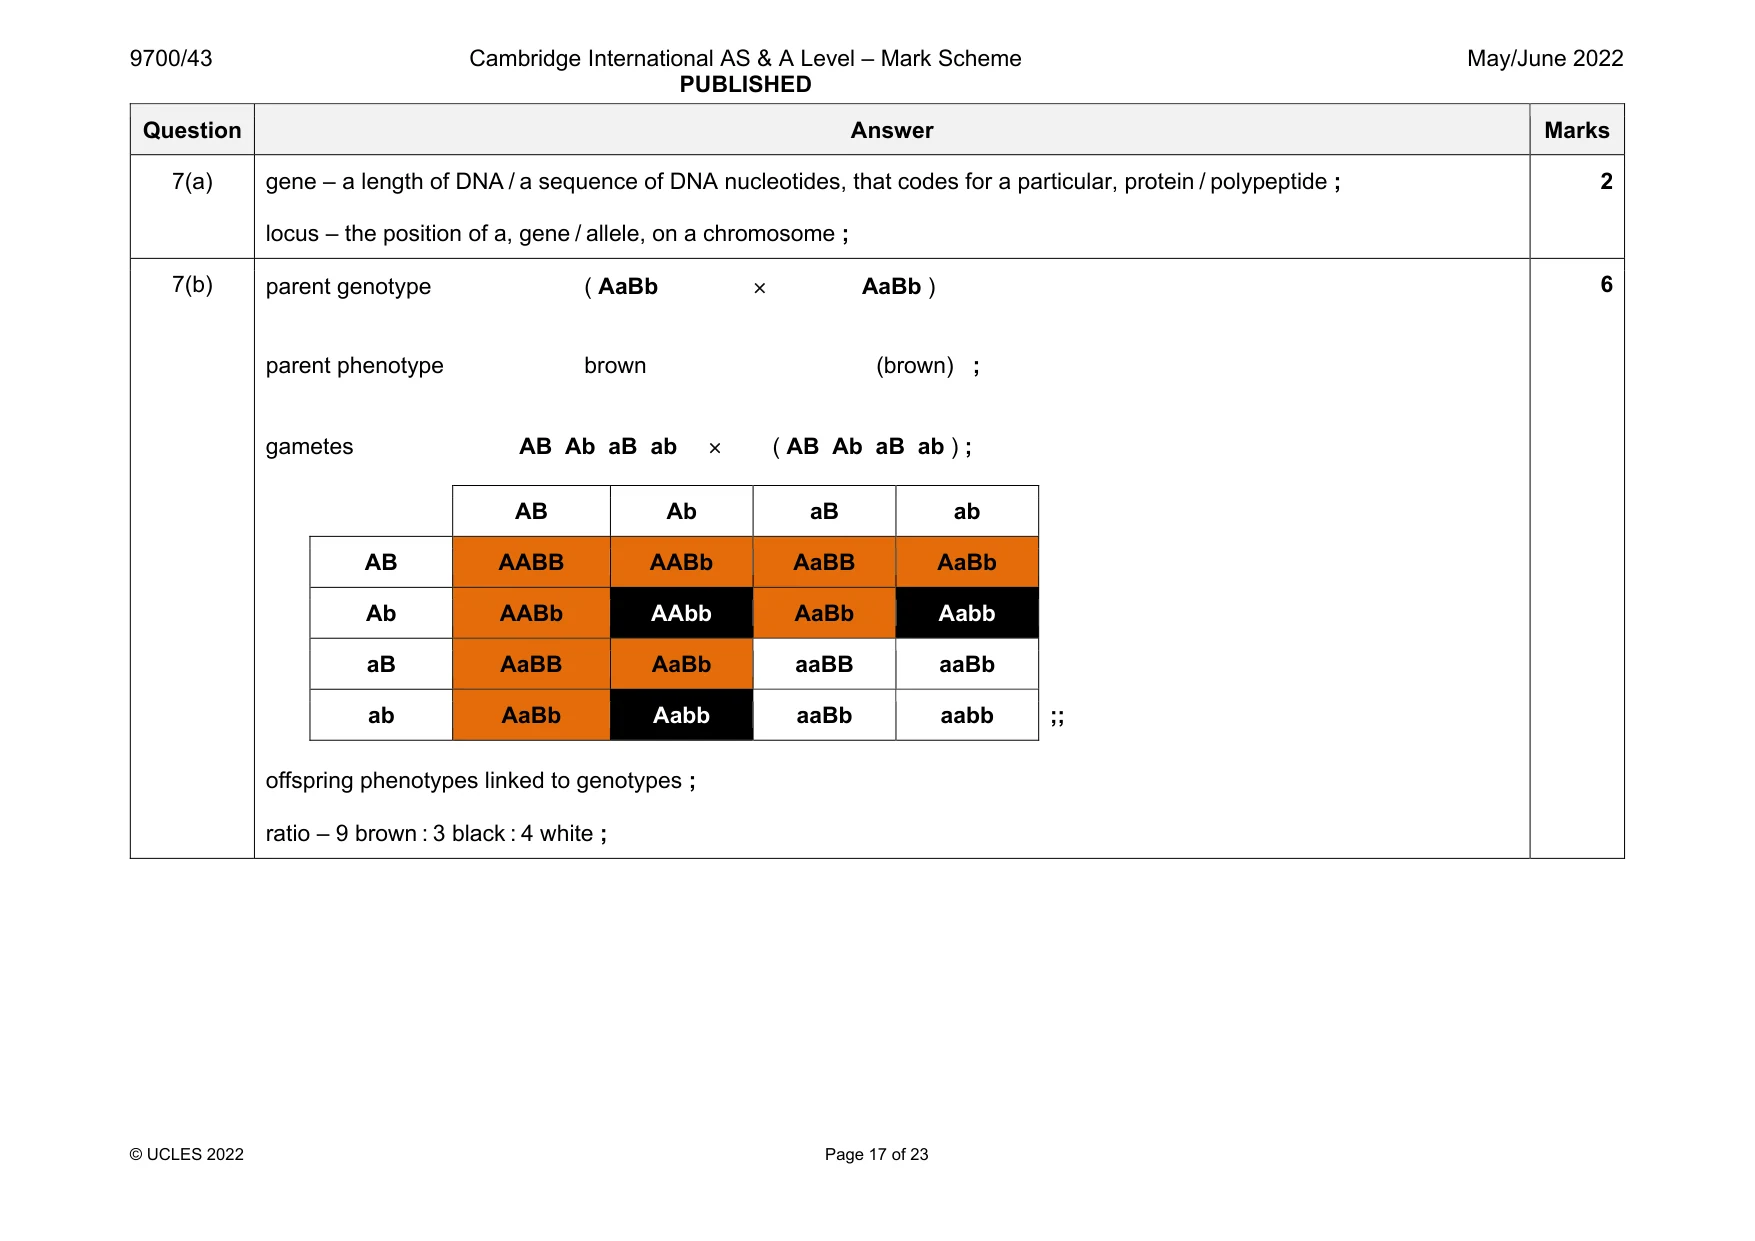
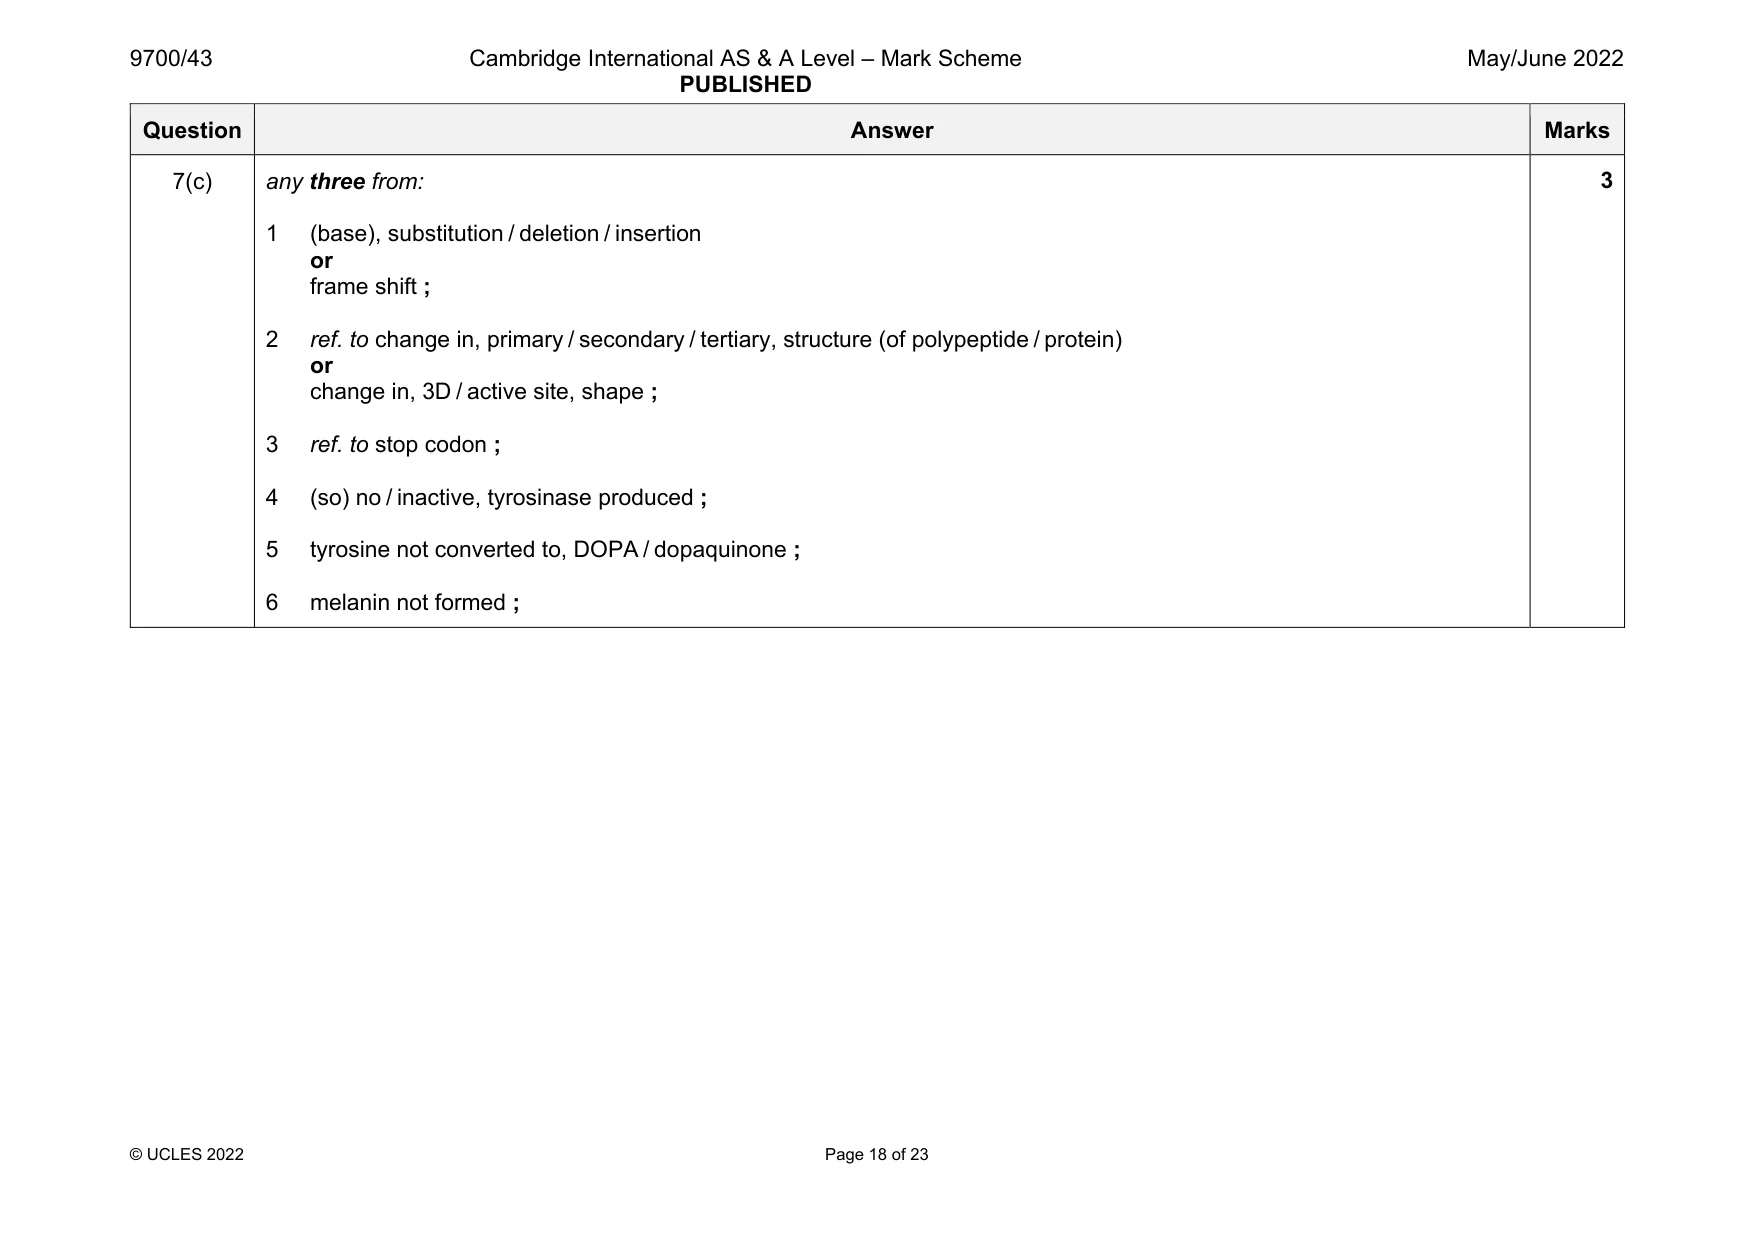
Mark scheme: 7(a) gene – a length of DNA / a sequence of DNA nucleotides, that codes for a particular, protein / polypeptide ; locus – the position of a, gene / allele, on a chromosome ; 2 7(b) parent genotype ( AaBb AaBb ) parent phenotype brown (brown) ; gametes AB Ab aB ab ( AB Ab aB ab ) ; AB Ab aB ab AB AABB AABb AaBB AaBb Ab AABb AAbb AaBb Aabb aB AaBB AaBb aaBB aaBb ab AaBb Aabb aaBb aabb ;; offspring phenotypes linked to genotypes ; ratio – 9 brown : 3 black : 4 white ; 6 Question Answer Marks 7(c) any three from: 1 (base), substitution / deletion / insertion or frame shift ; 2 ref. to change in, primary / secondary / tertiary, structure (of polypeptide / protein) or change in, 3D / active site, shape ; 3 ref. to stop codon ; 4 (so) no / inactive, tyrosinase produced ; 5 tyrosine not converted to, DOPA / dopaquinone ; 6 melanin not formed ; 3
More questions on Passage of information from parents to offspring
Q8 · The Malayan tapir, Tapirus indicus, lives in the rainforest of South East Asia
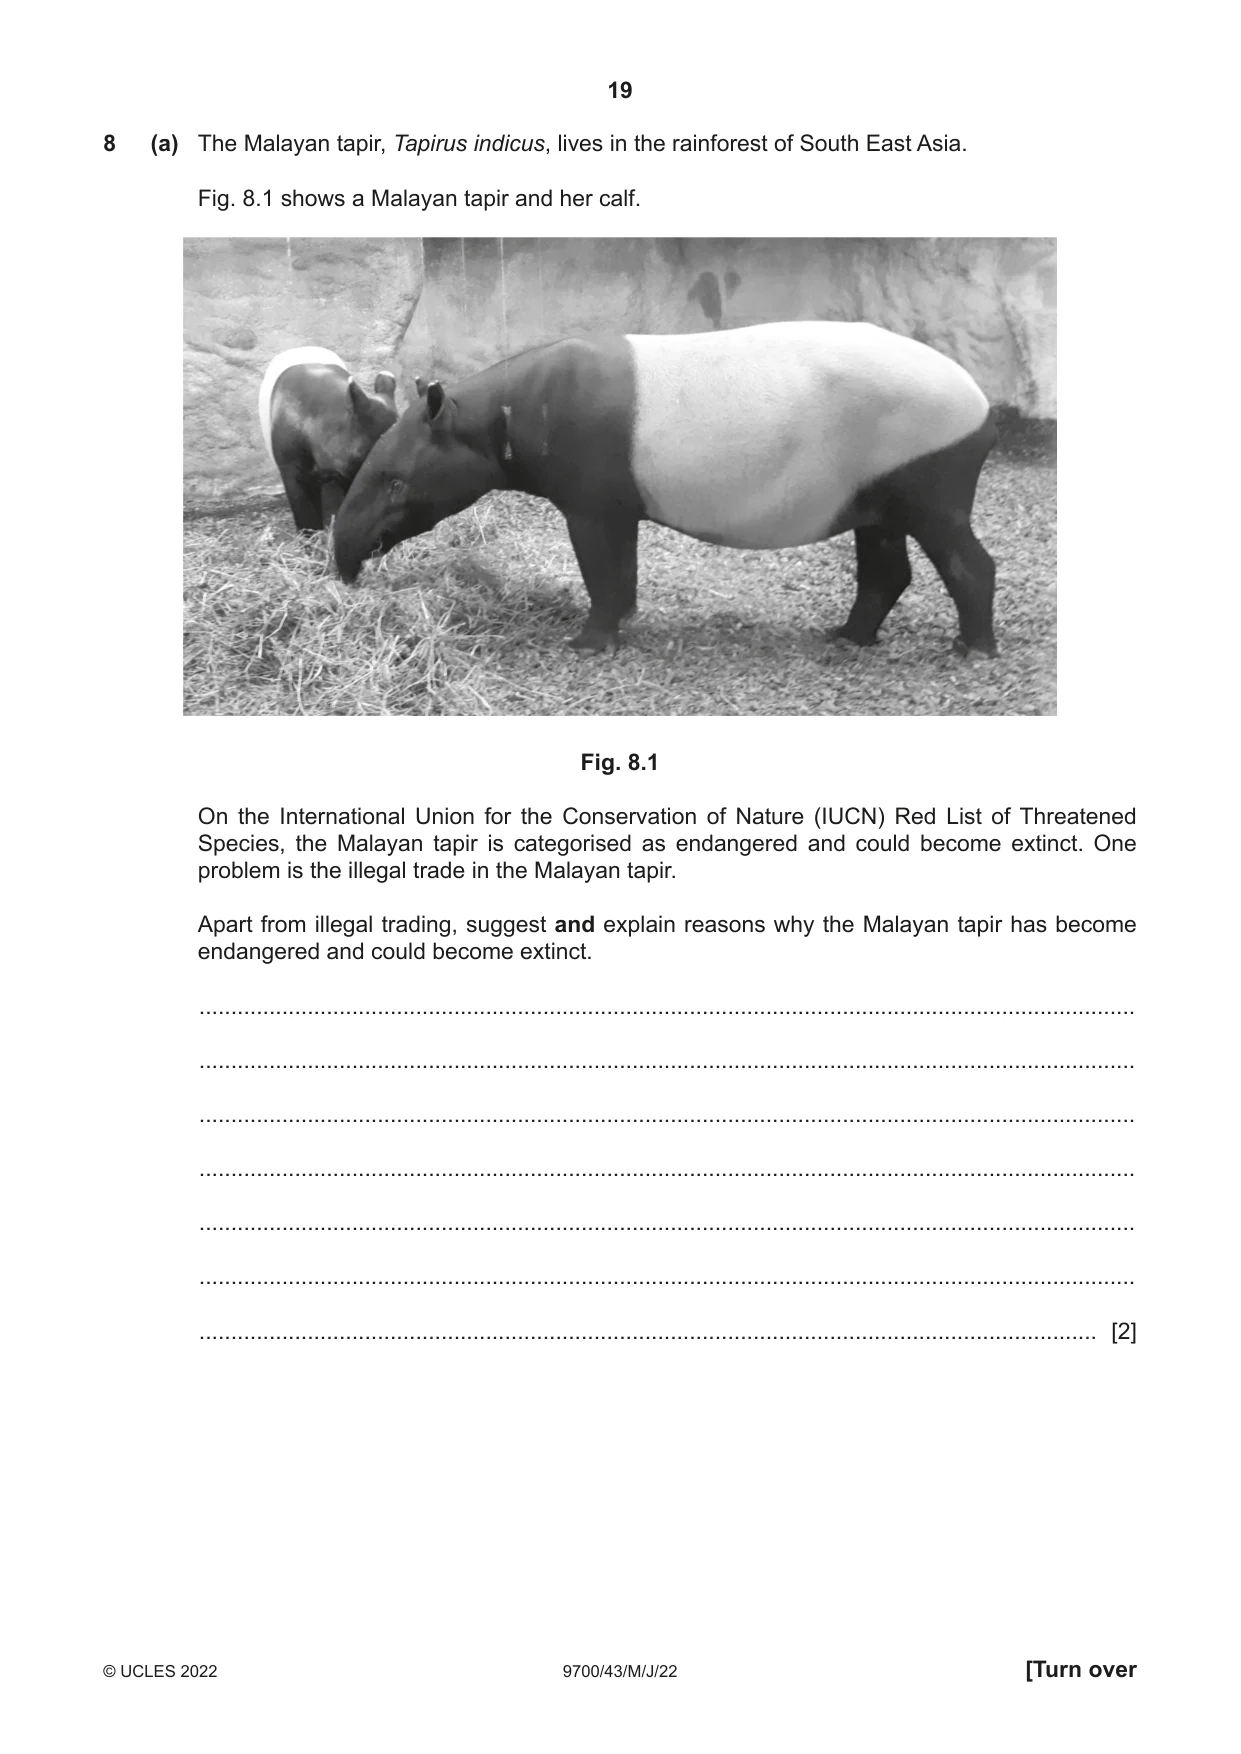
8 (a) The Malayan tapir, Tapirus indicus, lives in the rainforest of South East Asia. Fig. 8.1 shows a Malayan tapir and her calf. Fig. 8.1 On the International Union for the Conservation of Nature (IUCN) Red List of Threatened Species, the Malayan tapir is categorised as endangered and could become extinct. One problem is the illegal trade in the Malayan tapir. Apart from illegal trading, suggest and explain reasons why the Malayan tapir has become endangered and could become extinct. ................................................................................................................................................... ................................................................................................................................................... ................................................................................................................................................... ................................................................................................................................................... ................................................................................................................................................... ................................................................................................................................................... ............................................................................................................................................. [2] (b) The trade in Malayan tapirs is regulated by the Convention on International Trade in Endangered Species (CITES). Suggest ways by which CITES attempts to regulate the trade in wild fauna and flora. ................................................................................................................................................... ................................................................................................................................................... ................................................................................................................................................... ................................................................................................................................................... ................................................................................................................................................... ................................................................................................................................................... ................................................................................................................................................... ................................................................................................................................................... ............................................................................................................................................. [3] (c) Many endangered species, such as the Malayan tapir, are protected in zoos. Outline the role of zoos in the conservation of endangered species. ................................................................................................................................................... ................................................................................................................................................... ................................................................................................................................................... ................................................................................................................................................... ................................................................................................................................................... ................................................................................................................................................... ................................................................................................................................................... ................................................................................................................................................... ............................................................................................................................................. [4] [Total: 9]
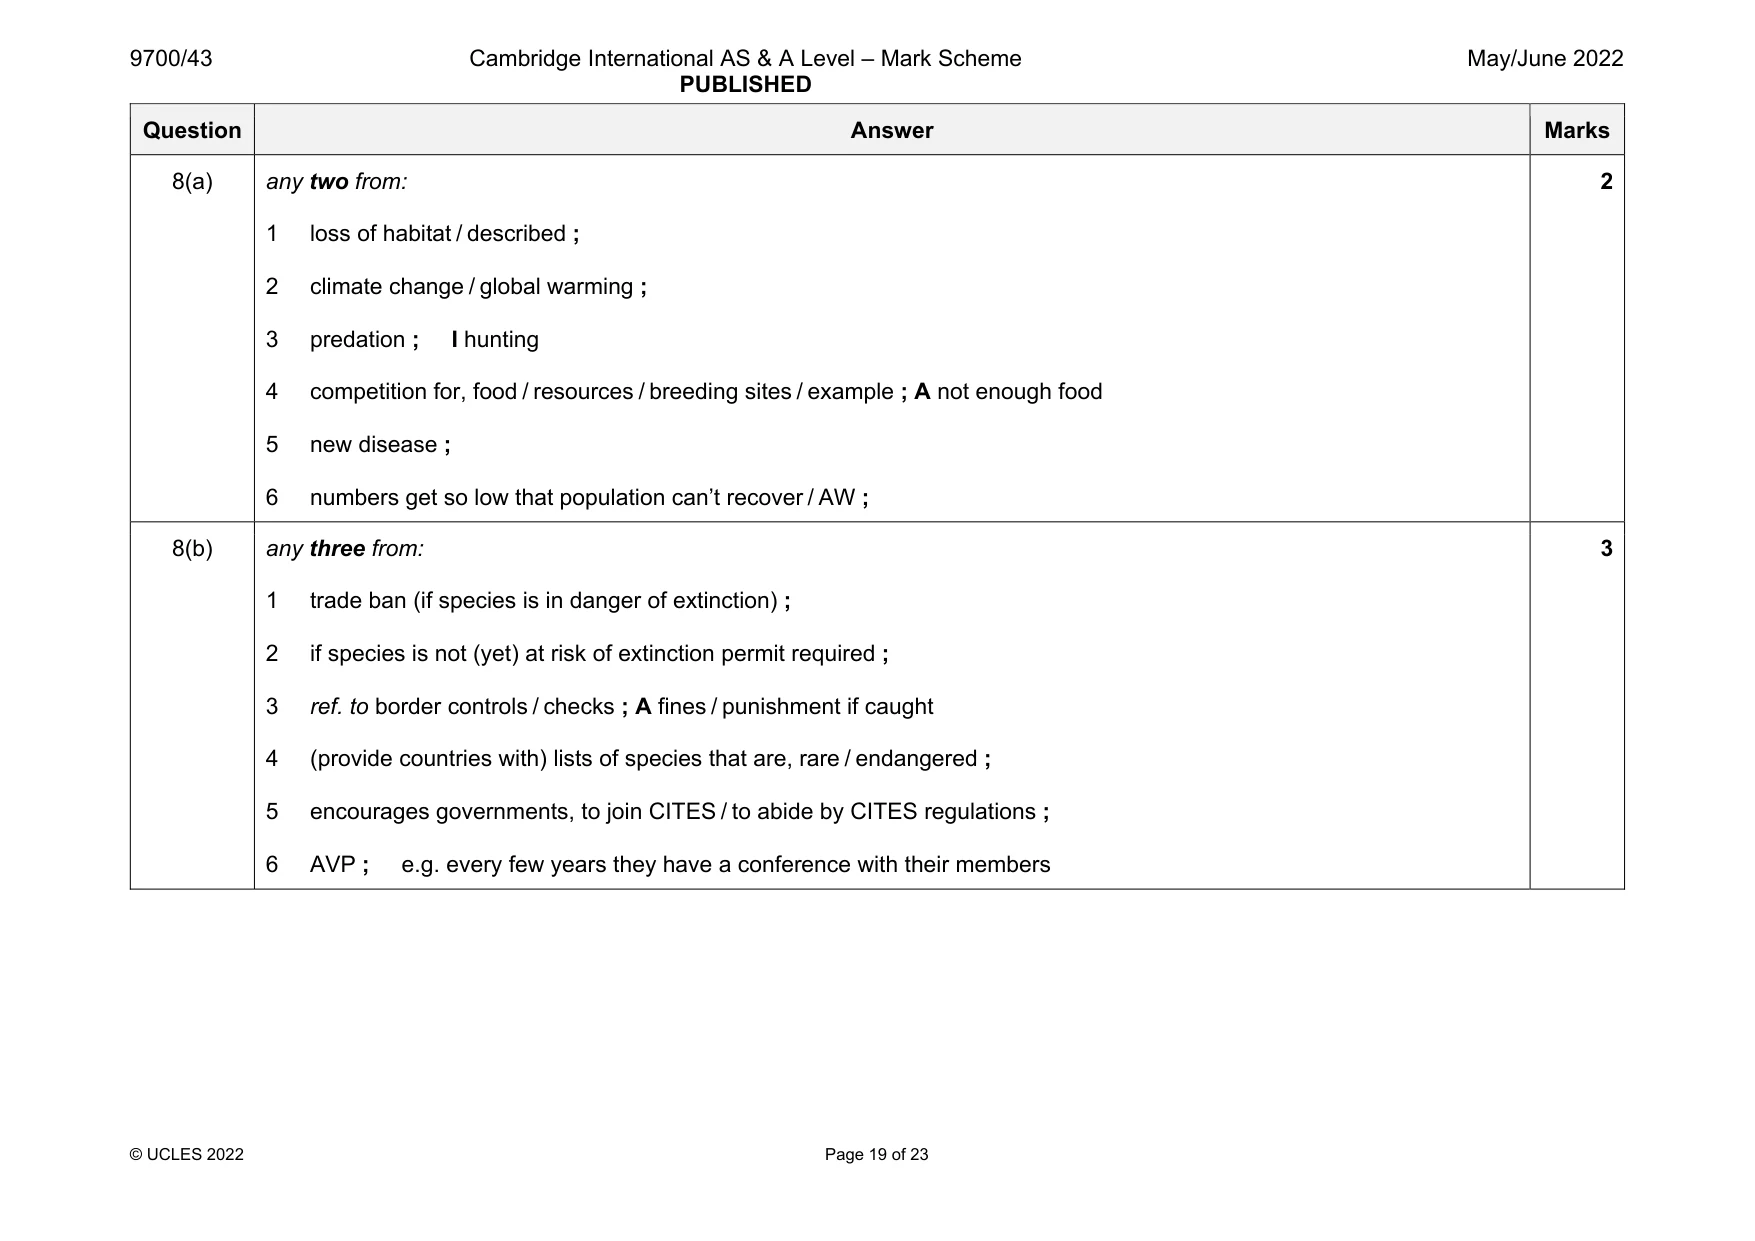
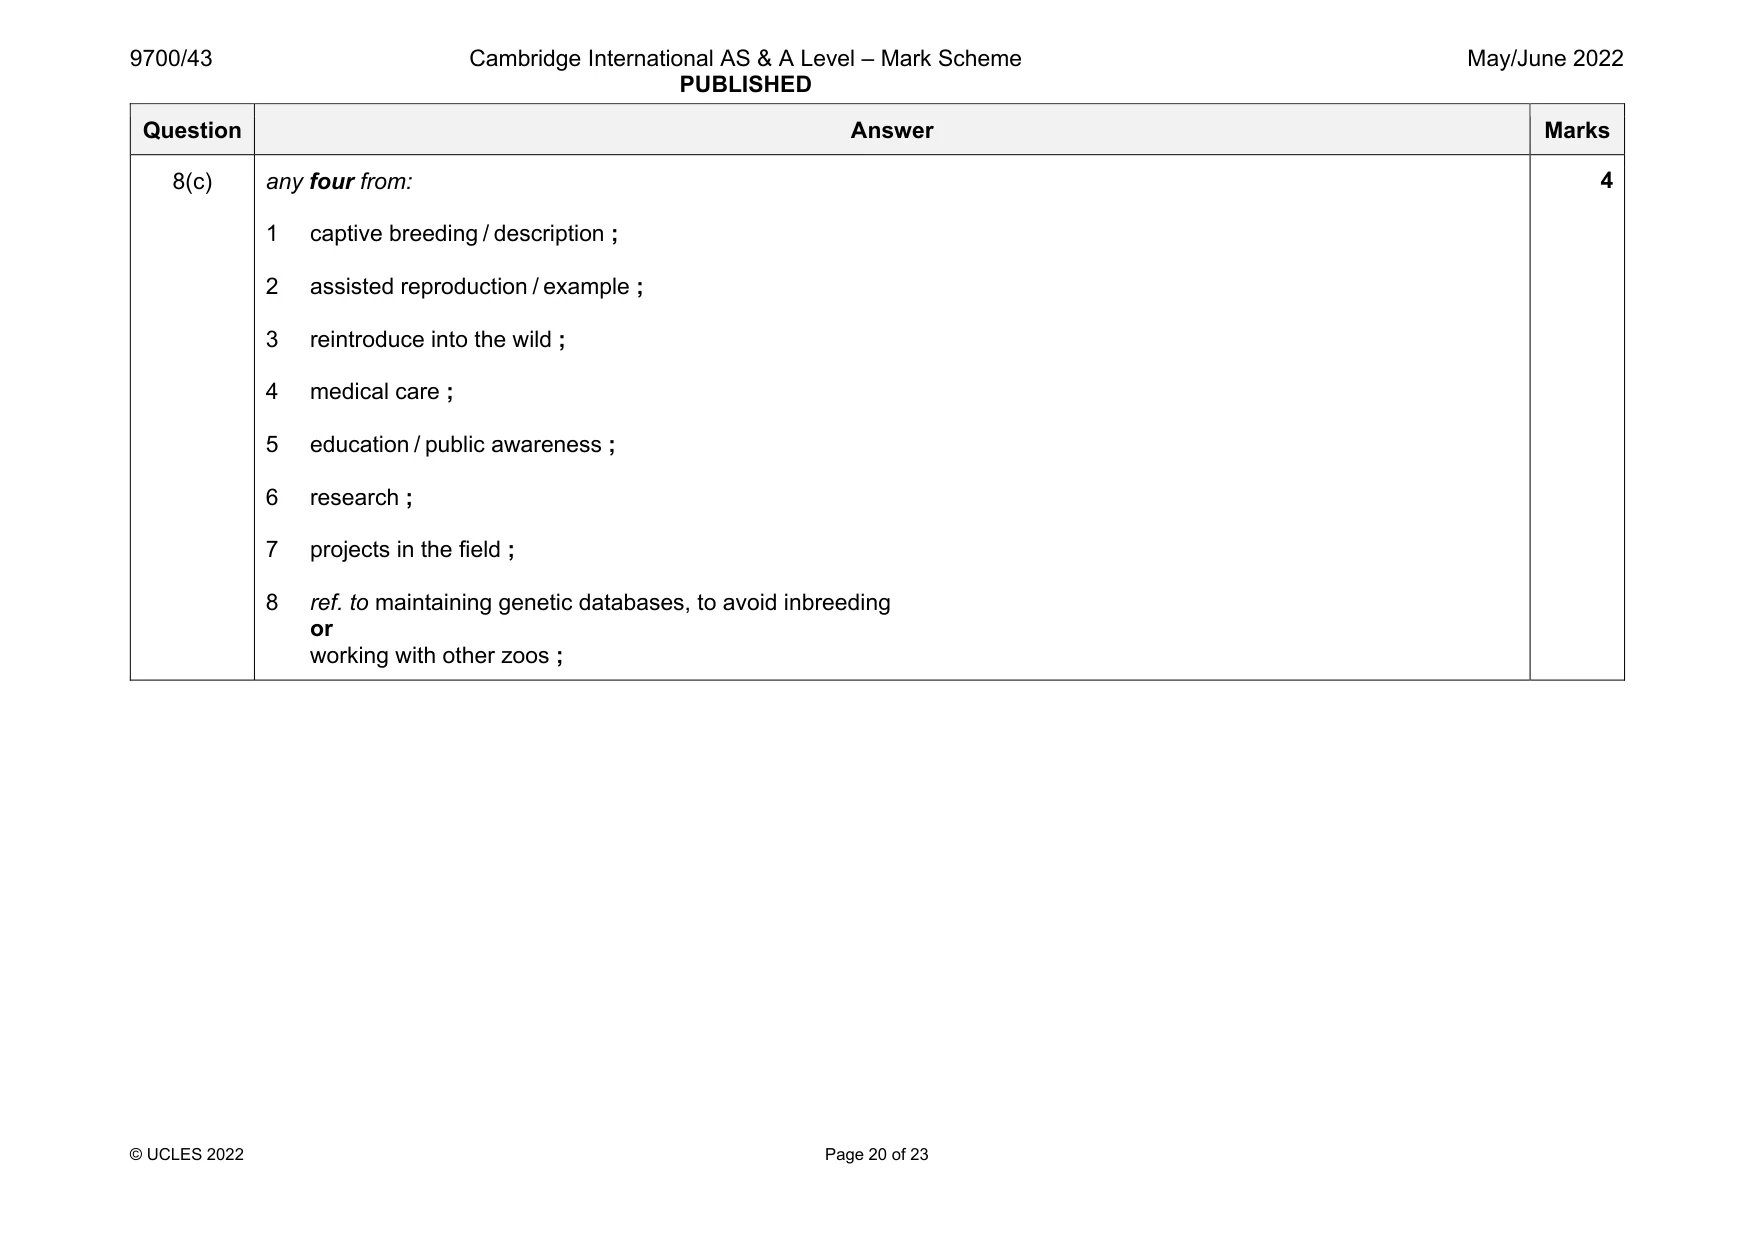
Mark scheme: 8(a) any two from: 1 loss of habitat / described ; 2 climate change / global warming ; 3 predation ; I hunting 4 competition for, food / resources / breeding sites / example ; A not enough food 5 new disease ; 6 numbers get so low that population can’t recover / AW ; 2 8(b) any three from: 1 trade ban (if species is in danger of extinction) ; 2 if species is not (yet) at risk of extinction permit required ; 3 ref. to border controls / checks ; A fines / punishment if caught 4 (provide countries with) lists of species that are, rare / endangered ; 5 encourages governments, to join CITES / to abide by CITES regulations ; 6 AVP ; e.g. every few years they have a conference with their members 3 Question Answer Marks 8(c) any four from: 1 captive breeding / description ; 2 assisted reproduction / example ; 3 reintroduce into the wild ; 4 medical care ; 5 education / public awareness ; 6 research ; 7 projects in the field ; 8 ref. to maintaining genetic databases, to avoid inbreeding or working with other zoos ; 4
Q9 · A cross-section through a myelinated neurone
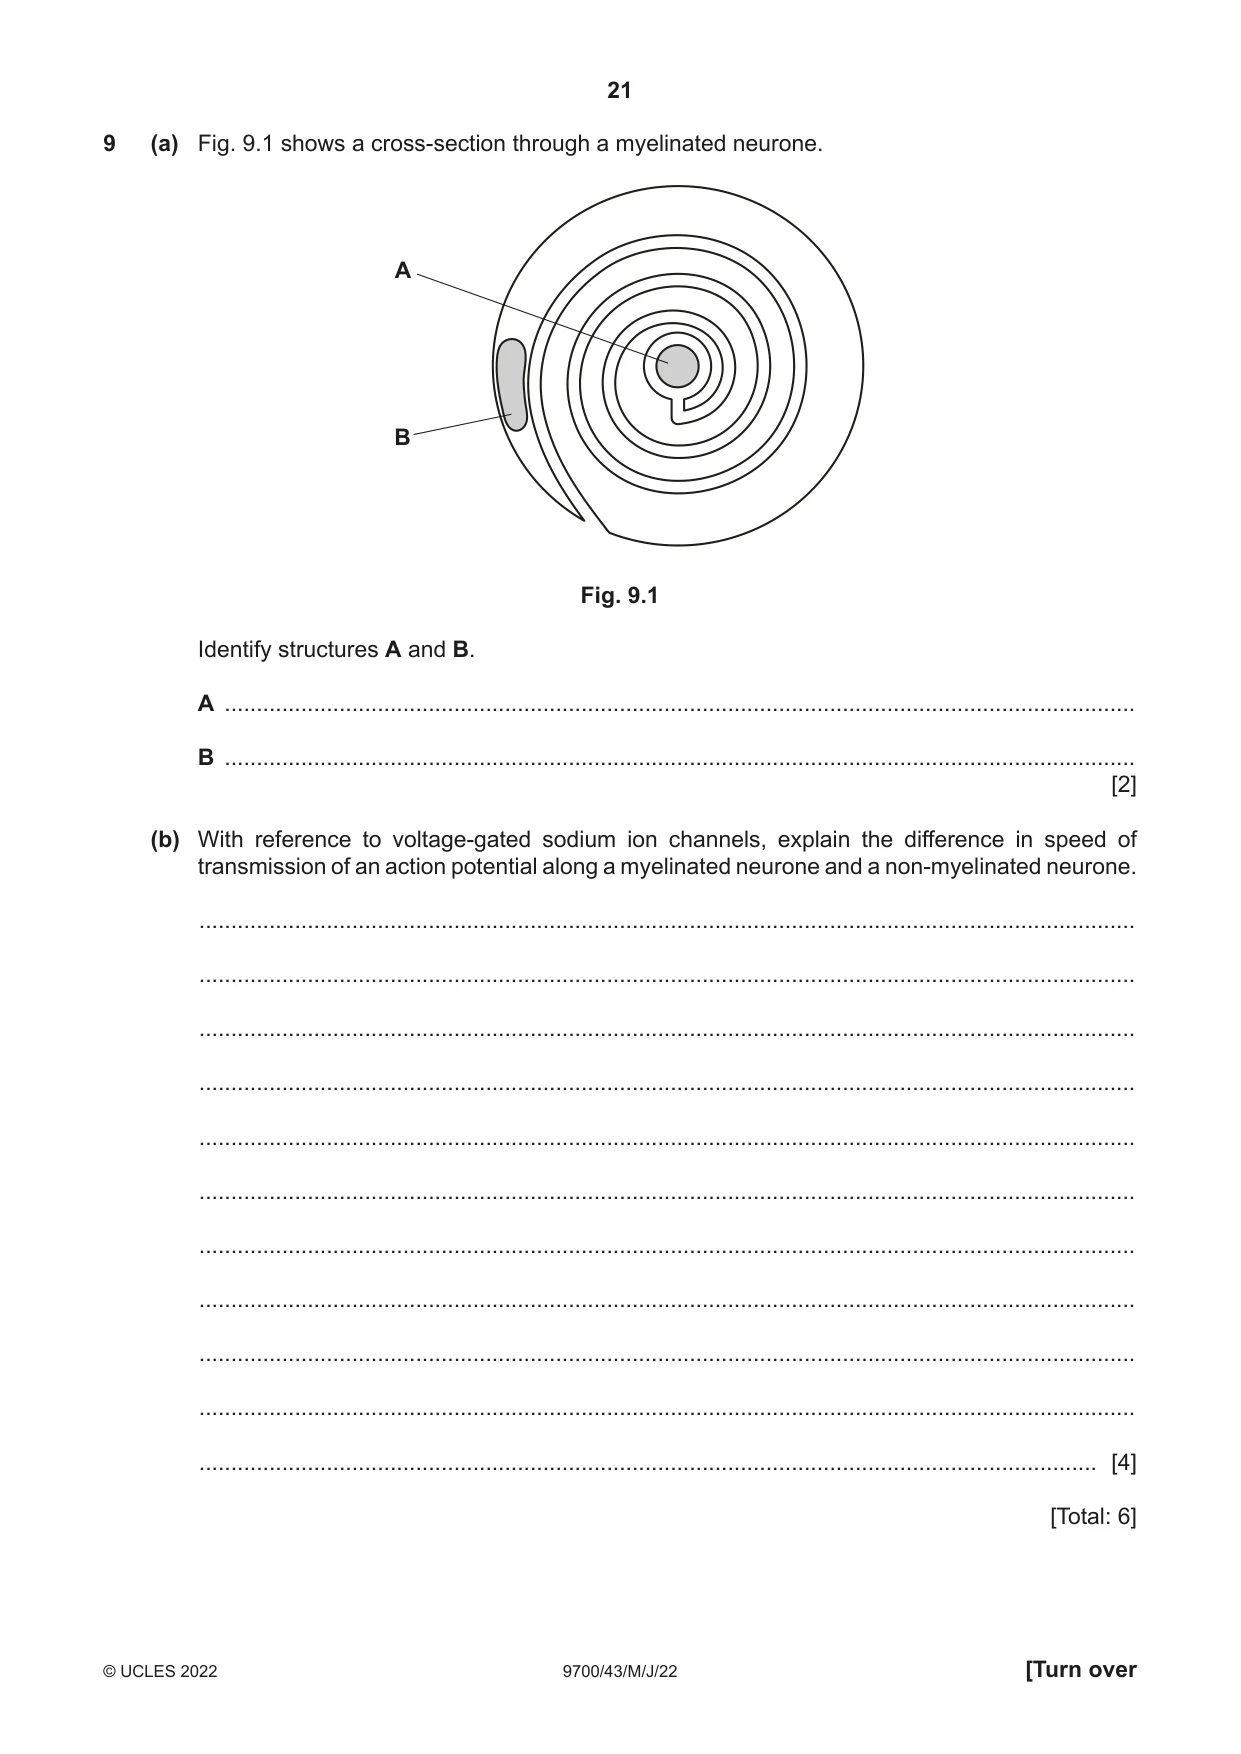
9 (a) Fig. 9.1 shows a cross-section through a myelinated neurone. A B Fig. 9.1 Identify structures A and B. A ............................................................................................................................................... B ............................................................................................................................................... [2] (b) With reference to voltage-gated sodium ion channels, explain the difference in speed of transmission of an action potential along a myelinated neurone and a non-myelinated neurone. ................................................................................................................................................... ................................................................................................................................................... ................................................................................................................................................... ................................................................................................................................................... ................................................................................................................................................... ................................................................................................................................................... ................................................................................................................................................... ................................................................................................................................................... ................................................................................................................................................... ................................................................................................................................................... ............................................................................................................................................. [4] [Total: 6]
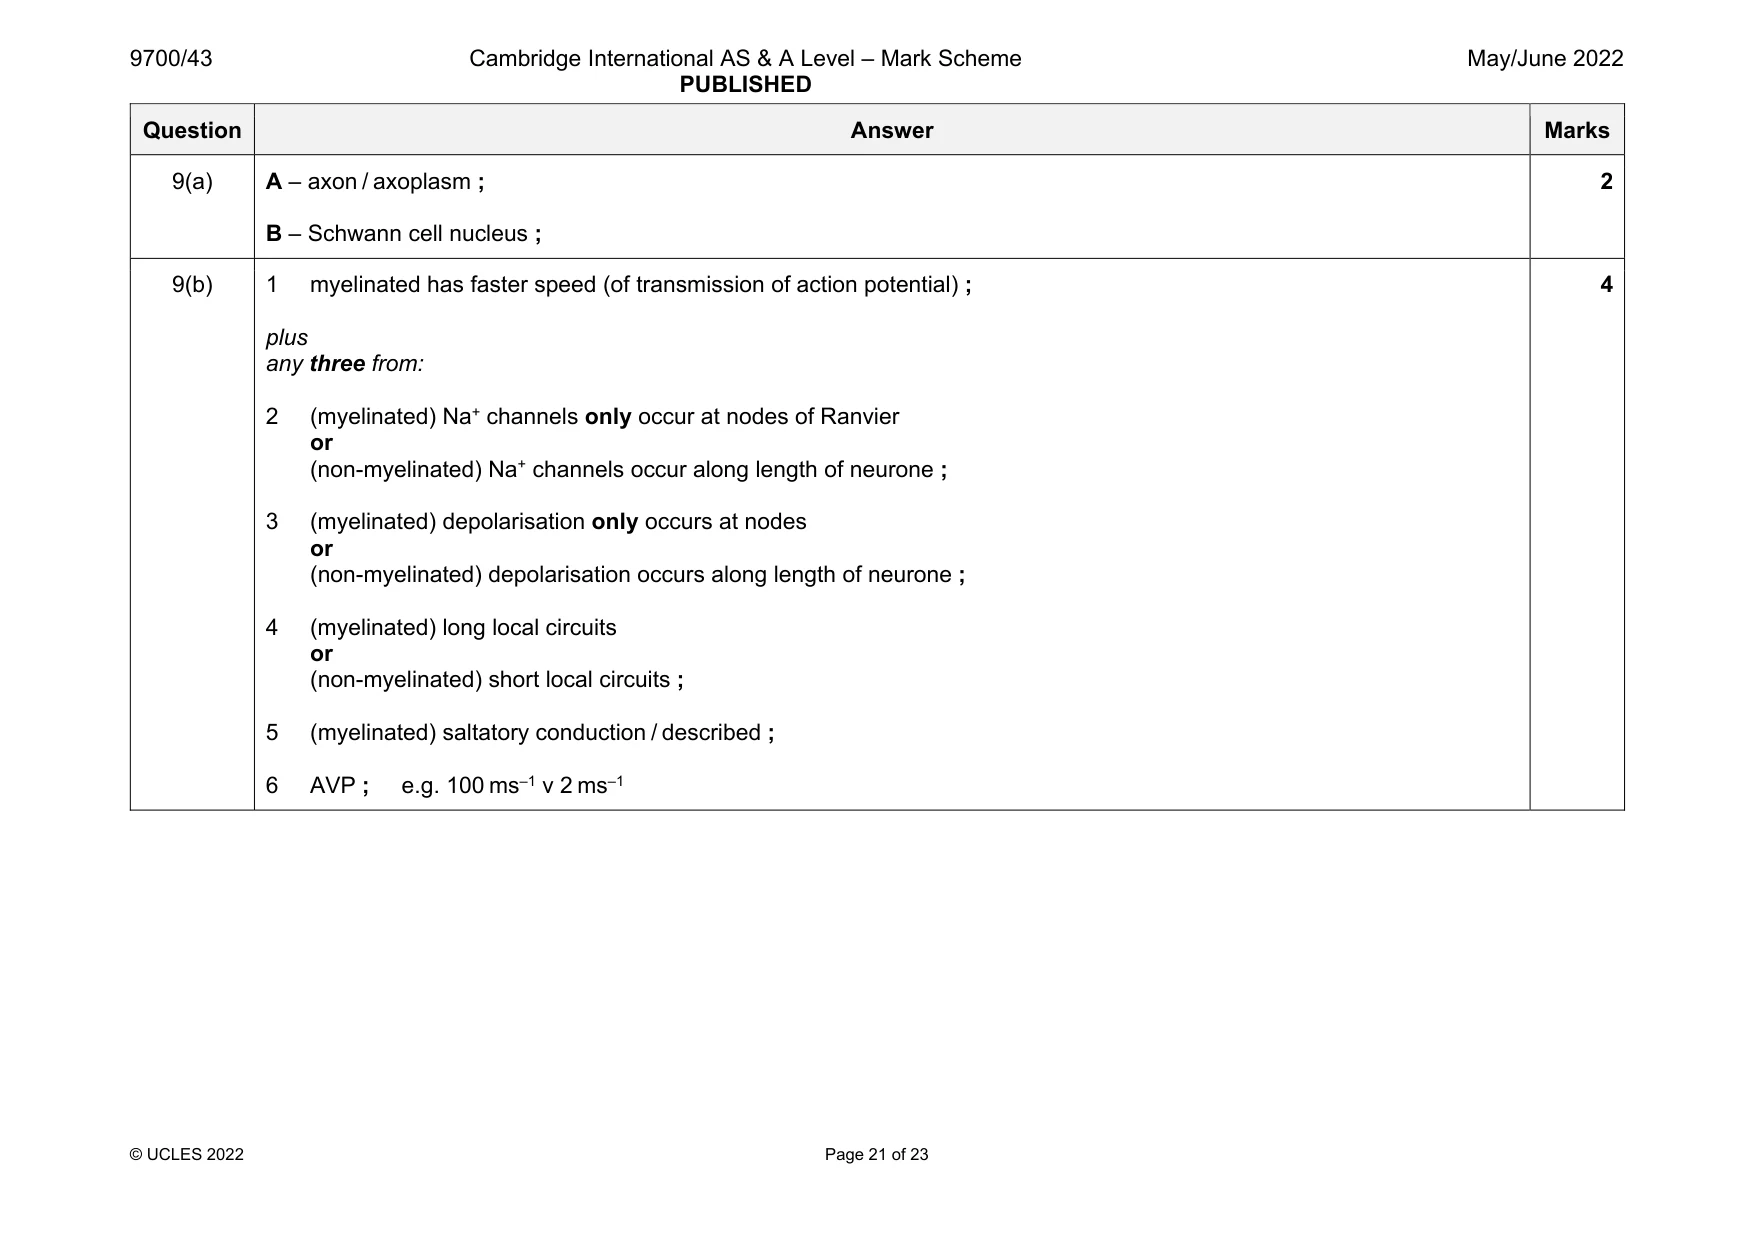
Mark scheme: 9(a) A – axon / axoplasm ; B – Schwann cell nucleus ; 2 9(b) 1 myelinated has faster speed (of transmission of action potential) ; plus any three from: 2 (myelinated) Na+ channels only occur at nodes of Ranvier or (non-myelinated) Na+ channels occur along length of neurone ; 3 (myelinated) depolarisation only occurs at nodes or (non-myelinated) depolarisation occurs along length of neurone ; 4 (myelinated) long local circuits or (non-myelinated) short local circuits ; 5 (myelinated) saltatory conduction / described ; 6 AVP ; e.g. 100 ms–1 v 2 ms–1 4
Q10 · Insulin has an important role in the maintenance of blood glucose concentration
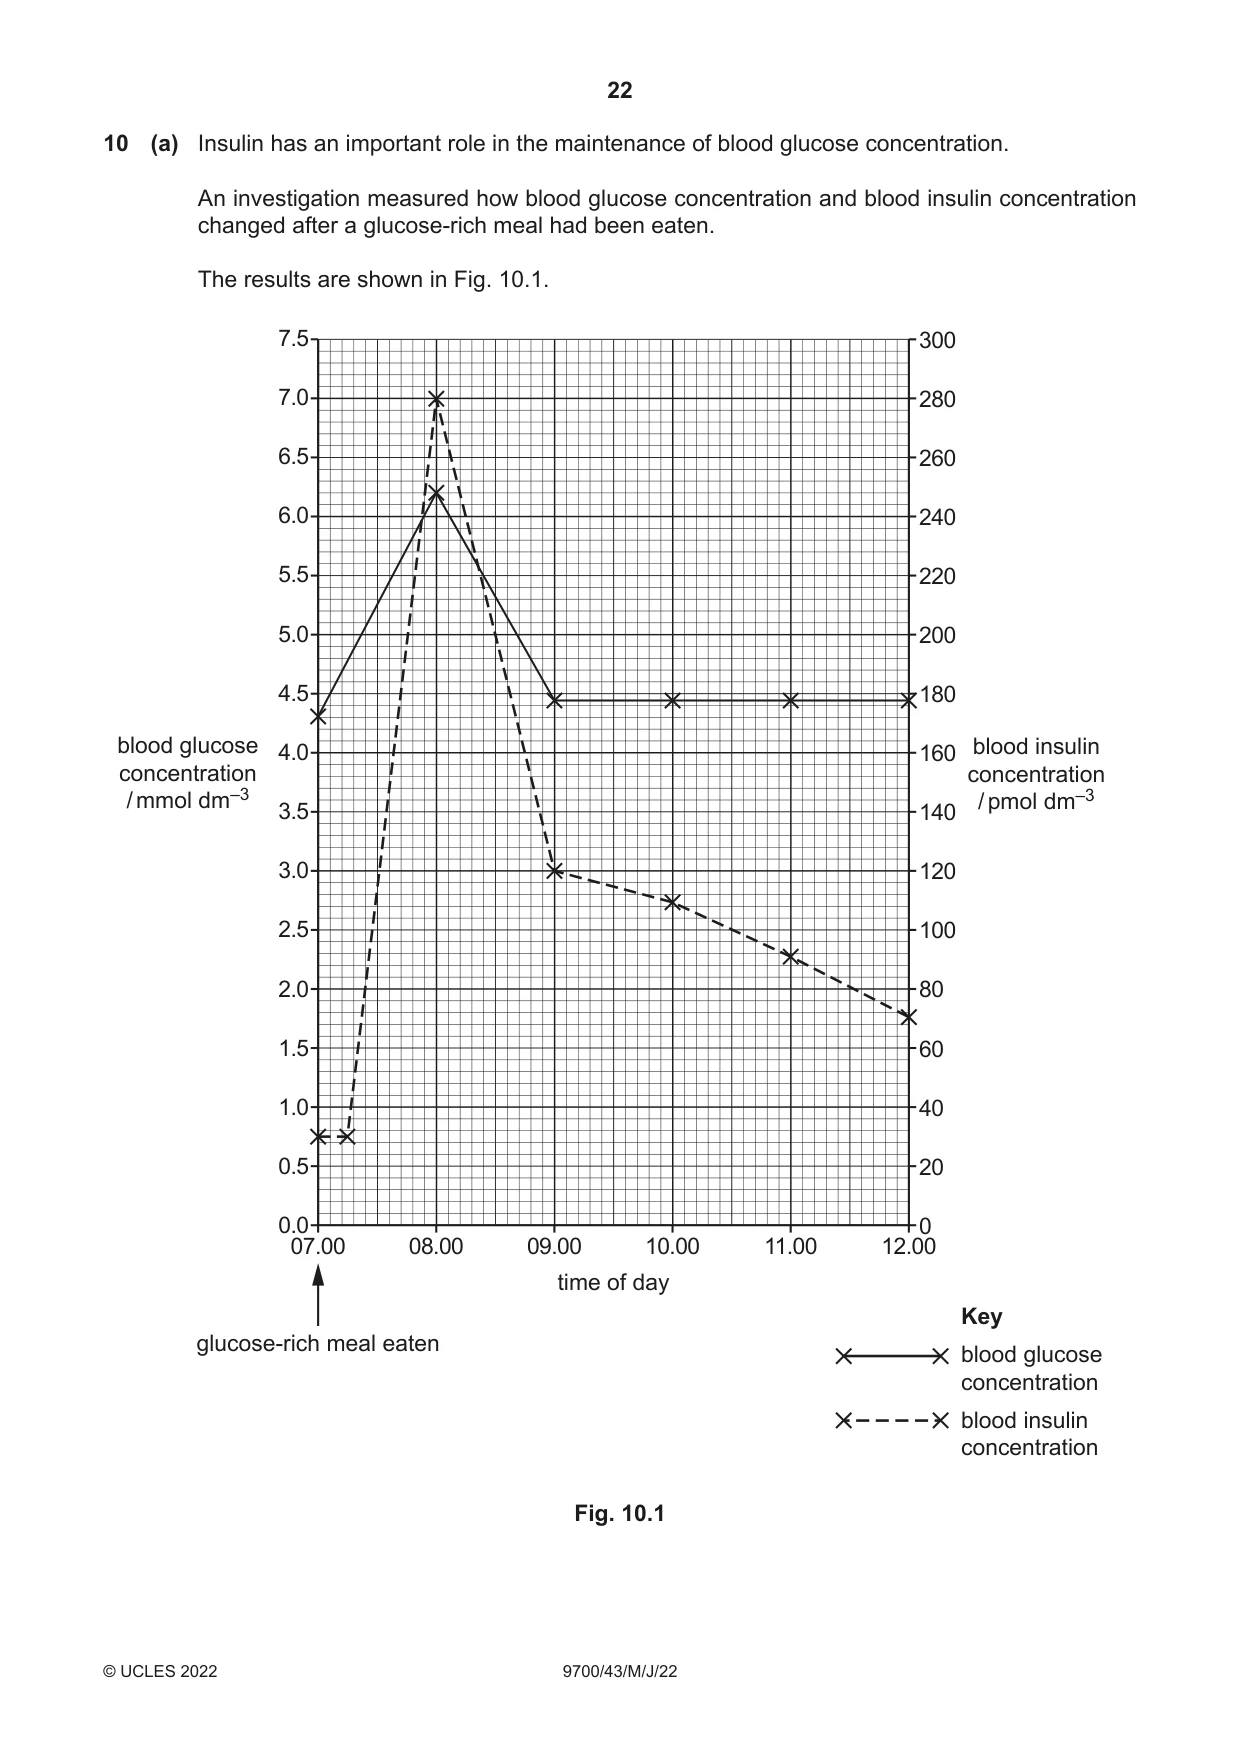
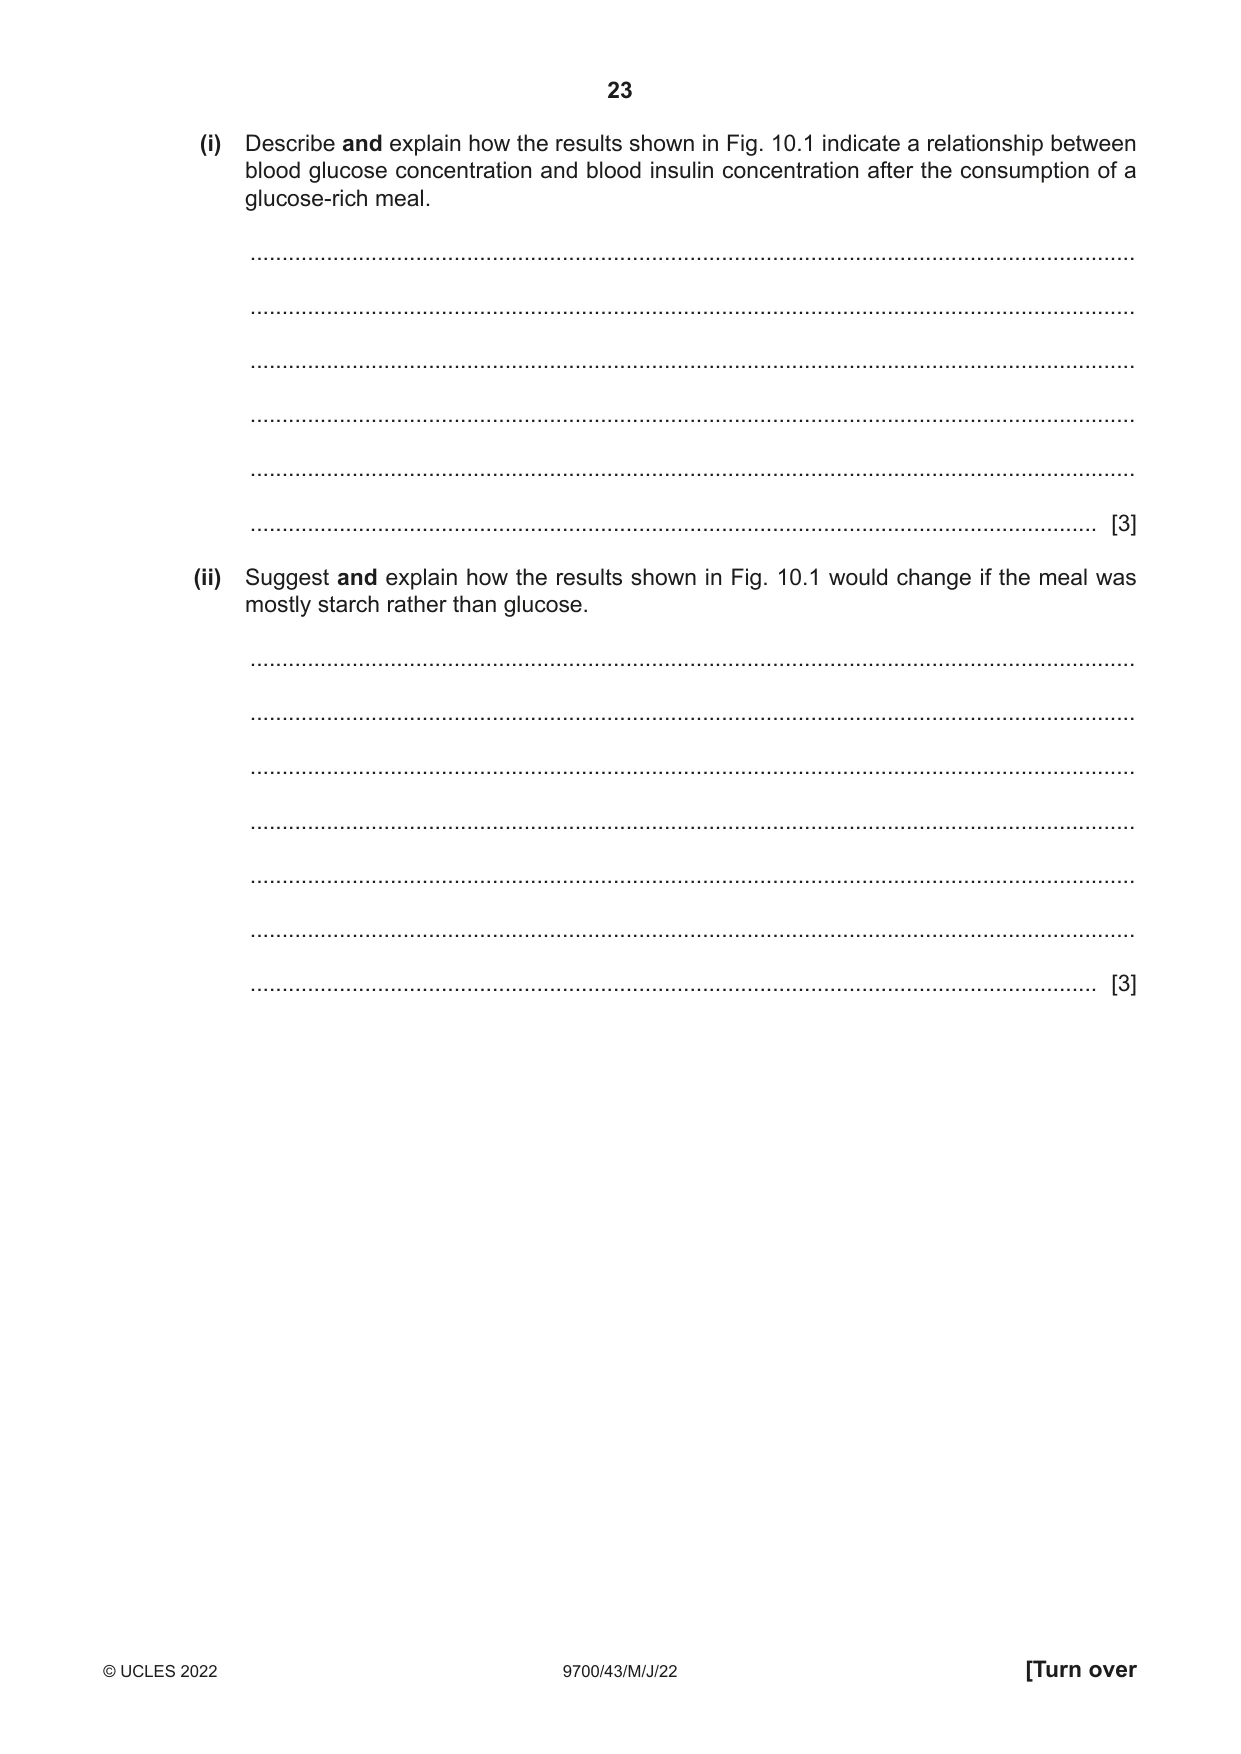
10 (a) Insulin has an important role in the maintenance of blood glucose concentration. An investigation measured how blood glucose concentration and blood insulin concentration changed after a glucose-rich meal had been eaten. The results are shown in Fig. 10.1. 7.5 300 7.0 280 6.5 260 6.0 240 5.5 220 5.0 200 4.5 180 blood glucose 4.0 160 blood insulin concentration concentration / mmol dm–3 / pmol dm–3 3.5 140 3.0 120 2.5 100 2.0 80 1.5 60 1.0 40 0.5 20 0.0 0 07.00 08.00 09.00 10.00 11.00 12.00 time of day Key glucose-rich meal eaten blood glucose concentration blood insulin concentration Fig. 10.1 (i) Describe and explain how the results shown in Fig. 10.1 indicate a relationship between blood glucose concentration and blood insulin concentration after the consumption of a glucose-rich meal. ........................................................................................................................................... ........................................................................................................................................... ........................................................................................................................................... ........................................................................................................................................... ........................................................................................................................................... ..................................................................................................................................... [3] (ii) Suggest and explain how the results shown in Fig. 10.1 would change if the meal was mostly starch rather than glucose. ........................................................................................................................................... ........................................................................................................................................... ........................................................................................................................................... ........................................................................................................................................... ........................................................................................................................................... ........................................................................................................................................... ..................................................................................................................................... [3] (b) Glucagon is synthesised by cells in the pancreas known as alpha (α) cells. Glucagon binds to G-protein-coupled receptors in the cell surface membrane of liver cells. This results in the activation of G-proteins. Outline the sequence of events occurring within the cell after the activation of G-proteins that helps to restore the blood glucose concentration to its set point. ................................................................................................................................................... ................................................................................................................................................... ................................................................................................................................................... ................................................................................................................................................... ................................................................................................................................................... ................................................................................................................................................... ................................................................................................................................................... ................................................................................................................................................... ................................................................................................................................................... ............................................................................................................................................. [4] [Total: 10] The boundaries and names shown, the designations used and the presentation of material on any maps contained in this question paper/insert do not imply official endorsement or acceptance by Cambridge Assessment International Education concerning the legal status of any country, territory, or area or any of its authorities, or of the delimitation of its frontiers or boundaries.
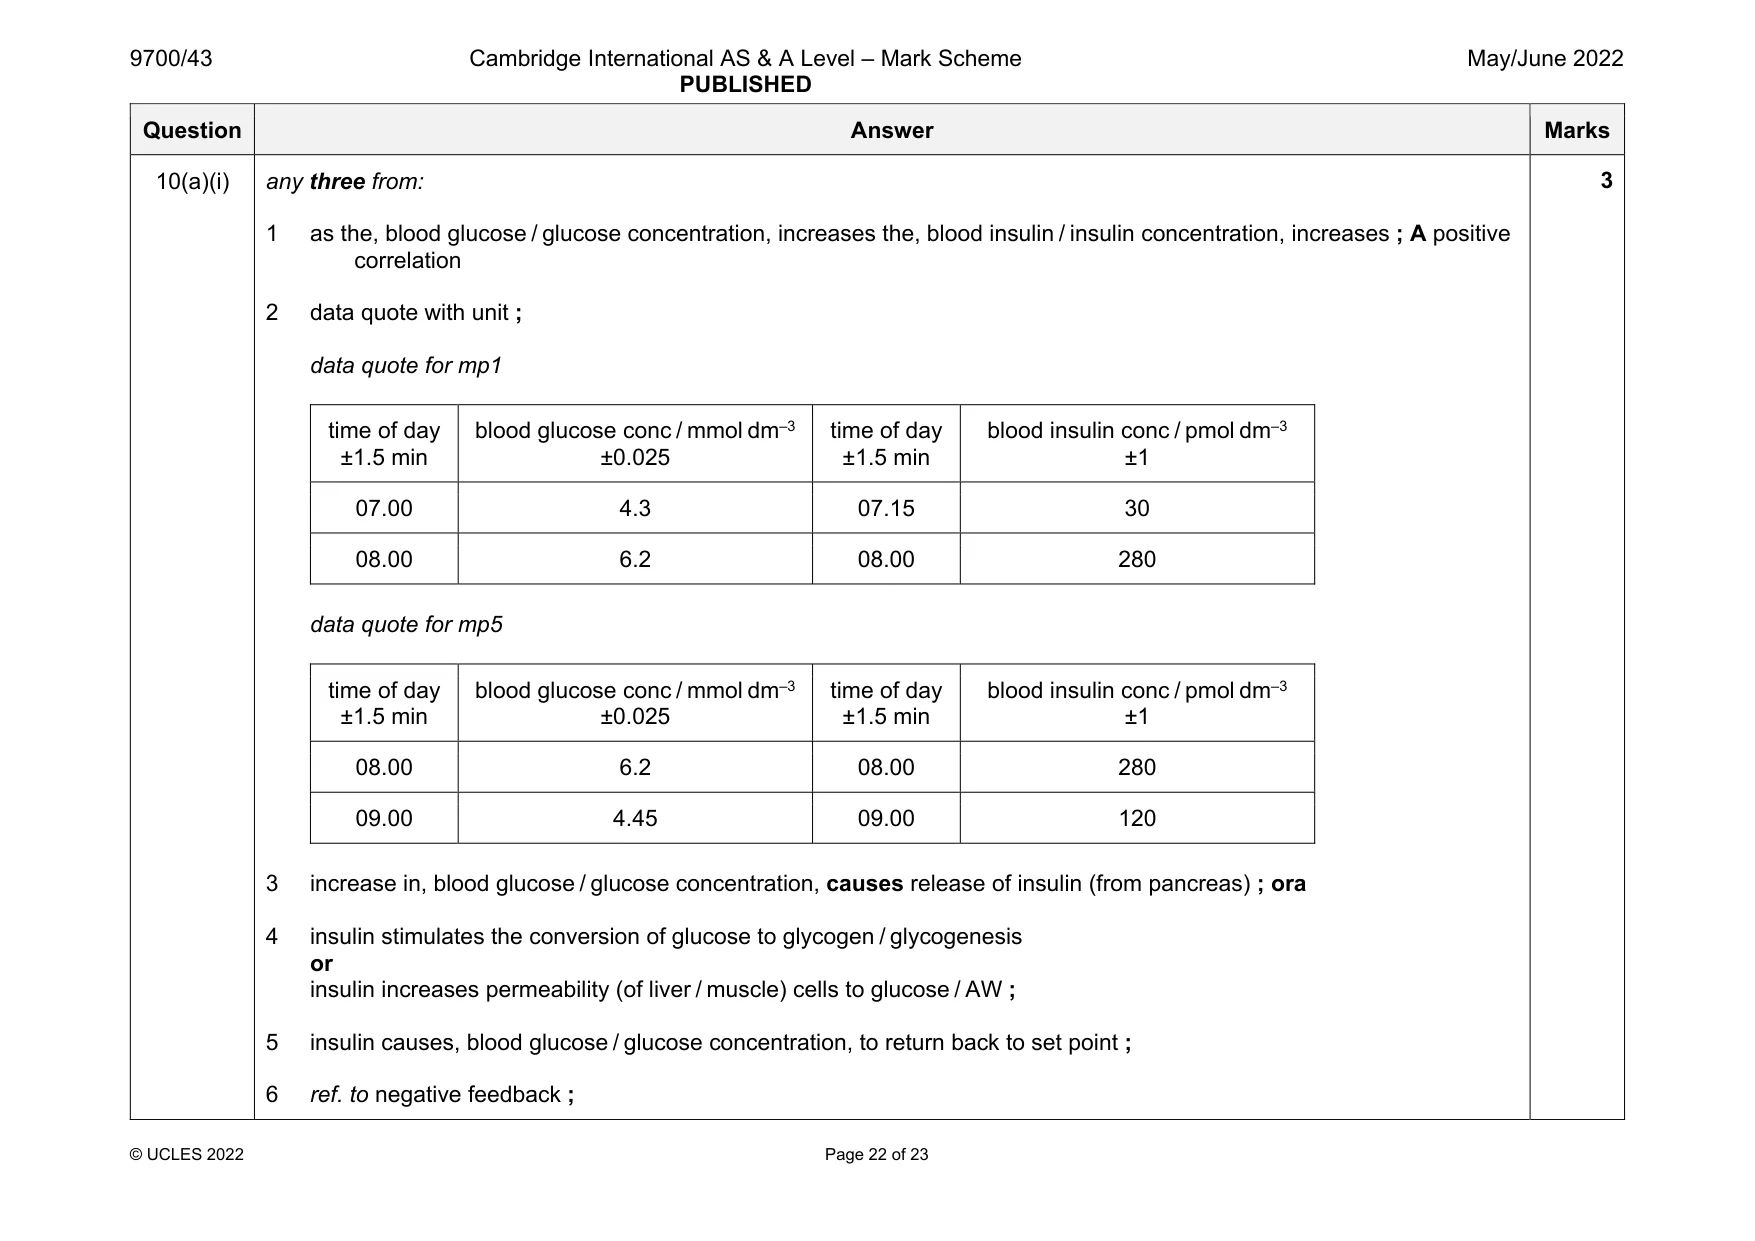
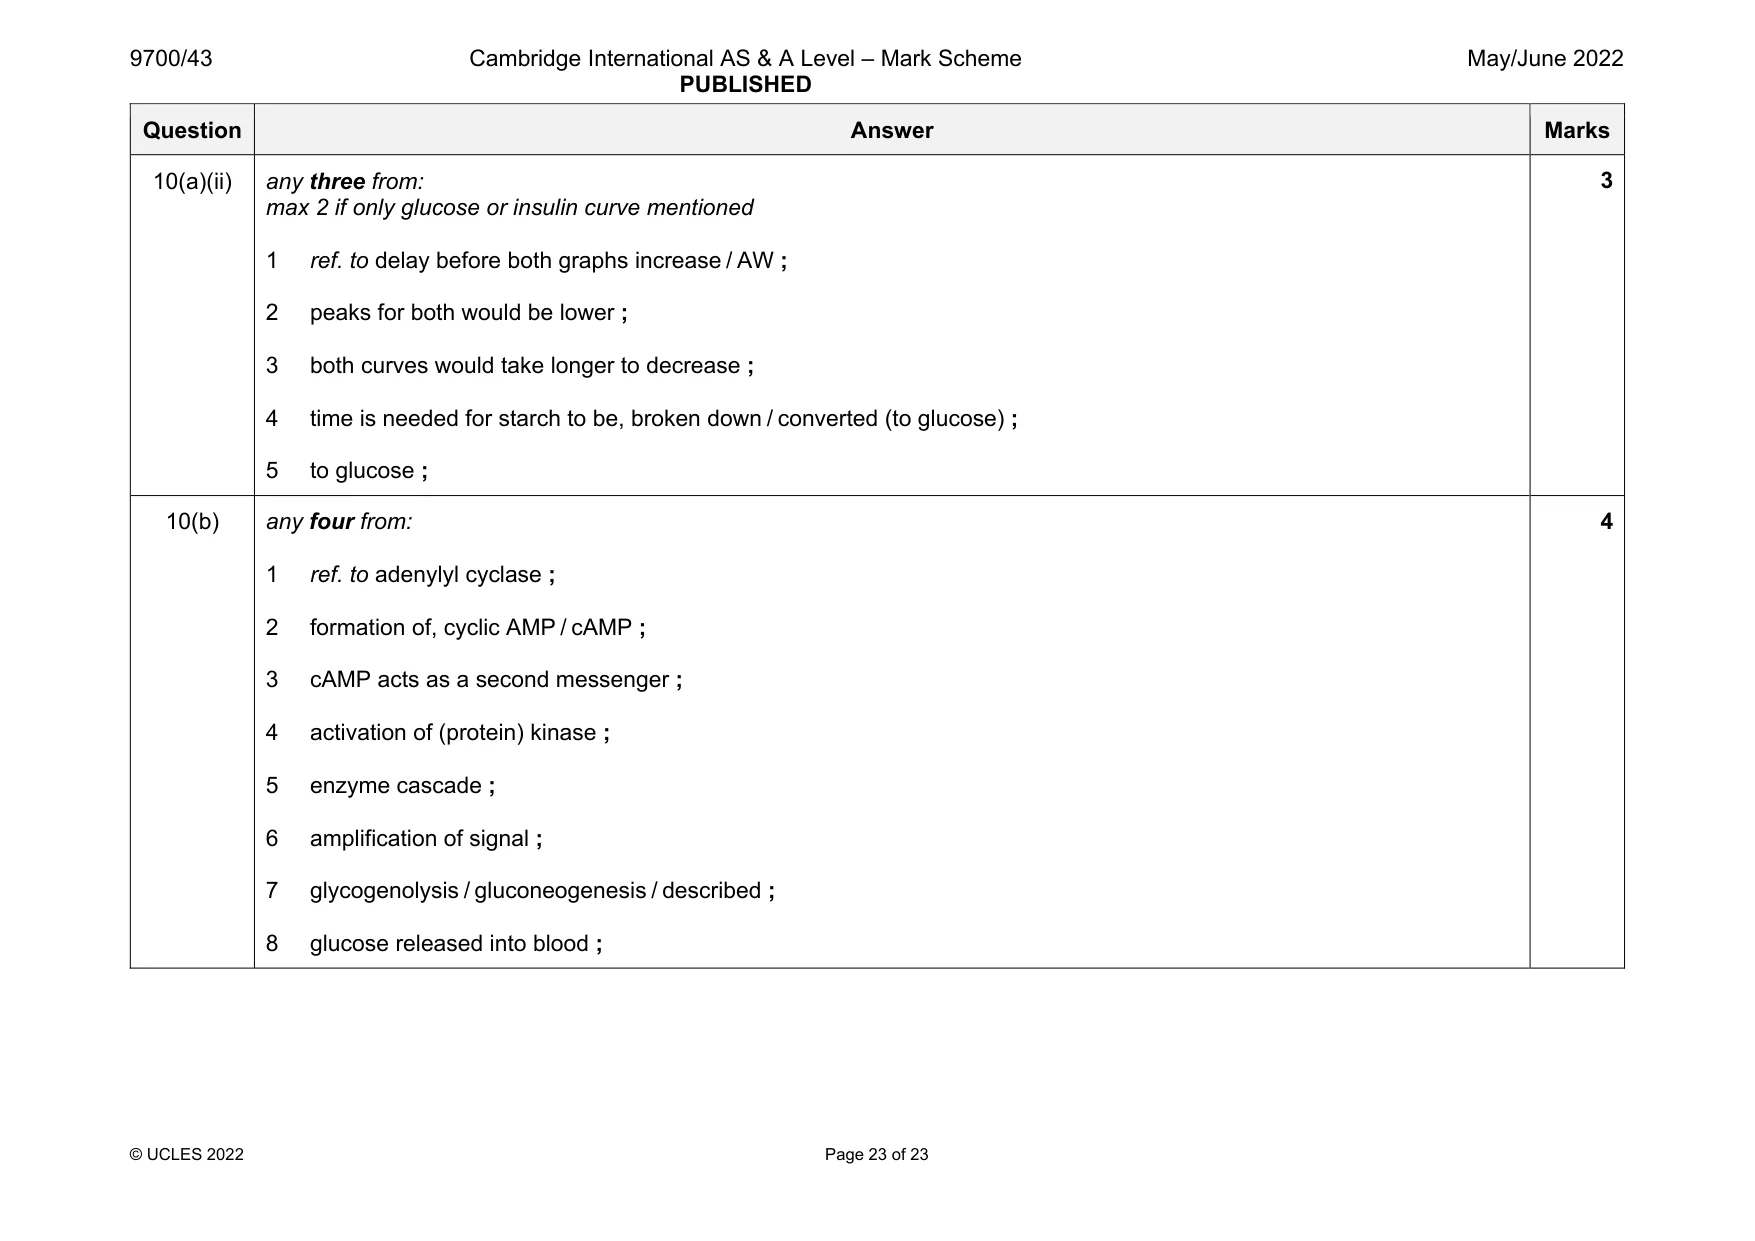
Mark scheme: 10(a)(i) any three from: 1 as the, blood glucose / glucose concentration, increases the, blood insulin / insulin concentration, increases ; A positive correlation 2 data quote with unit ; data quote for mp1 time of day ±1.5 min blood glucose conc / mmol dm–3 ±0.025 time of day ±1.5 min blood insulin conc / pmol dm–3 ±1 07.00 4.3 07.15 30 08.00 6.2 08.00 280 data quote for mp5 time of day ±1.5 min blood glucose conc / mmol dm–3 ±0.025 time of day ±1.5 min blood insulin conc / pmol dm–3 ±1 08.00 6.2 08.00 280 09.00 4.45 09.00 120 3 increase in, blood glucose / glucose concentration, causes release of insulin (from pancreas) ; ora 4 insulin stimulates the conversion of glucose to glycogen / glycogenesis or insulin increases permeability (of liver / muscle) cells to glucose / AW ; 5 insulin causes, blood glucose / glucose concentration, to return back to set point ; 6 ref. to negative feedback ; Question Answer Marks 10(a)(ii) any three from: max 2 if only glucose or insulin curve mentioned 1 ref. to delay before both graphs increase / AW ; 2 peaks for both would be lower ; 3 both curves would take longer to decrease ; 4 time is needed for starch to be, broken down / converted (to glucose) ; 5 to glucose ; 3 10(b) any four from: 1 ref. to adenylyl cyclase ; 2 formation of, cyclic AMP / cAMP ; 3 cAMP acts as a second messenger ; 4 activation of (protein) kinase ; 5 enzyme cascade ; 6 amplification of signal ; 7 glycogenolysis / gluconeogenesis / described ; 8 glucose released into blood ; 4
What was in this paper
The subtopics covered by these 10 questions, and how many questions each got. Open one in a new tab to see every Cambridge question on it.
What you needed in this session
Cambridge’s own grade thresholds for 2022 May/June, Paper 4 · Variant 3. A higher threshold means an easier paper — the bar moves with how the cohort did.