Cambridge A Level Biology 9700 — 2021 May/June Paper 4 · Variant 3
9700/43/M/J/21 · 10 questions · 100 marks · ≈113 min
The question paper and its mark scheme, free to read here and free to download. This is Cambridge’s own paper, exactly as it was sat.
Question paper24 pages


Mark scheme22 pages
Answers below. Sit the paper first if you are practising.
Questions as text
Q1 · A diagram of a part of a sarcomere in striated muscle
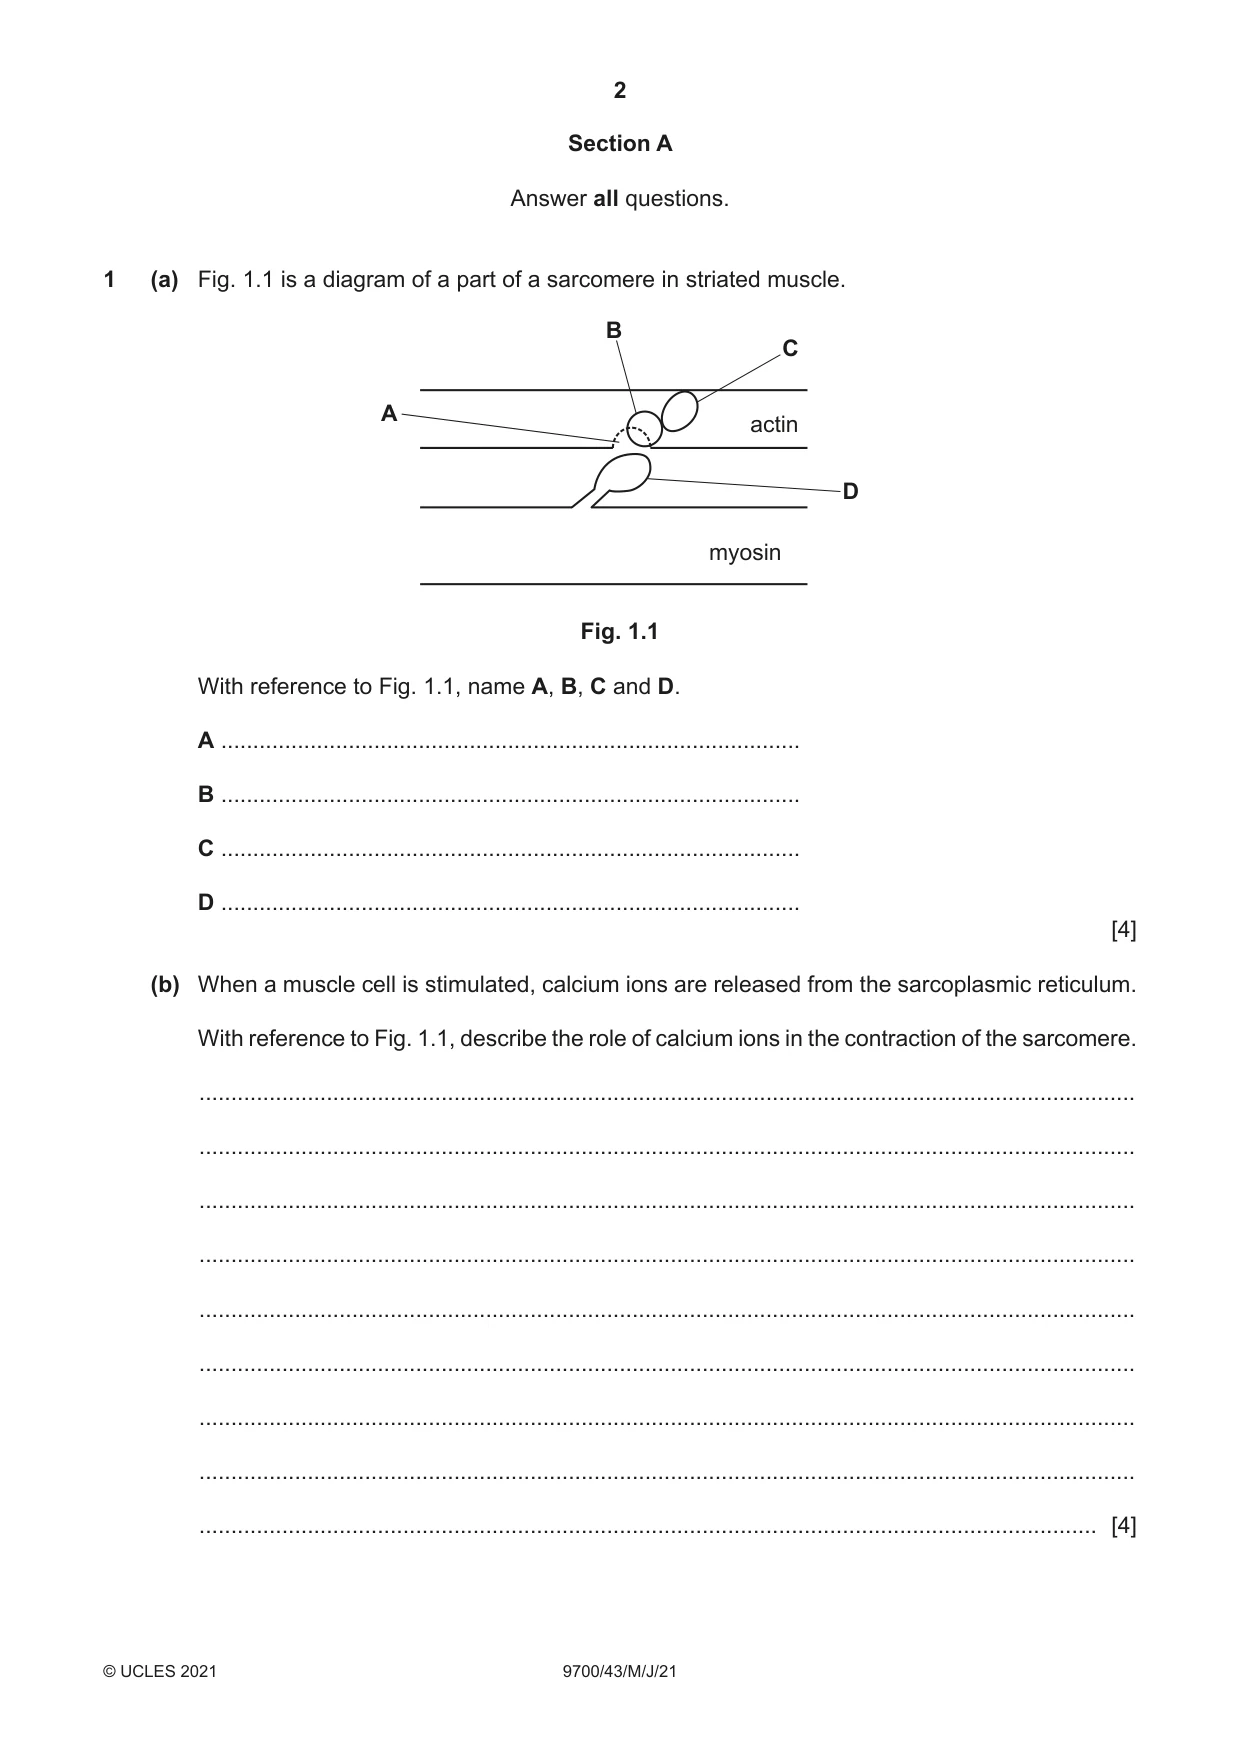
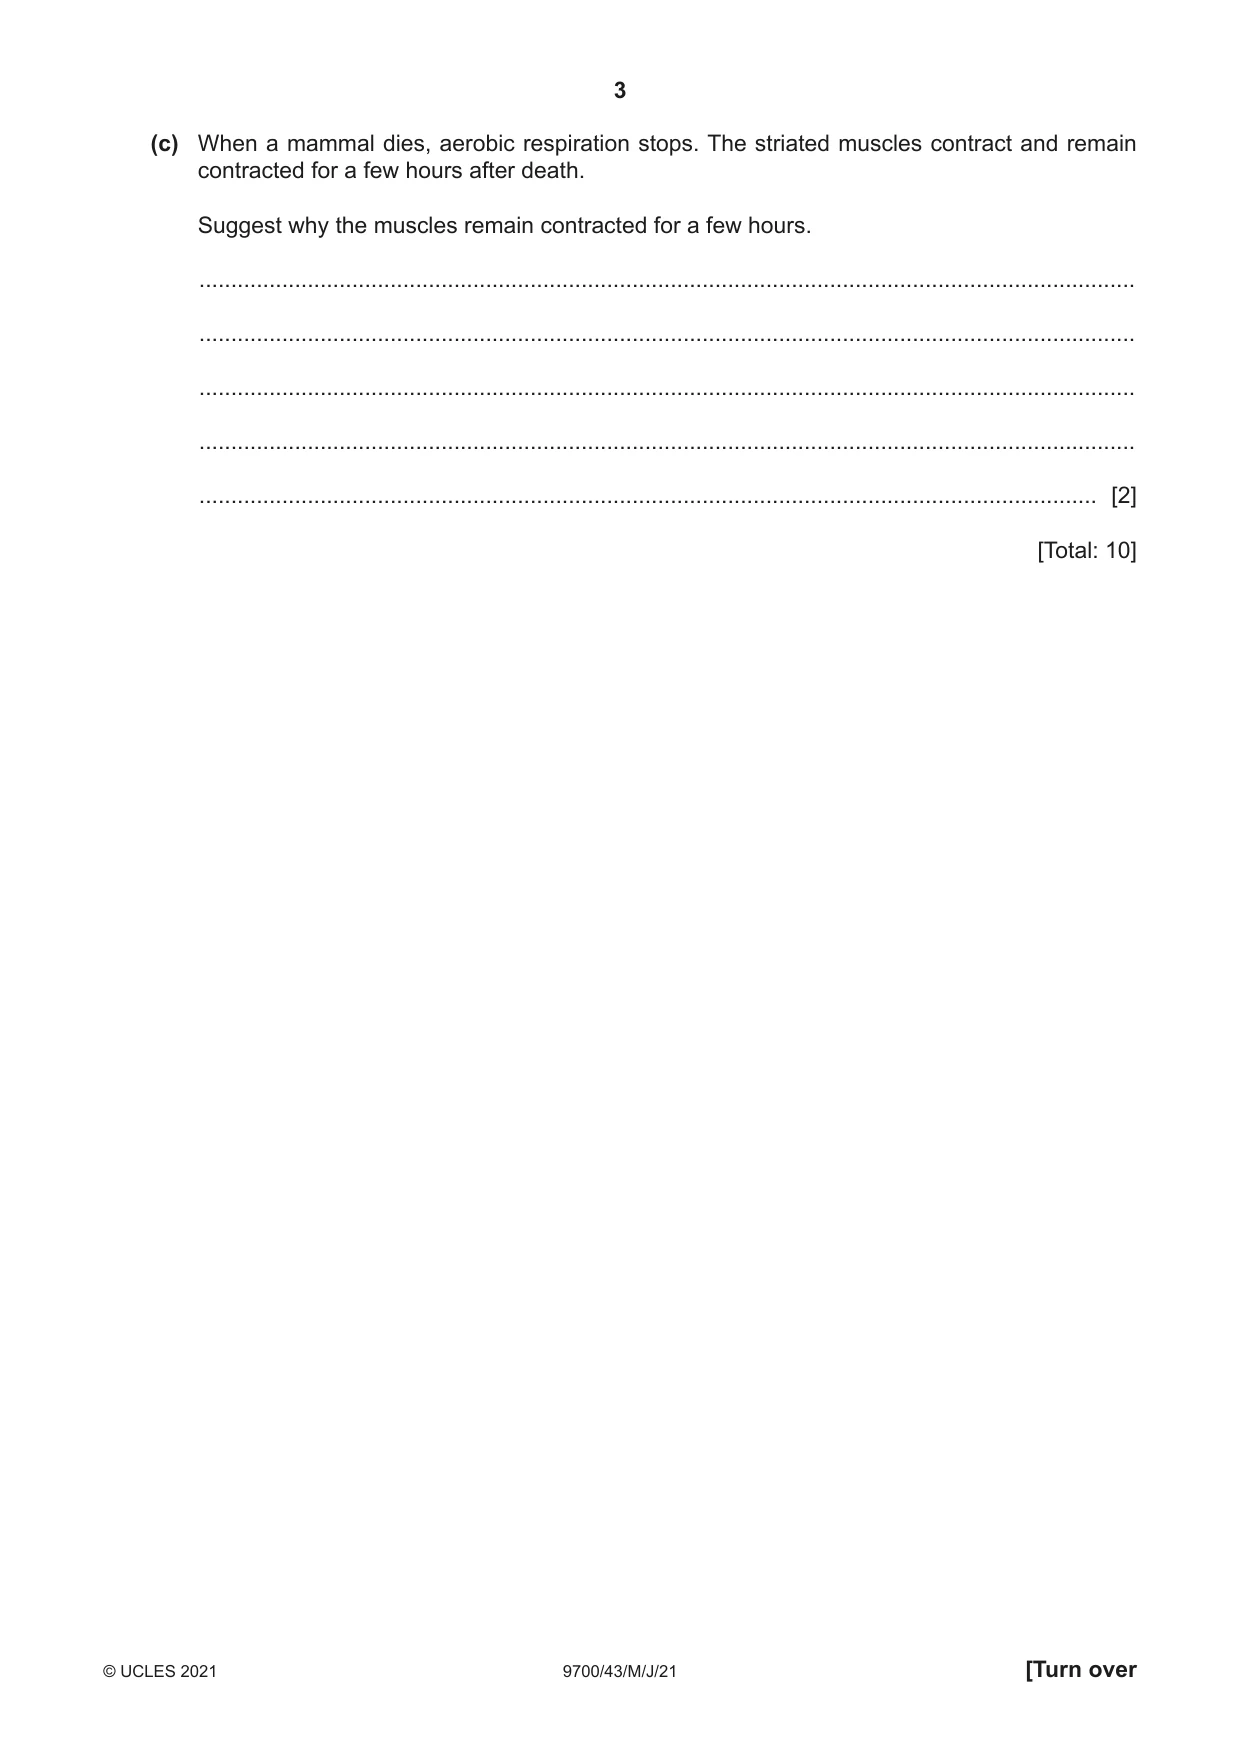
1 (a) Fig. 1.1 is a diagram of a part of a sarcomere in striated muscle. B C A actin D myosin Fig. 1.1 With reference to Fig. 1.1, name A, B, C and D. A ........................................................................................... B ........................................................................................... C ........................................................................................... D ........................................................................................... [4] (b) When a muscle cell is stimulated, calcium ions are released from the sarcoplasmic reticulum. With reference to Fig. 1.1, describe the role of calcium ions in the contraction of the sarcomere. ................................................................................................................................................... ................................................................................................................................................... ................................................................................................................................................... ................................................................................................................................................... ................................................................................................................................................... ................................................................................................................................................... ................................................................................................................................................... ................................................................................................................................................... ............................................................................................................................................. [4] (c) When a mammal dies, aerobic respiration stops. The striated muscles contract and remain contracted for a few hours after death. Suggest why the muscles remain contracted for a few hours. ................................................................................................................................................... ................................................................................................................................................... ................................................................................................................................................... ................................................................................................................................................... ............................................................................................................................................. [2] [Total: 10]
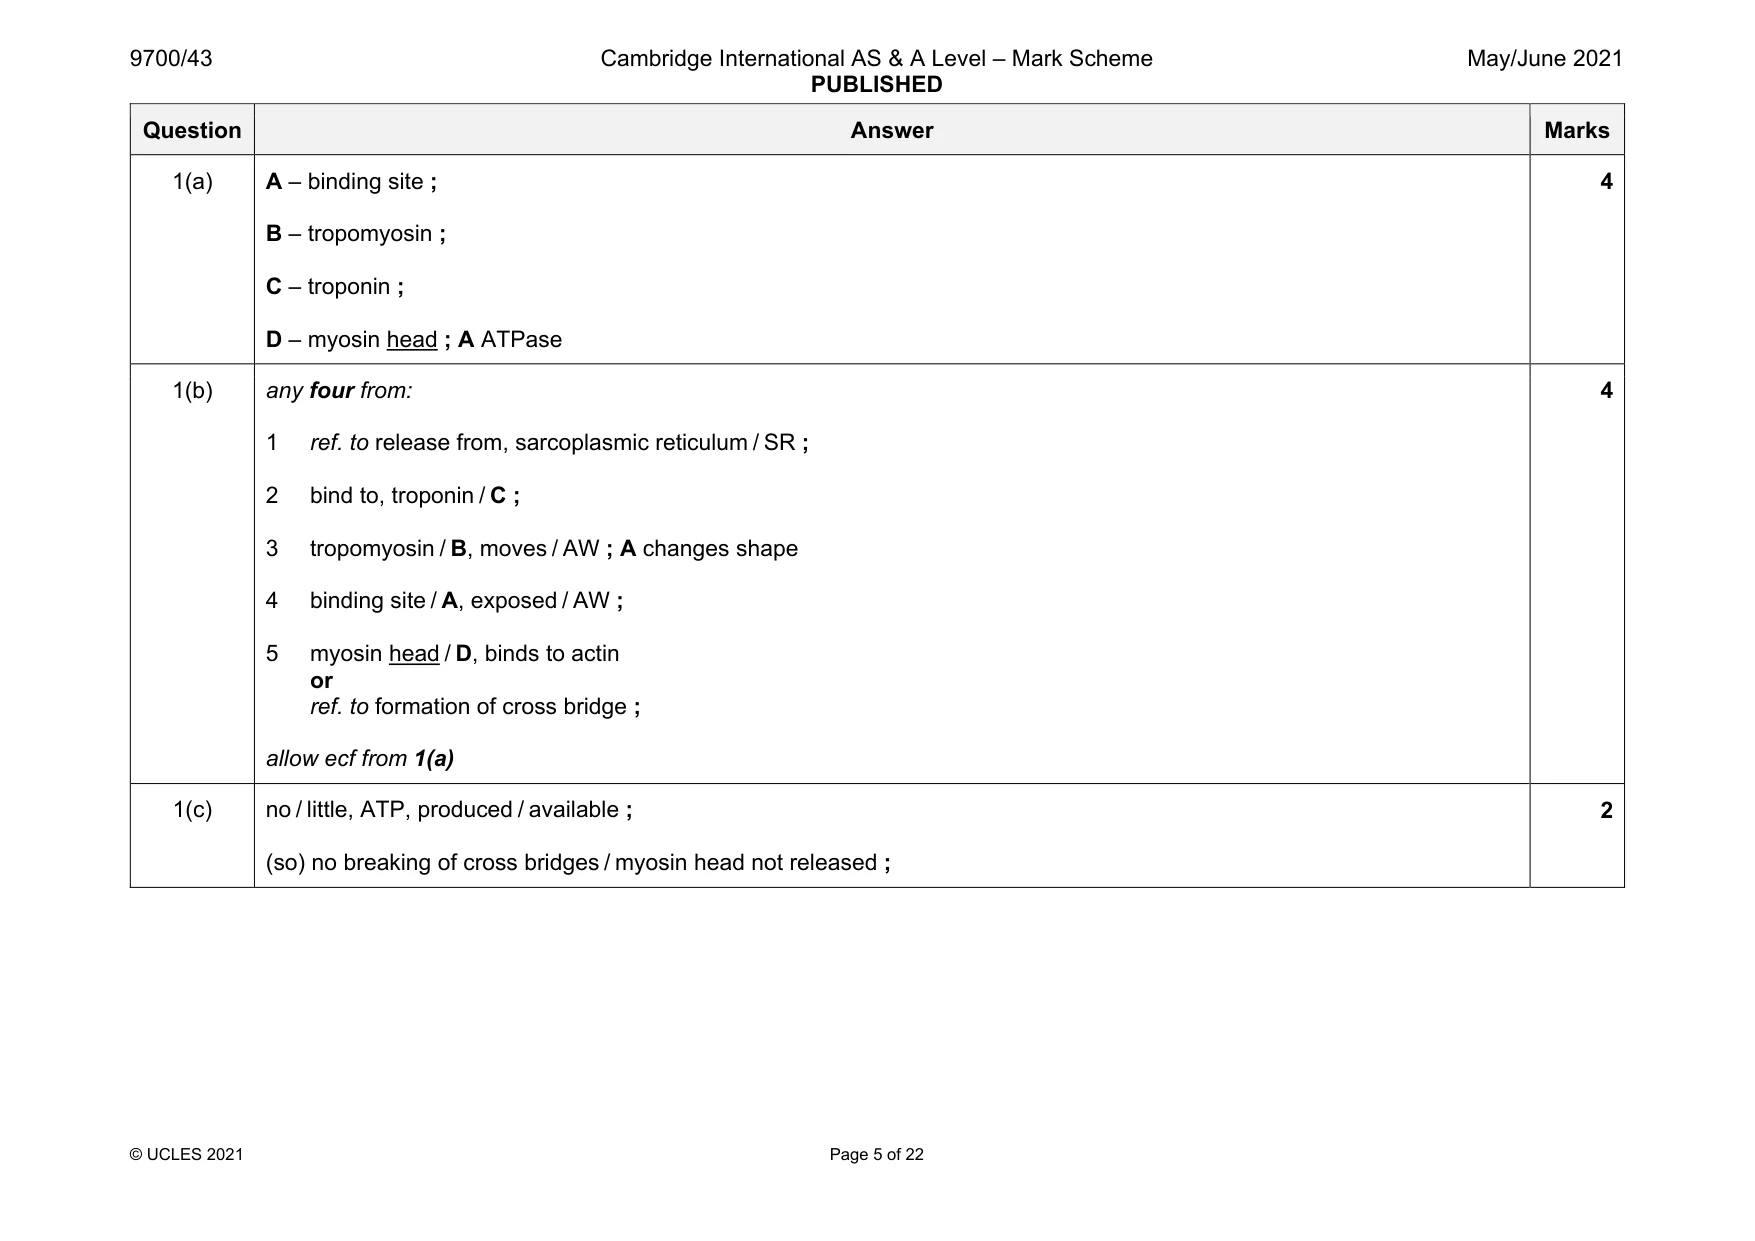
Mark scheme: 1(a) A – binding site ; B – tropomyosin ; C – troponin ; D – myosin head ; A ATPase 4 1(b) any four from: 1 ref. to release from, sarcoplasmic reticulum / SR ; 2 bind to, troponin / C ; 3 tropomyosin / B, moves / AW ; A changes shape 4 binding site / A, exposed / AW ; 5 myosin head / D, binds to actin or ref. to formation of cross bridge ; allow ecf from 1(a) 4 1(c) no / little, ATP, produced / available ; (so) no breaking of cross bridges / myosin head not released ; 2
Q2 · During respiration, respiratory substrates such as glucose are used as a source of energy…
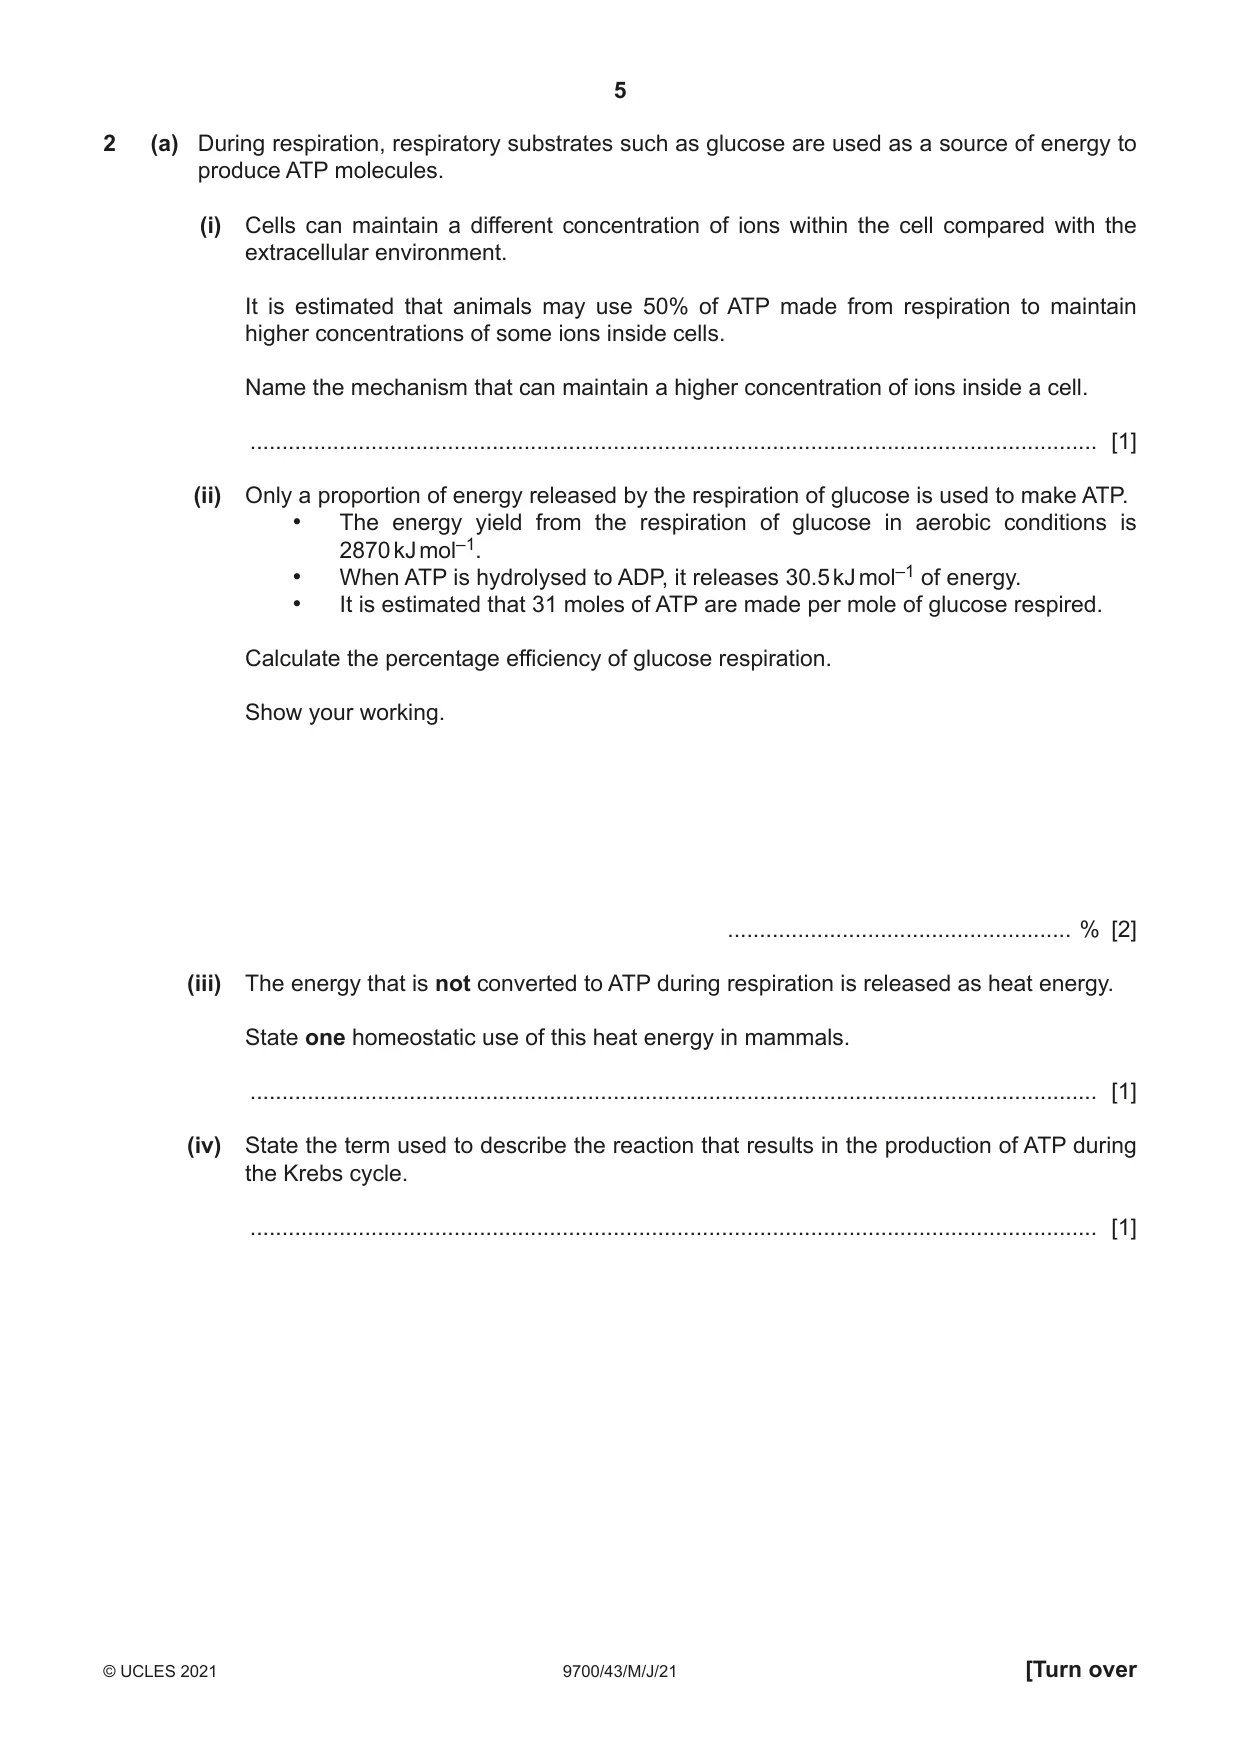
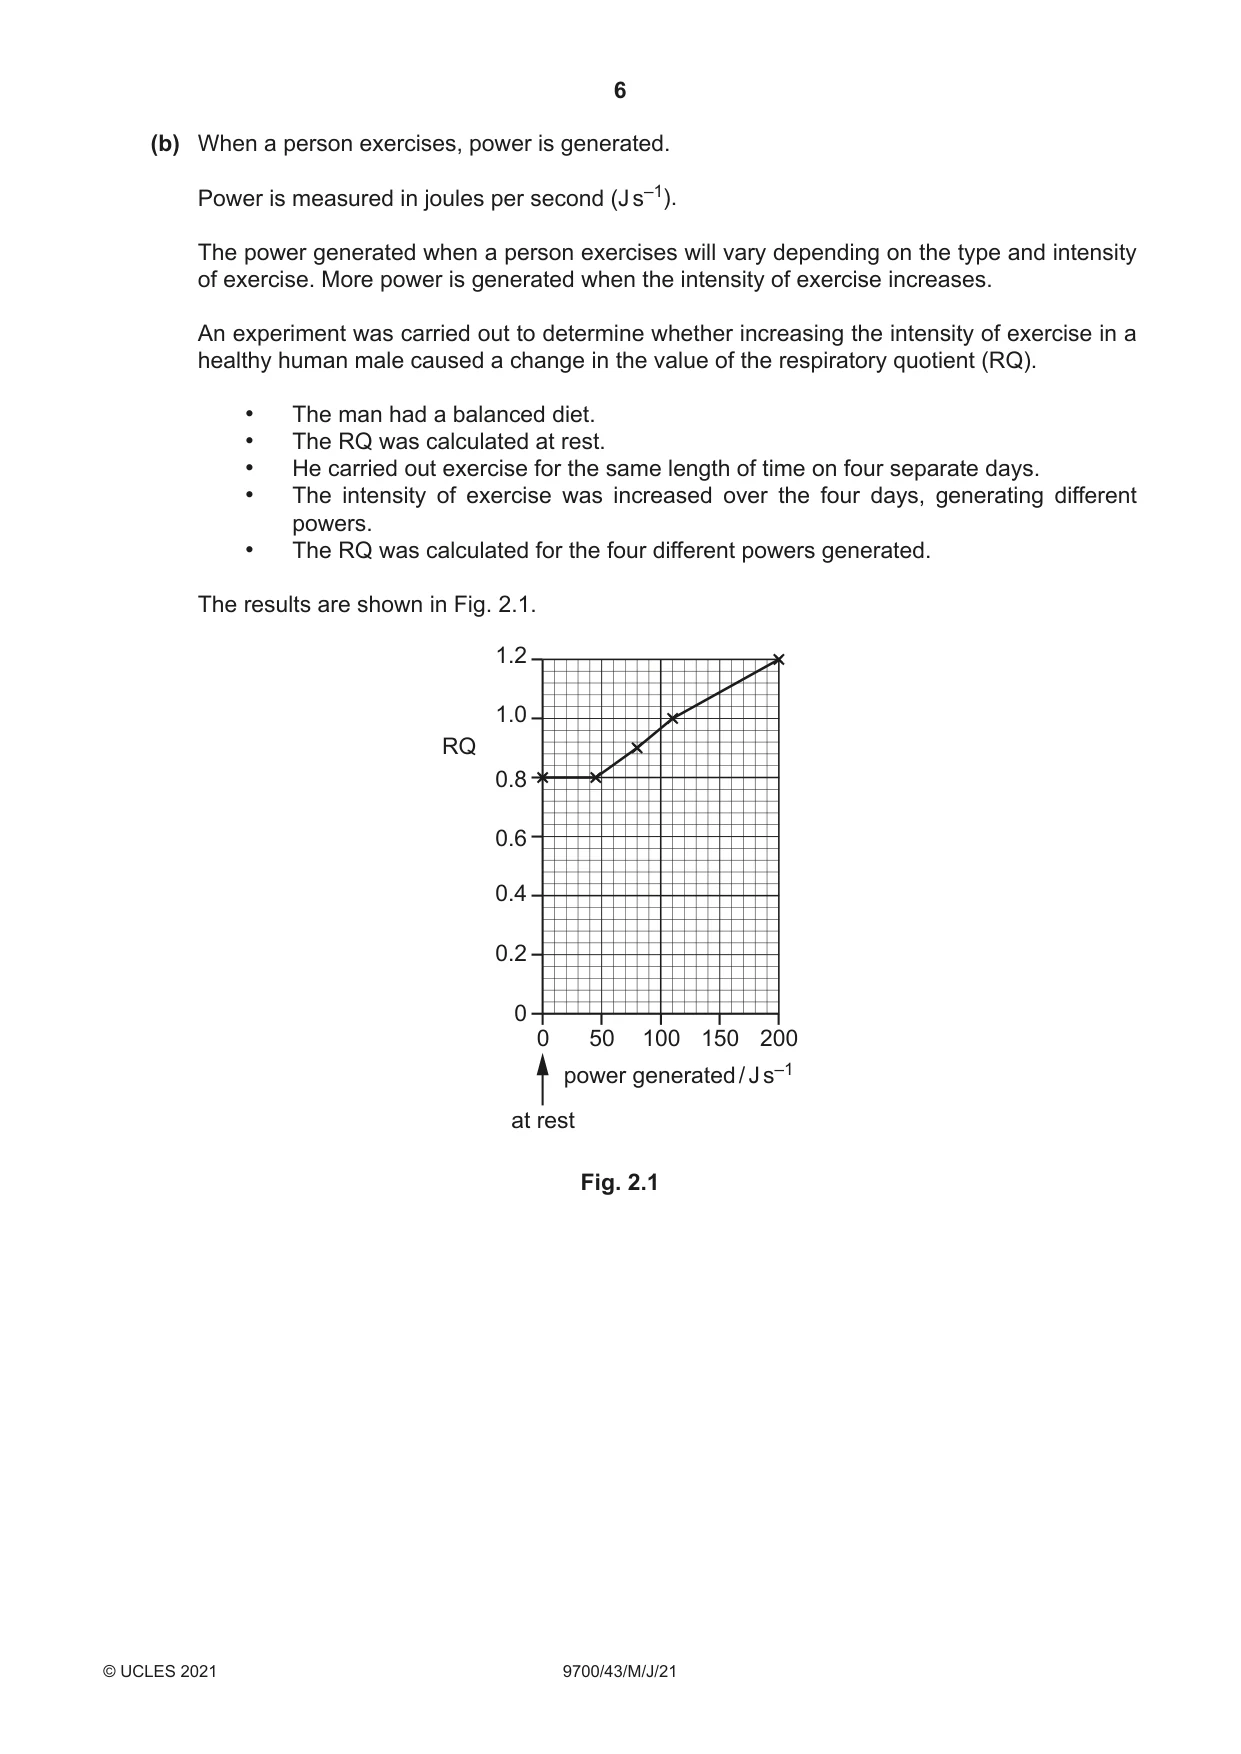
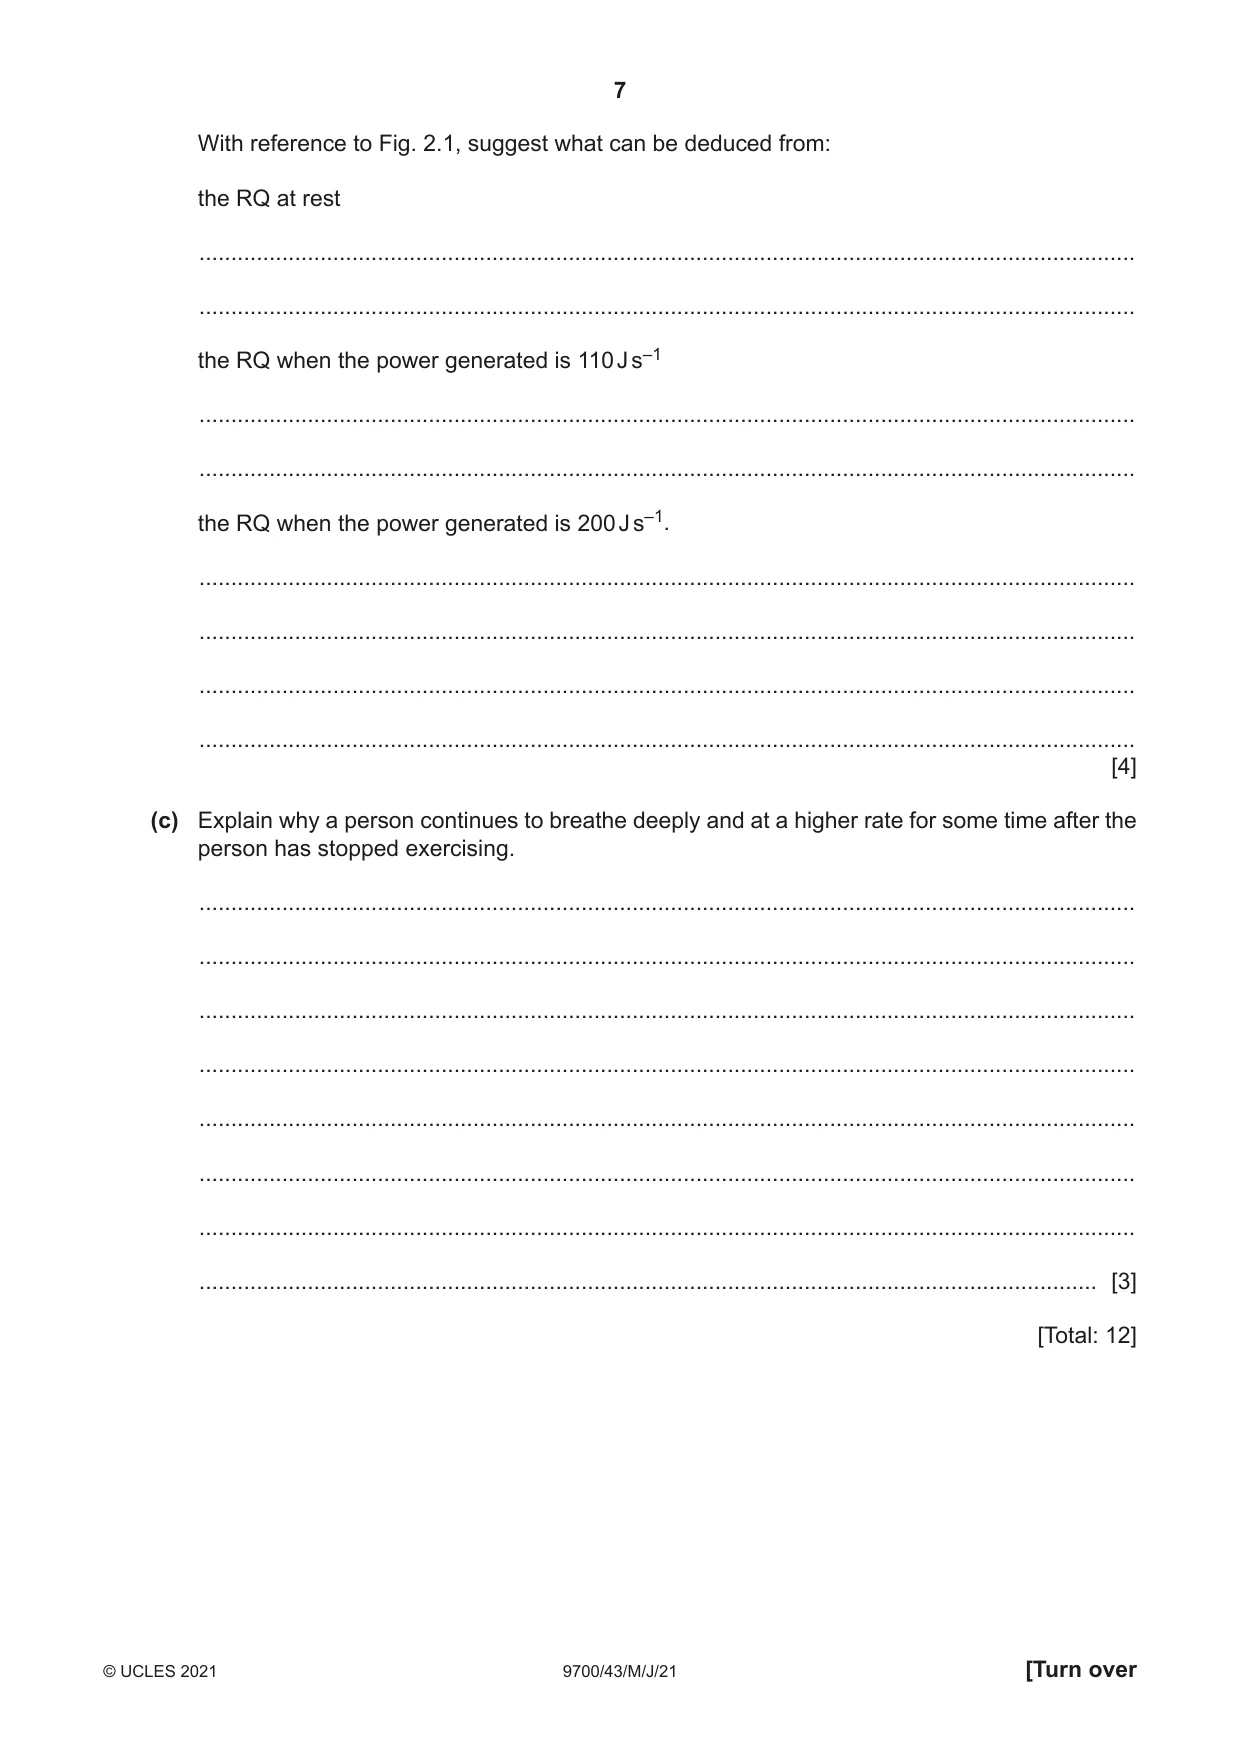
2 (a) During respiration, respiratory substrates such as glucose are used as a source of energy to produce ATP molecules. (i) Cells can maintain a different concentration of ions within the cell compared with the extracellular environment. It is estimated that animals may use 50% of ATP made from respiration to maintain higher concentrations of some ions inside cells. Name the mechanism that can maintain a higher concentration of ions inside a cell. ..................................................................................................................................... [1] (ii) Only a proportion of energy released by the respiration of glucose is used to make ATP. • The energy yield from the respiration of glucose in aerobic conditions is 2870 kJ mol–1. • When ATP is hydrolysed to ADP, it releases 30.5 kJ mol–1 of energy. • It is estimated that 31 moles of ATP are made per mole of glucose respired. Calculate the percentage efficiency of glucose respiration. Show your working. ...................................................... % [2] (iii) The energy that is not converted to ATP during respiration is released as heat energy. State one homeostatic use of this heat energy in mammals. ..................................................................................................................................... [1] (iv) State the term used to describe the reaction that results in the production of ATP during the Krebs cycle. ..................................................................................................................................... [1] (b) When a person exercises, power is generated. Power is measured in joules per second (J s–1). The power generated when a person exercises will vary depending on the type and intensity of exercise. More power is generated when the intensity of exercise increases. An experiment was carried out to determine whether increasing the intensity of exercise in a healthy human male caused a change in the value of the respiratory quotient (RQ). • The man had a balanced diet. • The RQ was calculated at rest. • He carried out exercise for the same length of time on four separate days. • The intensity of exercise was increased over the four days, generating different powers. • The RQ was calculated for the four different powers generated. The results are shown in Fig. 2.1. 1.2 1.0 RQ 0.8 0.6 0.4 0.2 0 0 50 100 150 200 power generated / J s–1 at rest Fig. 2.1 With reference to Fig. 2.1, suggest what can be deduced from: the RQ at rest ................................................................................................................................................... ................................................................................................................................................... the RQ when the power generated is 110 J s–1 ................................................................................................................................................... ................................................................................................................................................... the RQ when the power generated is 200 J s–1. ................................................................................................................................................... ................................................................................................................................................... ................................................................................................................................................... ................................................................................................................................................... [4] (c) Explain why a person continues to breathe deeply and at a higher rate for some time after the person has stopped exercising. ................................................................................................................................................... ................................................................................................................................................... ................................................................................................................................................... ................................................................................................................................................... ................................................................................................................................................... ................................................................................................................................................... ................................................................................................................................................... ............................................................................................................................................. [3] [Total: 12]
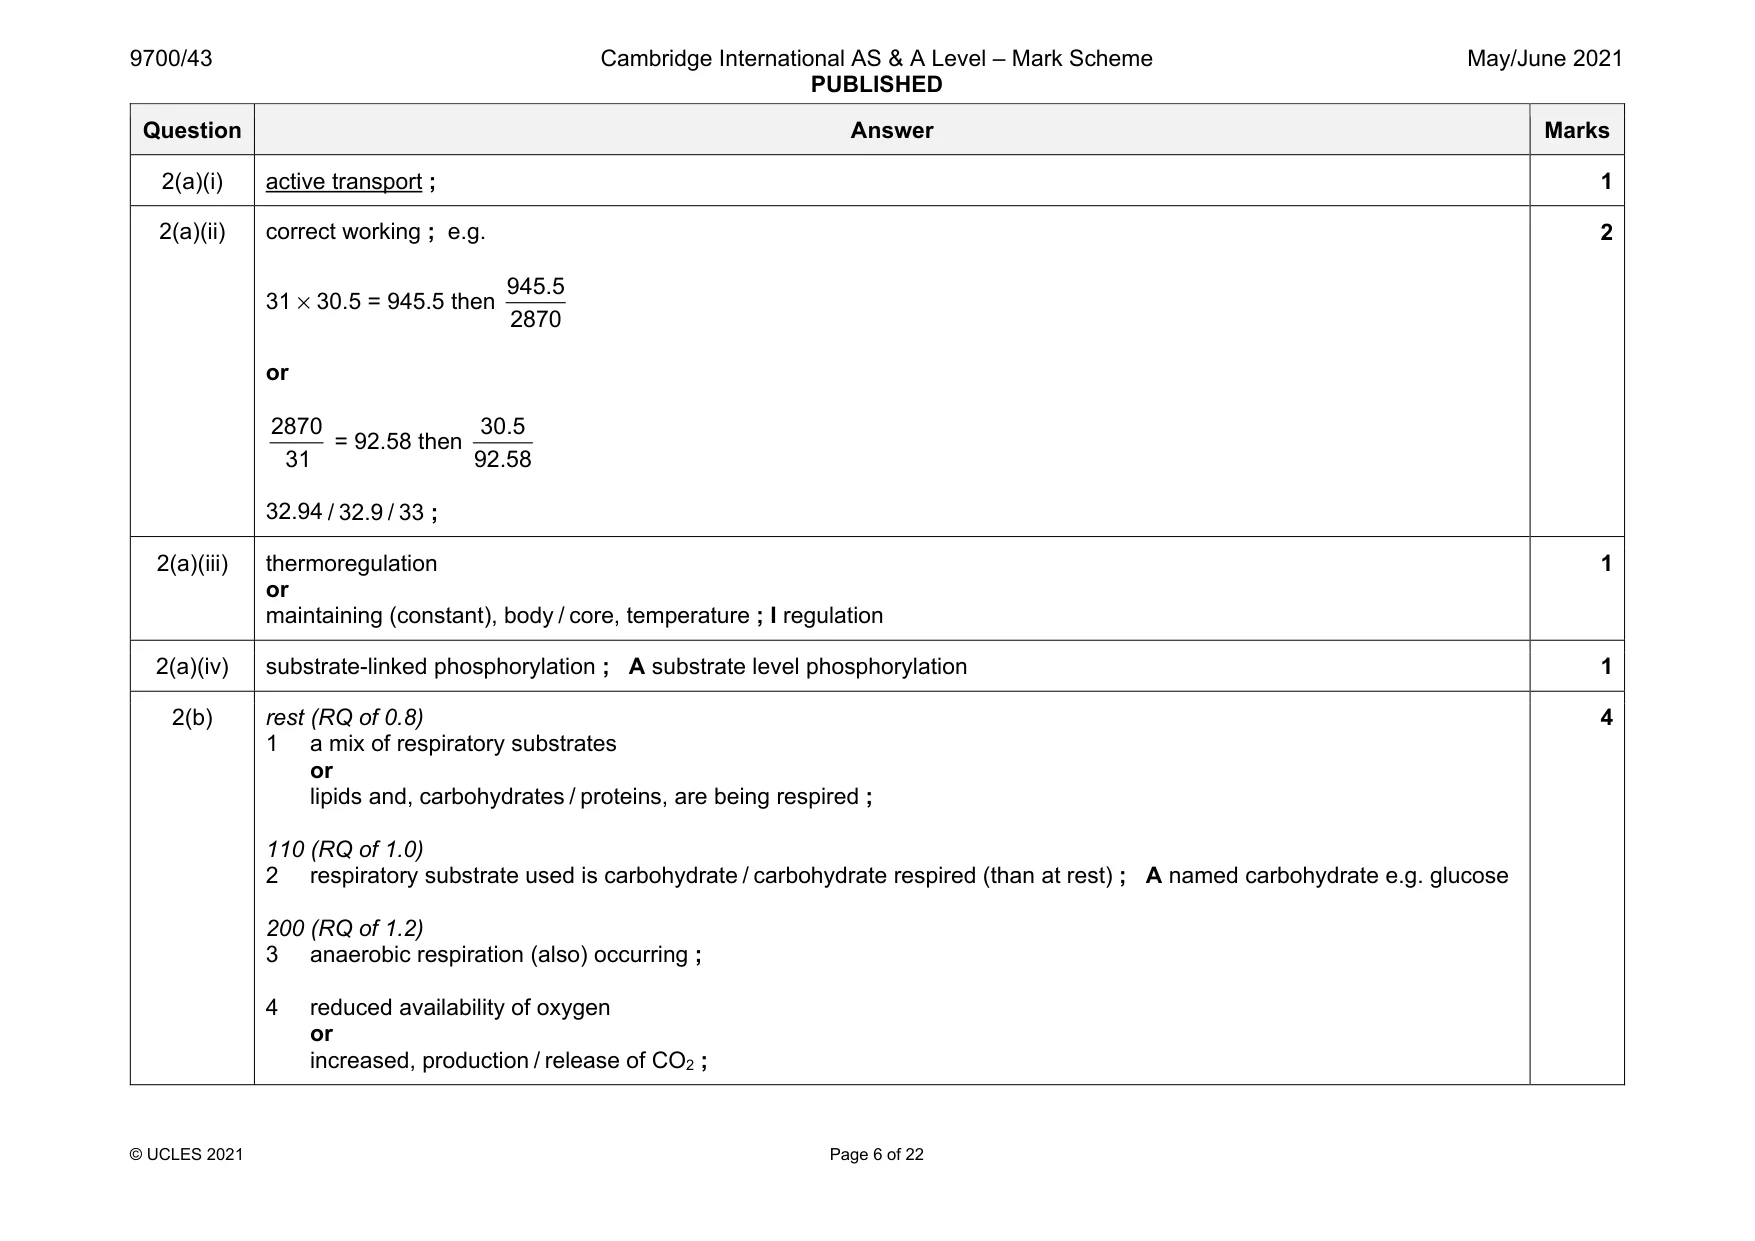
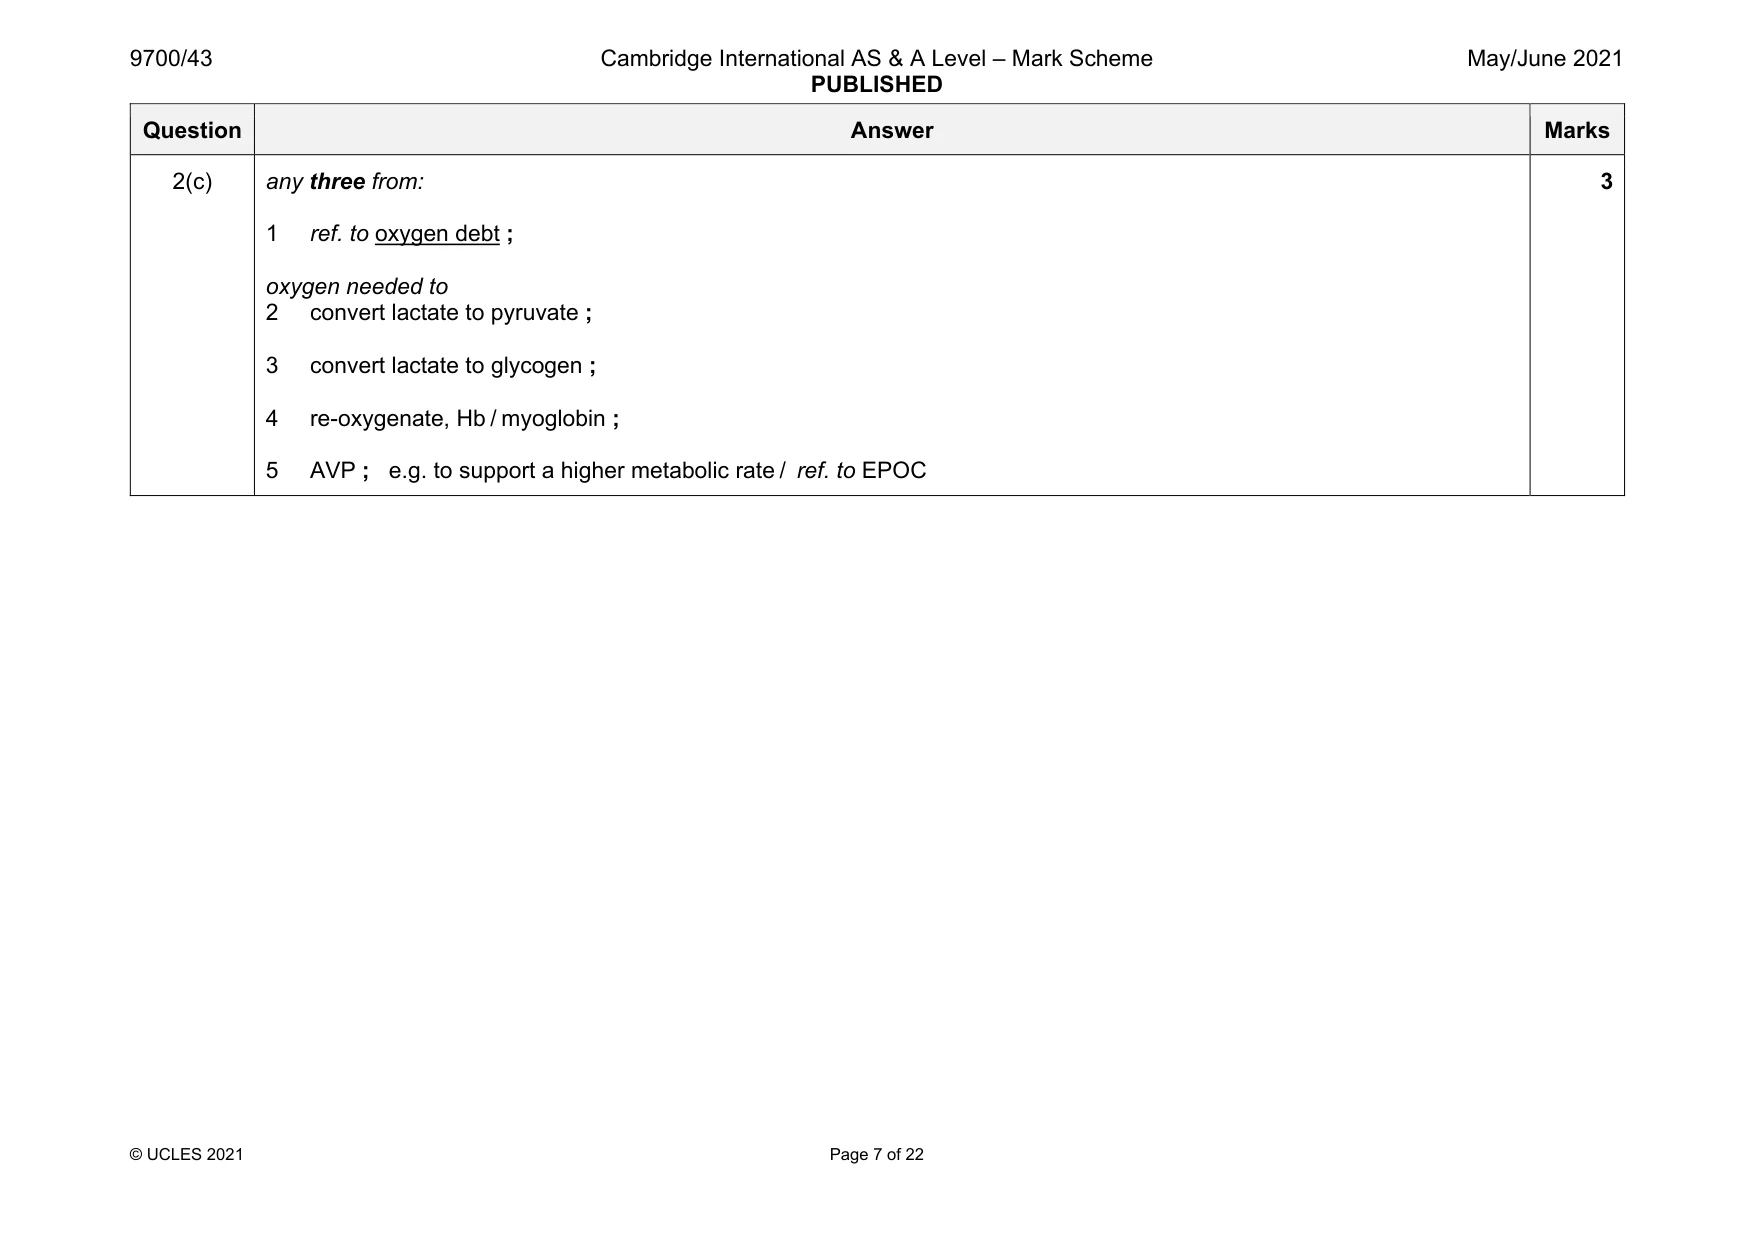
Mark scheme: 2(a)(i) active transport ; 1 2(a)(ii) correct working ; e.g. 31 × 30.5 = 945.5 then 945.5 2870 or 2870 31 = 92.58 then 30.5 92.58 32.94 / 32.9 / 33 ; 2 2(a)(iii) thermoregulation or maintaining (constant), body / core, temperature ; I regulation 1 2(a)(iv) substrate-linked phosphorylation ; A substrate level phosphorylation 1 2(b) rest (RQ of 0.8) 1 a mix of respiratory substrates or lipids and, carbohydrates / proteins, are being respired ; 110 (RQ of 1.0) 2 respiratory substrate used is carbohydrate / carbohydrate respired (than at rest) ; A named carbohydrate e.g. glucose 200 (RQ of 1.2) 3 anaerobic respiration (also) occurring ; 4 reduced availability of oxygen or increased, production / release of CO2 ; 4 Question Answer Marks 2(c) any three from: 1 ref. to oxygen debt ; oxygen needed to 2 convert lactate to pyruvate ; 3 convert lactate to glycogen ; 4 re-oxygenate, Hb / myoglobin ; 5 AVP ; e.g. to support a higher metabolic rate / ref. to EPOC 3
Q3 · Fruit flies of the genus Bactrocera are pests that damage fruit crops
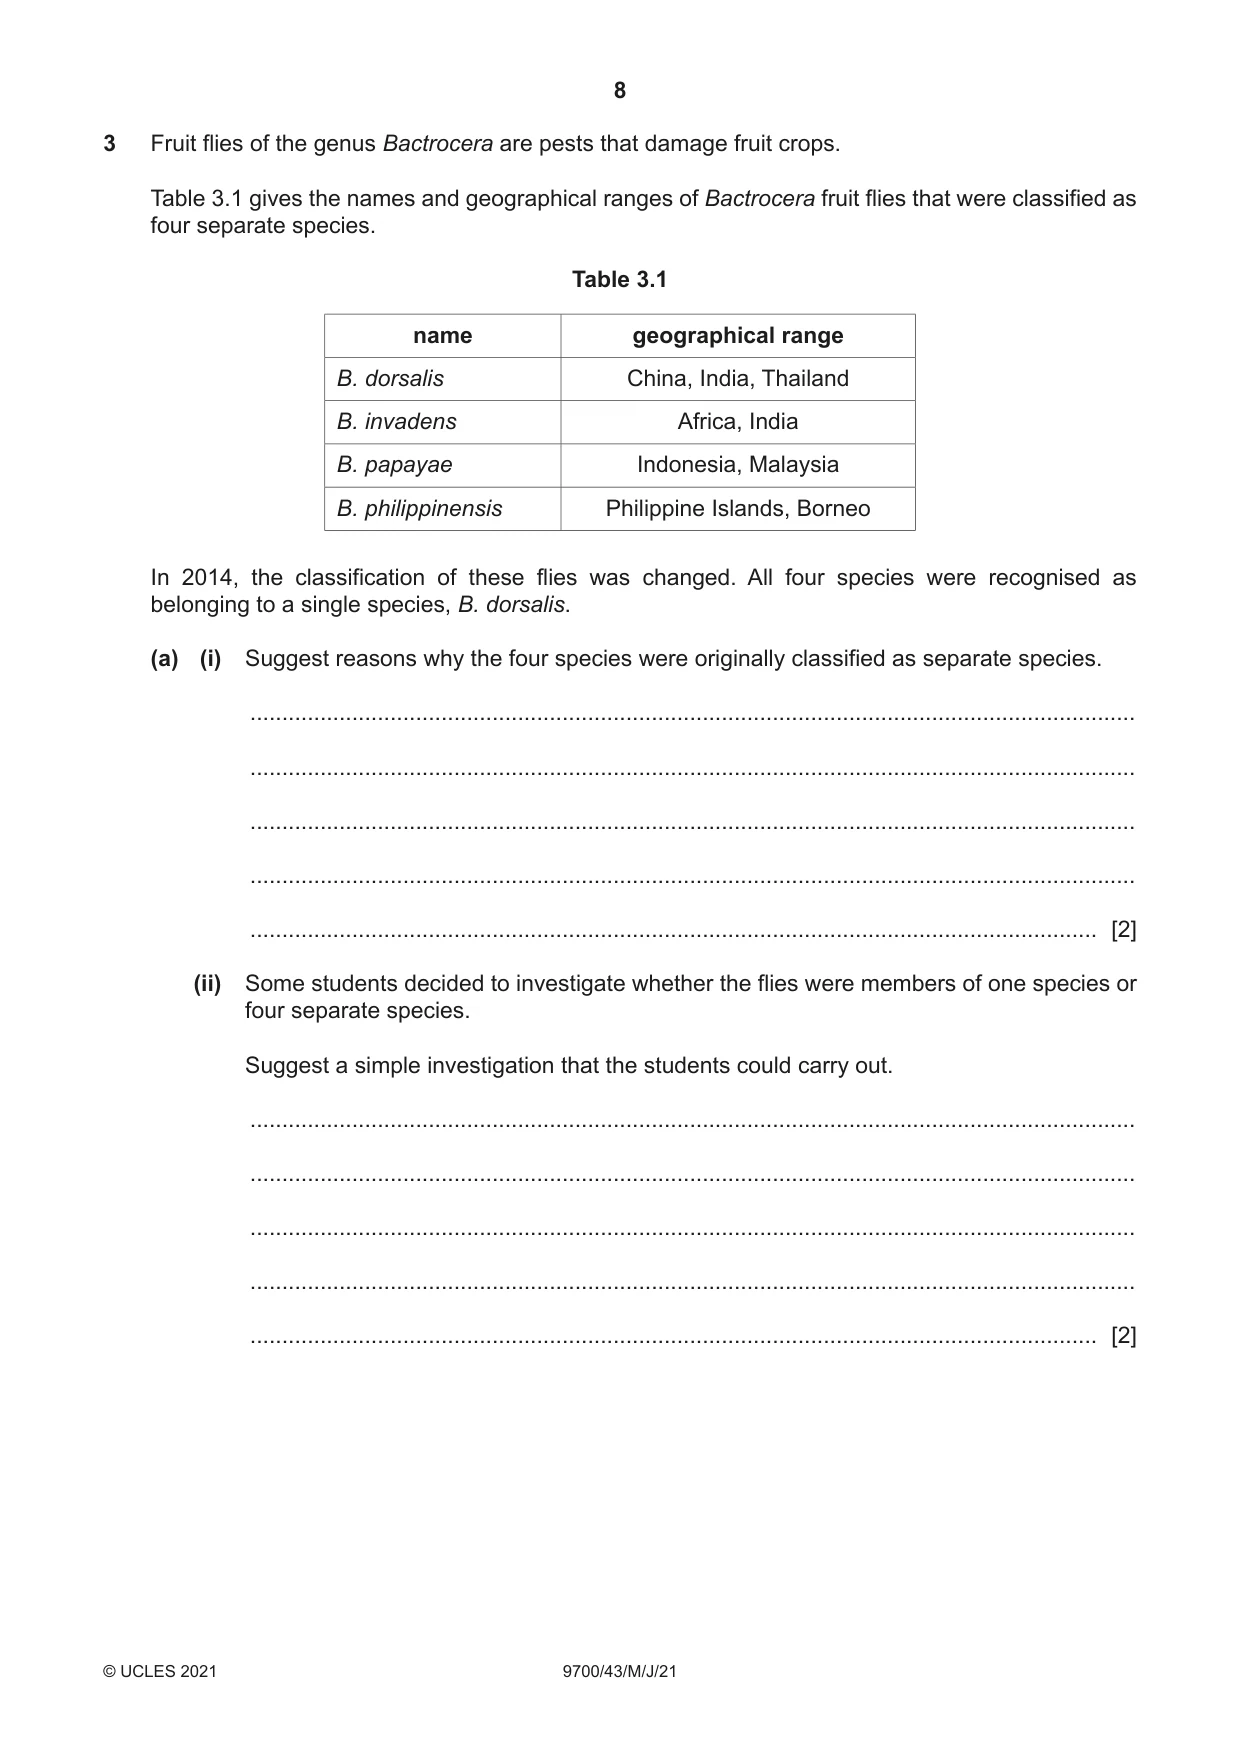
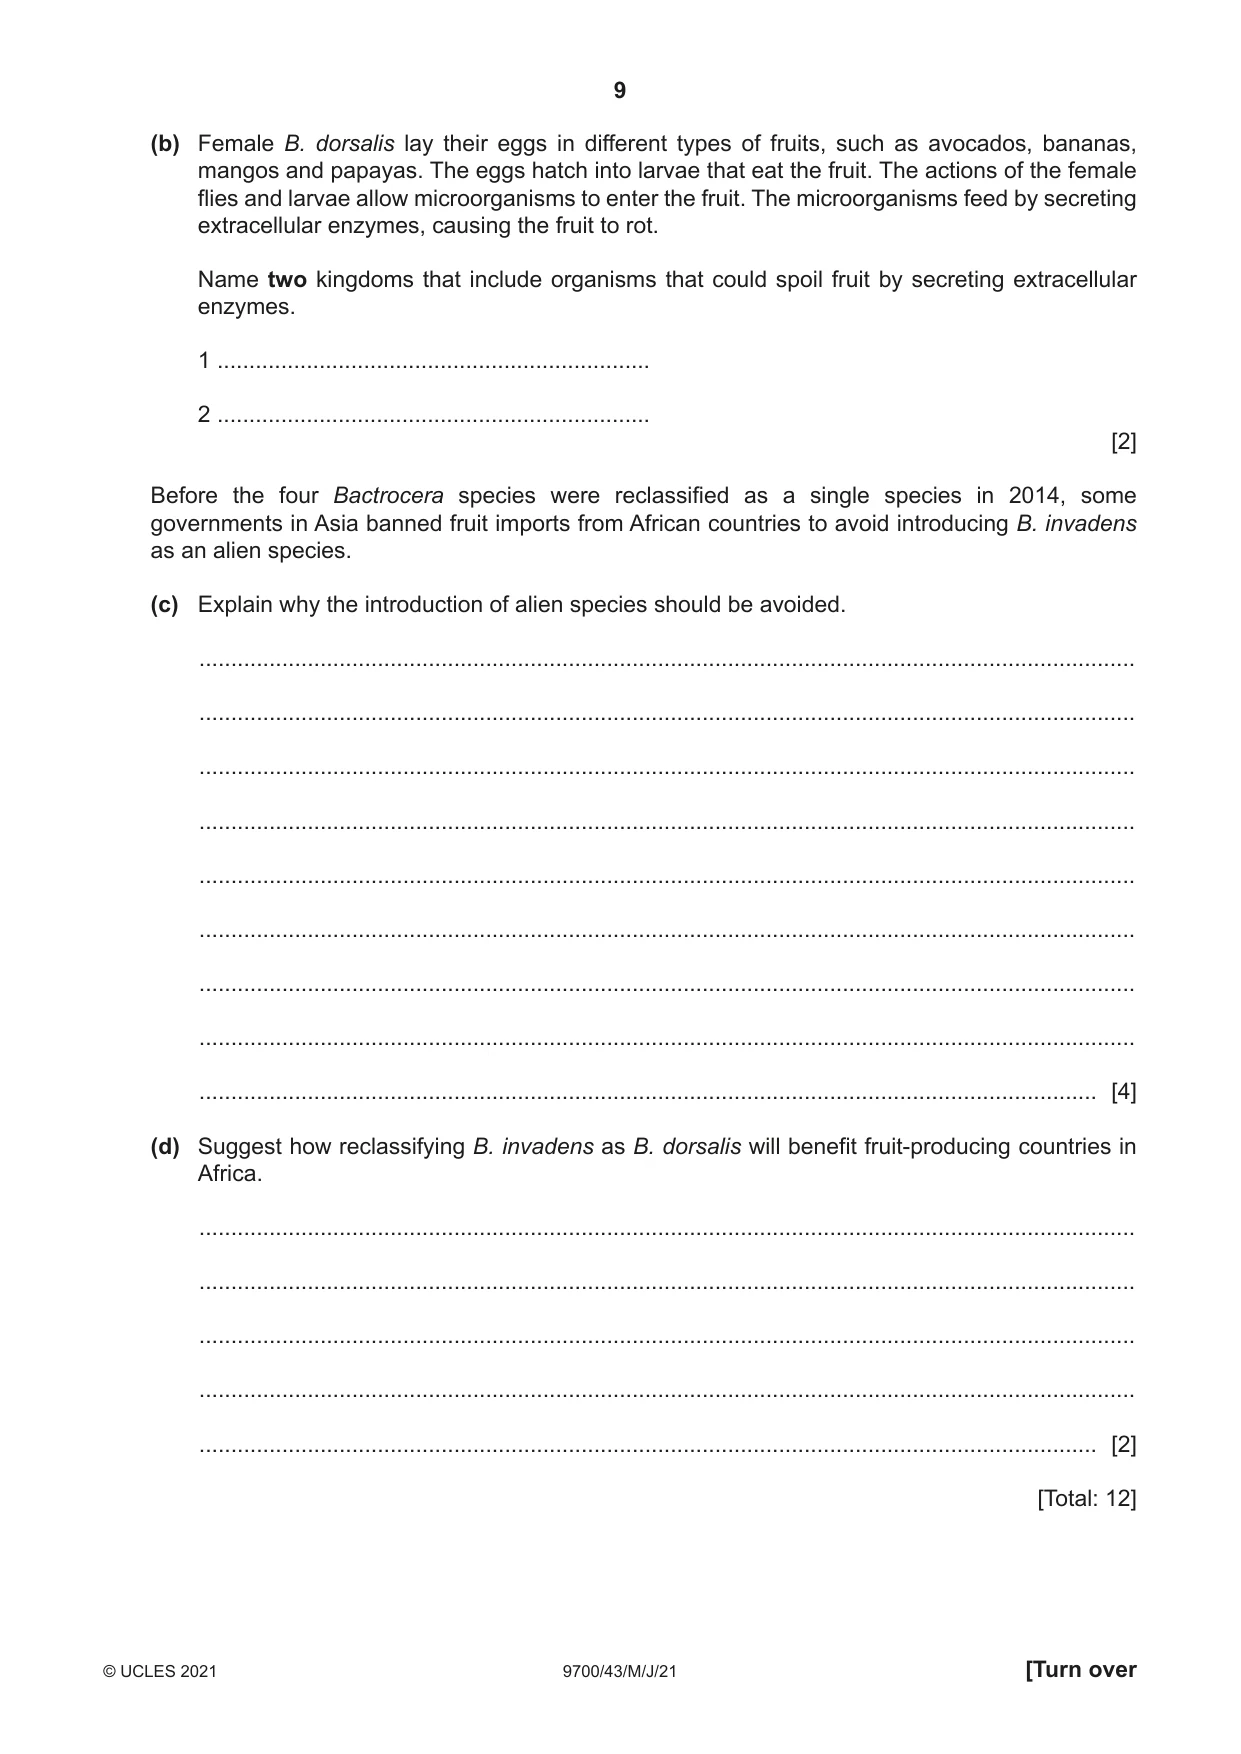
3 Fruit flies of the genus Bactrocera are pests that damage fruit crops. Table 3.1 gives the names and geographical ranges of Bactrocera fruit flies that were classified as four separate species. Table 3.1 name geographical range B. dorsalis China, India, Thailand B. invadens Africa, India B. papayae Indonesia, Malaysia B. philippinensis Philippine Islands, Borneo In 2014, the classification of these flies was changed. All four species were recognised as belonging to a single species, B. dorsalis. (a) (i) Suggest reasons why the four species were originally classified as separate species. ........................................................................................................................................... ........................................................................................................................................... ........................................................................................................................................... ........................................................................................................................................... ..................................................................................................................................... [2] (ii) Some students decided to investigate whether the flies were members of one species or four separate species. Suggest a simple investigation that the students could carry out. ........................................................................................................................................... ........................................................................................................................................... ........................................................................................................................................... ........................................................................................................................................... ..................................................................................................................................... [2] (b) Female B. dorsalis lay their eggs in different types of fruits, such as avocados, bananas, mangos and papayas. The eggs hatch into larvae that eat the fruit. The actions of the female flies and larvae allow microorganisms to enter the fruit. The microorganisms feed by secreting extracellular enzymes, causing the fruit to rot. Name two kingdoms that include organisms that could spoil fruit by secreting extracellular enzymes. 1 .................................................................... 2 .................................................................... [2] Before the four Bactrocera species were reclassified as a single species in 2014, some governments in Asia banned fruit imports from African countries to avoid introducing B. invadens as an alien species. (c) Explain why the introduction of alien species should be avoided. ................................................................................................................................................... ................................................................................................................................................... ................................................................................................................................................... ................................................................................................................................................... ................................................................................................................................................... ................................................................................................................................................... ................................................................................................................................................... ................................................................................................................................................... ............................................................................................................................................. [4] (d) Suggest how reclassifying B. invadens as B. dorsalis will benefit fruit‑producing countries in Africa. ................................................................................................................................................... ................................................................................................................................................... ................................................................................................................................................... ................................................................................................................................................... ............................................................................................................................................. [2] [Total: 12]
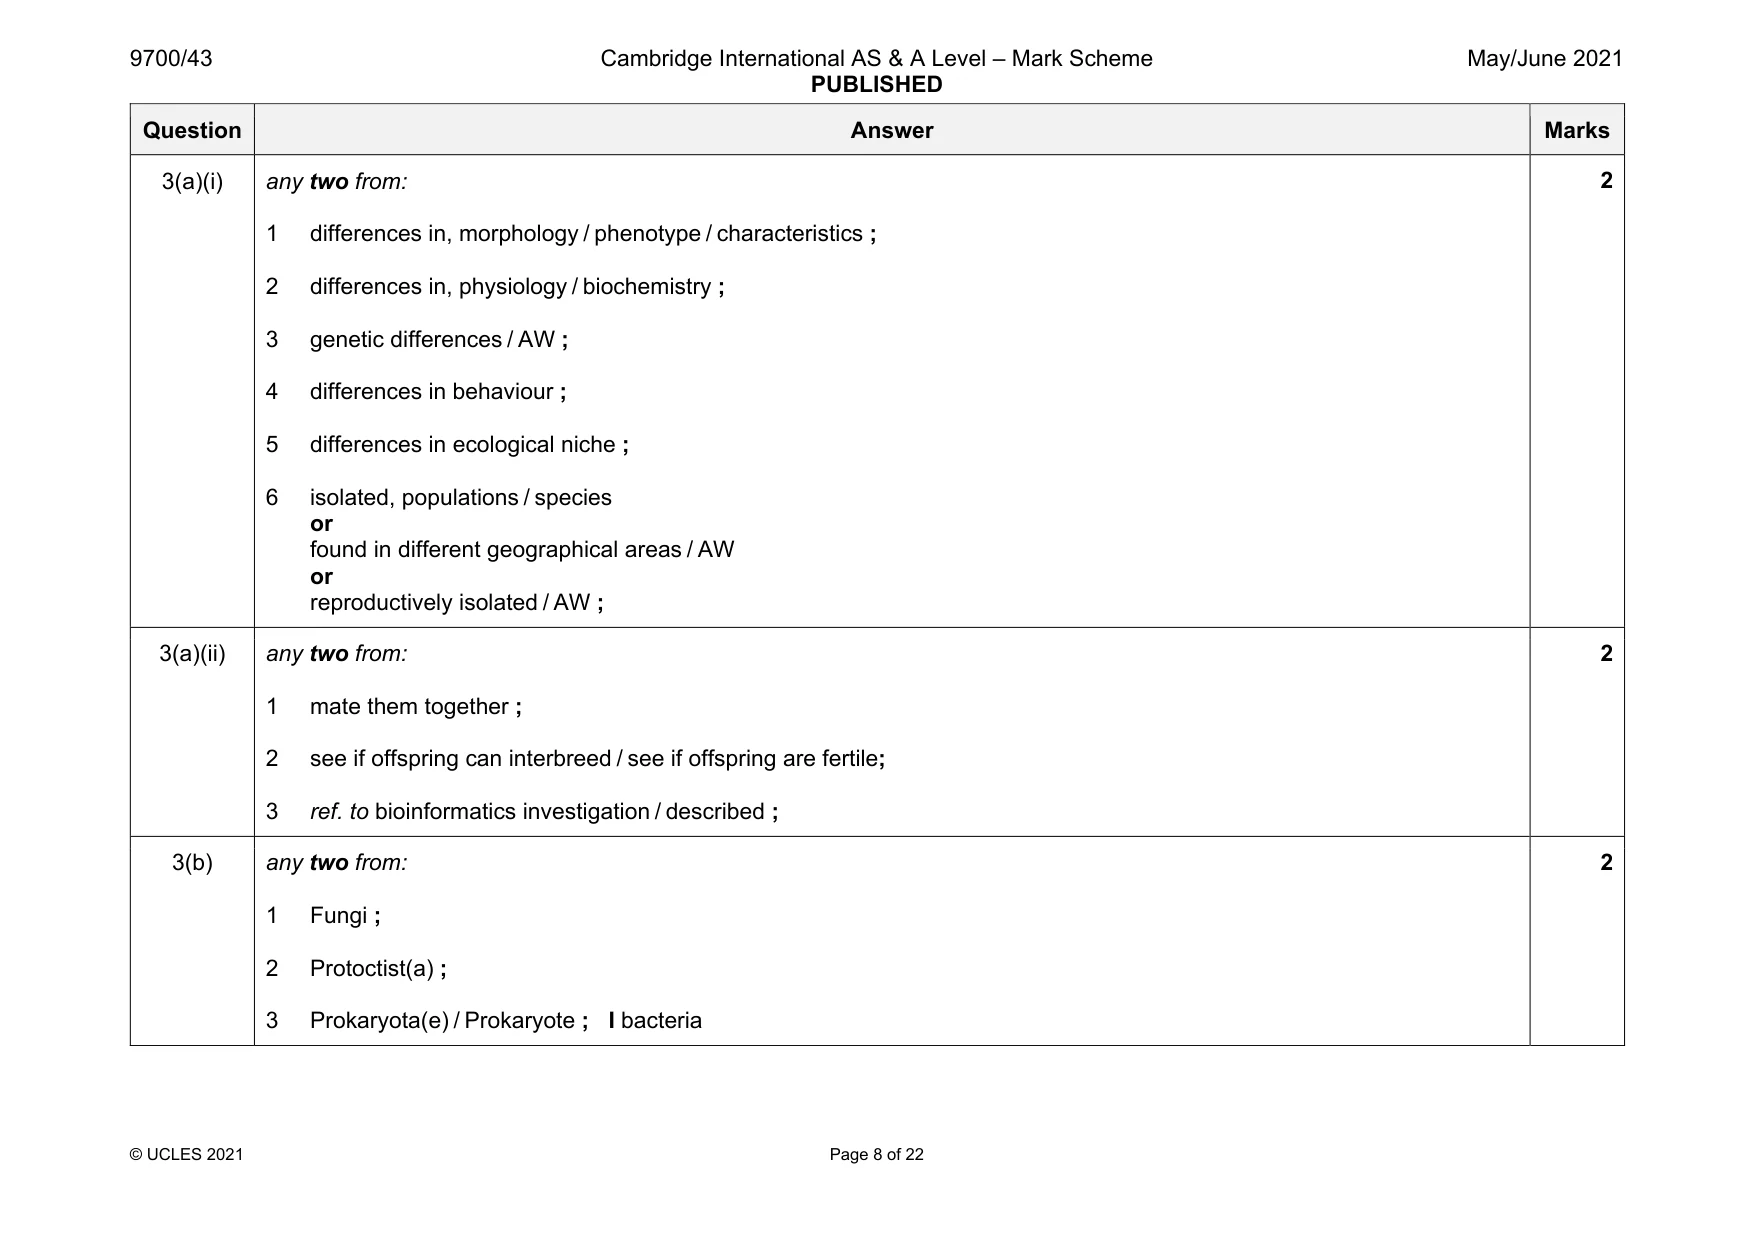
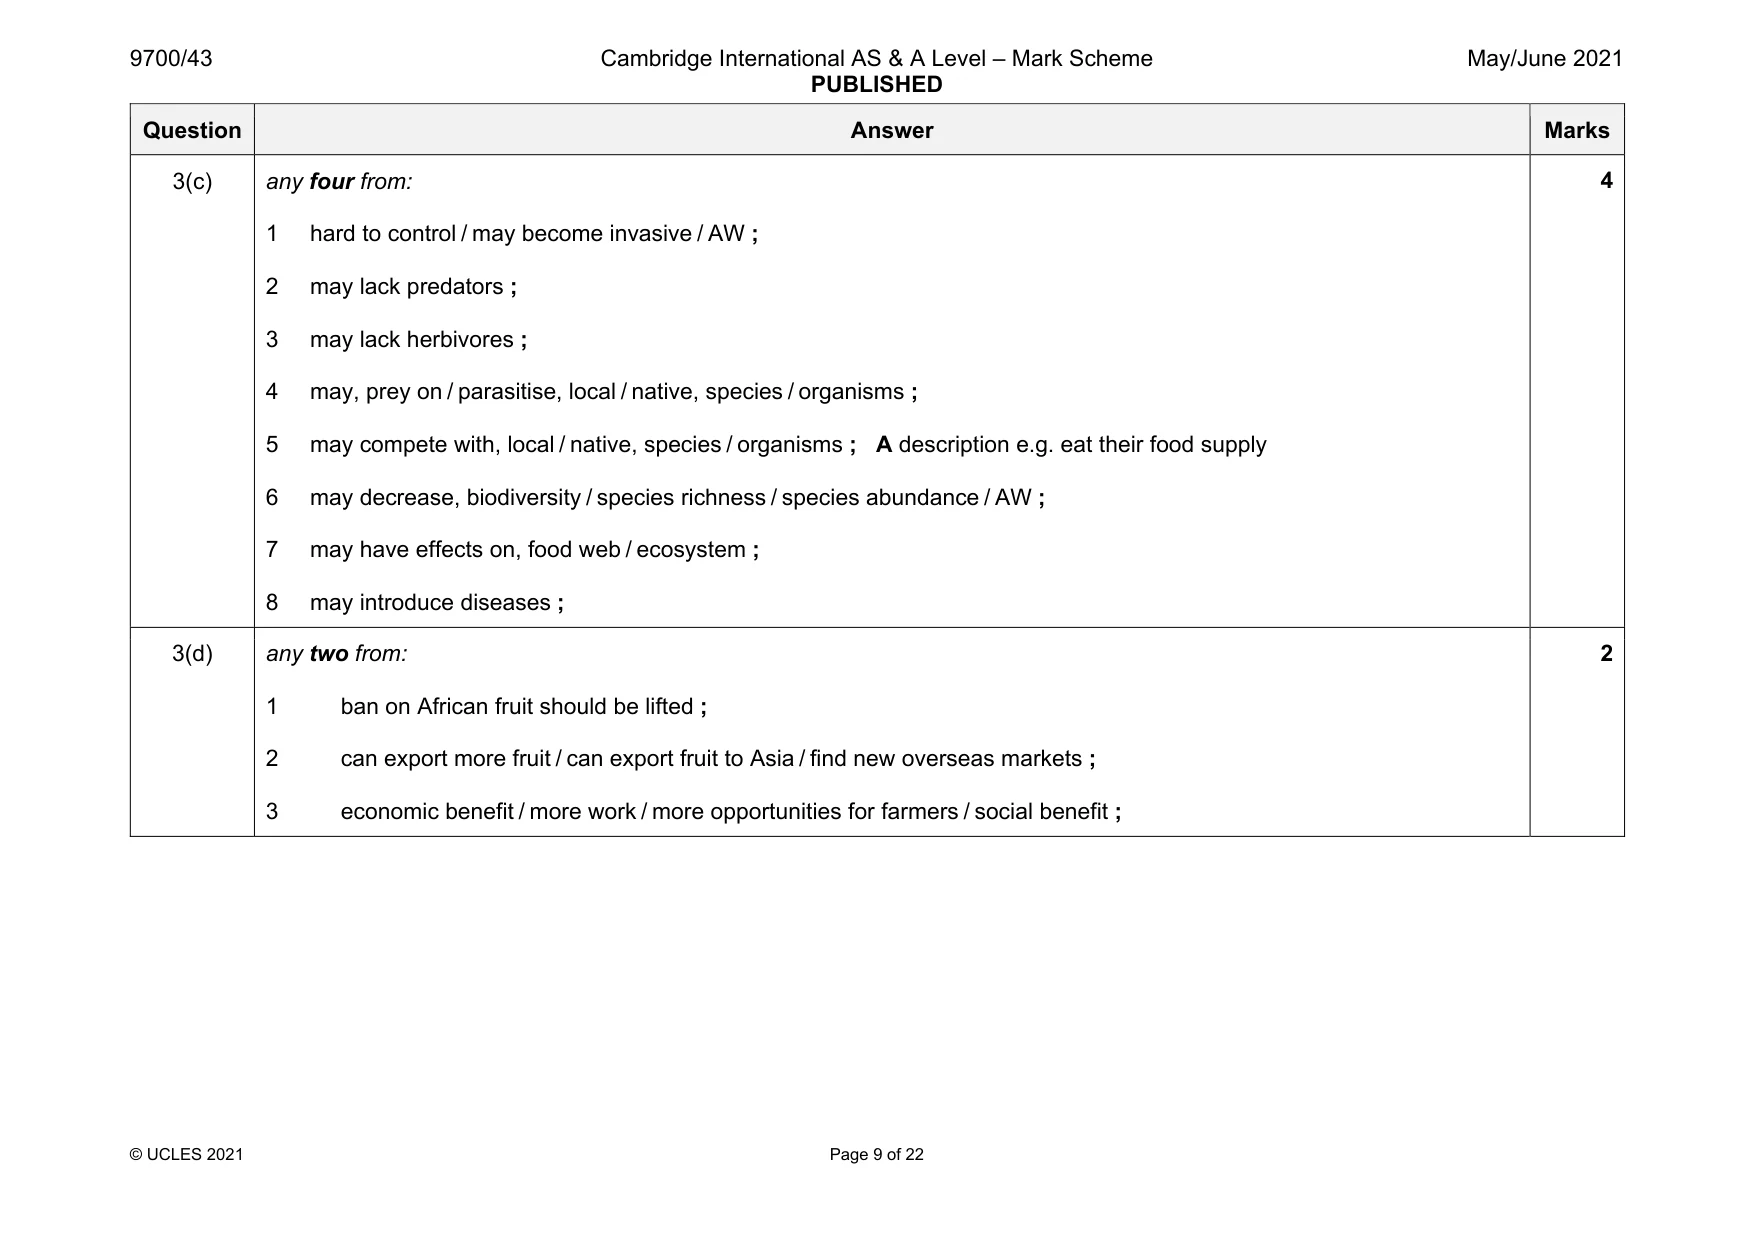
Mark scheme: 3(a)(i) any two from: 1 differences in, morphology / phenotype / characteristics ; 2 differences in, physiology / biochemistry ; 3 genetic differences / AW ; 4 differences in behaviour ; 5 differences in ecological niche ; 6 isolated, populations / species or found in different geographical areas / AW or reproductively isolated / AW ; 3(a)(ii) any two from: 1 mate them together ; 2 see if offspring can interbreed / see if offspring are fertile; 3 ref. to bioinformatics investigation / described ; 2 3(b) any two from: 1 Fungi ; 2 Protoctist(a) ; 3 Prokaryota(e) / Prokaryote ; I bacteria 2 Question Answer Marks 3(c) any four from: 1 hard to control / may become invasive / AW ; 2 may lack predators ; 3 may lack herbivores ; 4 may, prey on / parasitise, local / native, species / organisms ; 5 may compete with, local / native, species / organisms ; A description e.g. eat their food supply 6 may decrease, biodiversity / species richness / species abundance / AW ; 7 may have effects on, food web / ecosystem ; 8 may introduce diseases ; 4 3(d) any two from: 1 ban on African fruit should be lifted ; 2 can export more fruit / can export fruit to Asia / find new overseas markets ; 3 economic benefit / more work / more opportunities for farmers / social benefit ; 2
Q4 · Bt maize has been genetically engineered to resist insect attack
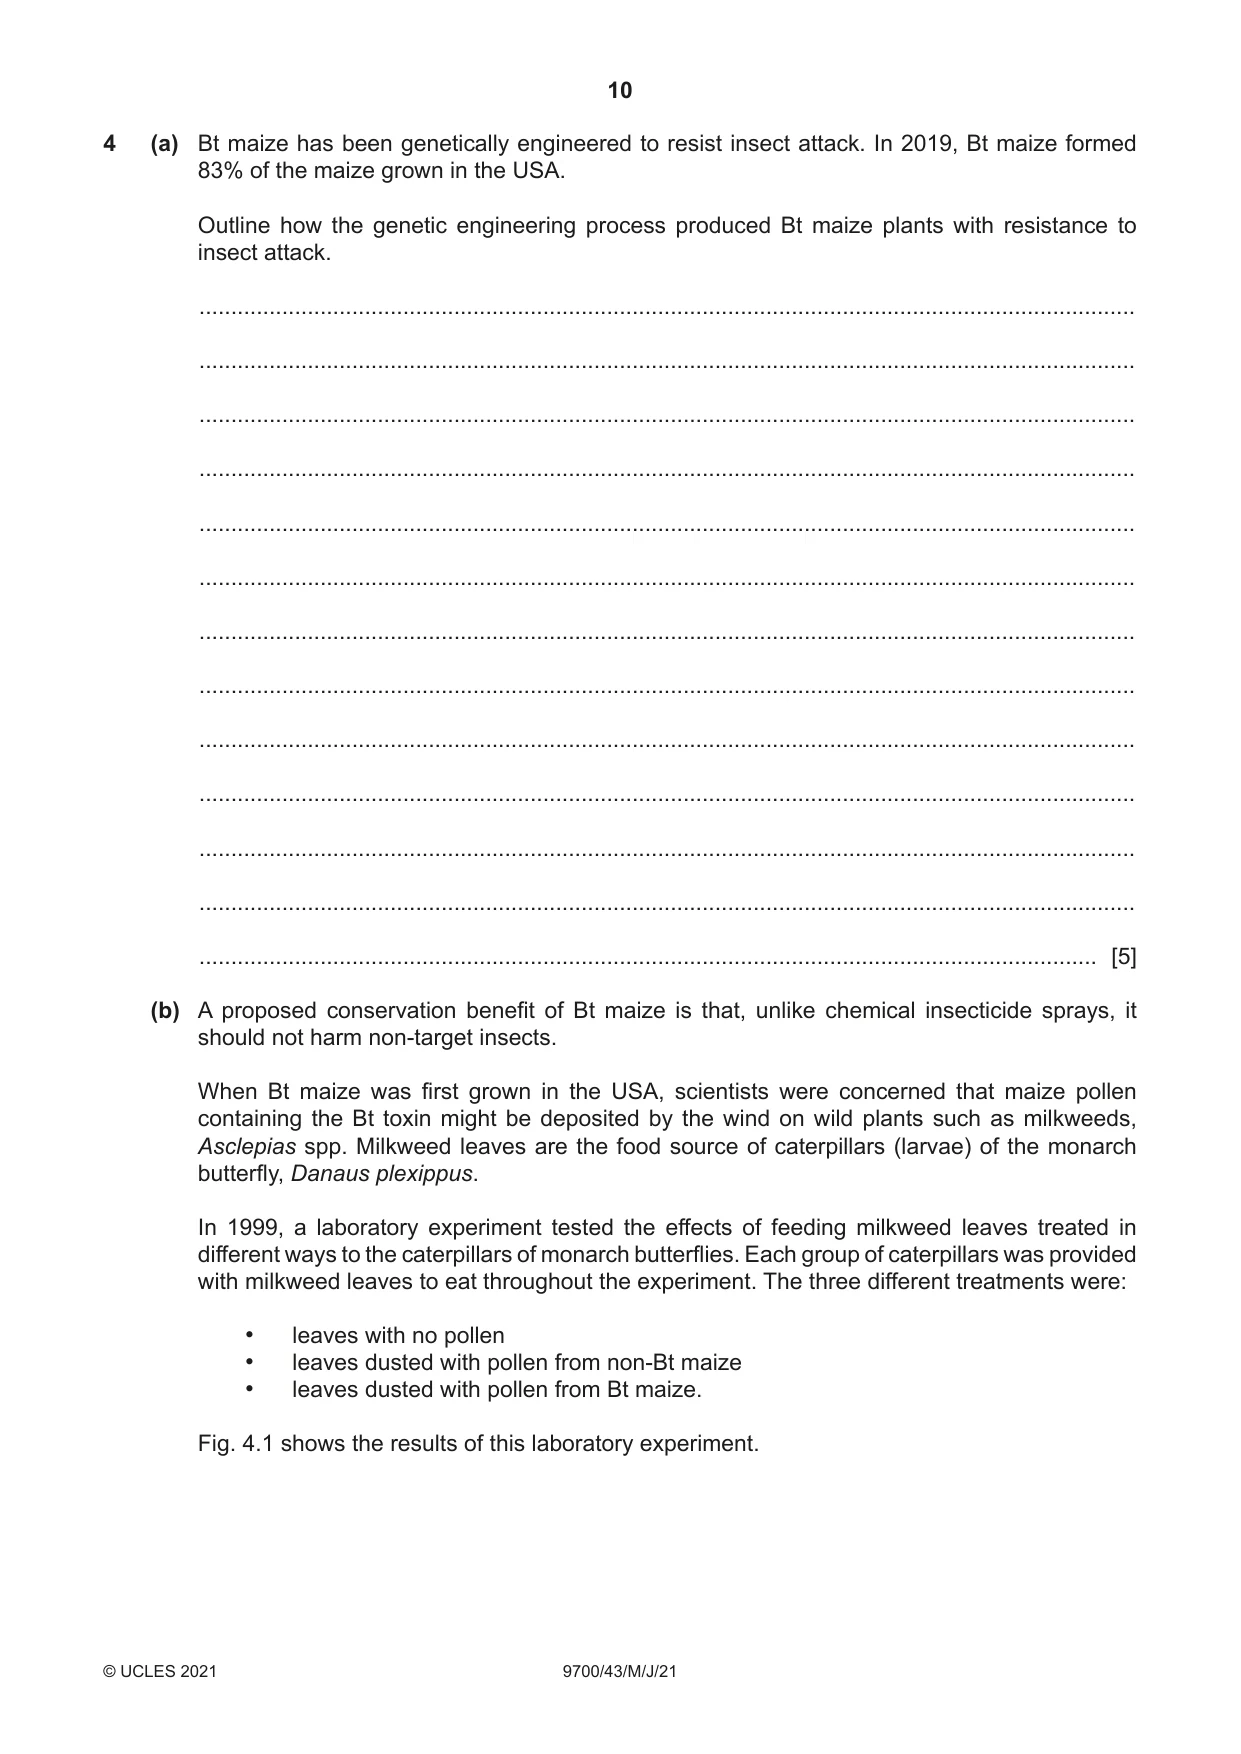
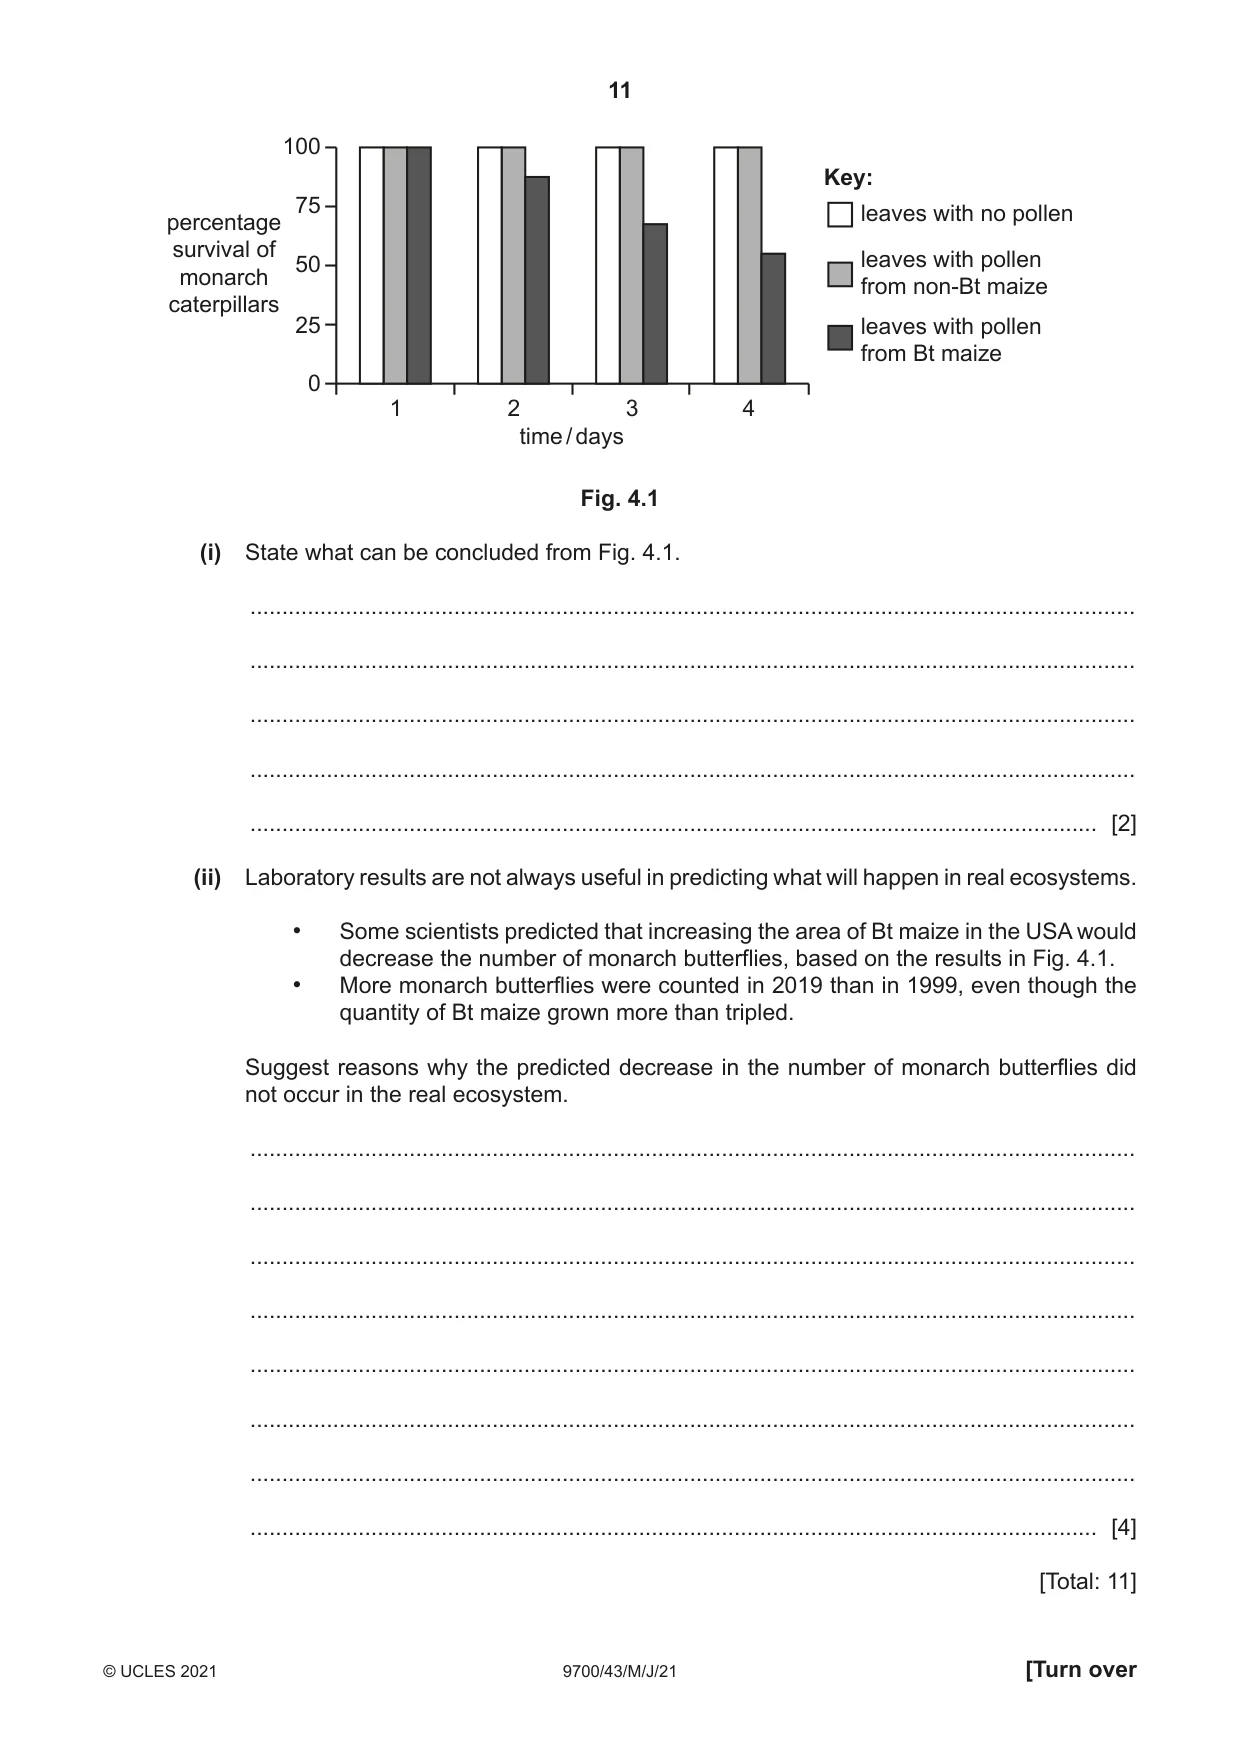
4 (a) Bt maize has been genetically engineered to resist insect attack. In 2019, Bt maize formed 83% of the maize grown in the USA. Outline how the genetic engineering process produced Bt maize plants with resistance to insect attack. ................................................................................................................................................... ................................................................................................................................................... ................................................................................................................................................... ................................................................................................................................................... ................................................................................................................................................... ................................................................................................................................................... ................................................................................................................................................... ................................................................................................................................................... ................................................................................................................................................... ................................................................................................................................................... ................................................................................................................................................... ................................................................................................................................................... ............................................................................................................................................. [5] (b) A proposed conservation benefit of Bt maize is that, unlike chemical insecticide sprays, it should not harm non‑target insects. When Bt maize was first grown in the USA, scientists were concerned that maize pollen containing the Bt toxin might be deposited by the wind on wild plants such as milkweeds, Asclepias spp. Milkweed leaves are the food source of caterpillars (larvae) of the monarch butterfly, Danaus plexippus. In 1999, a laboratory experiment tested the effects of feeding milkweed leaves treated in different ways to the caterpillars of monarch butterflies. Each group of caterpillars was provided with milkweed leaves to eat throughout the experiment. The three different treatments were: • leaves with no pollen • leaves dusted with pollen from non‑Bt maize • leaves dusted with pollen from Bt maize. Fig. 4.1 shows the results of this laboratory experiment. 100 Key: 75 leaves with no pollenpercentage survival of 50 leaves with pollen monarch from non-Bt maize caterpillars 25 leaves with pollen from Bt maize 0 1 2 3 4 time / days Fig. 4.1 (i) State what can be concluded from Fig. 4.1. ........................................................................................................................................... ........................................................................................................................................... ........................................................................................................................................... ........................................................................................................................................... ..................................................................................................................................... [2] (ii) Laboratory results are not always useful in predicting what will happen in real ecosystems. • Some scientists predicted that increasing the area of Bt maize in the USA would decrease the number of monarch butterflies, based on the results in Fig. 4.1. • More monarch butterflies were counted in 2019 than in 1999, even though the quantity of Bt maize grown more than tripled. Suggest reasons why the predicted decrease in the number of monarch butterflies did not occur in the real ecosystem. ........................................................................................................................................... ........................................................................................................................................... ........................................................................................................................................... ........................................................................................................................................... ........................................................................................................................................... ........................................................................................................................................... ........................................................................................................................................... ..................................................................................................................................... [4] [Total: 11]
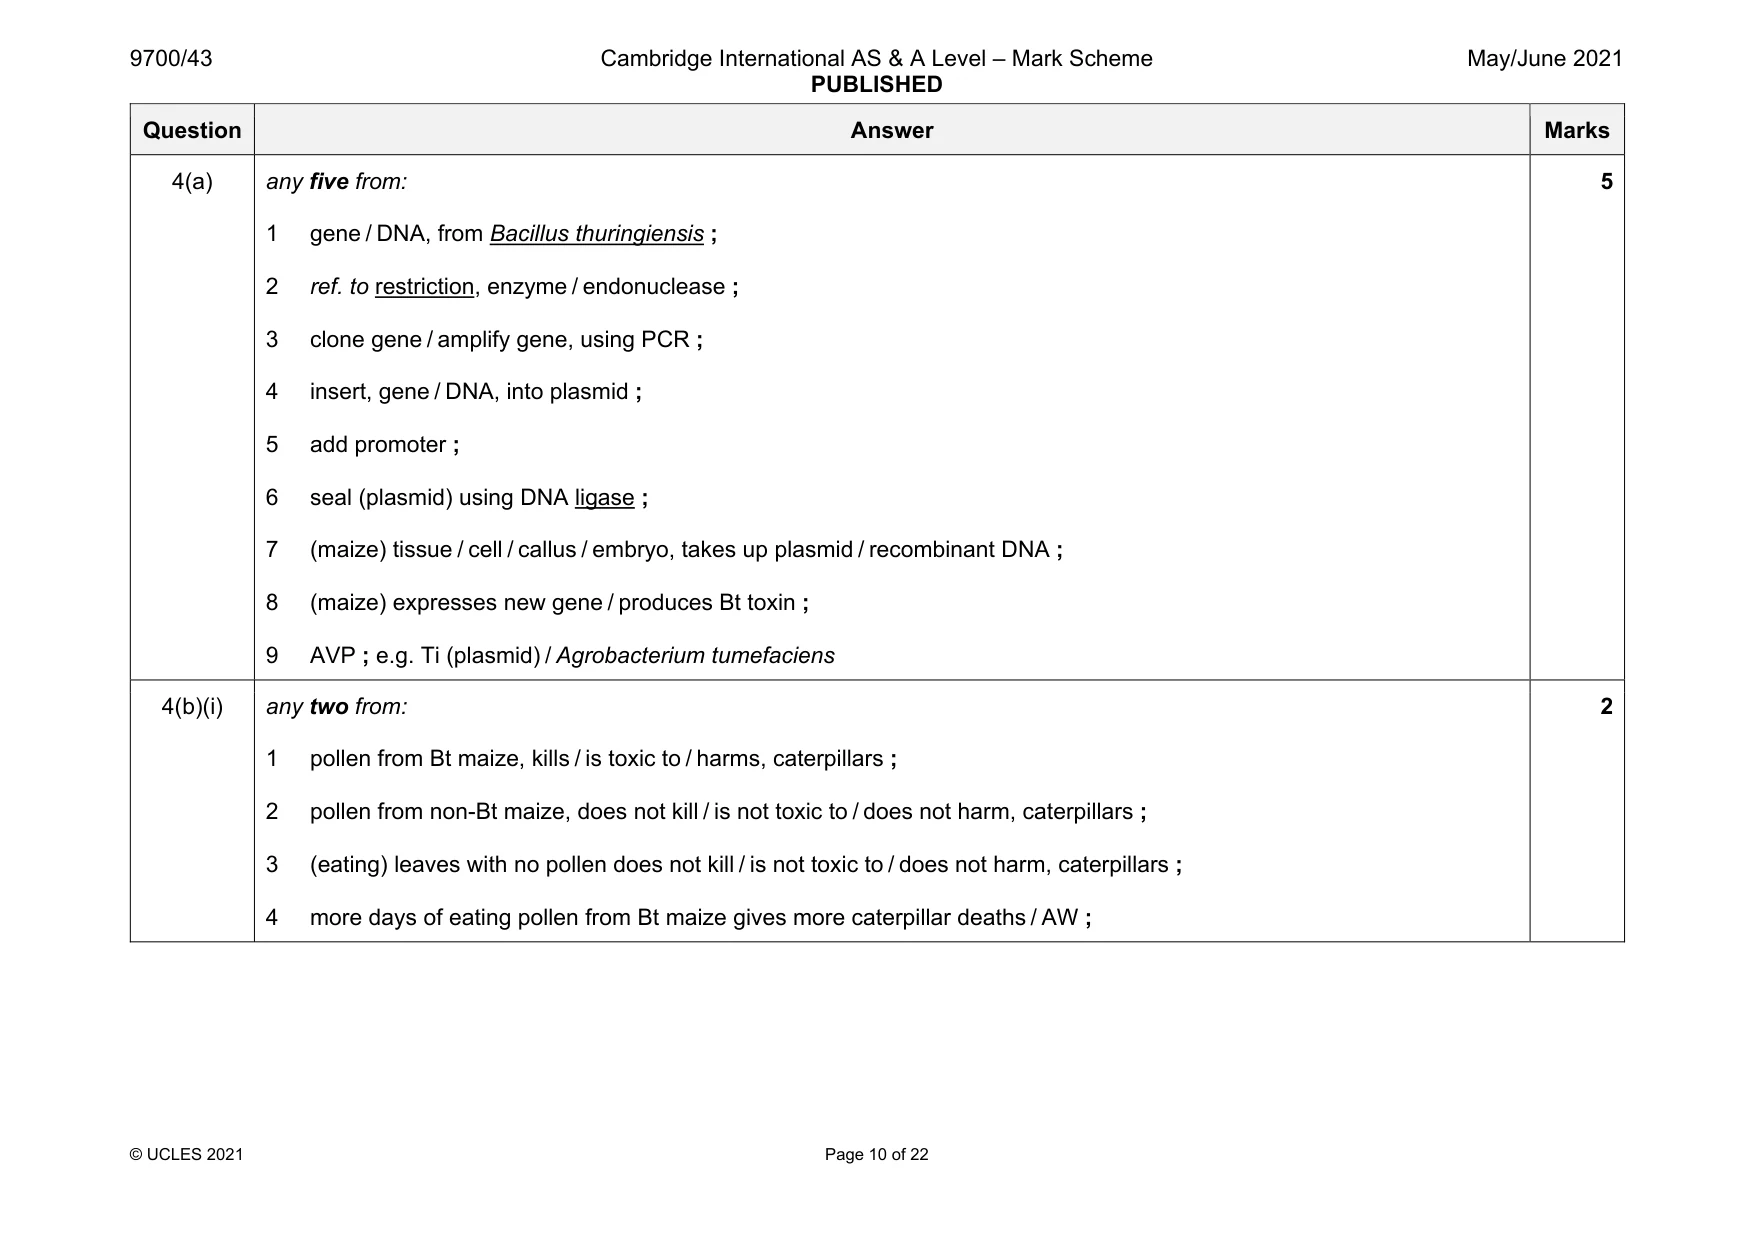
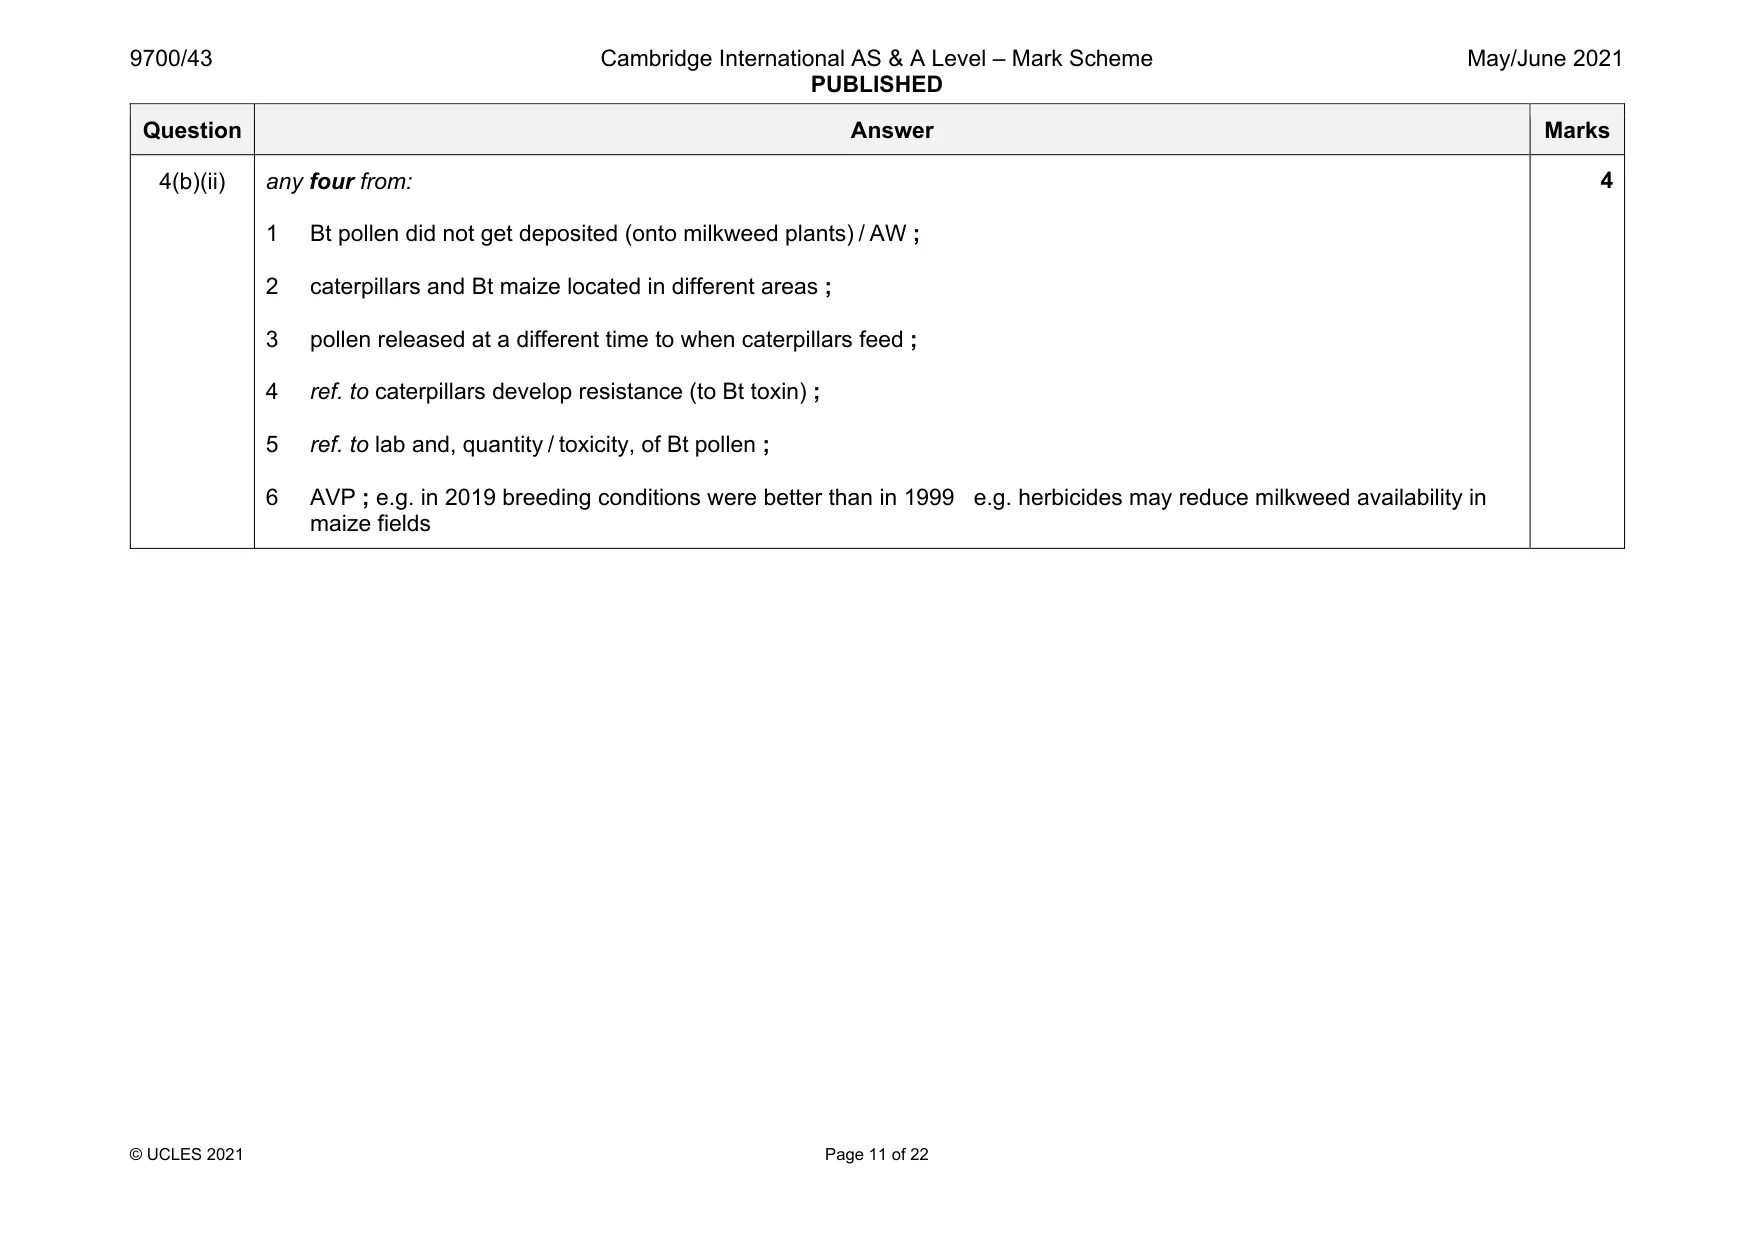
Mark scheme: 4(a) any five from: 1 gene / DNA, from Bacillus thuringiensis ; 2 ref. to restriction, enzyme / endonuclease ; 3 clone gene / amplify gene, using PCR ; 4 insert, gene / DNA, into plasmid ; 5 add promoter ; 6 seal (plasmid) using DNA ligase ; 7 (maize) tissue / cell / callus / embryo, takes up plasmid / recombinant DNA ; 8 (maize) expresses new gene / produces Bt toxin ; 9 AVP ; e.g. Ti (plasmid) / Agrobacterium tumefaciens 5 4(b)(i) any two from: 1 pollen from Bt maize, kills / is toxic to / harms, caterpillars ; 2 pollen from non-Bt maize, does not kill / is not toxic to / does not harm, caterpillars ; 3 (eating) leaves with no pollen does not kill / is not toxic to / does not harm, caterpillars ; 4 more days of eating pollen from Bt maize gives more caterpillar deaths / AW ; 2 Question Answer Marks 4(b)(ii) any four from: 1 Bt pollen did not get deposited (onto milkweed plants) / AW ; 2 caterpillars and Bt maize located in different areas ; 3 pollen released at a different time to when caterpillars feed ; 4 ref. to caterpillars develop resistance (to Bt toxin) ; 5 ref. to lab and, quantity / toxicity, of Bt pollen ; 6 AVP ; e.g. in 2019 breeding conditions were better than in 1999 e.g. herbicides may reduce milkweed availability in maize fields 4
More questions on Genetically modified organisms in agriculture
Q5 · Photosynthesis is a process that results in the synthesis of complex organic molecules
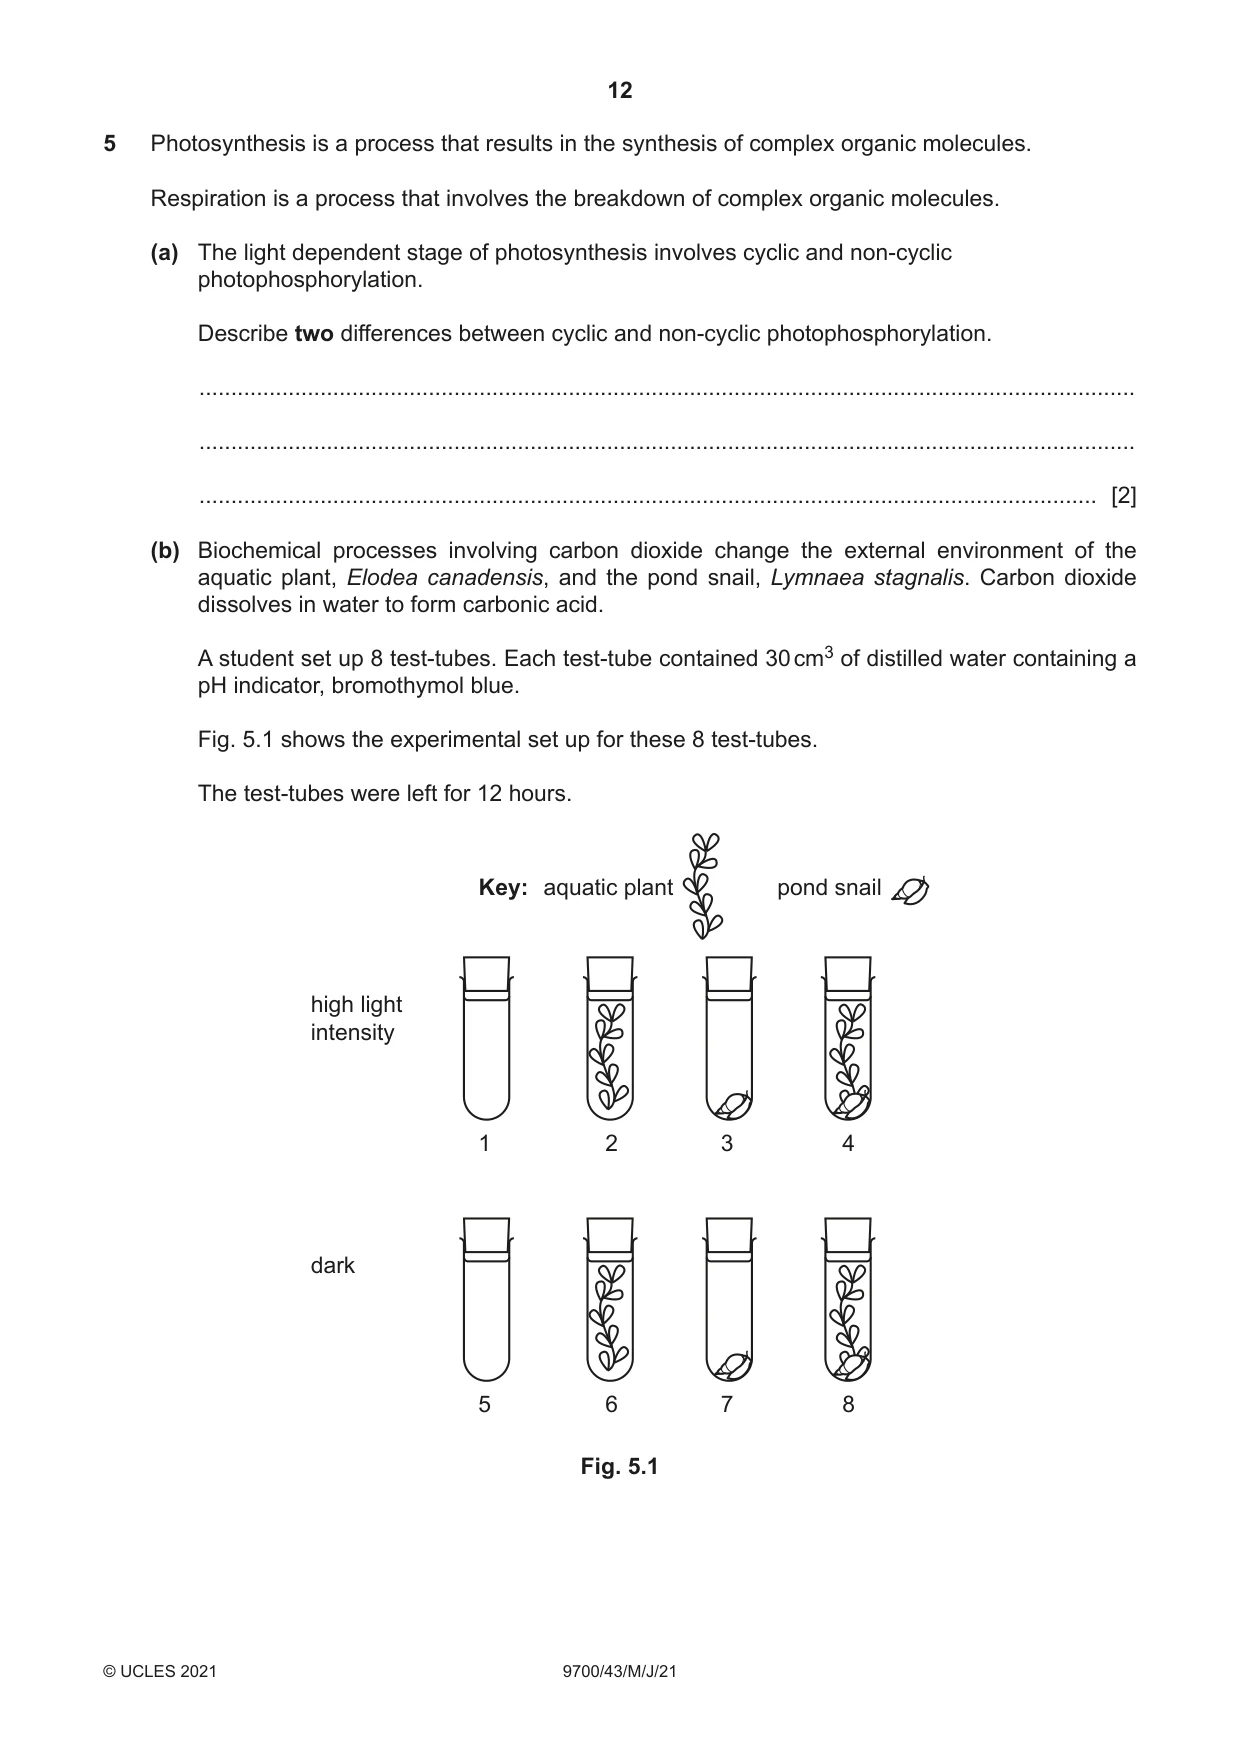
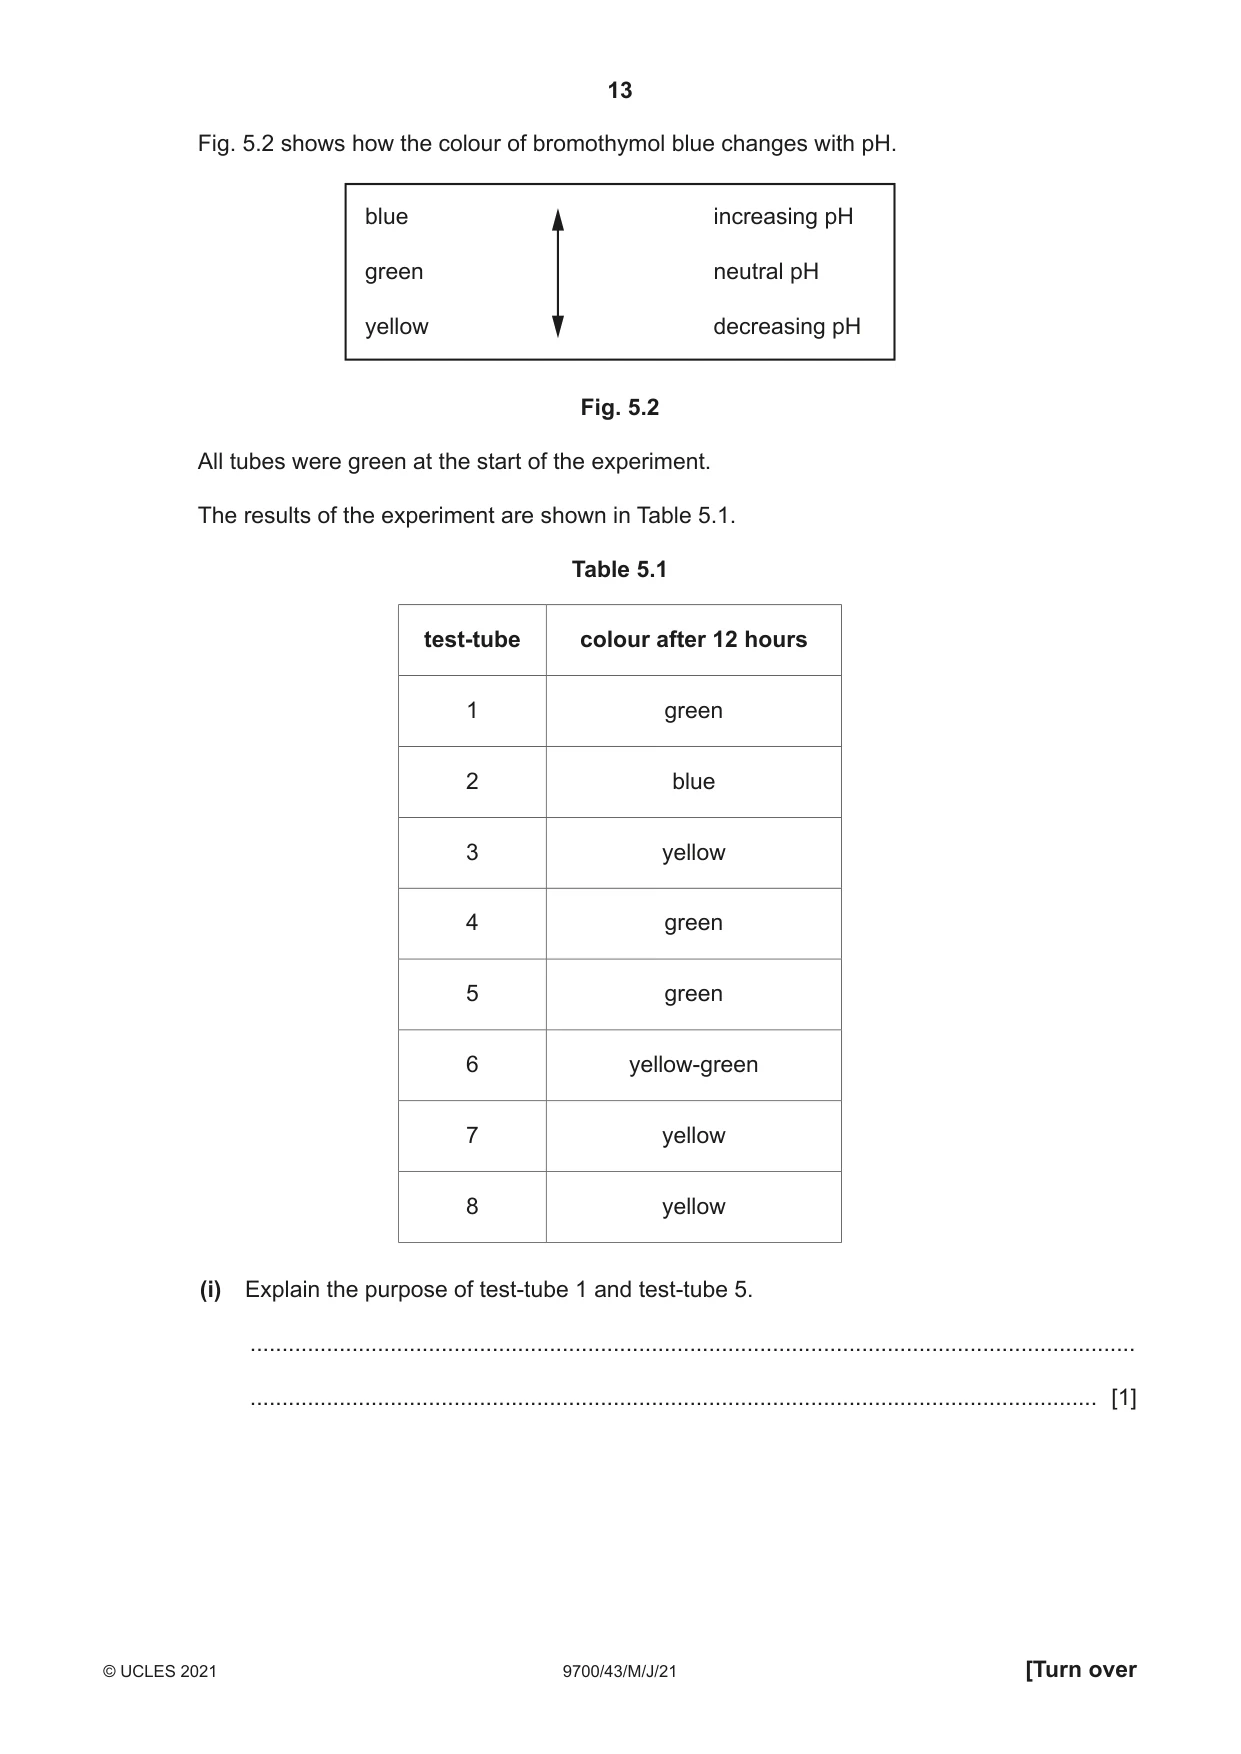
5 Photosynthesis is a process that results in the synthesis of complex organic molecules. Respiration is a process that involves the breakdown of complex organic molecules. (a) The light dependent stage of photosynthesis involves cyclic and non‑cyclic photophosphorylation. Describe two differences between cyclic and non‑cyclic photophosphorylation. ................................................................................................................................................... ................................................................................................................................................... ............................................................................................................................................. [2] (b) Biochemical processes involving carbon dioxide change the external environment of the aquatic plant, Elodea canadensis, and the pond snail, Lymnaea stagnalis. Carbon dioxide dissolves in water to form carbonic acid. A student set up 8 test‑tubes. Each test‑tube contained 30 cm3 of distilled water containing a pH indicator, bromothymol blue. Fig. 5.1 shows the experimental set up for these 8 test‑tubes. The test‑tubes were left for 12 hours. Key: aquatic plant pond snail high light intensity 1 2 3 4 dark 5 6 7 8 Fig. 5.1 Fig. 5.2 shows how the colour of bromothymol blue changes with pH. blue increasing pH green neutral pH yellow decreasing pH Fig. 5.2 All tubes were green at the start of the experiment. The results of the experiment are shown in Table 5.1. Table 5.1 test‑tube colour after 12 hours 1 green 2 blue 3 yellow 4 green 5 green 6 yellow‑green 7 yellow 8 yellow (i) Explain the purpose of test‑tube 1 and test‑tube 5. ........................................................................................................................................... ..................................................................................................................................... [1] (ii) Explain the results of test‑tubes 2, 3 and 4. test‑tube 2 ......................................................................................................................... ........................................................................................................................................... ........................................................................................................................................... test‑tube 3 ......................................................................................................................... ........................................................................................................................................... ........................................................................................................................................... test‑tube 4 ......................................................................................................................... ........................................................................................................................................... ........................................................................................................................................... [5] (iii) Explain the colour change in test‑tube 6. ........................................................................................................................................... ........................................................................................................................................... ........................................................................................................................................... ........................................................................................................................................... ........................................................................................................................................... ........................................................................................................................................... ........................................................................................................................................... ..................................................................................................................................... [3] [Total: 11]
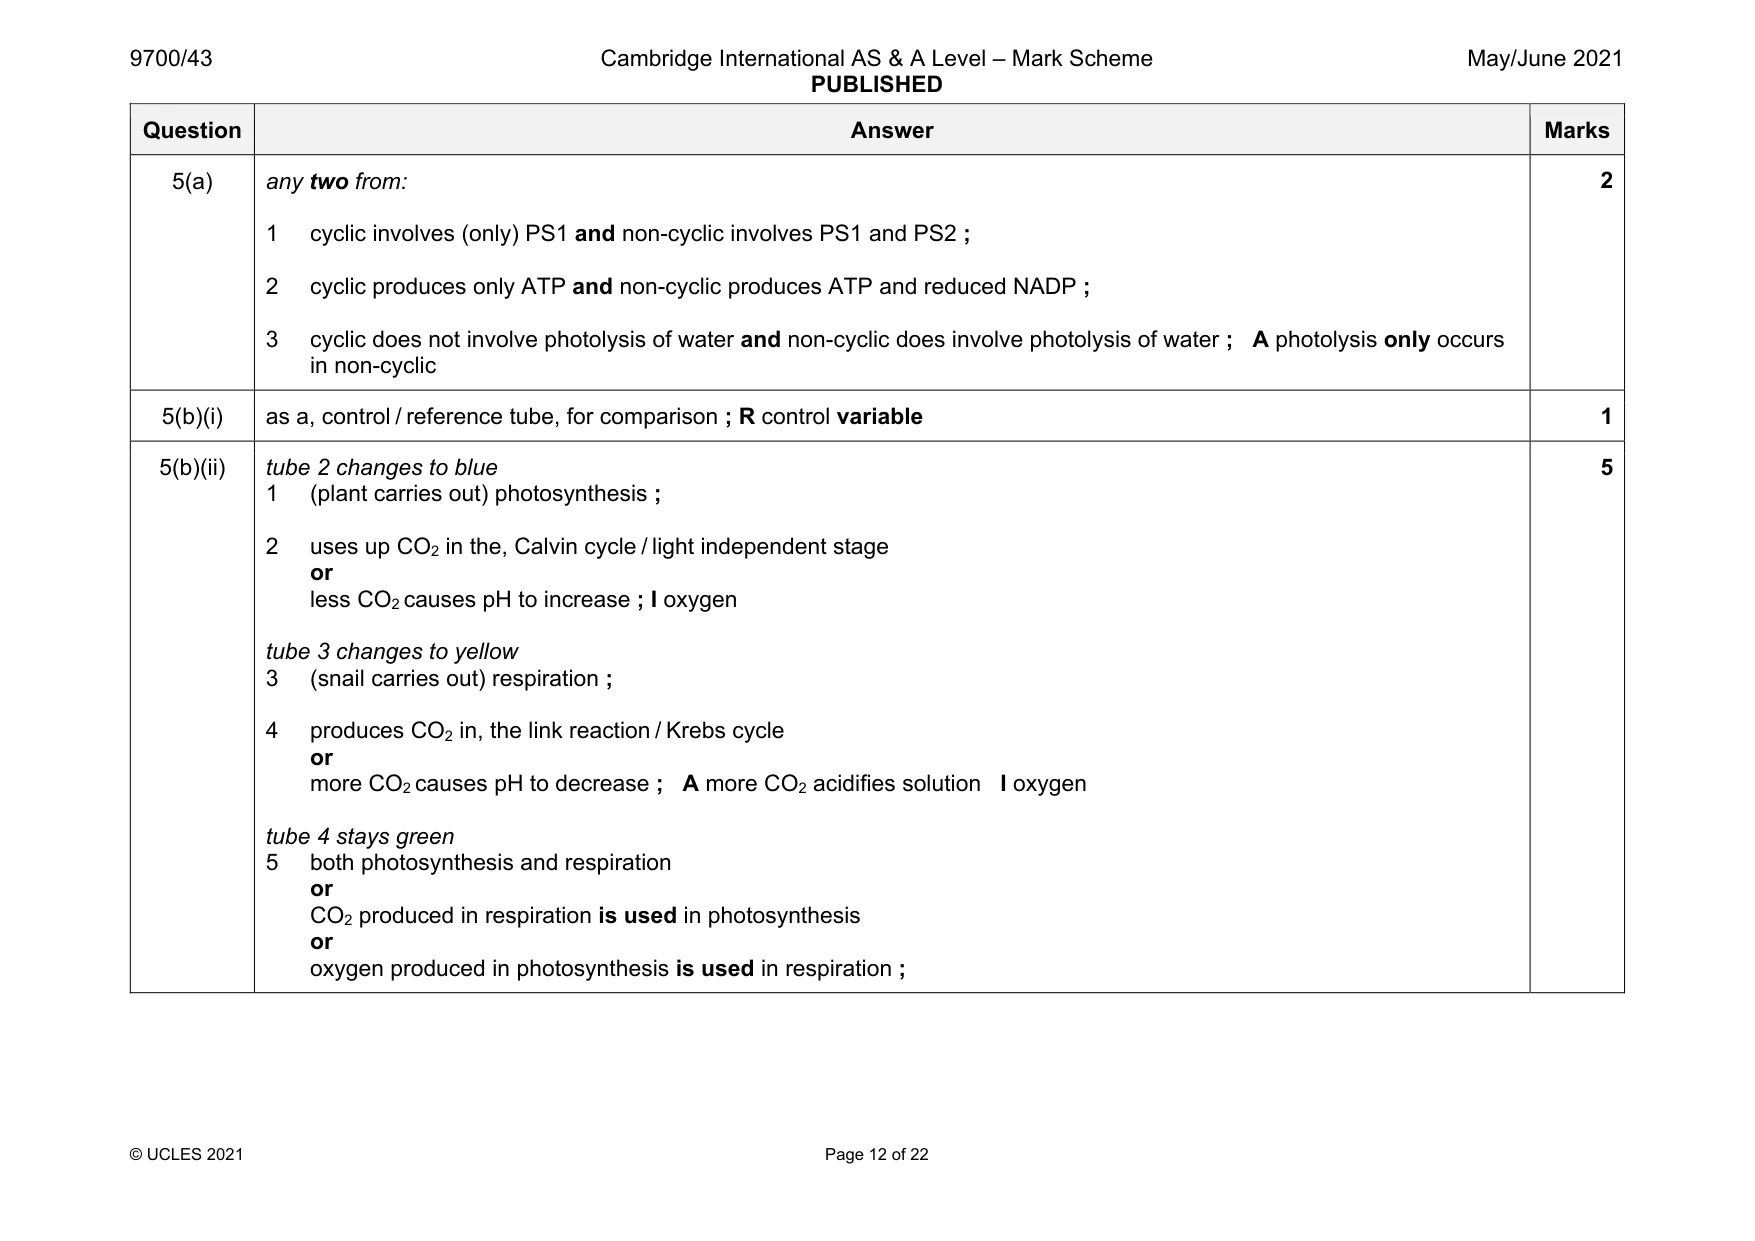
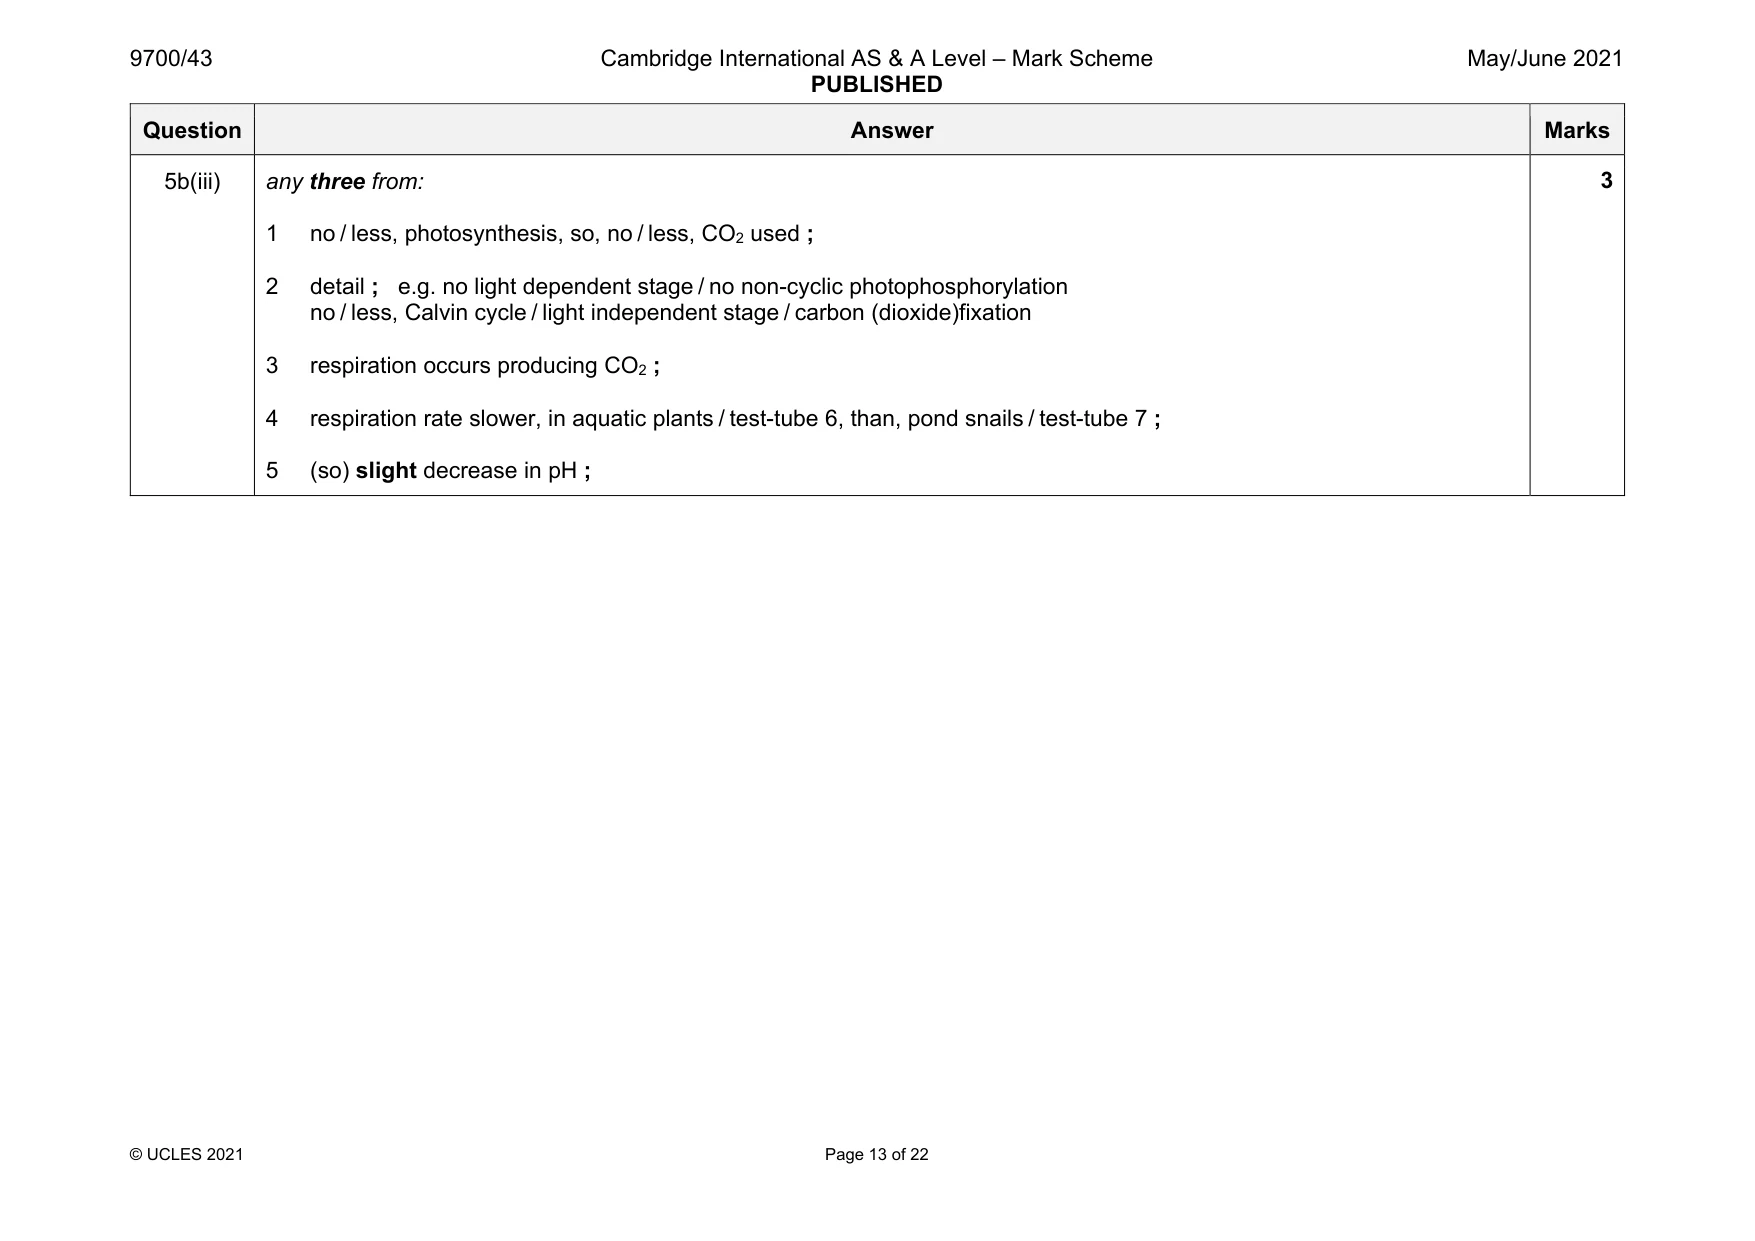
Mark scheme: 5(a) any two from: 1 cyclic involves (only) PS1 and non-cyclic involves PS1 and PS2 ; 2 cyclic produces only ATP and non-cyclic produces ATP and reduced NADP ; 3 cyclic does not involve photolysis of water and non-cyclic does involve photolysis of water ; A photolysis only occurs in non-cyclic 5(b)(i) as a, control / reference tube, for comparison ; R control variable 1 5(b)(ii) tube 2 changes to blue 1 (plant carries out) photosynthesis ; 2 uses up CO2 in the, Calvin cycle / light independent stage or less CO2 causes pH to increase ; I oxygen tube 3 changes to yellow 3 (snail carries out) respiration ; 4 produces CO2 in, the link reaction / Krebs cycle or more CO2 causes pH to decrease ; A more CO2 acidifies solution I oxygen tube 4 stays green 5 both photosynthesis and respiration or CO2 produced in respiration is used in photosynthesis or oxygen produced in photosynthesis is used in respiration ; 5 Question Answer Marks 5b(iii) any three from: 1 no / less, photosynthesis, so, no / less, CO2 used ; 2 detail ; e.g. no light dependent stage / no non-cyclic photophosphorylation no / less, Calvin cycle / light independent stage / carbon (dioxide)fixation 3 respiration occurs producing CO2 ; 4 respiration rate slower, in aquatic plants / test-tube 6, than, pond snails / test-tube 7 ; 5 (so) slight decrease in pH ; 3
Q6 · The bottlenose dolphin, Tursiops truncatus, is an aquatic mammal
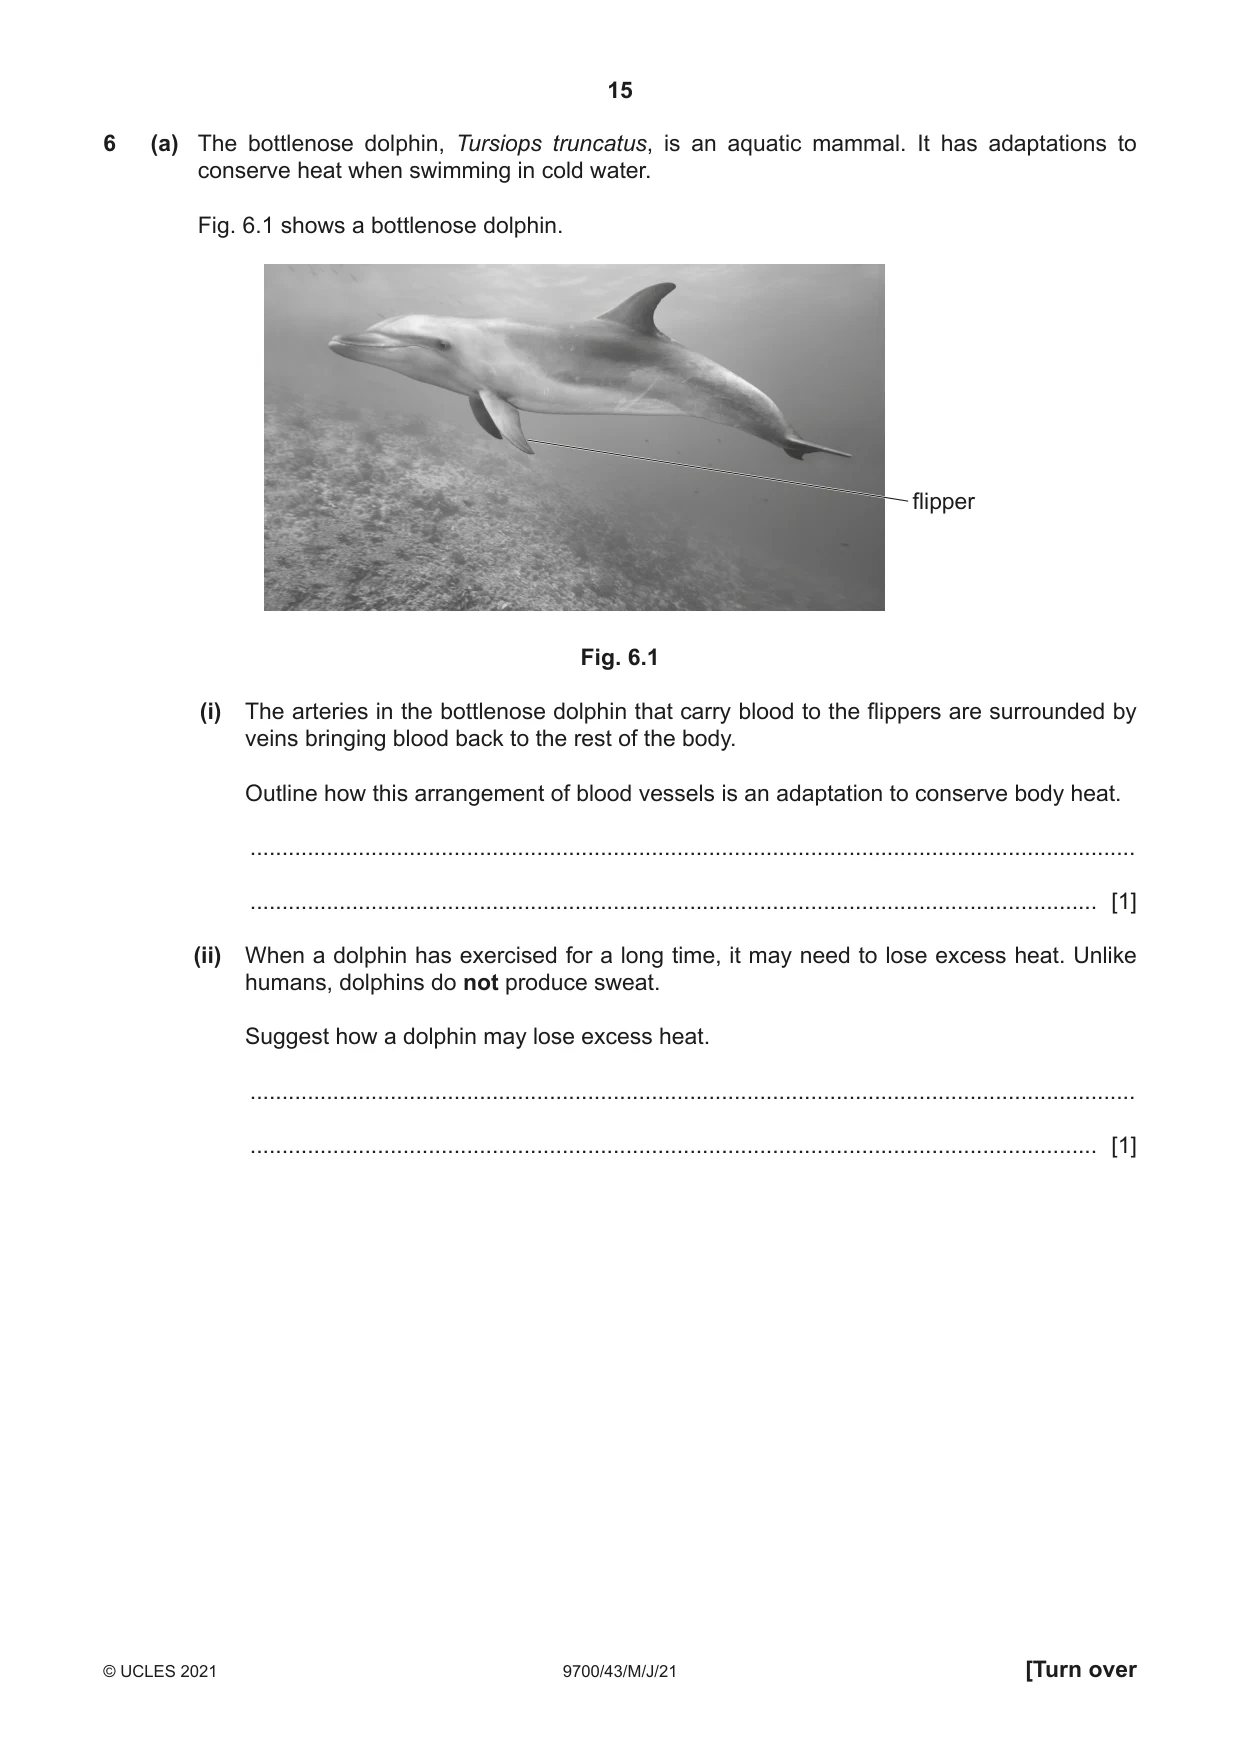
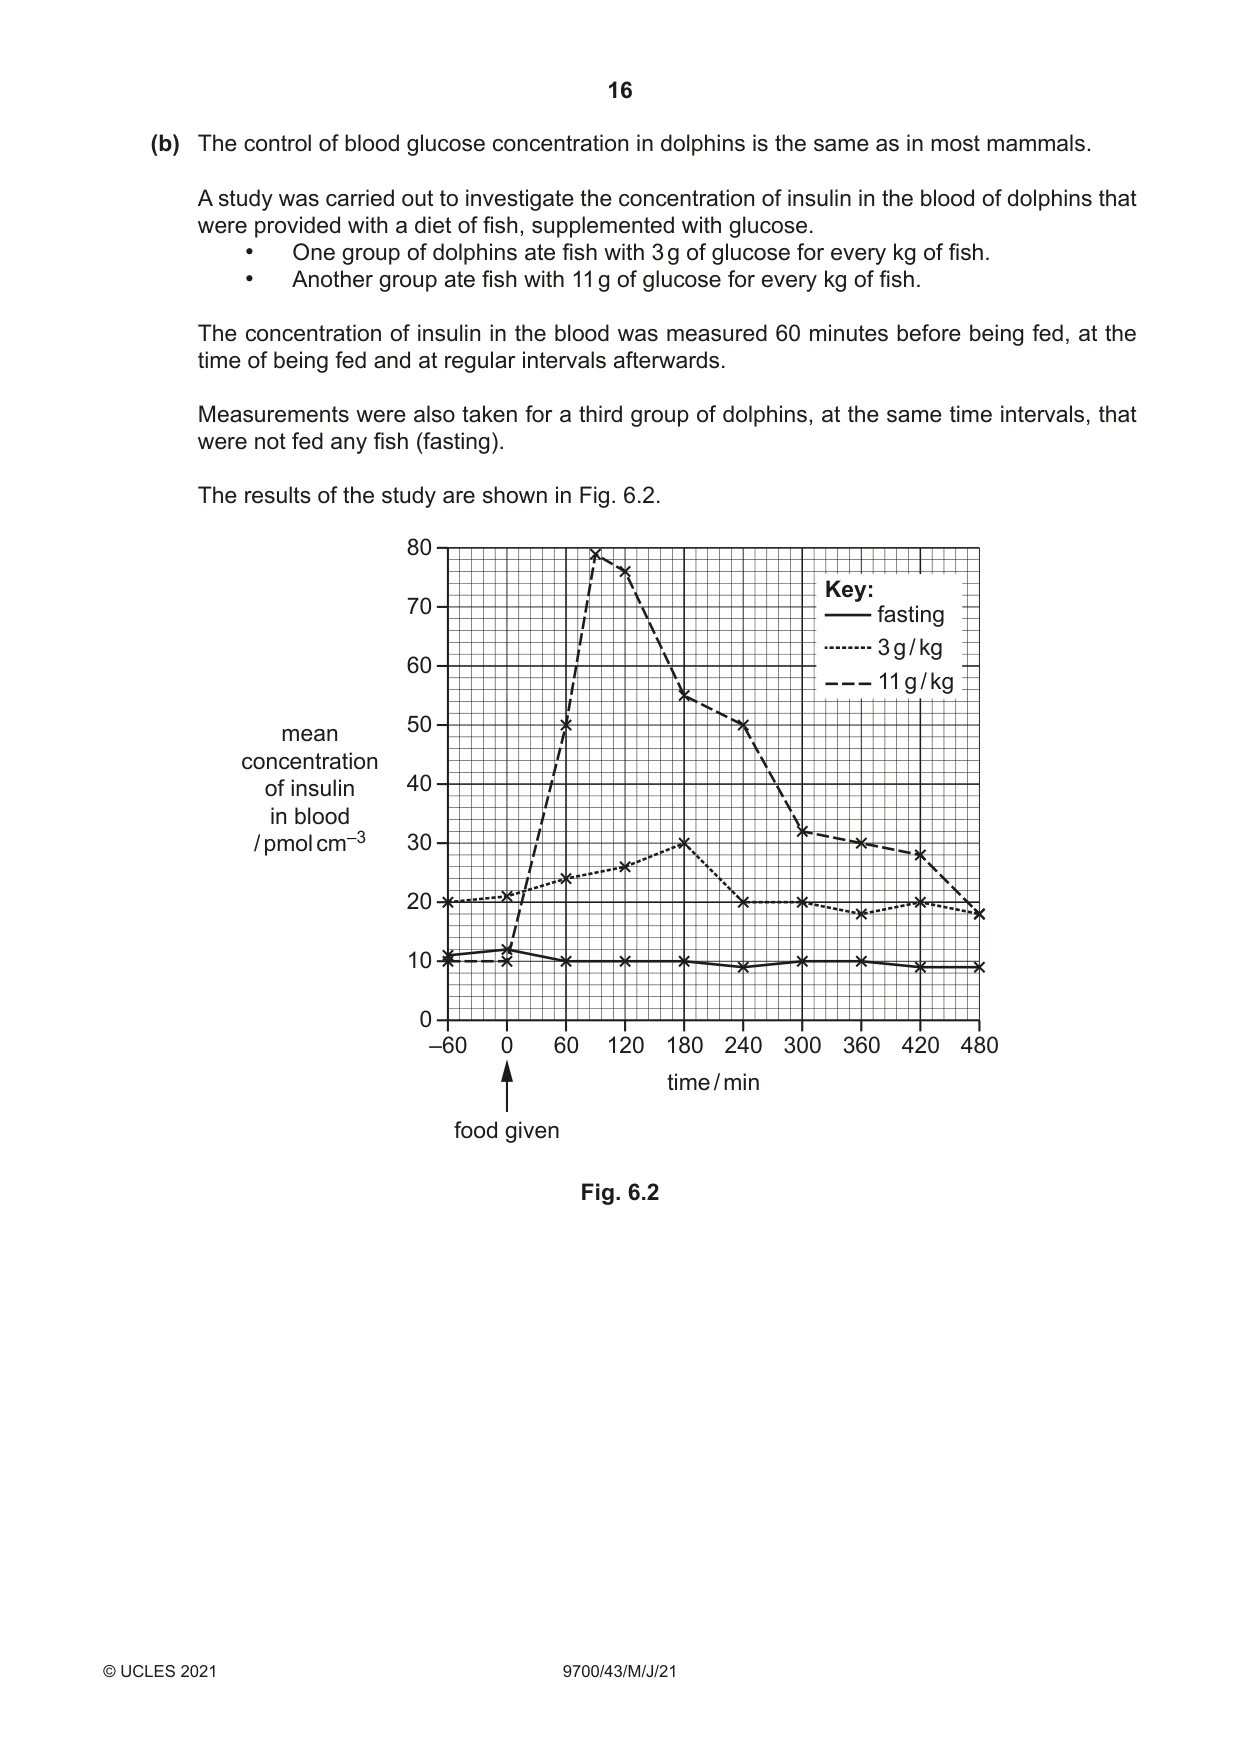
6 (a) The bottlenose dolphin, Tursiops truncatus, is an aquatic mammal. It has adaptations to conserve heat when swimming in cold water. Fig. 6.1 shows a bottlenose dolphin. flipper Fig. 6.1 (i) The arteries in the bottlenose dolphin that carry blood to the flippers are surrounded by veins bringing blood back to the rest of the body. Outline how this arrangement of blood vessels is an adaptation to conserve body heat. ........................................................................................................................................... ..................................................................................................................................... [1] (ii) When a dolphin has exercised for a long time, it may need to lose excess heat. Unlike humans, dolphins do not produce sweat. Suggest how a dolphin may lose excess heat. ........................................................................................................................................... ..................................................................................................................................... [1] (b) The control of blood glucose concentration in dolphins is the same as in most mammals. A study was carried out to investigate the concentration of insulin in the blood of dolphins that were provided with a diet of fish, supplemented with glucose. • One group of dolphins ate fish with 3 g of glucose for every kg of fish. • Another group ate fish with 11 g of glucose for every kg of fish. The concentration of insulin in the blood was measured 60 minutes before being fed, at the time of being fed and at regular intervals afterwards. Measurements were also taken for a third group of dolphins, at the same time intervals, that were not fed any fish (fasting). The results of the study are shown in Fig. 6.2. 80 Key: 70 fasting 3 g / kg 60 11 g / kg 50 mean concentration of insulin 40 in blood / pmol cm–3 30 20 10 0 –60 0 60 120 180 240 300 360 420 480 time / min food given Fig. 6.2 (i) Describe the trends shown in Fig. 6.2. ........................................................................................................................................... ........................................................................................................................................... ........................................................................................................................................... ........................................................................................................................................... ........................................................................................................................................... ........................................................................................................................................... ........................................................................................................................................... ........................................................................................................................................... ........................................................................................................................................... ..................................................................................................................................... [4] (ii) The mean concentration of insulin in the blood changes over time for the dolphins that were fed fish with 11 g of glucose per kg of fish. Calculate the rate of change in the mean concentration of insulin in this group of dolphins from the time of being fed until the concentration reaches its maximum. Show your working. ................................ pmol cm–3 min–1 [2] (c) Blood glucose concentration is regulated by negative feedback. Explain what is meant by negative feedback. ................................................................................................................................................... ................................................................................................................................................... ................................................................................................................................................... ................................................................................................................................................... ................................................................................................................................................... ................................................................................................................................................... ............................................................................................................................................. [3] [Total: 11]
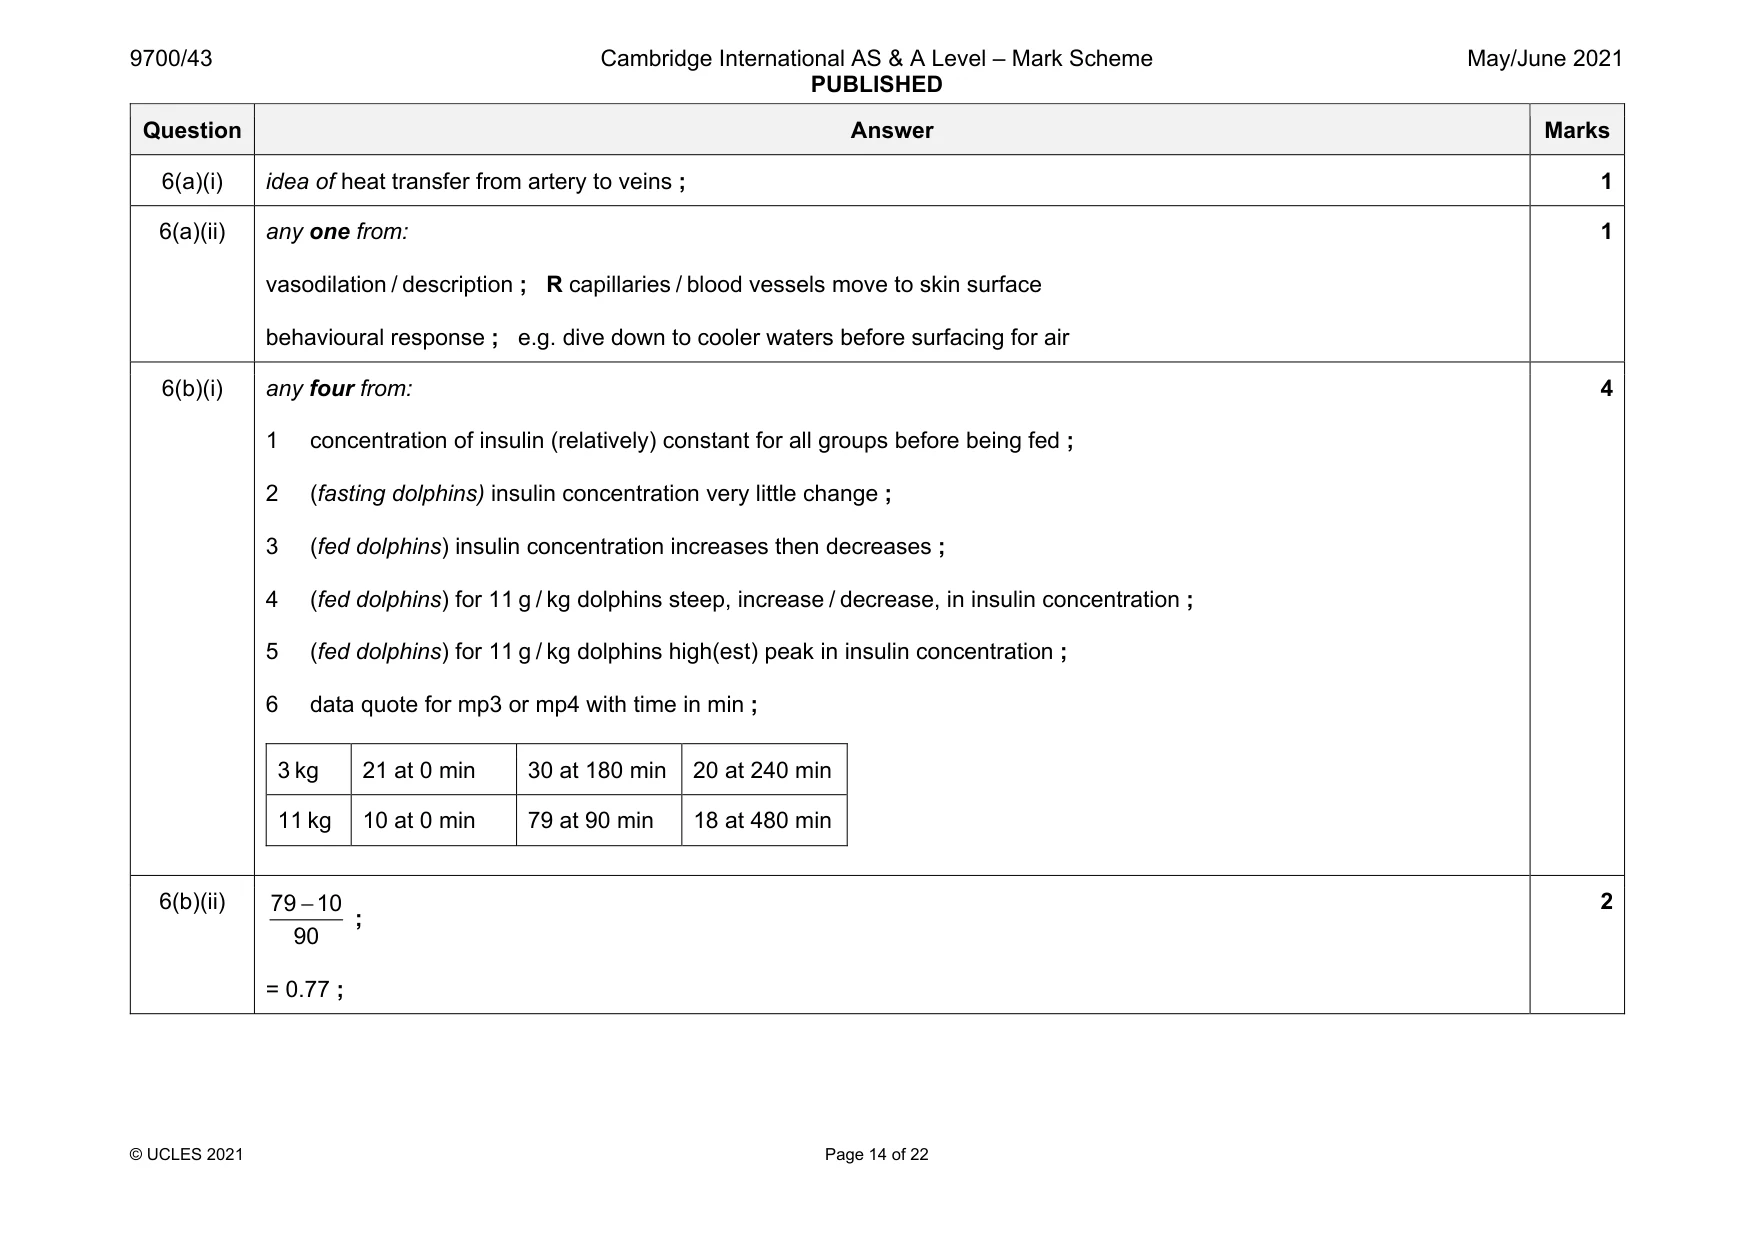
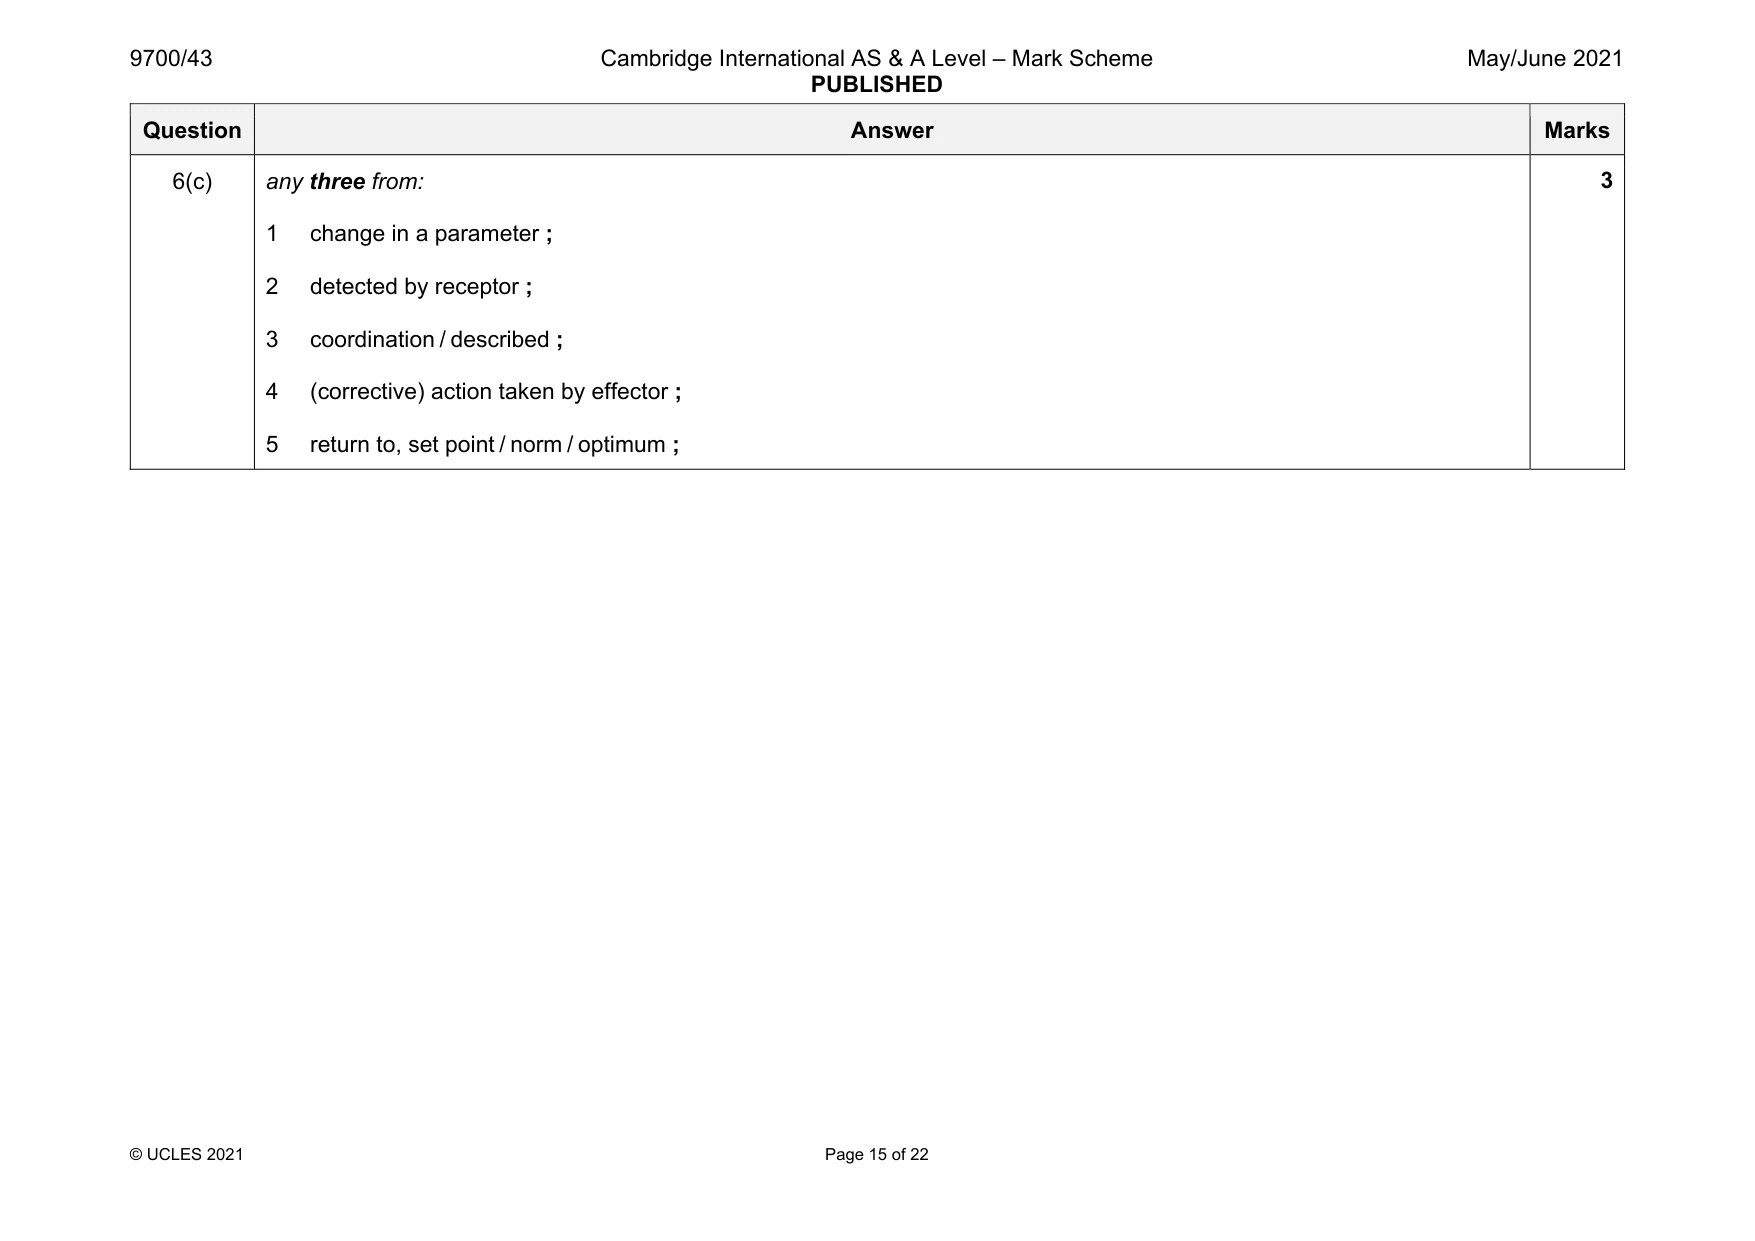
Mark scheme: 6(a)(i) idea of heat transfer from artery to veins ; 1 6(a)(ii) any one from: vasodilation / description ; R capillaries / blood vessels move to skin surface behavioural response ; e.g. dive down to cooler waters before surfacing for air 1 6(b)(i) any four from: 1 concentration of insulin (relatively) constant for all groups before being fed ; 2 (fasting dolphins) insulin concentration very little change ; 3 (fed dolphins) insulin concentration increases then decreases ; 4 (fed dolphins) for 11 g / kg dolphins steep, increase / decrease, in insulin concentration ; 5 (fed dolphins) for 11 g / kg dolphins high(est) peak in insulin concentration ; 6 data quote for mp3 or mp4 with time in min ; 3 kg 21 at 0 min 30 at 180 min 20 at 240 min 11 kg 10 at 0 min 79 at 90 min 18 at 480 min 4 6(b)(ii) − 79 10 90 ; = 0.77 ; 2 Question Answer Marks 6(c) any three from: 1 change in a parameter ; 2 detected by receptor ; 3 coordination / described ; 4 (corrective) action taken by effector ; 5 return to, set point / norm / optimum ; 3
Q7 · Haemoglobin is made of two α‑globin chains and two β‑globin chains
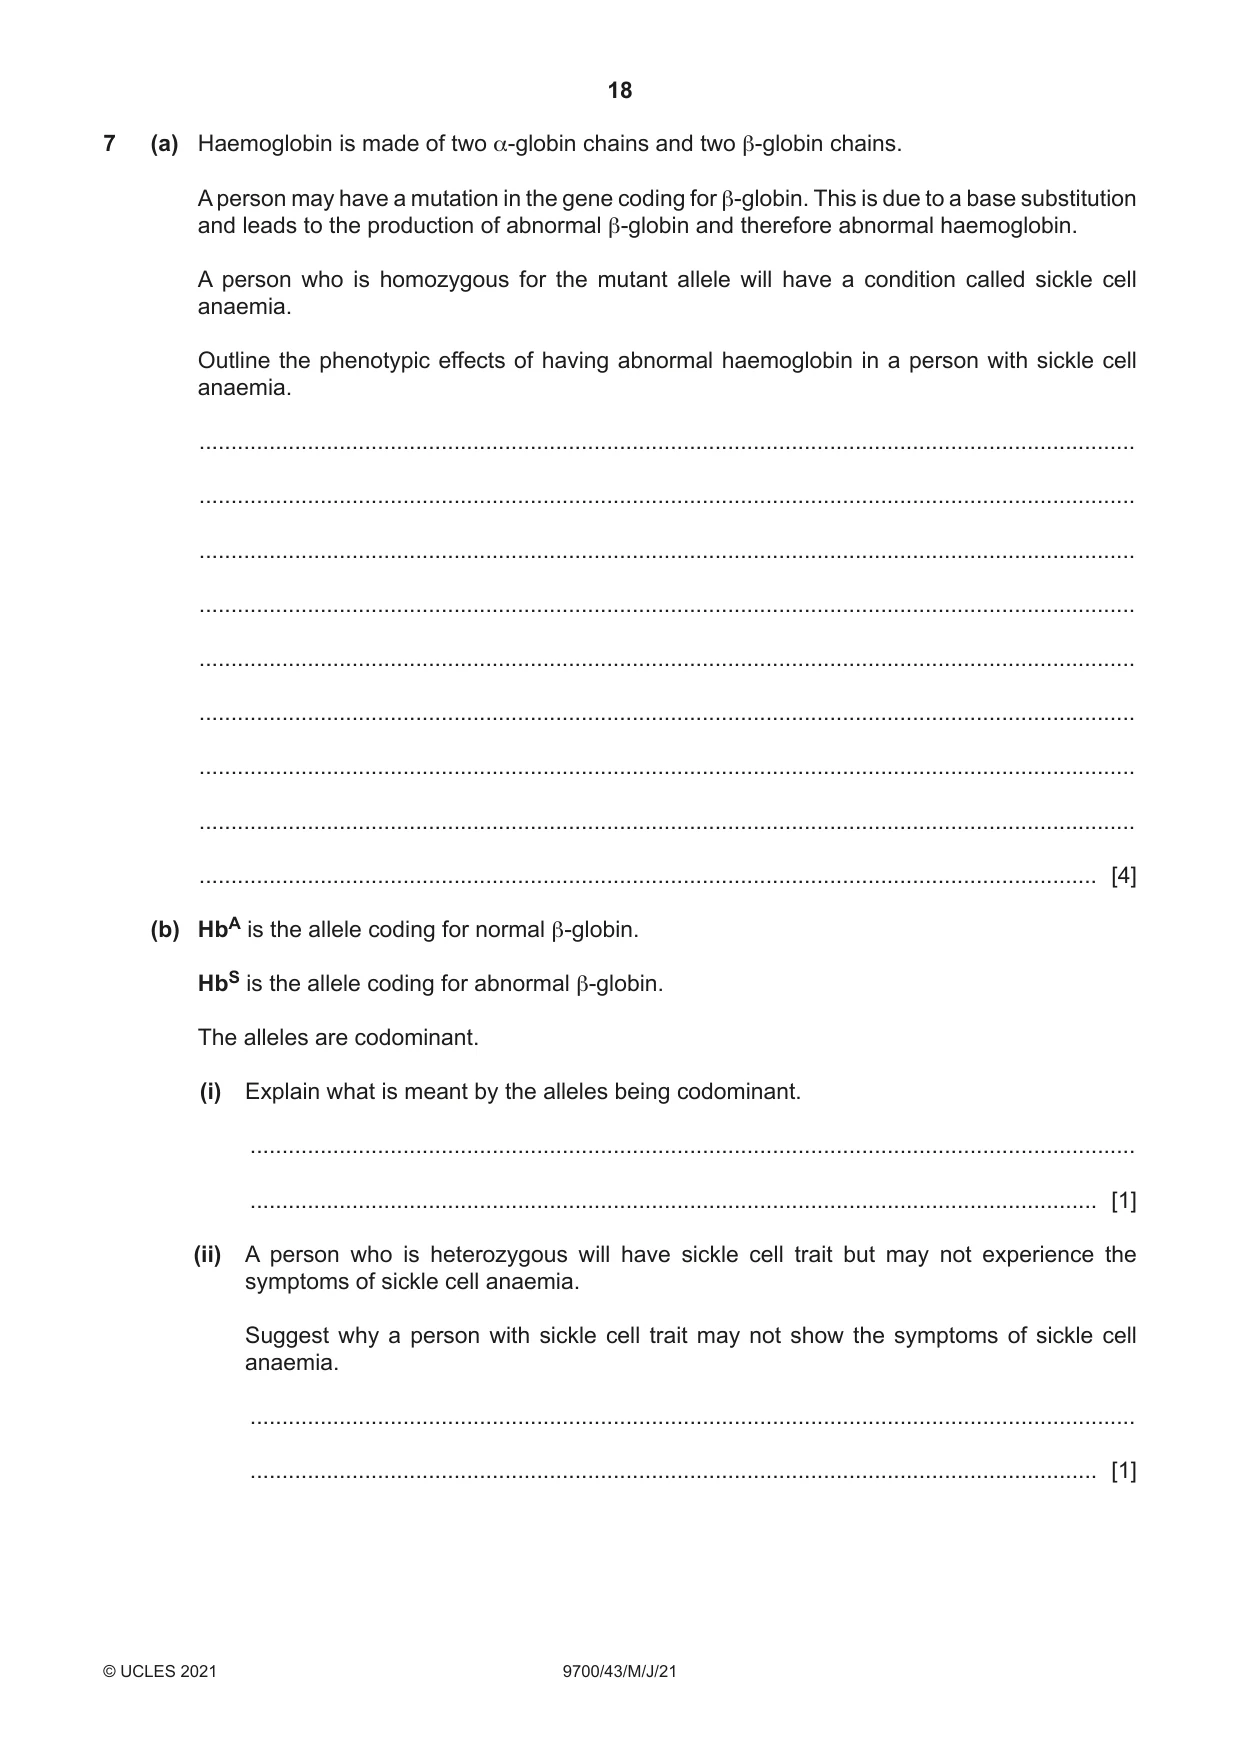
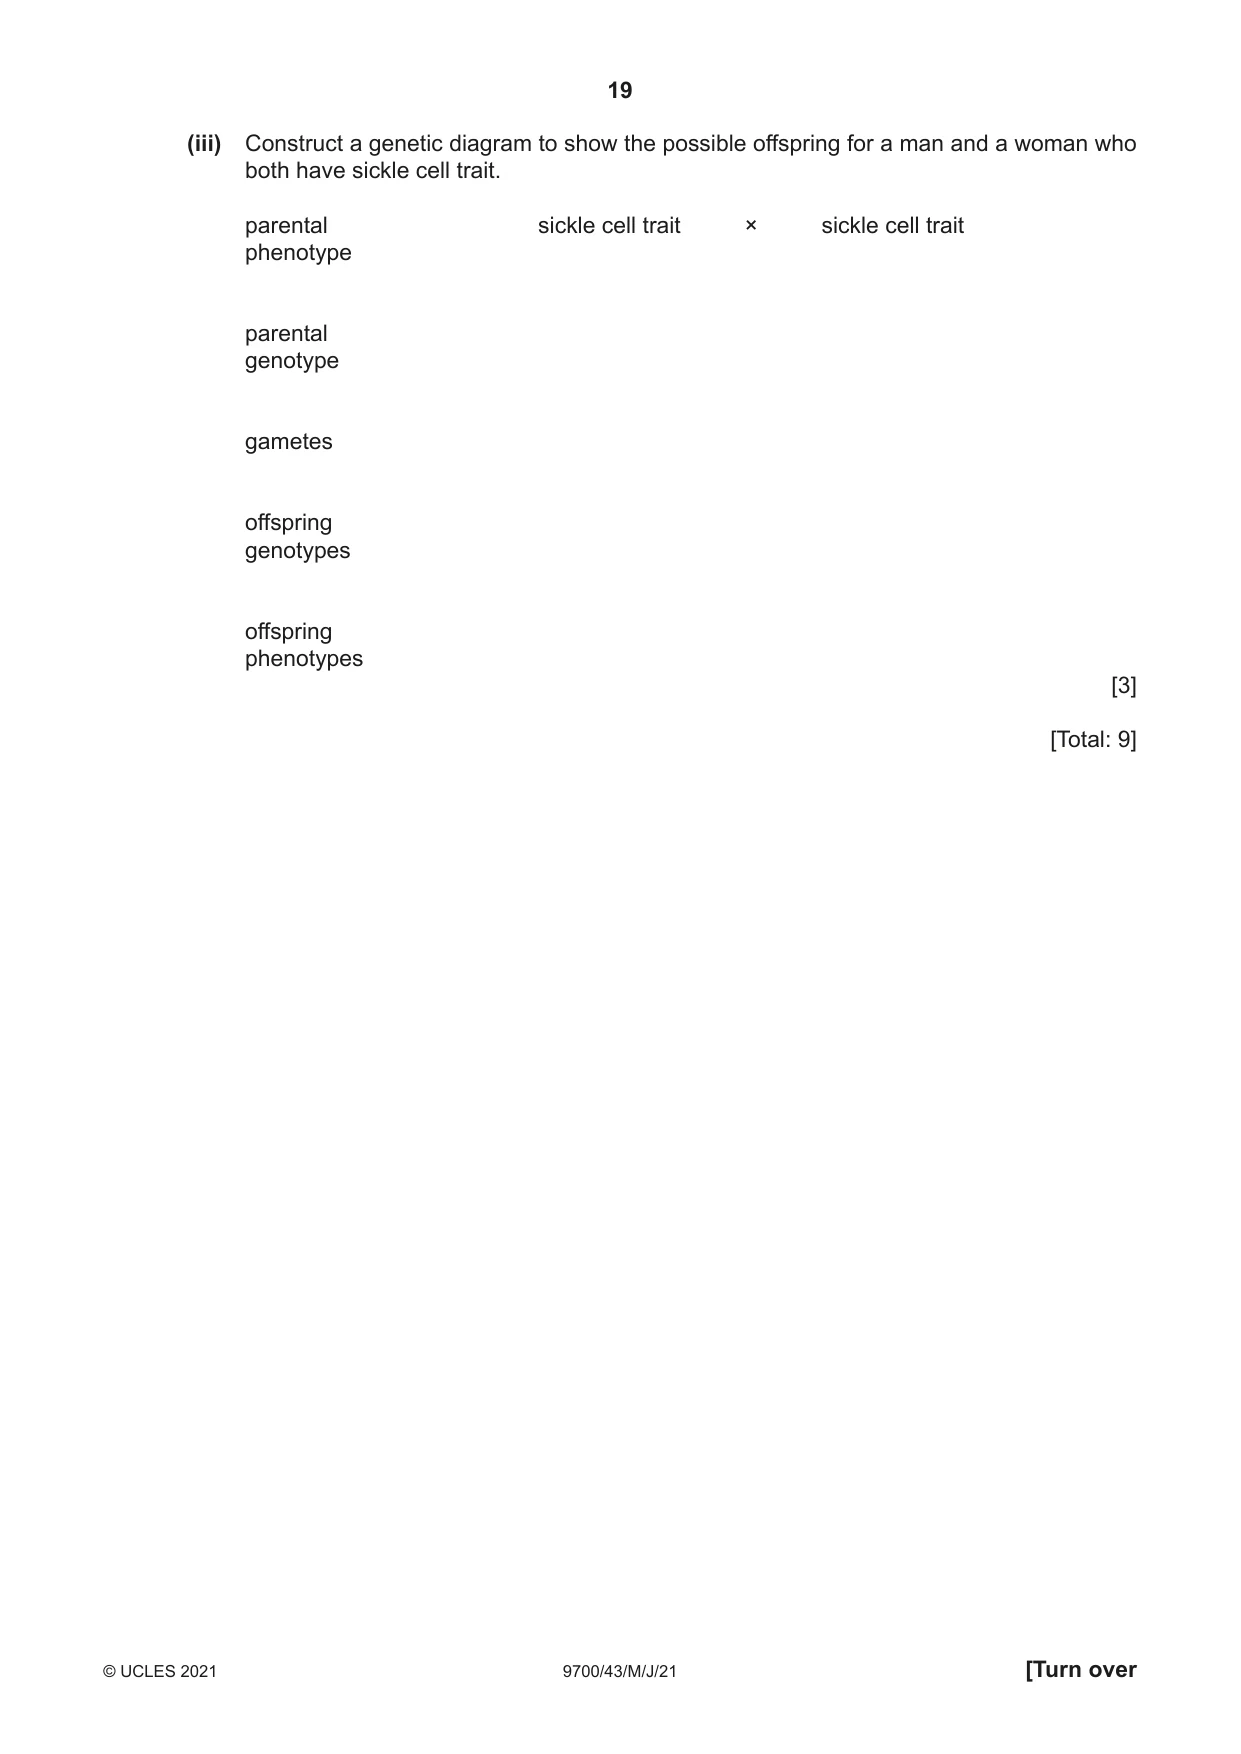
7 (a) Haemoglobin is made of two α‑globin chains and two β‑globin chains. A person may have a mutation in the gene coding for β‑globin. This is due to a base substitution and leads to the production of abnormal β‑globin and therefore abnormal haemoglobin. A person who is homozygous for the mutant allele will have a condition called sickle cell anaemia. Outline the phenotypic effects of having abnormal haemoglobin in a person with sickle cell anaemia. ................................................................................................................................................... ................................................................................................................................................... ................................................................................................................................................... ................................................................................................................................................... ................................................................................................................................................... ................................................................................................................................................... ................................................................................................................................................... ................................................................................................................................................... ............................................................................................................................................. [4] (b) HbA is the allele coding for normal β‑globin. HbS is the allele coding for abnormal β‑globin. The alleles are codominant. (i) Explain what is meant by the alleles being codominant. ........................................................................................................................................... ..................................................................................................................................... [1] (ii) A person who is heterozygous will have sickle cell trait but may not experience the symptoms of sickle cell anaemia. Suggest why a person with sickle cell trait may not show the symptoms of sickle cell anaemia. ........................................................................................................................................... ..................................................................................................................................... [1] (iii) Construct a genetic diagram to show the possible offspring for a man and a woman who both have sickle cell trait. parental sickle cell trait × sickle cell trait phenotype parental genotype gametes offspring genotypes offspring phenotypes [3] [Total: 9]
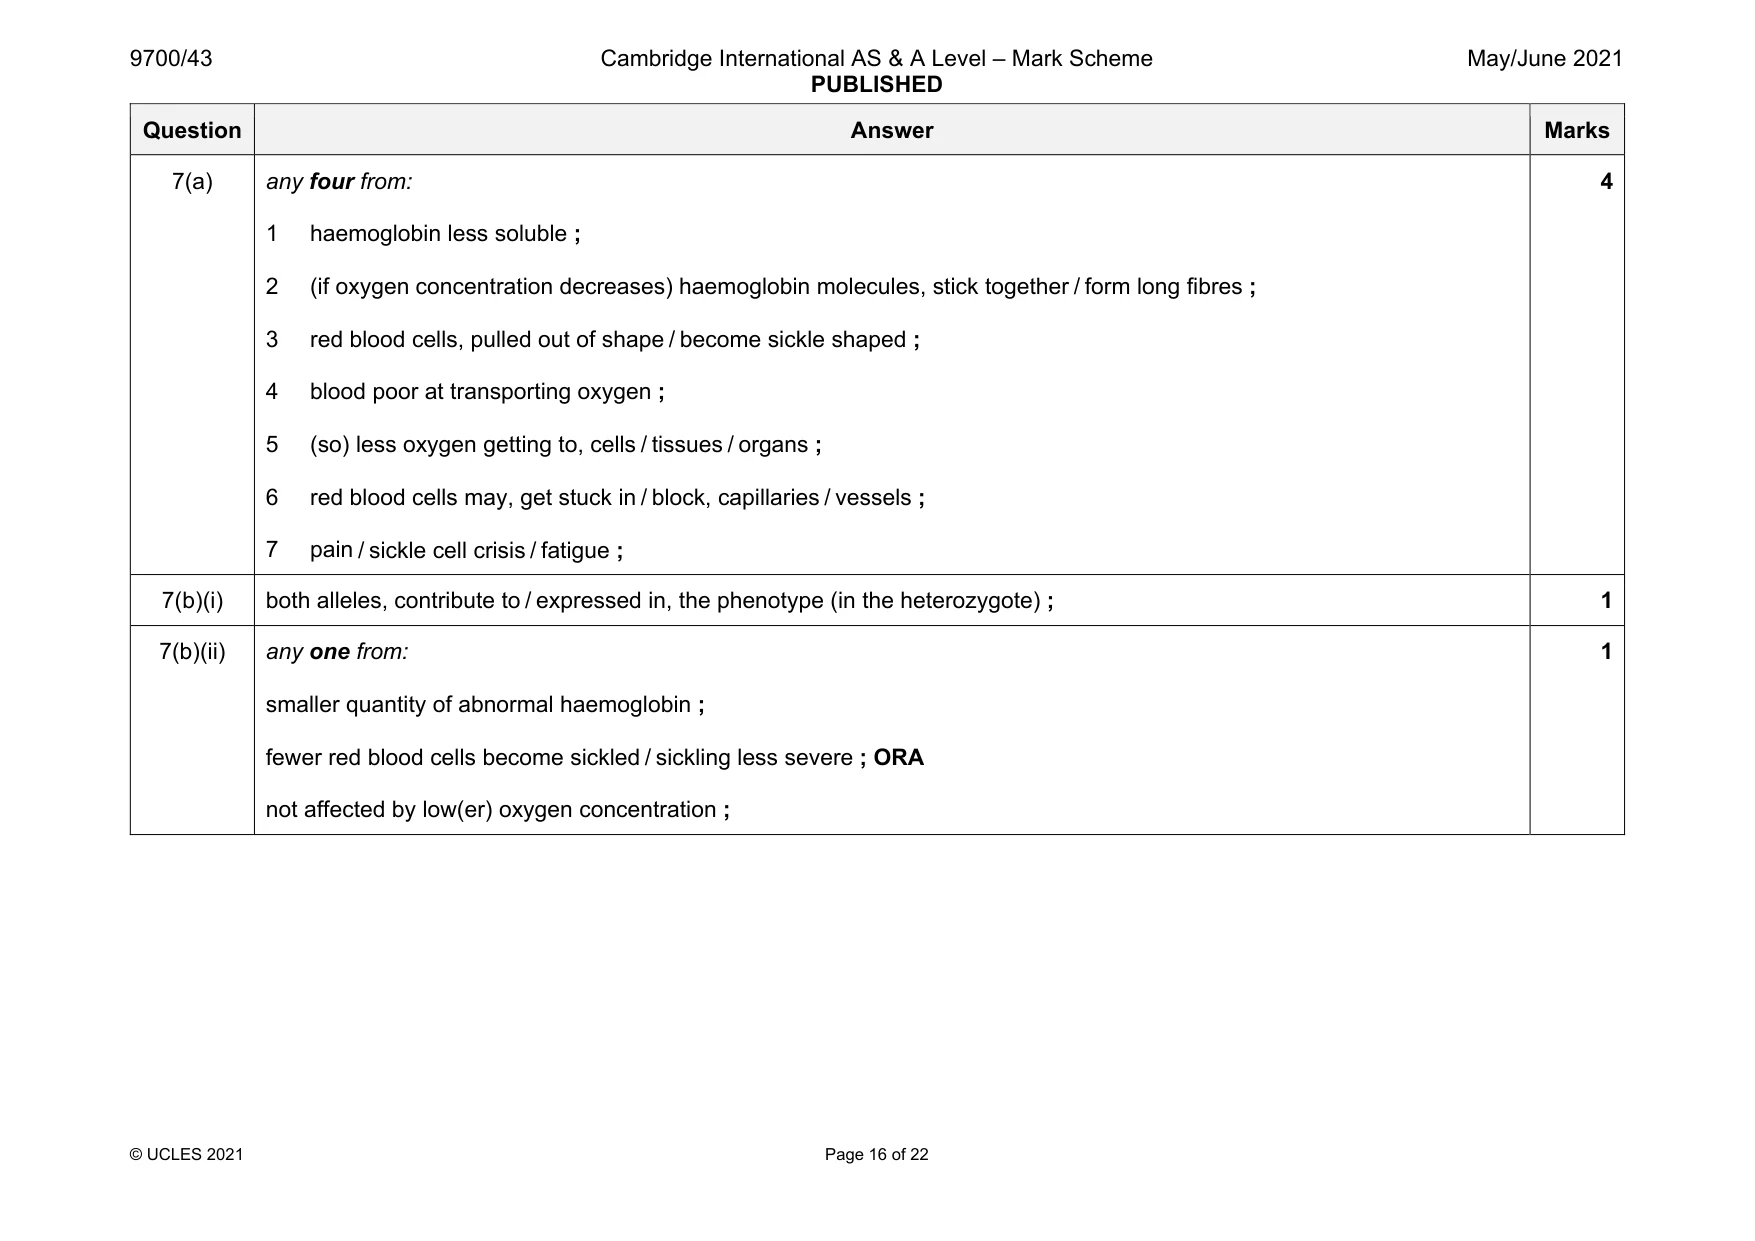
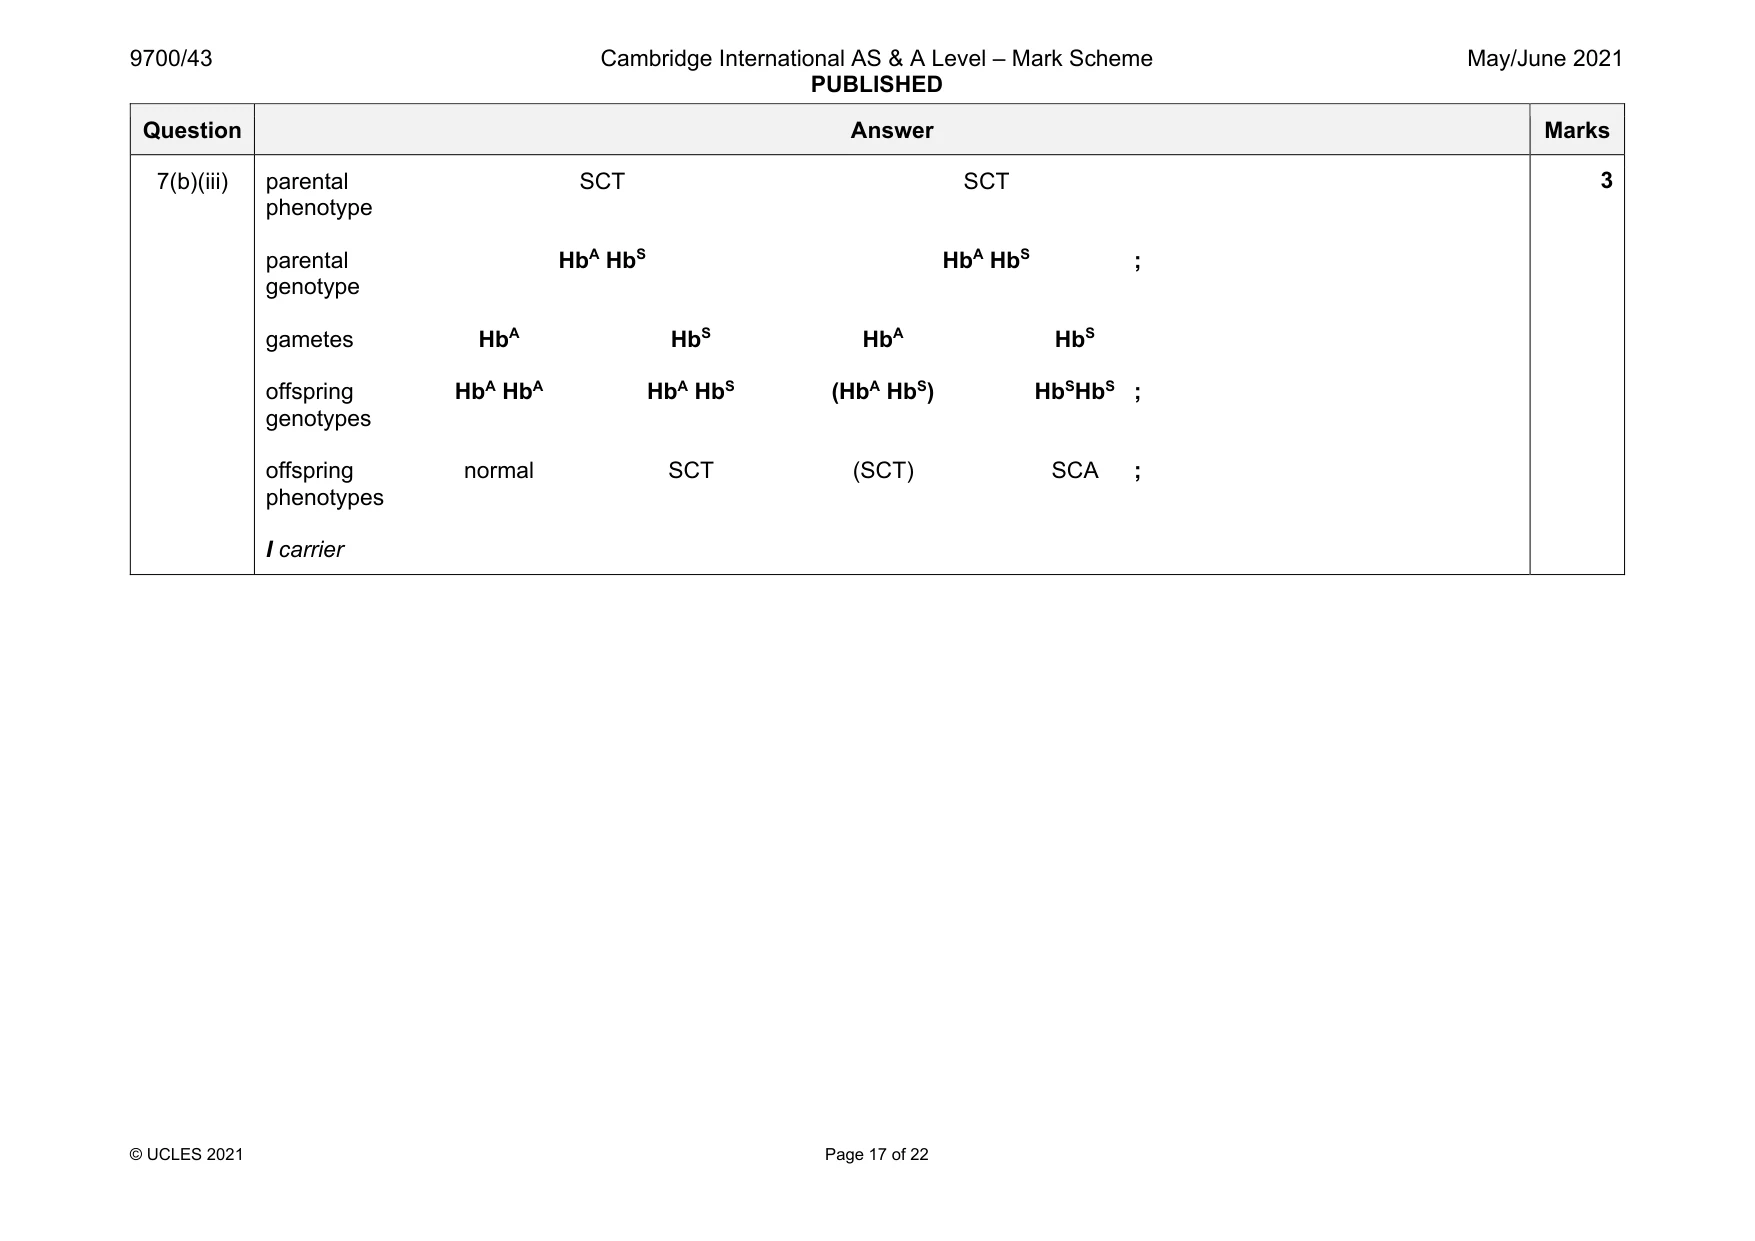
Mark scheme: 7(a) any four from: 1 haemoglobin less soluble ; 2 (if oxygen concentration decreases) haemoglobin molecules, stick together / form long fibres ; 3 red blood cells, pulled out of shape / become sickle shaped ; 4 blood poor at transporting oxygen ; 5 (so) less oxygen getting to, cells / tissues / organs ; 6 red blood cells may, get stuck in / block, capillaries / vessels ; 7 pain / sickle cell crisis / fatigue ; 4 7(b)(i) both alleles, contribute to / expressed in, the phenotype (in the heterozygote) ; 1 7(b)(ii) any one from: smaller quantity of abnormal haemoglobin ; fewer red blood cells become sickled / sickling less severe ; ORA not affected by low(er) oxygen concentration ; 1 Question Answer Marks 7(b)(iii) parental SCT SCT phenotype parental HbA HbS HbA HbS ; genotype gametes HbA HbS HbA HbS offspring HbA HbA HbA HbS (HbA HbS) HbSHbS ; genotypes offspring normal SCT (SCT) SCA ; phenotypes I carrier 3
More questions on Passage of information from parents to offspring
Q8 · Explain what is meant by stabilising selection
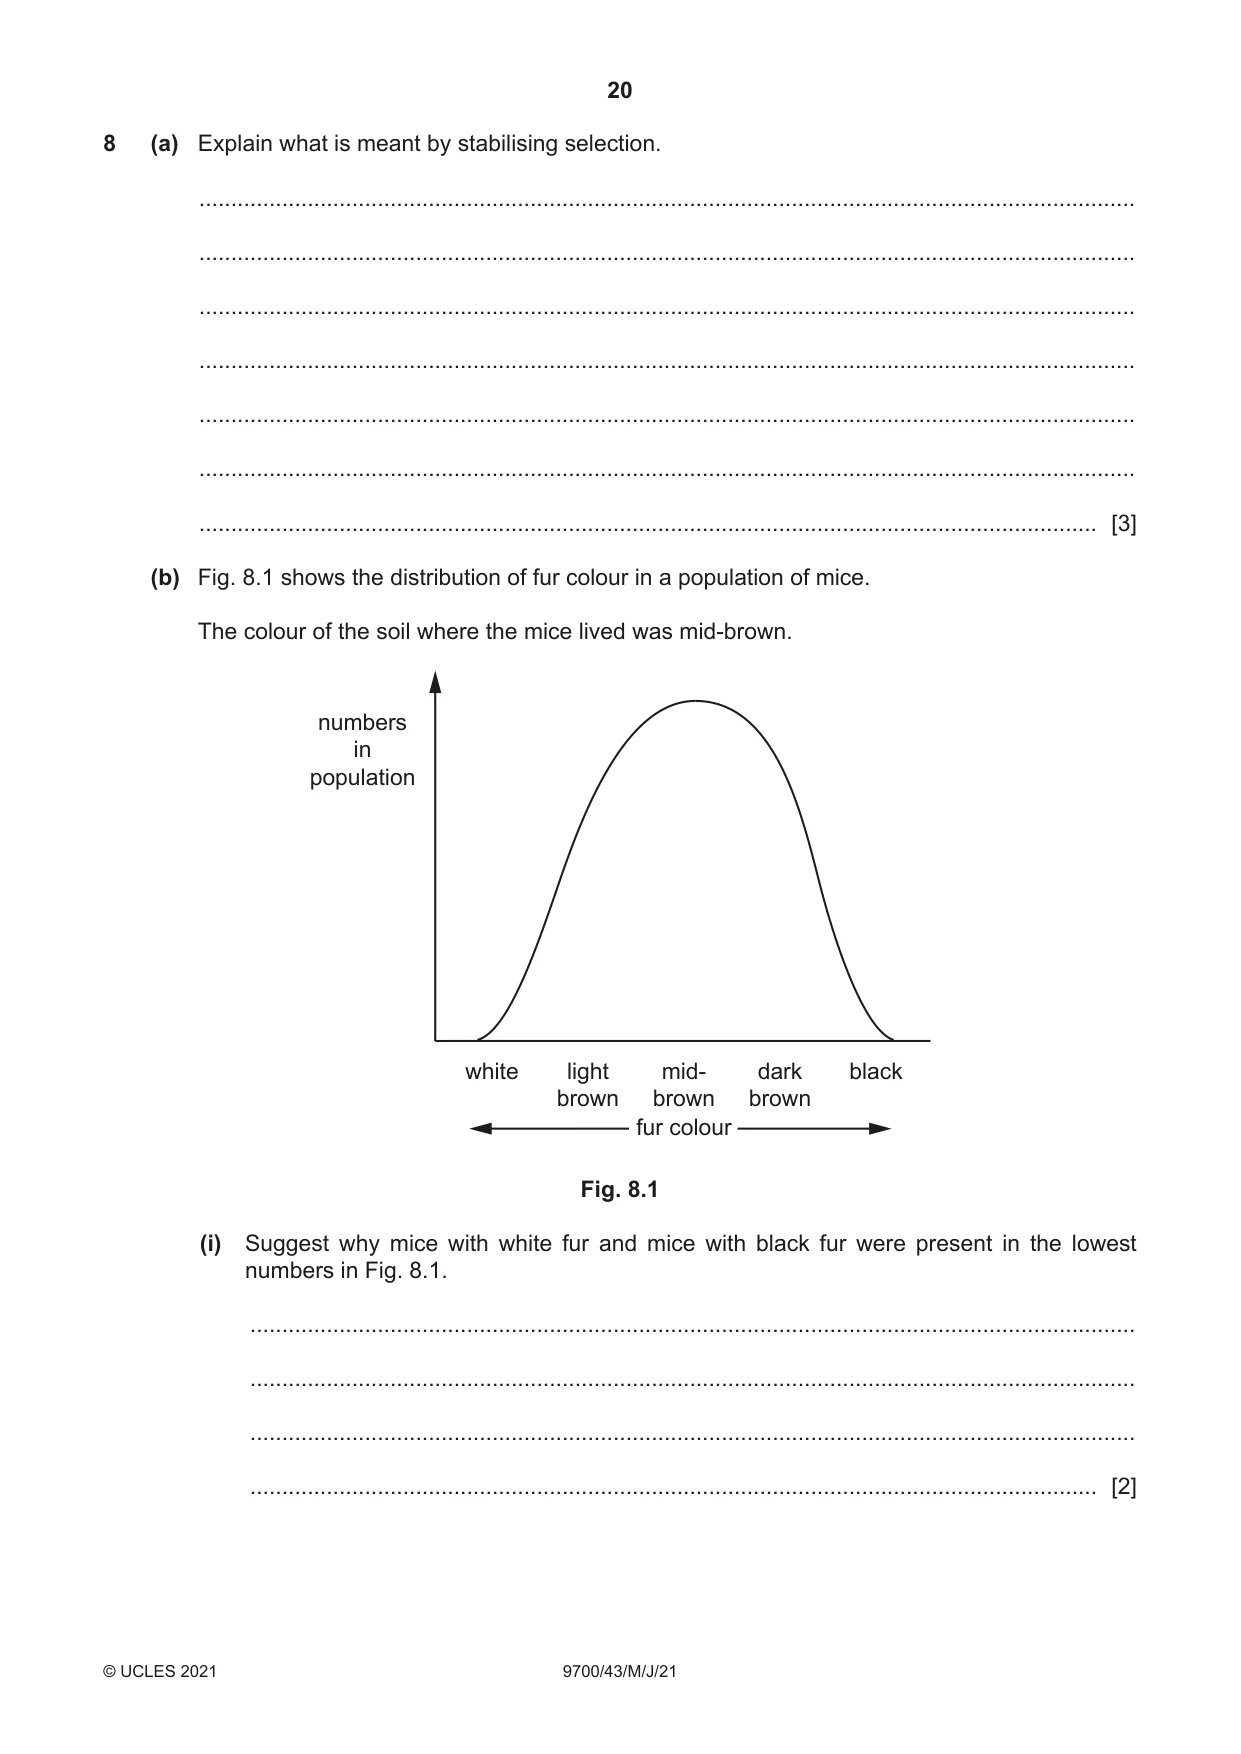
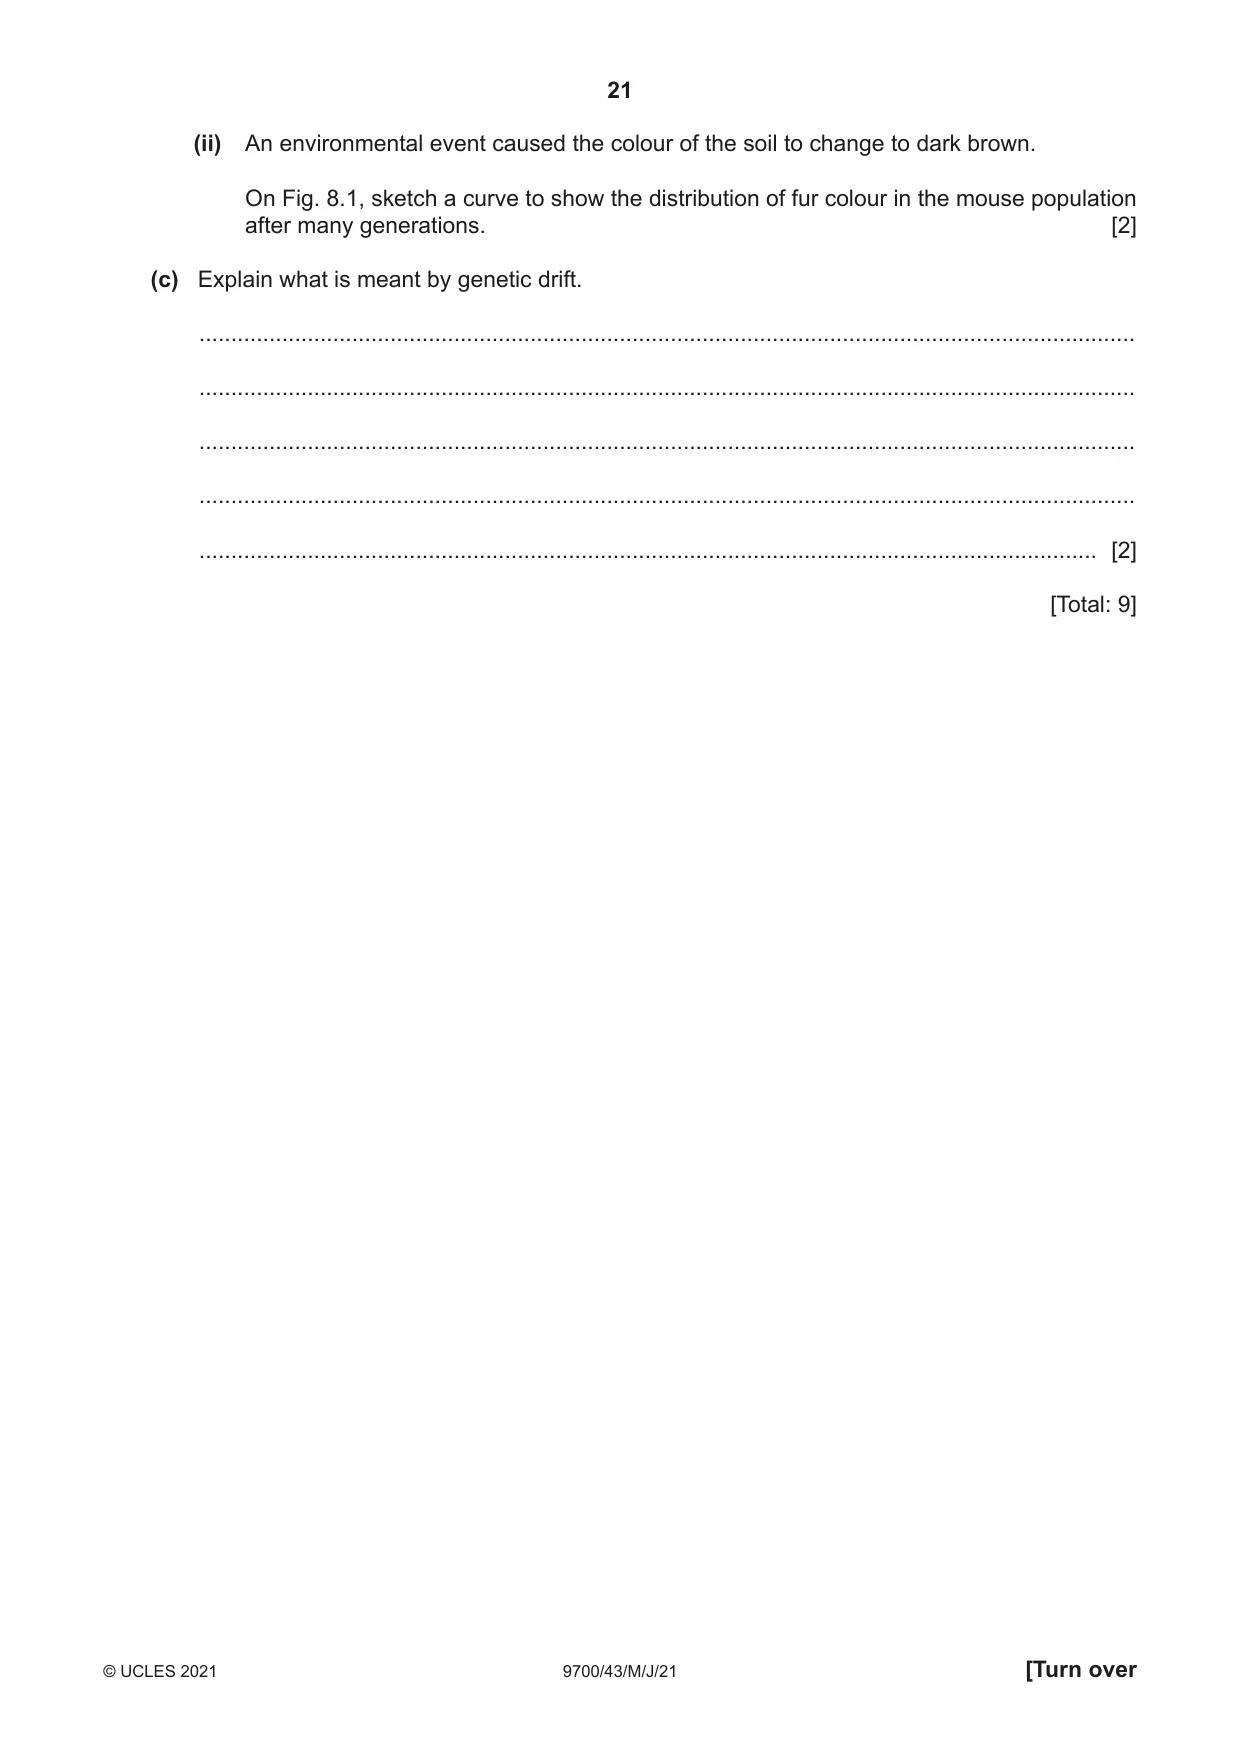
8 (a) Explain what is meant by stabilising selection. ................................................................................................................................................... ................................................................................................................................................... ................................................................................................................................................... ................................................................................................................................................... ................................................................................................................................................... ................................................................................................................................................... ............................................................................................................................................. [3] (b) Fig. 8.1 shows the distribution of fur colour in a population of mice. The colour of the soil where the mice lived was mid‑brown. numbers in population white light mid- dark black brown brown brown fur colour Fig. 8.1 (i) Suggest why mice with white fur and mice with black fur were present in the lowest numbers in Fig. 8.1. ........................................................................................................................................... ........................................................................................................................................... ........................................................................................................................................... ..................................................................................................................................... [2] (ii) An environmental event caused the colour of the soil to change to dark brown. On Fig. 8.1, sketch a curve to show the distribution of fur colour in the mouse population after many generations. [2] (c) Explain what is meant by genetic drift. ................................................................................................................................................... ................................................................................................................................................... ................................................................................................................................................... ................................................................................................................................................... ............................................................................................................................................. [2] [Total: 9]
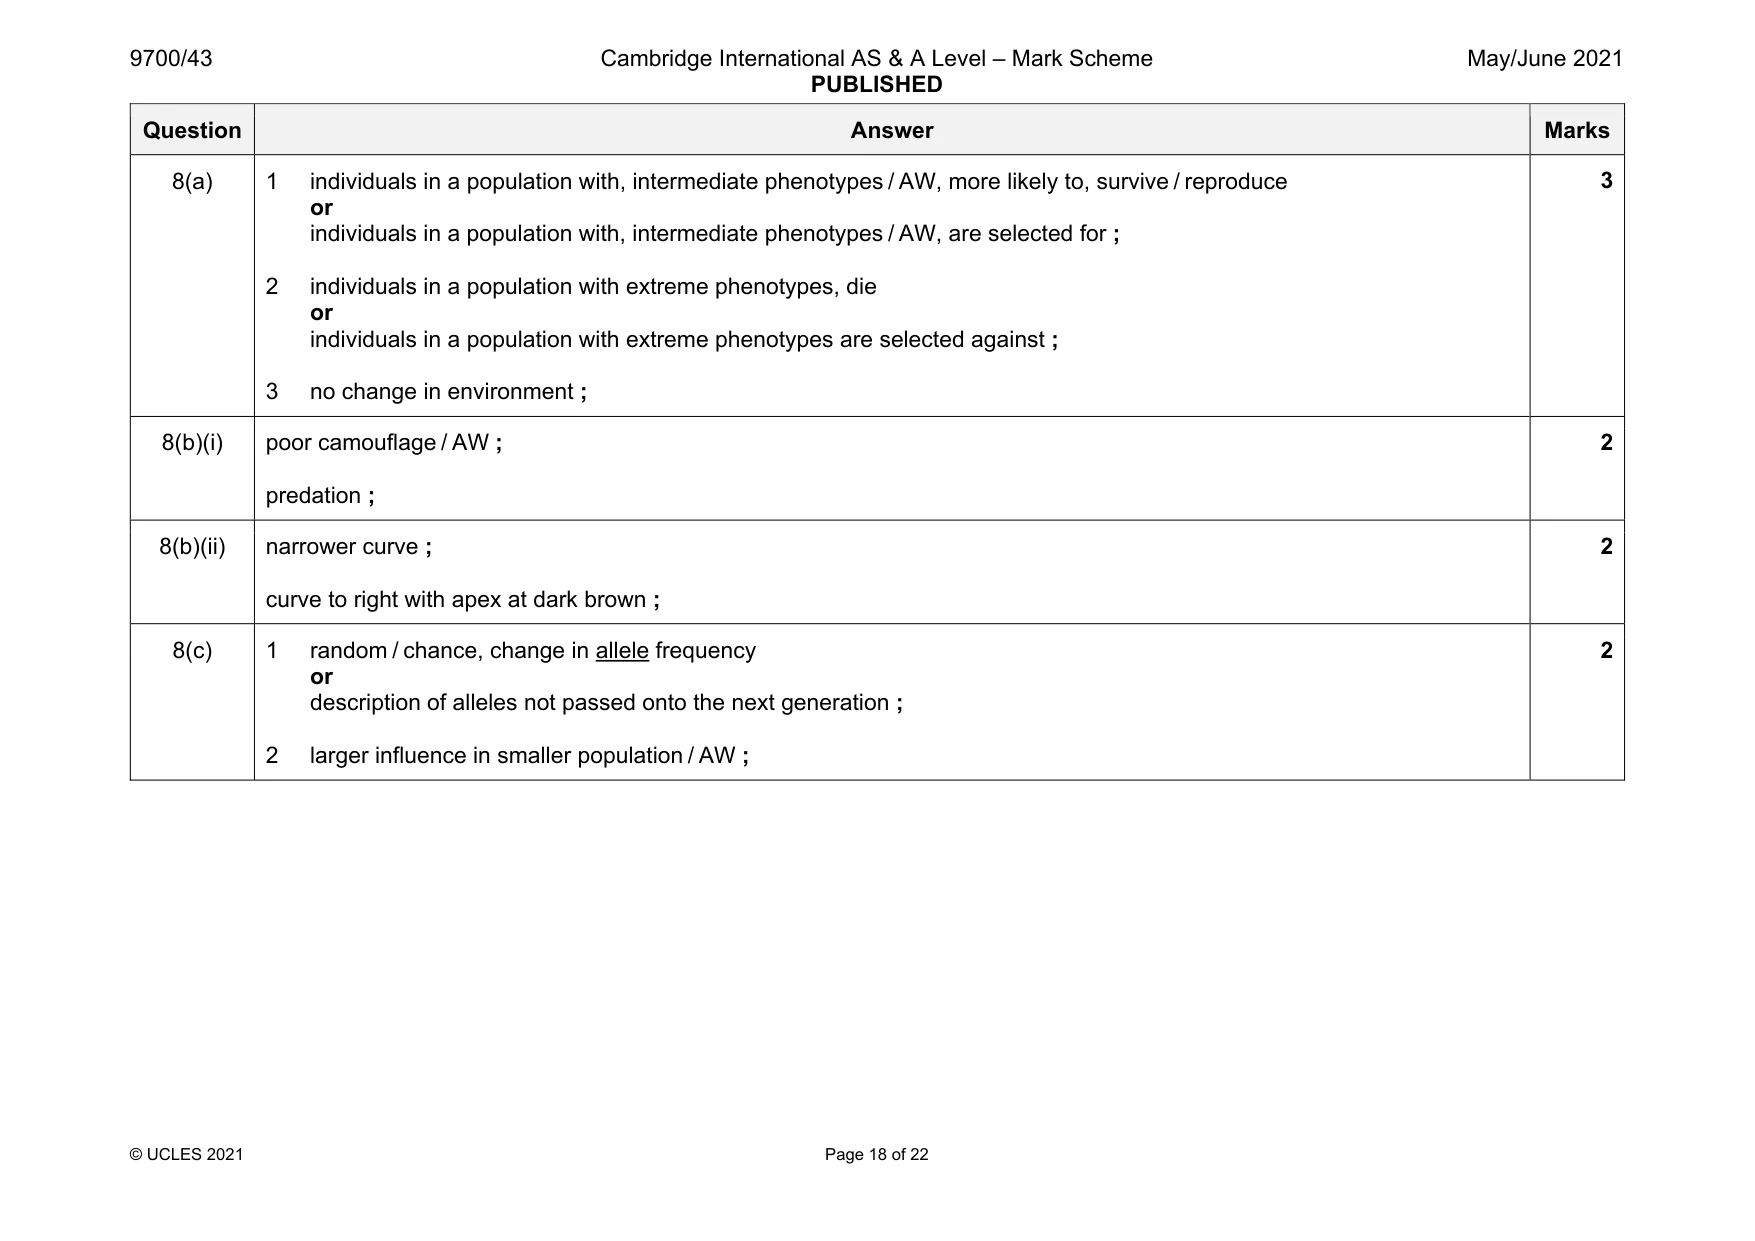
Mark scheme: 8(a) 1 individuals in a population with, intermediate phenotypes / AW, more likely to, survive / reproduce or individuals in a population with, intermediate phenotypes / AW, are selected for ; 2 individuals in a population with extreme phenotypes, die or individuals in a population with extreme phenotypes are selected against ; 3 no change in environment ; 8(b)(i) poor camouflage / AW ; predation ; 2 8(b)(ii) narrower curve ; curve to right with apex at dark brown ; 2 8(c) 1 random / chance, change in allele frequency or description of alleles not passed onto the next generation ; 2 larger influence in smaller population / AW ; 2
Q9 · Explain the use of genes for fluorescence as markers in gene technology
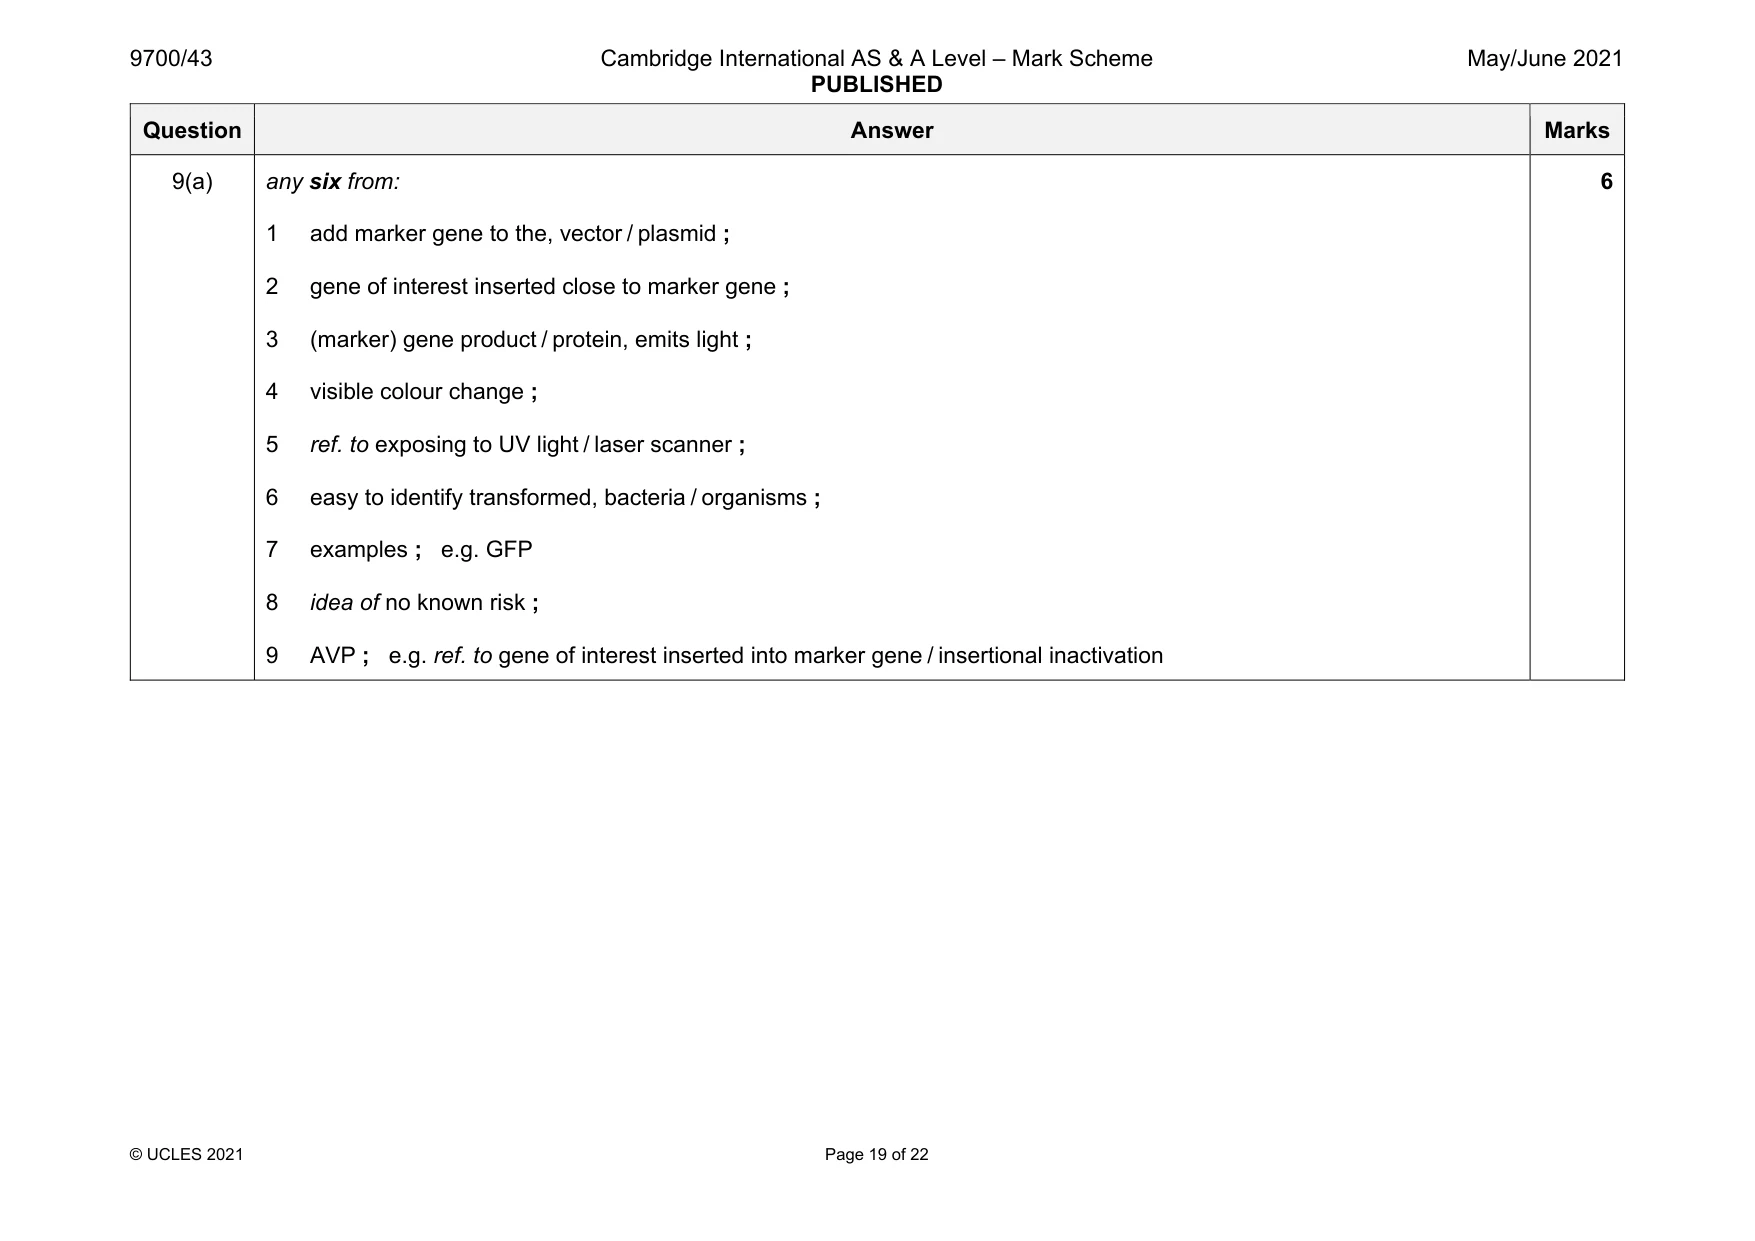
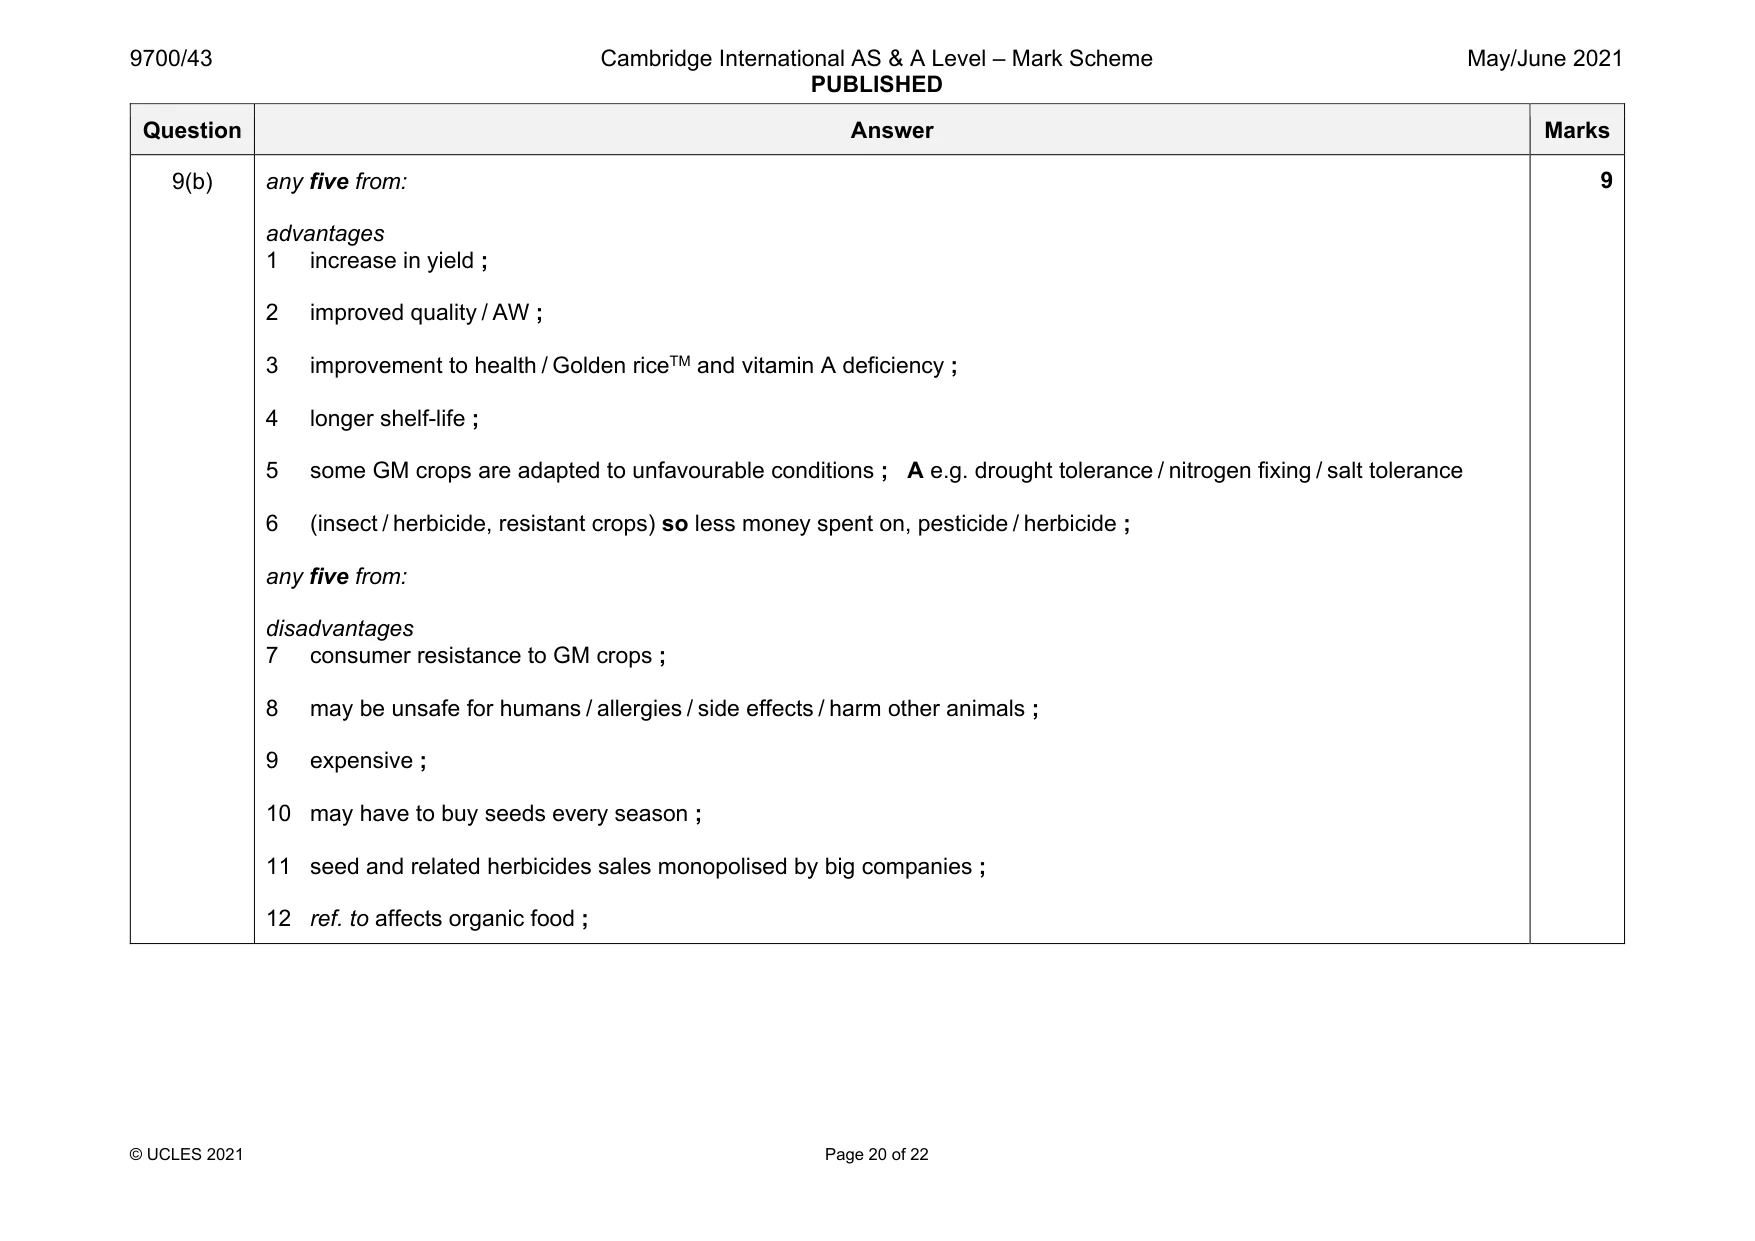
9 (a) Explain the use of genes for fluorescence as markers in gene technology. [6] (b) Discuss the social implications of using genetically modified organisms in food production. [9] [Total: 15]
Mark scheme: 9(a) any six from: 1 add marker gene to the, vector / plasmid ; 2 gene of interest inserted close to marker gene ; 3 (marker) gene product / protein, emits light ; 4 visible colour change ; 5 ref. to exposing to UV light / laser scanner ; 6 easy to identify transformed, bacteria / organisms ; 7 examples ; e.g. GFP 8 idea of no known risk ; 9 AVP ; e.g. ref. to gene of interest inserted into marker gene / insertional inactivation 6 Question Answer Marks 9(b) any five from: advantages 1 increase in yield ; 2 improved quality / AW ; 3 improvement to health / Golden riceTM and vitamin A deficiency ; 4 longer shelf-life ; 5 some GM crops are adapted to unfavourable conditions ; A e.g. drought tolerance / nitrogen fixing / salt tolerance 6 (insect / herbicide, resistant crops) so less money spent on, pesticide / herbicide ; any five from: disadvantages 7 consumer resistance to GM crops ; 8 may be unsafe for humans / allergies / side effects / harm other animals ; 9 expensive ; 10 may have to buy seeds every season ; 11 seed and related herbicides sales monopolised by big companies ; 12 ref. to affects organic food ; 9
More questions on Genetically modified organisms in agriculture
Q10 · Describe the roles of sodium ions in selective reabsorption in the nephron and calcium…
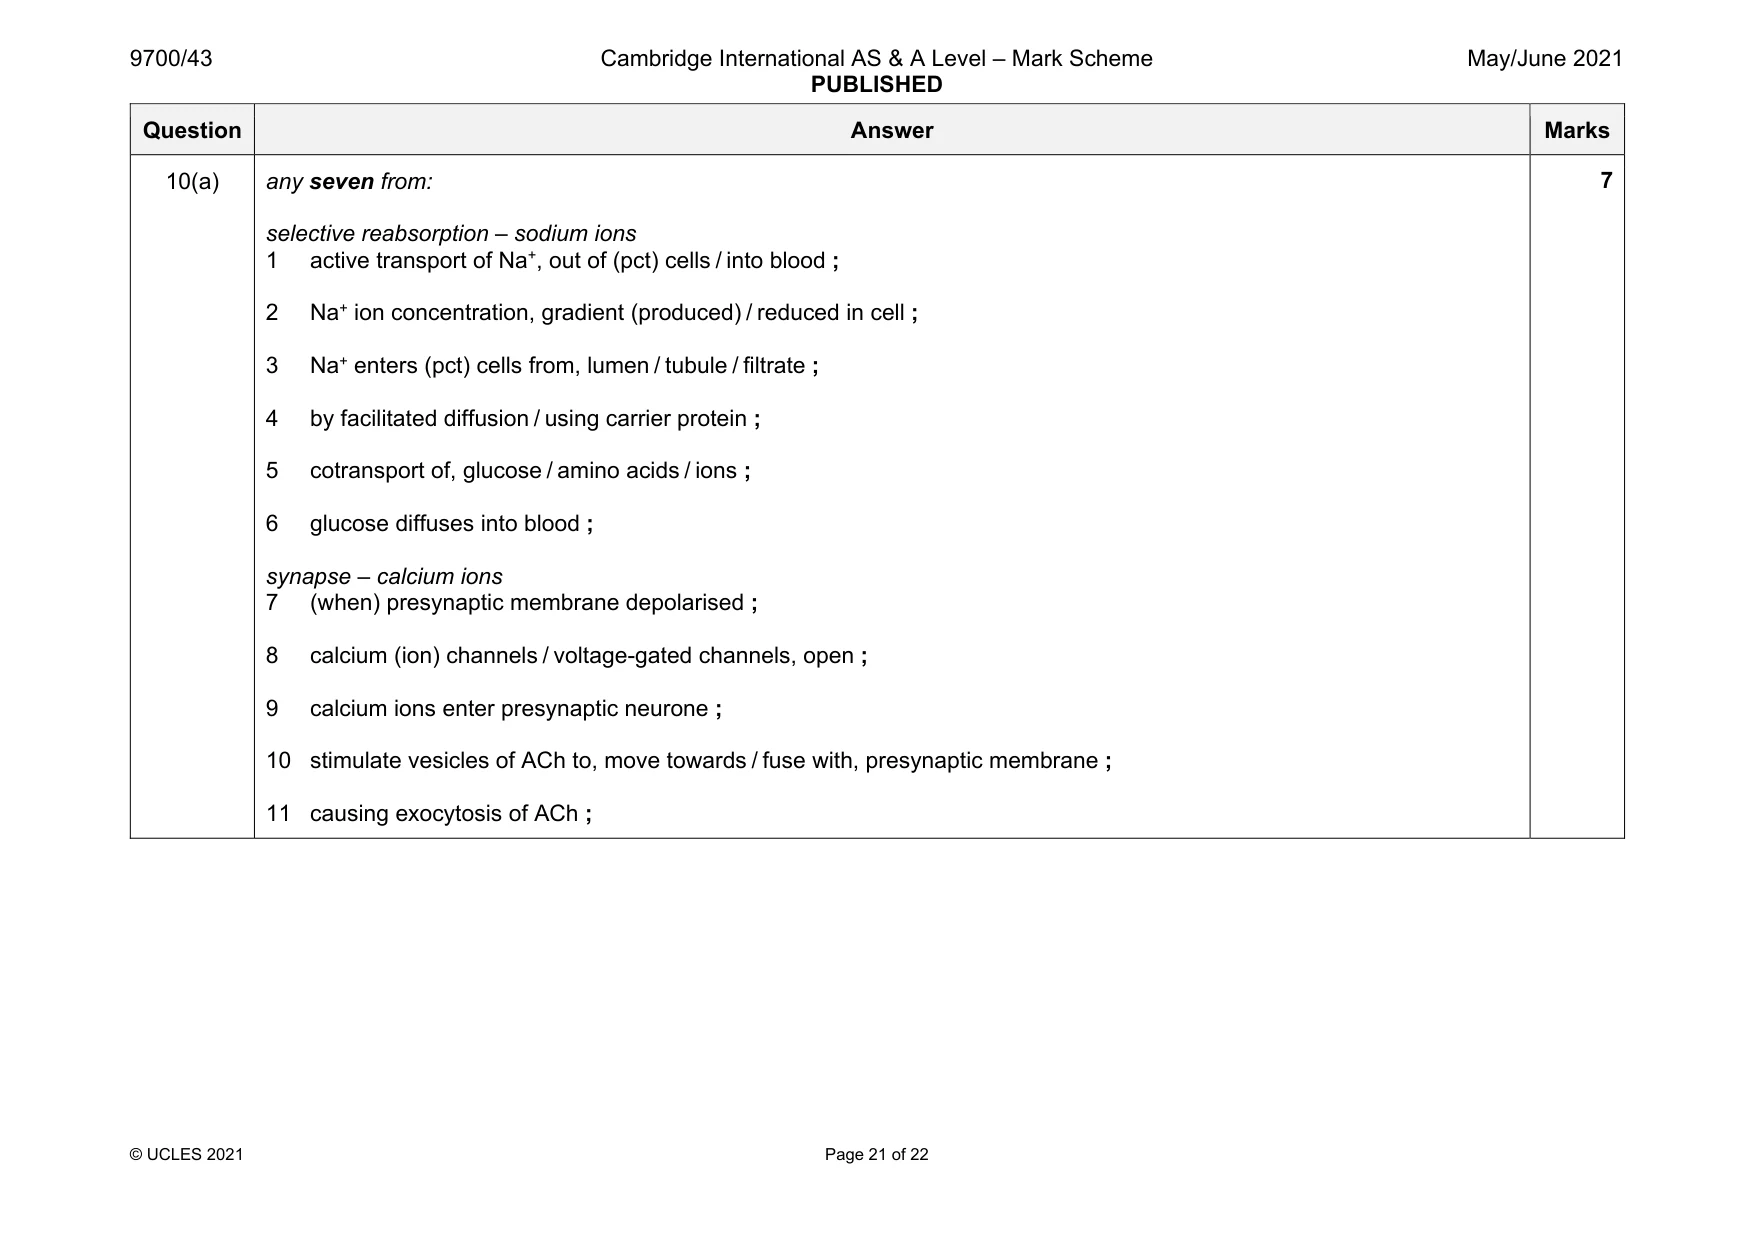
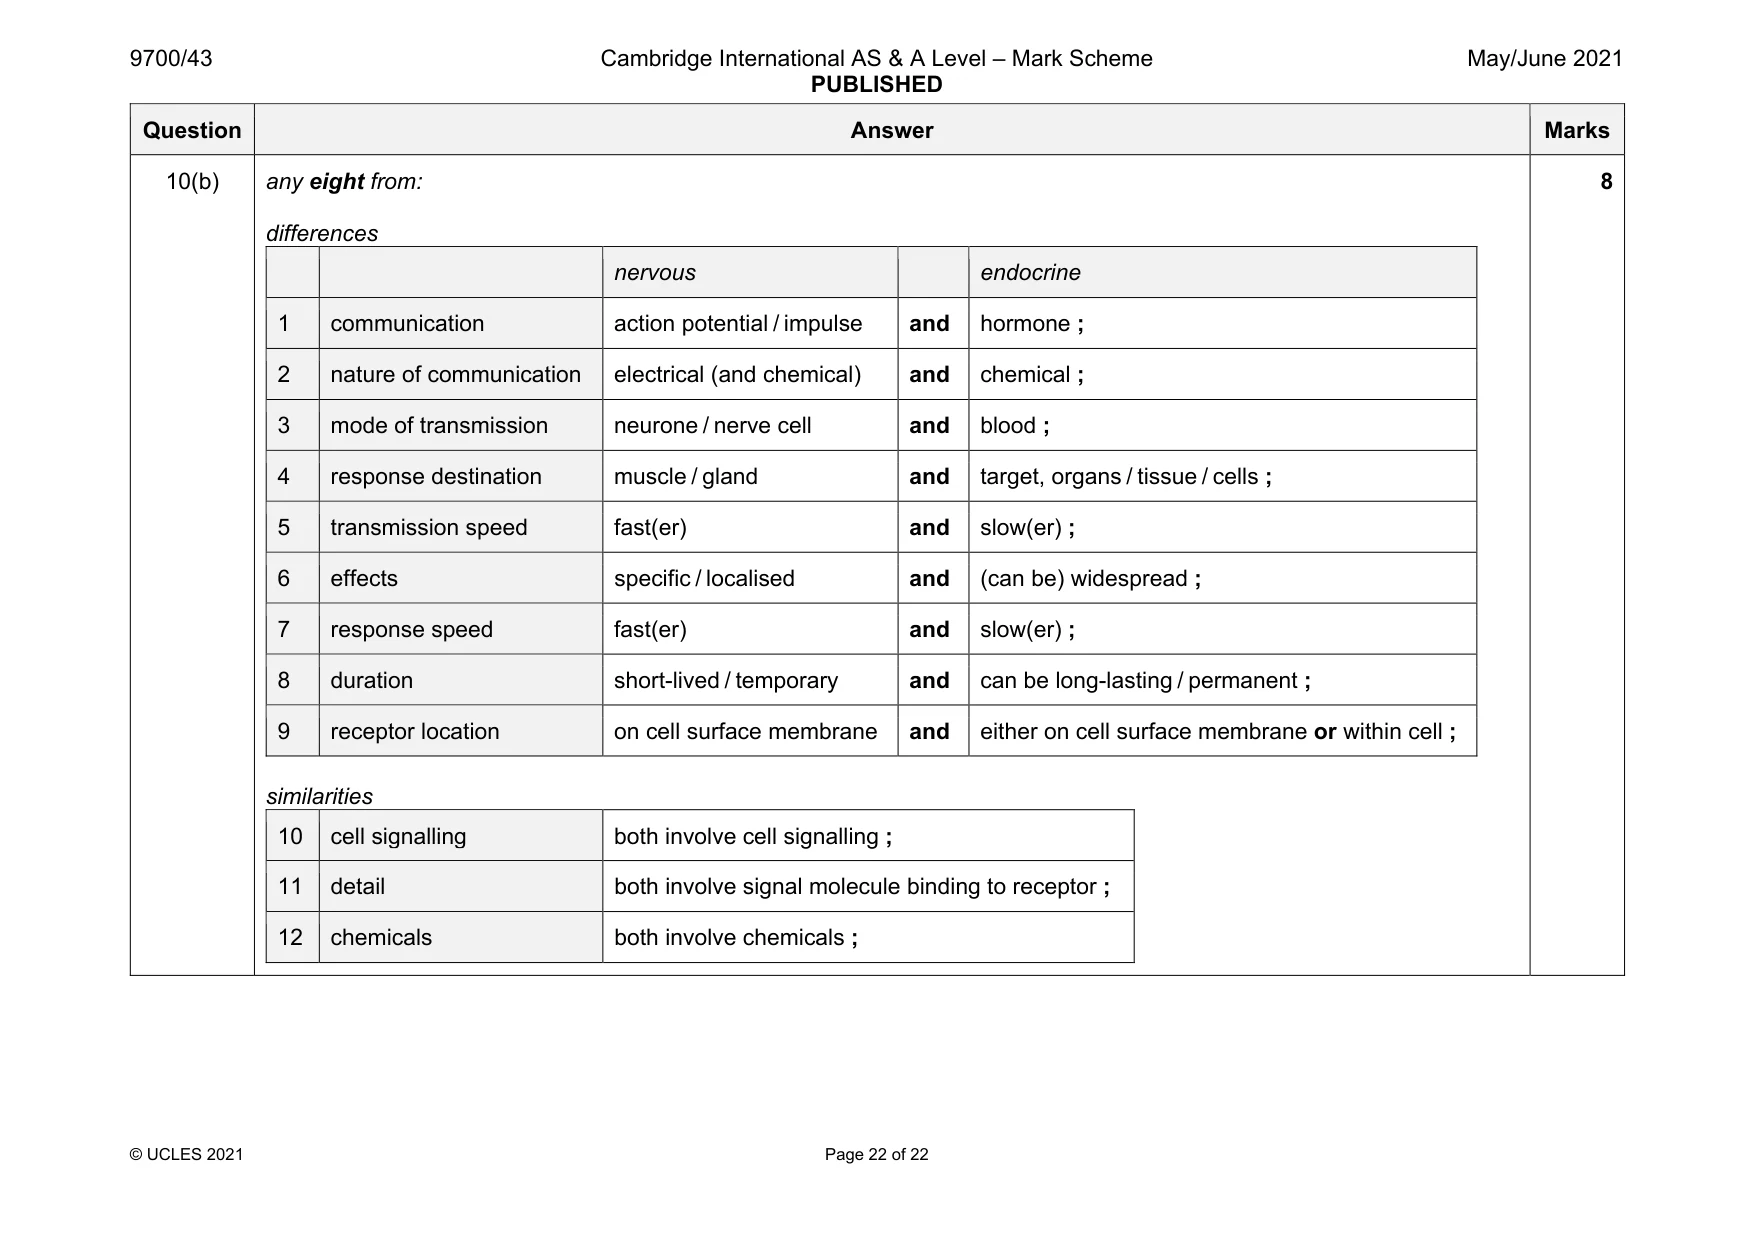
10 (a) Describe the roles of sodium ions in selective reabsorption in the nephron and calcium ions in the functioning of a cholinergic synapse. [7] (b) Compare the endocrine and nervous systems in control and co‑ordination in mammals. [8] [Total: 15] .................................................................................................................................................................. .................................................................................................................................................................. .................................................................................................................................................................. .................................................................................................................................................................. .................................................................................................................................................................. .................................................................................................................................................................. .................................................................................................................................................................. .................................................................................................................................................................. .................................................................................................................................................................. .................................................................................................................................................................. .................................................................................................................................................................. .................................................................................................................................................................. .................................................................................................................................................................. .................................................................................................................................................................. .................................................................................................................................................................. .................................................................................................................................................................. .................................................................................................................................................................. .................................................................................................................................................................. .................................................................................................................................................................. .................................................................................................................................................................. .................................................................................................................................................................. .................................................................................................................................................................. .................................................................................................................................................................. .................................................................................................................................................................. .................................................................................................................................................................. .................................................................................................................................................................. .................................................................................................................................................................. .................................................................................................................................................................. .................................................................................................................................................................. .................................................................................................................................................................. .................................................................................................................................................................. .................................................................................................................................................................. .................................................................................................................................................................. .................................................................................................................................................................. .................................................................................................................................................................. .................................................................................................................................................................. .................................................................................................................................................................. .................................................................................................................................................................. .................................................................................................................................................................. .................................................................................................................................................................. .................................................................................................................................................................. .................................................................................................................................................................. .................................................................................................................................................................. .................................................................................................................................................................. .................................................................................................................................................................. .................................................................................................................................................................. .................................................................................................................................................................. .................................................................................................................................................................. .................................................................................................................................................................. .................................................................................................................................................................. .................................................................................................................................................................. .................................................................................................................................................................. .................................................................................................................................................................. .................................................................................................................................................................. .................................................................................................................................................................. .................................................................................................................................................................. .................................................................................................................................................................. .................................................................................................................................................................. .................................................................................................................................................................. .................................................................................................................................................................. .................................................................................................................................................................. .................................................................................................................................................................. .................................................................................................................................................................. .................................................................................................................................................................. .................................................................................................................................................................. .................................................................................................................................................................. .................................................................................................................................................................. .................................................................................................................................................................. .................................................................................................................................................................. ..................................................................................................................................................................
Mark scheme: 10(a) any seven from: selective reabsorption – sodium ions 1 active transport of Na+, out of (pct) cells / into blood ; 2 Na+ ion concentration, gradient (produced) / reduced in cell ; 3 Na+ enters (pct) cells from, lumen / tubule / filtrate ; 4 by facilitated diffusion / using carrier protein ; 5 cotransport of, glucose / amino acids / ions ; 6 glucose diffuses into blood ; synapse – calcium ions 7 (when) presynaptic membrane depolarised ; 8 calcium (ion) channels / voltage-gated channels, open ; 9 calcium ions enter presynaptic neurone ; 10 stimulate vesicles of ACh to, move towards / fuse with, presynaptic membrane ; 11 causing exocytosis of ACh ; Question Answer Marks 10(b) any eight from: differences nervous endocrine 1 communication action potential / impulse and hormone ; 2 nature of communication electrical (and chemical) and chemical ; 3 mode of transmission neurone / nerve cell and blood ; 4 response destination muscle / gland and target, organs / tissue / cells ; 5 transmission speed fast(er) and slow(er) ; 6 effects specific / localised and (can be) widespread ; 7 response speed fast(er) and slow(er) ; 8 duration short-lived / temporary and can be long-lasting / permanent ; 9 receptor location on cell surface membrane and either on cell surface membrane or within cell ; similarities 10 cell signalling both involve cell signalling ; 11 detail both involve signal molecule binding to receptor ; 12 chemicals both involve chemicals ; 8
What was in this paper
The subtopics covered by these 10 questions, and how many questions each got. Open one in a new tab to see every Cambridge question on it.
What you needed in this session
Cambridge’s own grade thresholds for 2021 May/June, Paper 4 · Variant 3. A higher threshold means an easier paper — the bar moves with how the cohort did.