Cambridge A Level Biology 9700 — 2018 May/June Paper 4 · Variant 3
9700/43/M/J/18 · 10 questions · 100 marks · ≈113 min
The question paper and its mark scheme, free to read here and free to download. This is Cambridge’s own paper, exactly as it was sat.
Question paper24 pages


Mark scheme17 pages
Answers below. Sit the paper first if you are practising.
Questions as text
Q1 · The Sulawesi macaque, Macaca nigra, is found on the large island of Sulawesi in Indonesia
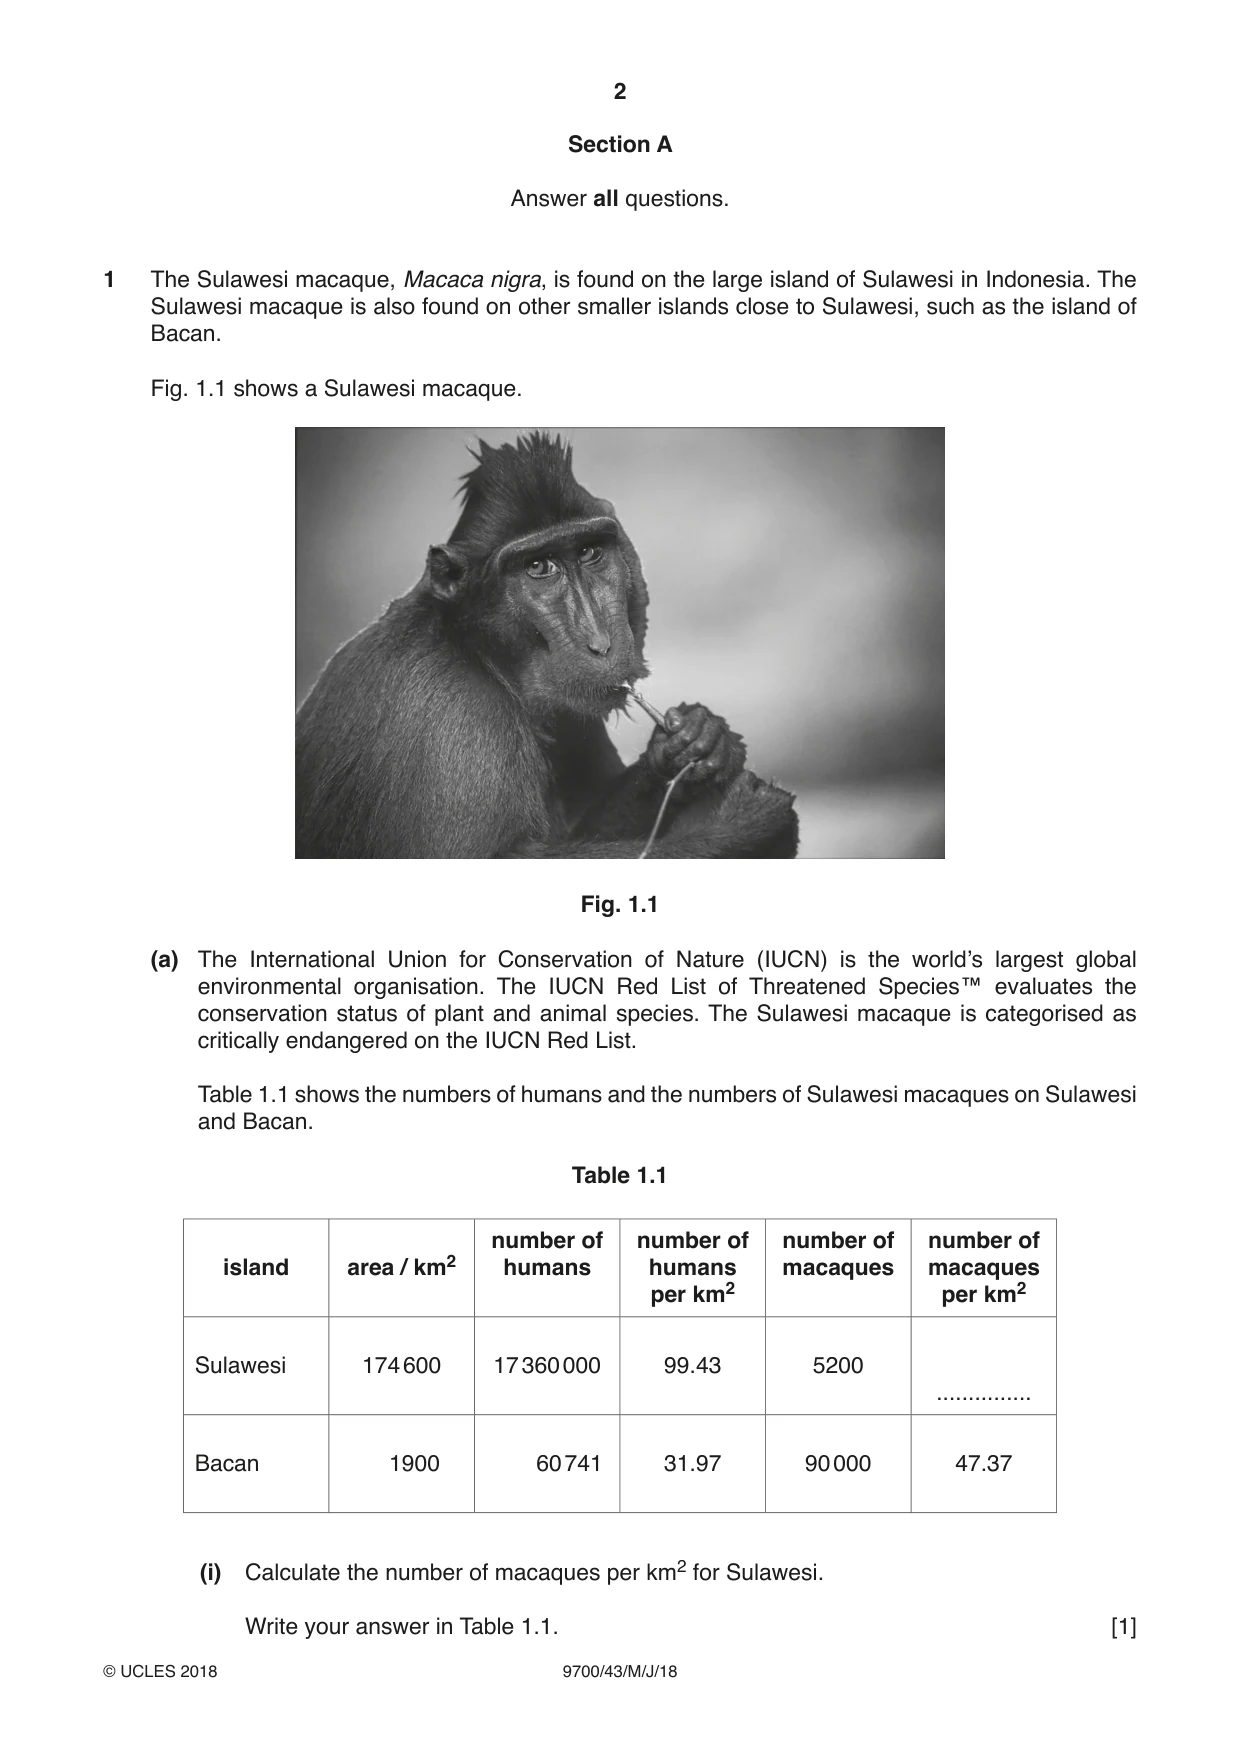
1 The Sulawesi macaque, Macaca nigra, is found on the large island of Sulawesi in Indonesia. The Sulawesi macaque is also found on other smaller islands close to Sulawesi, such as the island of Bacan. Fig. 1.1 shows a Sulawesi macaque. Fig. 1.1 (a) The International Union for Conservation of Nature (IUCN) is the world’s largest global environmental organisation. The IUCN Red List of Threatened Species™ evaluates the conservation status of plant and animal species. The Sulawesi macaque is categorised as critically endangered on the IUCN Red List. Table 1.1 shows the numbers of humans and the numbers of Sulawesi macaques on Sulawesi and Bacan. Table 1.1 number of number of number of number of island area / km2 humans humans macaques macaques per km2 per km2 Sulawesi 174 600 17 360 000 99.43 5200 ............... Bacan 1900 60 741 31.97 90 000 47.37 (i) Calculate the number of macaques per km2 for Sulawesi. Write your answer in Table 1.1. [1] (ii) Comment on the data shown in Table 1.1 and suggest reasons for the pattern shown. ........................................................................................................................................... ........................................................................................................................................... ........................................................................................................................................... ........................................................................................................................................... ........................................................................................................................................... ........................................................................................................................................... ........................................................................................................................................... .......................................................................................................................................[3] (b) Suggest ways of protecting the Sulawesi macaque. ................................................................................................................................................... ................................................................................................................................................... ................................................................................................................................................... ................................................................................................................................................... ................................................................................................................................................... ................................................................................................................................................... ................................................................................................................................................... ................................................................................................................................................... ................................................................................................................................................... ................................................................................................................................................... ................................................................................................................................................... ................................................................................................................................................... ...............................................................................................................................................[4] [Total: 8]
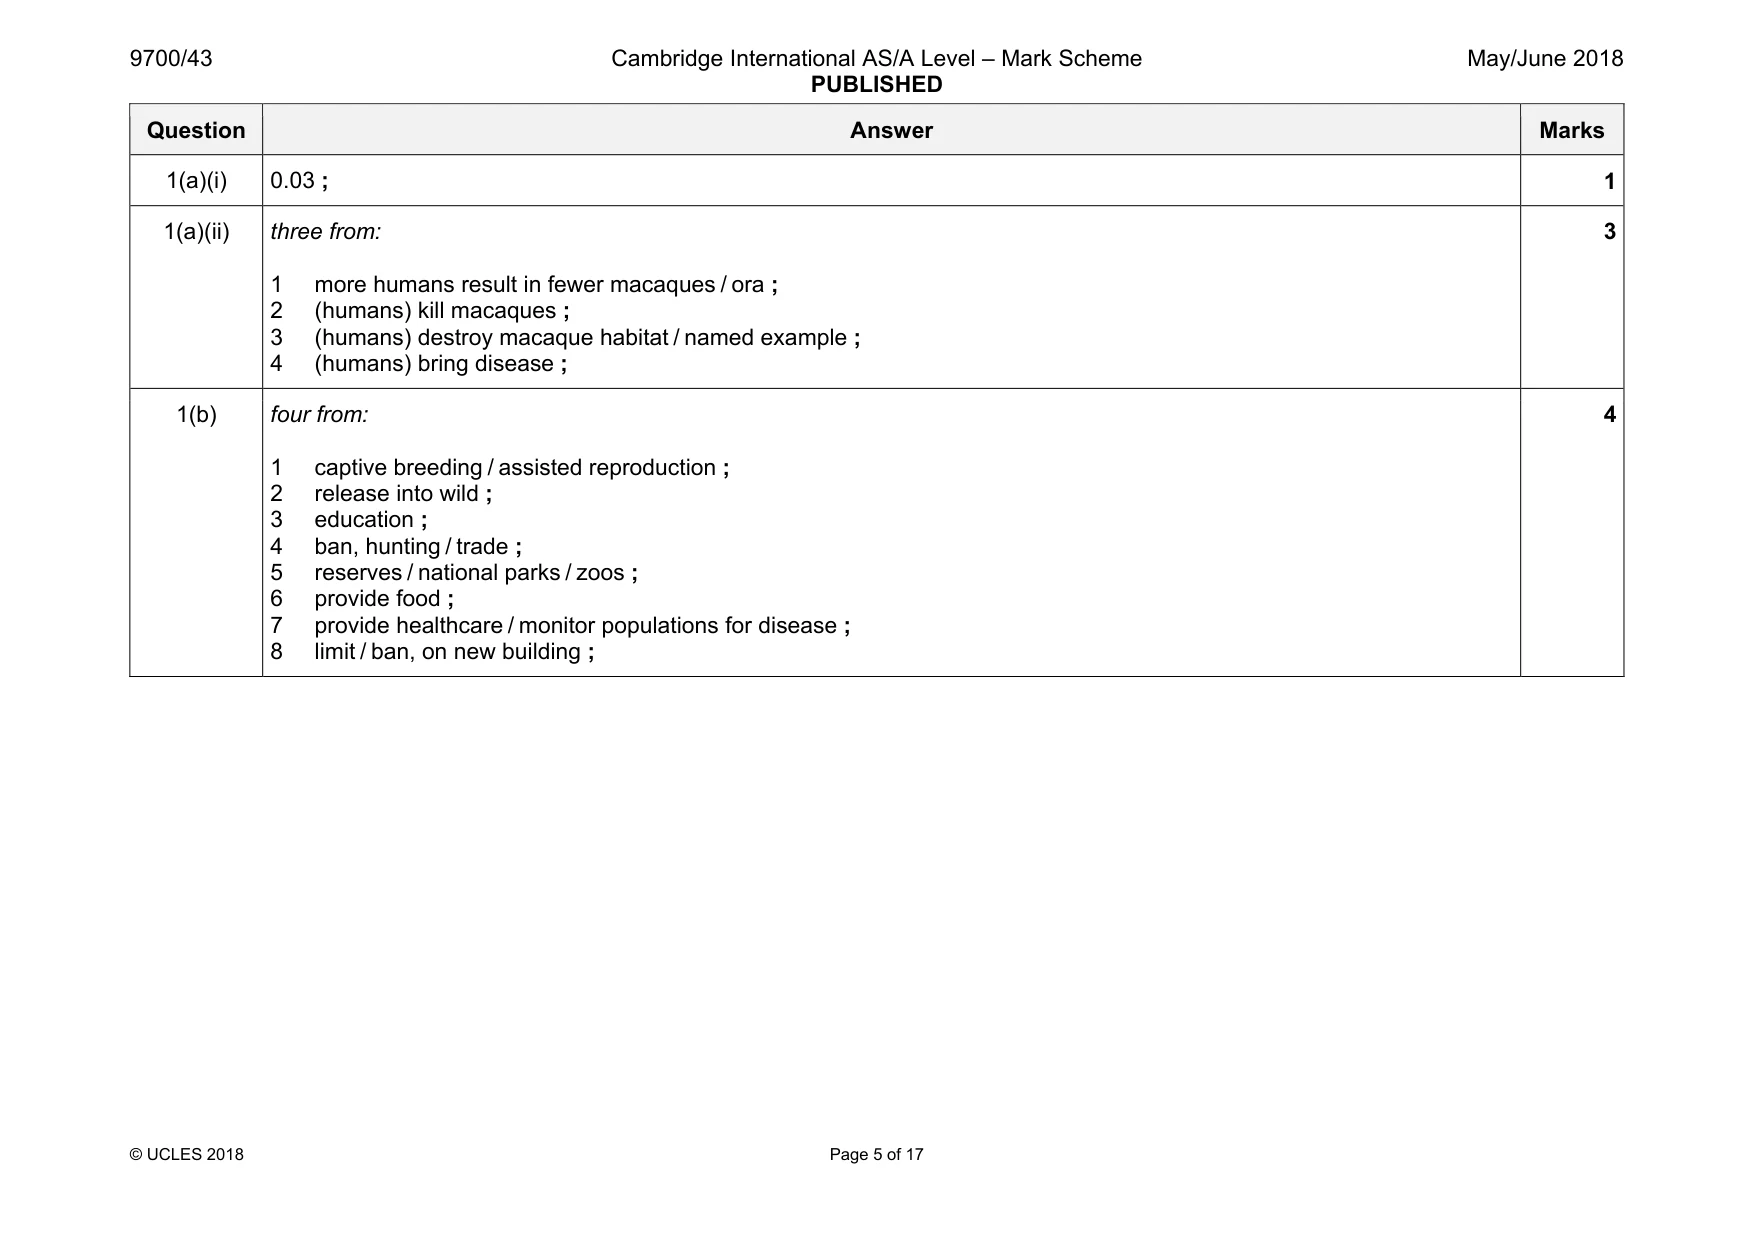
Mark scheme: 1(a)(i) 0.03 ; 1 1(a)(ii) three from: 1 more humans result in fewer macaques / ora ; 2 (humans) kill macaques ; 3 (humans) destroy macaque habitat / named example ; 4 (humans) bring disease ; 3 1(b) four from: 1 captive breeding / assisted reproduction ; 2 release into wild ; 3 education ; 4 ban, hunting / trade ; 5 reserves / national parks / zoos ; 6 provide food ; 7 provide healthcare / monitor populations for disease ; 8 limit / ban, on new building ; 4
Q2 · In the fruit fly, Drosophila melanogaster, eye colour and wing shape are controlled by…
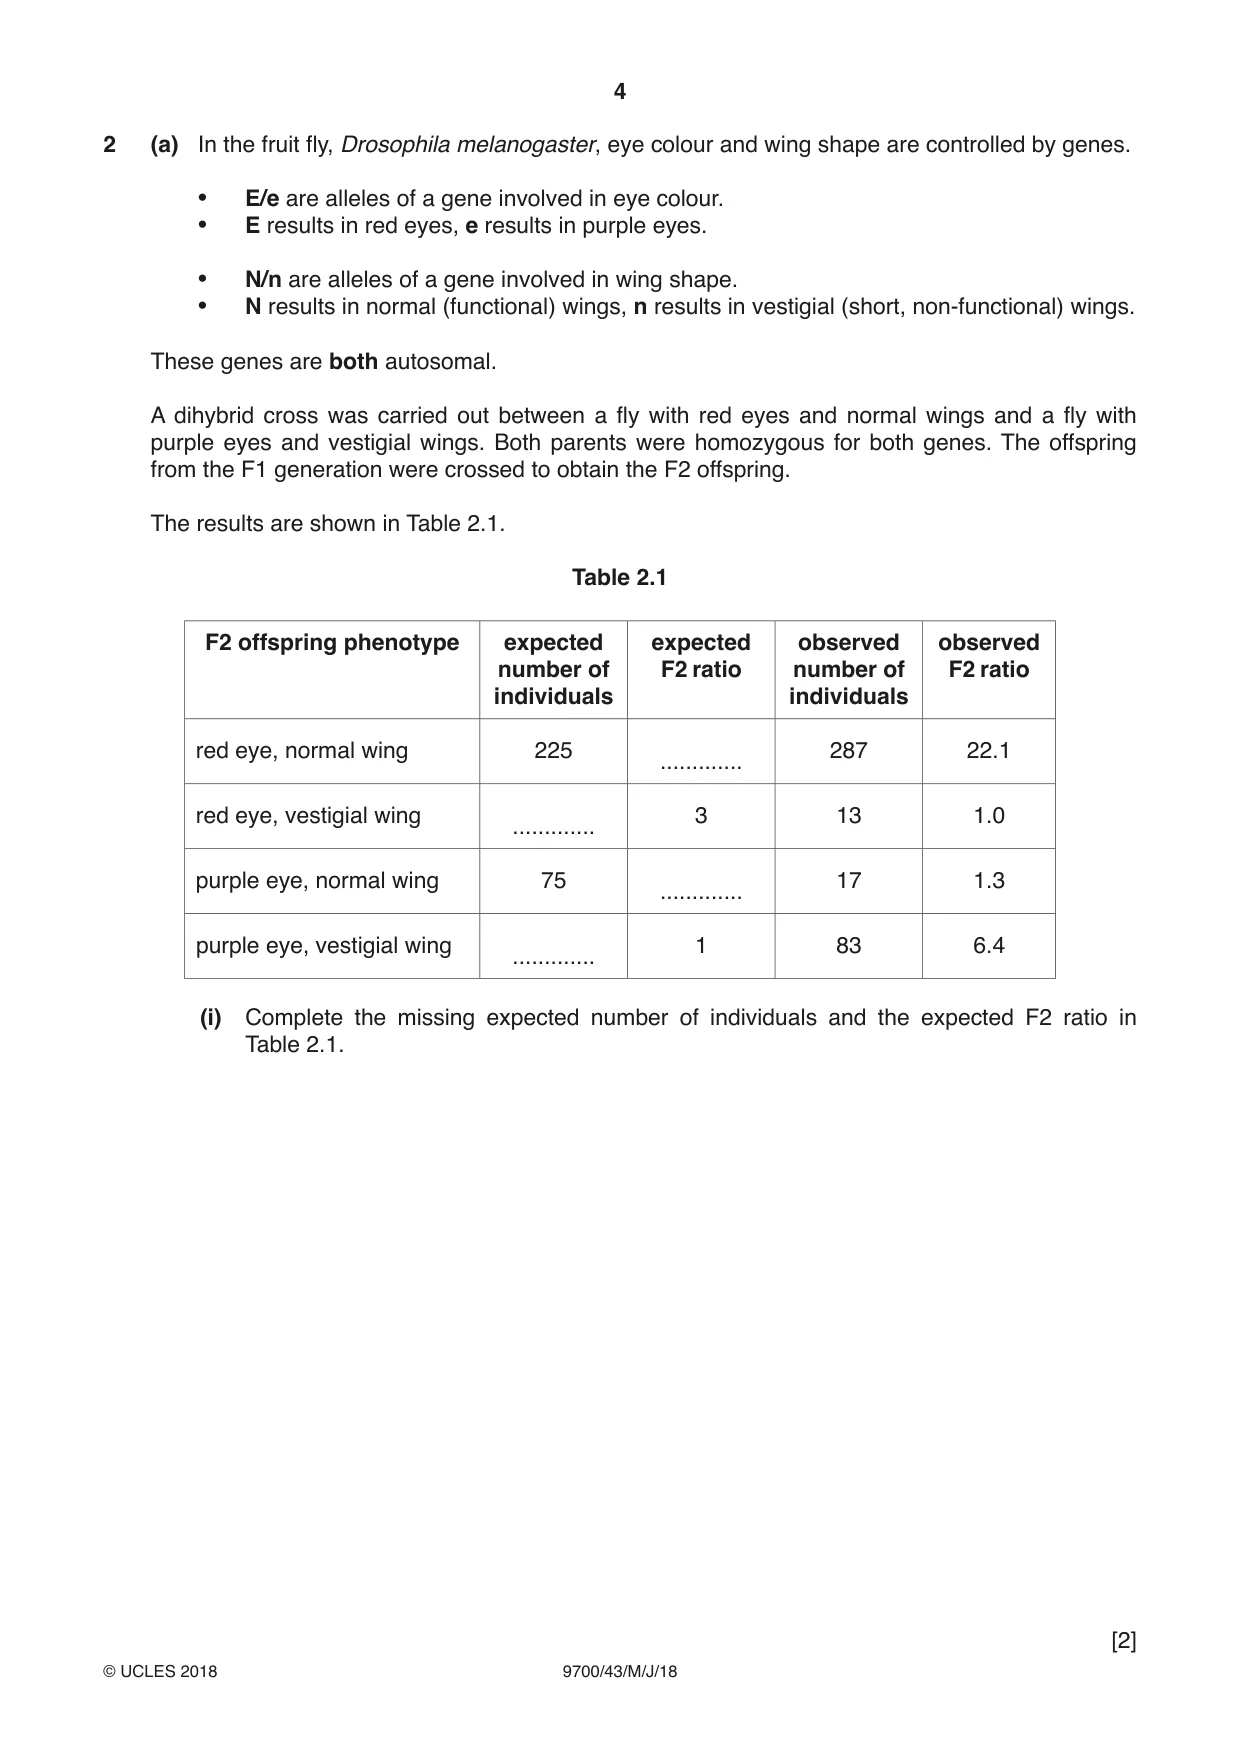
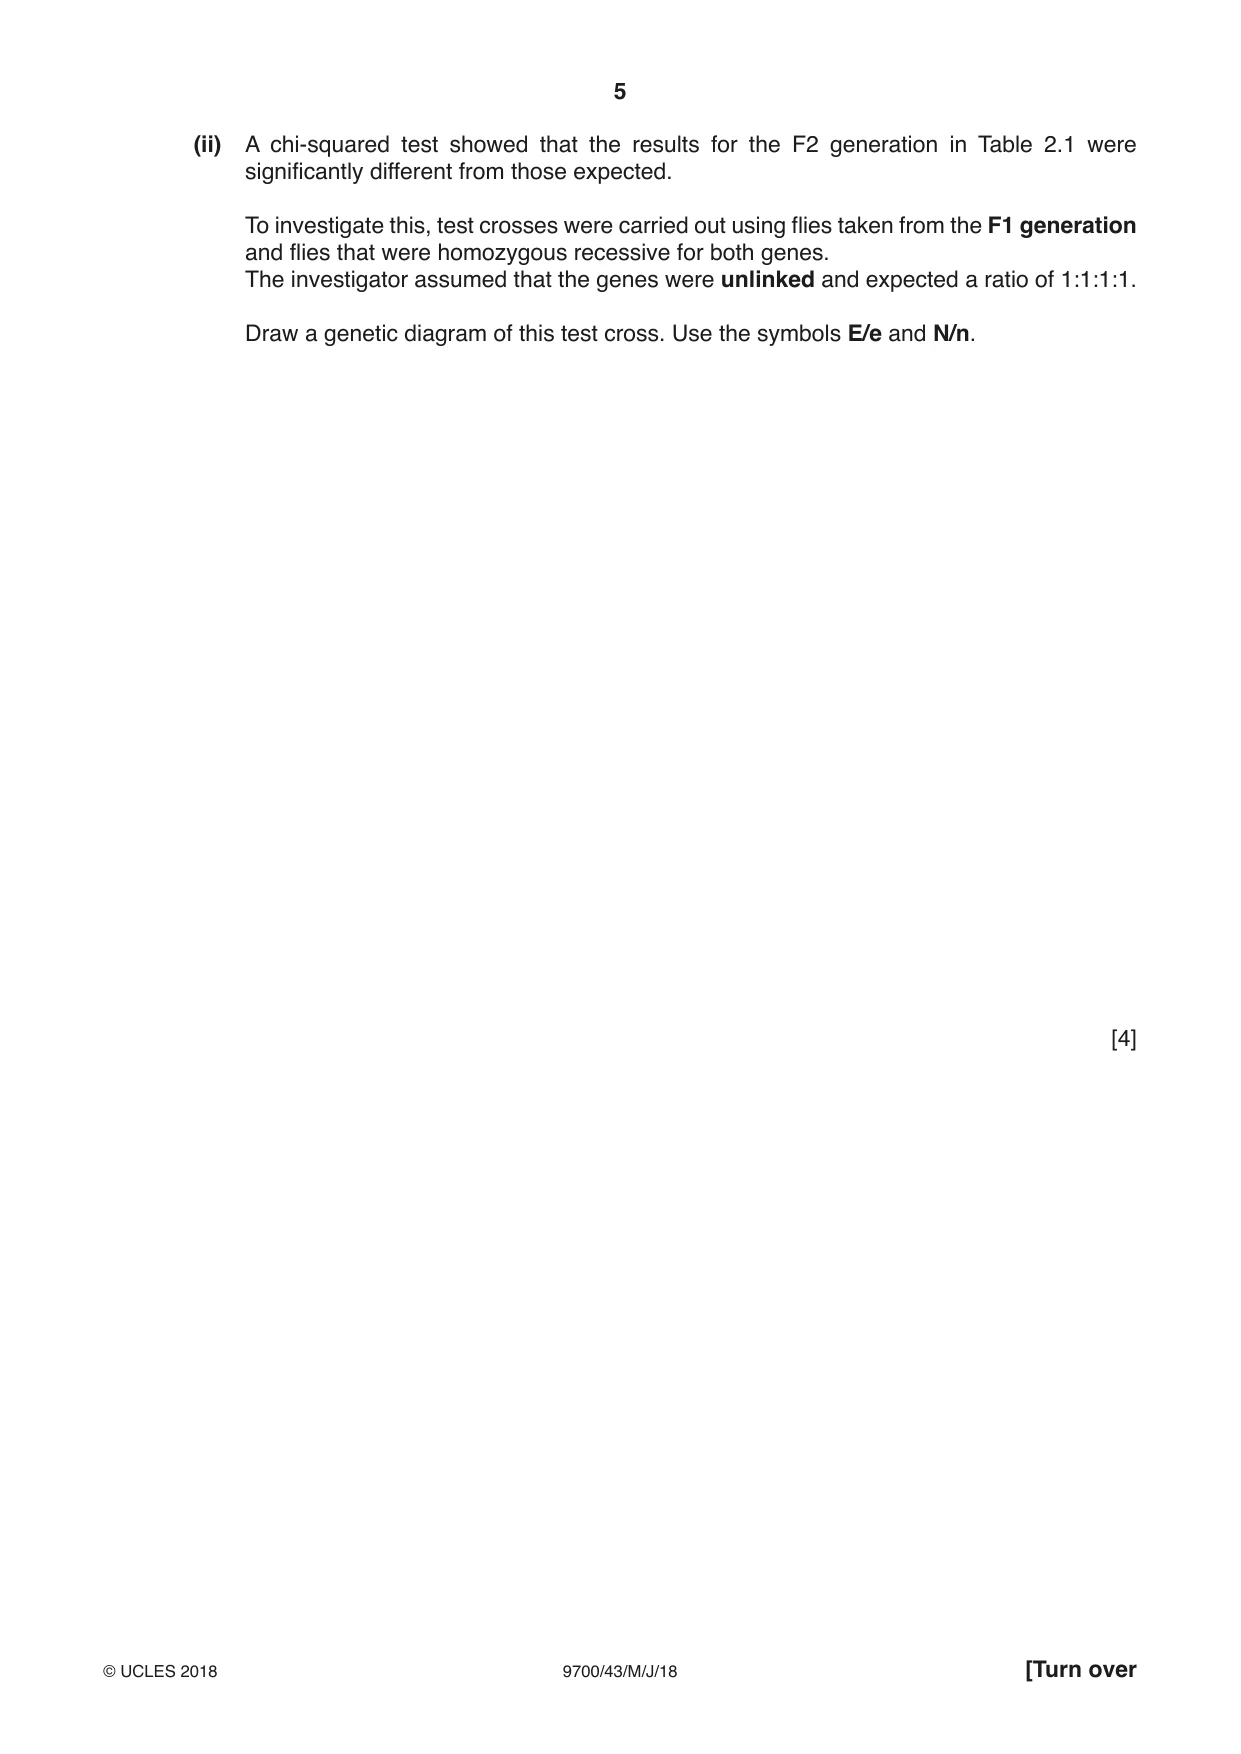
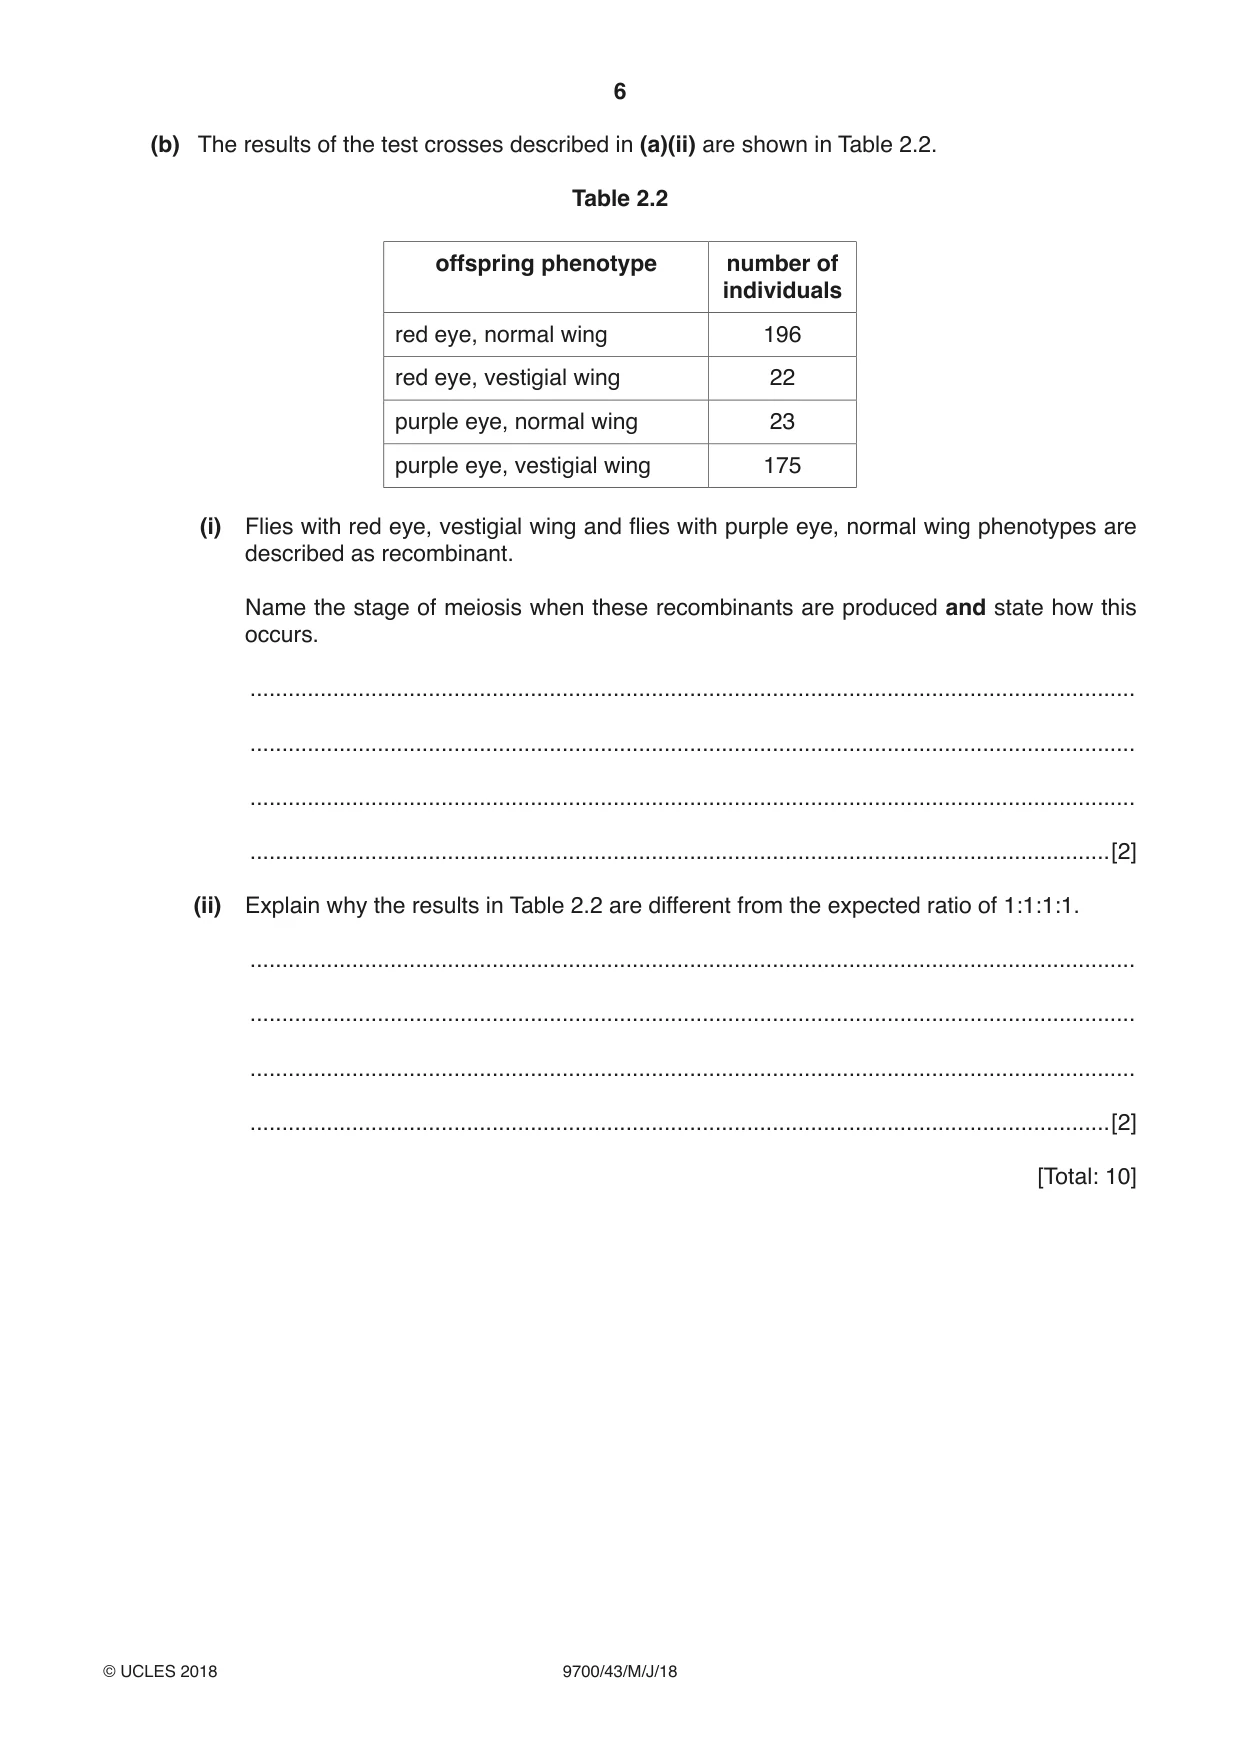
2 (a) In the fruit fly, Drosophila melanogaster, eye colour and wing shape are controlled by genes. • E/e are alleles of a gene involved in eye colour. • E results in red eyes, e results in purple eyes. • N/n are alleles of a gene involved in wing shape. • N results in normal (functional) wings, n results in vestigial (short, non-functional) wings. These genes are both autosomal. A dihybrid cross was carried out between a fly with red eyes and normal wings and a fly with purple eyes and vestigial wings. Both parents were homozygous for both genes. The offspring from the F1 generation were crossed to obtain the F2 offspring. The results are shown in Table 2.1. Table 2.1 F2 offspring phenotype expected expected observed observed number of F2 ratio number of F2 ratio individuals individuals red eye, normal wing 225 287 22.1 ............. red eye, vestigial wing 3 13 1.0 ............. purple eye, normal wing 75 17 1.3 ............. purple eye, vestigial wing 1 83 6.4 ............. (i) Complete the missing expected number of individuals and the expected F2 ratio in Table 2.1. [2] (ii) A chi-squared test showed that the results for the F2 generation in Table 2.1 were significantly different from those expected. To investigate this, test crosses were carried out using flies taken from the F1 generation and flies that were homozygous recessive for both genes. The investigator assumed that the genes were unlinked and expected a ratio of 1:1:1:1. Draw a genetic diagram of this test cross. Use the symbols E/e and N/n. [4] (b) The results of the test crosses described in (a)(ii) are shown in Table 2.2. Table 2.2 offspring phenotype number of individuals red eye, normal wing 196 red eye, vestigial wing 22 purple eye, normal wing 23 purple eye, vestigial wing 175 (i) Flies with red eye, vestigial wing and flies with purple eye, normal wing phenotypes are described as recombinant. Name the stage of meiosis when these recombinants are produced and state how this occurs. ........................................................................................................................................... ........................................................................................................................................... ........................................................................................................................................... .......................................................................................................................................[2] (ii) Explain why the results in Table 2.2 are different from the expected ratio of 1:1:1:1. ........................................................................................................................................... ........................................................................................................................................... ........................................................................................................................................... .......................................................................................................................................[2] [Total: 10]
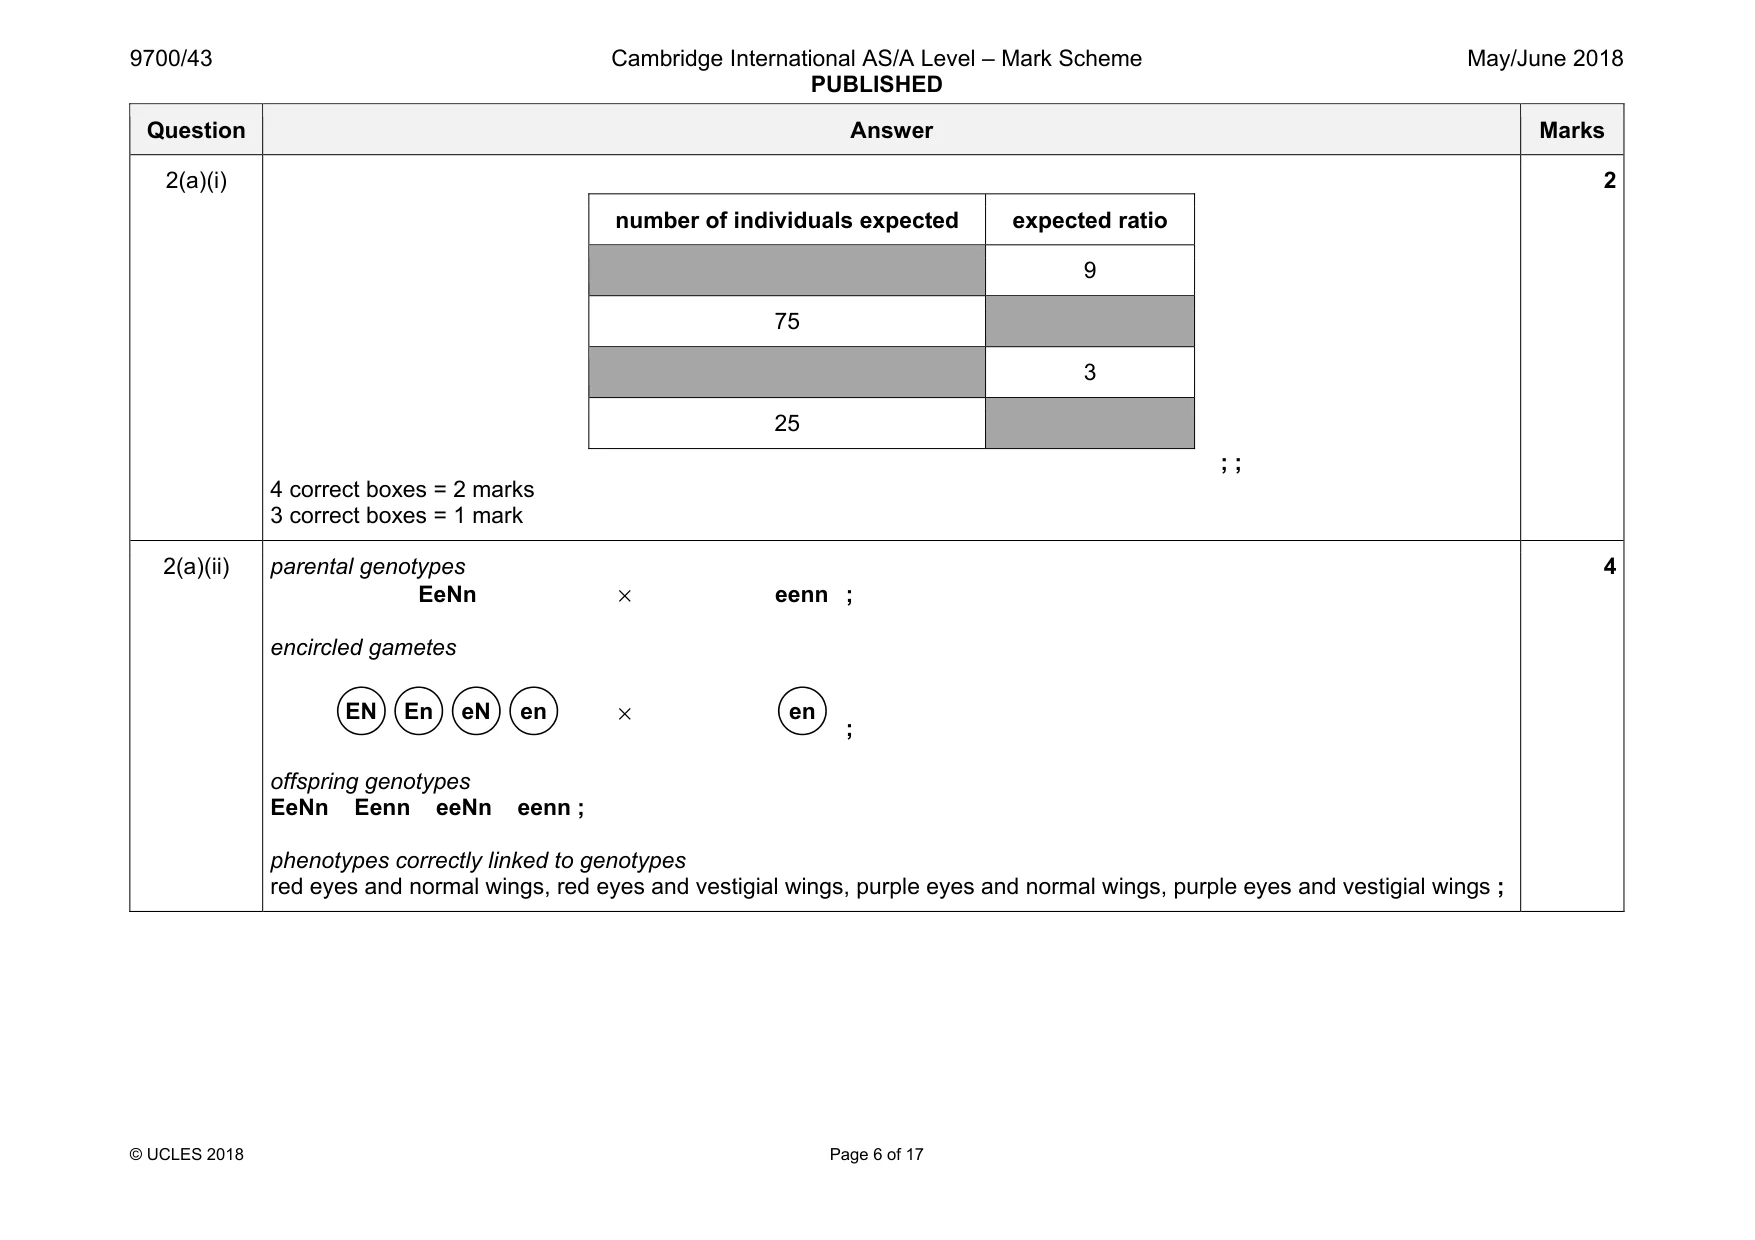
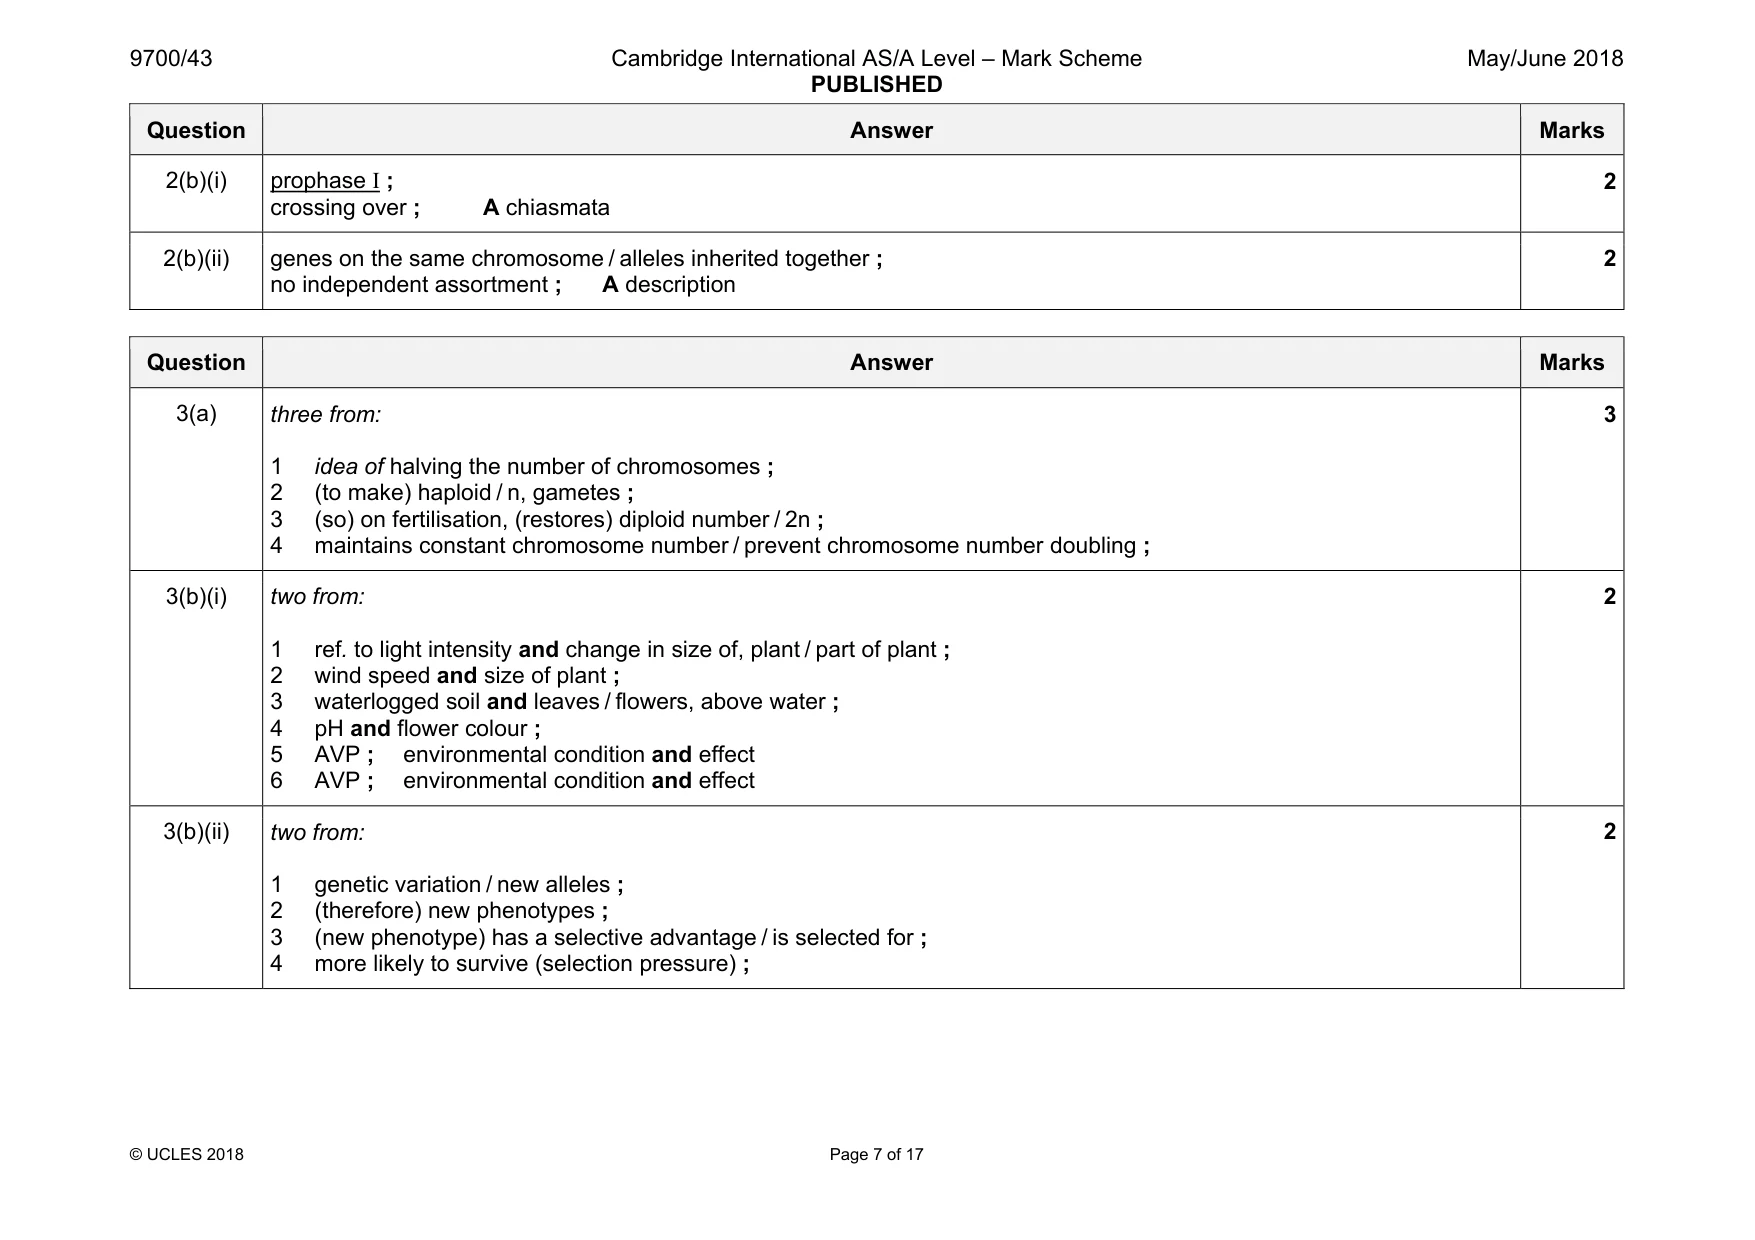
Mark scheme: 2(a)(i) number of individuals expected expected ratio 9 75 3 25 ; ; 4 correct boxes = 2 marks 3 correct boxes = 1 mark 2 2(a)(ii) parental genotypes EeNn × eenn ; encircled gametes × ; offspring genotypes EeNn Eenn eeNn eenn ; phenotypes correctly linked to genotypes red eyes and normal wings, red eyes and vestigial wings, purple eyes and normal wings, purple eyes and vestigial wings ; 4 en EN En eN en Question Answer Marks 2(b)(i) prophase I ; crossing over ; A chiasmata 2 2(b)(ii) genes on the same chromosome / alleles inherited together ; no independent assortment ; A description 2
More questions on Passage of information from parents to offspring
Q3 · Meiosis is described as reduction division
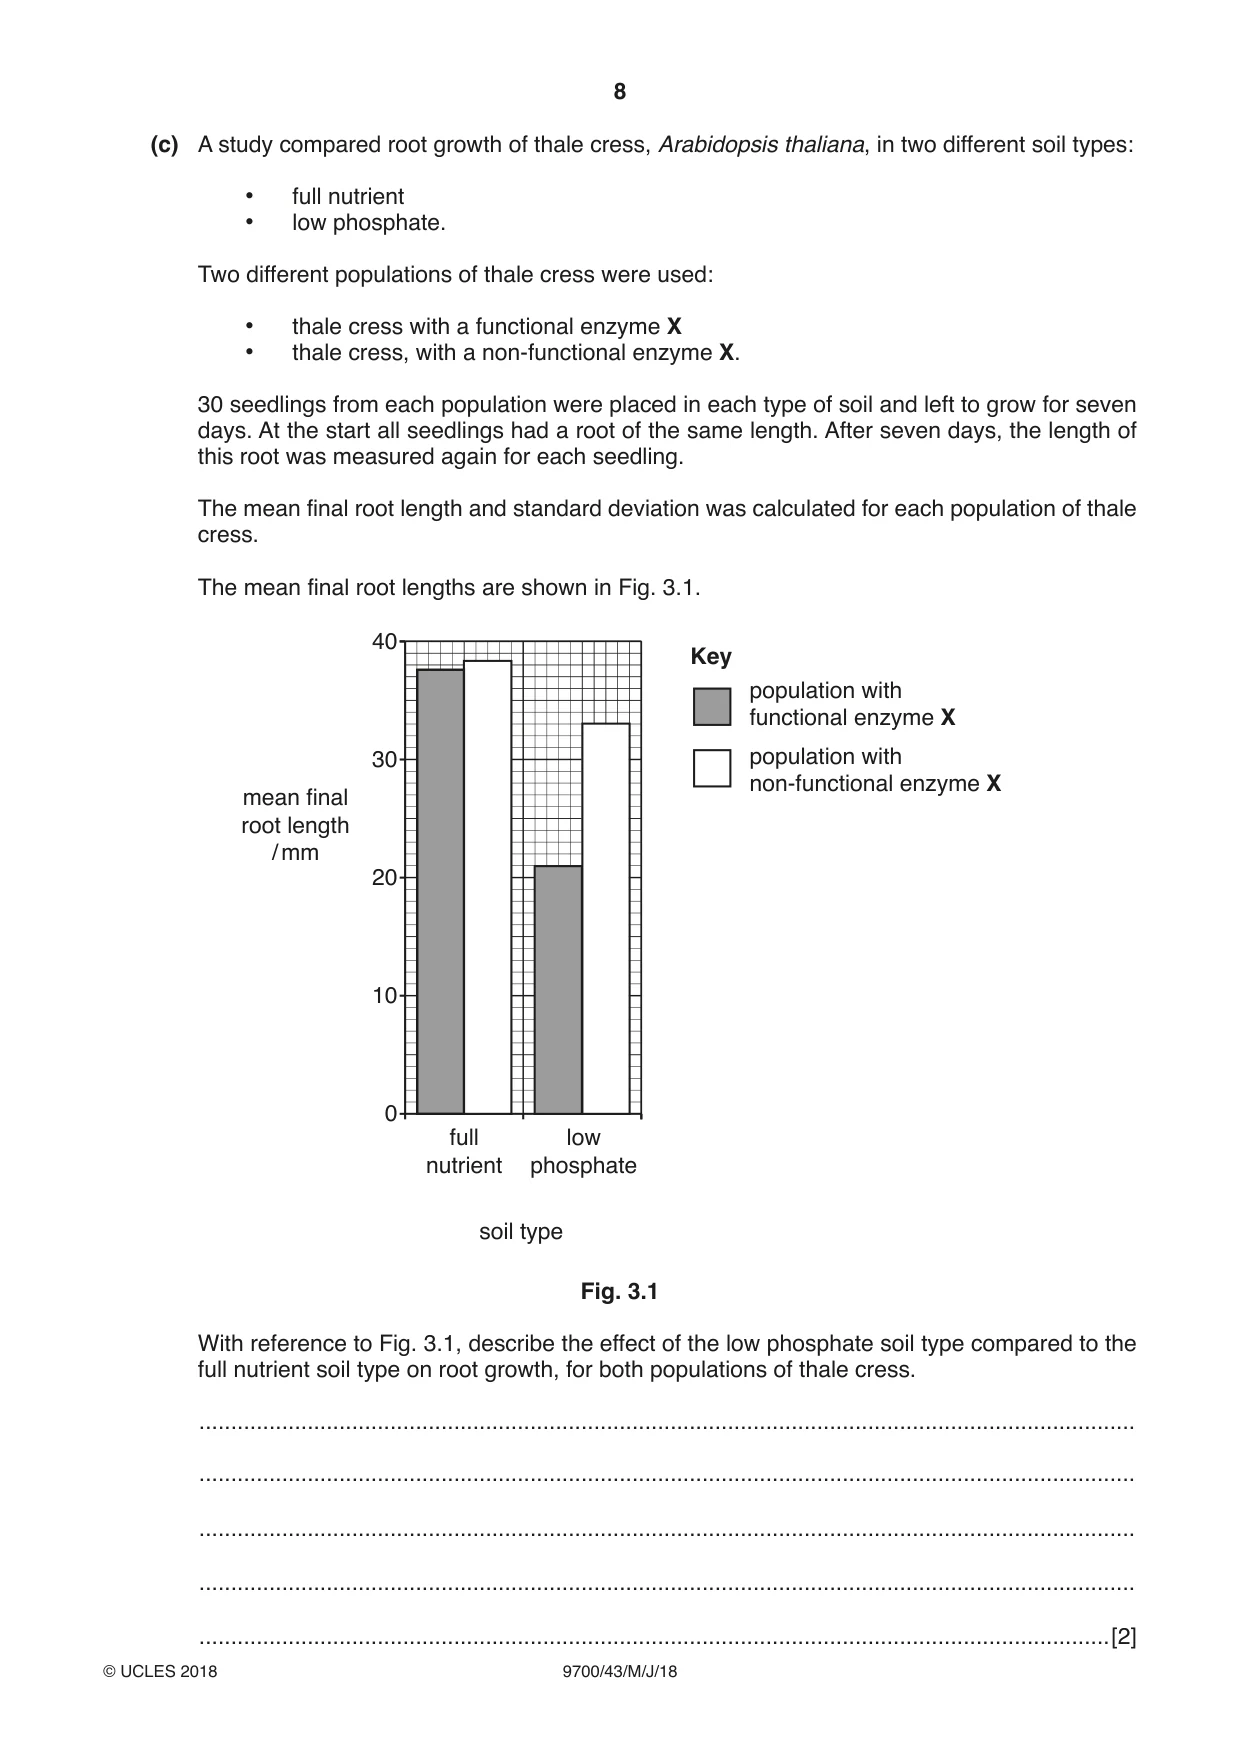
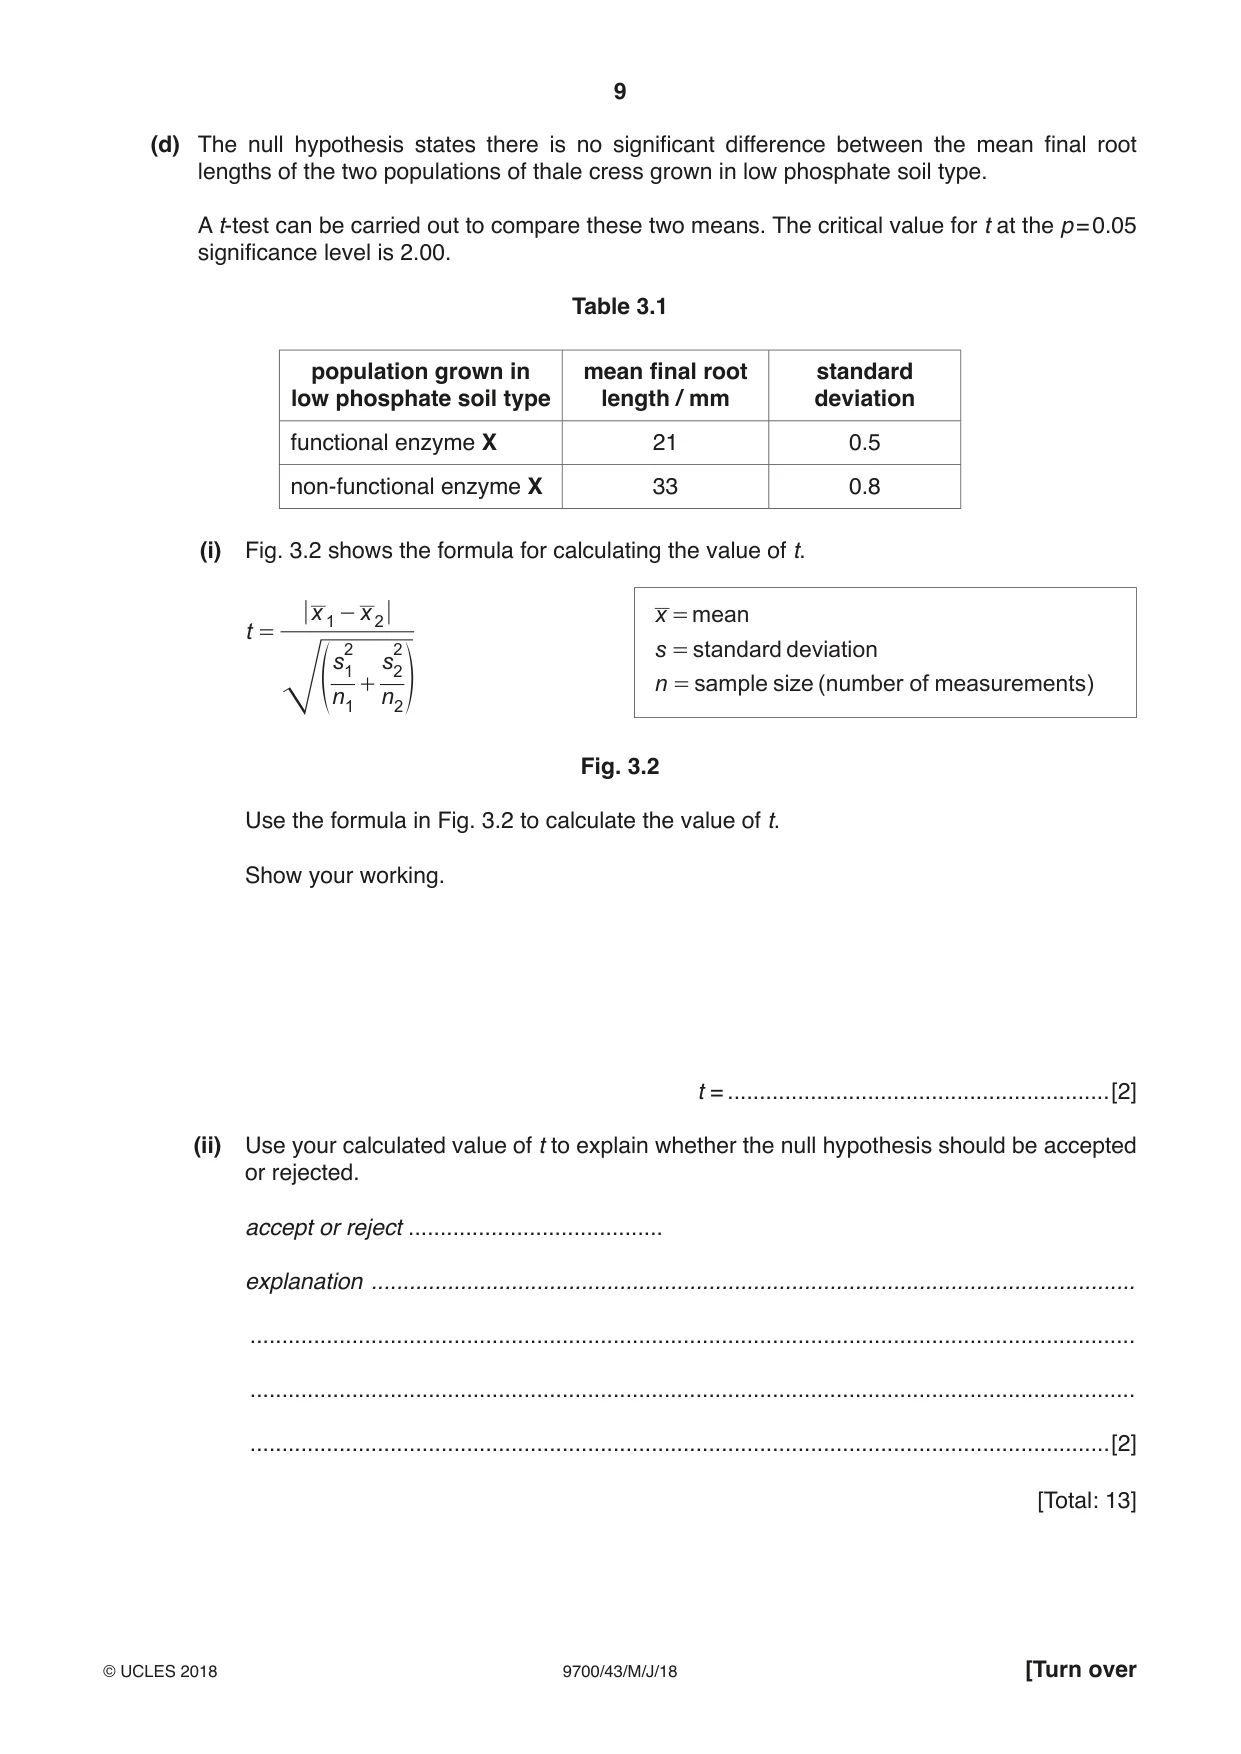
3 (a) Meiosis is described as reduction division. Explain why meiosis is necessary in the life cycle of a sexually reproducing organism. ................................................................................................................................................... ................................................................................................................................................... ................................................................................................................................................... ................................................................................................................................................... ................................................................................................................................................... ...............................................................................................................................................[3] (b) Plants need mineral ions to grow and develop. For example, plants need phosphates and a deficiency inhibits cell division and root growth. Mutations in individuals of some plant populations allow them to survive in mineral-deficient soils. (i) Name two examples of environmental conditions that affect plant phenotype, other than mineral deficiency. For each example, describe how it affects the phenotype. ........................................................................................................................................... ........................................................................................................................................... ........................................................................................................................................... ........................................................................................................................................... ........................................................................................................................................... ........................................................................................................................................... .......................................................................................................................................[2] (ii) Explain why mutations are important in selection. ........................................................................................................................................... ........................................................................................................................................... ........................................................................................................................................... ........................................................................................................................................... .......................................................................................................................................[2] (c) A study compared root growth of thale cress, Arabidopsis thaliana, in two different soil types: • full nutrient • low phosphate. Two different populations of thale cress were used: • thale cress with a functional enzyme X • thale cress, with a non-functional enzyme X. 30 seedlings from each population were placed in each type of soil and left to grow for seven days. At the start all seedlings had a root of the same length. After seven days, the length of this root was measured again for each seedling. The mean final root length and standard deviation was calculated for each population of thale cress. The mean final root lengths are shown in Fig. 3.1. 40 Key population with functional enzyme X 30 population with non-functional enzyme X mean final root length / mm 20 10 0 full low nutrient phosphate soil type Fig. 3.1 With reference to Fig. 3.1, describe the effect of the low phosphate soil type compared to the full nutrient soil type on root growth, for both populations of thale cress. ................................................................................................................................................... ................................................................................................................................................... ................................................................................................................................................... ................................................................................................................................................... ...............................................................................................................................................[2] (d) The null hypothesis states there is no significant difference between the mean final root lengths of the two populations of thale cress grown in low phosphate soil type. A t-test can be carried out to compare these two means. The critical value for t at the p = 0.05 significance level is 2.00. Table 3.1 population grown in mean final root standard low phosphate soil type length / mm deviation functional enzyme X 21 0.5 non-functional enzyme X 33 0.8 (i) Fig. 3.2 shows the formula for calculating the value of t. x 1 - x 2 x = mean t = 2 2 s = standard deviation s 1 s2 + n = sample size (number of measurements) f n 1 n 2 p Fig. 3.2 Use the formula in Fig. 3.2 to calculate the value of t. Show your working. t = ............................................................[2] (ii) Use your calculated value of t to explain whether the null hypothesis should be accepted or rejected. accept or reject ........................................ explanation ........................................................................................................................ ........................................................................................................................................... ........................................................................................................................................... .......................................................................................................................................[2] [Total: 13]
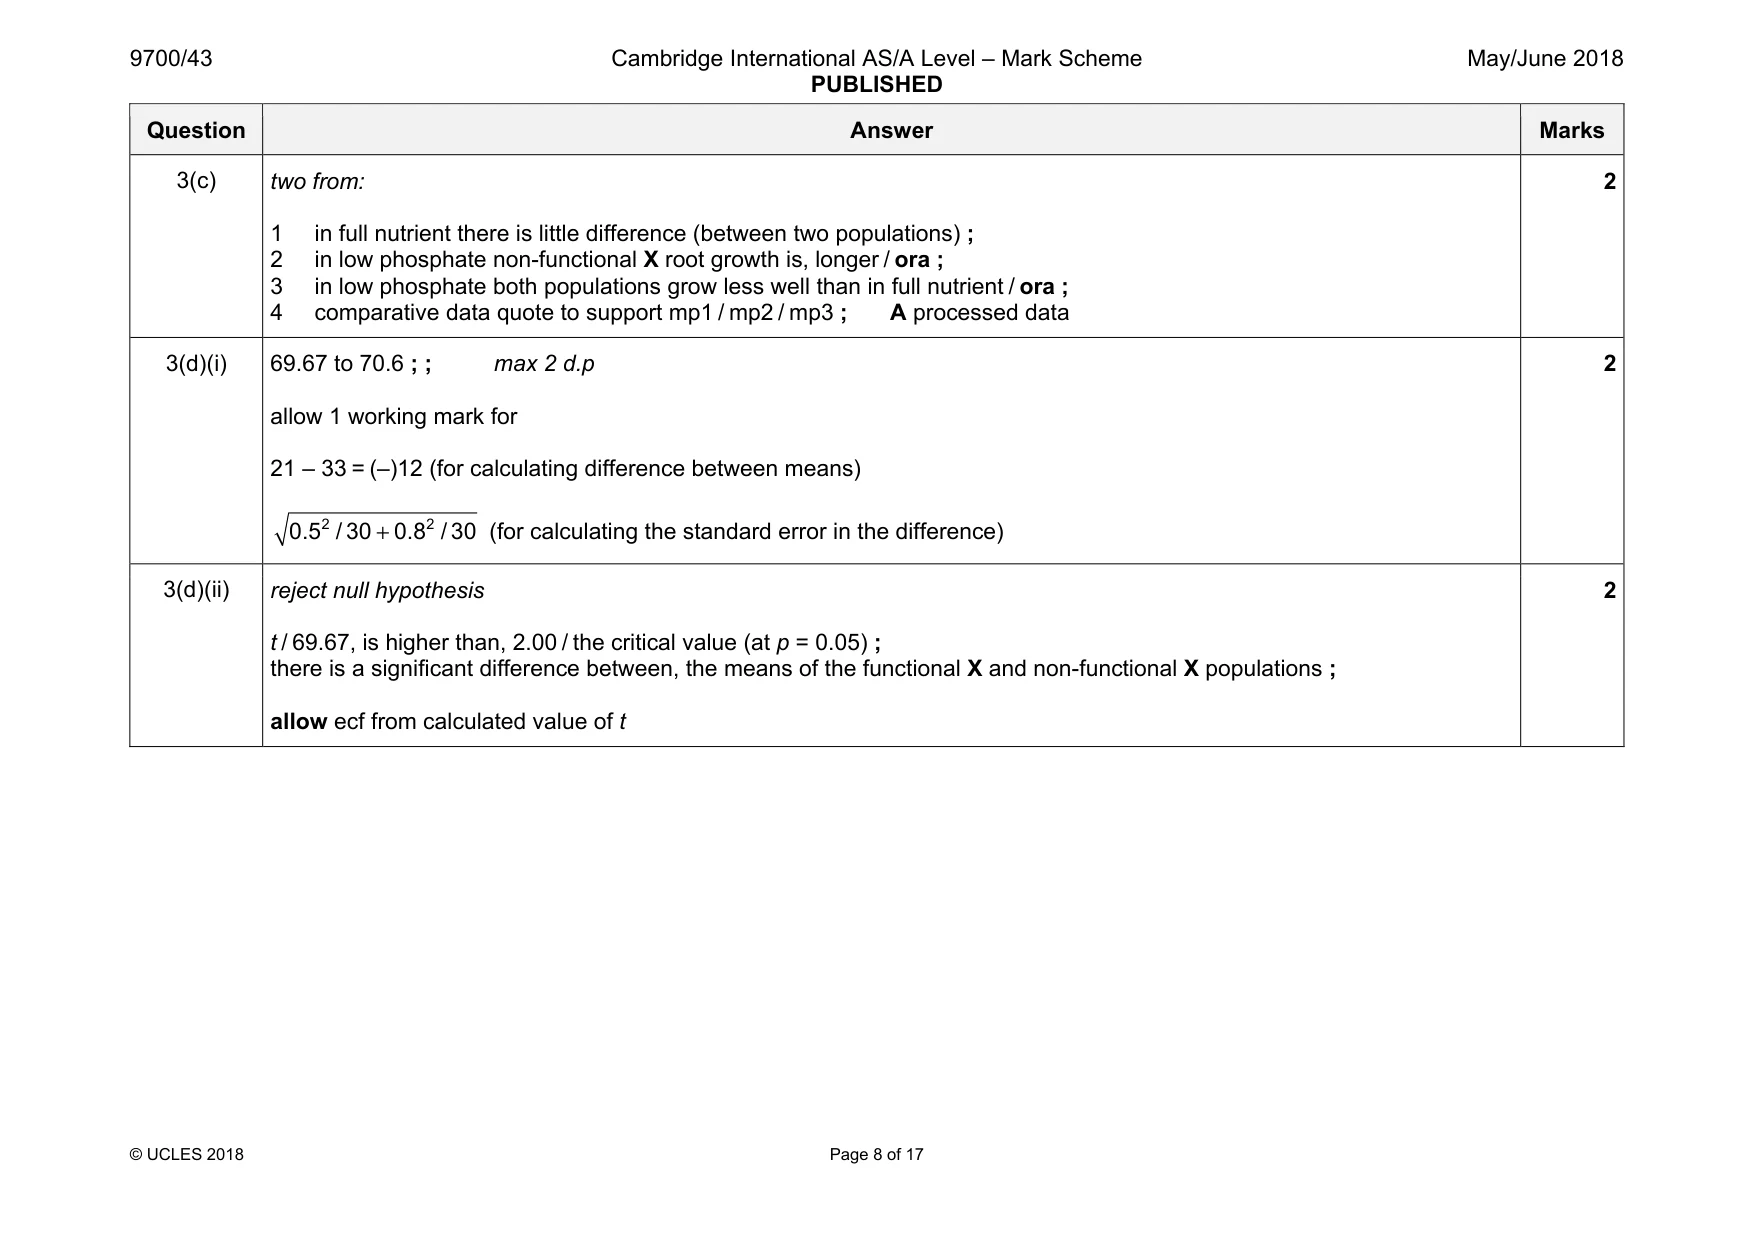
Mark scheme: 3(a) three from: 1 idea of halving the number of chromosomes ; 2 (to make) haploid / n, gametes ; 3 (so) on fertilisation, (restores) diploid number / 2n ; 4 maintains constant chromosome number / prevent chromosome number doubling ; 3 3(b)(i) two from: 1 ref. to light intensity and change in size of, plant / part of plant ; 2 wind speed and size of plant ; 3 waterlogged soil and leaves / flowers, above water ; 4 pH and flower colour ; 5 AVP ; environmental condition and effect 6 AVP ; environmental condition and effect 2 3(b)(ii) two from: 1 genetic variation / new alleles ; 2 (therefore) new phenotypes ; 3 (new phenotype) has a selective advantage / is selected for ; 4 more likely to survive (selection pressure) ; 2 Question Answer Marks 3(c) two from: 1 in full nutrient there is little difference (between two populations) ; 2 in low phosphate non-functional X root growth is, longer / ora ; 3 in low phosphate both populations grow less well than in full nutrient / ora ; 4 comparative data quote to support mp1 / mp2 / mp3 ; A processed data 2 3(d)(i) 69.67 to 70.6 ; ; max 2 d.p allow 1 working mark for 21 – 33 = (–)12 (for calculating difference between means) 2 2 0.5 / 30 0.8 / 30 + (for calculating the standard error in the difference) 2 3(d)(ii) reject null hypothesis t / 69.67, is higher than, 2.00 / the critical value (at p = 0.05) ; there is a significant difference between, the means of the functional X and non-functional X populations ; allow ecf from calculated value of t 2
Q4 · A study was carried out to investigate natural selection in the plant evening primrose…
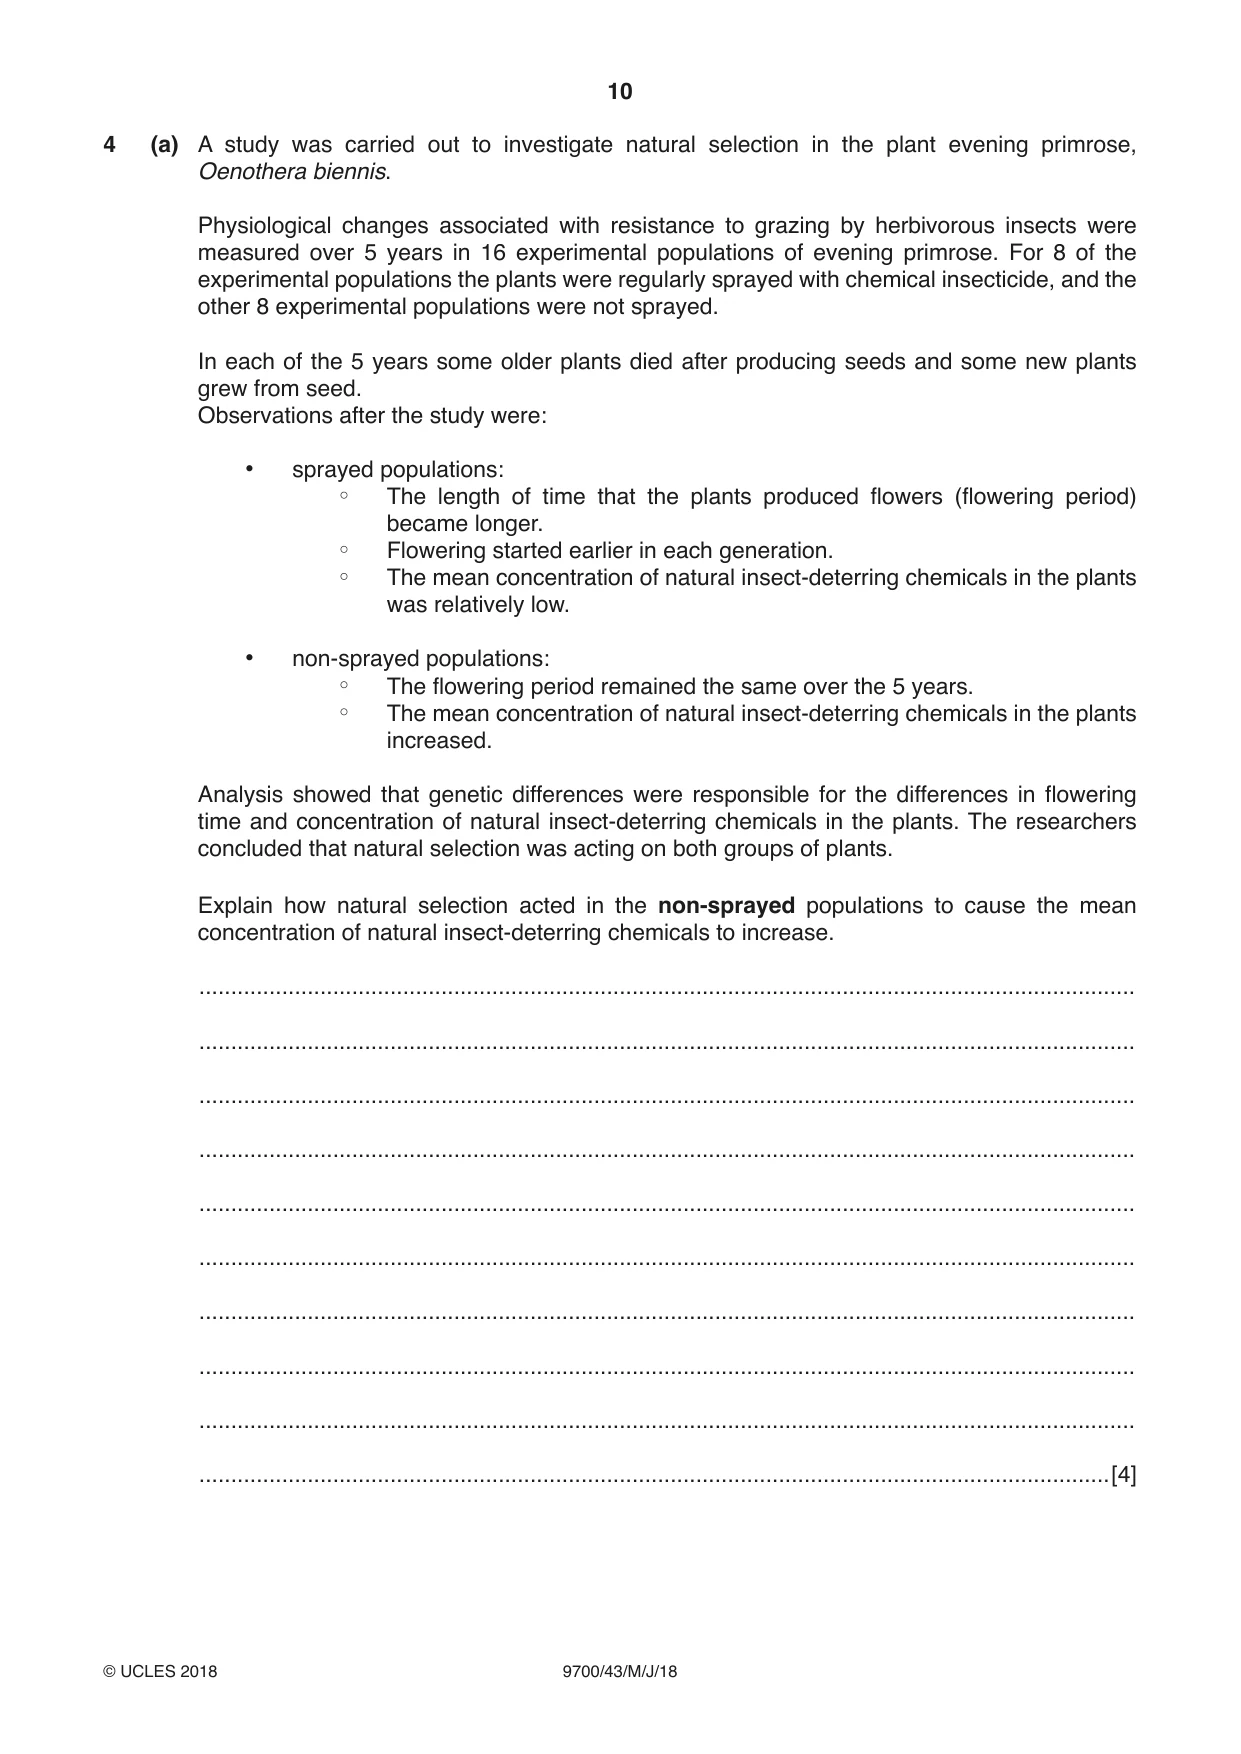
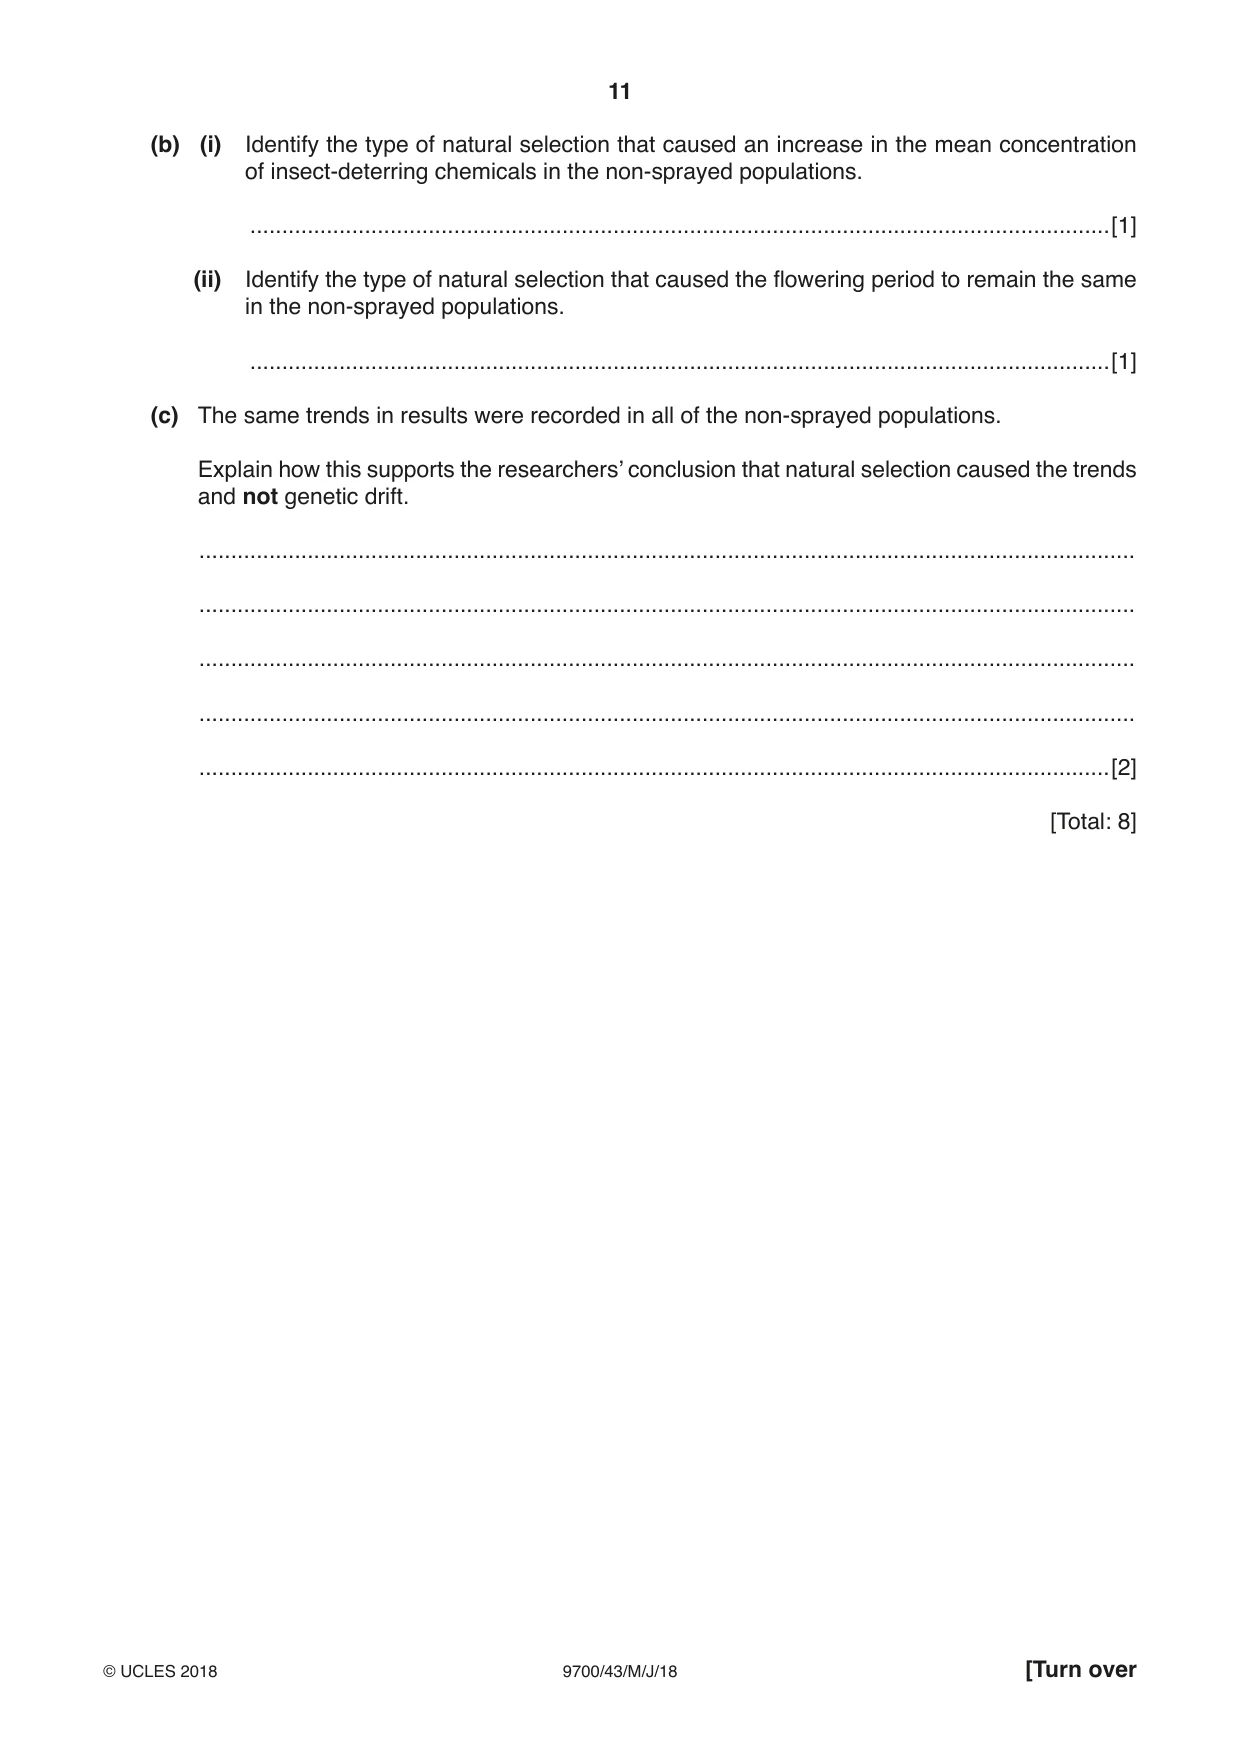
4 (a) A study was carried out to investigate natural selection in the plant evening primrose, Oenothera biennis. Physiological changes associated with resistance to grazing by herbivorous insects were measured over 5 years in 16 experimental populations of evening primrose. For 8 of the experimental populations the plants were regularly sprayed with chemical insecticide, and the other 8 experimental populations were not sprayed. In each of the 5 years some older plants died after producing seeds and some new plants grew from seed. Observations after the study were: • sprayed populations: The length of time that the plants produced flowers (flowering period) became longer. Flowering started earlier in each generation. The mean concentration of natural insect-deterring chemicals in the plants was relatively low. • non-sprayed populations: The flowering period remained the same over the 5 years. The mean concentration of natural insect-deterring chemicals in the plants increased. Analysis showed that genetic differences were responsible for the differences in flowering time and concentration of natural insect-deterring chemicals in the plants. The researchers concluded that natural selection was acting on both groups of plants. Explain how natural selection acted in the non-sprayed populations to cause the mean concentration of natural insect-deterring chemicals to increase. ................................................................................................................................................... ................................................................................................................................................... ................................................................................................................................................... ................................................................................................................................................... ................................................................................................................................................... ................................................................................................................................................... ................................................................................................................................................... ................................................................................................................................................... ................................................................................................................................................... ...............................................................................................................................................[4] (b) (i) Identify the type of natural selection that caused an increase in the mean concentration of insect-deterring chemicals in the non-sprayed populations. .......................................................................................................................................[1] (ii) Identify the type of natural selection that caused the flowering period to remain the same in the non-sprayed populations. .......................................................................................................................................[1] (c) The same trends in results were recorded in all of the non-sprayed populations. Explain how this supports the researchers’ conclusion that natural selection caused the trends and not genetic drift. ................................................................................................................................................... ................................................................................................................................................... ................................................................................................................................................... ................................................................................................................................................... ...............................................................................................................................................[2] [Total: 8]
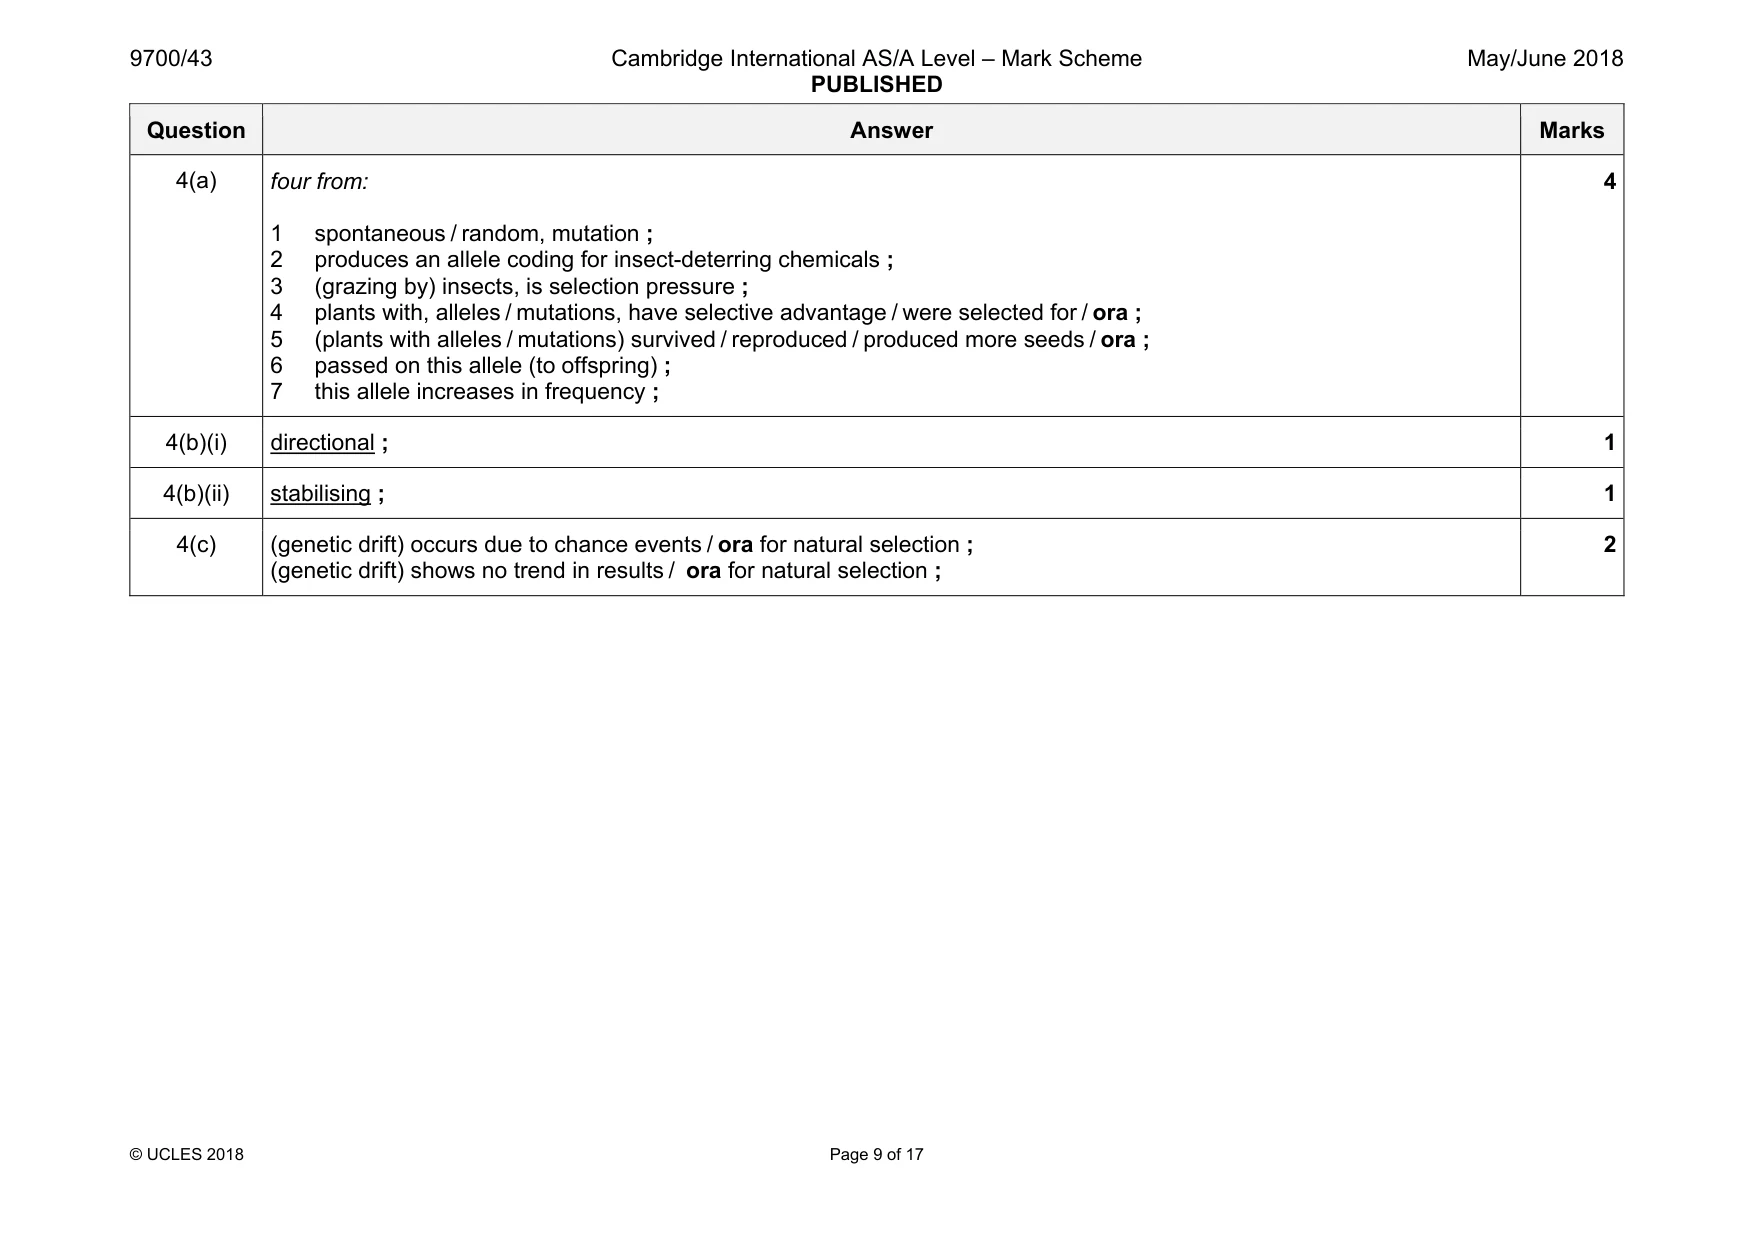
Mark scheme: 4(a) four from: 1 spontaneous / random, mutation ; 2 produces an allele coding for insect-deterring chemicals ; 3 (grazing by) insects, is selection pressure ; 4 plants with, alleles / mutations, have selective advantage / were selected for / ora ; 5 (plants with alleles / mutations) survived / reproduced / produced more seeds / ora ; 6 passed on this allele (to offspring) ; 7 this allele increases in frequency ; 4 4(b)(i) directional ; 1 4(b)(ii) stabilising ; 1 4(c) (genetic drift) occurs due to chance events / ora for natural selection ; (genetic drift) shows no trend in results / ora for natural selection ; 2
Q5 · People with Alzheimer’s disease (AD) lose their ability to form new memories
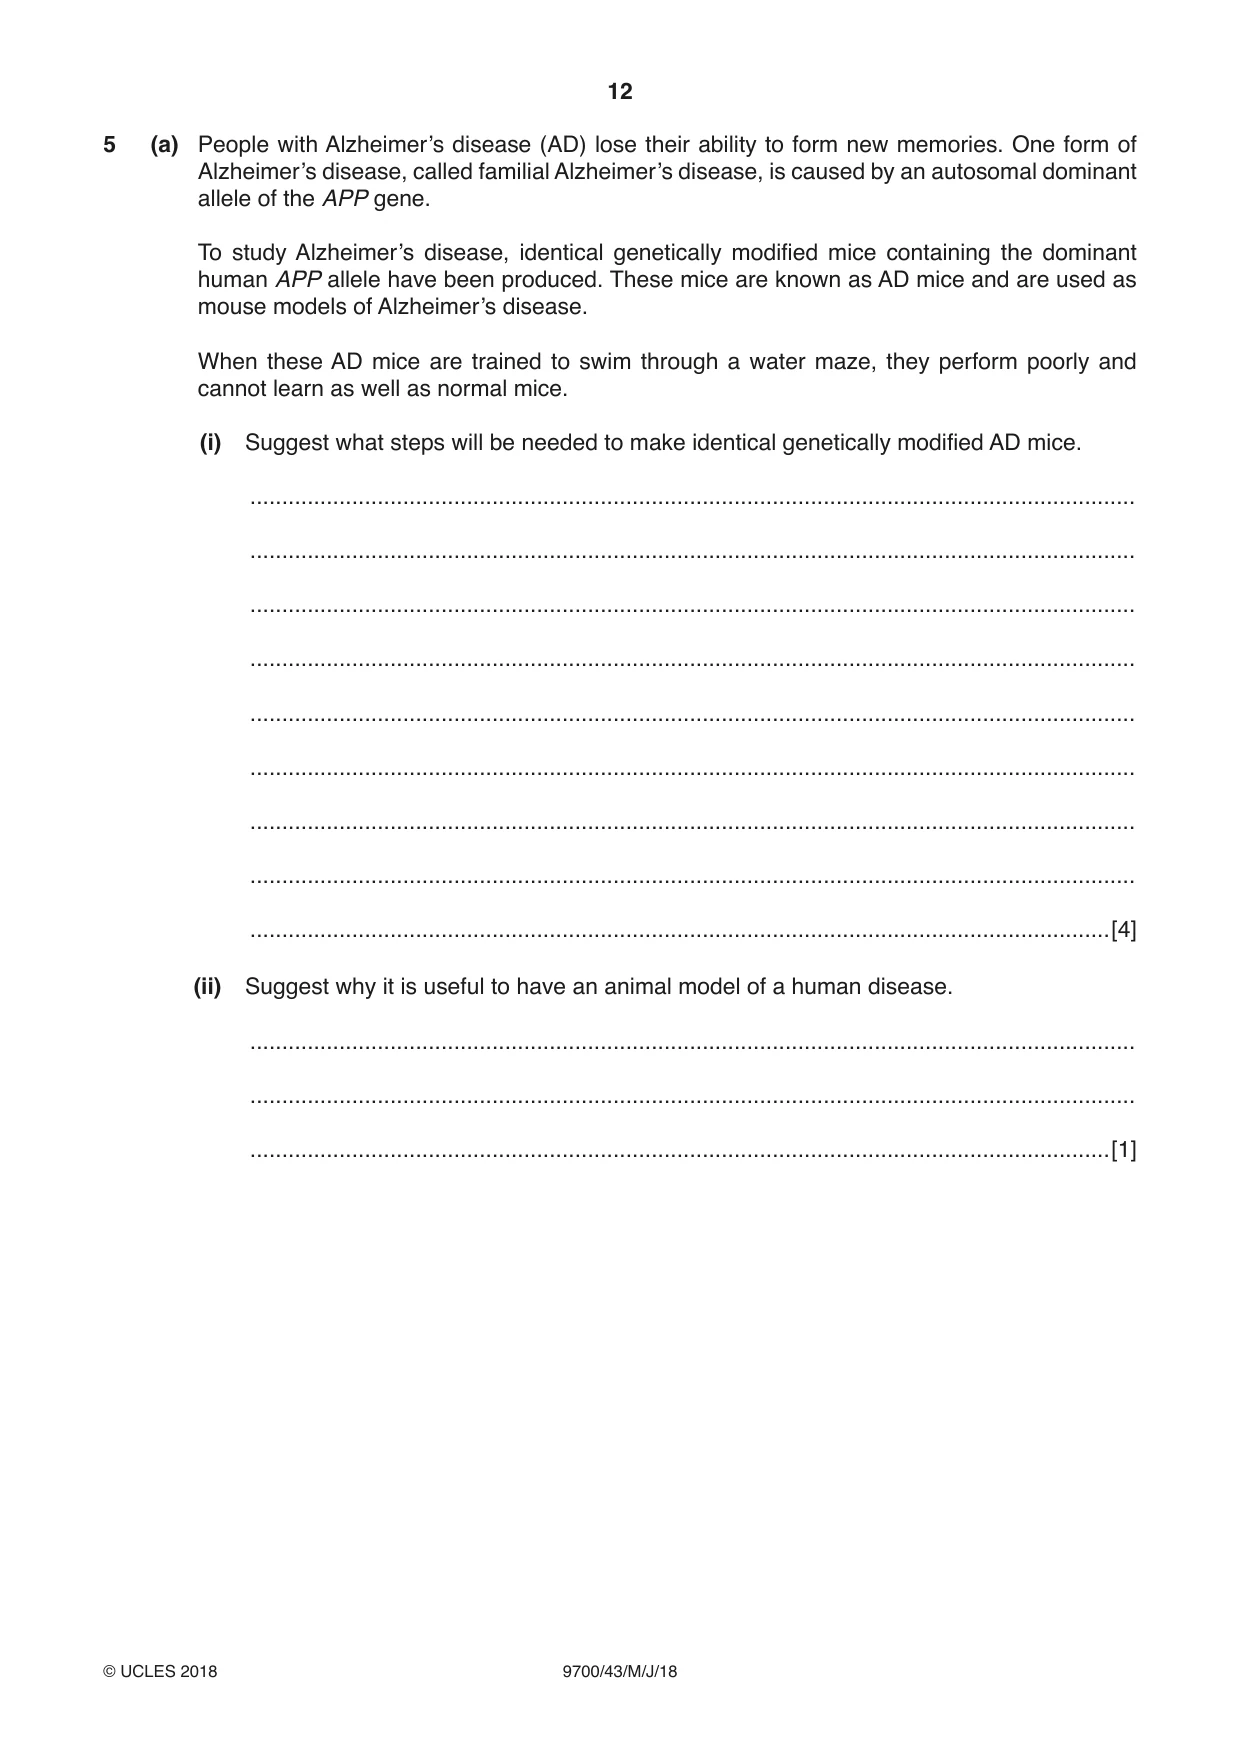
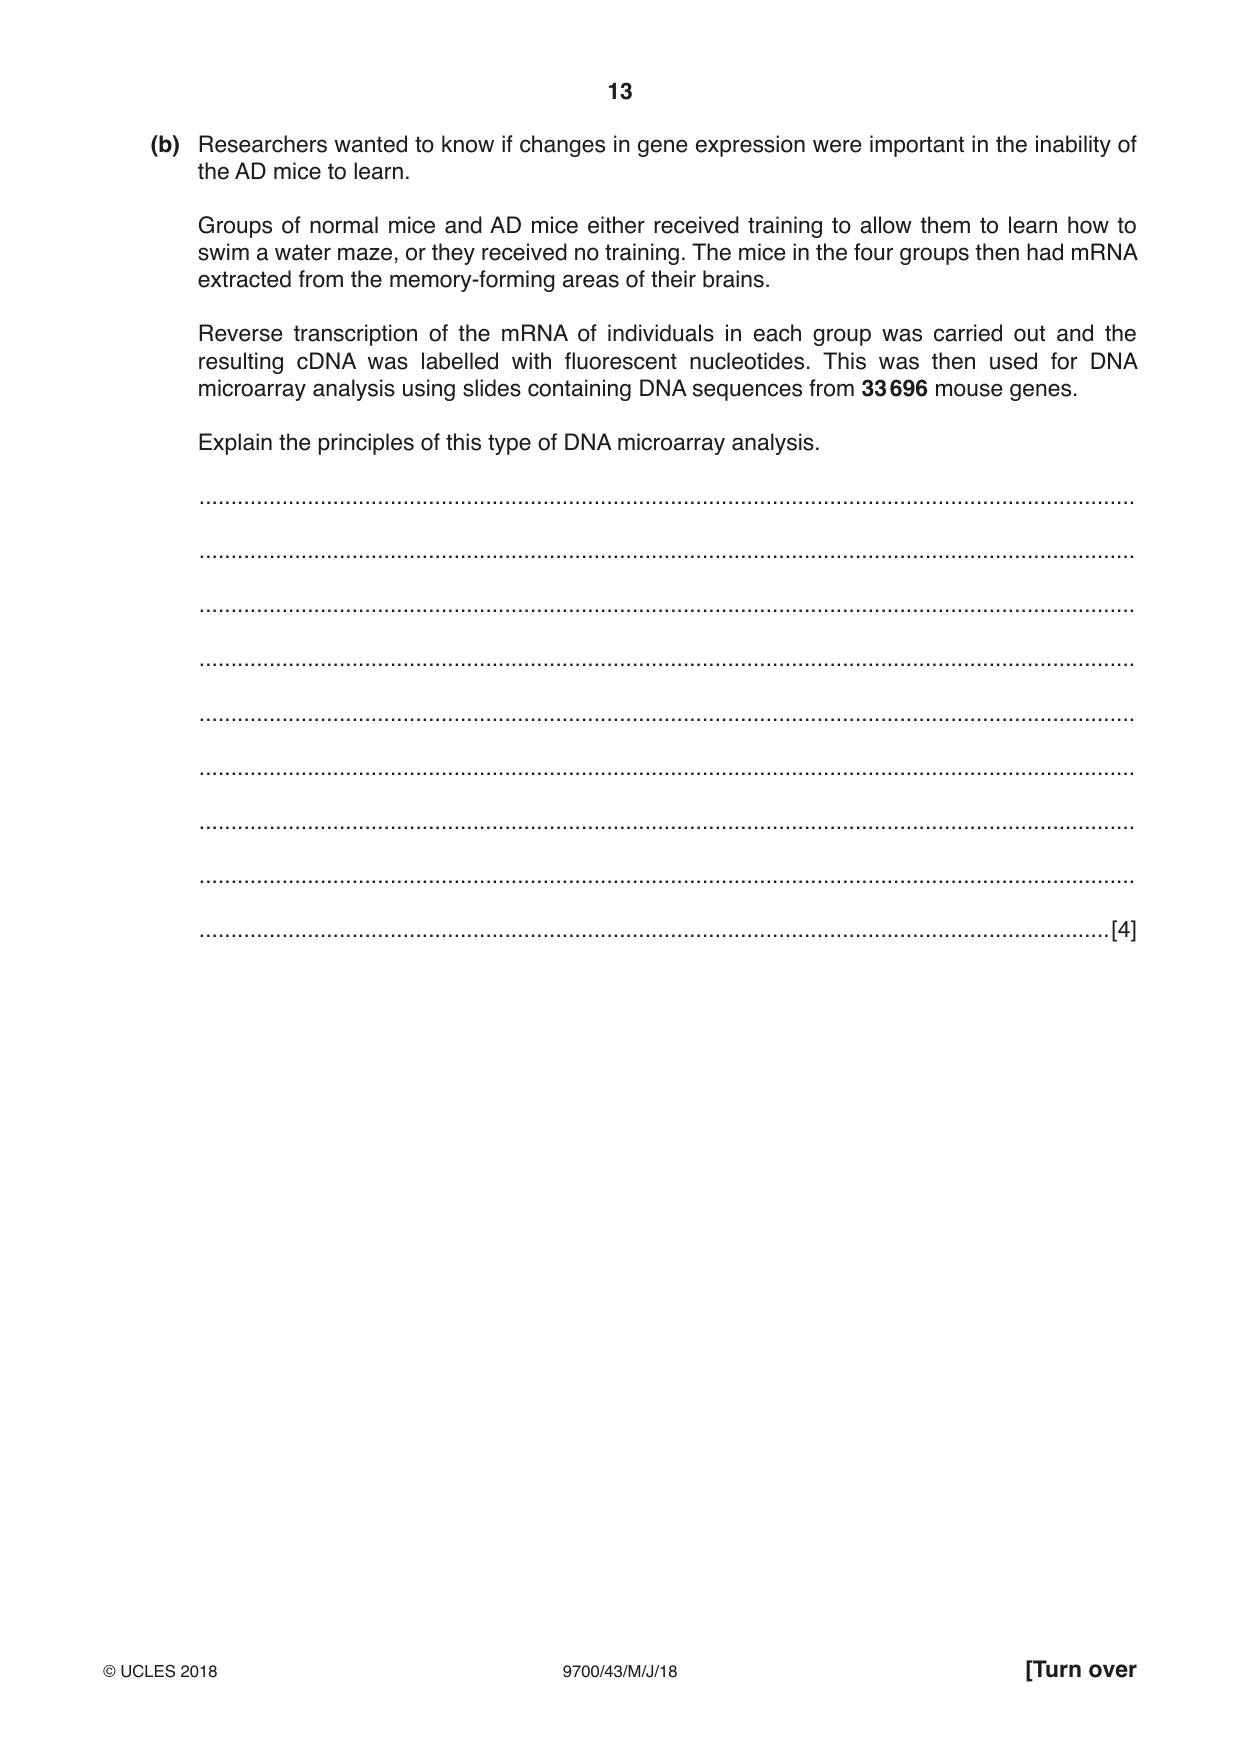
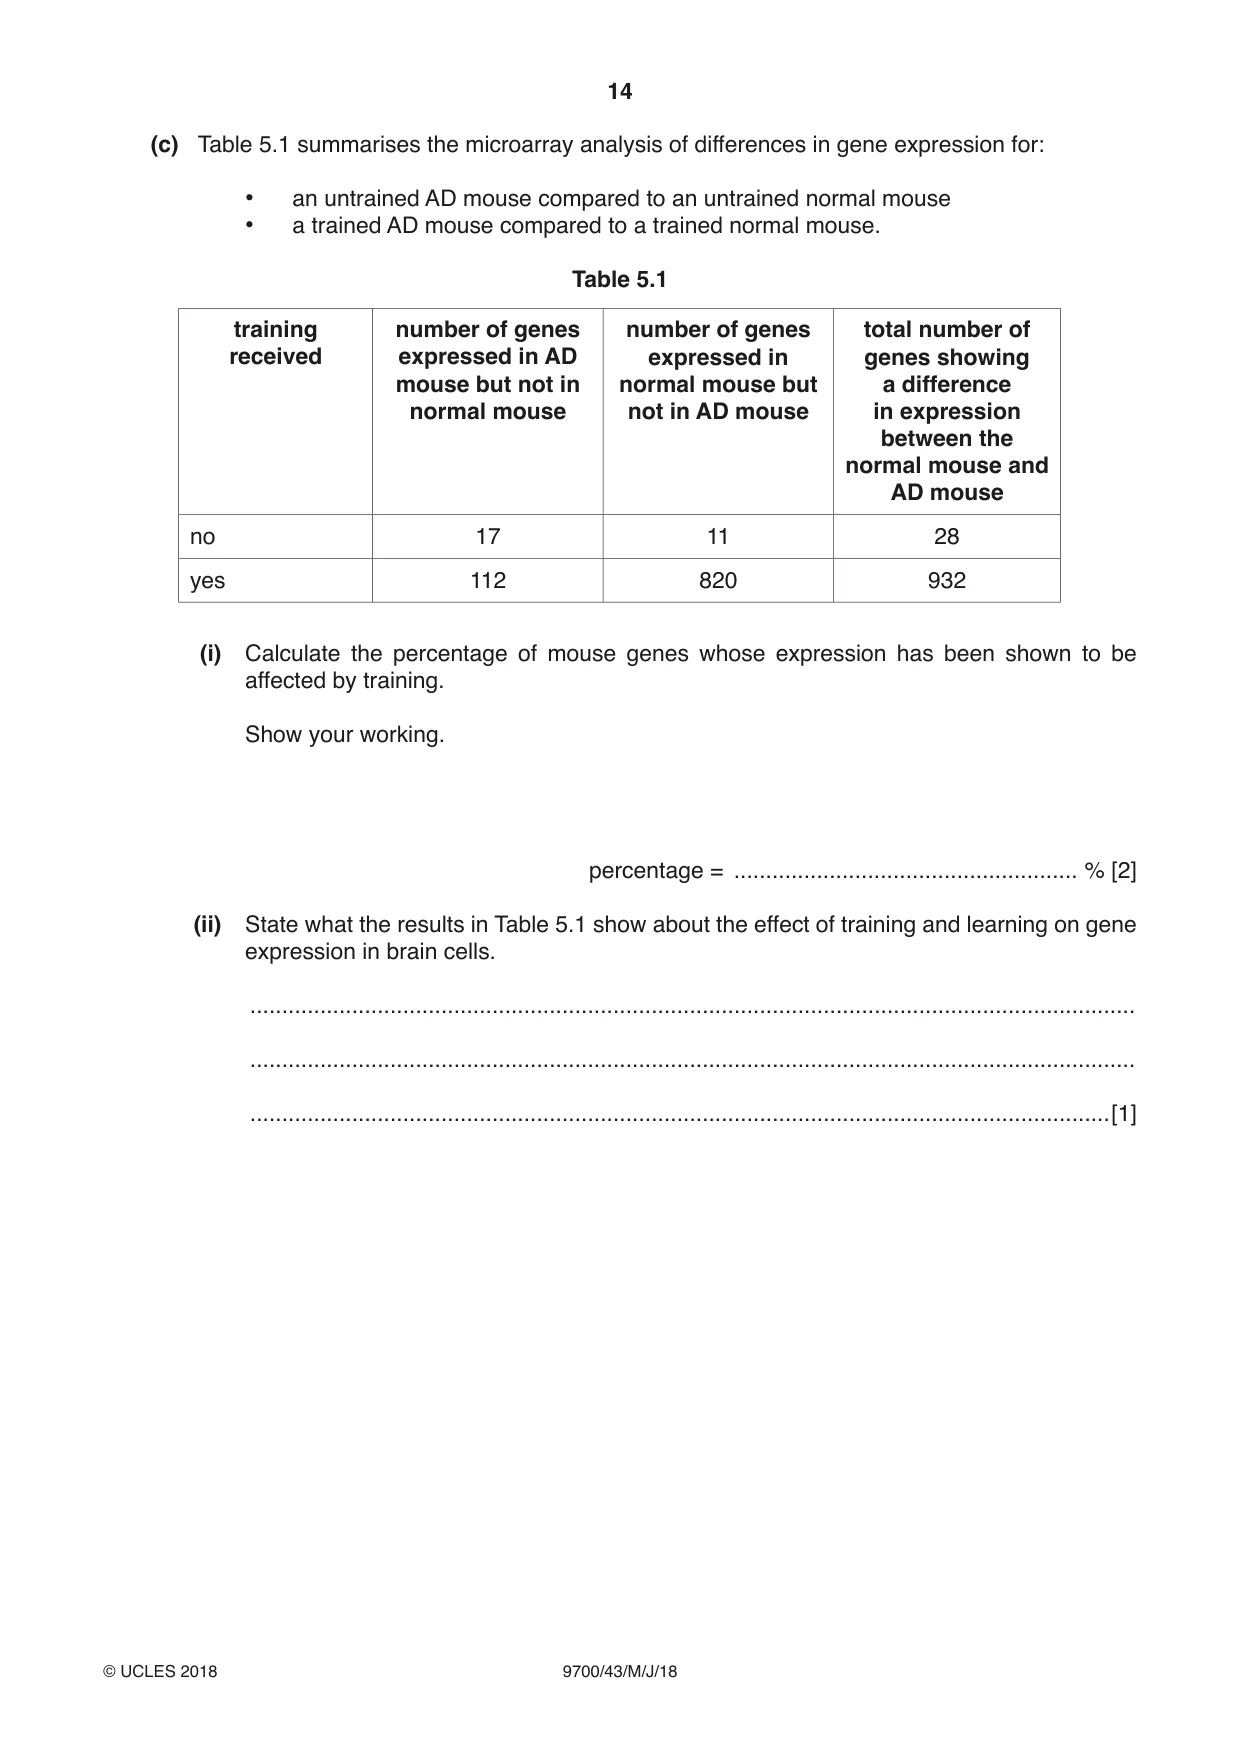
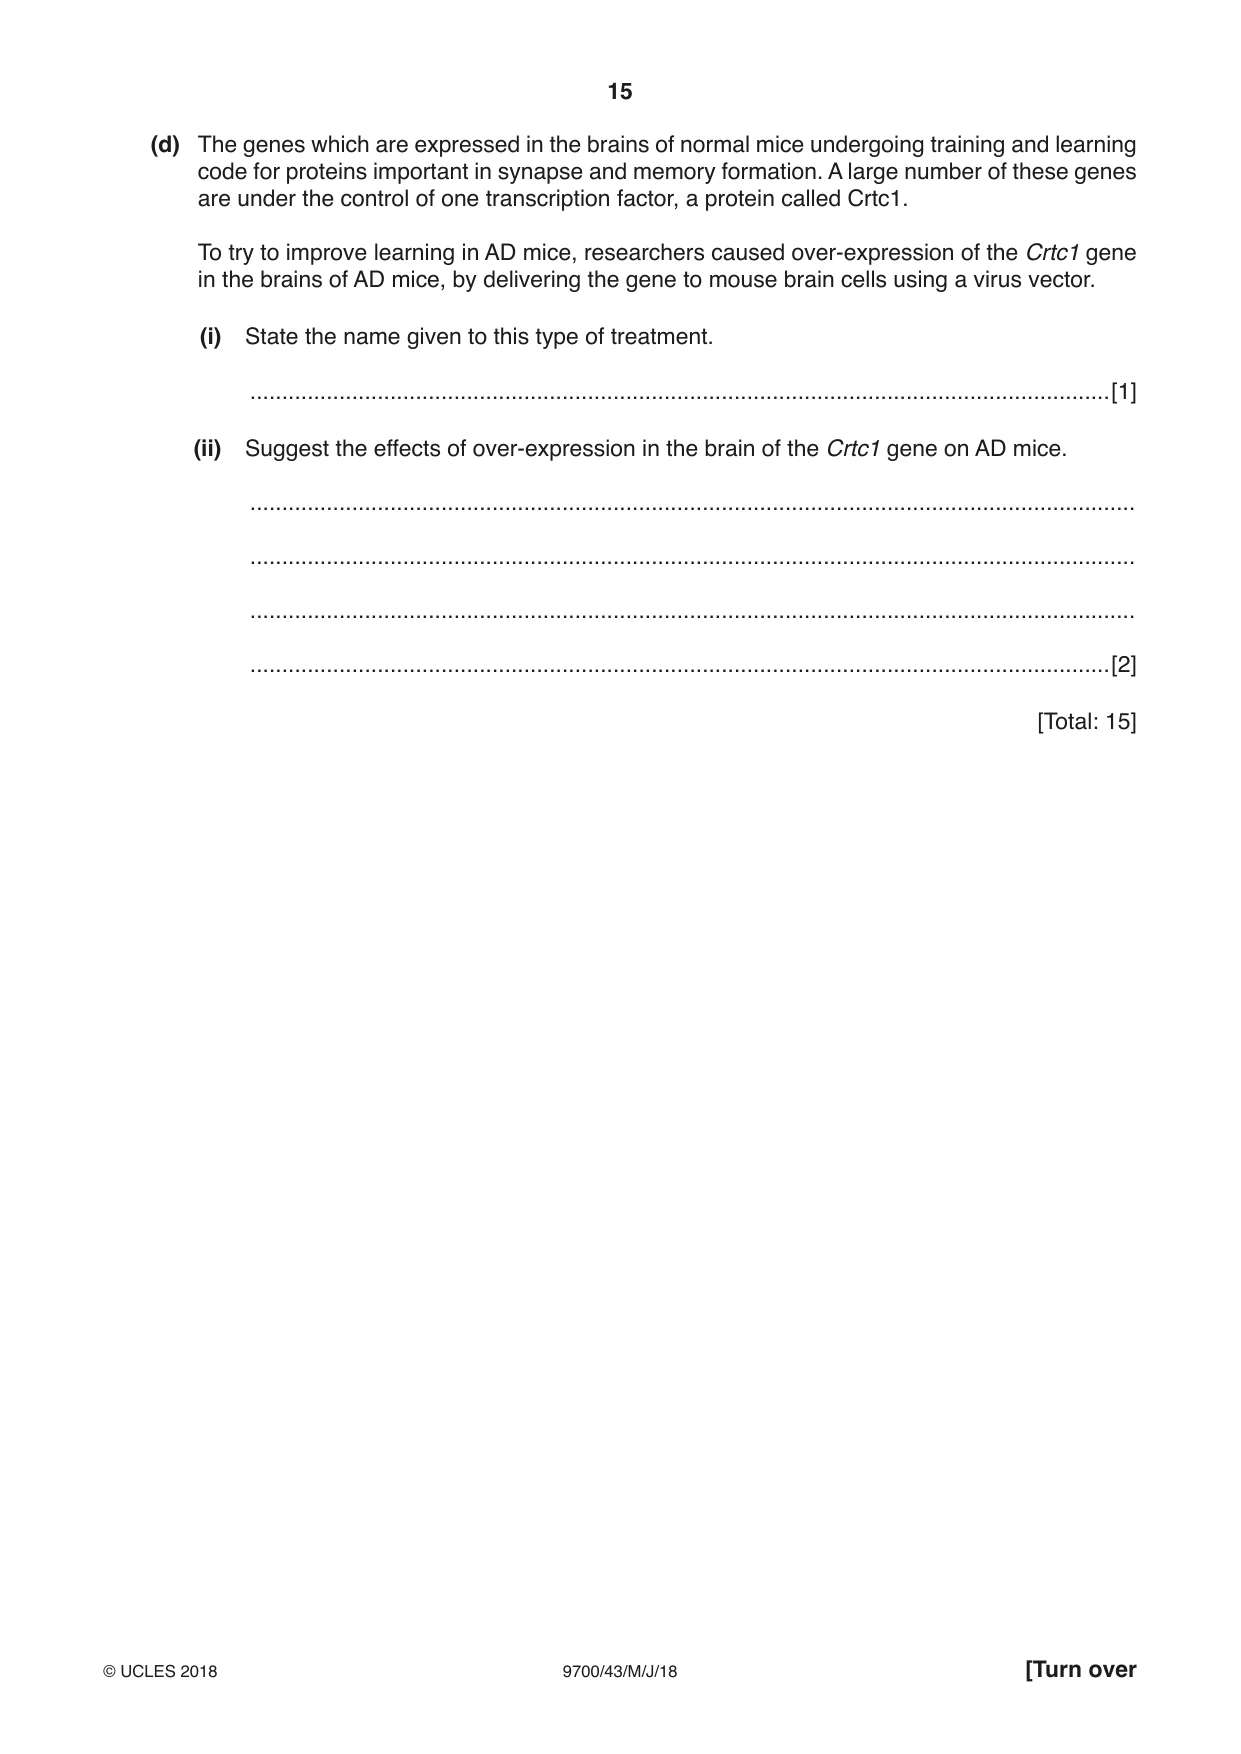
5 (a) People with Alzheimer’s disease (AD) lose their ability to form new memories. One form of Alzheimer’s disease, called familial Alzheimer’s disease, is caused by an autosomal dominant allele of the APP gene. To study Alzheimer’s disease, identical genetically modified mice containing the dominant human APP allele have been produced. These mice are known as AD mice and are used as mouse models of Alzheimer’s disease. When these AD mice are trained to swim through a water maze, they perform poorly and cannot learn as well as normal mice. (i) Suggest what steps will be needed to make identical genetically modified AD mice. ........................................................................................................................................... ........................................................................................................................................... ........................................................................................................................................... ........................................................................................................................................... ........................................................................................................................................... ........................................................................................................................................... ........................................................................................................................................... ........................................................................................................................................... .......................................................................................................................................[4] (ii) Suggest why it is useful to have an animal model of a human disease. ........................................................................................................................................... ........................................................................................................................................... .......................................................................................................................................[1] (b) Researchers wanted to know if changes in gene expression were important in the inability of the AD mice to learn. Groups of normal mice and AD mice either received training to allow them to learn how to swim a water maze, or they received no training. The mice in the four groups then had mRNA extracted from the memory-forming areas of their brains. Reverse transcription of the mRNA of individuals in each group was carried out and the resulting cDNA was labelled with fluorescent nucleotides. This was then used for DNA microarray analysis using slides containing DNA sequences from 33 696 mouse genes. Explain the principles of this type of DNA microarray analysis. ................................................................................................................................................... ................................................................................................................................................... ................................................................................................................................................... ................................................................................................................................................... ................................................................................................................................................... ................................................................................................................................................... ................................................................................................................................................... ................................................................................................................................................... ...............................................................................................................................................[4] (c) Table 5.1 summarises the microarray analysis of differences in gene expression for: • an untrained AD mouse compared to an untrained normal mouse • a trained AD mouse compared to a trained normal mouse. Table 5.1 training number of genes number of genes total number of received expressed in AD expressed in genes showing mouse but not in normal mouse but a difference normal mouse not in AD mouse in expression between the normal mouse and AD mouse no 17 11 28 yes 112 820 932 (i) Calculate the percentage of mouse genes whose expression has been shown to be affected by training. Show your working. percentage = ...................................................... % [2] (ii) State what the results in Table 5.1 show about the effect of training and learning on gene expression in brain cells. ........................................................................................................................................... ........................................................................................................................................... .......................................................................................................................................[1] (d) The genes which are expressed in the brains of normal mice undergoing training and learning code for proteins important in synapse and memory formation. A large number of these genes are under the control of one transcription factor, a protein called Crtc1. To try to improve learning in AD mice, researchers caused over-expression of the Crtc1 gene in the brains of AD mice, by delivering the gene to mouse brain cells using a virus vector. (i) State the name given to this type of treatment. .......................................................................................................................................[1] (ii) Suggest the effects of over-expression in the brain of the Crtc1 gene on AD mice. ........................................................................................................................................... ........................................................................................................................................... ........................................................................................................................................... .......................................................................................................................................[2] [Total: 15]
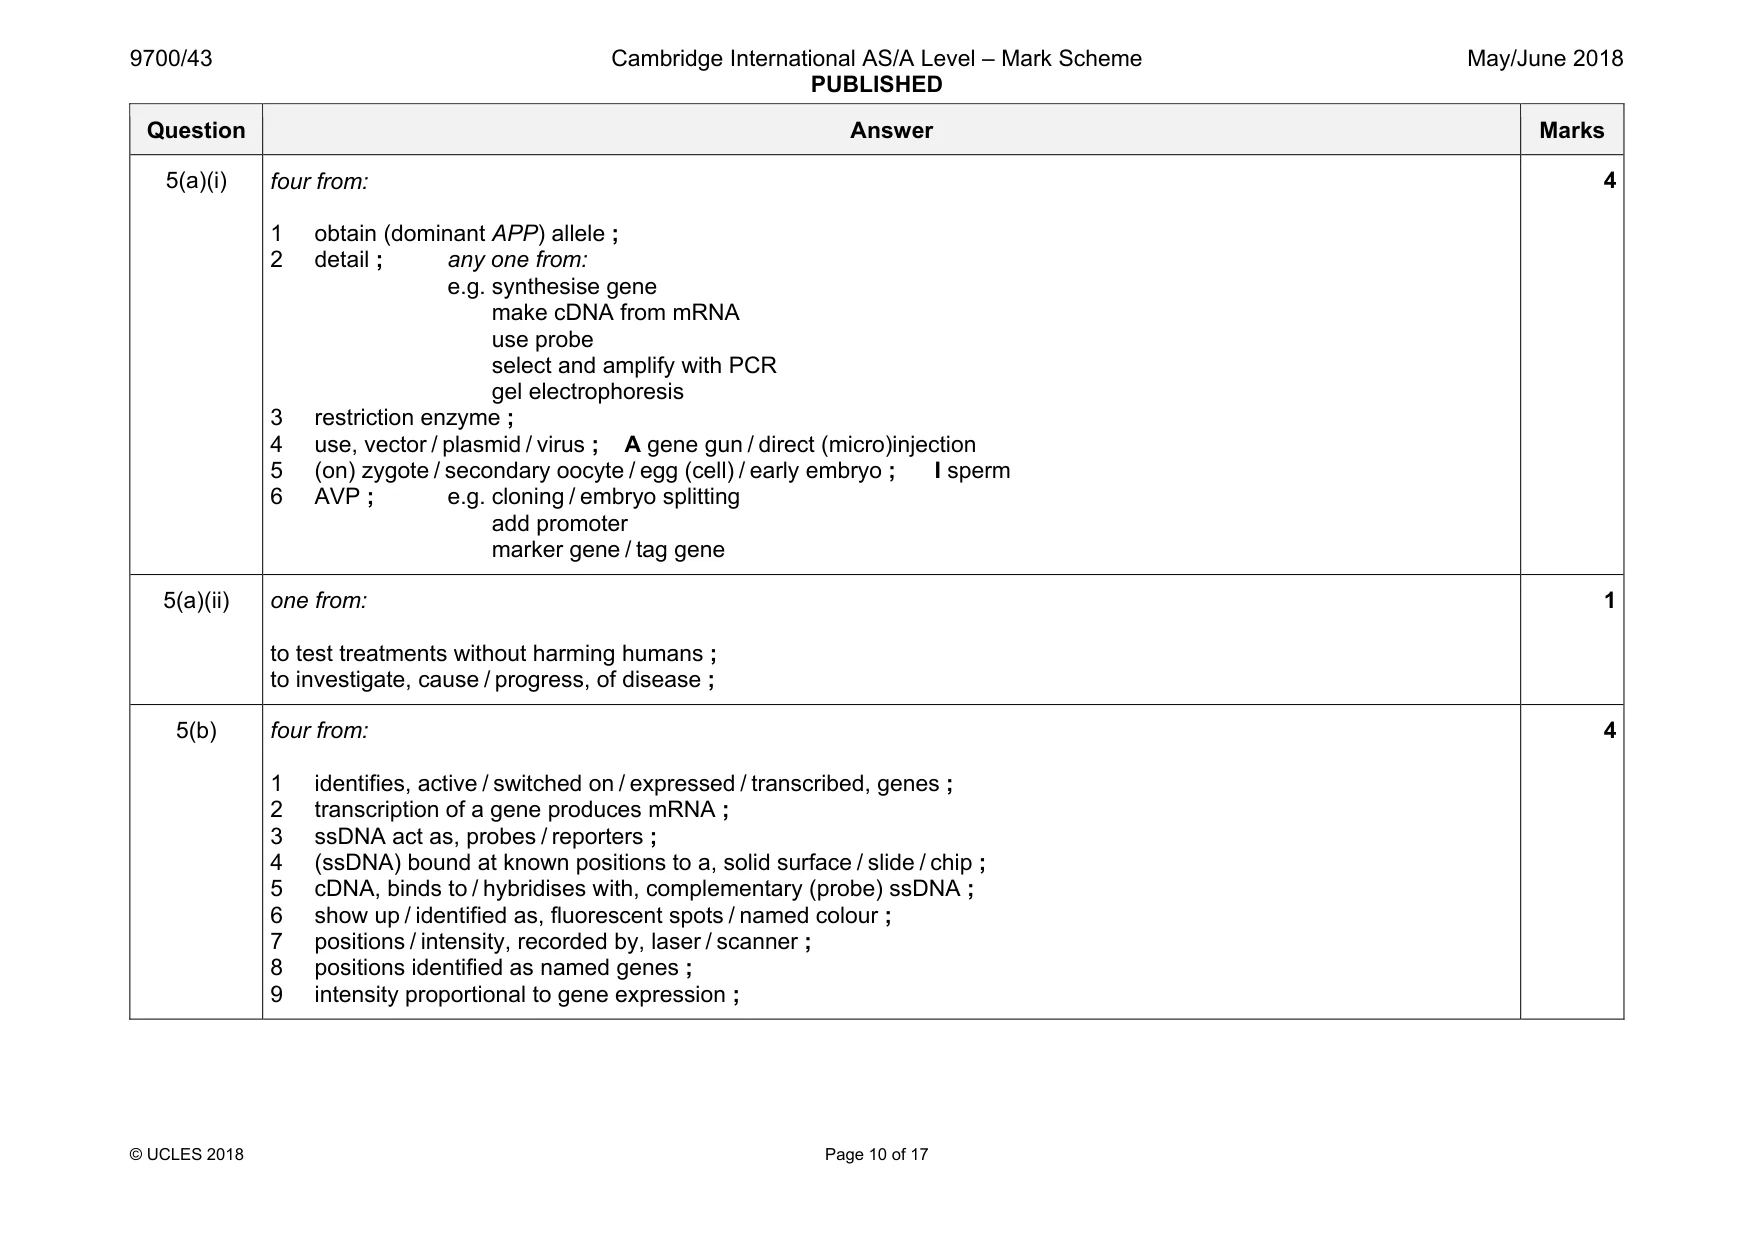
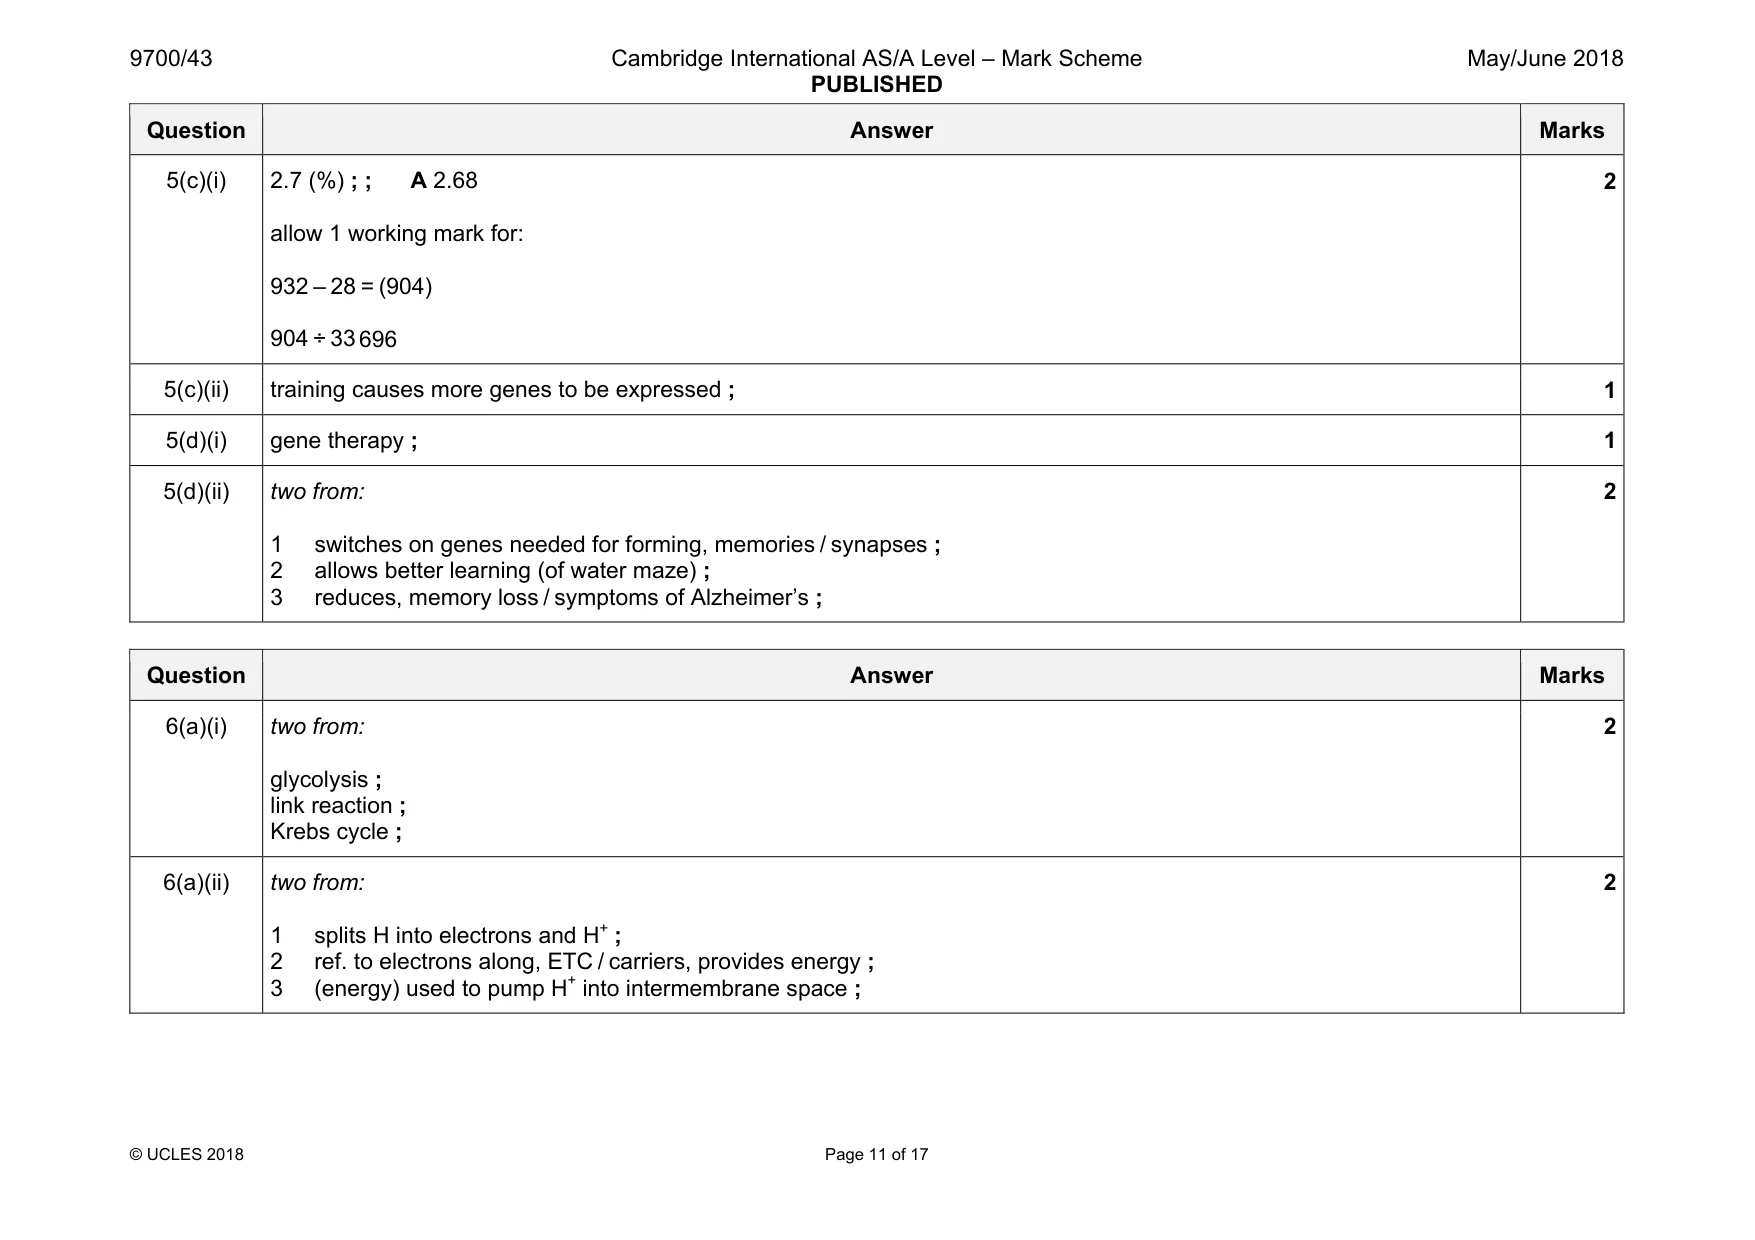
Mark scheme: 5(a)(i) four from: 1 obtain (dominant APP) allele ; 2 detail ; any one from: e.g. synthesise gene make cDNA from mRNA use probe select and amplify with PCR gel electrophoresis 3 restriction enzyme ; 4 use, vector / plasmid / virus ; A gene gun / direct (micro)injection 5 (on) zygote / secondary oocyte / egg (cell) / early embryo ; I sperm 6 AVP ; e.g. cloning / embryo splitting add promoter marker gene / tag gene 4 5(a)(ii) one from: to test treatments without harming humans ; to investigate, cause / progress, of disease ; 1 5(b) four from: 1 identifies, active / switched on / expressed / transcribed, genes ; 2 transcription of a gene produces mRNA ; 3 ssDNA act as, probes / reporters ; 4 (ssDNA) bound at known positions to a, solid surface / slide / chip ; 5 cDNA, binds to / hybridises with, complementary (probe) ssDNA ; 6 show up / identified as, fluorescent spots / named colour ; 7 positions / intensity, recorded by, laser / scanner ; 8 positions identified as named genes ; 9 intensity proportional to gene expression ; 4 Question Answer Marks 5(c)(i) 2.7 (%) ; ; A 2.68 allow 1 working mark for: 932 – 28 = (904) 904 ÷ 33 696 2 5(c)(ii) training causes more genes to be expressed ; 1 5(d)(i) gene therapy ; 1 5(d)(ii) two from: 1 switches on genes needed for forming, memories / synapses ; 2 allows better learning (of water maze) ; 3 reduces, memory loss / symptoms of Alzheimer’s ; 2
Q6 · A diagram of part of a mitochondrion showing some of the events occurring in oxidative…
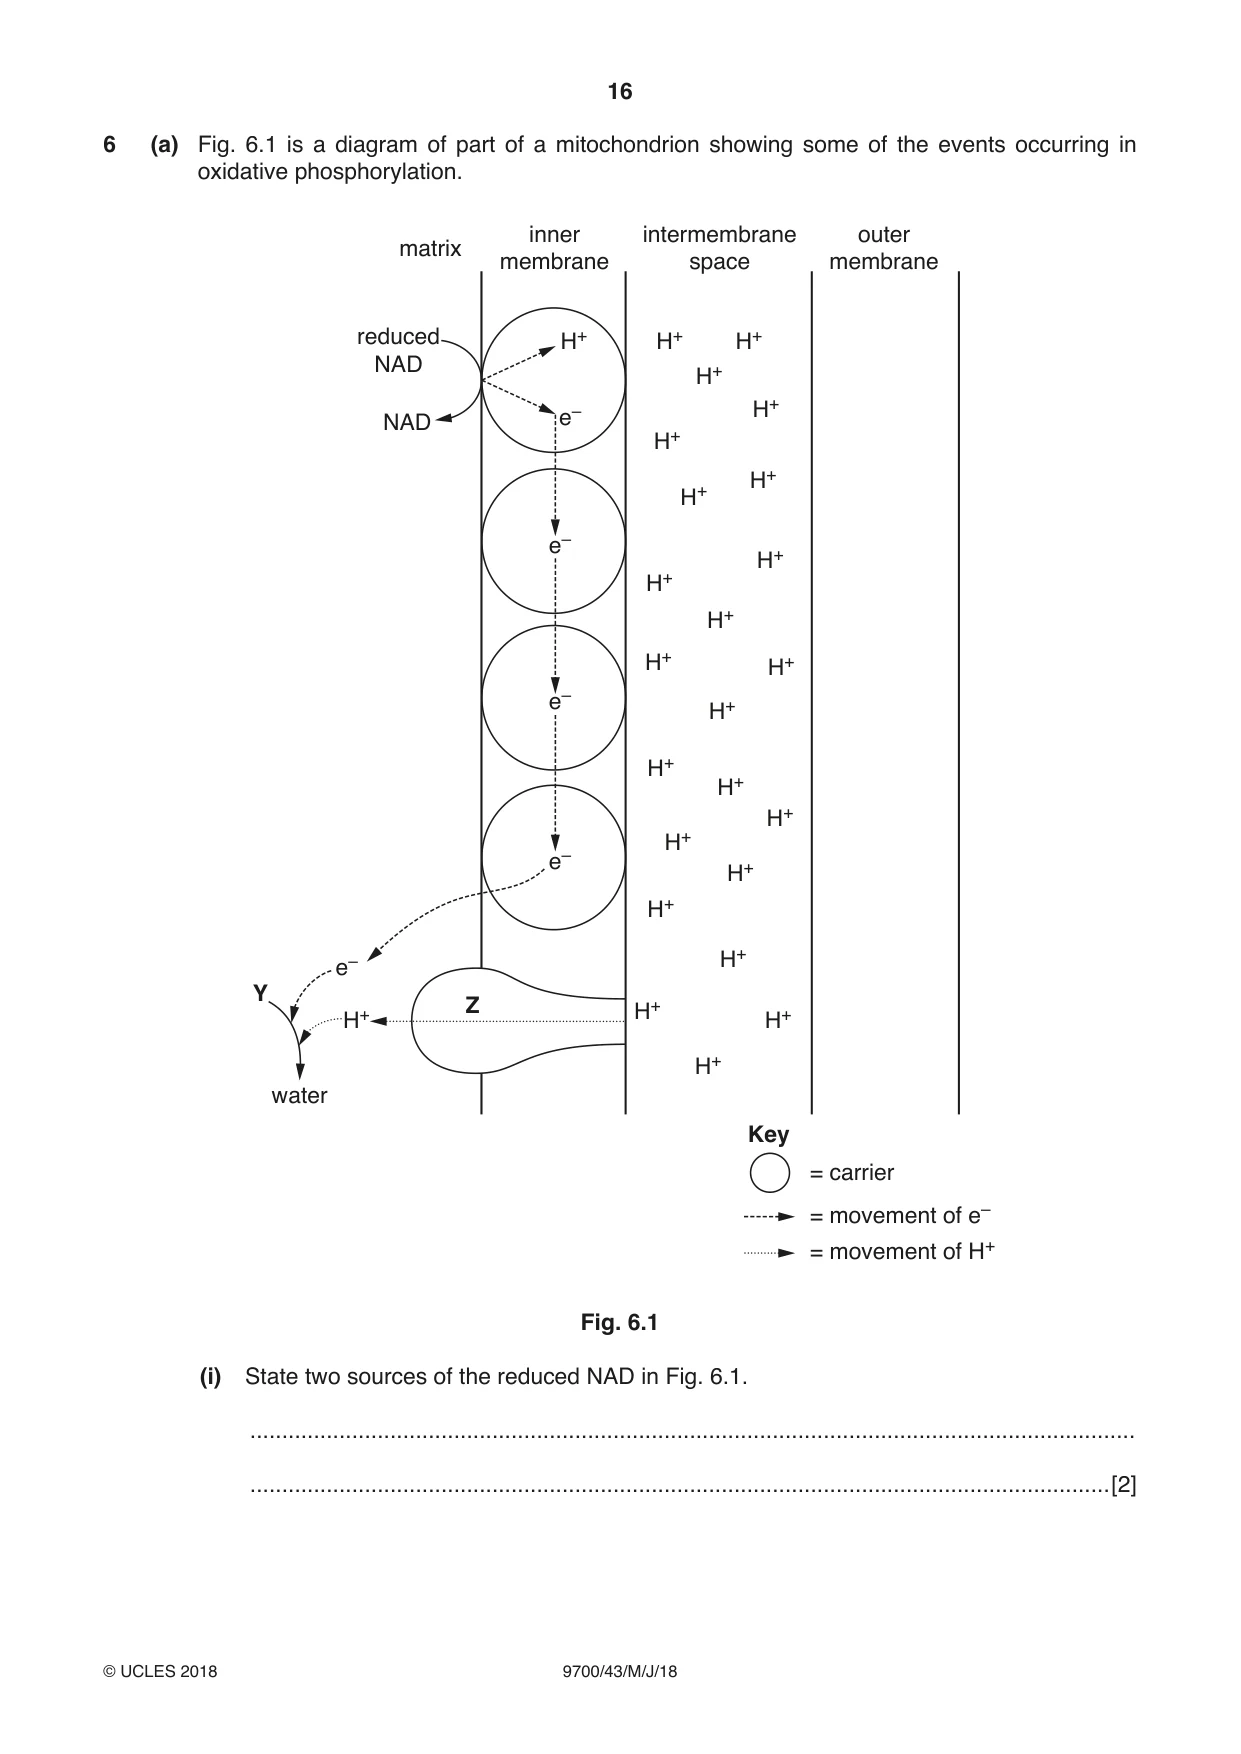
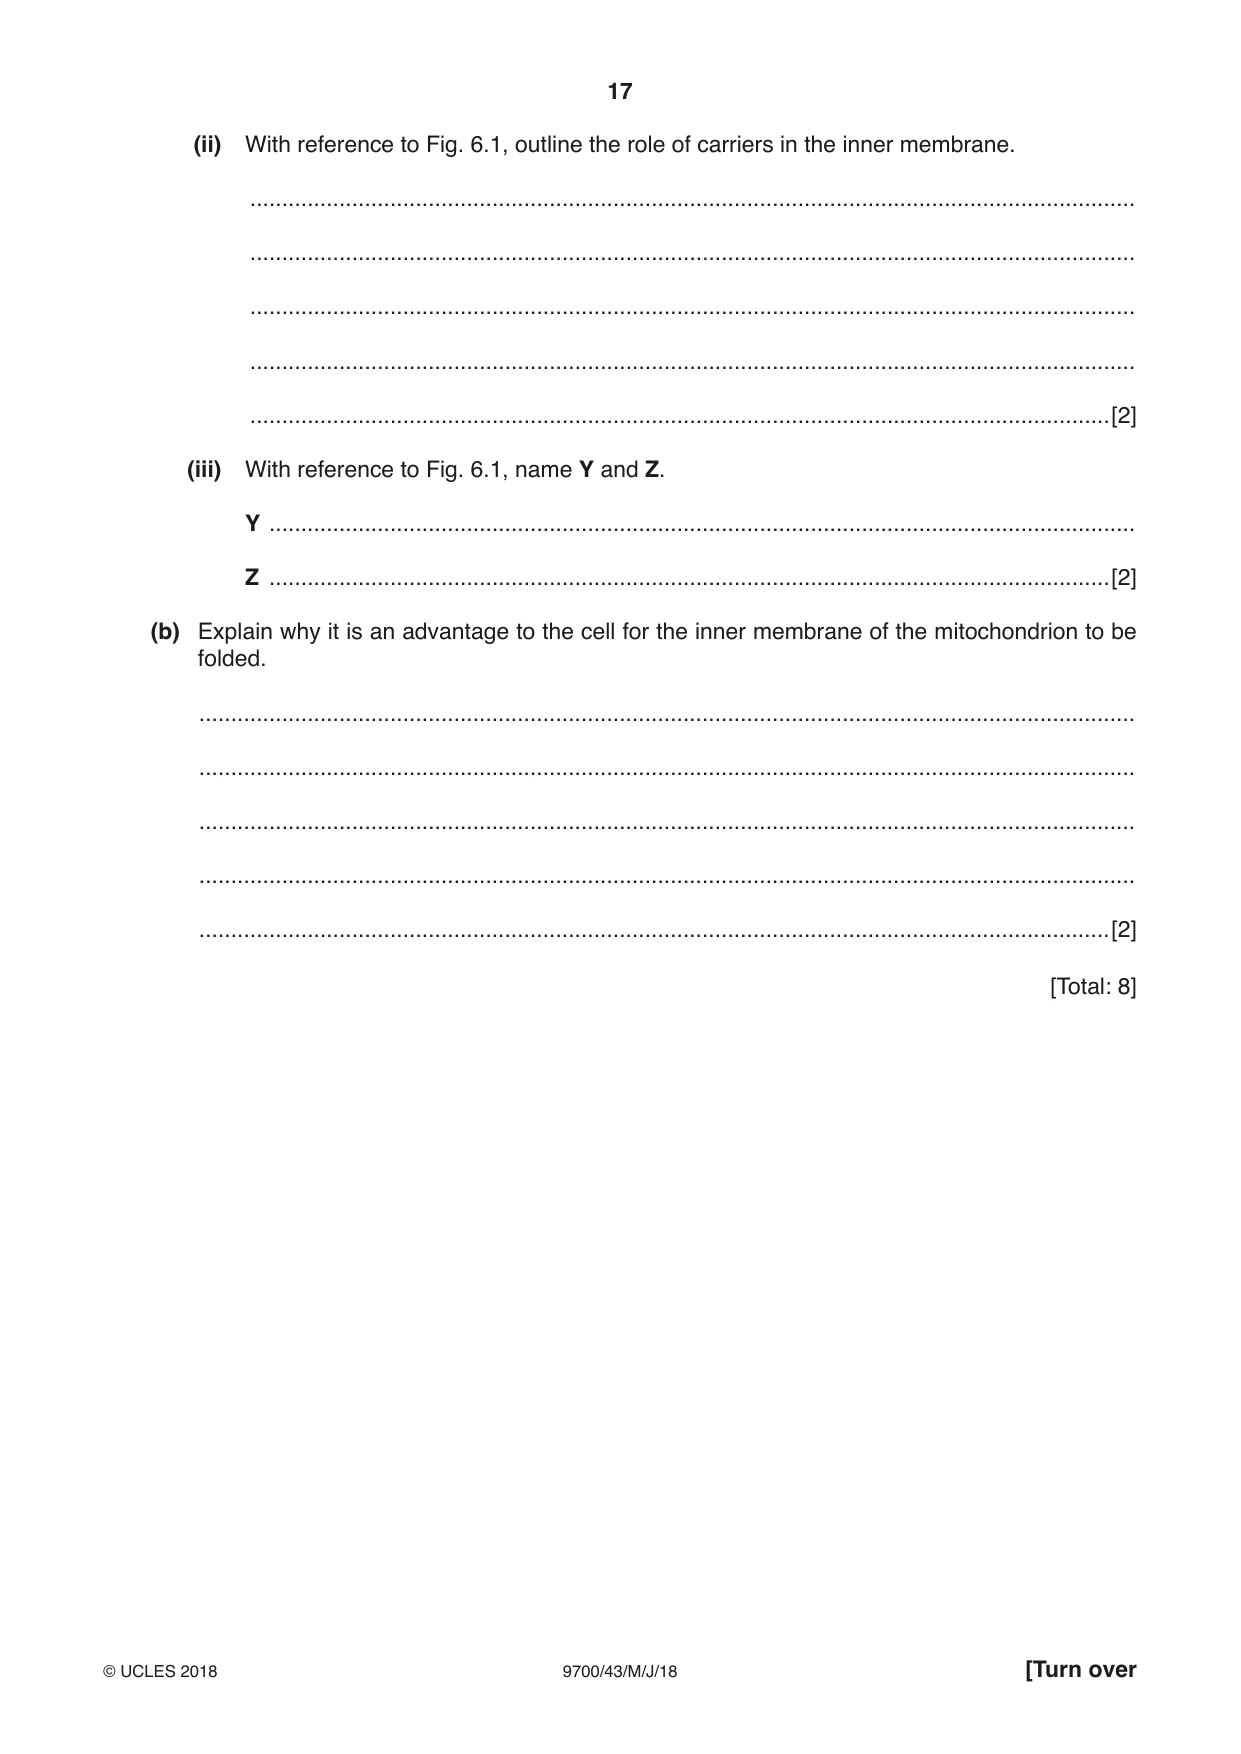
6 (a) Fig. 6.1 is a diagram of part of a mitochondrion showing some of the events occurring in oxidative phosphorylation. inner intermembrane outer matrix membrane space membrane reduced H+ H+ H+ NAD H+ H+ NAD e– H+ H+ H+ e– H+ H+ H+ H+ H+ e– H+ H+ H+ H+ H+ e– H+ H+ H+ e– Y Z H+ H+ H+ H+ water Key = carrier = movement of e– = movement of H+ Fig. 6.1 (i) State two sources of the reduced NAD in Fig. 6.1. ........................................................................................................................................... .......................................................................................................................................[2] (ii) With reference to Fig. 6.1, outline the role of carriers in the inner membrane. ........................................................................................................................................... ........................................................................................................................................... ........................................................................................................................................... ........................................................................................................................................... .......................................................................................................................................[2] (iii) With reference to Fig. 6.1, name Y and Z. Y ........................................................................................................................................ Z ....................................................................................................................................[2] (b) Explain why it is an advantage to the cell for the inner membrane of the mitochondrion to be folded. ................................................................................................................................................... ................................................................................................................................................... ................................................................................................................................................... ................................................................................................................................................... ...............................................................................................................................................[2] [Total: 8]
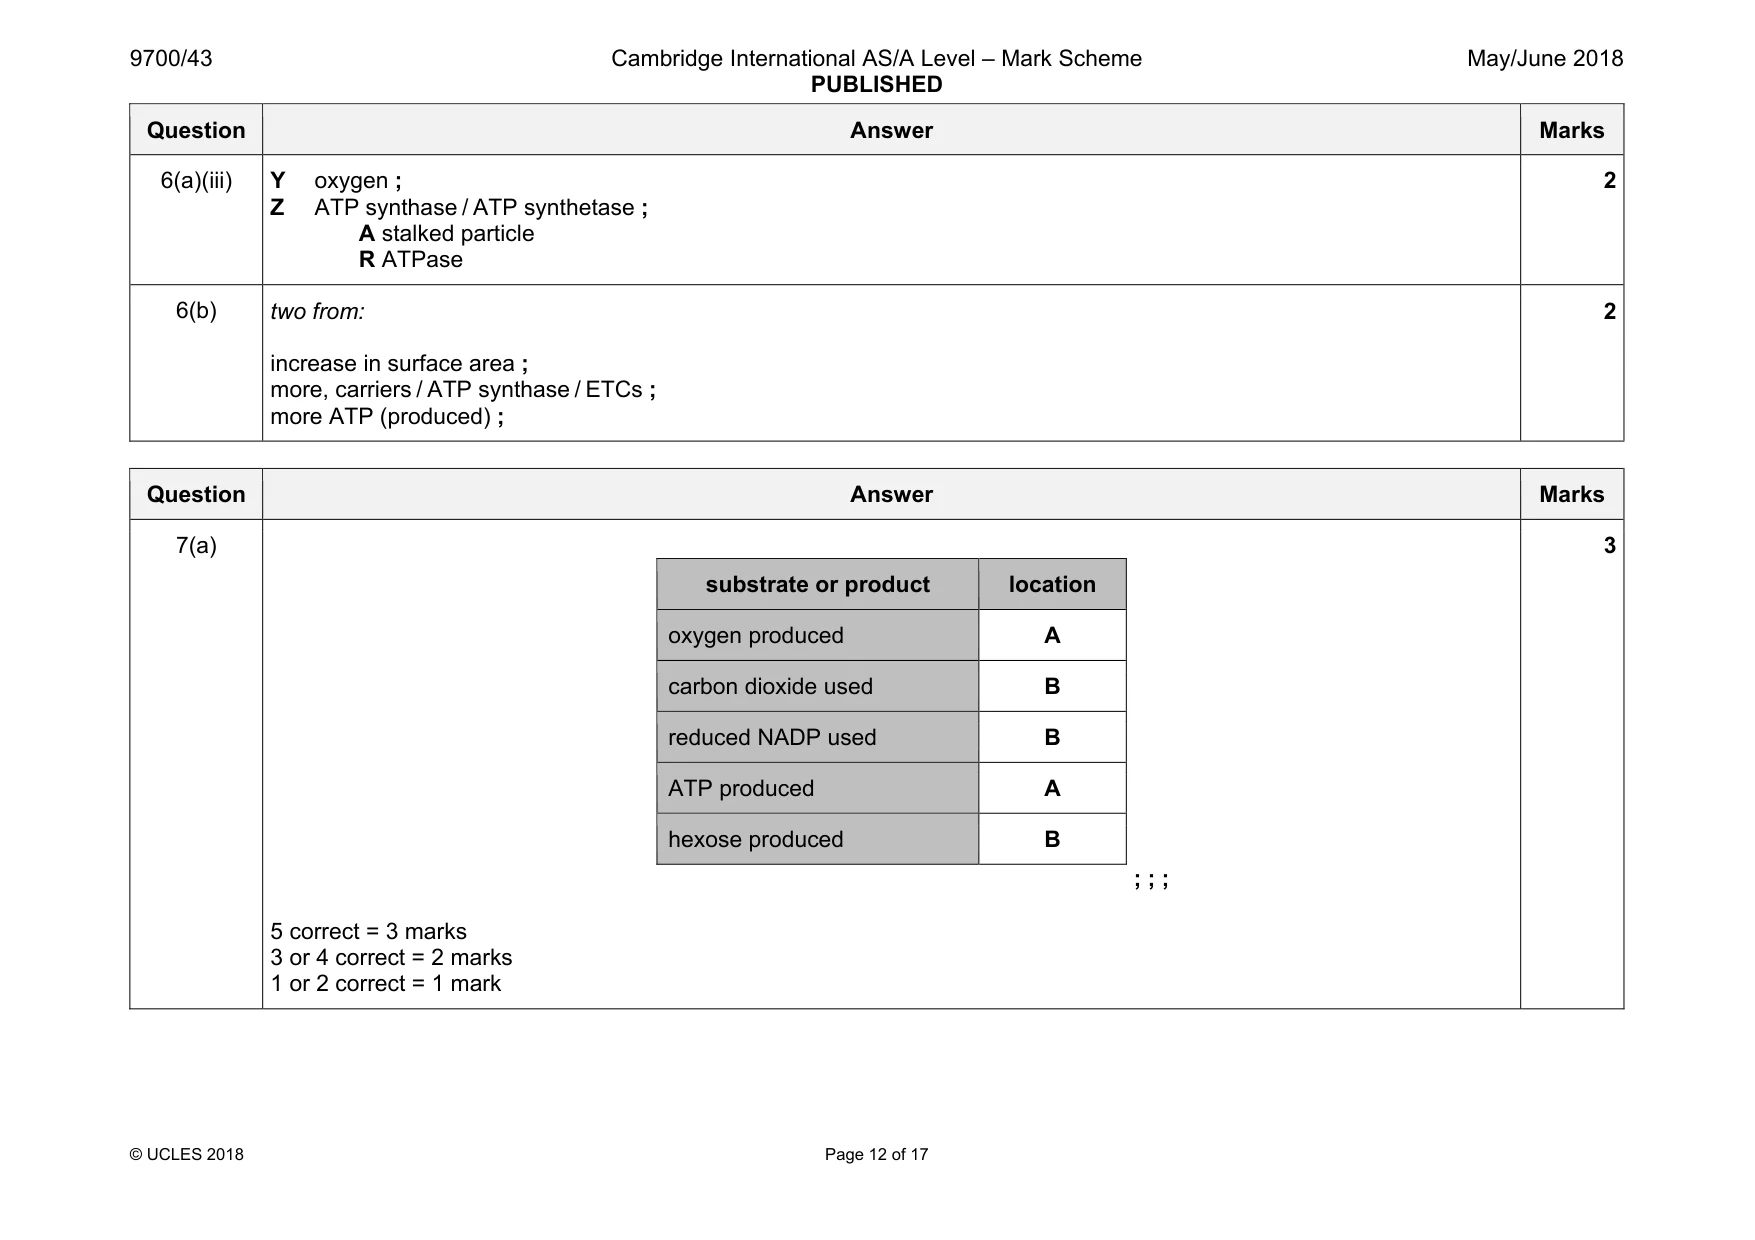
Mark scheme: 6(a)(i) two from: glycolysis ; link reaction ; Krebs cycle ; 2 6(a)(ii) two from: 1 splits H into electrons and H+ ; 2 ref. to electrons along, ETC / carriers, provides energy ; 3 (energy) used to pump H+ into intermembrane space ; 2 Question Answer Marks 6(a)(iii) Y oxygen ; Z ATP synthase / ATP synthetase ; A stalked particle R ATPase 2 6(b) two from: increase in surface area ; more, carriers / ATP synthase / ETCs ; more ATP (produced) ; 2
Q7 · A transmission electron micrograph of part of a chloroplast of a leaf cell from maize
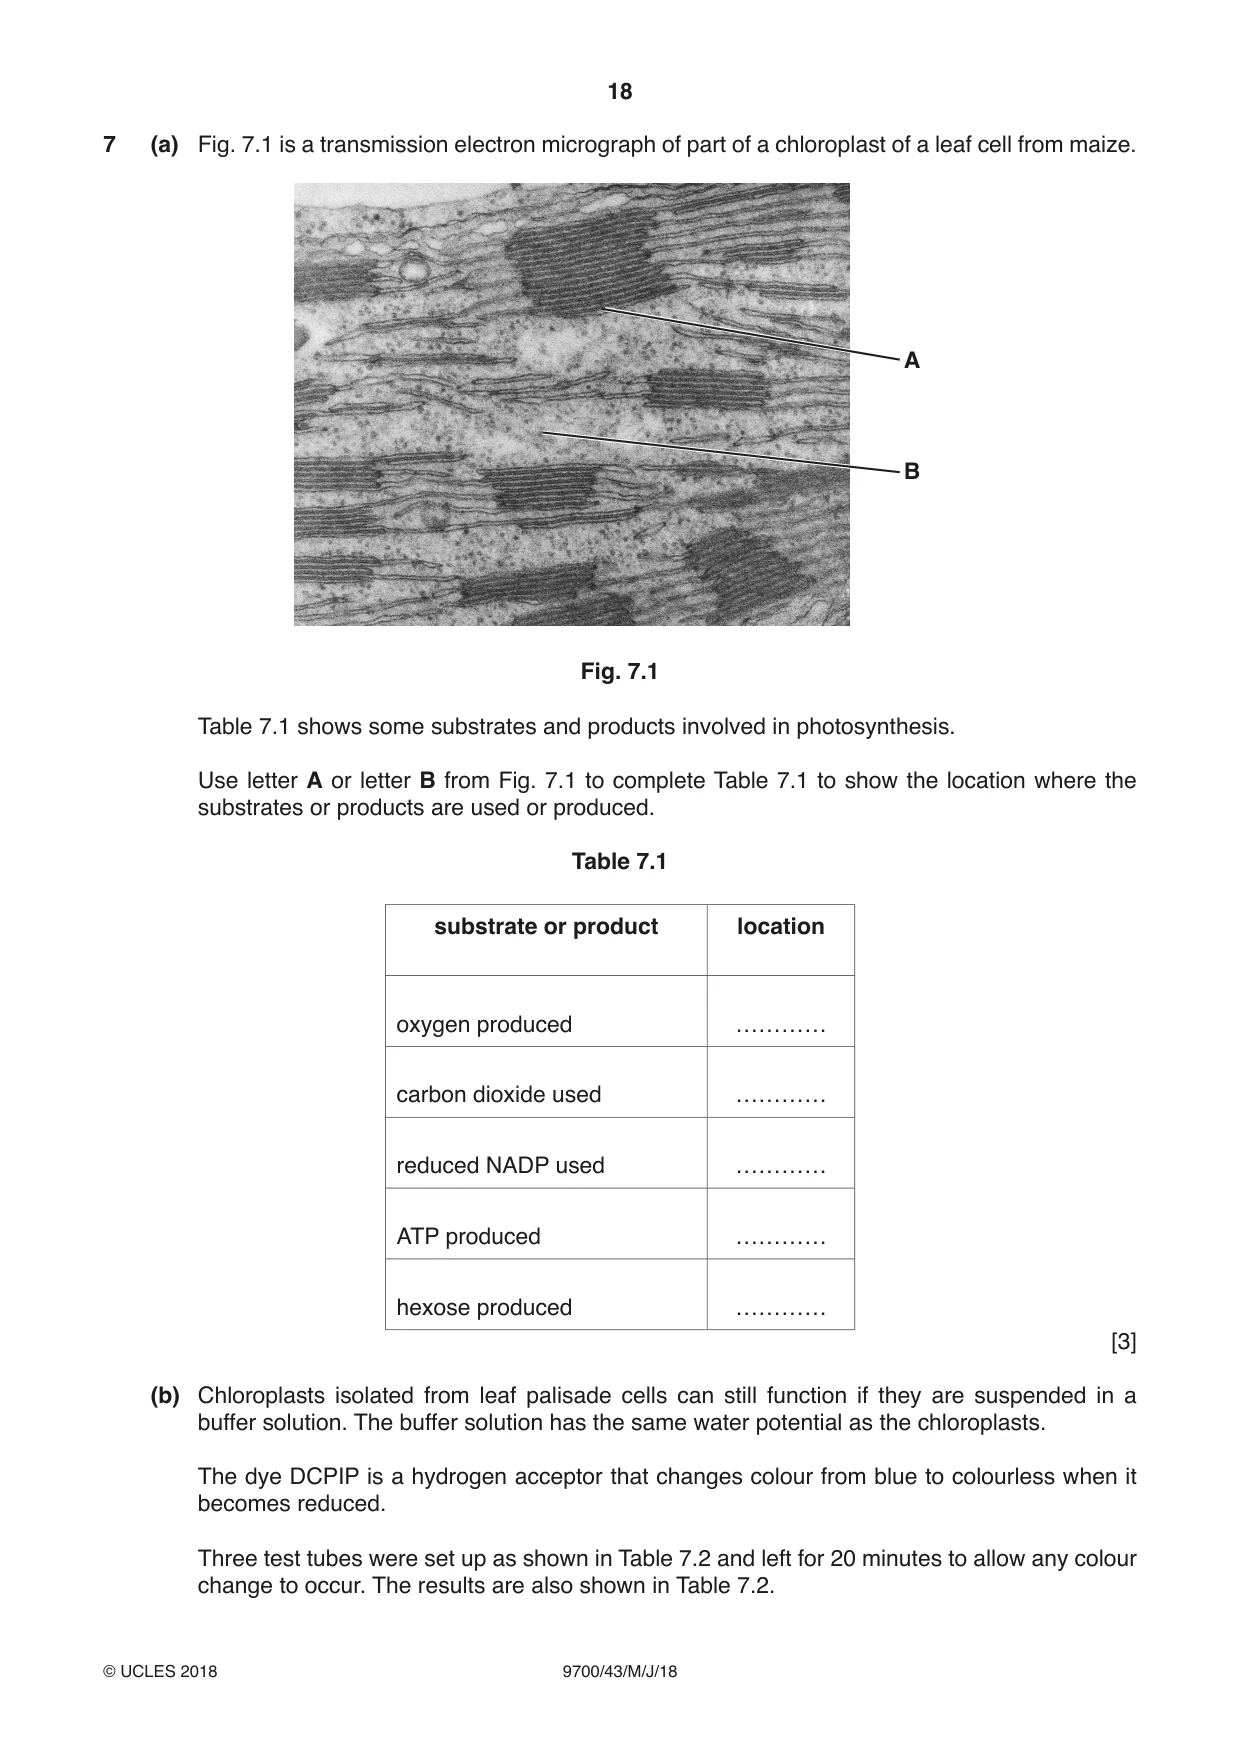
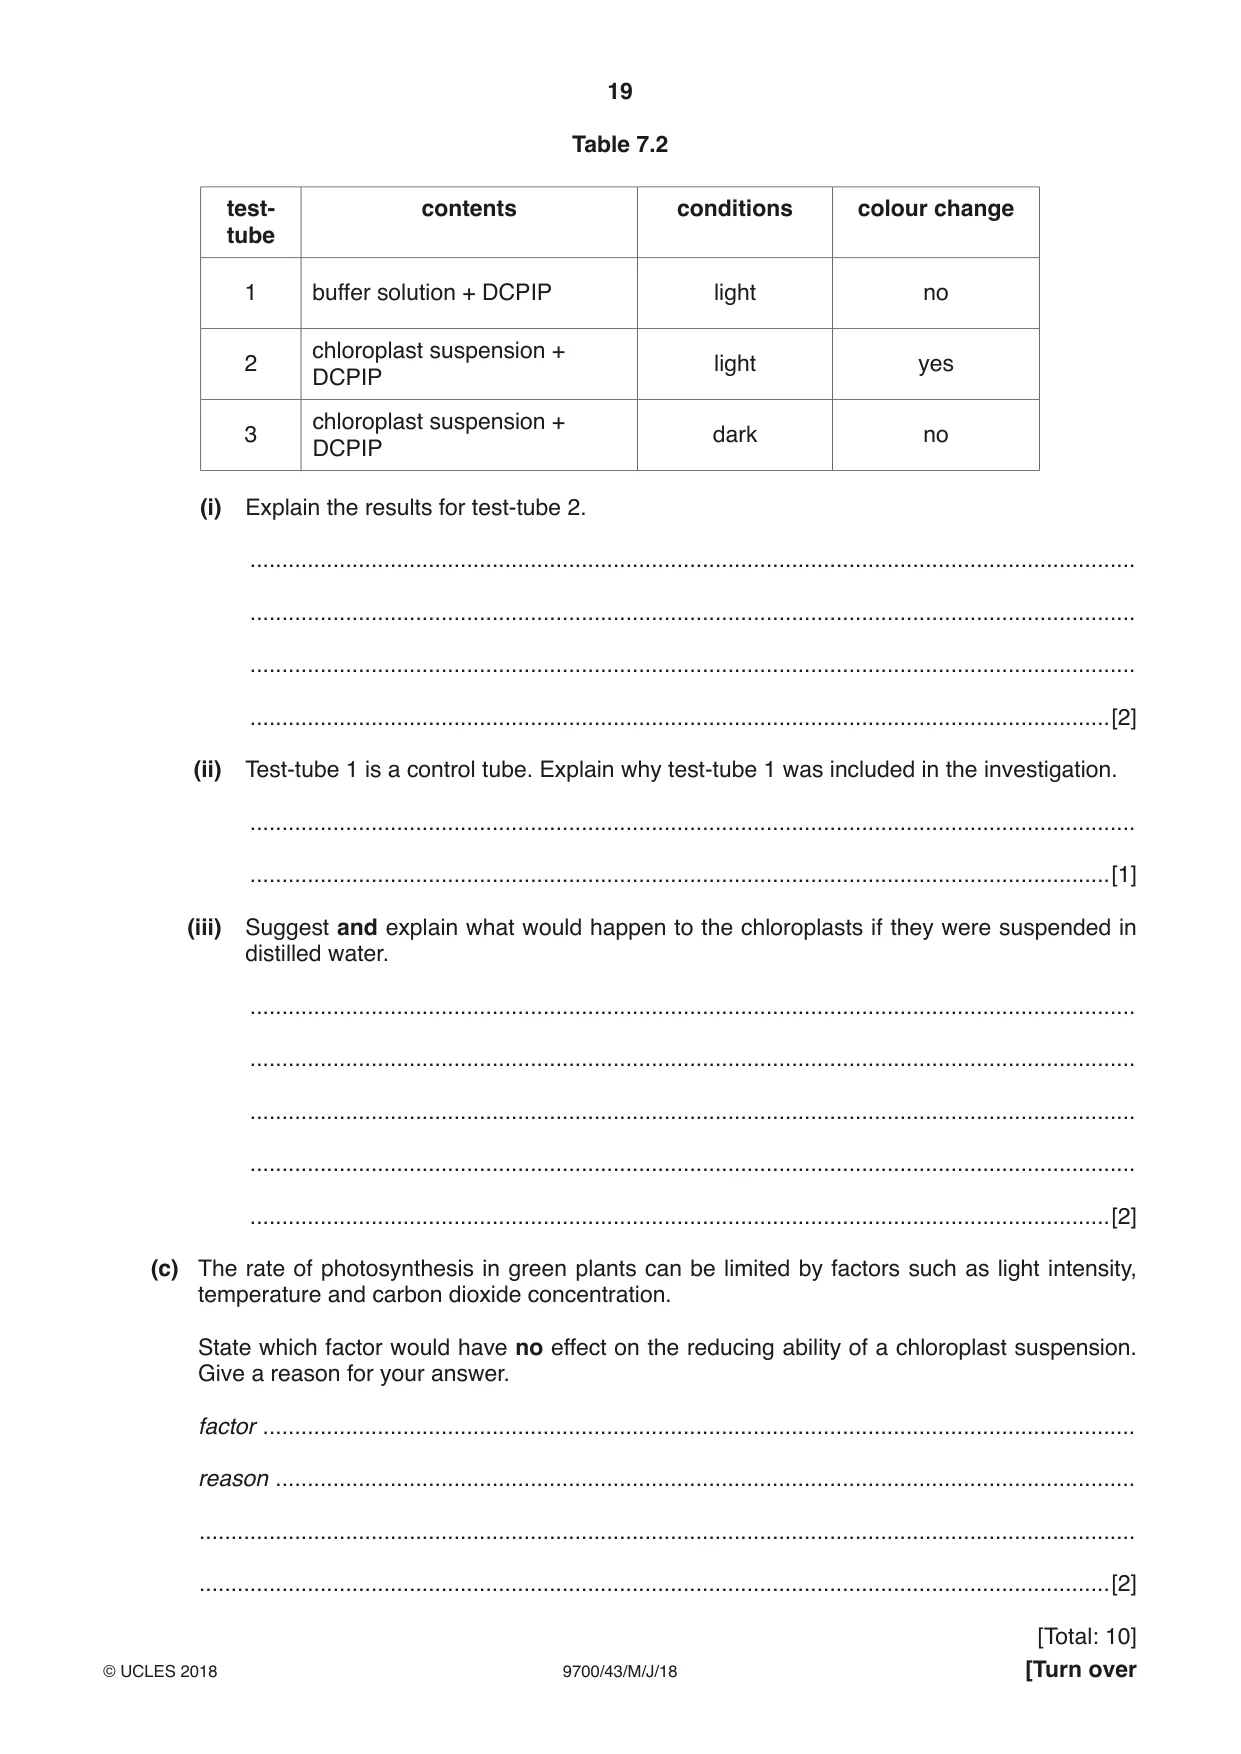
7 (a) Fig. 7.1 is a transmission electron micrograph of part of a chloroplast of a leaf cell from maize. A B Fig. 7.1 Table 7.1 shows some substrates and products involved in photosynthesis. Use letter A or letter B from Fig. 7.1 to complete Table 7.1 to show the location where the substrates or products are used or produced. Table 7.1 substrate or product location oxygen produced ………… carbon dioxide used ………… reduced NADP used ………… ATP produced ………… hexose produced ………… [3] (b) Chloroplasts isolated from leaf palisade cells can still function if they are suspended in a buffer solution. The buffer solution has the same water potential as the chloroplasts. The dye DCPIP is a hydrogen acceptor that changes colour from blue to colourless when it becomes reduced. Three test tubes were set up as shown in Table 7.2 and left for 20 minutes to allow any colour change to occur. The results are also shown in Table 7.2. Table 7.2 test- contents conditions colour change tube 1 buffer solution + DCPIP light no chloroplast suspension + 2 light yes DCPIP chloroplast suspension + 3 dark no DCPIP (i) Explain the results for test-tube 2. ........................................................................................................................................... ........................................................................................................................................... ........................................................................................................................................... .......................................................................................................................................[2] (ii) Test-tube 1 is a control tube. Explain why test-tube 1 was included in the investigation. ........................................................................................................................................... .......................................................................................................................................[1] (iii) Suggest and explain what would happen to the chloroplasts if they were suspended in distilled water. ........................................................................................................................................... ........................................................................................................................................... ........................................................................................................................................... ........................................................................................................................................... .......................................................................................................................................[2] (c) The rate of photosynthesis in green plants can be limited by factors such as light intensity, temperature and carbon dioxide concentration. State which factor would have no effect on the reducing ability of a chloroplast suspension. Give a reason for your answer. factor ......................................................................................................................................... reason ....................................................................................................................................... ................................................................................................................................................... ...............................................................................................................................................[2] [Total: 10]
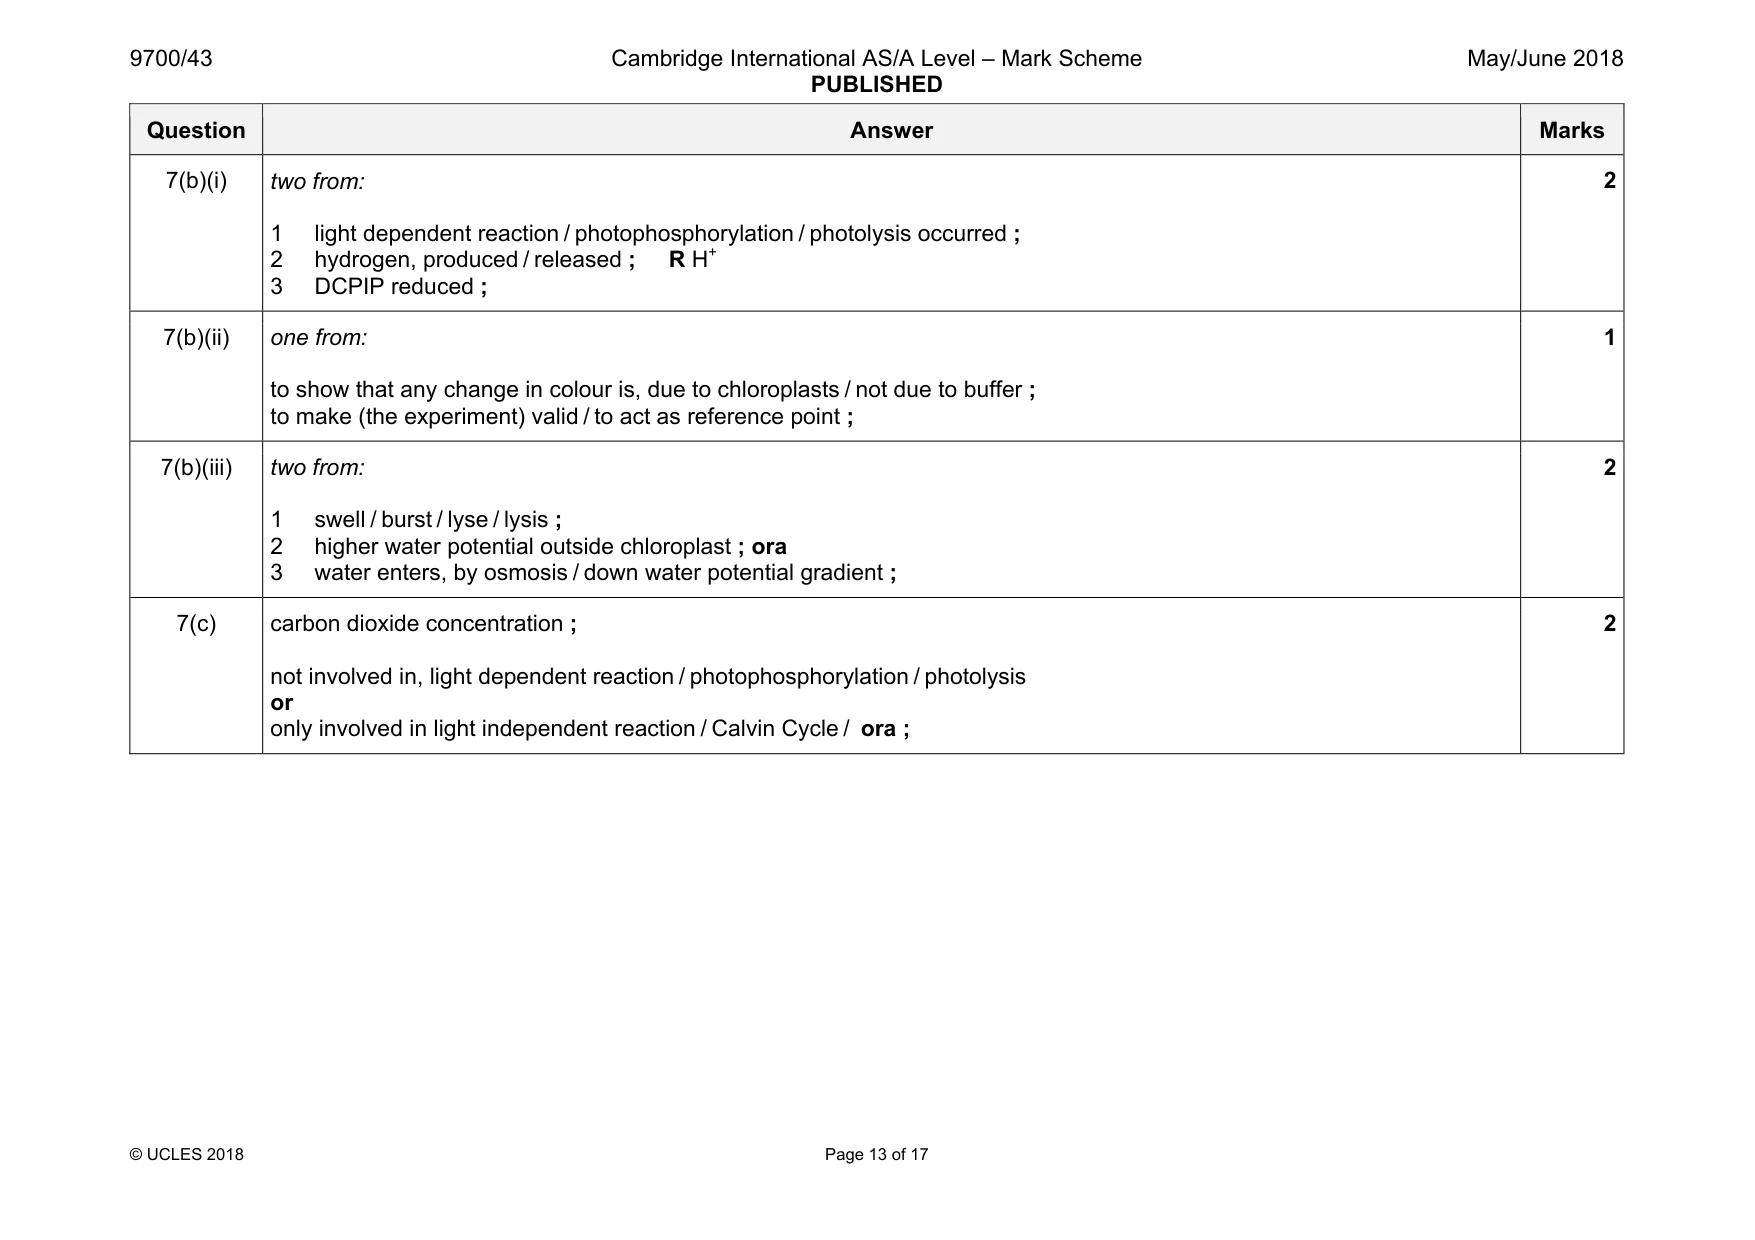
Mark scheme: 7(a) substrate or product location oxygen produced A carbon dioxide used B reduced NADP used B ATP produced A hexose produced B ; ; ; 5 correct = 3 marks 3 or 4 correct = 2 marks 1 or 2 correct = 1 mark 3 Question Answer Marks 7(b)(i) two from: 1 light dependent reaction / photophosphorylation / photolysis occurred ; 2 hydrogen, produced / released ; R H+ 3 DCPIP reduced ; 2 7(b)(ii) one from: to show that any change in colour is, due to chloroplasts / not due to buffer ; to make (the experiment) valid / to act as reference point ; 1 7(b)(iii) two from: 1 swell / burst / lyse / lysis ; 2 higher water potential outside chloroplast ; ora 3 water enters, by osmosis / down water potential gradient ; 2 7(c) carbon dioxide concentration ; not involved in, light dependent reaction / photophosphorylation / photolysis or only involved in light independent reaction / Calvin Cycle / ora ; 2
More questions on Photosynthesis as an energy transfer process
Q8 · Striated muscle is made of many fibres
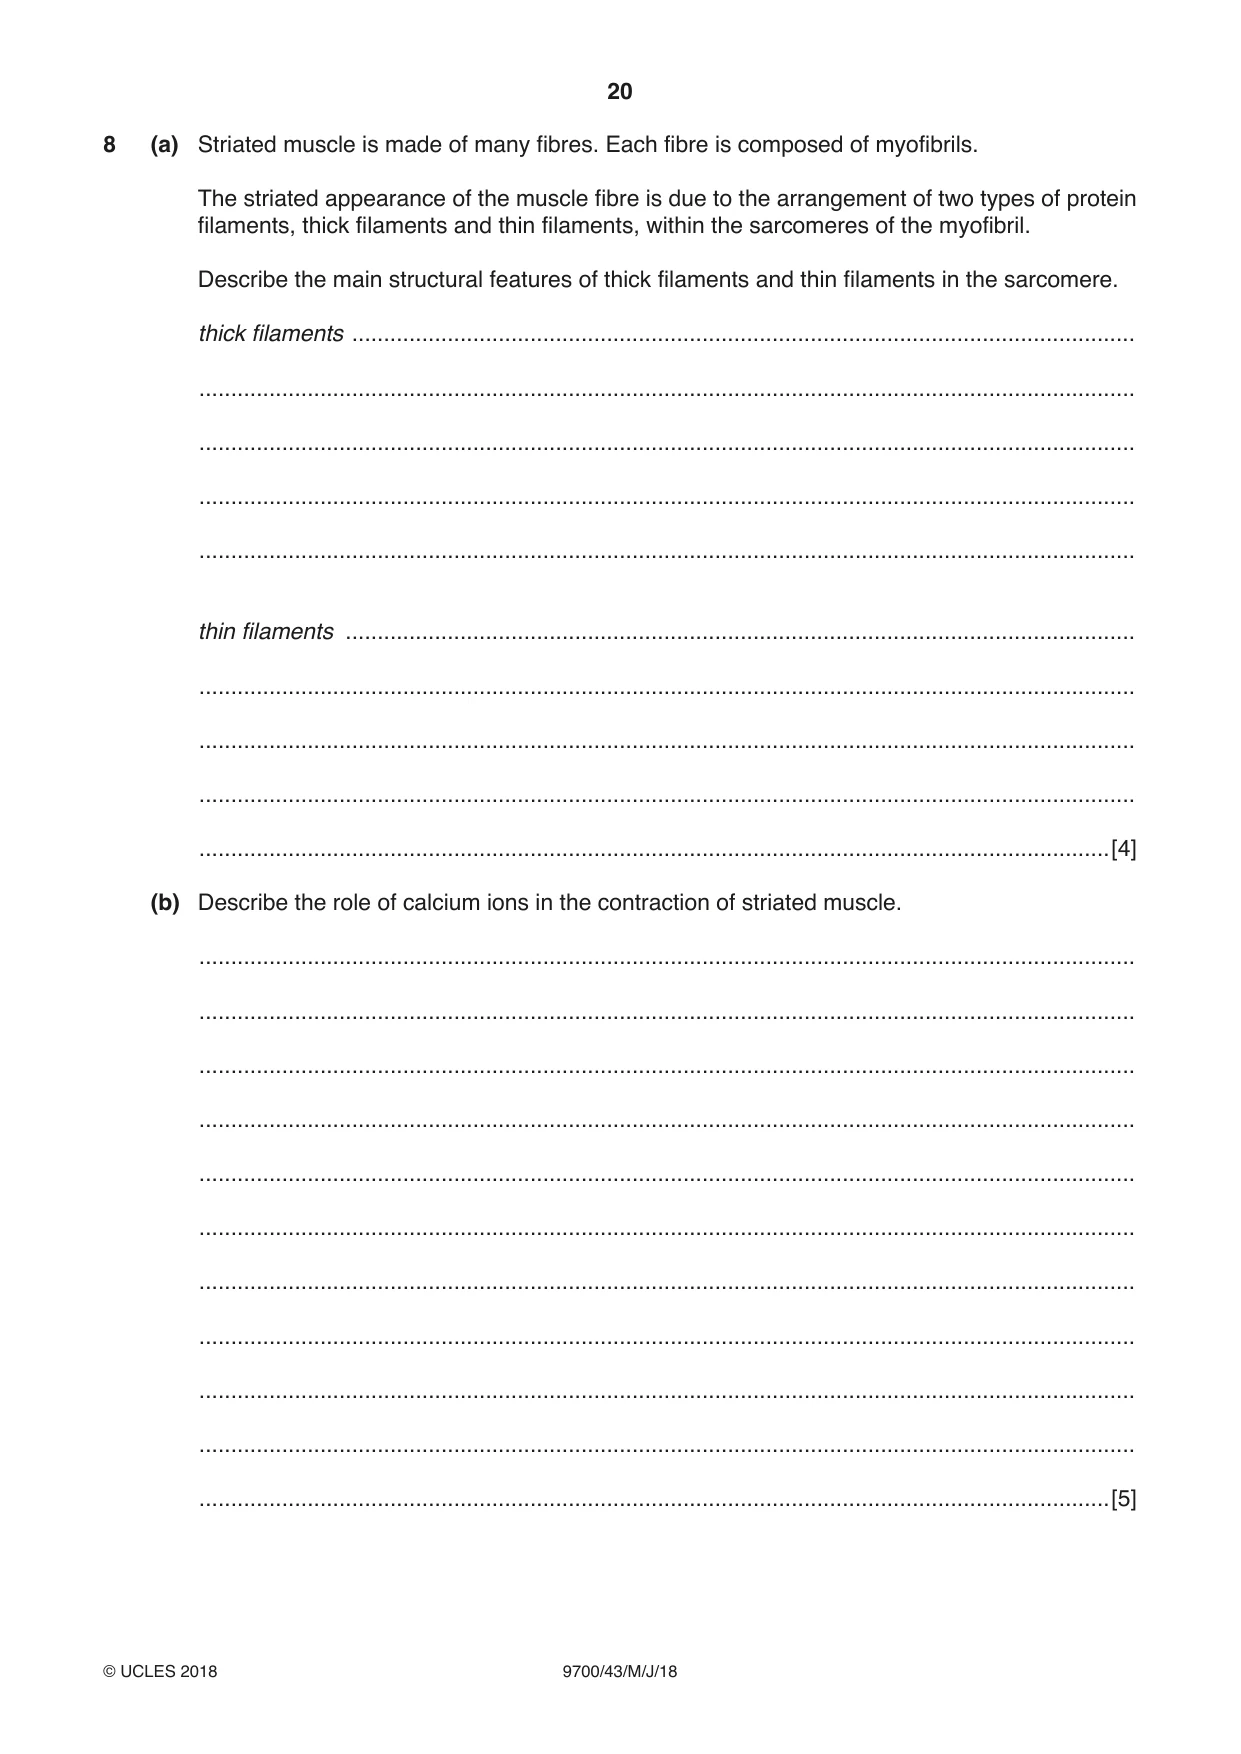
8 (a) Striated muscle is made of many fibres. Each fibre is composed of myofibrils. The striated appearance of the muscle fibre is due to the arrangement of two types of protein filaments, thick filaments and thin filaments, within the sarcomeres of the myofibril. Describe the main structural features of thick filaments and thin filaments in the sarcomere. thick filaments ........................................................................................................................... ................................................................................................................................................... ................................................................................................................................................... ................................................................................................................................................... ................................................................................................................................................... thin filaments ............................................................................................................................ ................................................................................................................................................... ................................................................................................................................................... ................................................................................................................................................... ...............................................................................................................................................[4] (b) Describe the role of calcium ions in the contraction of striated muscle. ................................................................................................................................................... ................................................................................................................................................... ................................................................................................................................................... ................................................................................................................................................... ................................................................................................................................................... ................................................................................................................................................... ................................................................................................................................................... ................................................................................................................................................... ................................................................................................................................................... ................................................................................................................................................... ...............................................................................................................................................[5] (c) Muscle cells sometimes have to carry out respiration in anaerobic conditions. Describe how respiration occurs in anaerobic conditions in a muscle cell and state why it is important that this process occurs. ................................................................................................................................................... ................................................................................................................................................... ................................................................................................................................................... ................................................................................................................................................... ................................................................................................................................................... ................................................................................................................................................... ................................................................................................................................................... ................................................................................................................................................... ...............................................................................................................................................[4] [Total: 13]
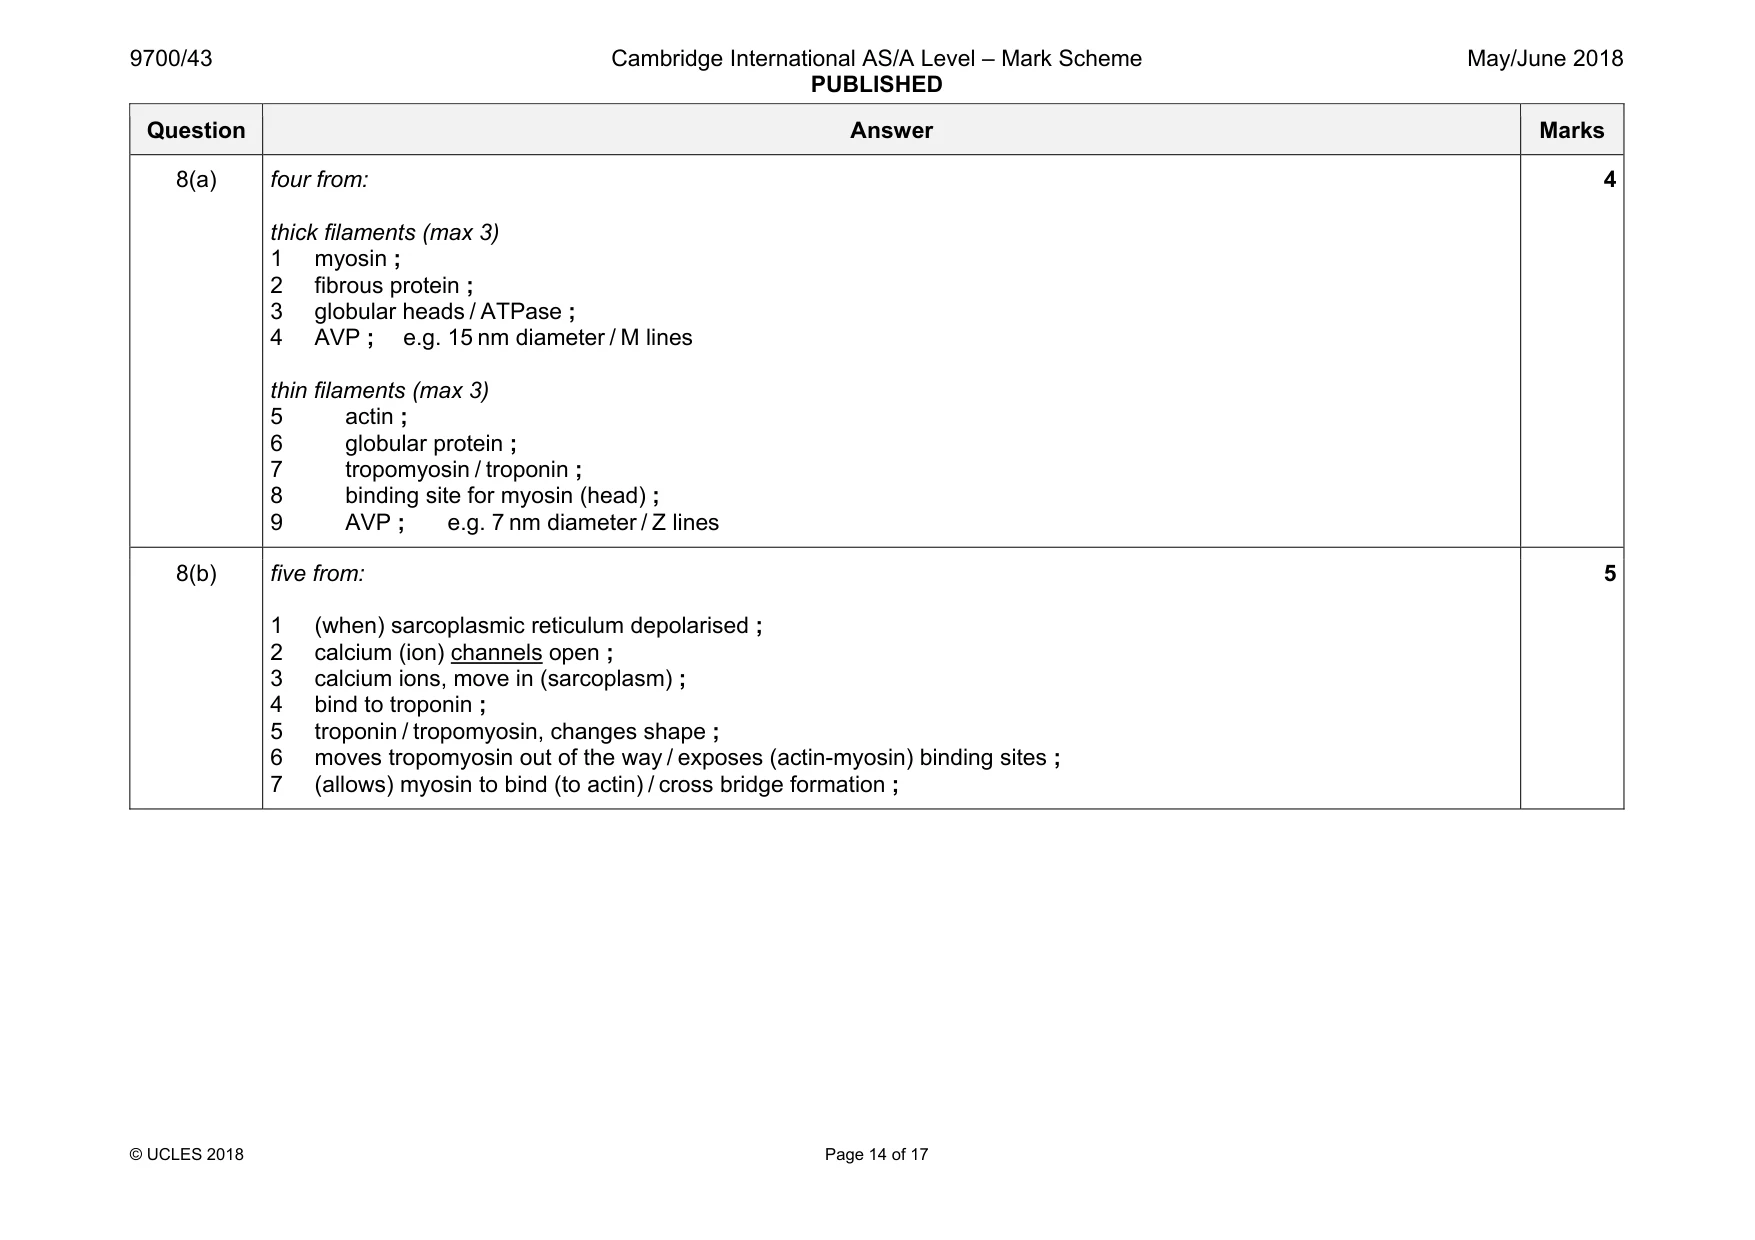
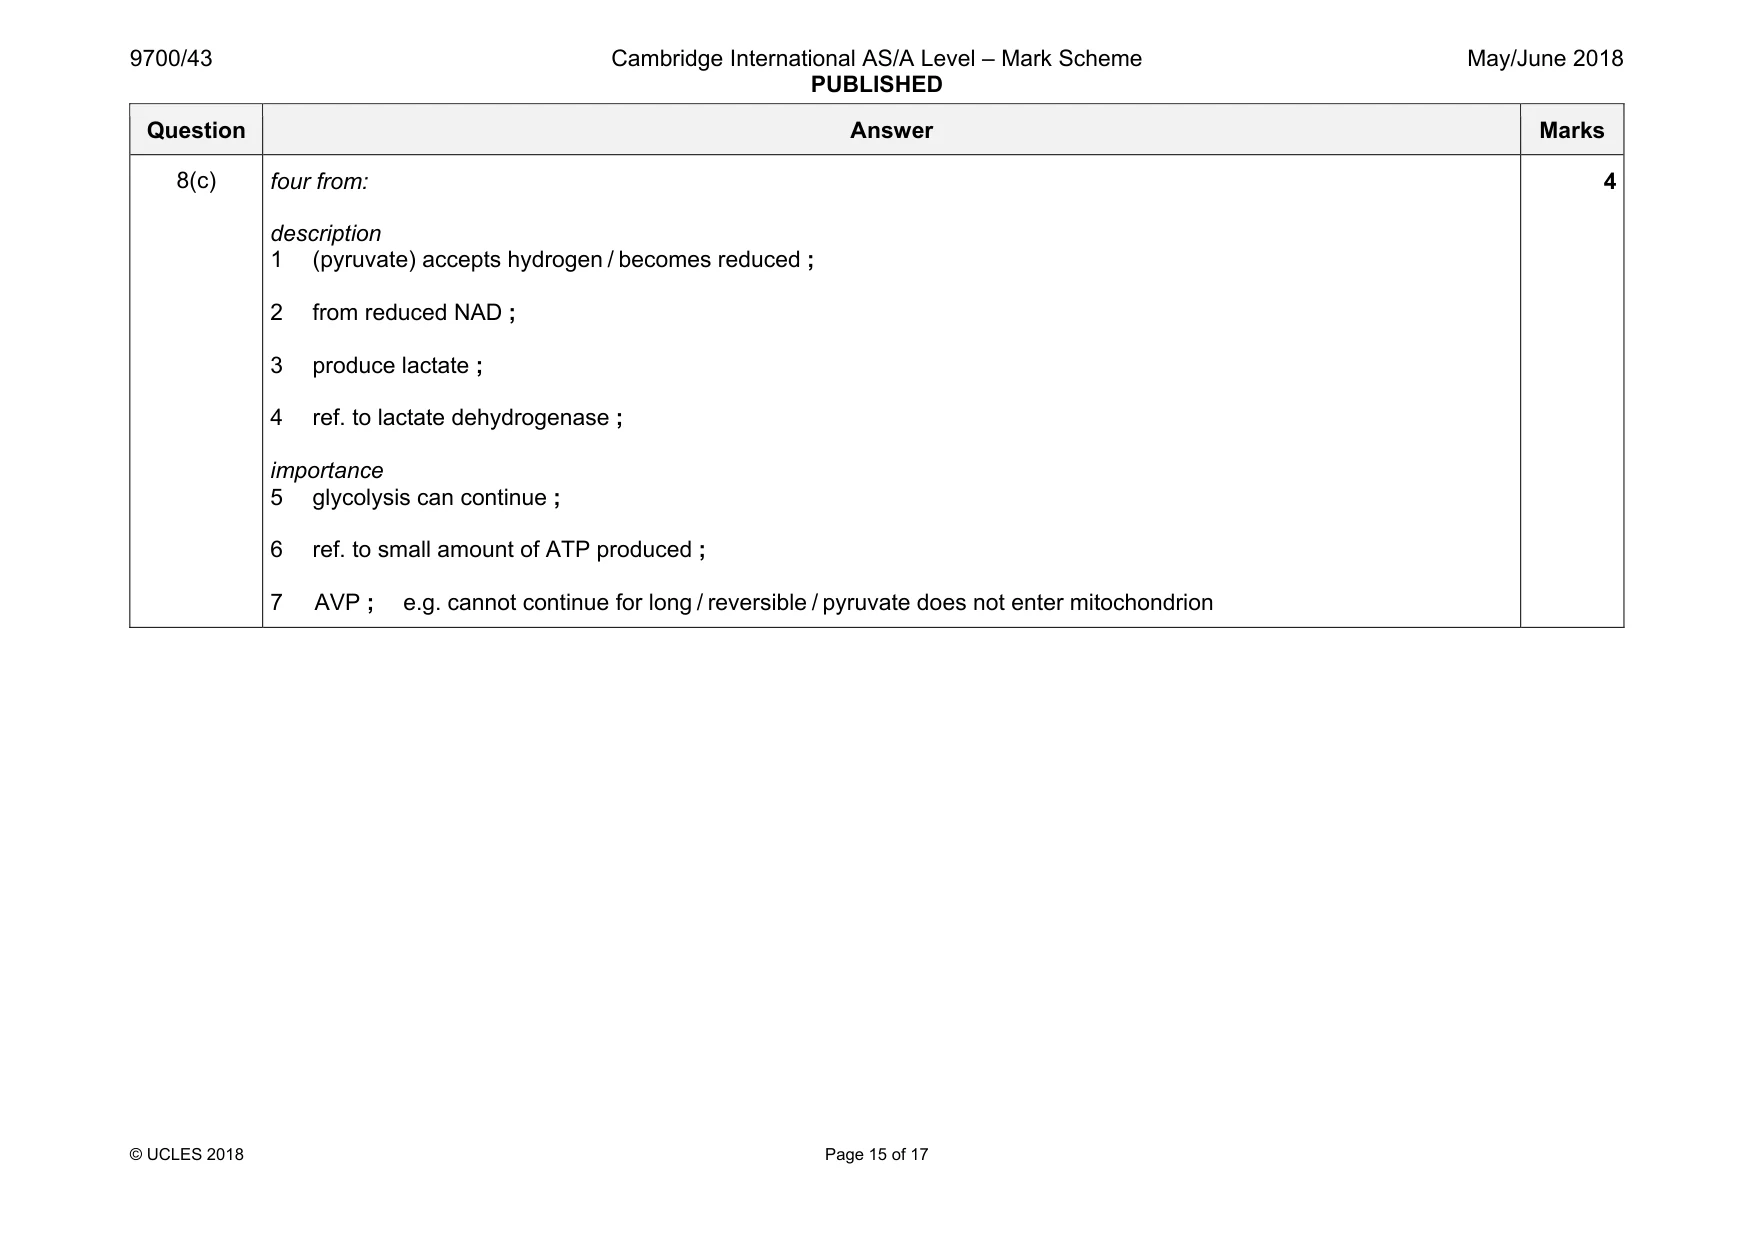
Mark scheme: 8(a) four from: thick filaments (max 3) 1 myosin ; 2 fibrous protein ; 3 globular heads / ATPase ; 4 AVP ; e.g. 15 nm diameter / M lines thin filaments (max 3) 5 actin ; 6 globular protein ; 7 tropomyosin / troponin ; 8 binding site for myosin (head) ; 9 AVP ; e.g. 7 nm diameter / Z lines 4 8(b) five from: 1 (when) sarcoplasmic reticulum depolarised ; 2 calcium (ion) channels open ; 3 calcium ions, move in (sarcoplasm) ; 4 bind to troponin ; 5 troponin / tropomyosin, changes shape ; 6 moves tropomyosin out of the way / exposes (actin-myosin) binding sites ; 7 (allows) myosin to bind (to actin) / cross bridge formation ; 5 Question Answer Marks 8(c) four from: description 1 (pyruvate) accepts hydrogen / becomes reduced ; 2 from reduced NAD ; 3 produce lactate ; 4 ref. to lactate dehydrogenase ; importance 5 glycolysis can continue ; 6 ref. to small amount of ATP produced ; 7 AVP ; e.g. cannot continue for long / reversible / pyruvate does not enter mitochondrion 4
Q9 · Outline the characteristic features of organisms in the domain Eukarya
9 (a) Outline the characteristic features of organisms in the domain Eukarya. [8] (b) Discuss the use of assisted reproduction techniques in the conservation of endangered mammal species. [7] [Total: 15]
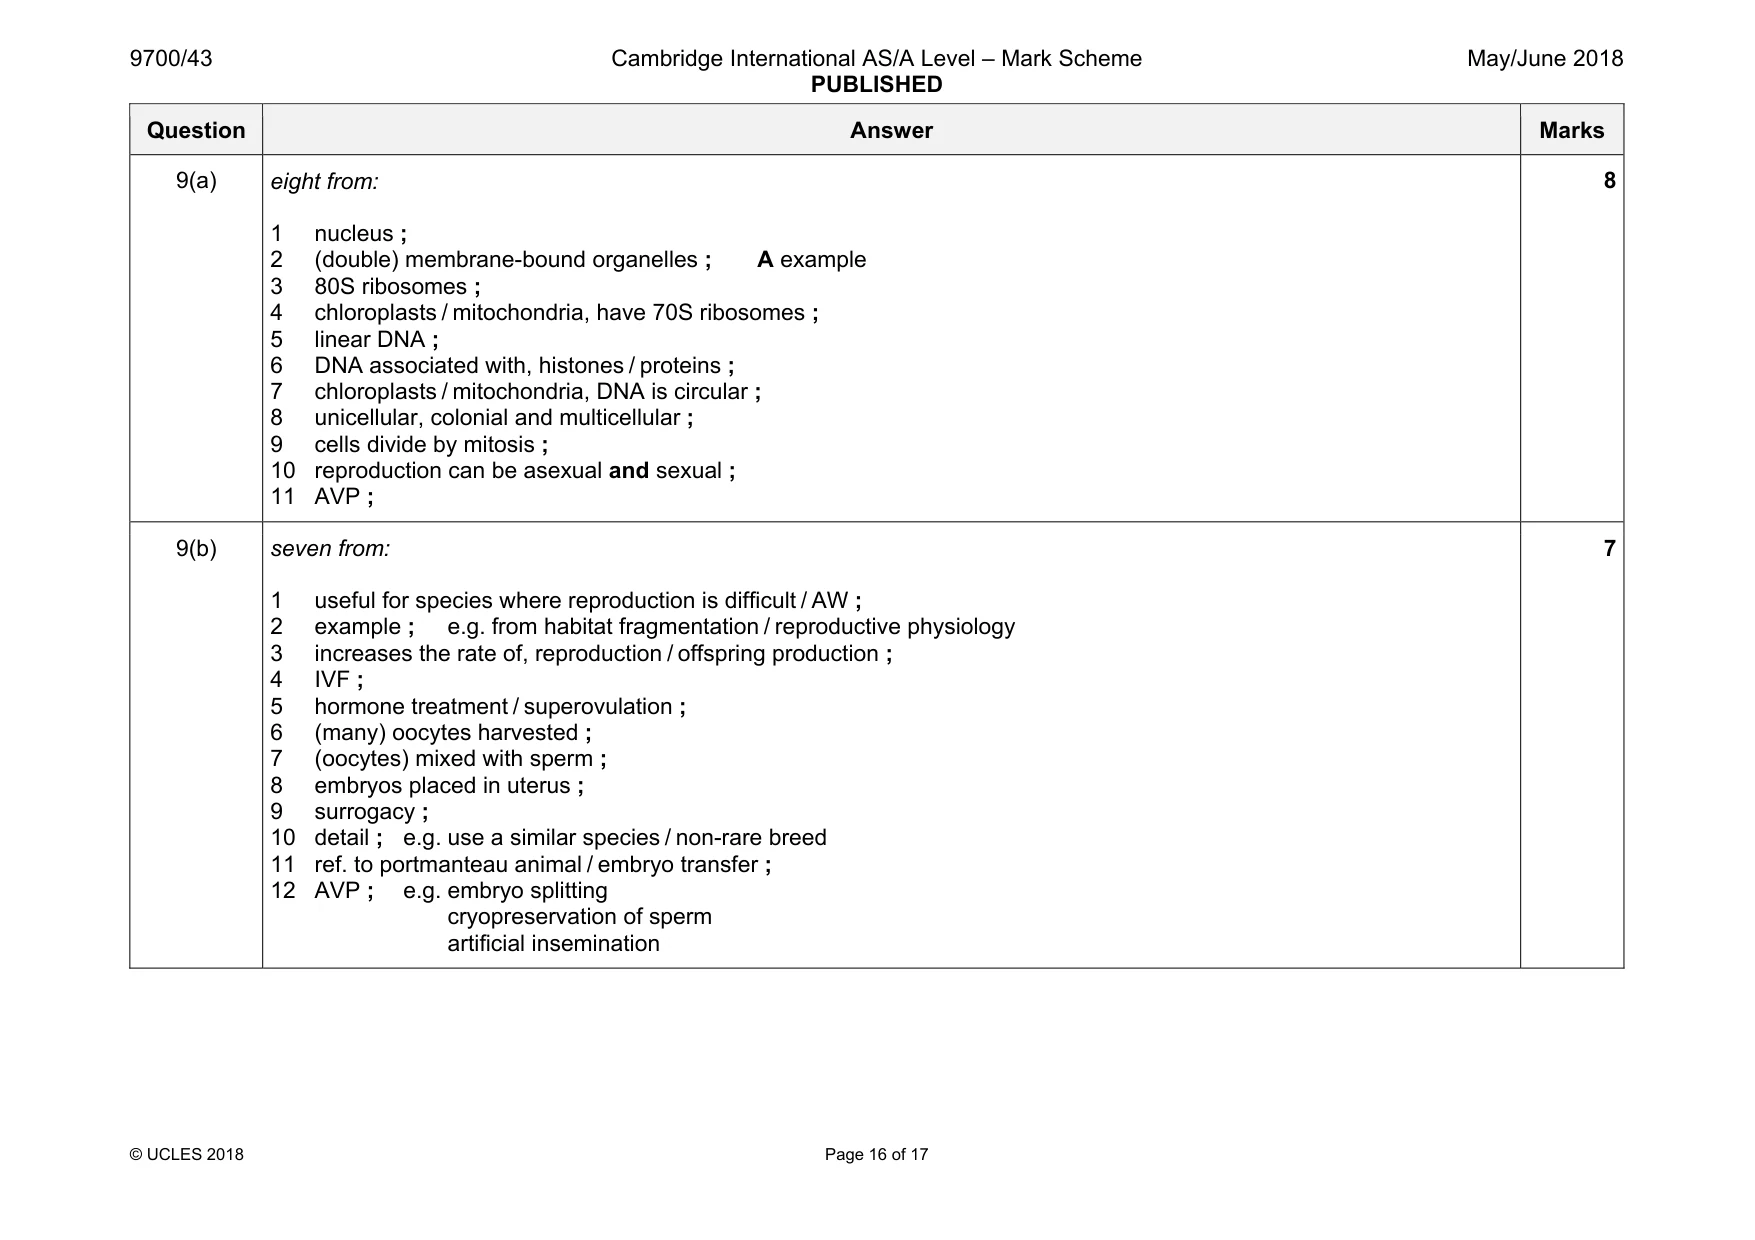
Mark scheme: 9(a) eight from: 1 nucleus ; 2 (double) membrane-bound organelles ; A example 3 80S ribosomes ; 4 chloroplasts / mitochondria, have 70S ribosomes ; 5 linear DNA ; 6 DNA associated with, histones / proteins ; 7 chloroplasts / mitochondria, DNA is circular ; 8 unicellular, colonial and multicellular ; 9 cells divide by mitosis ; 10 reproduction can be asexual and sexual ; 11 AVP ; 8 9(b) seven from: 1 useful for species where reproduction is difficult / AW ; 2 example ; e.g. from habitat fragmentation / reproductive physiology 3 increases the rate of, reproduction / offspring production ; 4 IVF ; 5 hormone treatment / superovulation ; 6 (many) oocytes harvested ; 7 (oocytes) mixed with sperm ; 8 embryos placed in uterus ; 9 surrogacy ; 10 detail ; e.g. use a similar species / non-rare breed 11 ref. to portmanteau animal / embryo transfer ; 12 AVP ; e.g. embryo splitting cryopreservation of sperm artificial insemination 7
Q10 · Describe the effect of a high blood concentration of ADH on the kidney
10 (a) Describe the effect of a high blood concentration of ADH on the kidney. [8] (b) Explain how glucagon brings about a rise in blood glucose concentration. [7] [Total: 15] .................................................................................................................................................................. .................................................................................................................................................................. .................................................................................................................................................................. .................................................................................................................................................................. .................................................................................................................................................................. .................................................................................................................................................................. .................................................................................................................................................................. .................................................................................................................................................................. .................................................................................................................................................................. .................................................................................................................................................................. .................................................................................................................................................................. .................................................................................................................................................................. .................................................................................................................................................................. .................................................................................................................................................................. .................................................................................................................................................................. .................................................................................................................................................................. .................................................................................................................................................................. .................................................................................................................................................................. .................................................................................................................................................................. .................................................................................................................................................................. .................................................................................................................................................................. .................................................................................................................................................................. .................................................................................................................................................................. .................................................................................................................................................................. .................................................................................................................................................................. .................................................................................................................................................................. .................................................................................................................................................................. .................................................................................................................................................................. .................................................................................................................................................................. .................................................................................................................................................................. .................................................................................................................................................................. .................................................................................................................................................................. .................................................................................................................................................................. .................................................................................................................................................................. .................................................................................................................................................................. .................................................................................................................................................................. .................................................................................................................................................................. .................................................................................................................................................................. .................................................................................................................................................................. .................................................................................................................................................................. .................................................................................................................................................................. .................................................................................................................................................................. .................................................................................................................................................................. .................................................................................................................................................................. .................................................................................................................................................................. .................................................................................................................................................................. .................................................................................................................................................................. .................................................................................................................................................................. .................................................................................................................................................................. .................................................................................................................................................................. .................................................................................................................................................................. .................................................................................................................................................................. .................................................................................................................................................................. .................................................................................................................................................................. .................................................................................................................................................................. .................................................................................................................................................................. .................................................................................................................................................................. .................................................................................................................................................................. .................................................................................................................................................................. .................................................................................................................................................................. .................................................................................................................................................................. .................................................................................................................................................................. .................................................................................................................................................................. .................................................................................................................................................................. .................................................................................................................................................................. .................................................................................................................................................................. .................................................................................................................................................................. .................................................................................................................................................................. .................................................................................................................................................................. ..................................................................................................................................................................
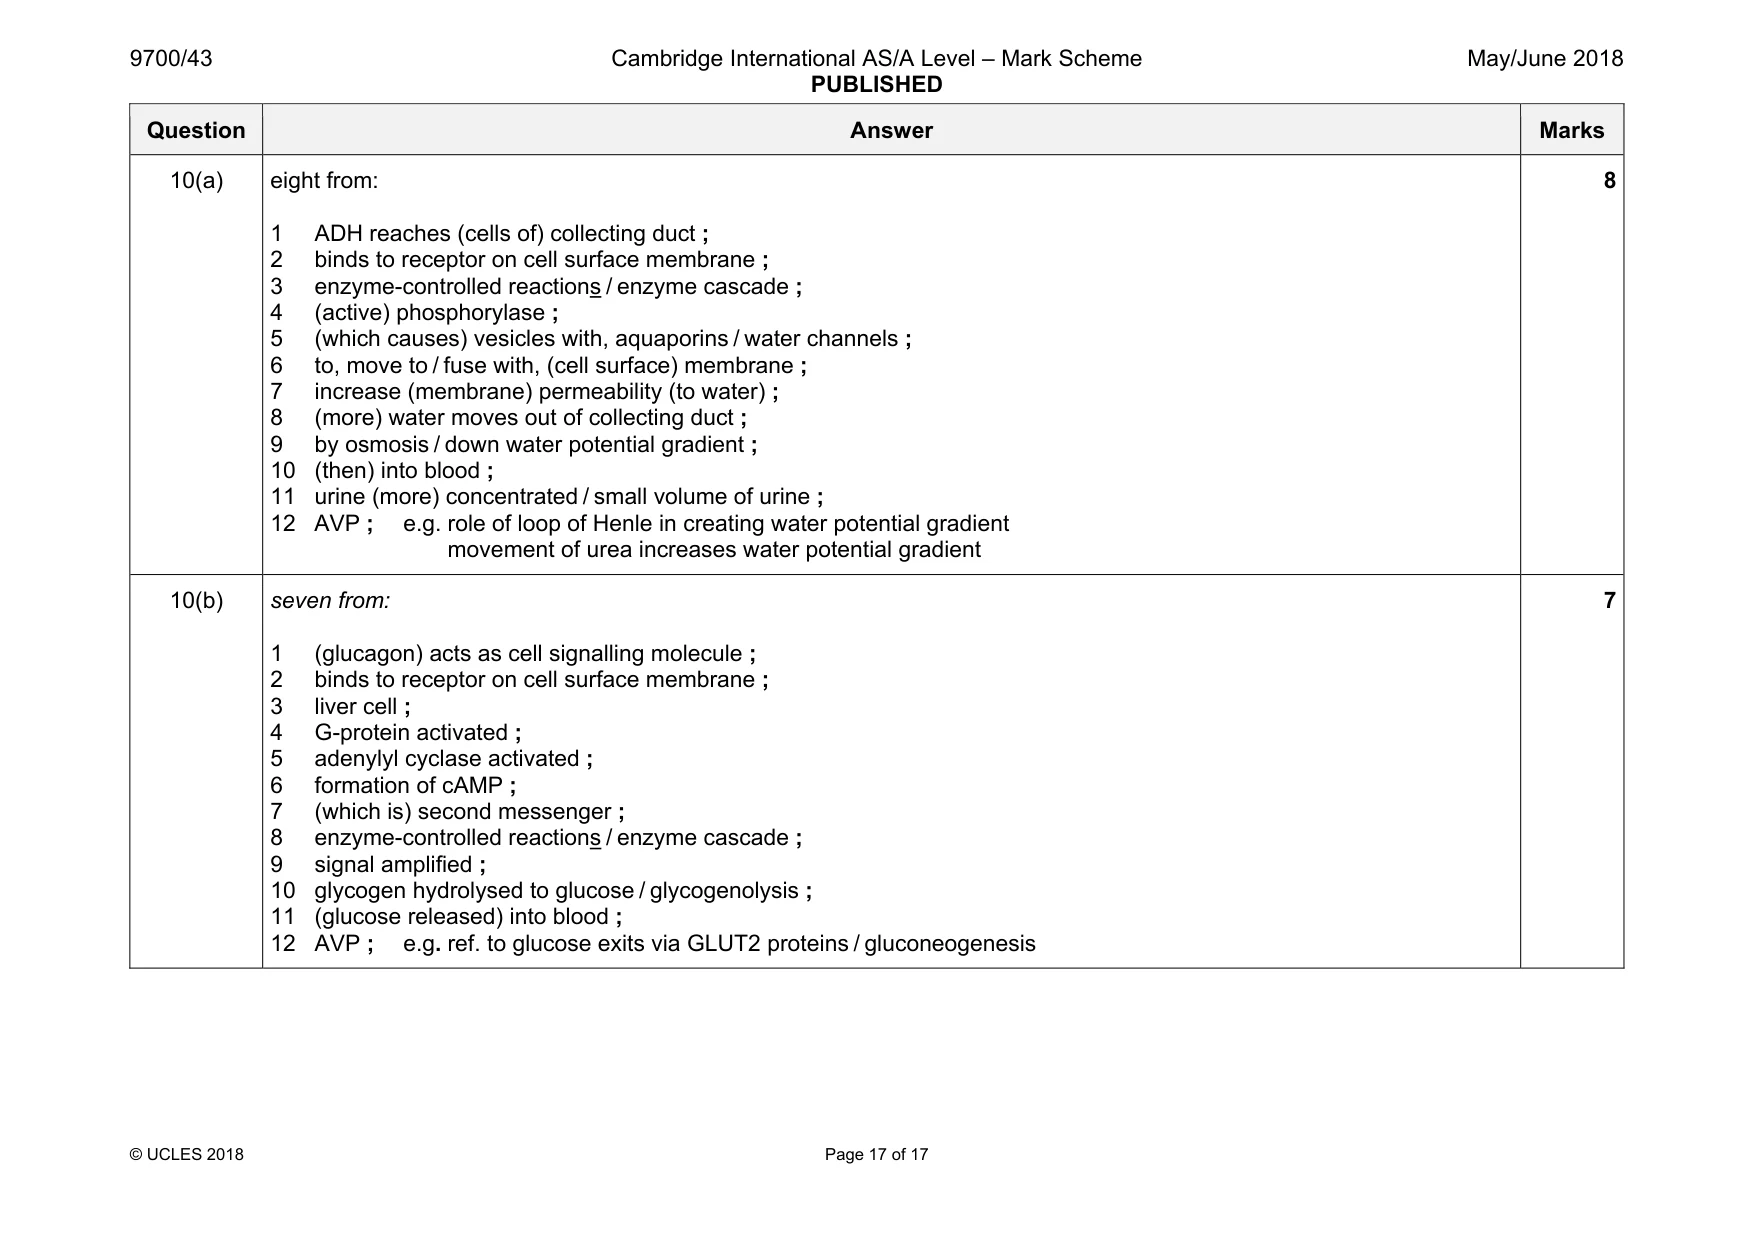
Mark scheme: 10(a) eight from: 1 ADH reaches (cells of) collecting duct ; 2 binds to receptor on cell surface membrane ; 3 enzyme-controlled reactions / enzyme cascade ; 4 (active) phosphorylase ; 5 (which causes) vesicles with, aquaporins / water channels ; 6 to, move to / fuse with, (cell surface) membrane ; 7 increase (membrane) permeability (to water) ; 8 (more) water moves out of collecting duct ; 9 by osmosis / down water potential gradient ; 10 (then) into blood ; 11 urine (more) concentrated / small volume of urine ; 12 AVP ; e.g. role of loop of Henle in creating water potential gradient movement of urea increases water potential gradient 8 10(b) seven from: 1 (glucagon) acts as cell signalling molecule ; 2 binds to receptor on cell surface membrane ; 3 liver cell ; 4 G-protein activated ; 5 adenylyl cyclase activated ; 6 formation of cAMP ; 7 (which is) second messenger ; 8 enzyme-controlled reactions / enzyme cascade ; 9 signal amplified ; 10 glycogen hydrolysed to glucose / glycogenolysis ; 11 (glucose released) into blood ; 12 AVP ; e.g. ref. to glucose exits via GLUT2 proteins / gluconeogenesis 7
What was in this paper
The subtopics covered by these 10 questions, and how many questions each got. Open one in a new tab to see every Cambridge question on it.
What you needed in this session
Cambridge’s own grade thresholds for 2018 May/June, Paper 4 · Variant 3. A higher threshold means an easier paper — the bar moves with how the cohort did.