Cambridge A Level Biology 9700 — 2016 Oct/Nov Paper 5 · Variant 3
9700/53/O/N/16 · 30 marks · ≈34 min
The question paper and its mark scheme, free to read here and free to download. This is Cambridge’s own paper, exactly as it was sat.
Question paper12 pages


Mark scheme10 pages
Answers below. Sit the paper first if you are practising.
Paper as text
Question paper, page 1
This document consists of 9 printed pages and 3 blank pages. DC (LK/SW) 109115/3 © UCLES 2016 [Turn over Cambridge International Examinations Cambridge International Advanced Subsidiary and Advanced Level * 5 8 3 9 1 2 1 3 9 3 * BIOLOGY 9700/53 Paper 5 Planning, Analysis and Evaluation October/November 2016 1 hour 15 minutes Candidates answer on the Question Paper. No Additional Materials are required. READ THESE INSTRUCTIONS FIRST Write your Centre number, candidate number and name on all the work you hand in. Write in dark blue or black pen. You may use an HB pencil for any diagrams or graphs. Do not use staples, paper clips, glue or correction fluid. DO NOT WRITE IN ANY BARCODES. Answer all questions. Electronic calculators may be used. You may lose marks if you do not show your working or if you do not use appropriate units. At the end of the examination, fasten all your work securely together. The number of marks is given in brackets [ ] at the end of each question or part question.
Question paper, page 2
2 9700/53/O/N/16 © UCLES 2016 1 (a) The opening and closing of stomata involves the movement of potassium ions into and out of guard cells in response to environmental factors, for example light and water stress. This movement of potassium ions is influenced by the concentration of calcium ions in the cytoplasm of guard cells. When plants are water stressed, abscisic acid (ABA) release causes the concentration of calcium ions in the cytoplasm to increase. The increase in calcium ions causes a series of changes resulting in the loss of potassium ions, so the stomata close in light. A student investigated the effect of calcium chloride in overcoming the effect of light on stomata. The student was provided with: • 500 cm3 of 1.0 mmol dm–3 buffered calcium chloride (CaCl2) solution • freshly picked leaves from a plant that had been kept in light for 2 hours so that all the stomata were open. The student soaked three epidermal strips of leaves in each of a range of calcium chloride solutions for 3 hours and recorded the number of closed stomata. An epidermal strip is made by peeling the epidermis from a leaf as a single layer. (i) Identify the independent and dependent variables in this investigation. independent variable … … dependent variable … …[2] (ii) The student used the 1.0 mmol dm–3 CaCl2 solution provided to prepare 50 cm3 of four other concentrations by reducing the concentration by half each time. State the method that the student used to make these four concentrations. … … …[1] (b) (i) Suggest a hypothesis that the student could test about the effect of CaCl2 on the opening and closing of stomata. … … …[1]
Question paper, page 3
3 9700/53/O/N/16 © UCLES 2016 [Turn over (ii) Describe a method the student could use to investigate the effect of different concentrations of CaCl2 solution on the closing of stomata. Your method should be detailed enough for another person to follow and should not include the details of how to dilute the 1.0 mmol dm–3 solution of CaCl2. … … … … … … … … … … … … … … … … … … … … … … … … …[5]
Question paper, page 4
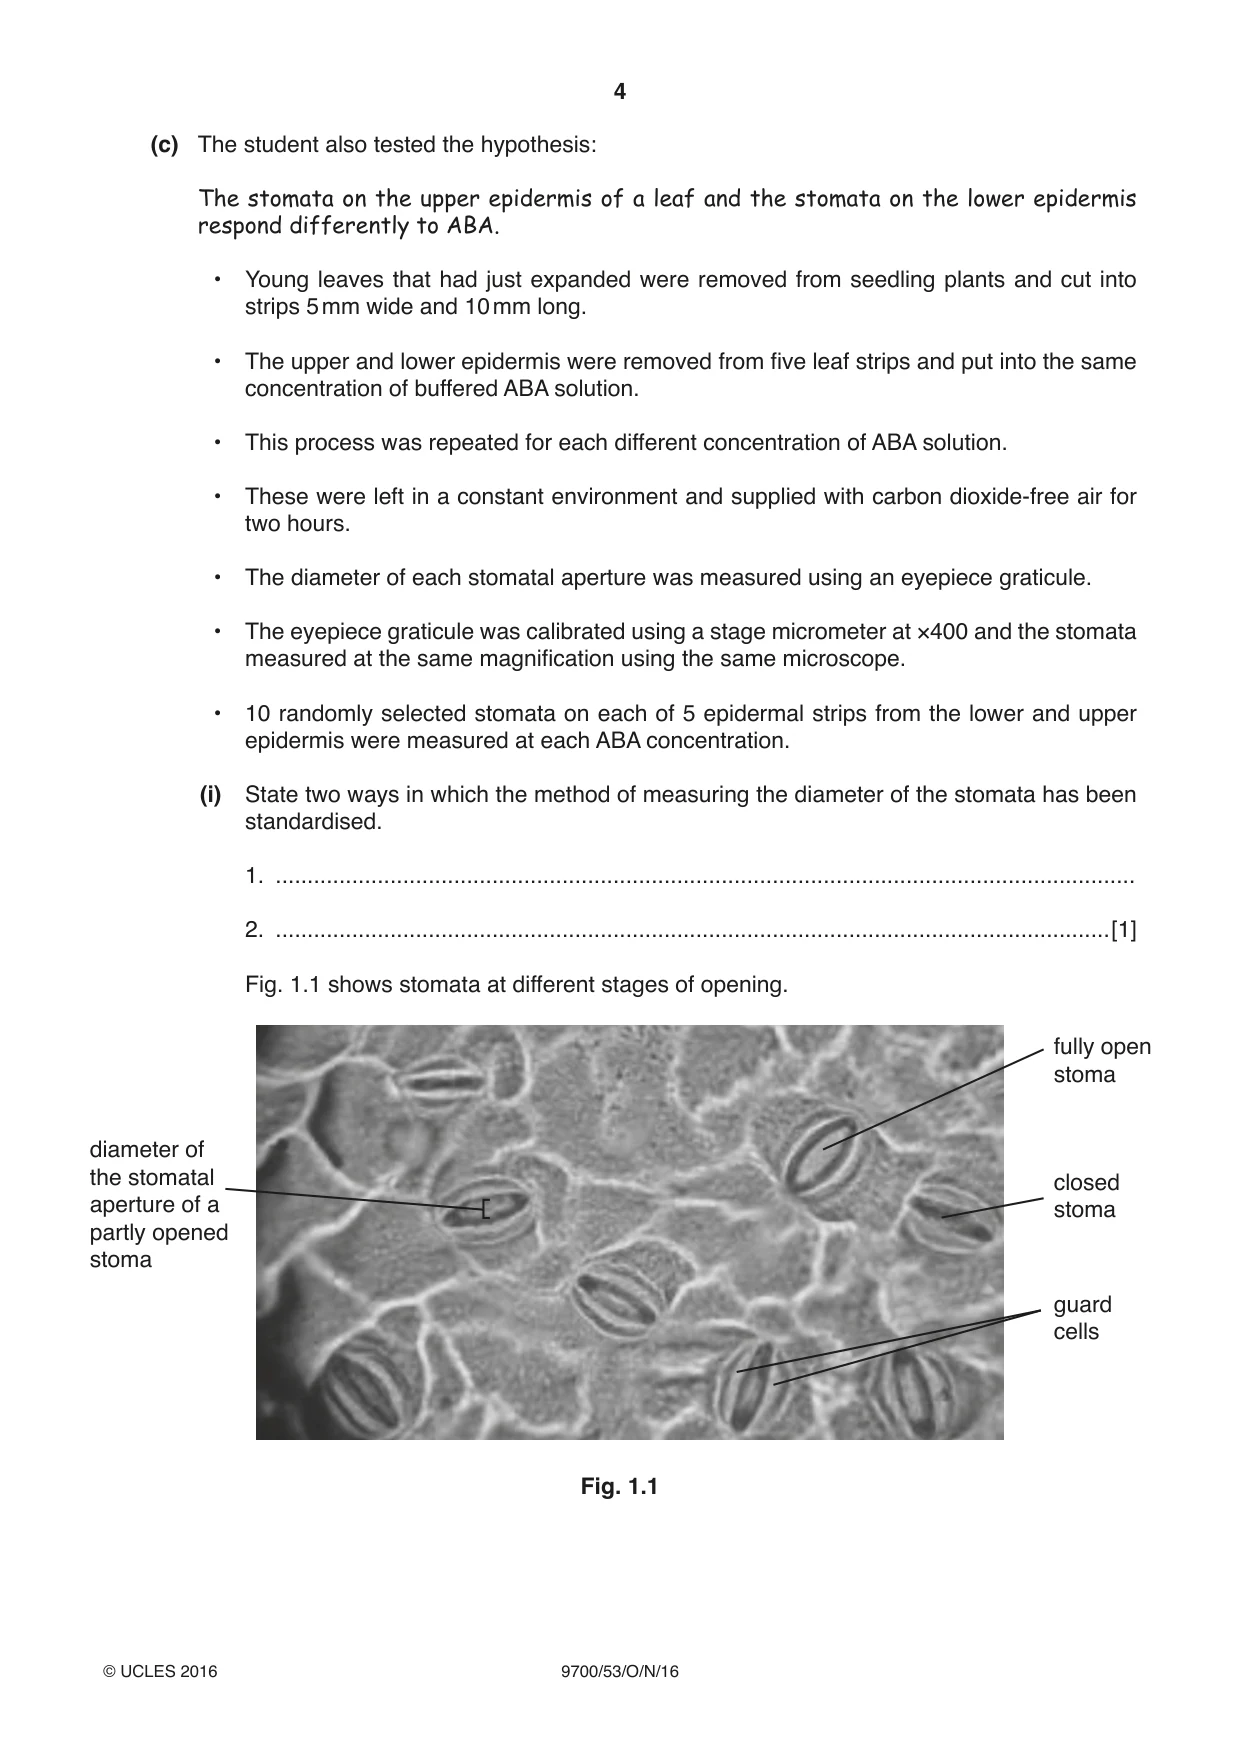
4 9700/53/O/N/16 © UCLES 2016 (c) The student also tested the hypothesis: The stomata on the upper epidermis of a leaf and the stomata on the lower epidermis respond differently to ABA. • Young leaves that had just expanded were removed from seedling plants and cut into strips 5 mm wide and 10 mm long. • The upper and lower epidermis were removed from five leaf strips and put into the same concentration of buffered ABA solution. • This process was repeated for each different concentration of ABA solution. • These were left in a constant environment and supplied with carbon dioxide-free air for two hours. • The diameter of each stomatal aperture was measured using an eyepiece graticule. • The eyepiece graticule was calibrated using a stage micrometer at ×400 and the stomata measured at the same magnification using the same microscope. • 10 randomly selected stomata on each of 5 epidermal strips from the lower and upper epidermis were measured at each ABA concentration. (i) State two ways in which the method of measuring the diameter of the stomata has been standardised. 1. … 2. …[1] Fig. 1.1 shows stomata at different stages of opening. diameter of the stomatal aperture of a partly opened stoma fully open stoma closed stoma guard cells Fig. 1.1
Question paper, page 5
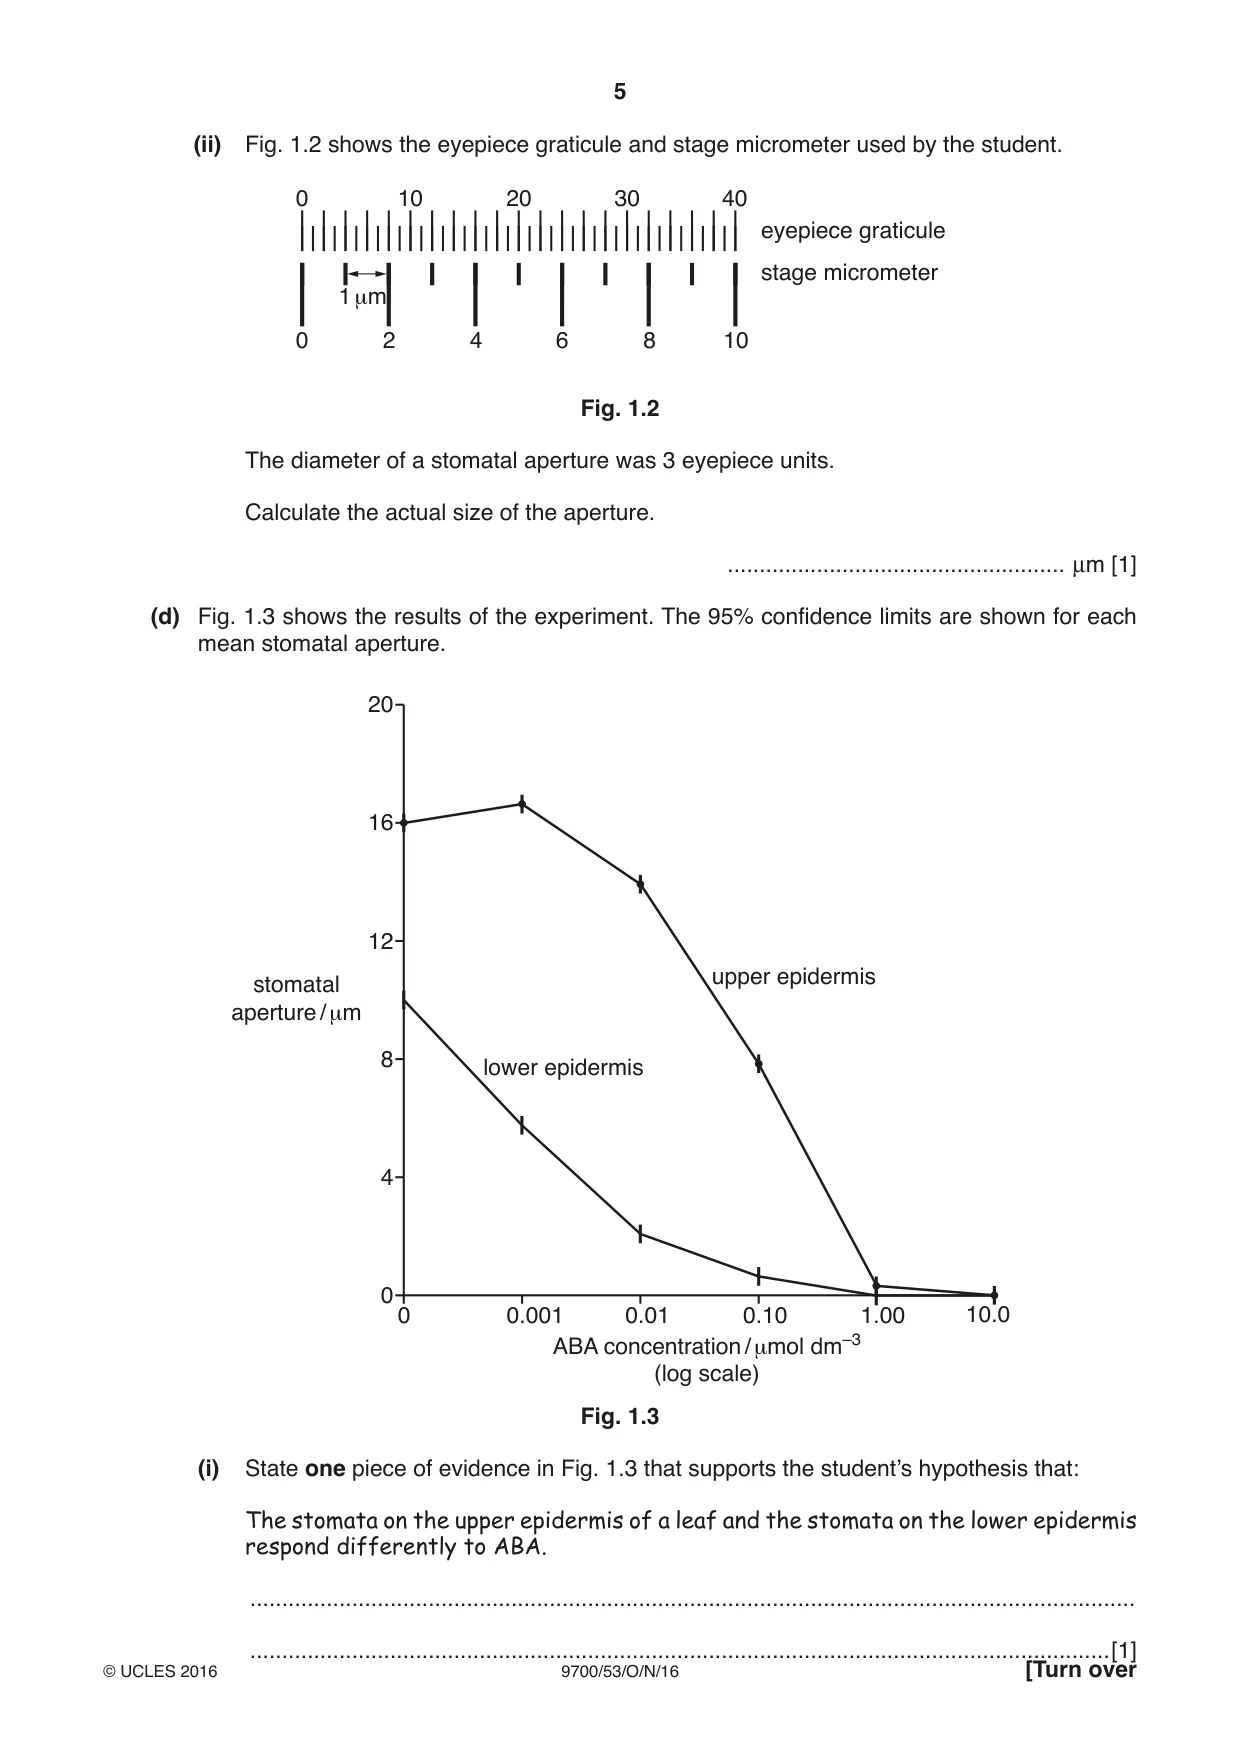
5 9700/53/O/N/16 © UCLES 2016 [Turn over (ii) Fig. 1.2 shows the eyepiece graticule and stage micrometer used by the student. 0 0 2 4 6 8 10 eyepiece graticule stage micrometer 10 20 30 40 1 μm Fig. 1.2 The diameter of a stomatal aperture was 3 eyepiece units. Calculate the actual size of the aperture. … µm [1] (d) Fig. 1.3 shows the results of the experiment. The 95% confidence limits are shown for each mean stomatal aperture. 0 0 0.001 0.01 0.10 ABA concentration / μmol dm–3 (log scale) stomatal aperture / μm 1.00 10.0 4 8 12 16 20 lower epidermis upper epidermis Fig. 1.3 (i) State one piece of evidence in Fig. 1.3 that supports the student’s hypothesis that: The stomata on the upper epidermis of a leaf and the stomata on the lower epidermis respond differently to ABA. … …[1]
Question paper, page 6
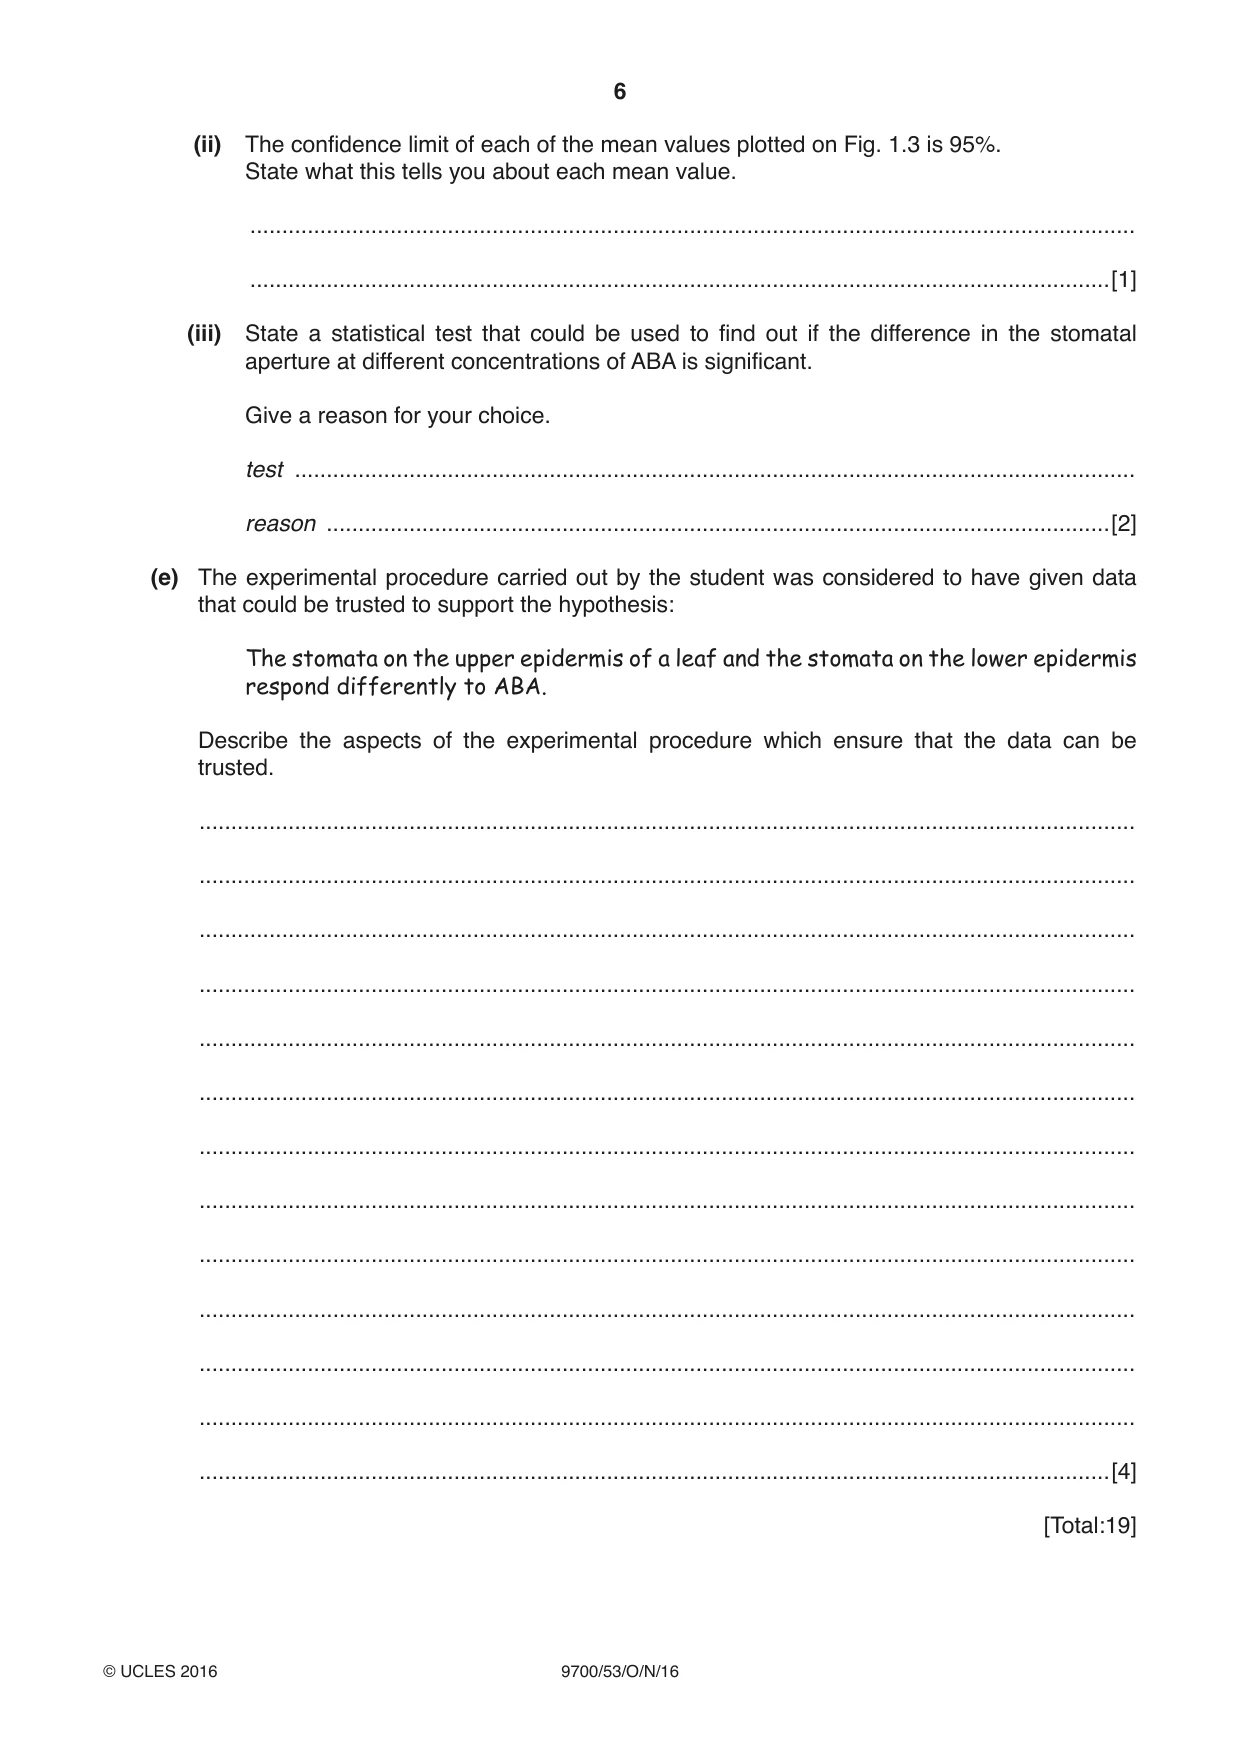
6 9700/53/O/N/16 © UCLES 2016 (ii) The confidence limit of each of the mean values plotted on Fig. 1.3 is 95%. State what this tells you about each mean value. … …[1] (iii) State a statistical test that could be used to find out if the difference in the stomatal aperture at different concentrations of ABA is significant. Give a reason for your choice. test … reason …[2] (e) The experimental procedure carried out by the student was considered to have given data that could be trusted to support the hypothesis: The stomata on the upper epidermis of a leaf and the stomata on the lower epidermis respond differently to ABA. Describe the aspects of the experimental procedure which ensure that the data can be trusted. … … … … … … … … … … … … …[4] [Total:19]
Question paper, page 7
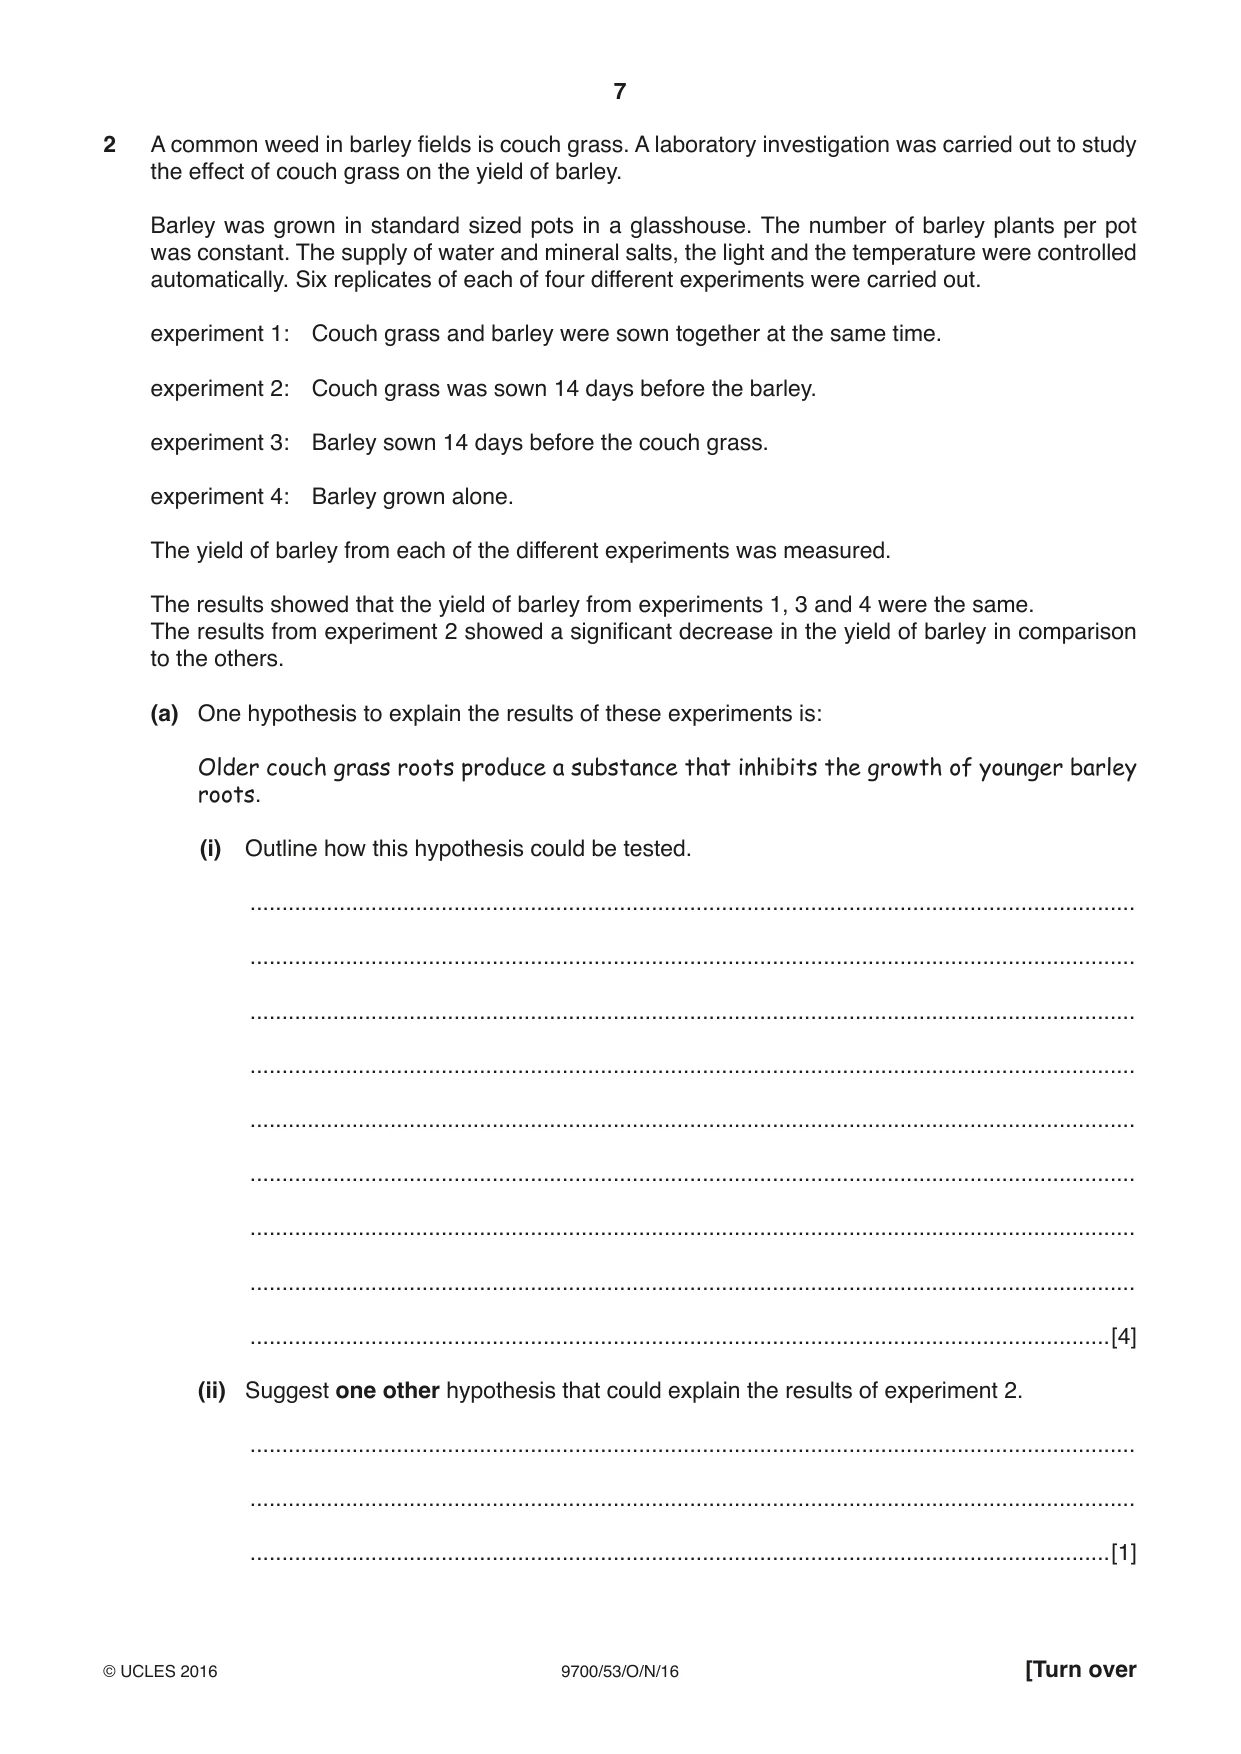
7 9700/53/O/N/16 © UCLES 2016 [Turn over 2 A common weed in barley fields is couch grass. A laboratory investigation was carried out to study the effect of couch grass on the yield of barley. Barley was grown in standard sized pots in a glasshouse. The number of barley plants per pot was constant. The supply of water and mineral salts, the light and the temperature were controlled automatically. Six replicates of each of four different experiments were carried out. experiment 1: Couch grass and barley were sown together at the same time. experiment 2: Couch grass was sown 14 days before the barley. experiment 3: Barley sown 14 days before the couch grass. experiment 4: Barley grown alone. The yield of barley from each of the different experiments was measured. The results showed that the yield of barley from experiments 1, 3 and 4 were the same. The results from experiment 2 showed a significant decrease in the yield of barley in comparison to the others. (a) One hypothesis to explain the results of these experiments is: Older couch grass roots produce a substance that inhibits the growth of younger barley roots. (i) Outline how this hypothesis could be tested. … … … … … … … … …[4] (ii) Suggest one other hypothesis that could explain the results of experiment 2. … … …[1]
Question paper, page 8
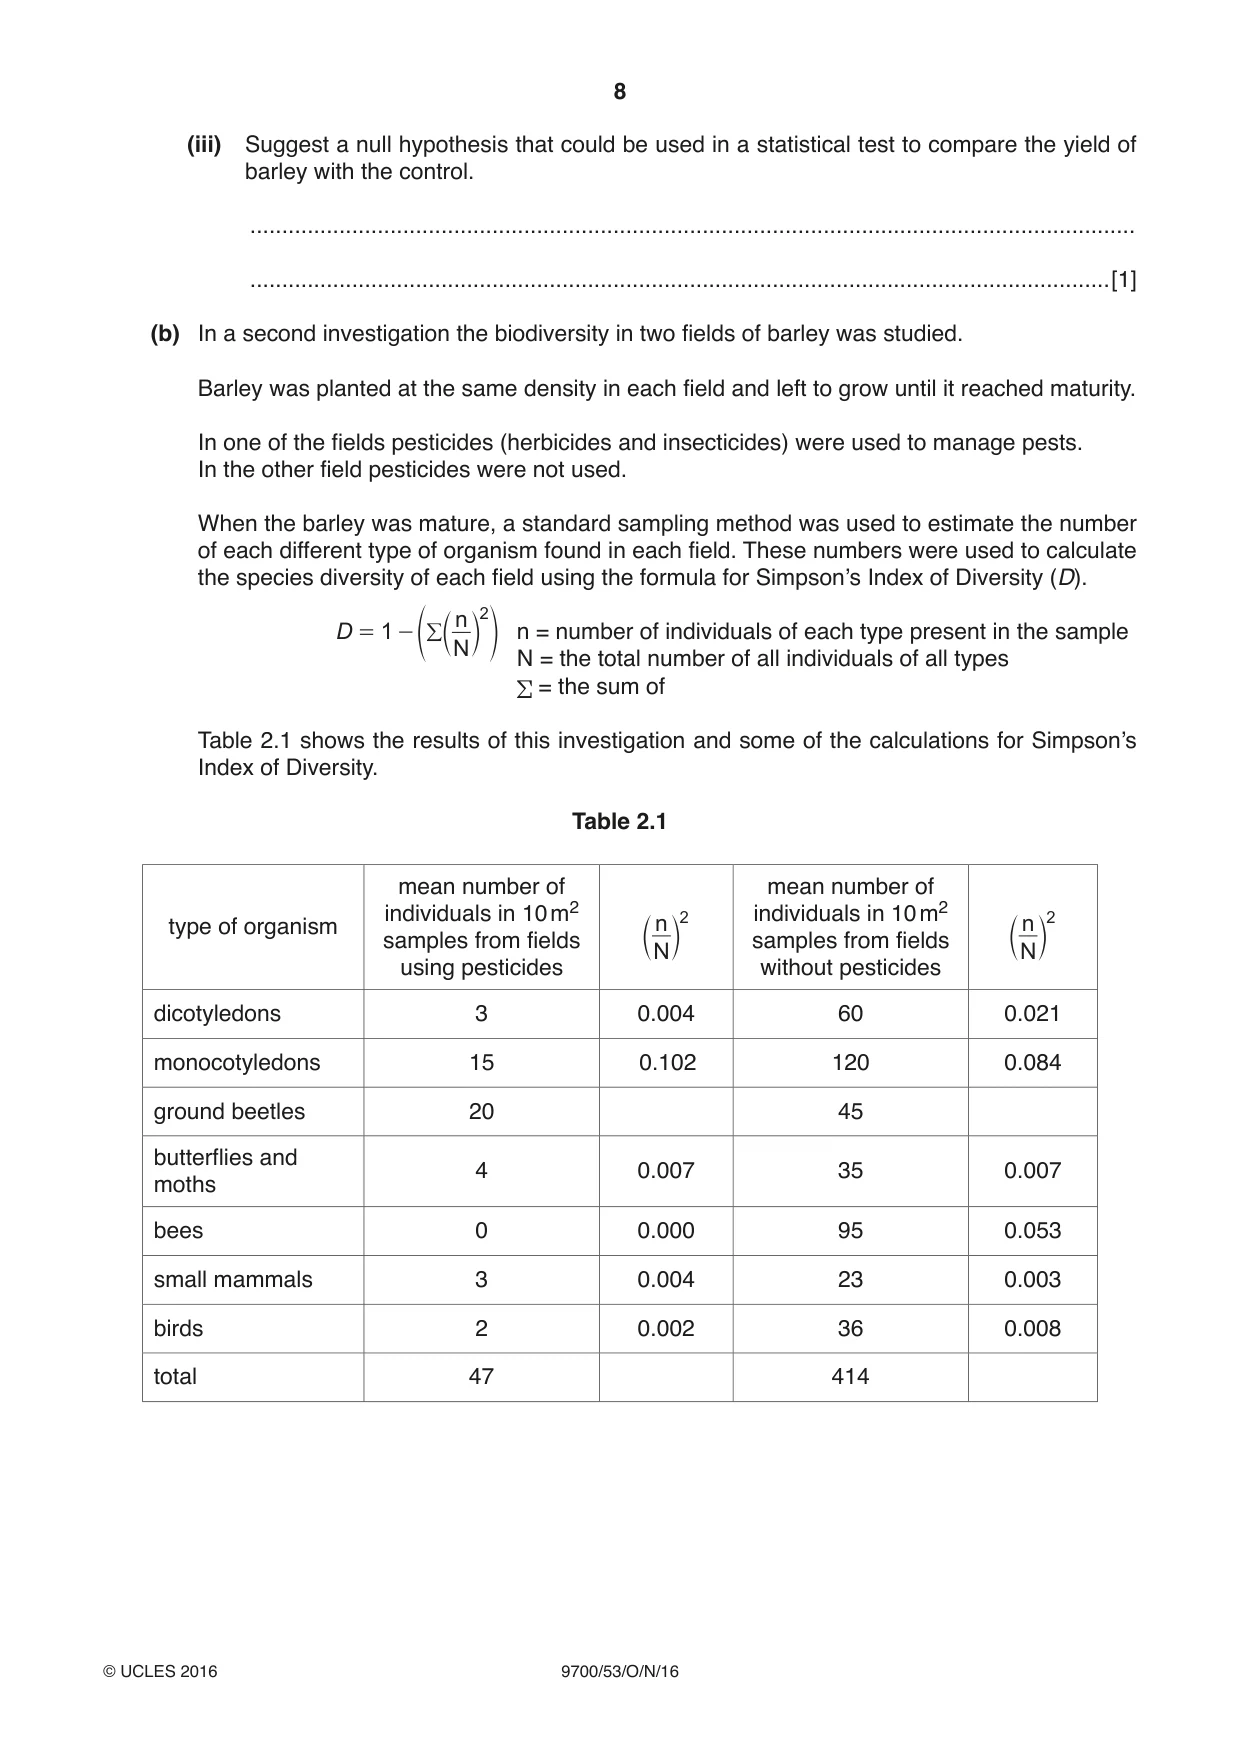
8 9700/53/O/N/16 © UCLES 2016 (iii) Suggest a null hypothesis that could be used in a statistical test to compare the yield of barley with the control. … …[1] (b) In a second investigation the biodiversity in two fields of barley was studied. Barley was planted at the same density in each field and left to grow until it reached maturity. In one of the fields pesticides (herbicides and insecticides) were used to manage pests. In the other field pesticides were not used. When the barley was mature, a standard sampling method was used to estimate the number of each different type of organism found in each field. These numbers were used to calculate the species diversity of each field using the formula for Simpson’s Index of Diversity (D). N n D 1 2 = - c e m o / n = number of individuals of each type present in the sample N = the total number of all individuals of all types ! = the sum of Table 2.1 shows the results of this investigation and some of the calculations for Simpson’s Index of Diversity. Table 2.1 type of organism mean number of individuals in 10 m2 samples from fields using pesticides N n 2 c m mean number of individuals in 10 m2 samples from fields without pesticides N n 2 c m dicotyledons 3 0.004 60 0.021 monocotyledons 15 0.102 120 0.084 ground beetles 20 45 butterflies and moths 4 0.007 35 0.007 bees 0 0.000 95 0.053 small mammals 3 0.004 23 0.003 birds 2 0.002 36 0.008 total 47 414
Question paper, page 9
9 9700/53/O/N/16 © UCLES 2016 (i) Complete Table 2.1 and use the data to calculate D for both fields of barley. In fields using pesticides D = … In fields without pesticides D = …[3] (ii) State what the results of this investigation show about the effect of pesticides on the plants and animals studied. … … … … …[2] [Total:11]
Question paper, page 10
10 9700/53/O/N/16 © UCLES 2016 BLANK PAGE
Question paper, page 11
11 9700/53/O/N/16 © UCLES 2016 BLANK PAGE
Question paper, page 12
12 9700/53/O/N/16 © UCLES 2016 BLANK PAGE Permission to reproduce items where third-party owned material protected by copyright is included has been sought and cleared where possible. Every reasonable effort has been made by the publisher (UCLES) to trace copyright holders, but if any items requiring clearance have unwittingly been included, the publisher will be pleased to make amends at the earliest possible opportunity. To avoid the issue of disclosure of answer-related information to candidates, all copyright acknowledgements are reproduced online in the Cambridge International Examinations Copyright Acknowledgements Booklet. This is produced for each series of examinations and is freely available to download at www.cie.org.uk after the live examination series. Cambridge International Examinations is part of the Cambridge Assessment Group. Cambridge Assessment is the brand name of University of Cambridge Local Examinations Syndicate (UCLES), which is itself a department of the University of Cambridge.
Mark scheme, page 1
® IGCSE is the registered trademark of Cambridge International Examinations. This document consists of 10 printed pages. © UCLES 2016 [Turn over Cambridge International Examinations Cambridge International Advanced Subsidiary and Advanced Level BIOLOGY 9700/53 Paper 5 Planning, Analysis and Evaluation October/November 2016 MARK SCHEME Maximum Mark: 30 Published This mark scheme is published as an aid to teachers and candidates, to indicate the requirements of the examination. It shows the basis on which Examiners were instructed to award marks. It does not indicate the details of the discussions that took place at an Examiners’ meeting before marking began, which would have considered the acceptability of alternative answers. Mark schemes should be read in conjunction with the question paper and the Principal Examiner Report for Teachers. Cambridge will not enter into discussions about these mark schemes. Cambridge is publishing the mark schemes for the October/November 2016 series for most Cambridge IGCSE®, Cambridge International A and AS Level components and some Cambridge O Level components.
Mark scheme, page 2
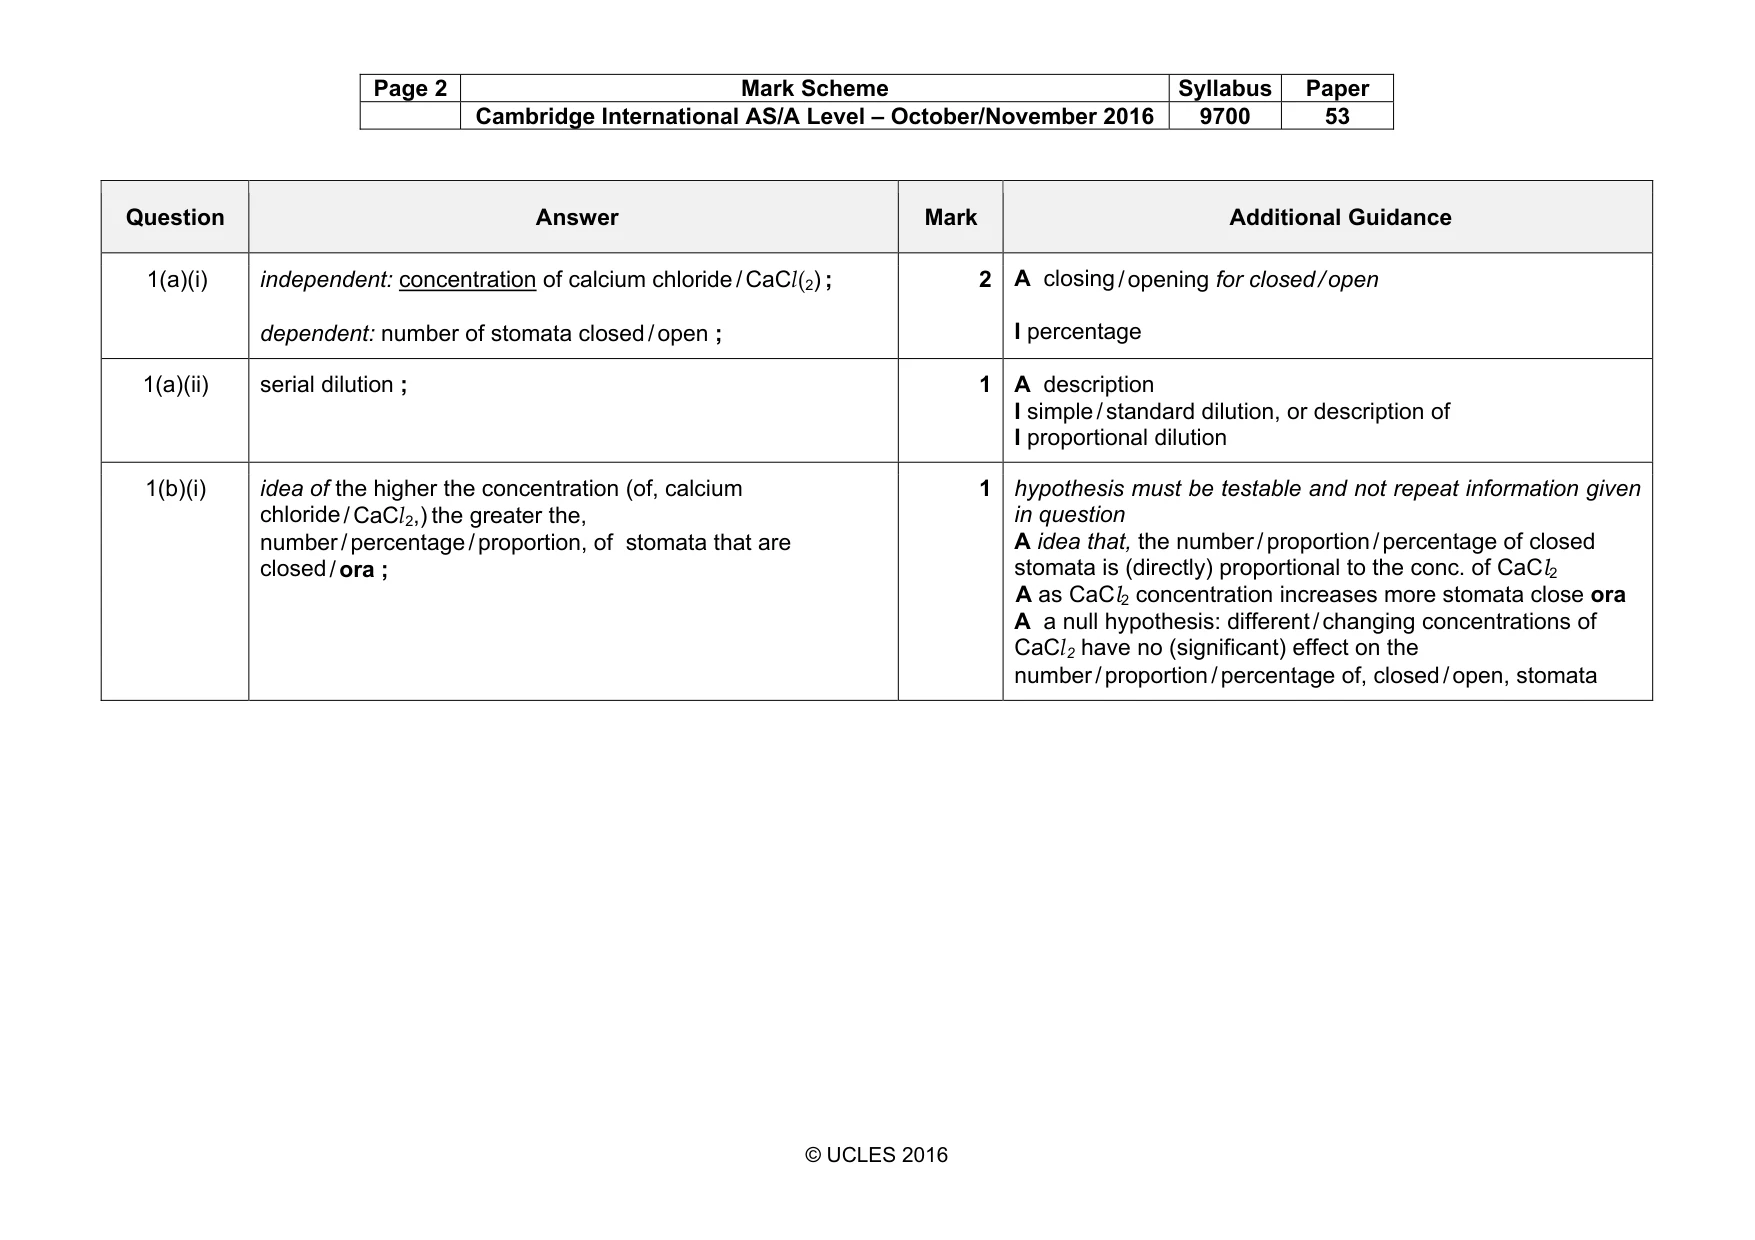
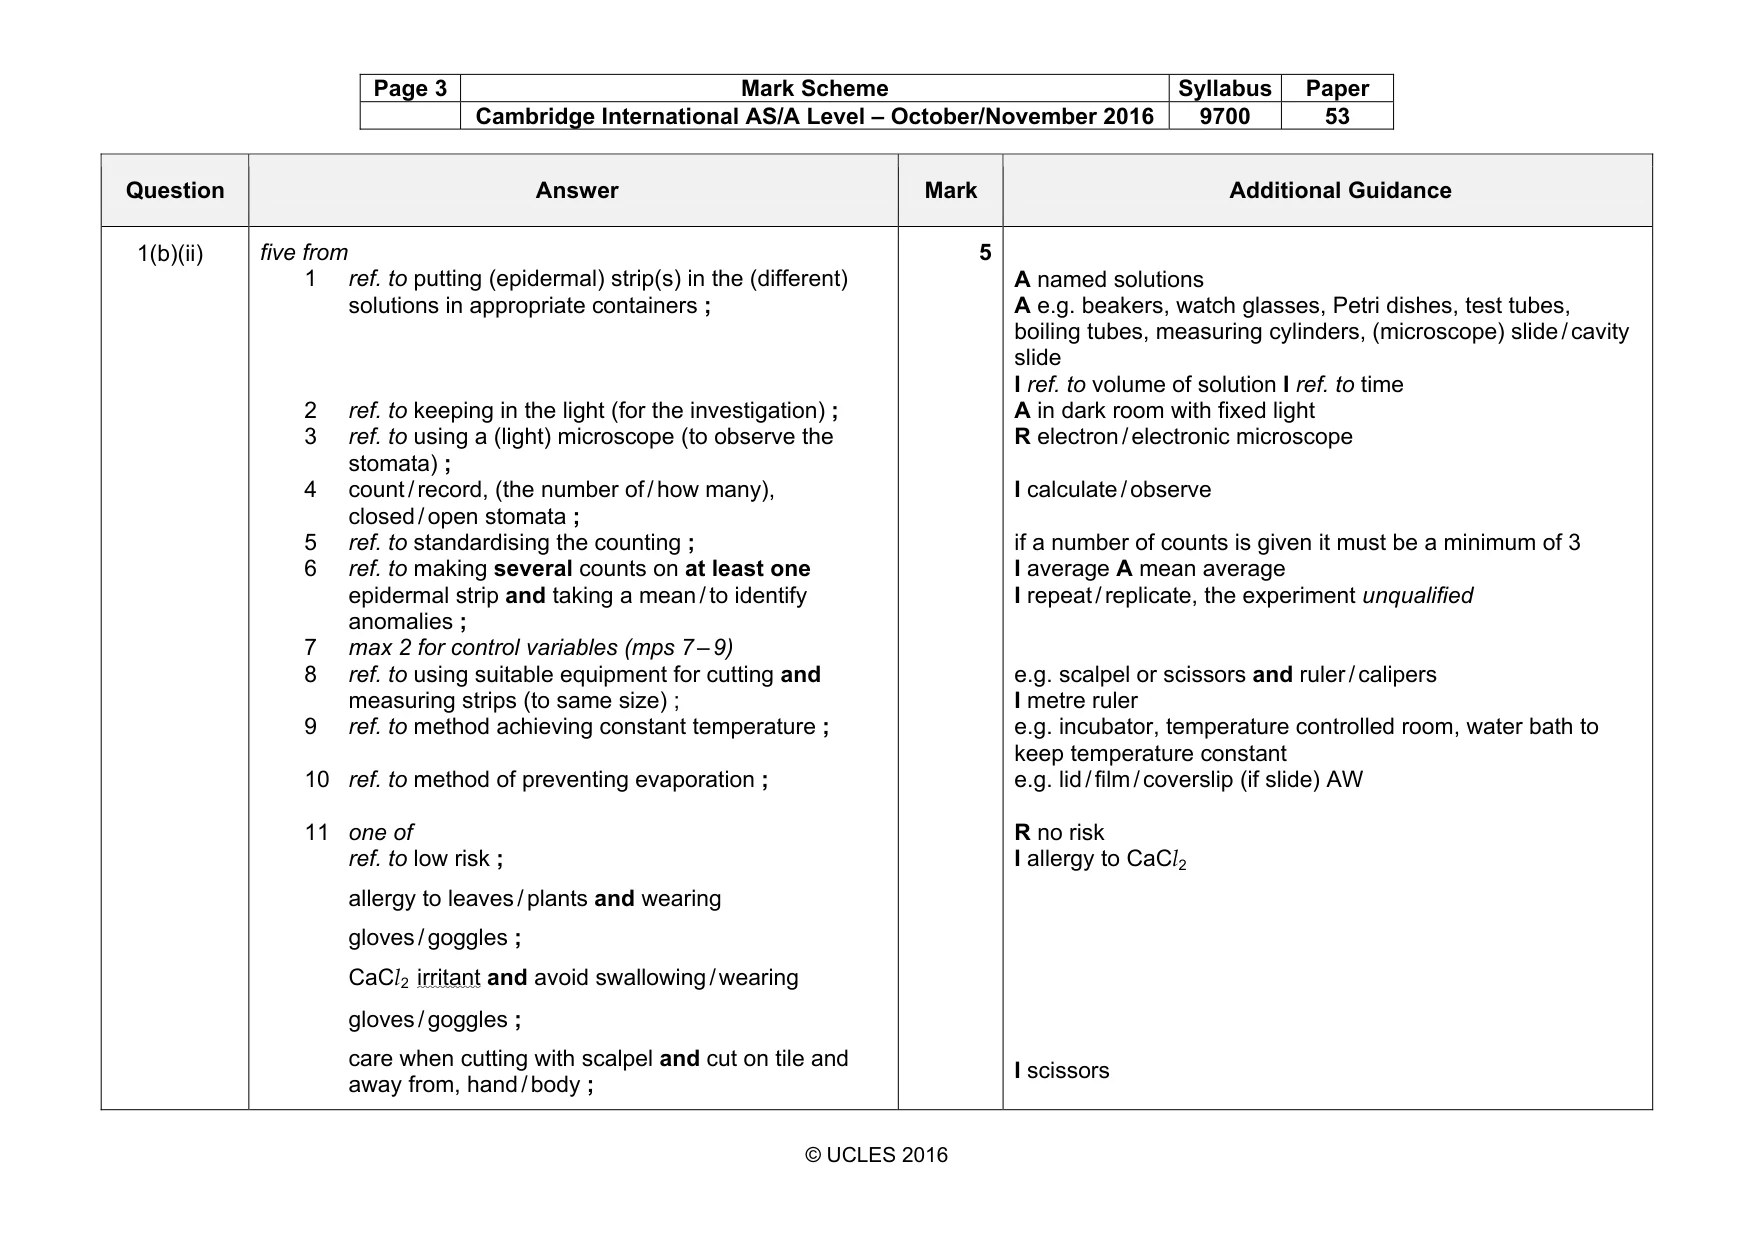
Page 2 Mark Scheme Syllabus Paper Cambridge International AS/A Level – October/November 2016 9700 53 © UCLES 2016 Question Answer Mark Additional Guidance 1(a)(i) independent: concentration of calcium chloride / CaCl(2) ; dependent: number of stomata closed / open ; 2 A closing / opening for closed / open I percentage 1(a)(ii) serial dilution ; 1 A description I simple / standard dilution, or description of I proportional dilution 1(b)(i) idea of the higher the concentration (of, calcium chloride / CaCl2,) the greater the, number / percentage / proportion, of stomata that are closed / ora ; 1 hypothesis must be testable and not repeat information given in question A idea that, the number / proportion / percentage of closed stomata is (directly) proportional to the conc. of CaCl2 A as CaCl2 concentration increases more stomata close ora A a null hypothesis: different / changing concentrations of CaCl2 have no (significant) effect on the number / proportion / percentage of, closed / open, stomata
Mark scheme, page 3
Page 3 Mark Scheme Syllabus Paper Cambridge International AS/A Level – October/November 2016 9700 53 © UCLES 2016 Question Answer Mark Additional Guidance 1(b)(ii) five from 1 ref. to putting (epidermal) strip(s) in the (different) solutions in appropriate containers ; 2 ref. to keeping in the light (for the investigation) ; 3 ref. to using a (light) microscope (to observe the stomata) ; 4 count / record, (the number of / how many), closed / open stomata ; 5 ref. to standardising the counting ; 6 ref. to making several counts on at least one epidermal strip and taking a mean / to identify anomalies ; 7 max 2 for control variables (mps 7 – 9) 8 ref. to using suitable equipment for cutting and measuring strips (to same size) ; 9 ref. to method achieving constant temperature ; 10 ref. to method of preventing evaporation ; 11 one of ref. to low risk ; allergy to leaves / plants and wearing gloves / goggles ; CaCl2 irritant and avoid swallowing / wearing gloves / goggles ; care when cutting with scalpel and cut on tile and away from, hand / body ; 5 A named solutions A e.g. beakers, watch glasses, Petri dishes, test tubes, boiling tubes, measuring cylinders, (microscope) slide / cavity slide I ref. to volume of solution I ref. to time A in dark room with fixed light R electron / electronic microscope I calculate / observe if a number of counts is given it must be a minimum of 3 I average A mean average I repeat / replicate, the experiment unqualified e.g. scalpel or scissors and ruler / calipers I metre ruler e.g. incubator, temperature controlled room, water bath to keep temperature constant e.g. lid / film / coverslip (if slide) AW R no risk I allergy to CaCl2 I scissors
Mark scheme, page 4
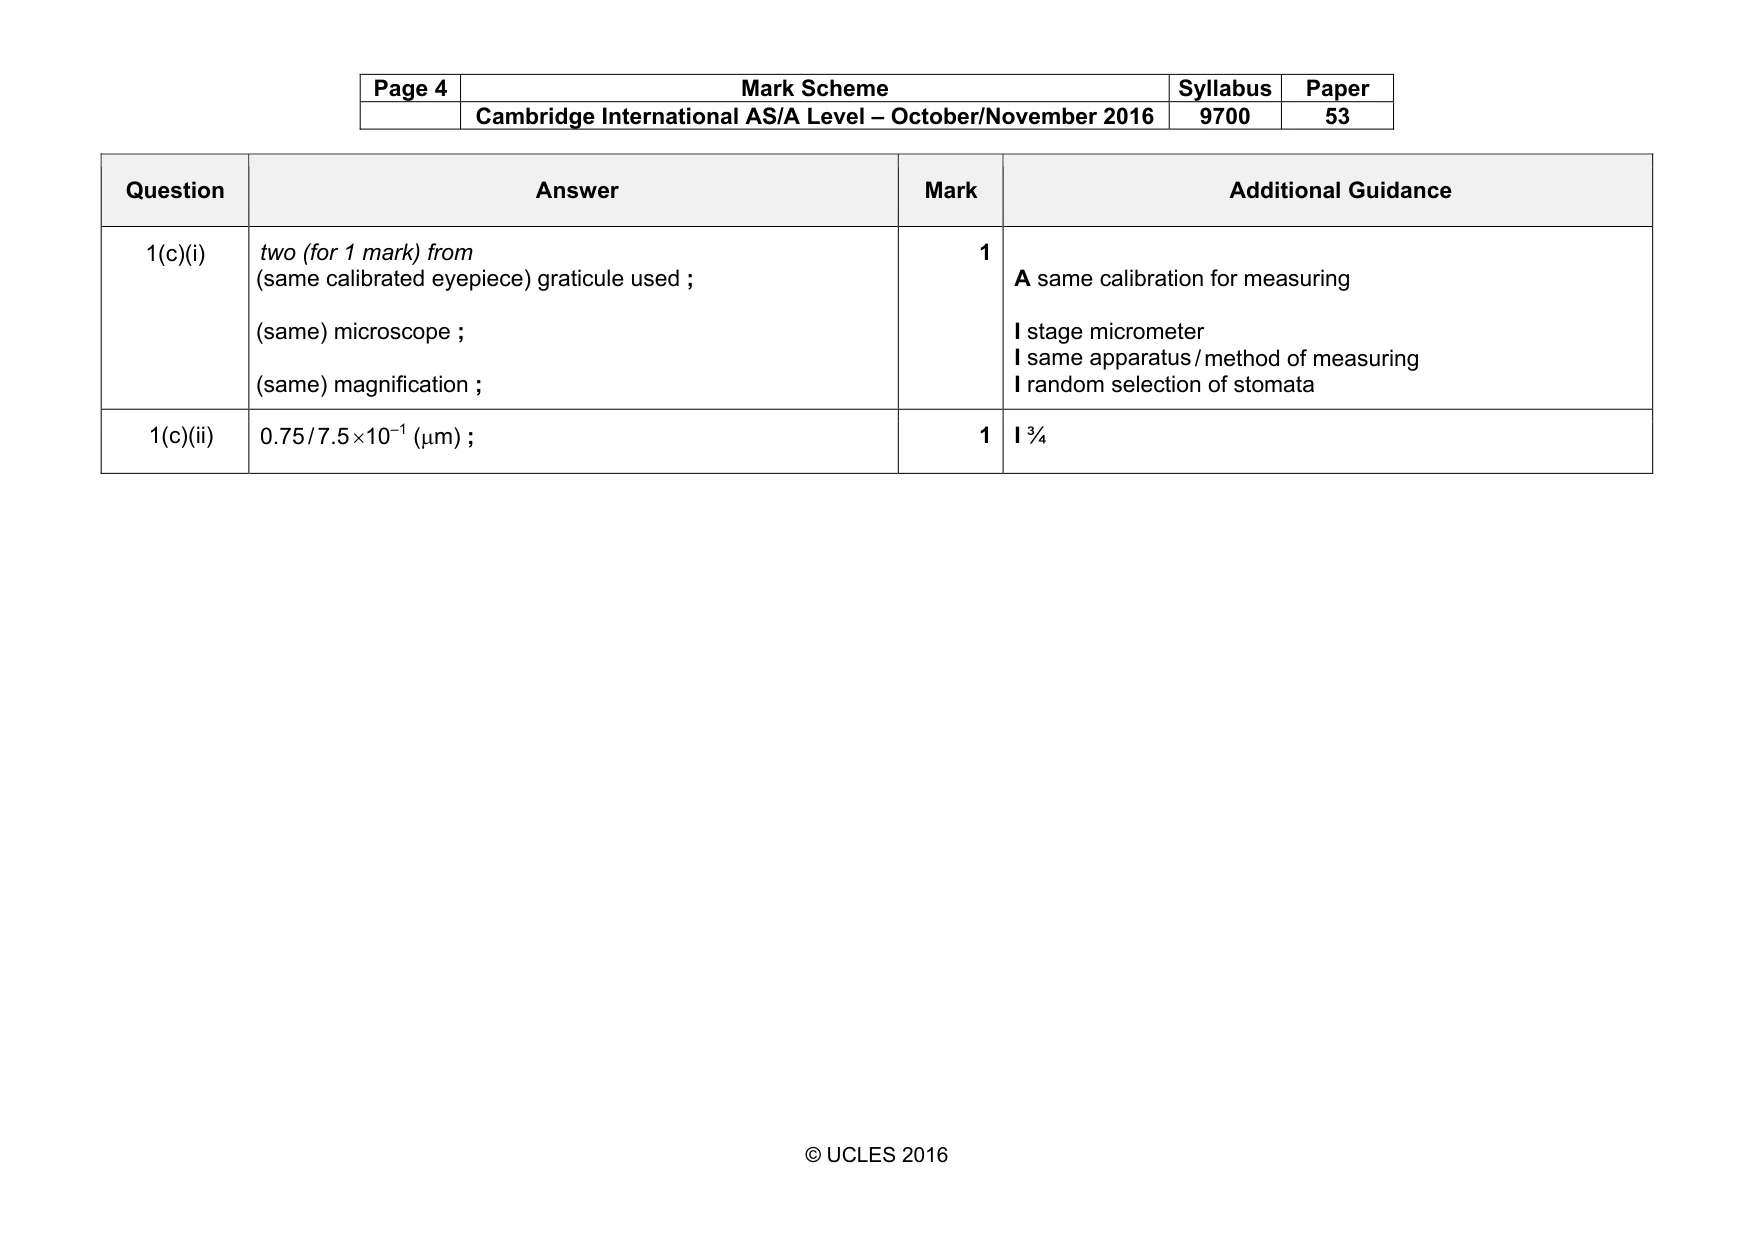
Page 4 Mark Scheme Syllabus Paper Cambridge International AS/A Level – October/November 2016 9700 53 © UCLES 2016 Question Answer Mark Additional Guidance 1(c)(i) two (for 1 mark) from (same calibrated eyepiece) graticule used ; (same) microscope ; (same) magnification ; 1 A same calibration for measuring I stage micrometer I same apparatus / method of measuring I random selection of stomata 1(c)(ii) 0.75 / 7.5 ×10⁻¹ (µm) ; 1 I ¾
Mark scheme, page 5
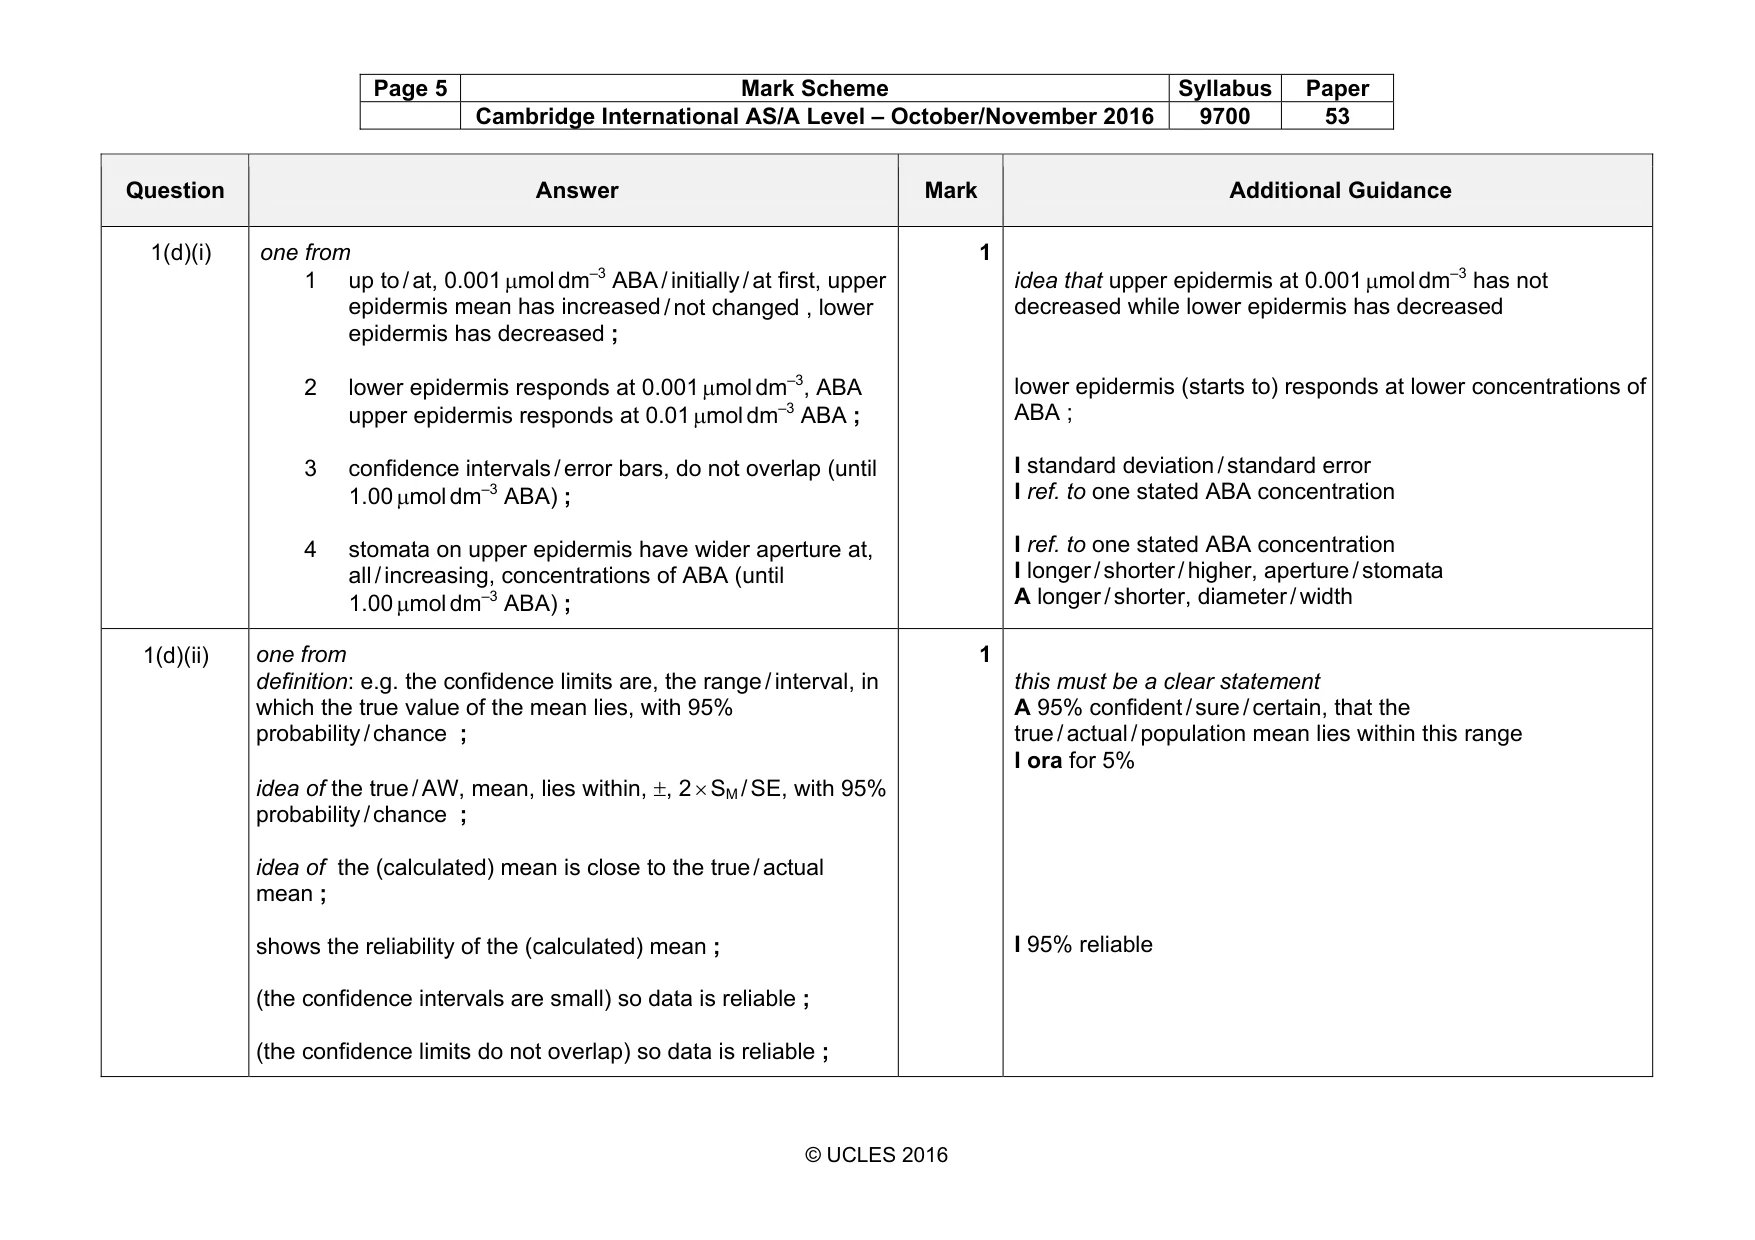
Page 5 Mark Scheme Syllabus Paper Cambridge International AS/A Level – October/November 2016 9700 53 © UCLES 2016 Question Answer Mark Additional Guidance 1(d)(i) one from 1 up to / at, 0.001 µmol dm–3 ABA / initially / at first, upper epidermis mean has increased / not changed , lower epidermis has decreased ; 2 lower epidermis responds at 0.001 µmol dm–3, ABA upper epidermis responds at 0.01 µmol dm–3 ABA ; 3 confidence intervals / error bars, do not overlap (until 1.00 µmol dm–3 ABA) ; 4 stomata on upper epidermis have wider aperture at, all / increasing, concentrations of ABA (until 1.00 µmol dm–3 ABA) ; 1 idea that upper epidermis at 0.001 µmol dm–3 has not decreased while lower epidermis has decreased lower epidermis (starts to) responds at lower concentrations of ABA ; I standard deviation / standard error I ref. to one stated ABA concentration I ref. to one stated ABA concentration I longer / shorter / higher, aperture / stomata A longer / shorter, diameter / width 1(d)(ii) one from definition: e.g. the confidence limits are, the range / interval, in which the true value of the mean lies, with 95% probability / chance ; idea of the true / AW, mean, lies within, ±, 2 × SM / SE, with 95% probability / chance ; idea of the (calculated) mean is close to the true / actual mean ; shows the reliability of the (calculated) mean ; (the confidence intervals are small) so data is reliable ; (the confidence limits do not overlap) so data is reliable ; 1 this must be a clear statement A 95% confident / sure / certain, that the true / actual / population mean lies within this range I ora for 5% I 95% reliable
Mark scheme, page 6
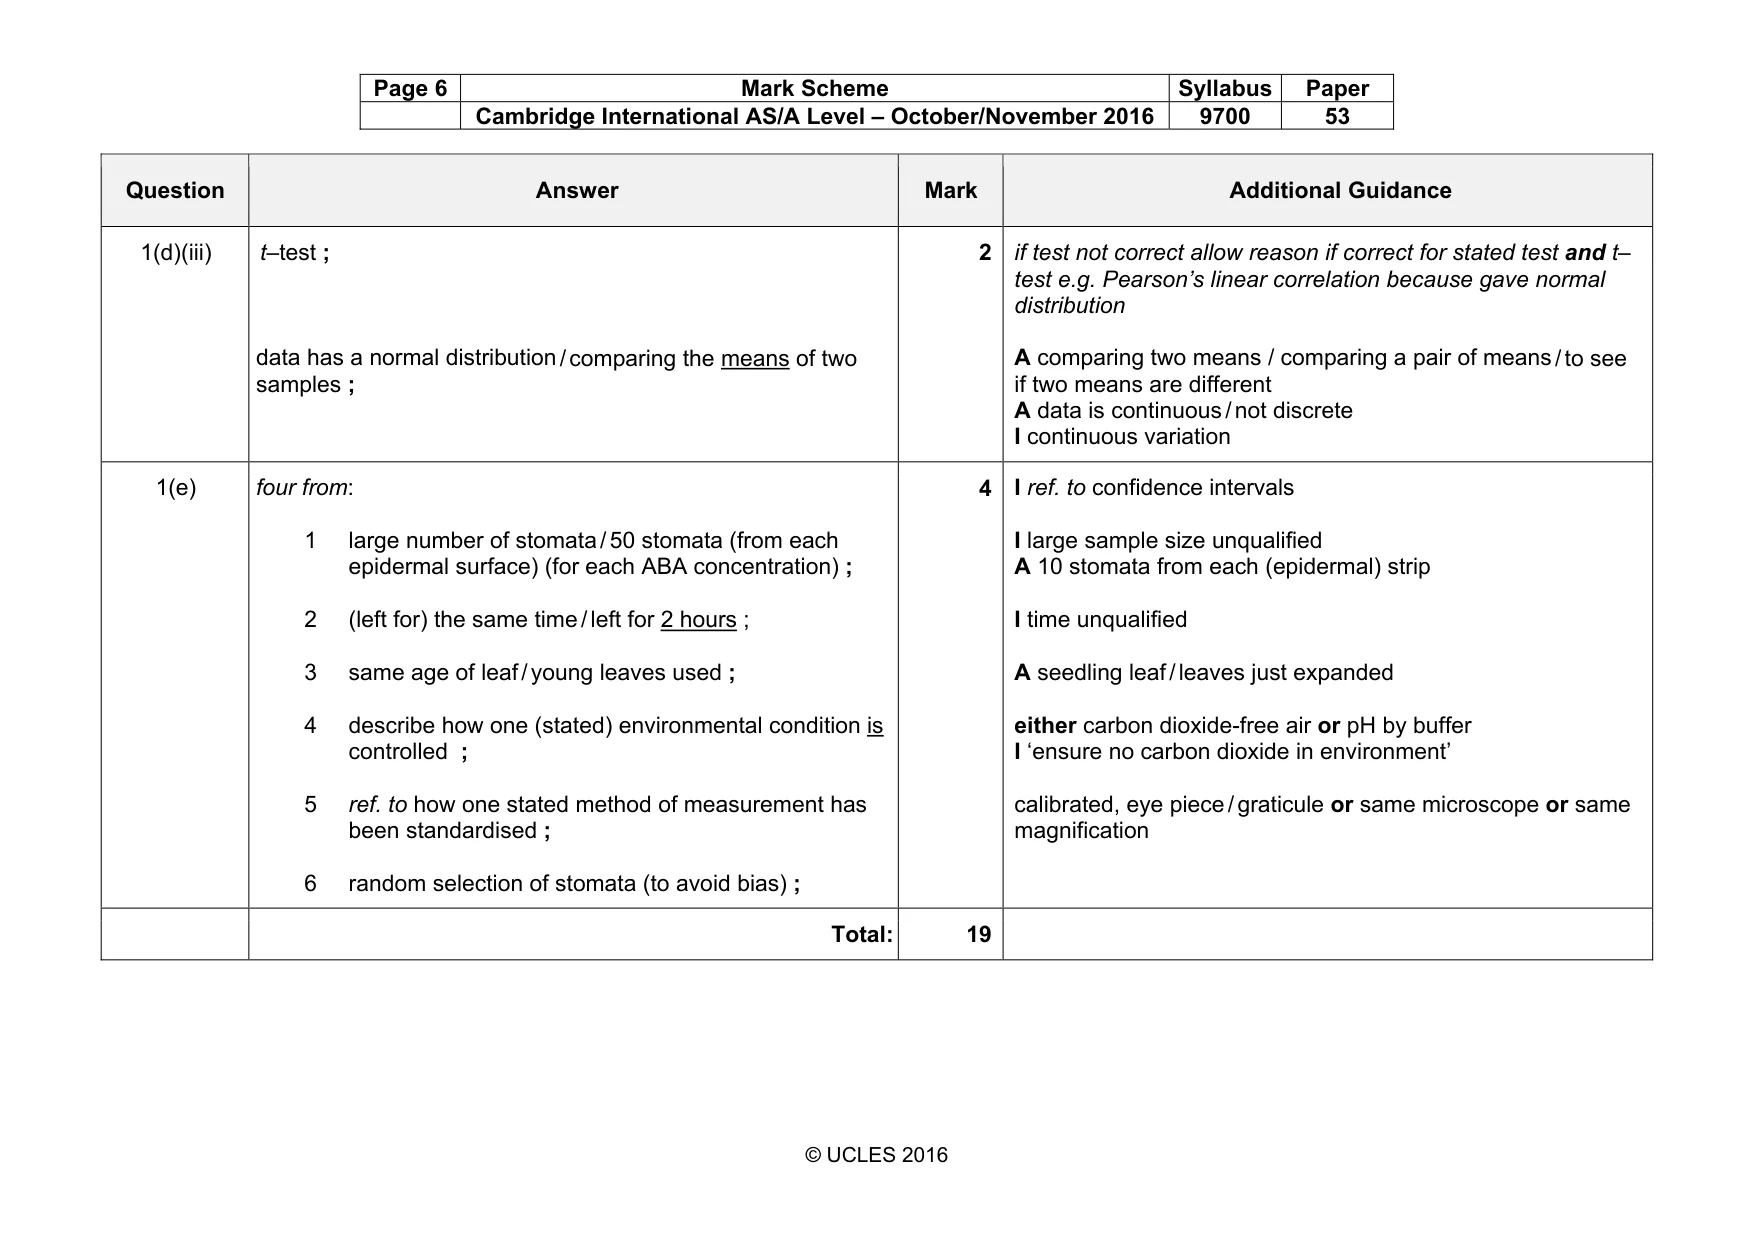
Page 6 Mark Scheme Syllabus Paper Cambridge International AS/A Level – October/November 2016 9700 53 © UCLES 2016 Question Answer Mark Additional Guidance 1(d)(iii) t–test ; data has a normal distribution / comparing the means of two samples ; 2 if test not correct allow reason if correct for stated test and t– test e.g. Pearson’s linear correlation because gave normal distribution A comparing two means / comparing a pair of means / to see if two means are different A data is continuous / not discrete I continuous variation 1(e) four from: 1 large number of stomata / 50 stomata (from each epidermal surface) (for each ABA concentration) ; 2 (left for) the same time / left for 2 hours ; 3 same age of leaf / young leaves used ; 4 describe how one (stated) environmental condition is controlled ; 5 ref. to how one stated method of measurement has been standardised ; 6 random selection of stomata (to avoid bias) ; 4 I ref. to confidence intervals I large sample size unqualified A 10 stomata from each (epidermal) strip I time unqualified A seedling leaf / leaves just expanded either carbon dioxide-free air or pH by buffer I ‘ensure no carbon dioxide in environment’ calibrated, eye piece / graticule or same microscope or same magnification Total: 19
Mark scheme, page 7
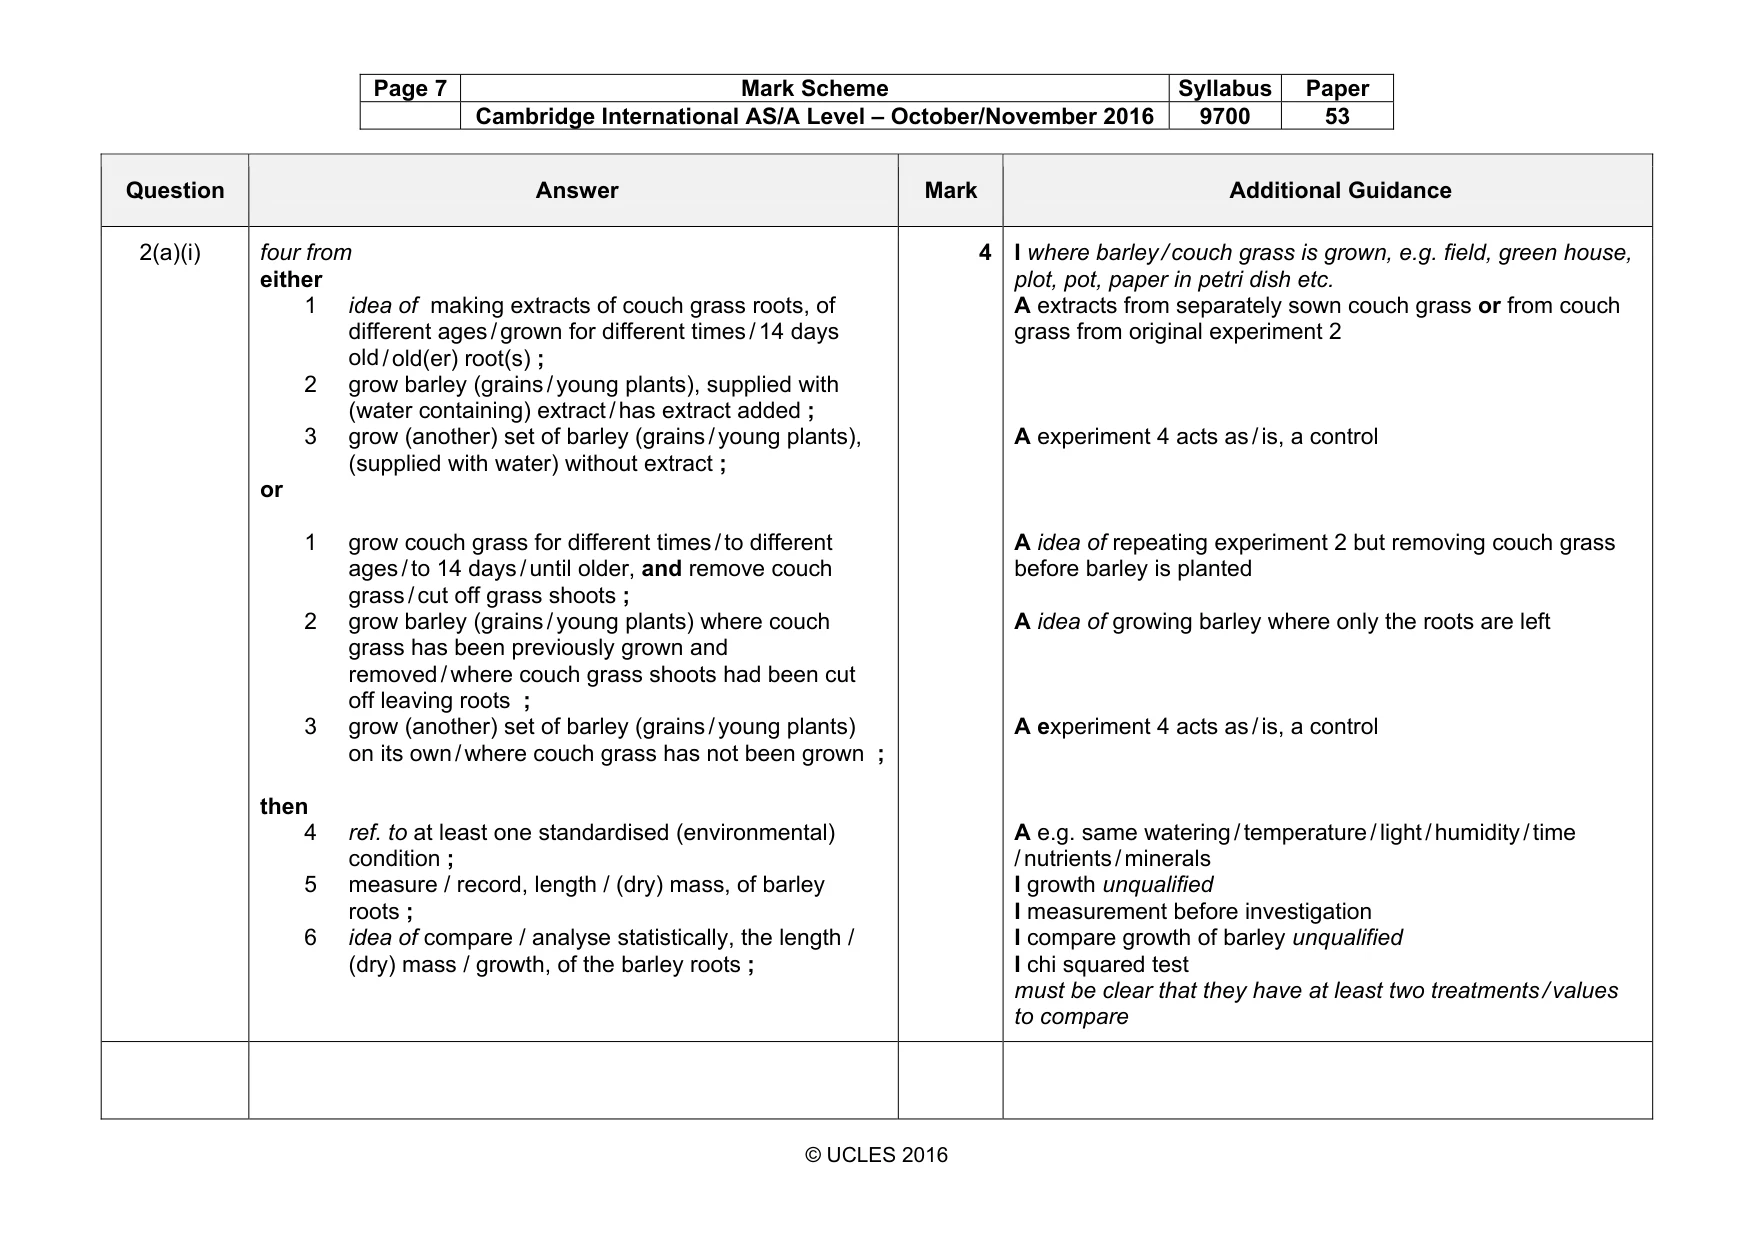
Page 7 Mark Scheme Syllabus Paper Cambridge International AS/A Level – October/November 2016 9700 53 © UCLES 2016 Question Answer Mark Additional Guidance 2(a)(i) four from either 1 idea of making extracts of couch grass roots, of different ages / grown for different times / 14 days old / old(er) root(s) ; 2 grow barley (grains / young plants), supplied with (water containing) extract / has extract added ; 3 grow (another) set of barley (grains / young plants), (supplied with water) without extract ; or 1 grow couch grass for different times / to different ages / to 14 days / until older, and remove couch grass / cut off grass shoots ; 2 grow barley (grains / young plants) where couch grass has been previously grown and removed / where couch grass shoots had been cut off leaving roots ; 3 grow (another) set of barley (grains / young plants) on its own / where couch grass has not been grown ; then 4 ref. to at least one standardised (environmental) condition ; 5 measure / record, length / (dry) mass, of barley roots ; 6 idea of compare / analyse statistically, the length / (dry) mass / growth, of the barley roots ; 4 I where barley / couch grass is grown, e.g. field, green house, plot, pot, paper in petri dish etc. A extracts from separately sown couch grass or from couch grass from original experiment 2 A experiment 4 acts as / is, a control A idea of repeating experiment 2 but removing couch grass before barley is planted A idea of growing barley where only the roots are left A experiment 4 acts as / is, a control A e.g. same watering / temperature / light / humidity / time / nutrients / minerals I growth unqualified I measurement before investigation I compare growth of barley unqualified I chi squared test must be clear that they have at least two treatments / values to compare
Mark scheme, page 8
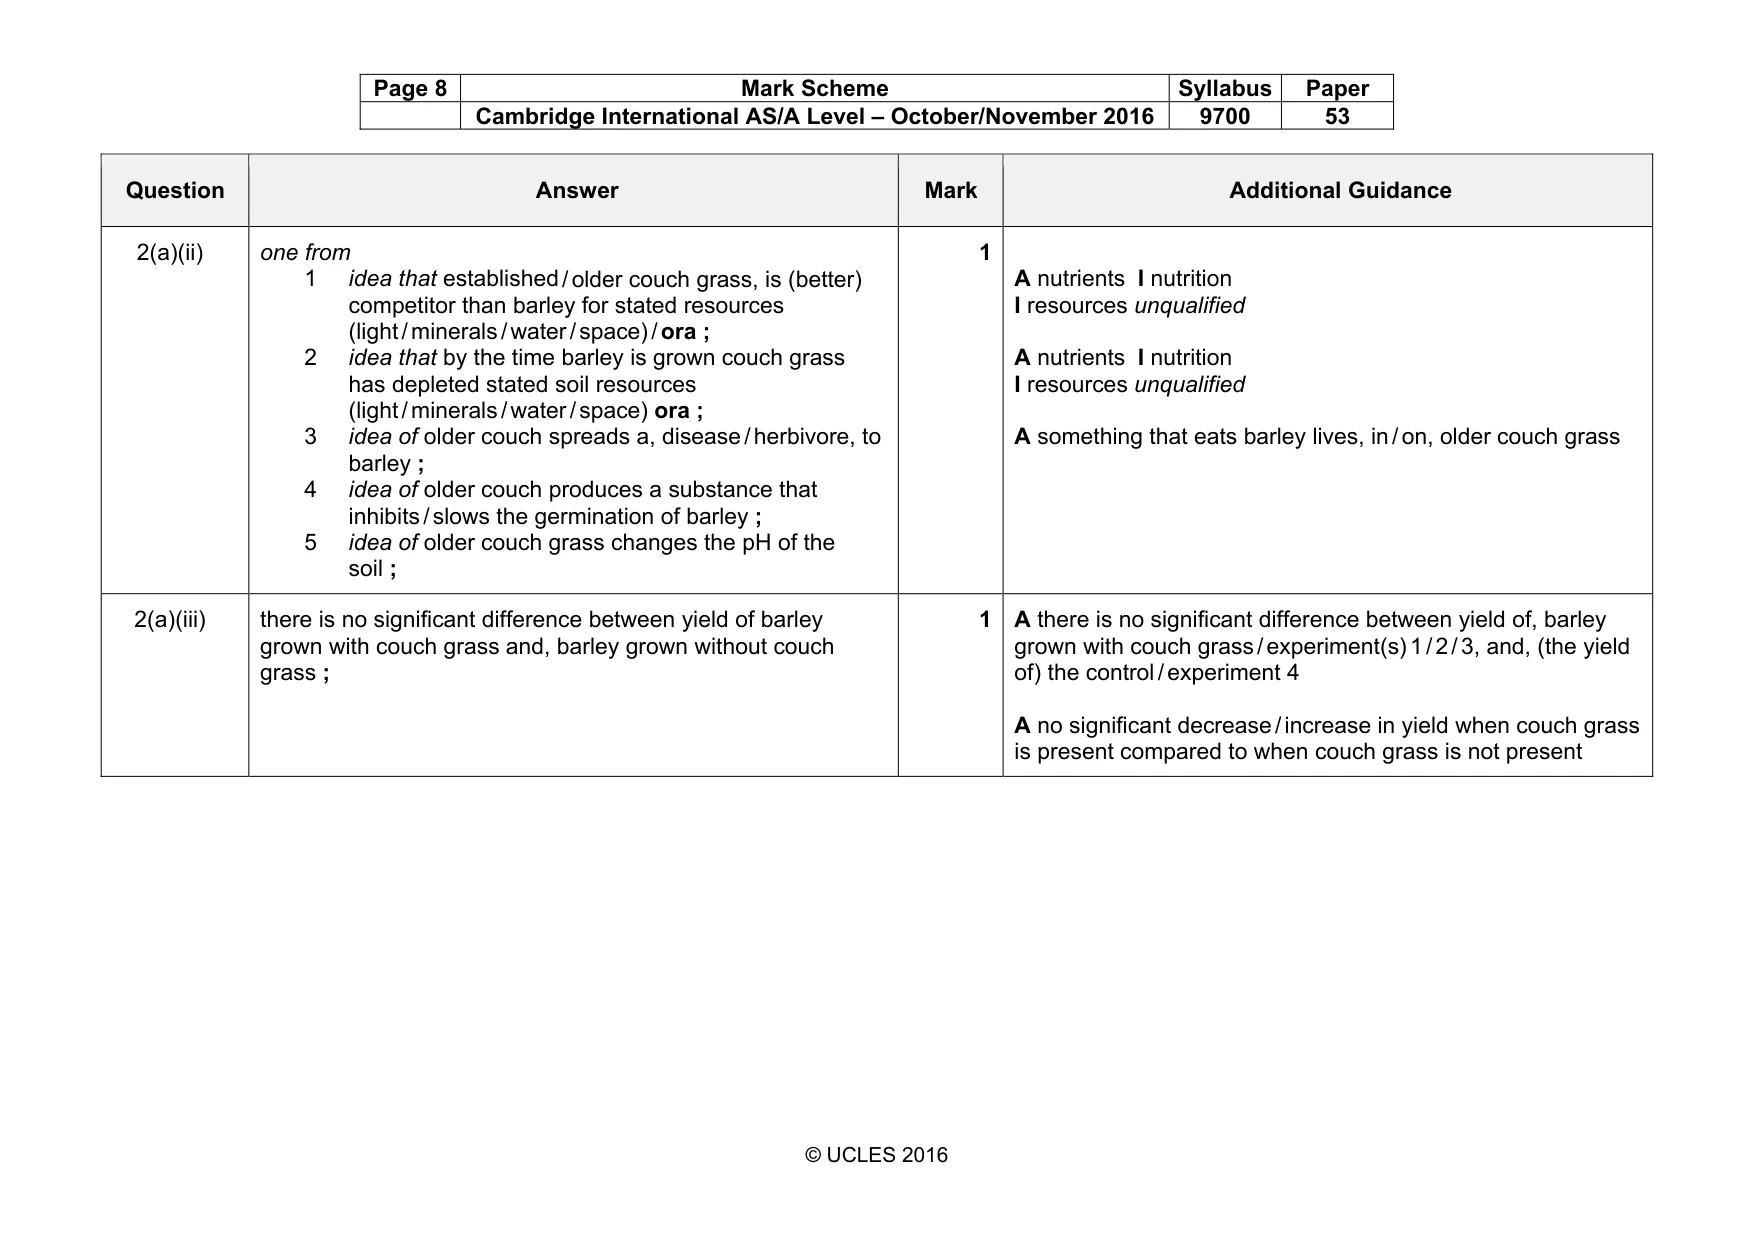
Page 8 Mark Scheme Syllabus Paper Cambridge International AS/A Level – October/November 2016 9700 53 © UCLES 2016 Question Answer Mark Additional Guidance 2(a)(ii) one from 1 idea that established / older couch grass, is (better) competitor than barley for stated resources (light / minerals / water / space) / ora ; 2 idea that by the time barley is grown couch grass has depleted stated soil resources (light / minerals / water / space) ora ; 3 idea of older couch spreads a, disease / herbivore, to barley ; 4 idea of older couch produces a substance that inhibits / slows the germination of barley ; 5 idea of older couch grass changes the pH of the soil ; 1 A nutrients I nutrition I resources unqualified A nutrients I nutrition I resources unqualified A something that eats barley lives, in / on, older couch grass 2(a)(iii) there is no significant difference between yield of barley grown with couch grass and, barley grown without couch grass ; 1 A there is no significant difference between yield of, barley grown with couch grass / experiment(s) 1 / 2 / 3, and, (the yield of) the control / experiment 4 A no significant decrease / increase in yield when couch grass is present compared to when couch grass is not present
Mark scheme, page 9
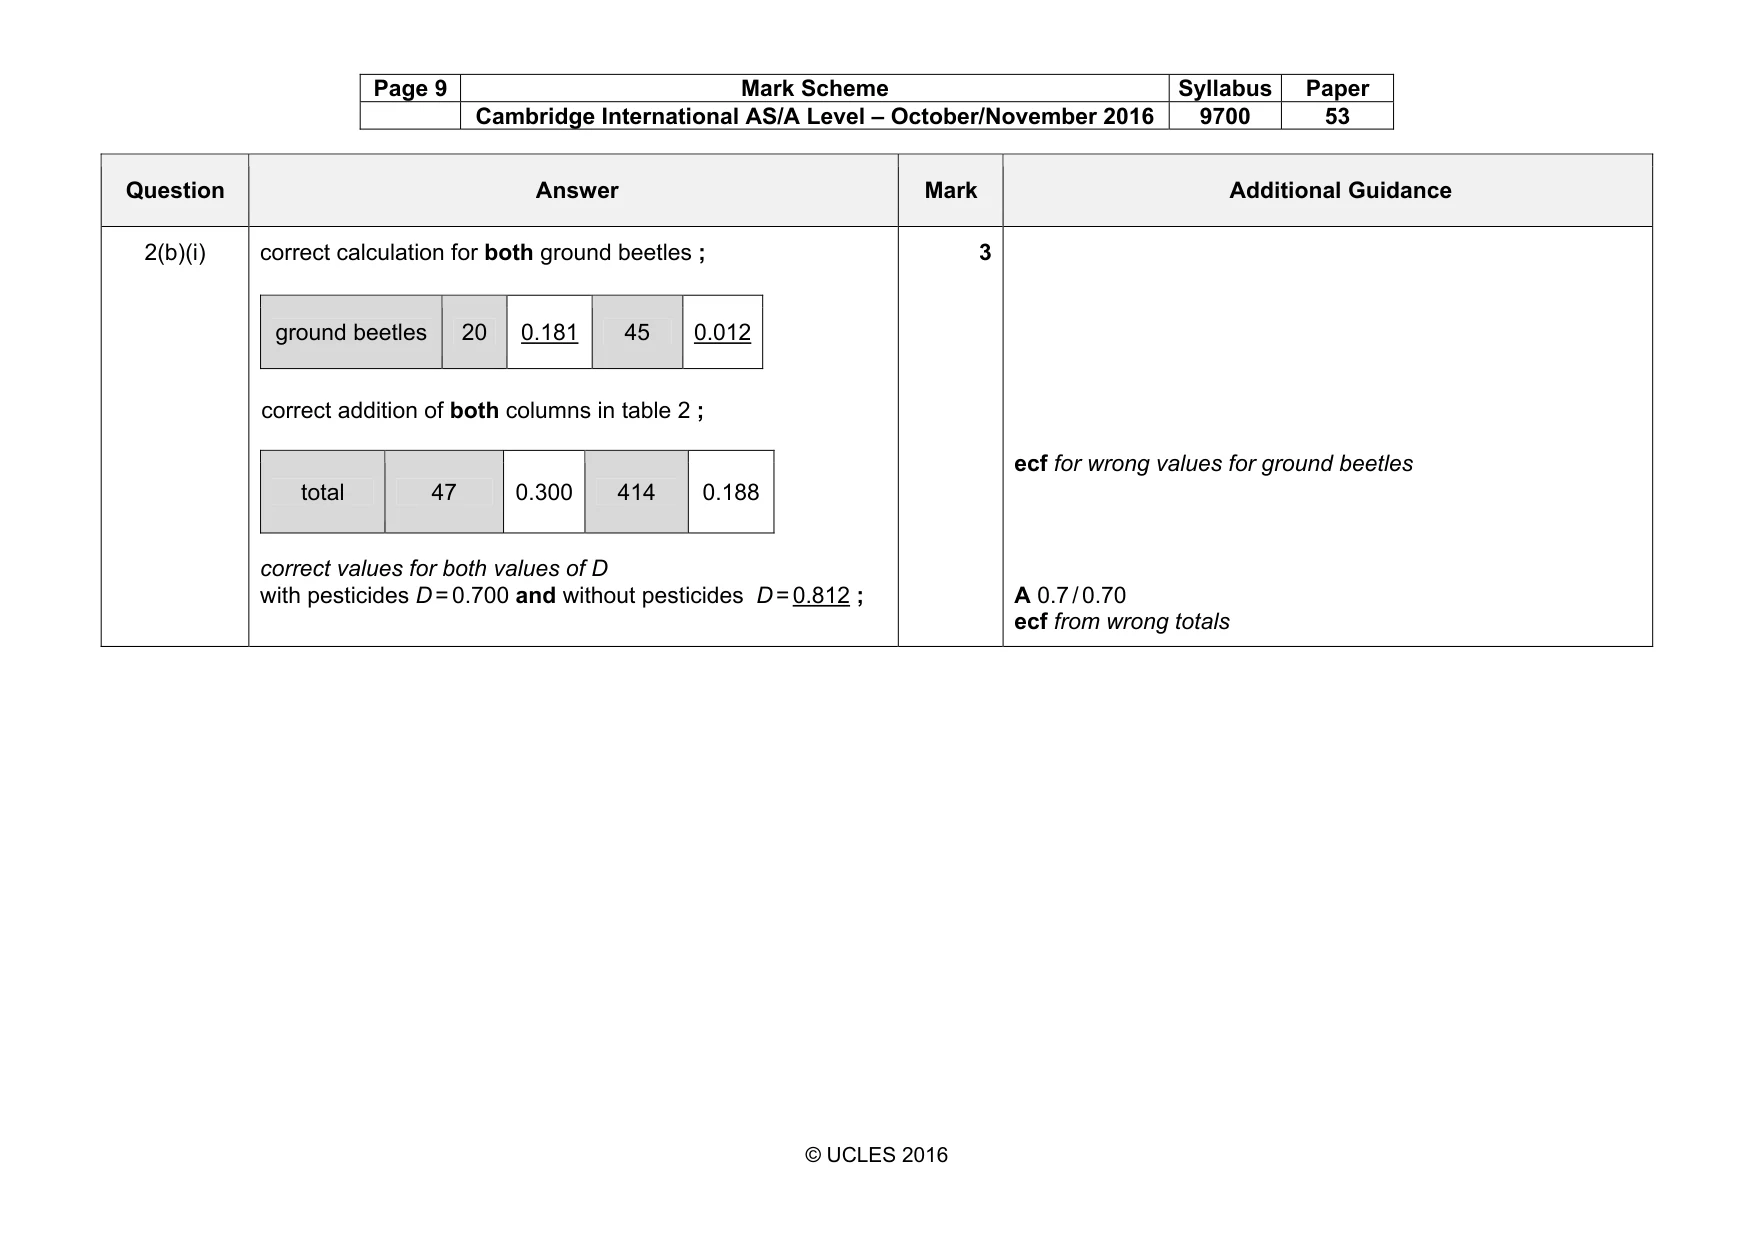
Page 9 Mark Scheme Syllabus Paper Cambridge International AS/A Level – October/November 2016 9700 53 © UCLES 2016 Question Answer Mark Additional Guidance 2(b)(i) correct calculation for both ground beetles ; correct addition of both columns in table 2 ; correct values for both values of D with pesticides D = 0.700 and without pesticides D = 0.812 ; ground beetles 20 0.181 45 0.012 total 47 0.300 414 0.188 3 ecf for wrong values for ground beetles A 0.7 / 0.70 ecf from wrong totals
Mark scheme, page 10
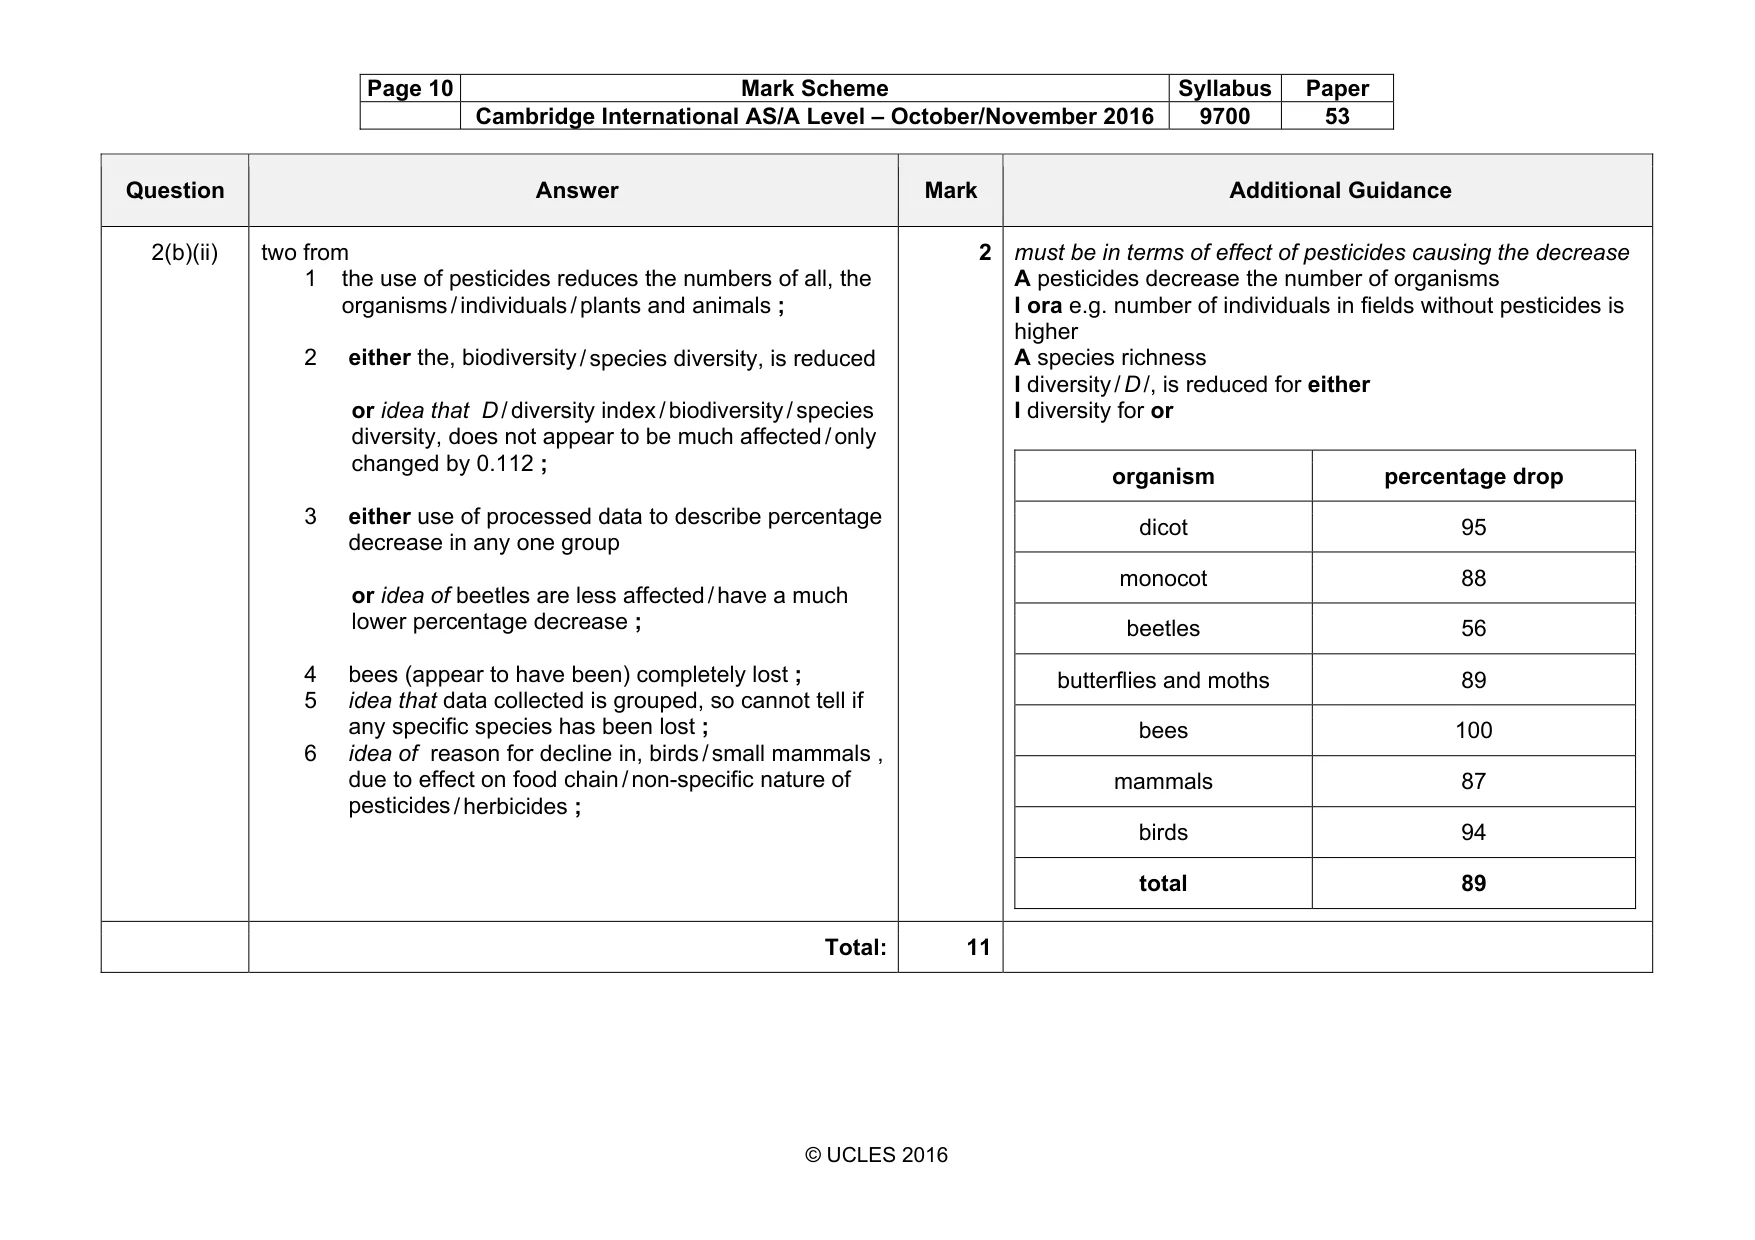
Page 10 Mark Scheme Syllabus Paper Cambridge International AS/A Level – October/November 2016 9700 53 © UCLES 2016 Question Answer Mark Additional Guidance 2(b)(ii) two from 1 the use of pesticides reduces the numbers of all, the organisms / individuals / plants and animals ; 2 either the, biodiversity / species diversity, is reduced or idea that D / diversity index / biodiversity / species diversity, does not appear to be much affected / only changed by 0.112 ; 3 either use of processed data to describe percentage decrease in any one group or idea of beetles are less affected / have a much lower percentage decrease ; 4 bees (appear to have been) completely lost ; 5 idea that data collected is grouped, so cannot tell if any specific species has been lost ; 6 idea of reason for decline in, birds / small mammals , due to effect on food chain / non-specific nature of pesticides / herbicides ; 2 must be in terms of effect of pesticides causing the decrease A pesticides decrease the number of organisms I ora e.g. number of individuals in fields without pesticides is higher A species richness I diversity / D /, is reduced for either I diversity for or organism percentage drop dicot 95 monocot 88 beetles 56 butterflies and moths 89 bees 100 mammals 87 birds 94 total 89 Total: 11
What you needed in this session
Cambridge’s own grade thresholds for 2016 Oct/Nov, Paper 5 · Variant 3. A higher threshold means an easier paper — the bar moves with how the cohort did.