Cambridge A Level Biology 9700 — 2011 Oct/Nov Paper 3 · Variant 3
9700/33/O/N/11 · 40 marks · ≈45 min
The question paper and its mark scheme, free to read here and free to download. This is Cambridge’s own paper, exactly as it was sat.
Question paper16 pages
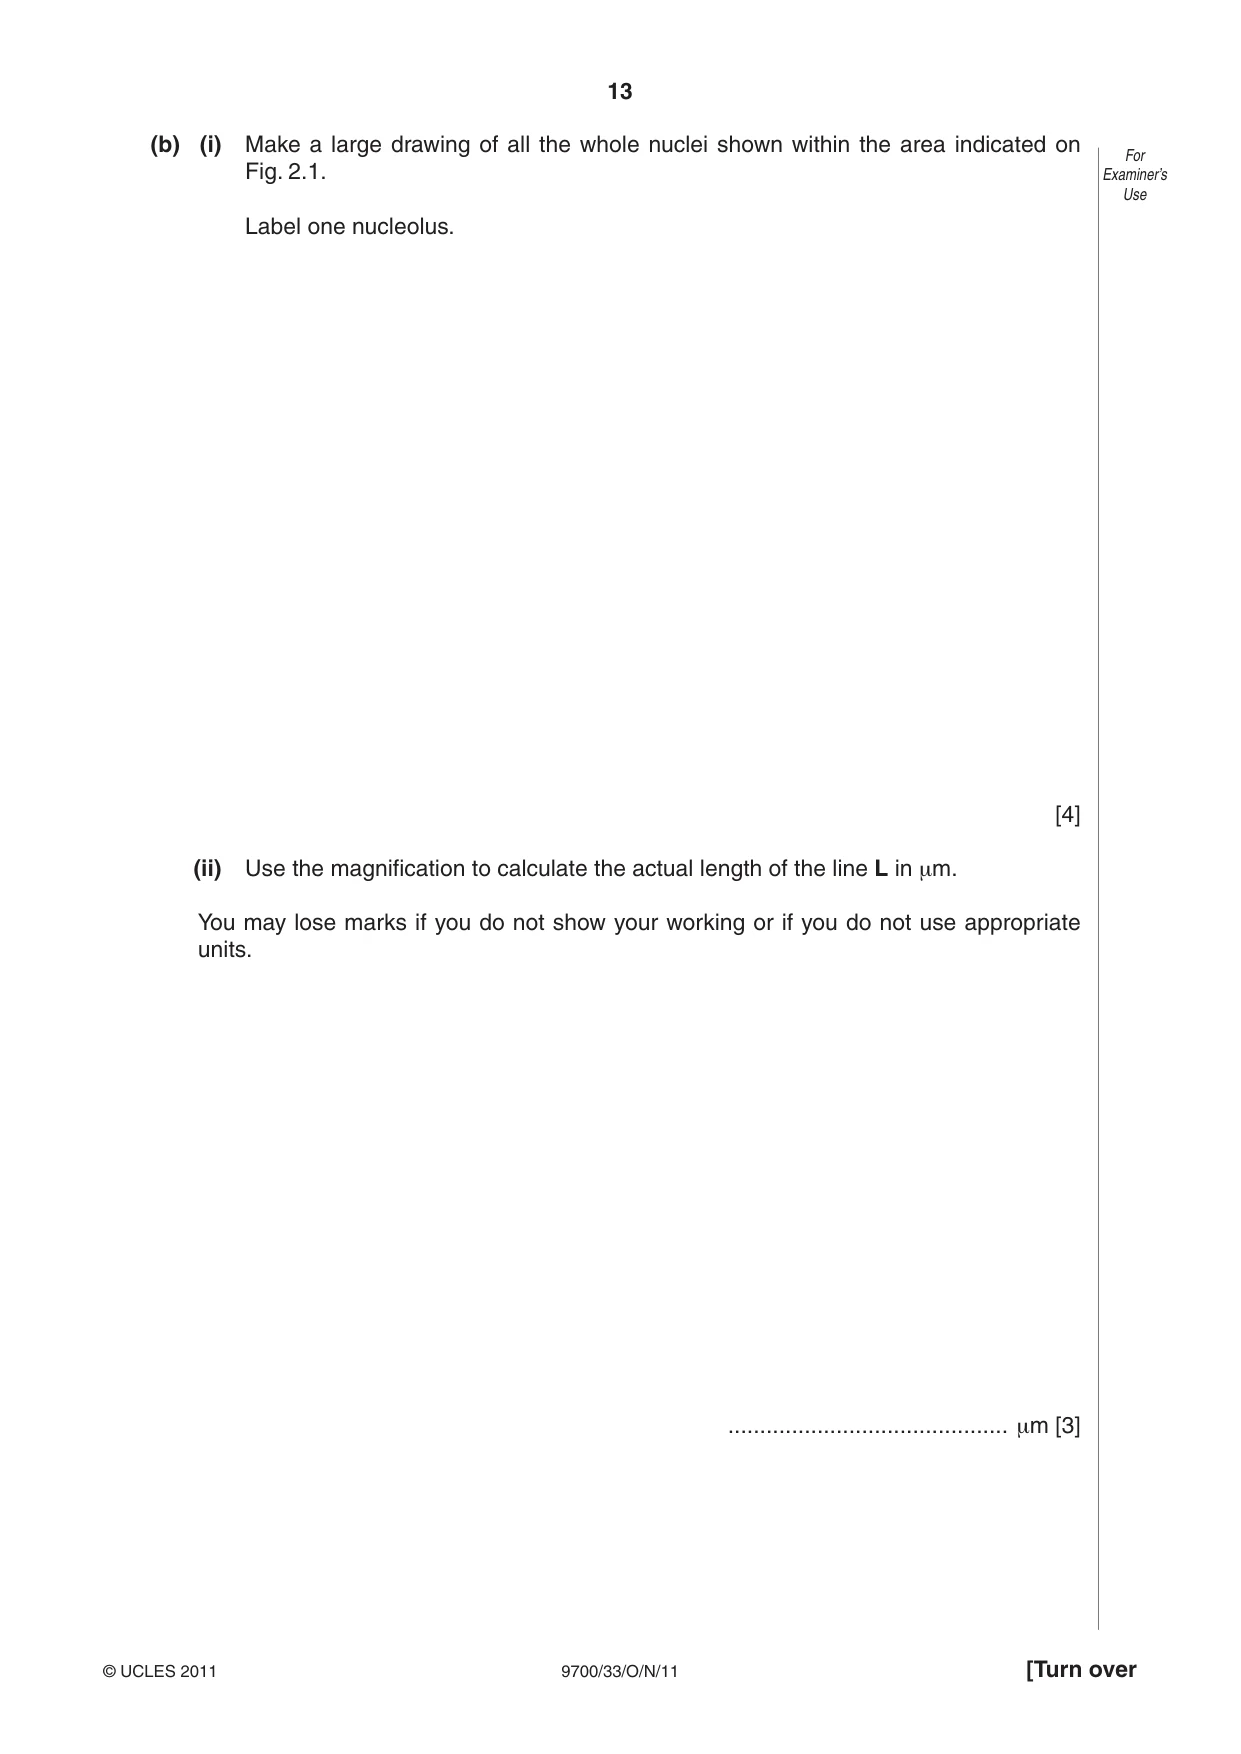
Mark scheme13 pages
Answers below. Sit the paper first if you are practising.
Paper as text
Question paper, page 1
This document consists of 14 printed pages and 2 blank pages. DC (CW/JG) 34181/7 © UCLES 2011 [Turn over UNIVERSITY OF CAMBRIDGE INTERNATIONAL EXAMINATIONS General Certificate of Education Advanced Subsidiary Level and Advanced Level READ THESE INSTRUCTIONS FIRST Write your Centre number, candidate number and name on all the work you hand in. Write in dark blue or black ink. You may use a pencil for any diagrams, graphs or rough working. Do not use red ink, staples, paper clips, highlighters, glue or correction fluid. DO NOT WRITE IN ANY BARCODES. Answer all questions. You may lose marks if you do not show your working or if you do not use appropriate units. At the end of the examination, fasten all your work securely together. The number of marks is given in brackets [ ] at the end of each question or part question. * 4 4 8 7 9 4 1 3 8 7 * BIOLOGY 9700/33 Advanced Practical Skills 1 October/November 2011 2 hours Candidates answer on the Question Paper. Additional Materials: As listed in the Confidential Instructions. For Examiner’s Use 1 2 Total
Question paper, page 2
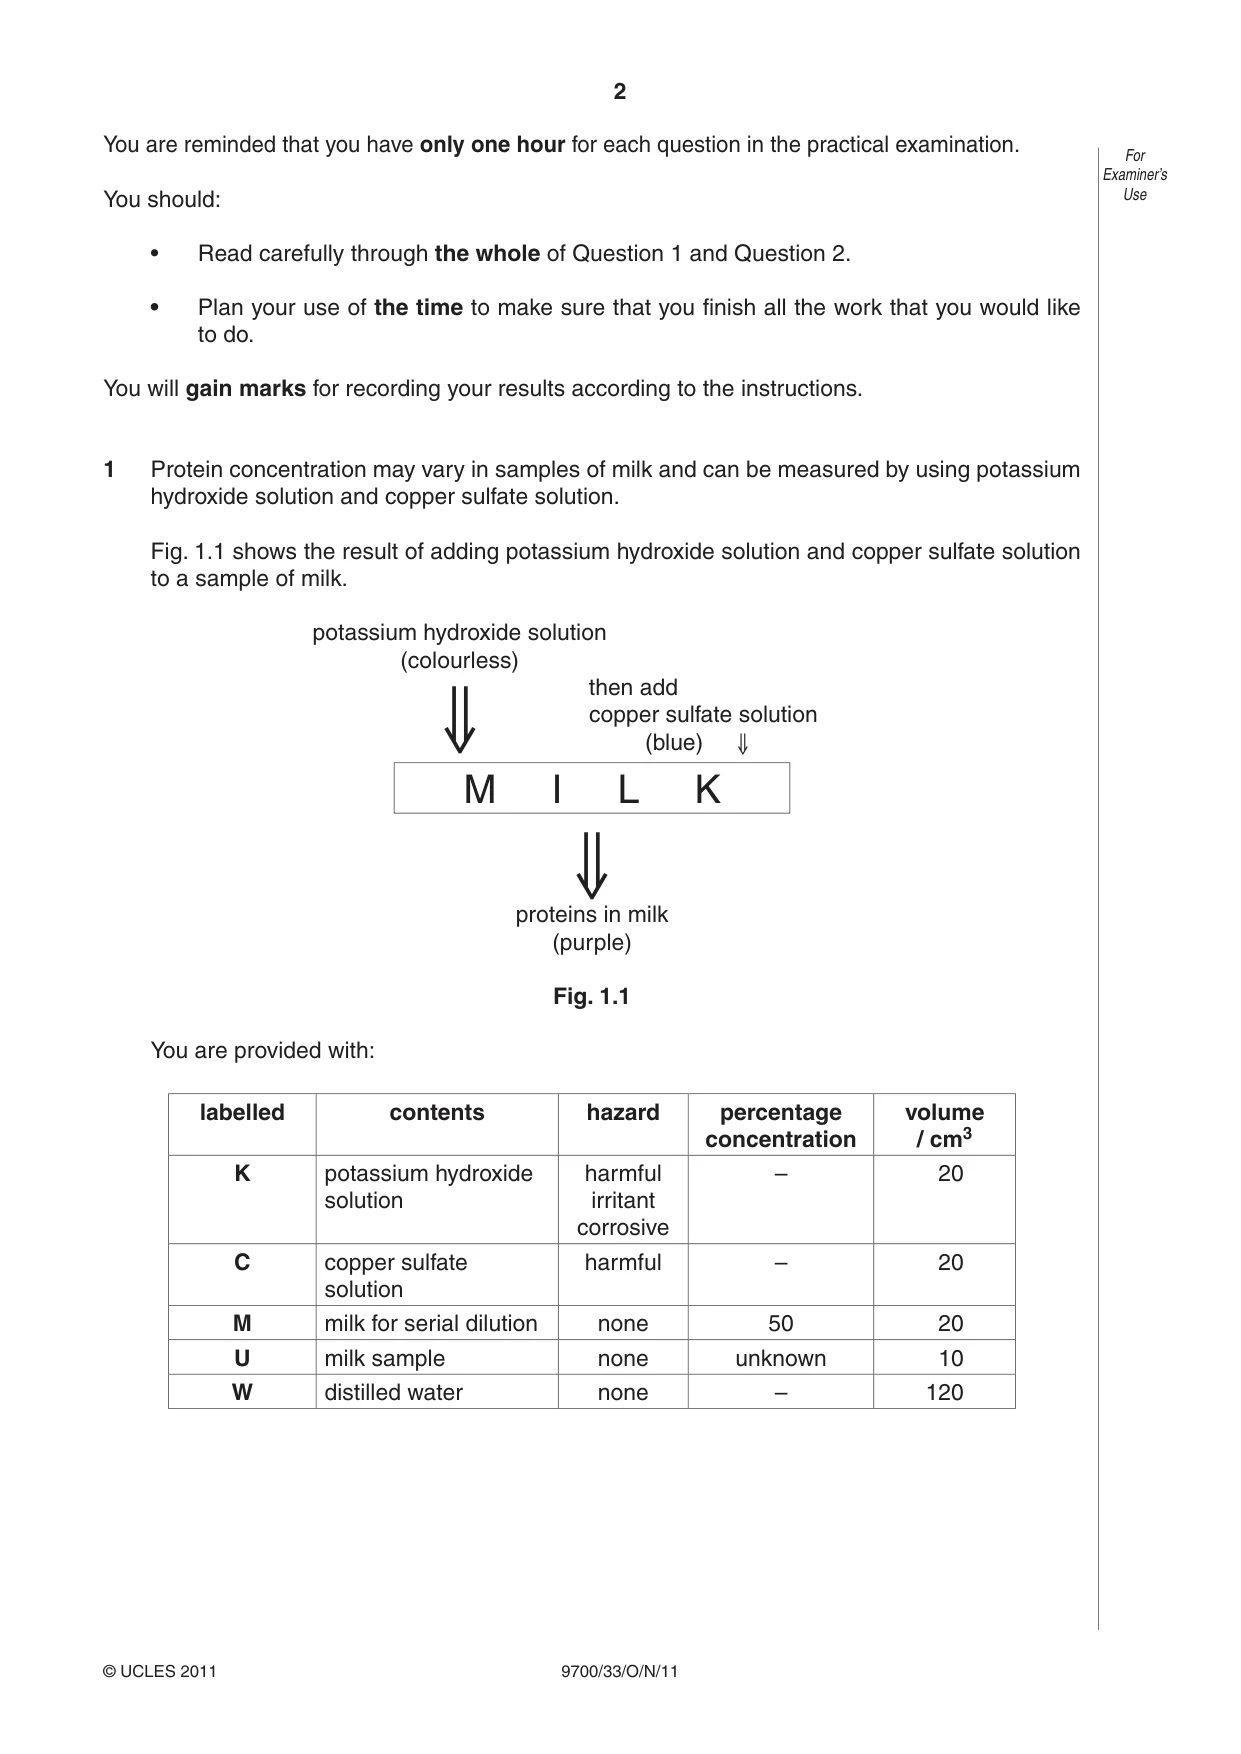
2 © UCLES 2011 9700/33/O/N/11 For Examiner’s Use You are reminded that you have only one hour for each question in the practical examination. You should: • Read carefully through the whole of Question 1 and Question 2. • Plan your use of the time to make sure that you finish all the work that you would like to do. You will gain marks for recording your results according to the instructions. 1 Protein concentration may vary in samples of milk and can be measured by using potassium hydroxide solution and copper sulfate solution. Fig. 1.1 shows the result of adding potassium hydroxide solution and copper sulfate solution to a sample of milk. potassium hydroxide solution (colourless) ⇓ then add copper sulfate solution (blue) ⇓ M I L K ⇓ proteins in milk (purple) Fig. 1.1 You are provided with: labelled contents hazard percentage concentration volume / cm3 K potassium hydroxide solution harmful irritant corrosive – 20 C copper sulfate solution harmful – 20 M milk for serial dilution none 50 20 U milk sample none unknown 10 W distilled water none – 120
Question paper, page 3
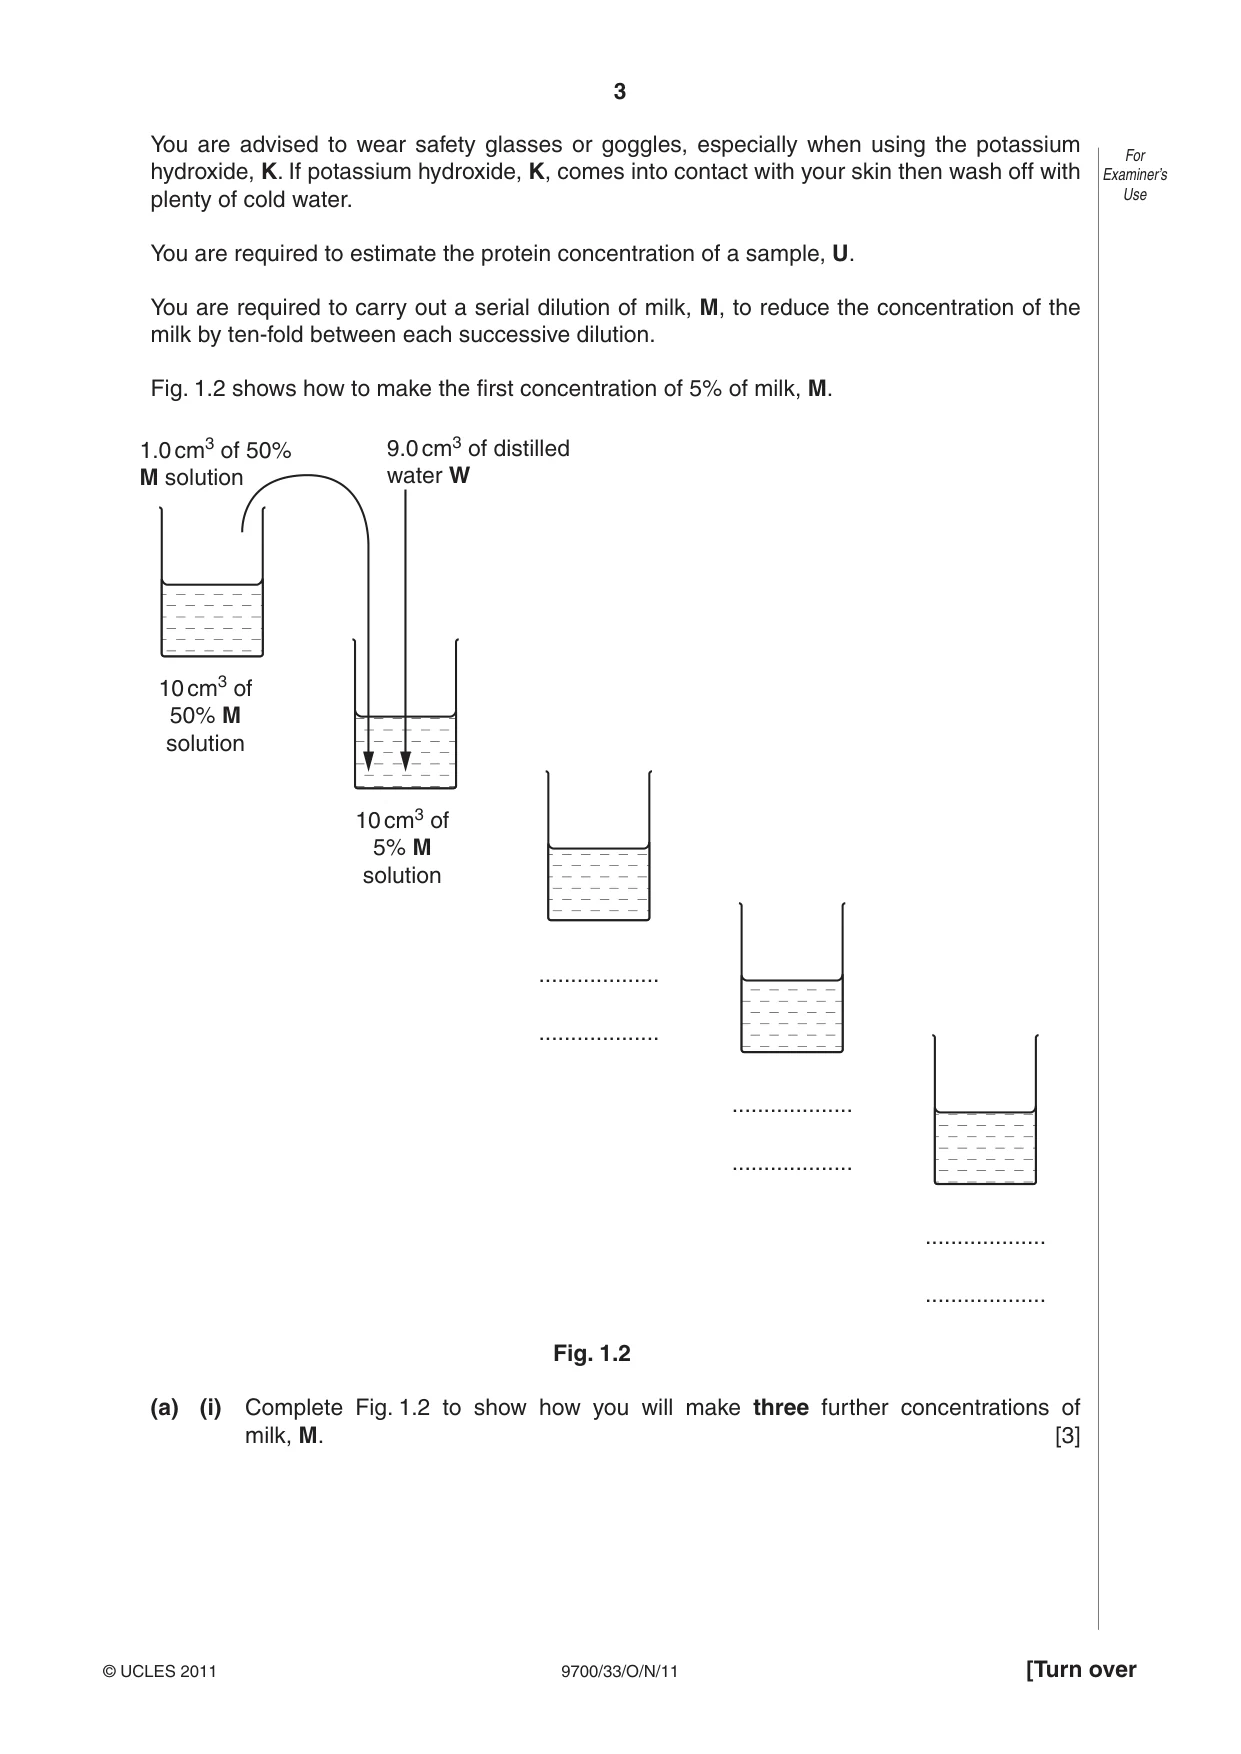
3 © UCLES 2011 [Turn over 9700/33/O/N/11 For Examiner’s Use You are advised to wear safety glasses or goggles, especially when using the potassium hydroxide, K. If potassium hydroxide, K, comes into contact with your skin then wash off with plenty of cold water. You are required to estimate the protein concentration of a sample, U. You are required to carry out a serial dilution of milk, M, to reduce the concentration of the milk by ten-fold between each successive dilution. Fig. 1.2 shows how to make the first concentration of 5% of milk, M. … … … … … … 1.0 cm3 of 50% M solution 10 cm3 of 50% M solution 10 cm3 of 5% M solution 9.0 cm3 of distilled water W Fig. 1.2 (a) (i) Complete Fig. 1.2 to show how you will make three further concentrations of milk, M. [3]
Question paper, page 4
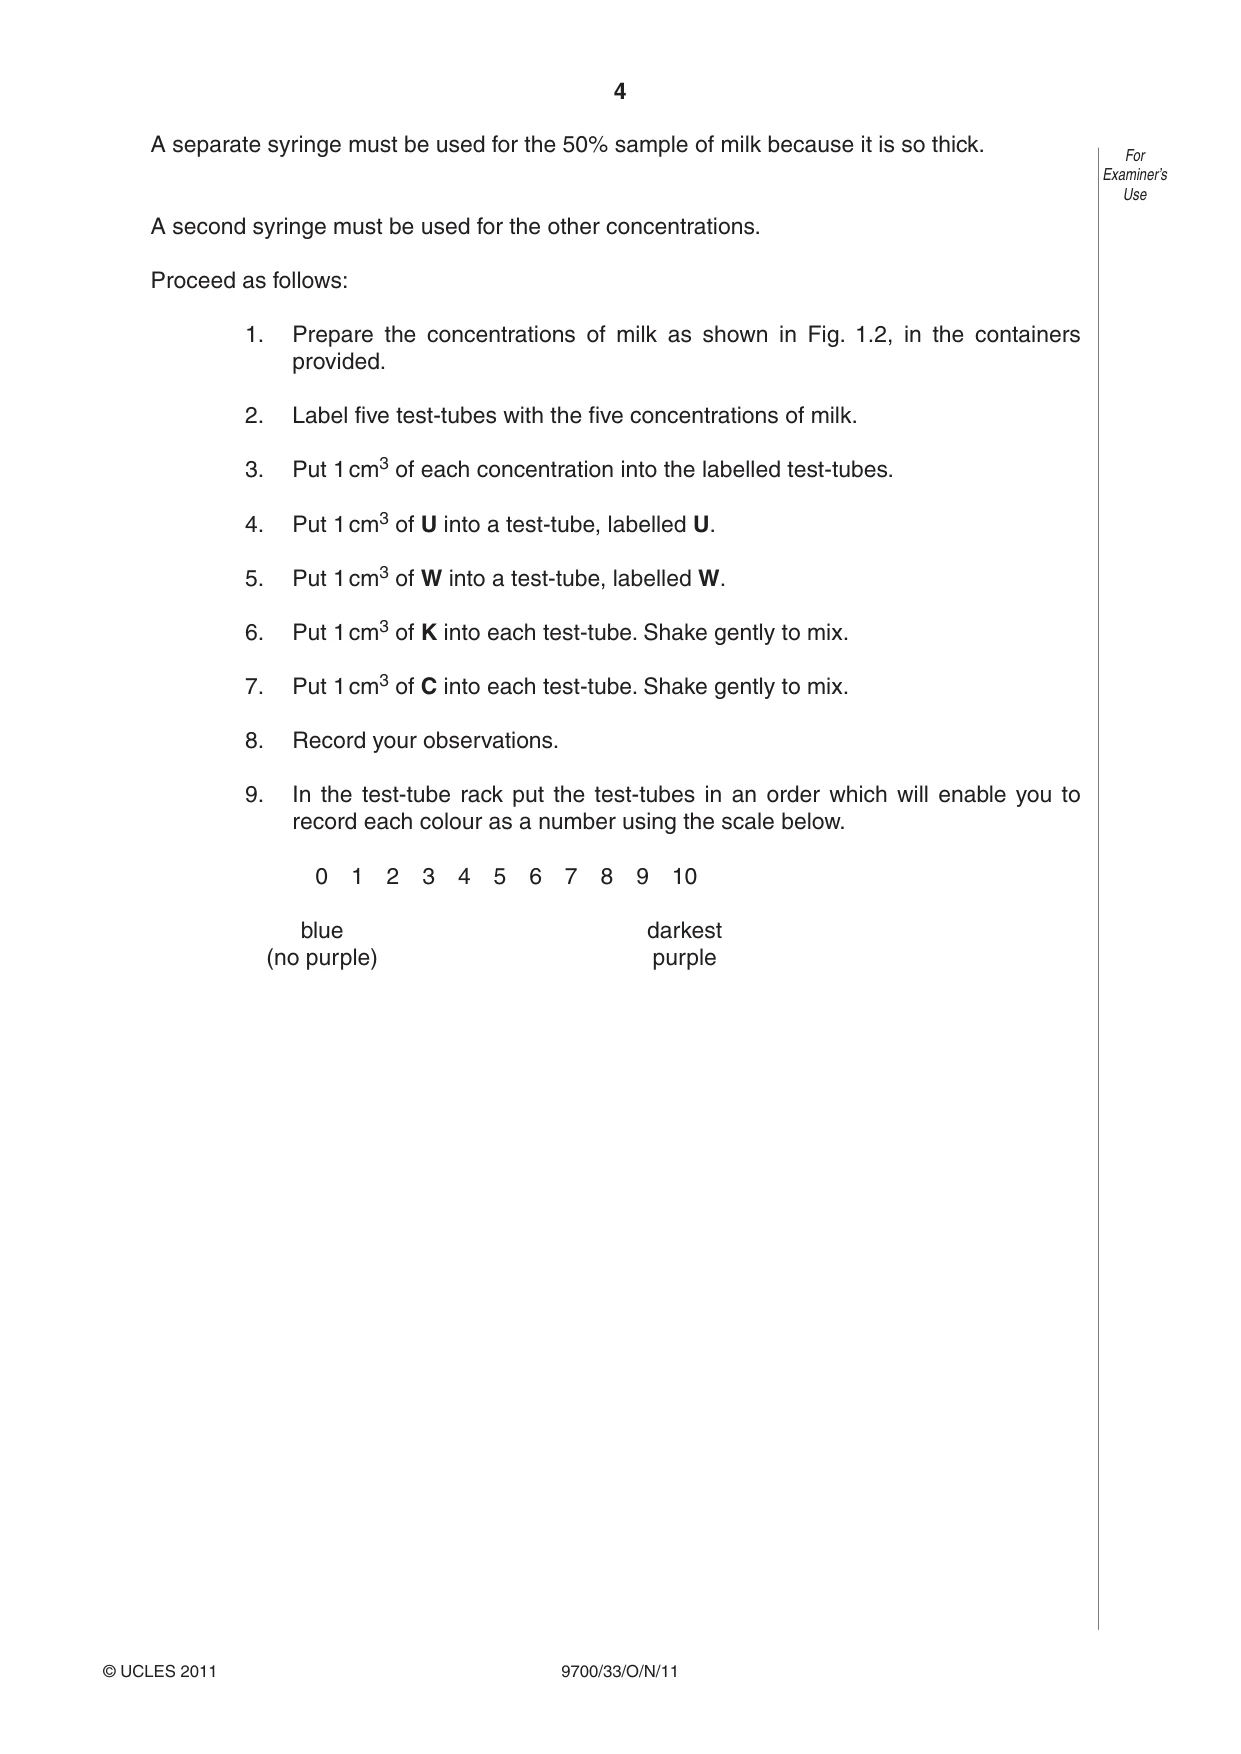
4 © UCLES 2011 9700/33/O/N/11 For Examiner’s Use A separate syringe must be used for the 50% sample of milk because it is so thick. A second syringe must be used for the other concentrations. Proceed as follows: 1. Prepare the concentrations of milk as shown in Fig. 1.2, in the containers provided. 2. Label five test-tubes with the five concentrations of milk. 3. Put 1 cm3 of each concentration into the labelled test-tubes. 4. Put 1 cm3 of U into a test-tube, labelled U. 5. Put 1 cm3 of W into a test-tube, labelled W. 6. Put 1 cm3 of K into each test-tube. Shake gently to mix. 7. Put 1 cm3 of C into each test-tube. Shake gently to mix. 8. Record your observations. 9. In the test-tube rack put the test-tubes in an order which will enable you to record each colour as a number using the scale below. 0 1 2 3 4 5 6 7 8 9 10 blue darkest (no purple) purple
Question paper, page 5
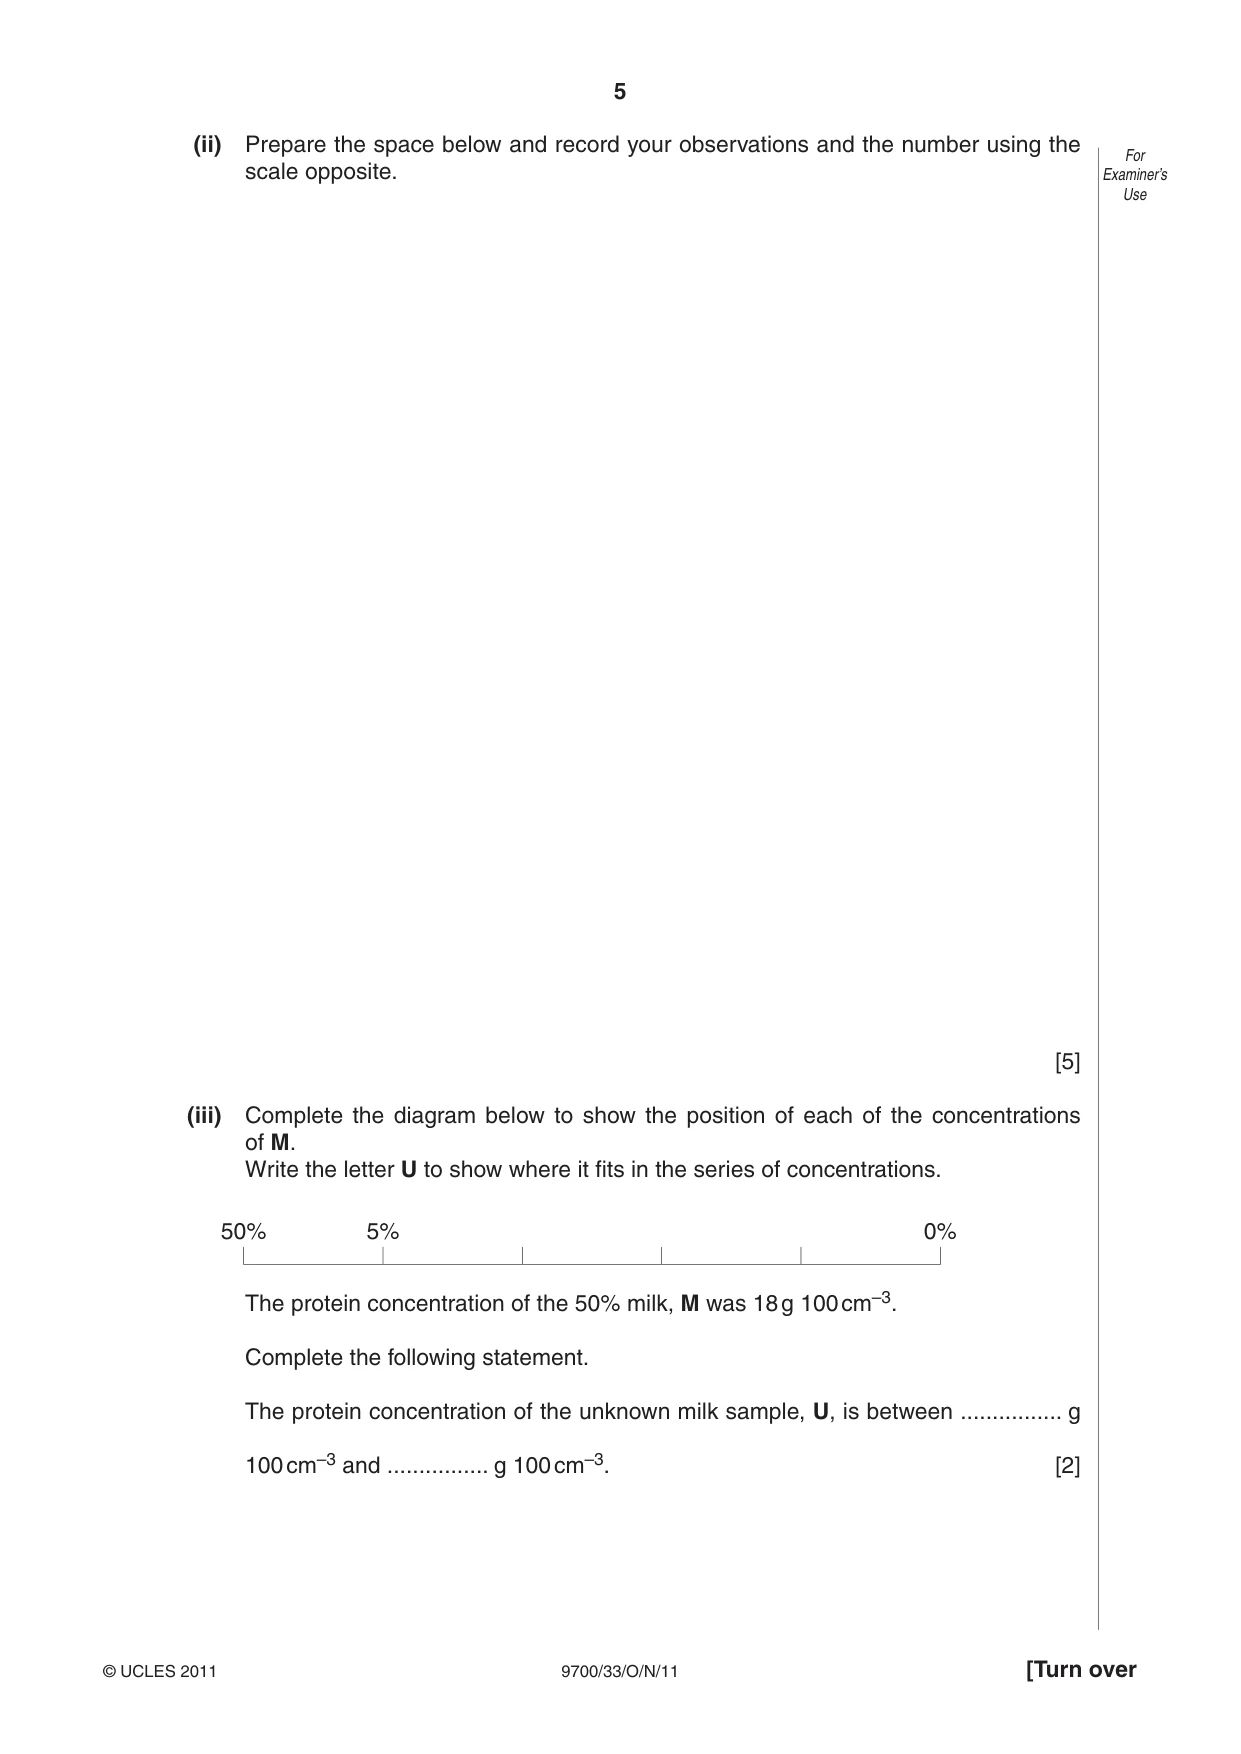
5 © UCLES 2011 [Turn over 9700/33/O/N/11 For Examiner’s Use (ii) Prepare the space below and record your observations and the number using the scale opposite. [5] (iii) Complete the diagram below to show the position of each of the concentrations of M. Write the letter U to show where it fits in the series of concentrations. 50% 5% 0% The protein concentration of the 50% milk, M was 18 g 100 cm–3. Complete the following statement. The protein concentration of the unknown milk sample, U, is between … g 100 cm–3 and … g 100 cm–3. [2]
Question paper, page 6
6 © UCLES 2011 9700/33/O/N/11 For Examiner’s Use (iv) Suggest how you would modify this investigation to obtain a more accurate estimate of the protein concentration in milk sample U. … … … … … … …[3]
Question paper, page 7
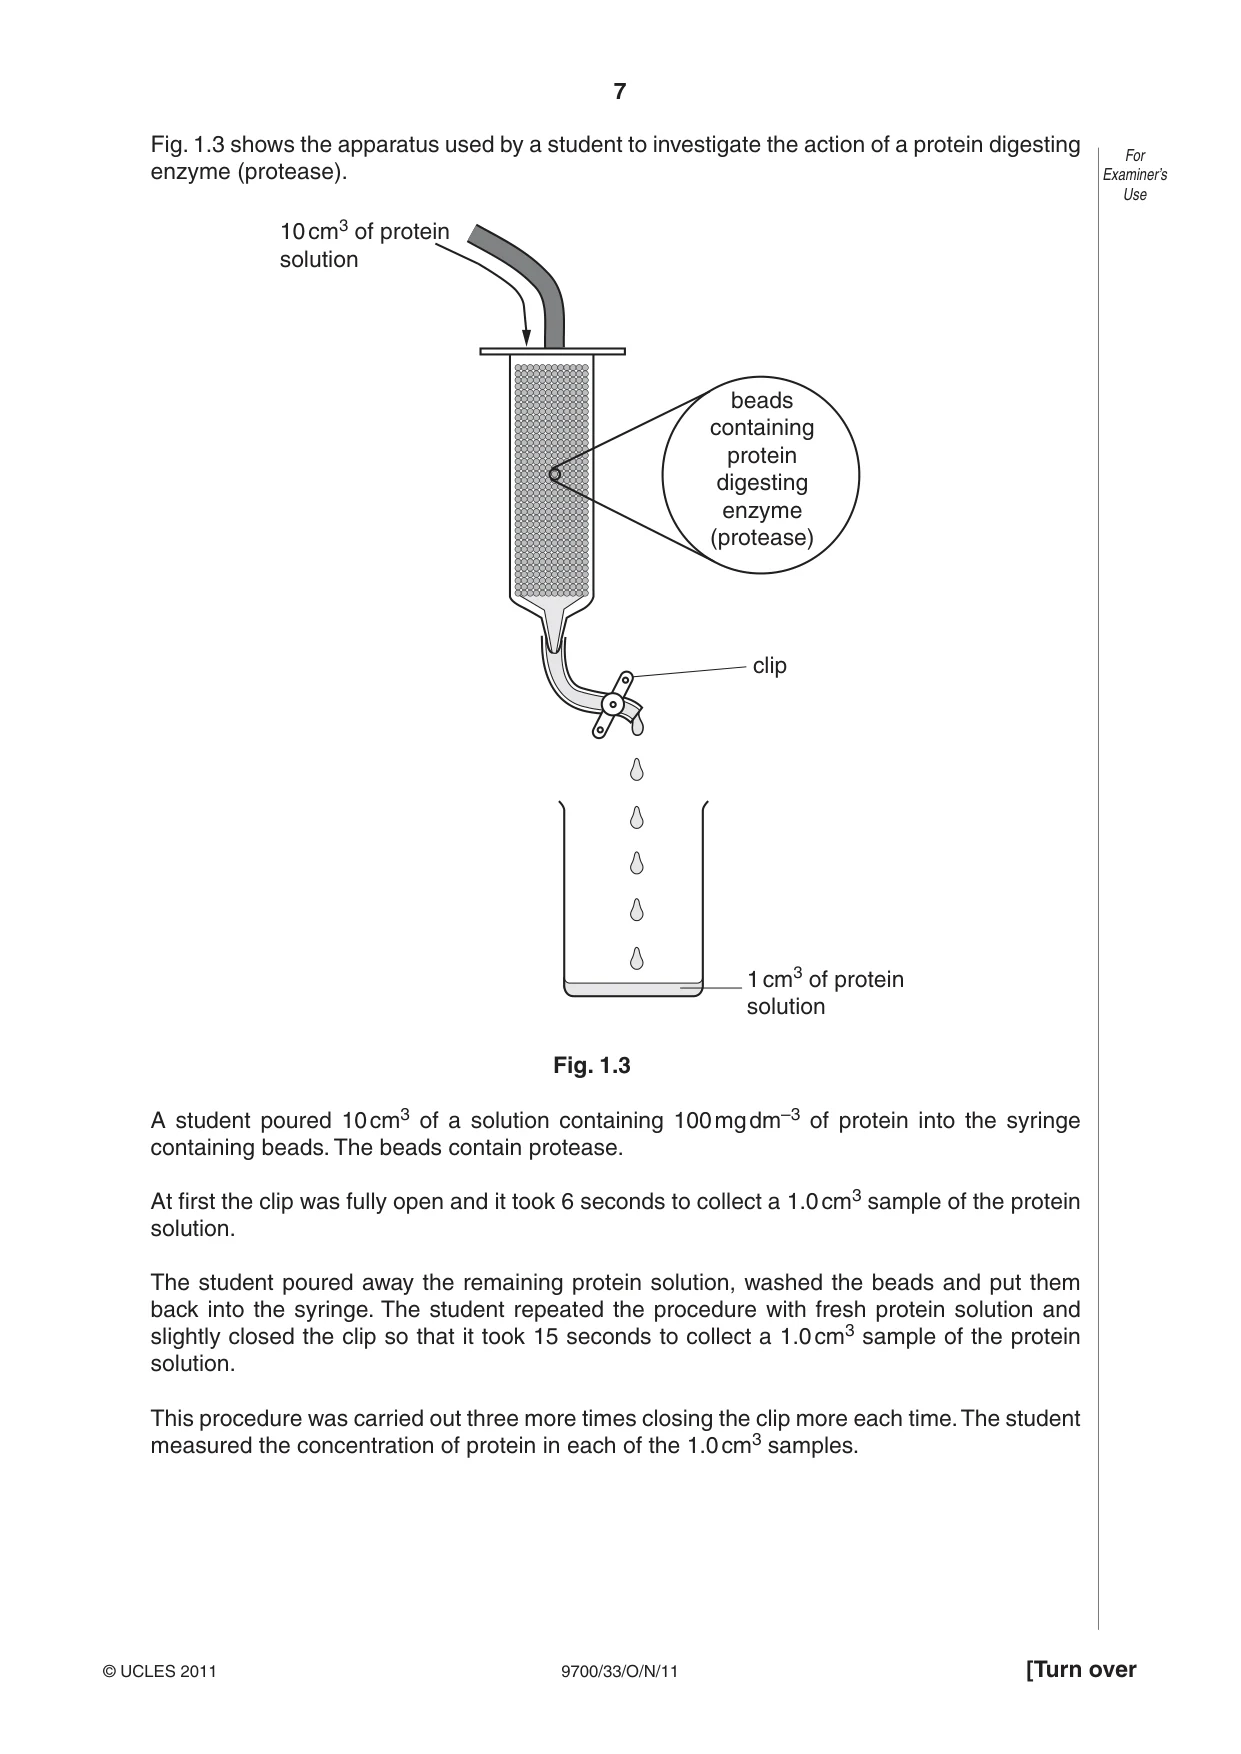
7 © UCLES 2011 [Turn over 9700/33/O/N/11 For Examiner’s Use Fig. 1.3 shows the apparatus used by a student to investigate the action of a protein digesting enzyme (protease). 1 cm3 of protein solution clip beads containing protein digesting enzyme (protease) 10 cm3 of protein solution Fig. 1.3 A student poured 10 cm3 of a solution containing 100 mg dm–3 of protein into the syringe containing beads. The beads contain protease. At first the clip was fully open and it took 6 seconds to collect a 1.0 cm3 sample of the protein solution. The student poured away the remaining protein solution, washed the beads and put them back into the syringe. The student repeated the procedure with fresh protein solution and slightly closed the clip so that it took 15 seconds to collect a 1.0 cm3 sample of the protein solution. This procedure was carried out three more times closing the clip more each time. The student measured the concentration of protein in each of the 1.0 cm3 samples.
Question paper, page 8
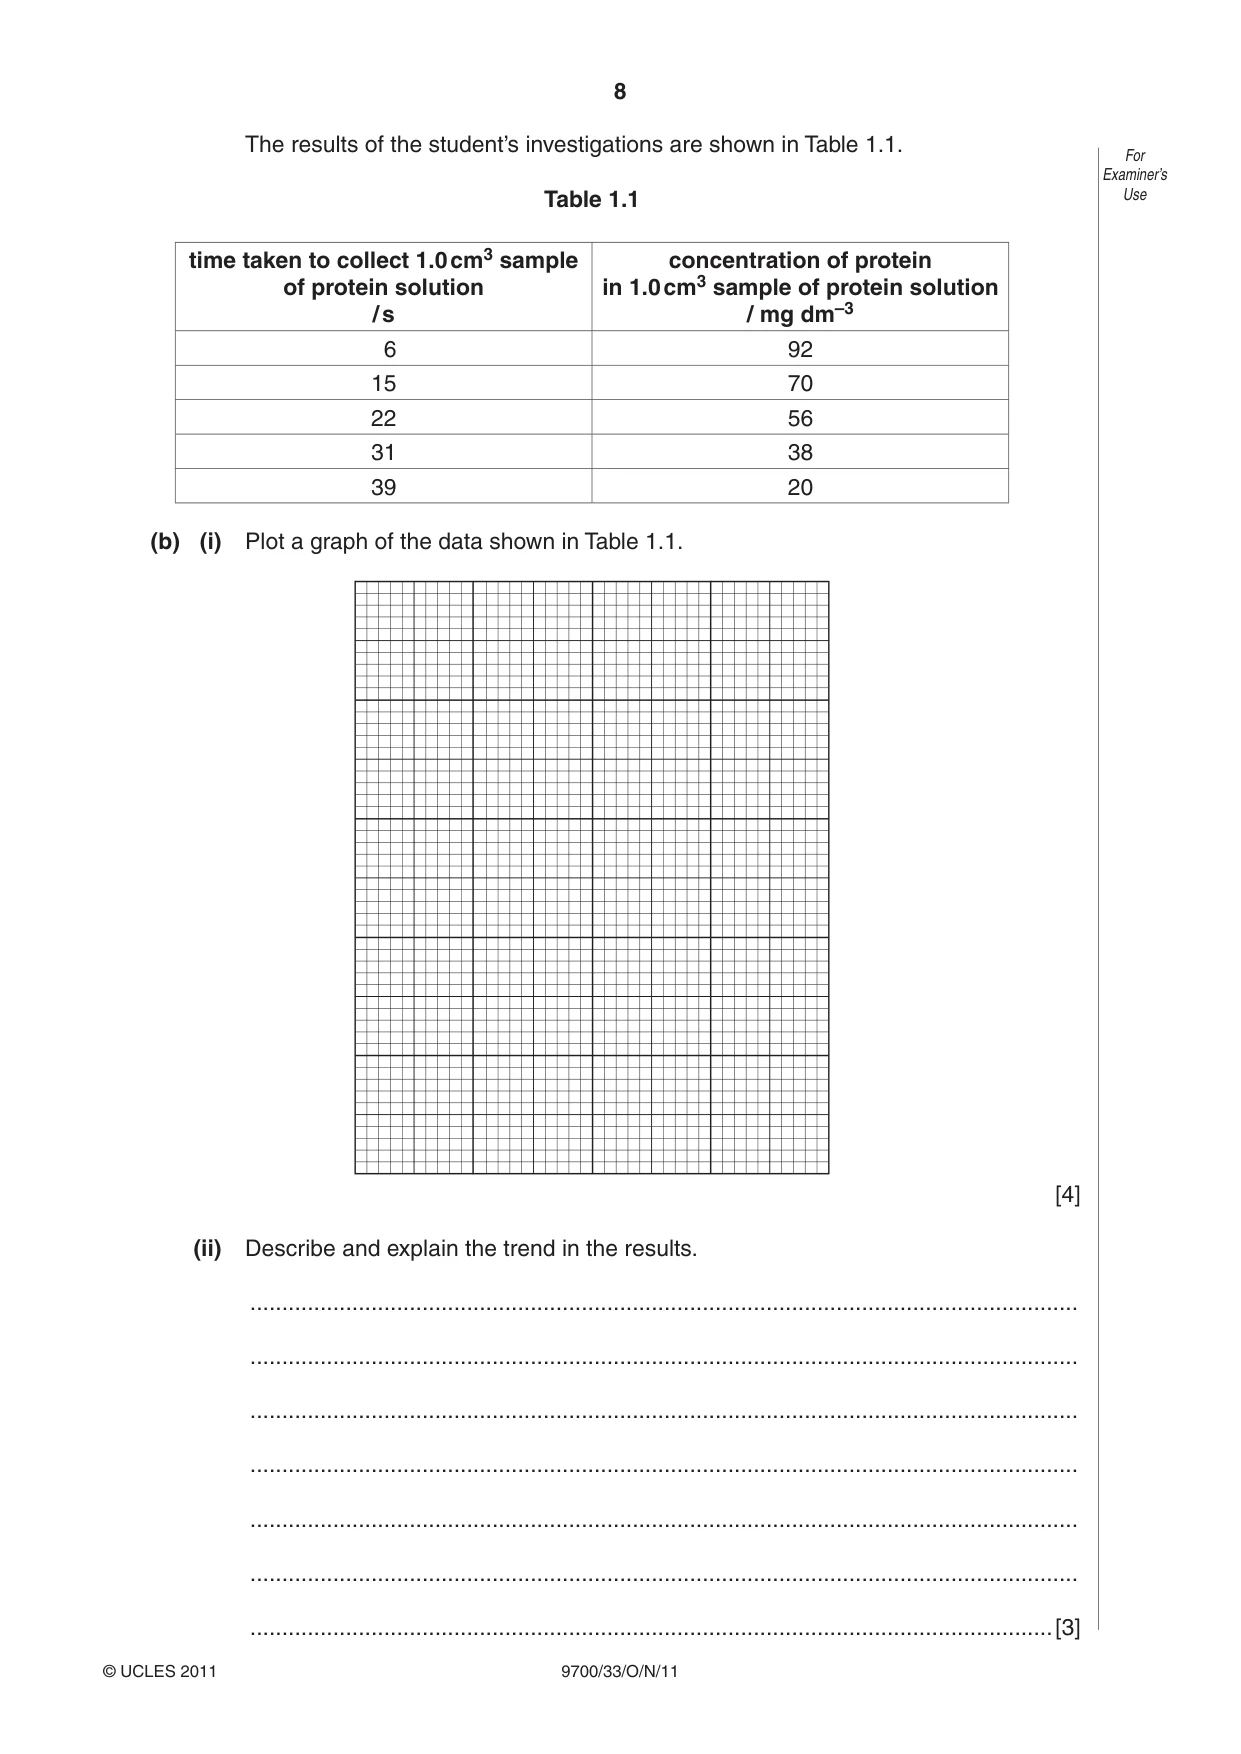
8 © UCLES 2011 9700/33/O/N/11 For Examiner’s Use The results of the student’s investigations are shown in Table 1.1. Table 1.1 time taken to collect 1.0 cm3 sample of protein solution / s concentration of protein in 1.0 cm3 sample of protein solution / mg dm–3 6 92 15 70 22 56 31 38 39 20 (b) (i) Plot a graph of the data shown in Table 1.1. [4] (ii) Describe and explain the trend in the results. … … … … … … …[3]
Question paper, page 9
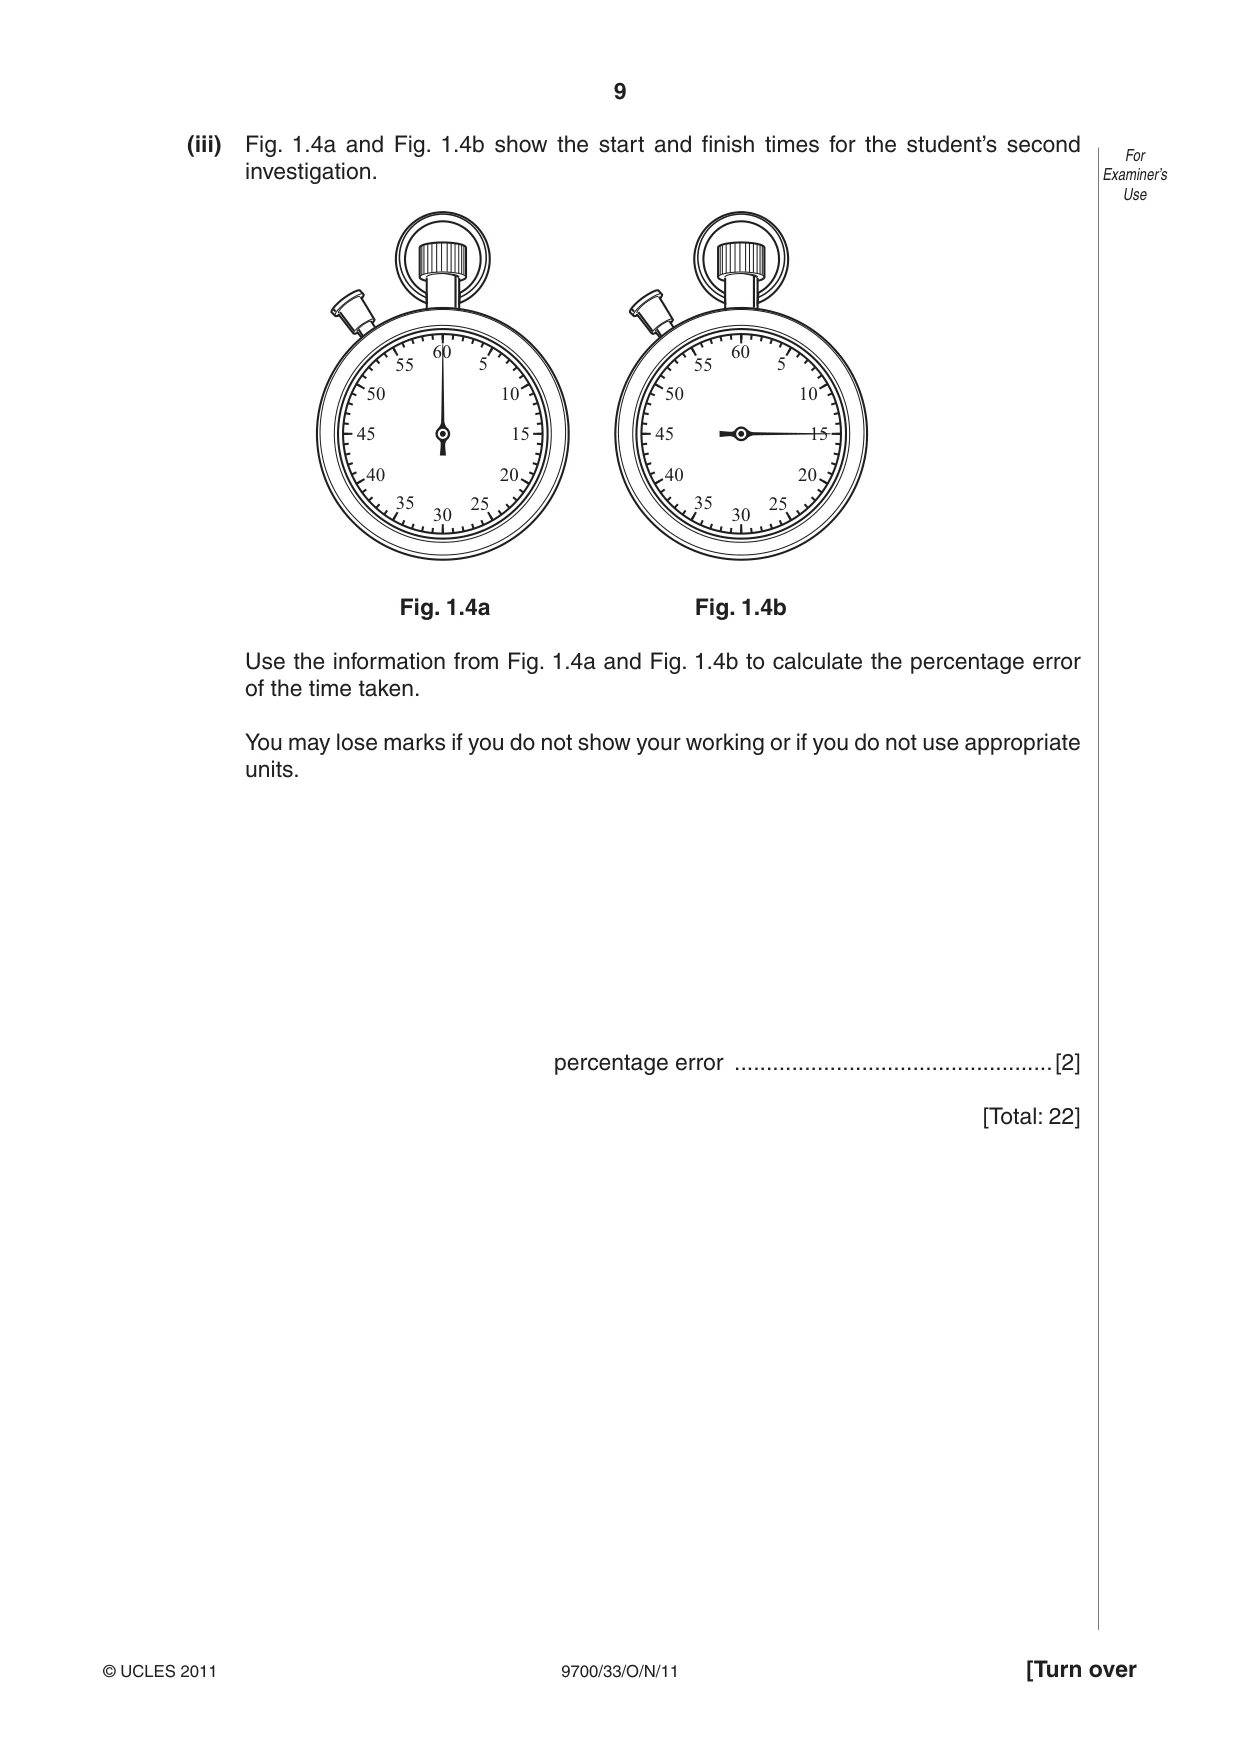
9 © UCLES 2011 [Turn over 9700/33/O/N/11 For Examiner’s Use (iii) Fig. 1.4a and Fig. 1.4b show the start and finish times for the student’s second investigation. 60 5 10 15 20 25 30 35 40 45 50 55 60 5 10 15 20 25 30 35 40 45 50 55 Fig. 1.4a Fig. 1.4b Use the information from Fig. 1.4a and Fig. 1.4b to calculate the percentage error of the time taken. You may lose marks if you do not show your working or if you do not use appropriate units. percentage error …[2] [Total: 22]
Question paper, page 10
10 9700/33/O/N/11 © UCLES 2011 BLANK PAGE Question 2 starts on page 11
Question paper, page 11
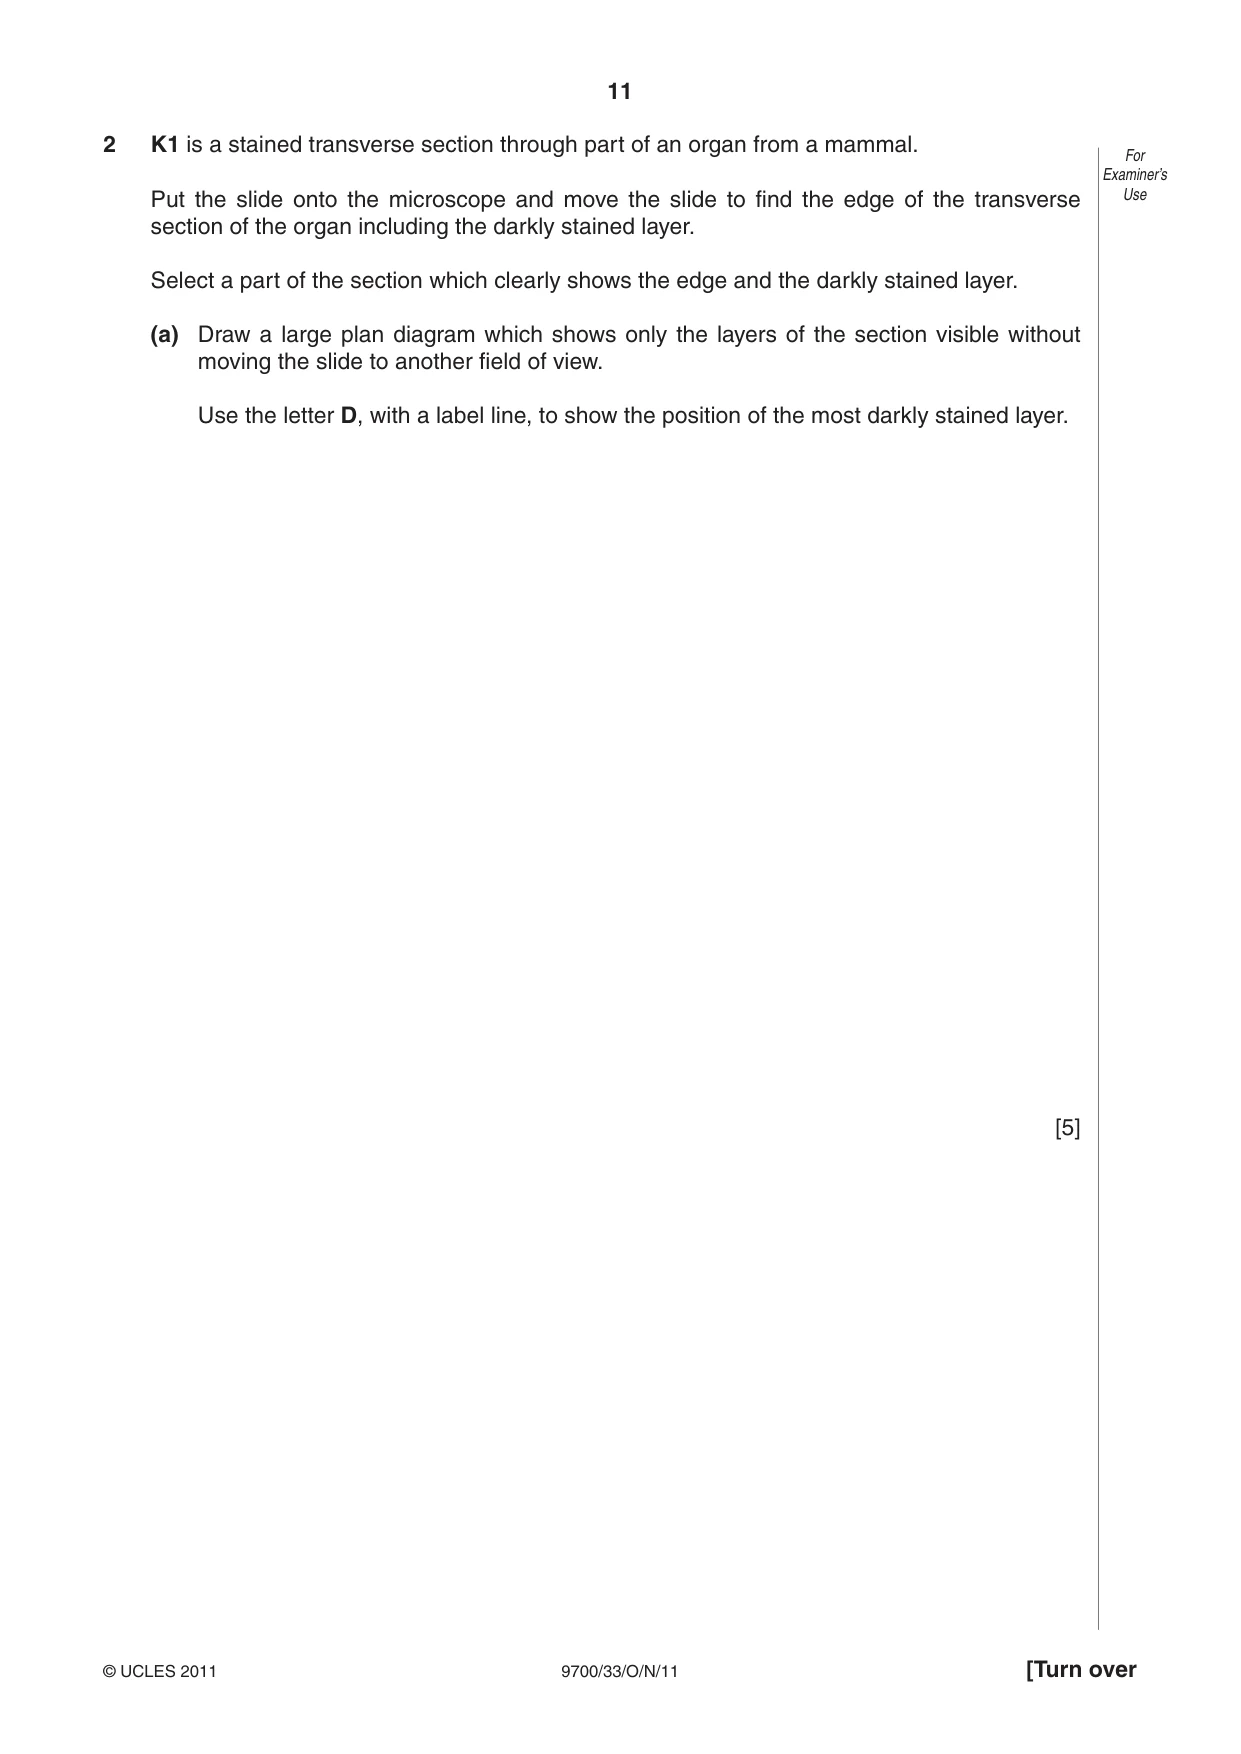
11 © UCLES 2011 [Turn over 9700/33/O/N/11 For Examiner’s Use 2 K1 is a stained transverse section through part of an organ from a mammal. Put the slide onto the microscope and move the slide to find the edge of the transverse section of the organ including the darkly stained layer. Select a part of the section which clearly shows the edge and the darkly stained layer. (a) Draw a large plan diagram which shows only the layers of the section visible without moving the slide to another field of view. Use the letter D, with a label line, to show the position of the most darkly stained layer. [5]
Question paper, page 12
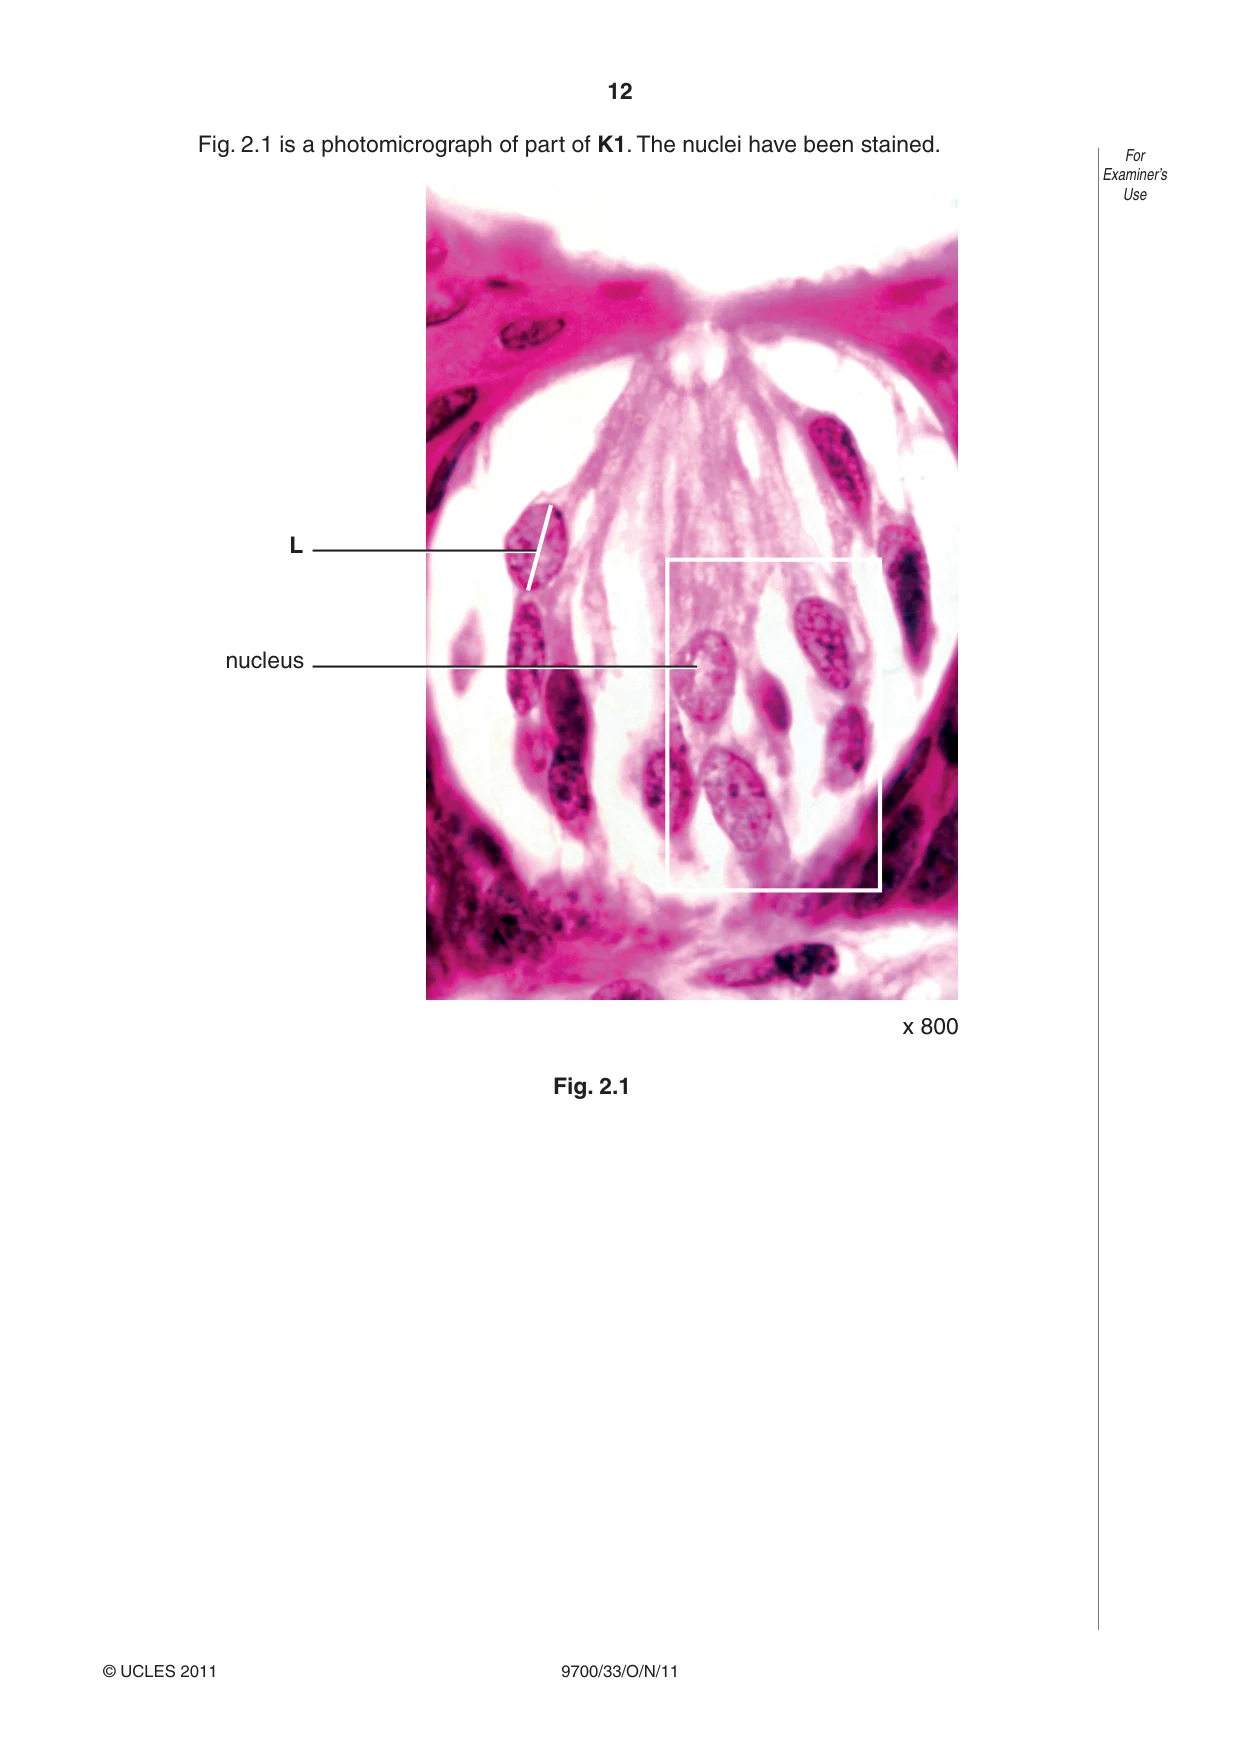
12 © UCLES 2011 9700/33/O/N/11 For Examiner’s Use Fig. 2.1 is a photomicrograph of part of K1. The nuclei have been stained. L nucleus x 800 Fig. 2.1
Question paper, page 13
13 © UCLES 2011 [Turn over 9700/33/O/N/11 For Examiner’s Use (b) (i) Make a large drawing of all the whole nuclei shown within the area indicated on Fig. 2.1. Label one nucleolus. [4] (ii) Use the magnification to calculate the actual length of the line L in μm. You may lose marks if you do not show your working or if you do not use appropriate units. … μm [3]
Question paper, page 14
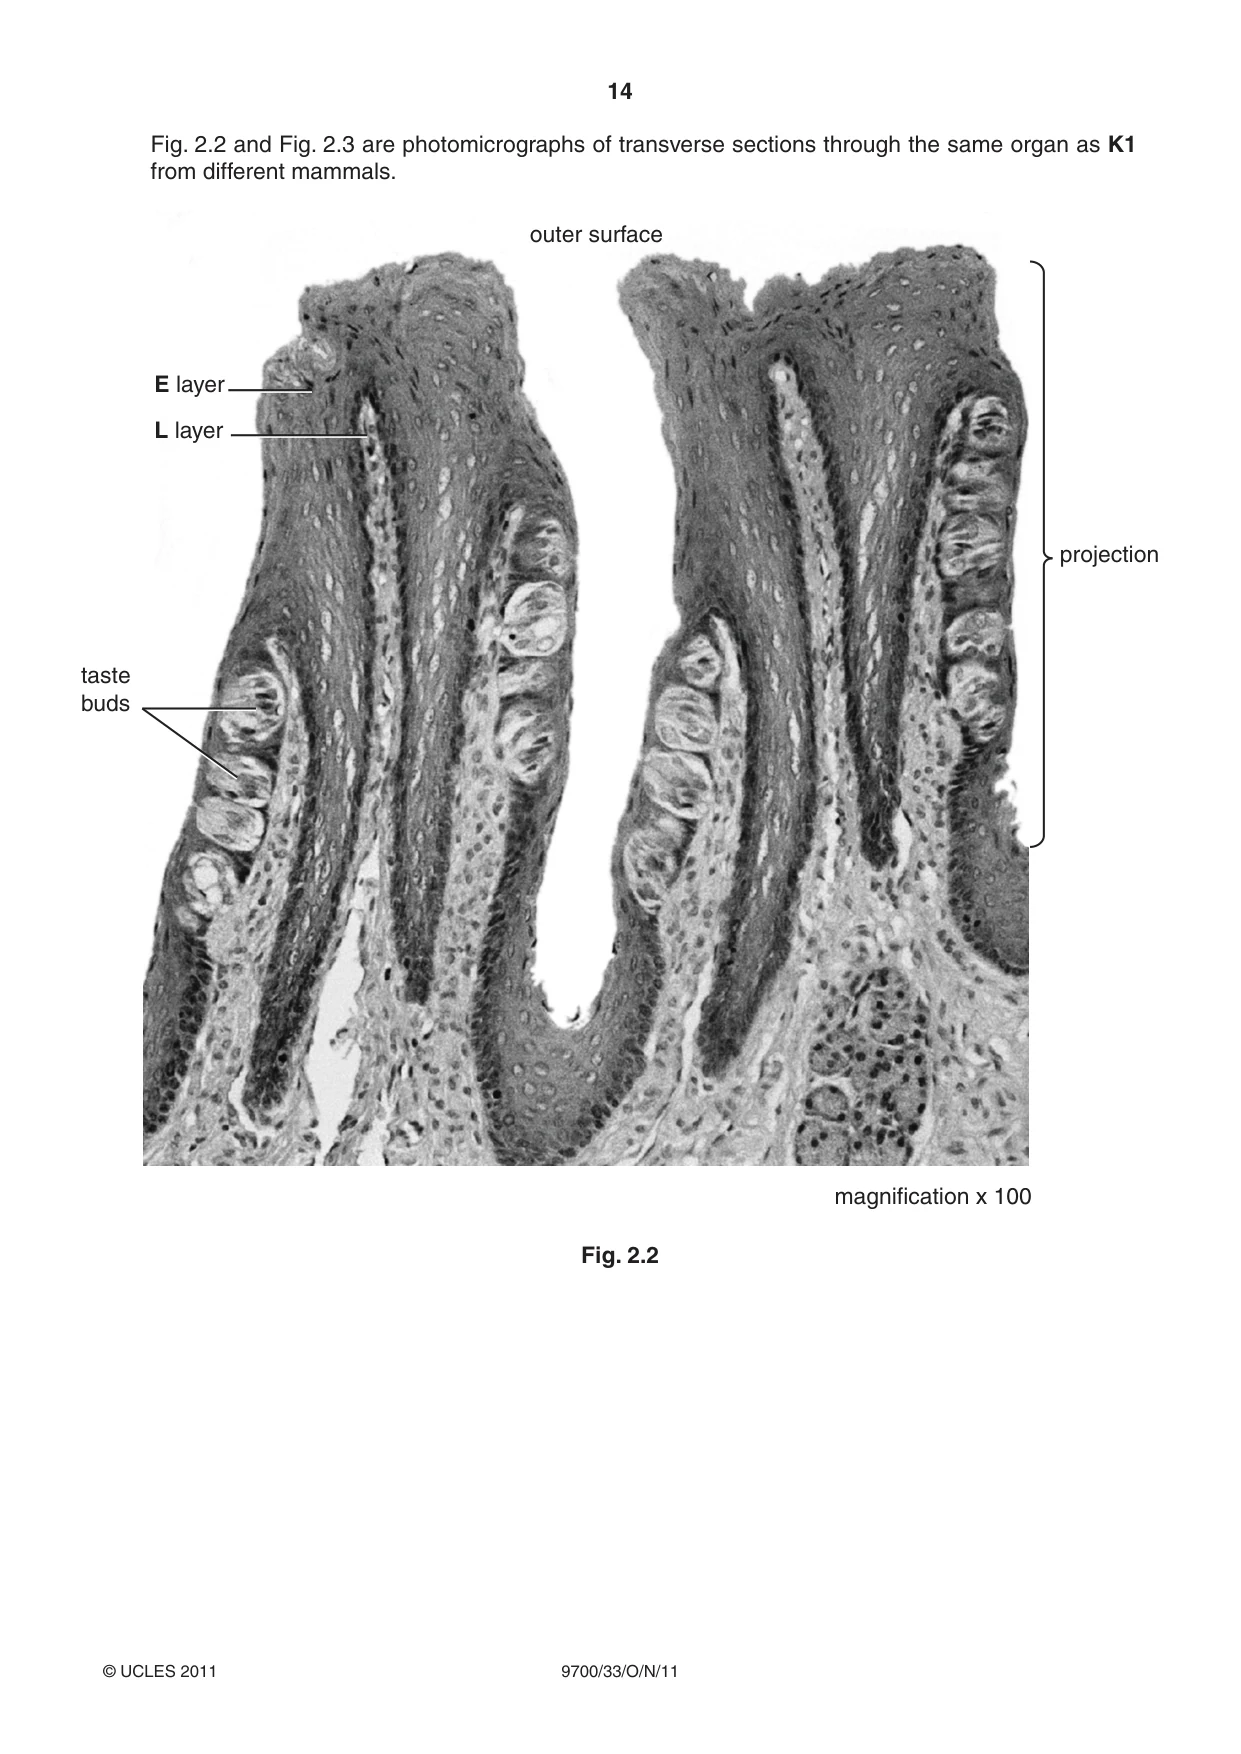
14 9700/33/O/N/11 © UCLES 2011 Fig. 2.2 and Fig. 2.3 are photomicrographs of transverse sections through the same organ as K1 from different mammals. outer surface projection taste buds L layer E layer magnification x 100 Fig. 2.2
Question paper, page 15
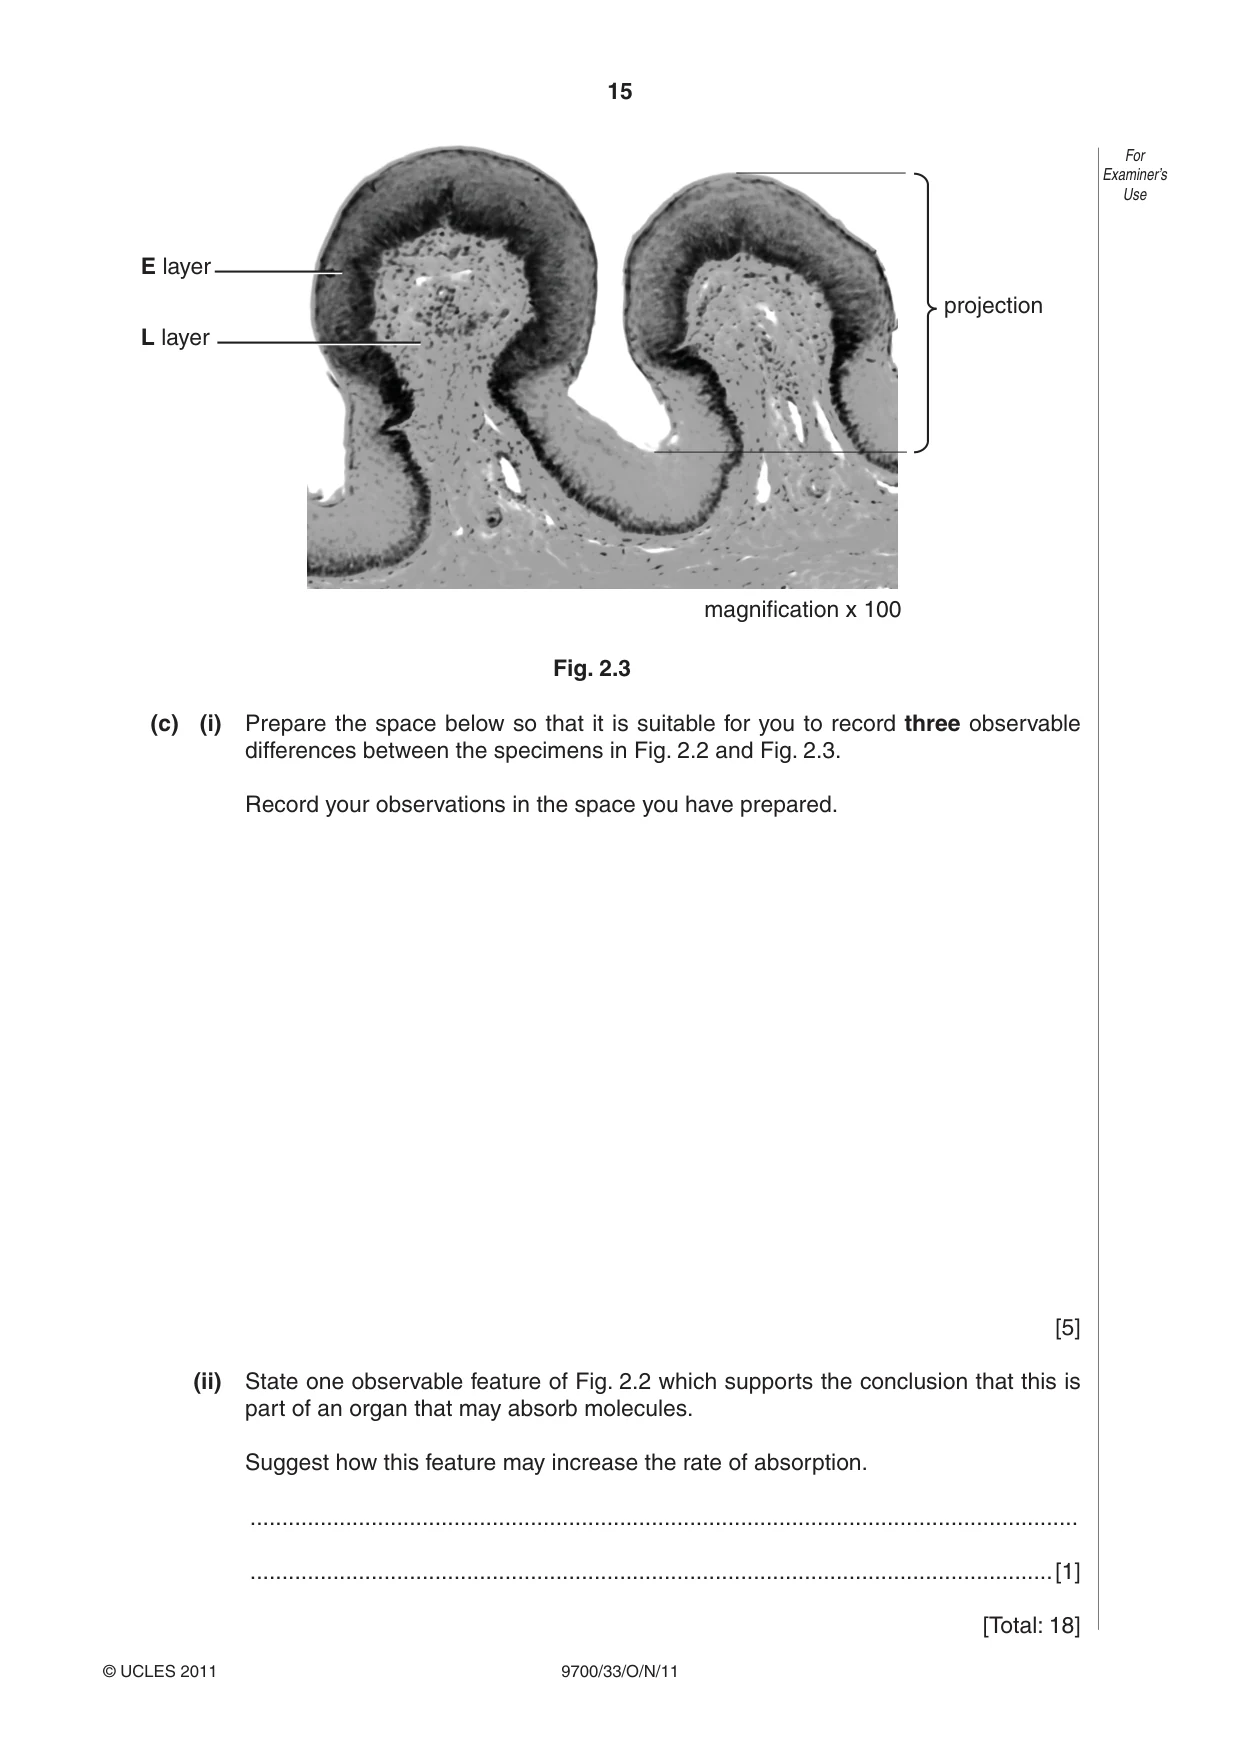
15 © UCLES 2011 9700/33/O/N/11 For Examiner’s Use projection L layer E layer magnification x 100 Fig. 2.3 (c) (i) Prepare the space below so that it is suitable for you to record three observable differences between the specimens in Fig. 2.2 and Fig. 2.3. Record your observations in the space you have prepared. [5] (ii) State one observable feature of Fig. 2.2 which supports the conclusion that this is part of an organ that may absorb molecules. Suggest how this feature may increase the rate of absorption. … …[1] [Total: 18]
Question paper, page 16
16 9700/33/O/N/11 © UCLES 2011 BLANK PAGE Copyright Acknowledgements: Question 2, Fig. 2.1 BIOPHOTO ASSOCIATES/SCIENCE PHOTO LIBRARY Question 2, Fig. 2.1 STEVE GSCHMEISSNER/SCIENCE PHOTO LIBRARY Question 2, Fig. 2.1 DR KEITH WHEELER/SCIENCE PHOTO LIBRARY Permission to reproduce items where third-party owned material protected by copyright is included has been sought and cleared where possible. Every reasonable effort has been made by the publisher (UCLES) to trace copyright holders, but if any items requiring clearance have unwittingly been included, the publisher will be pleased to make amends at the earliest possible opportunity. University of Cambridge International Examinations is part of the Cambridge Assessment Group. Cambridge Assessment is the brand name of University of Cambridge Local Examinations Syndicate (UCLES), which is itself a department of the University of Cambridge.
Mark scheme, page 1
UNIVERSITY OF CAMBRIDGE INTERNATIONAL EXAMINATIONS GCE Advanced Subsidiary Level and GCE Advanced Level MARK SCHEME for the October/November 2011 question paper for the guidance of teachers 9700 BIOLOGY 9700/33 Paper 3 (Advanced Practical Skills 1), maximum raw mark 40 This mark scheme is published as an aid to teachers and candidates, to indicate the requirements of the examination. It shows the basis on which Examiners were instructed to award marks. It does not indicate the details of the discussions that took place at an Examiners’ meeting before marking began, which would have considered the acceptability of alternative answers. Mark schemes must be read in conjunction with the question papers and the report on the examination. • Cambridge will not enter into discussions or correspondence in connection with these mark schemes. Cambridge is publishing the mark schemes for the October/November 2011 question papers for most IGCSE, GCE Advanced Level and Advanced Subsidiary Level syllabuses and some Ordinary Level syllabuses.
Mark scheme, page 2
Page 2 Mark Scheme: Teachers’ version Syllabus Paper GCE AS/A LEVEL – October/November 2011 9700 33 © University of Cambridge International Examinations 2011 Mark scheme abbreviations: ; separates marking points / alternative answers for the same point R reject A accept (for answers correctly cued by the question, or by extra guidance) AW alternative wording (where responses vary more than usual) underline actual word given must be used by candidate (grammatical variants excepted) max indicates the maximum number of marks that can be given ora or reverse argument mp marking point (with relevant number) ecf error carried forward I ignore ACE Analysis, Conclusions and Evaluation (skills) MMO Manipulations, Measurement and Observation (skills) PDO Presentation of Data and Observations (skills)
Mark scheme, page 3
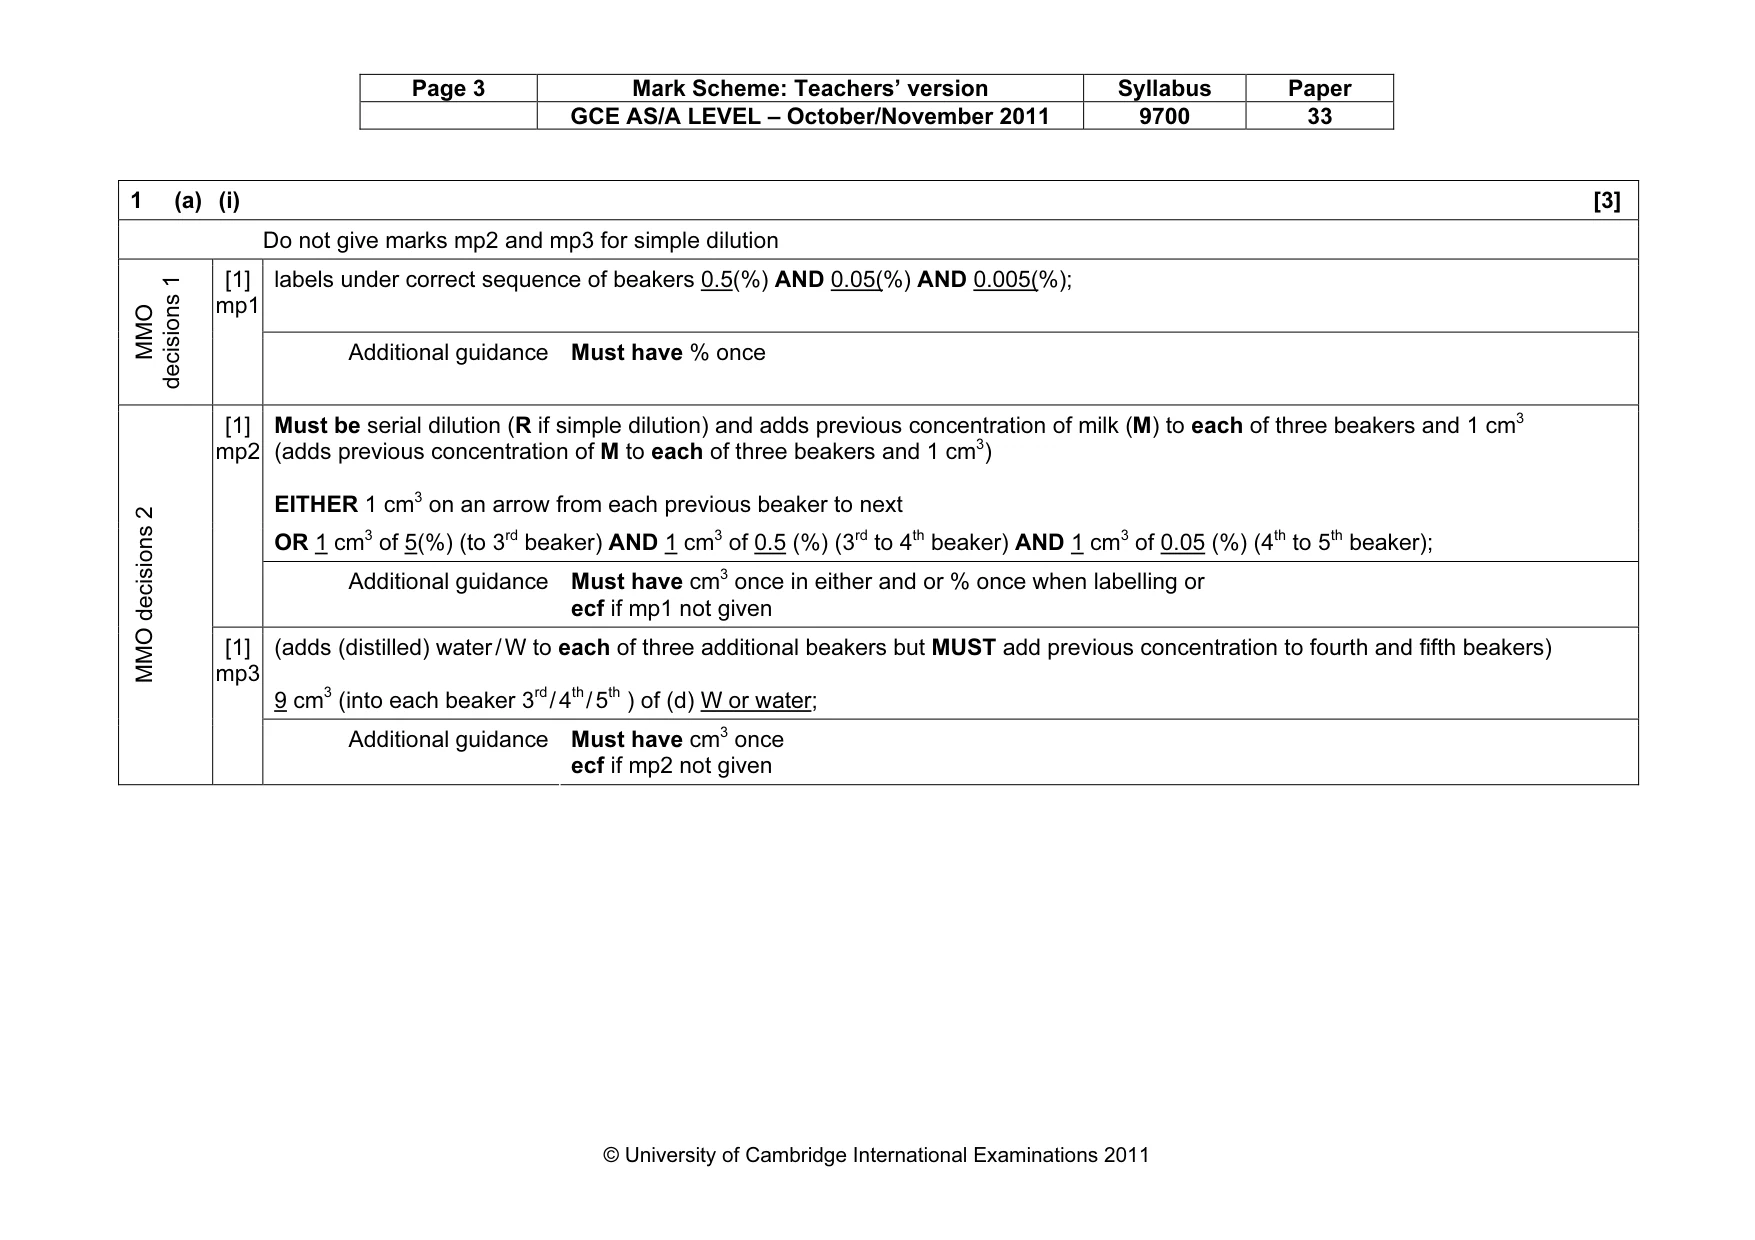
Page 3 Mark Scheme: Teachers’ version Syllabus Paper GCE AS/A LEVEL – October/November 2011 9700 33 © University of Cambridge International Examinations 2011 1 (a) (i) [3] Do not give marks mp2 and mp3 for simple dilution labels under correct sequence of beakers 0.5(%) AND 0.05(%) AND 0.005(%); MMO decisions 1 [1] mp1 Additional guidance Must have % once Must be serial dilution (R if simple dilution) and adds previous concentration of milk (M) to each of three beakers and 1 cm3 (adds previous concentration of M to each of three beakers and 1 cm3) EITHER 1 cm3 on an arrow from each previous beaker to next OR 1 cm3 of 5(%) (to 3rd beaker) AND 1 cm3 of 0.5 (%) (3rd to 4th beaker) AND 1 cm3 of 0.05 (%) (4th to 5th beaker); [1] mp2 Additional guidance Must have cm3 once in either and or % once when labelling or ecf if mp1 not given (adds (distilled) water / W to each of three additional beakers but MUST add previous concentration to fourth and fifth beakers) 9 cm3 (into each beaker 3rd / 4th / 5th ) of (d) W or water; MMO decisions 2 [1] mp3 Additional guidance Must have cm3 once ecf if mp2 not given
Mark scheme, page 4
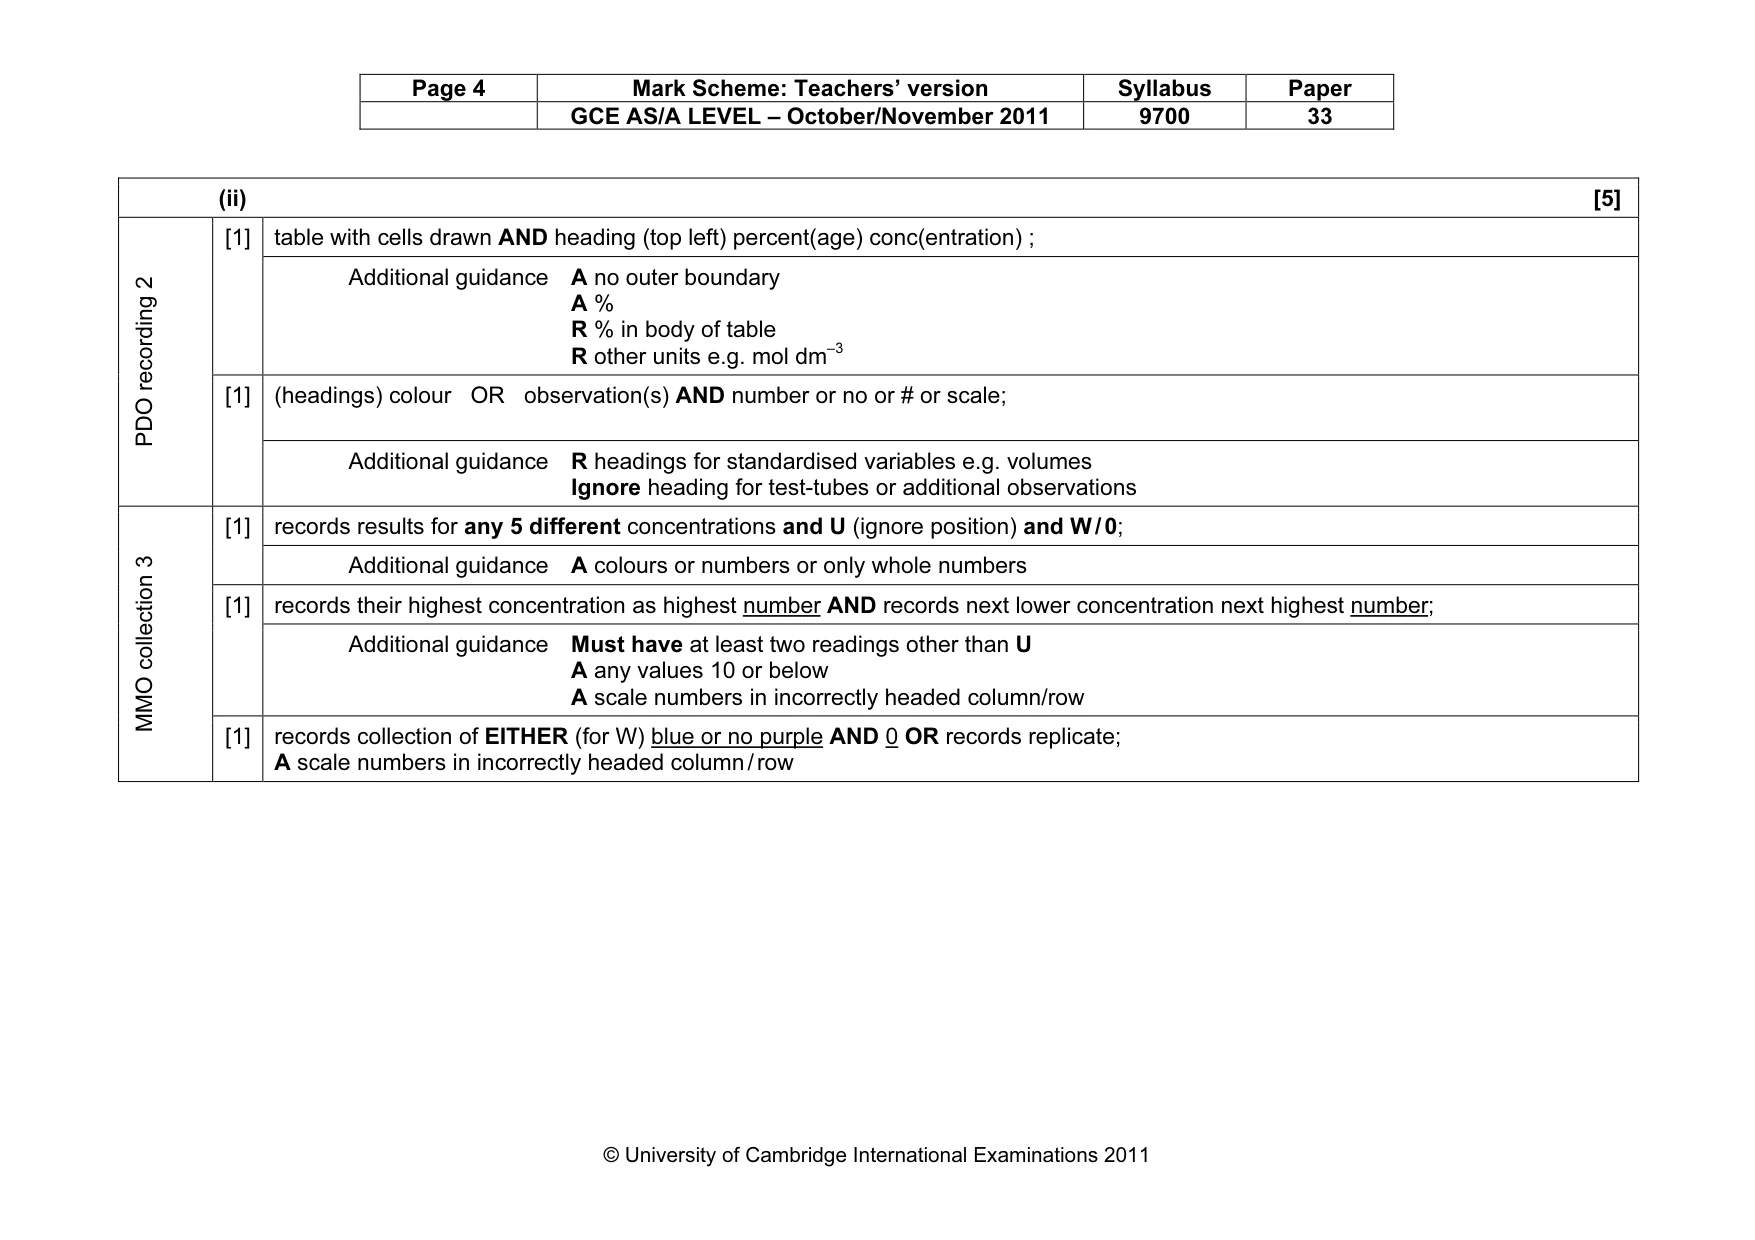
Page 4 Mark Scheme: Teachers’ version Syllabus Paper GCE AS/A LEVEL – October/November 2011 9700 33 © University of Cambridge International Examinations 2011 (ii) [5] table with cells drawn AND heading (top left) percent(age) conc(entration) ; [1] Additional guidance A no outer boundary A % R % in body of table R other units e.g. mol dm–3 (headings) colour OR observation(s) AND number or no or # or scale; PDO recording 2 [1] Additional guidance R headings for standardised variables e.g. volumes Ignore heading for test-tubes or additional observations records results for any 5 different concentrations and U (ignore position) and W / 0; [1] Additional guidance A colours or numbers or only whole numbers records their highest concentration as highest number AND records next lower concentration next highest number; [1] Additional guidance Must have at least two readings other than U A any values 10 or below A scale numbers in incorrectly headed column/row MMO collection 3 [1] records collection of EITHER (for W) blue or no purple AND 0 OR records replicate; A scale numbers in incorrectly headed column / row
Mark scheme, page 5
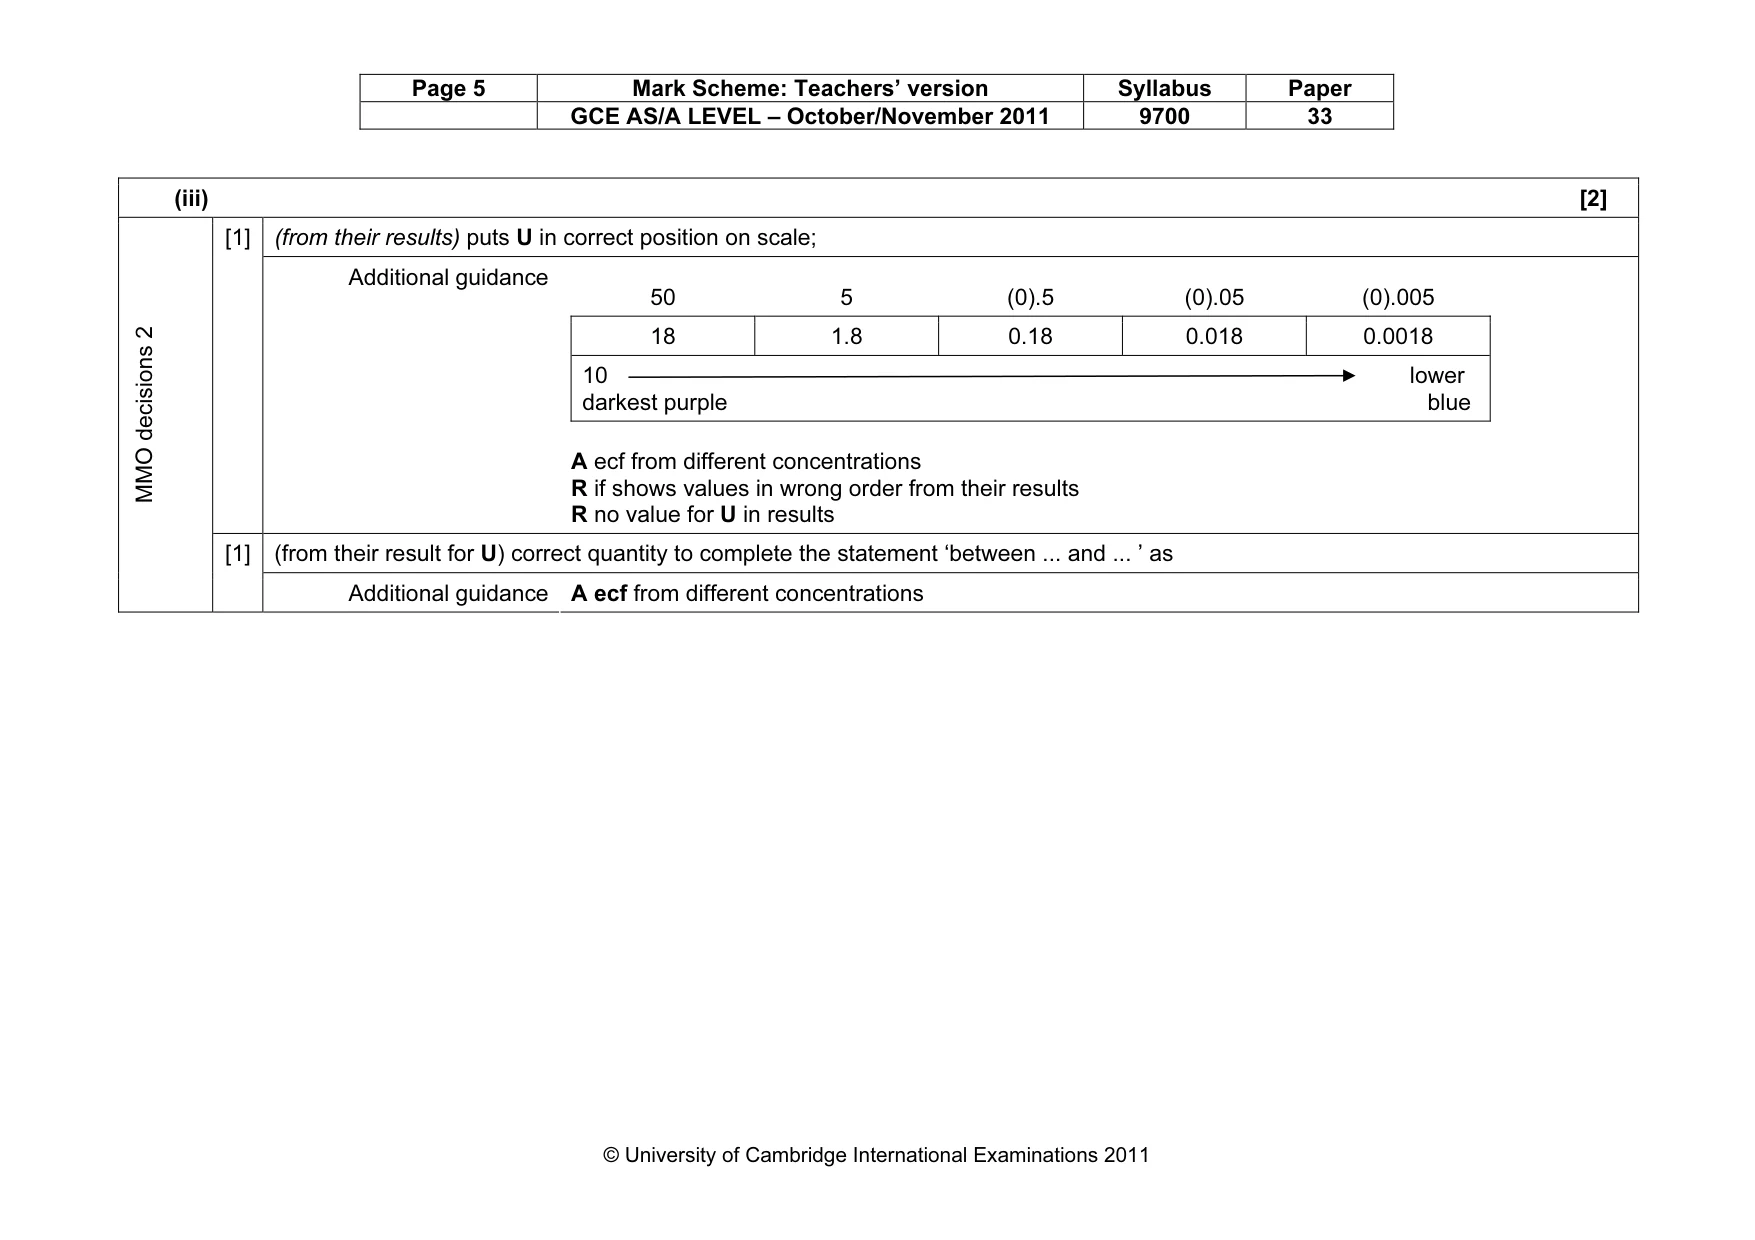
Page 5 Mark Scheme: Teachers’ version Syllabus Paper GCE AS/A LEVEL – October/November 2011 9700 33 © University of Cambridge International Examinations 2011 (iii) [2] (from their results) puts U in correct position on scale; [1] Additional guidance 50 5 (0).5 (0).05 (0).005 18 1.8 0.18 0.018 0.0018 10 lower darkest purple blue A ecf from different concentrations R if shows values in wrong order from their results R no value for U in results (from their result for U) correct quantity to complete the statement ‘between ... and ... ’ as MMO decisions 2 [1] Additional guidance A ecf from different concentrations
Mark scheme, page 6
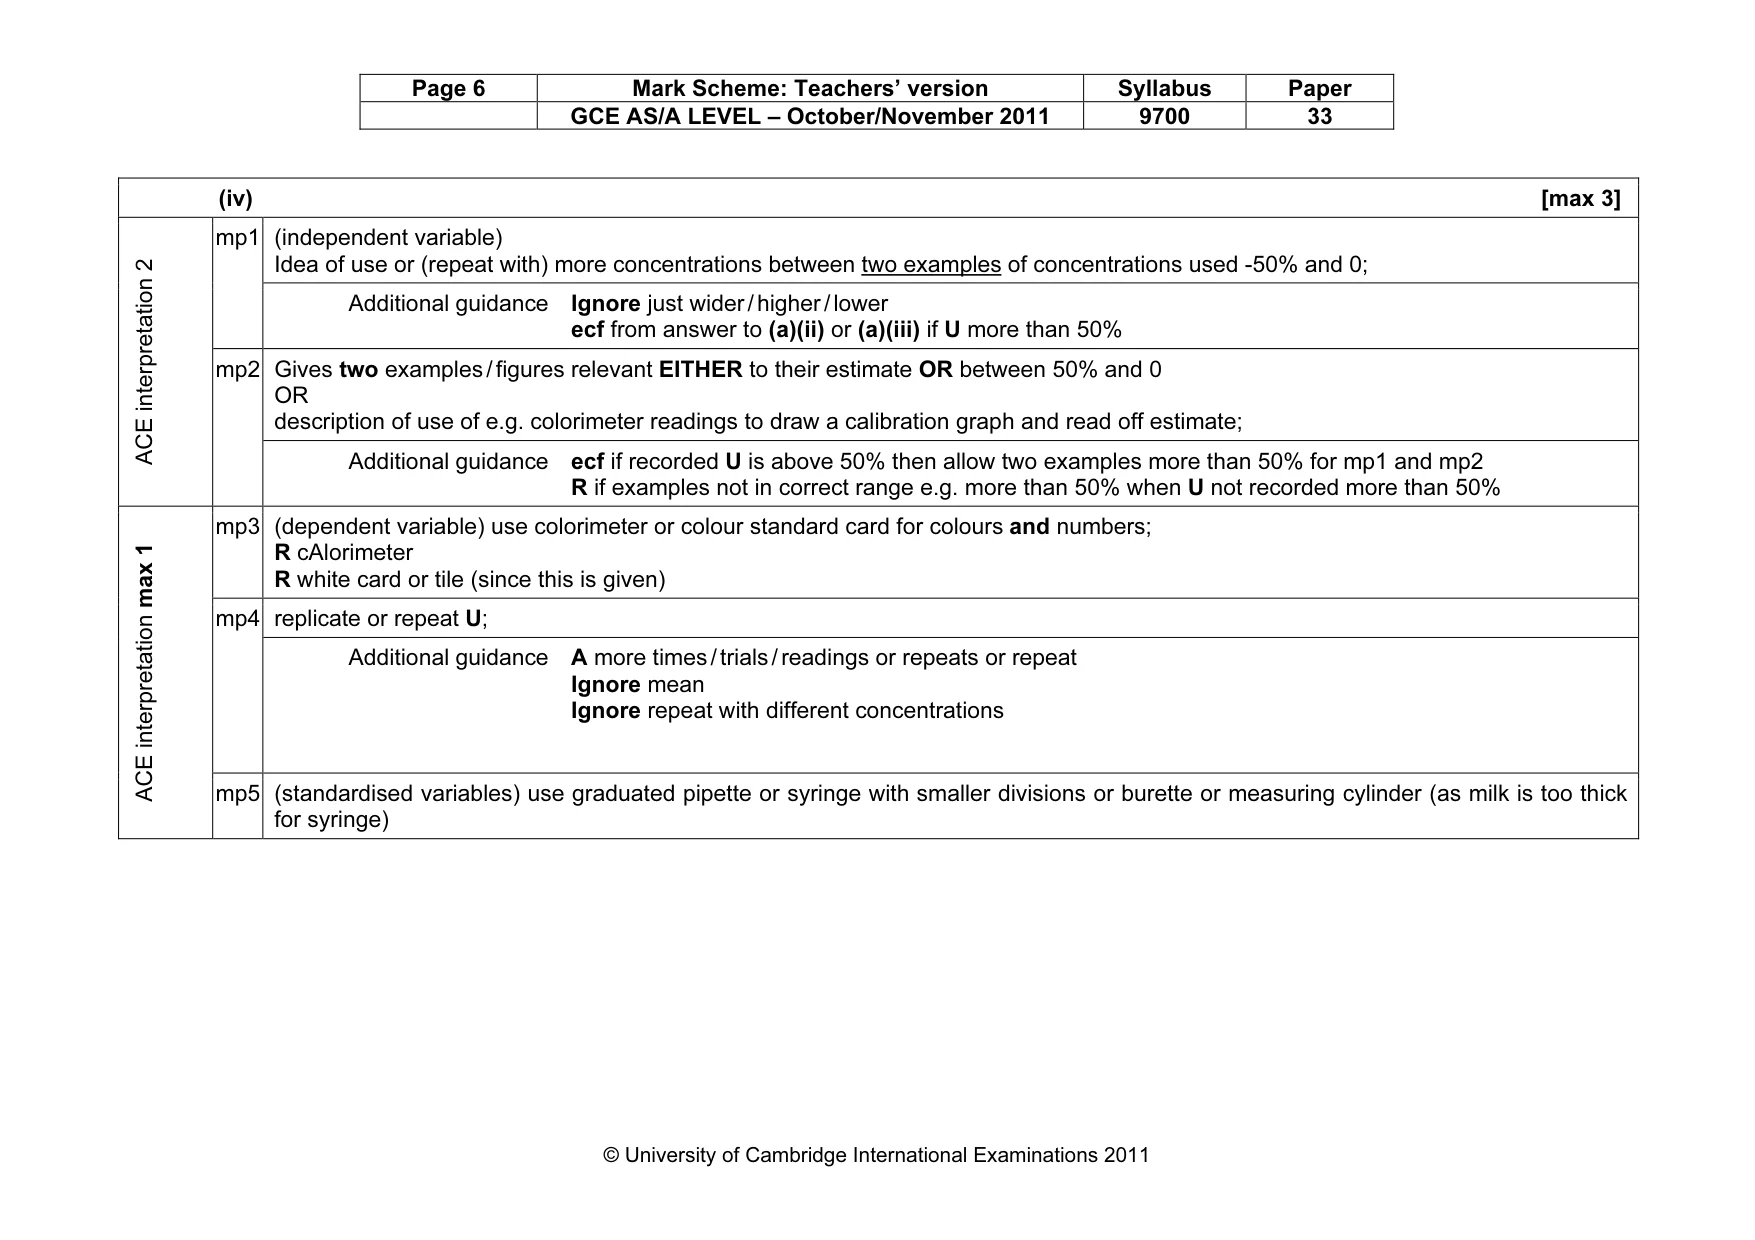
Page 6 Mark Scheme: Teachers’ version Syllabus Paper GCE AS/A LEVEL – October/November 2011 9700 33 © University of Cambridge International Examinations 2011 (iv) [max 3] (independent variable) Idea of use or (repeat with) more concentrations between two examples of concentrations used -50% and 0; mp1 Additional guidance Ignore just wider / higher / lower ecf from answer to (a)(ii) or (a)(iii) if U more than 50% Gives two examples / figures relevant EITHER to their estimate OR between 50% and 0 OR description of use of e.g. colorimeter readings to draw a calibration graph and read off estimate; ACE interpretation 2 mp2 Additional guidance ecf if recorded U is above 50% then allow two examples more than 50% for mp1 and mp2 R if examples not in correct range e.g. more than 50% when U not recorded more than 50% mp3 (dependent variable) use colorimeter or colour standard card for colours and numbers; R cAlorimeter R white card or tile (since this is given) replicate or repeat U; mp4 Additional guidance A more times / trials / readings or repeats or repeat Ignore mean Ignore repeat with different concentrations ACE interpretation max 1 mp5 (standardised variables) use graduated pipette or syringe with smaller divisions or burette or measuring cylinder (as milk is too thick for syringe)
Mark scheme, page 7
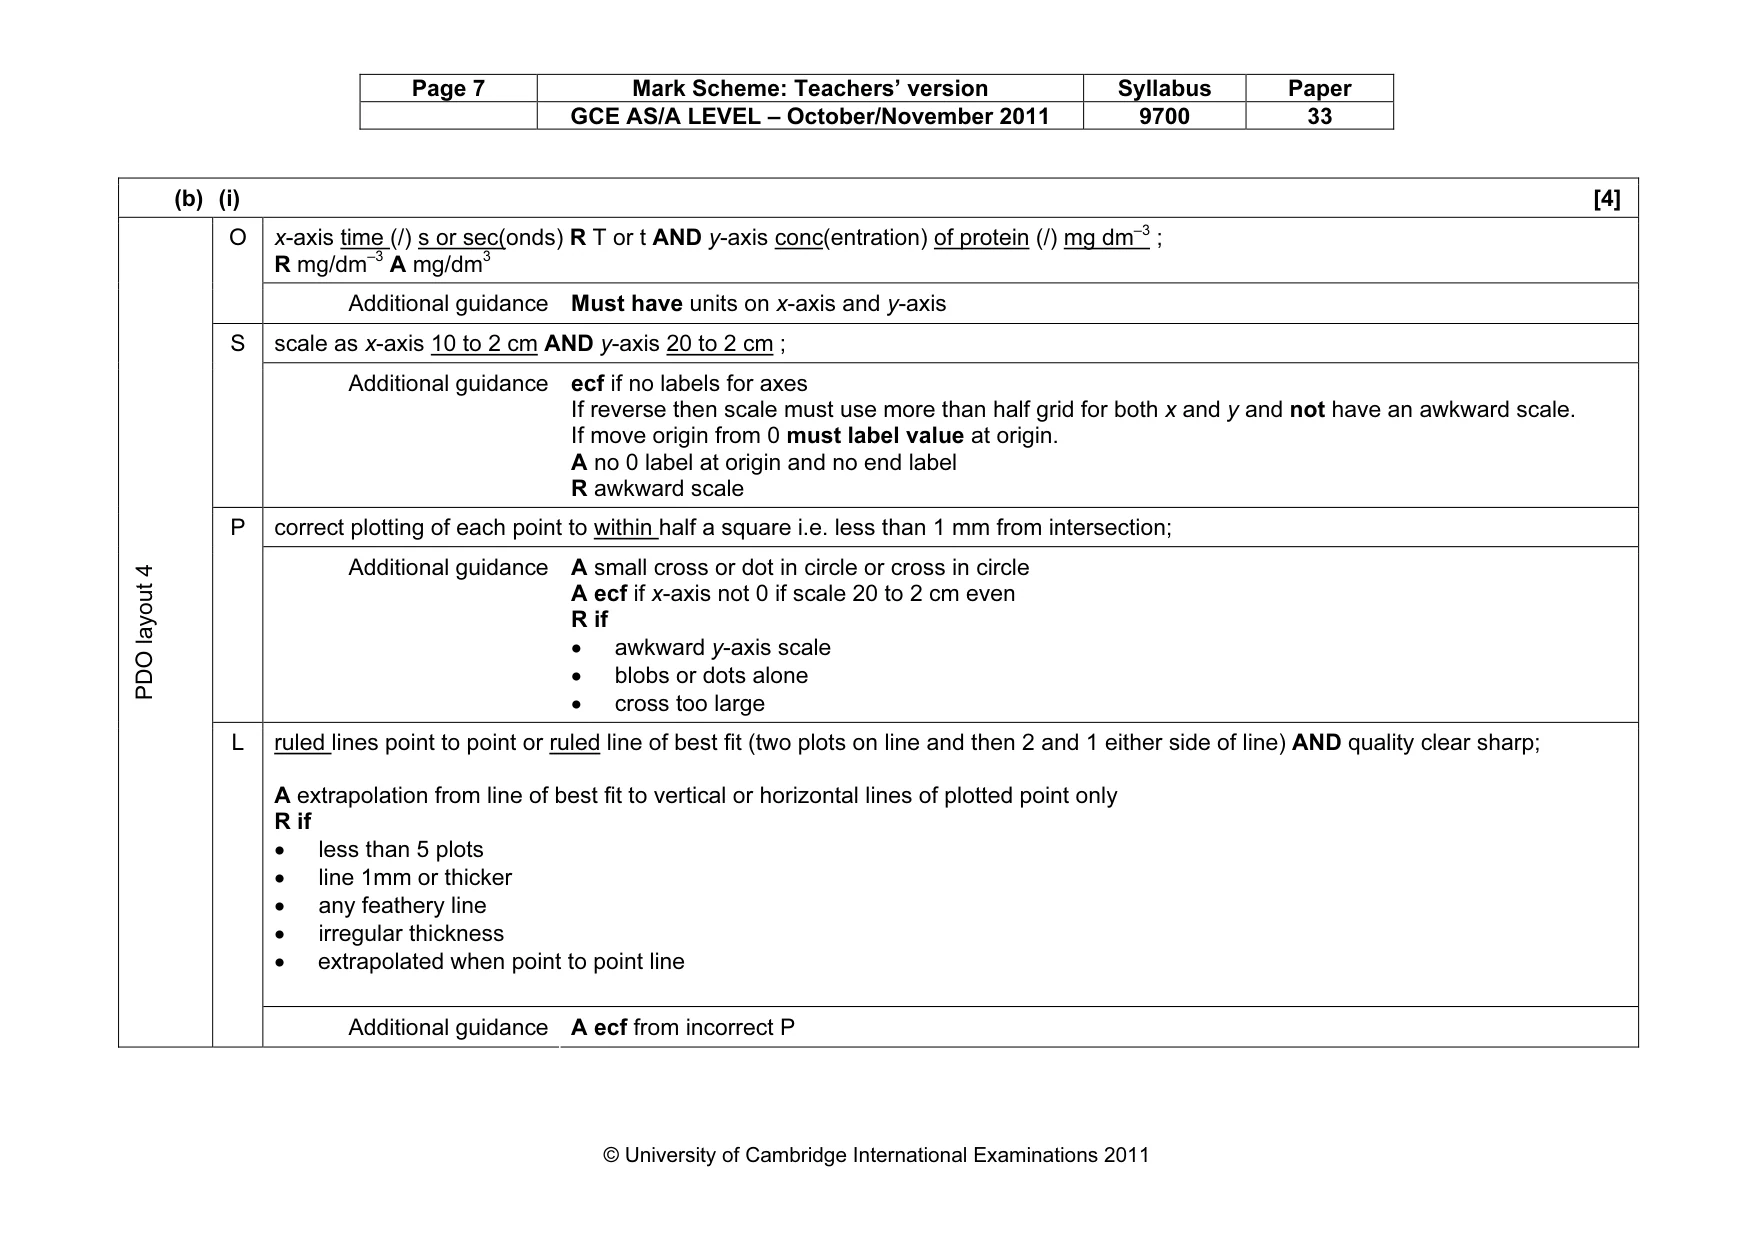
Page 7 Mark Scheme: Teachers’ version Syllabus Paper GCE AS/A LEVEL – October/November 2011 9700 33 © University of Cambridge International Examinations 2011 (b) (i) [4] x-axis time (/) s or sec(onds) R T or t AND y-axis conc(entration) of protein (/) mg dm–3 ; R mg/dm–3 A mg/dm3 O Additional guidance Must have units on x-axis and y-axis scale as x-axis 10 to 2 cm AND y-axis 20 to 2 cm ; S Additional guidance ecf if no labels for axes If reverse then scale must use more than half grid for both x and y and not have an awkward scale. If move origin from 0 must label value at origin. A no 0 label at origin and no end label R awkward scale correct plotting of each point to within half a square i.e. less than 1 mm from intersection; P Additional guidance A small cross or dot in circle or cross in circle A ecf if x-axis not 0 if scale 20 to 2 cm even R if • awkward y-axis scale • blobs or dots alone • cross too large ruled lines point to point or ruled line of best fit (two plots on line and then 2 and 1 either side of line) AND quality clear sharp; A extrapolation from line of best fit to vertical or horizontal lines of plotted point only R if • less than 5 plots • line 1mm or thicker • any feathery line • irregular thickness • extrapolated when point to point line PDO layout 4 L Additional guidance A ecf from incorrect P
Mark scheme, page 8
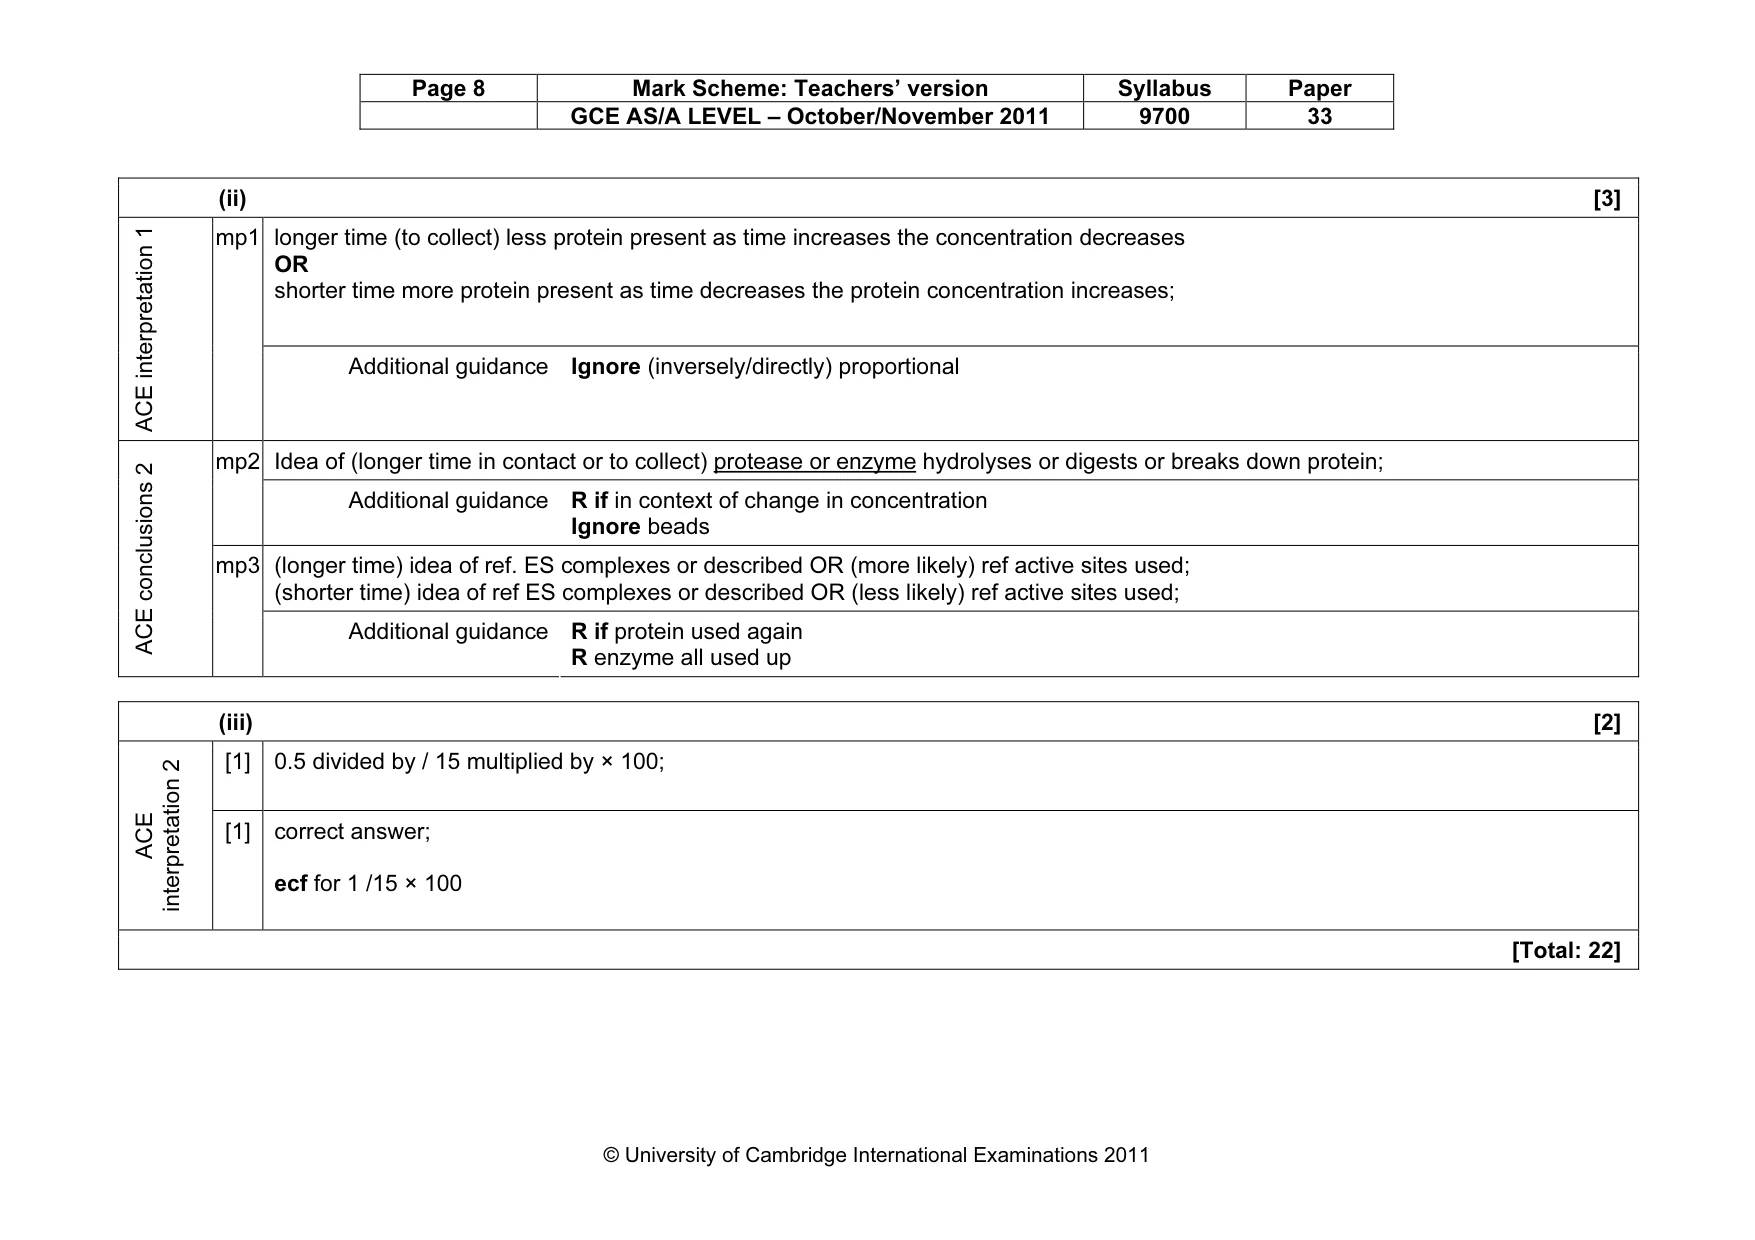
Page 8 Mark Scheme: Teachers’ version Syllabus Paper GCE AS/A LEVEL – October/November 2011 9700 33 © University of Cambridge International Examinations 2011 (ii) [3] longer time (to collect) less protein present as time increases the concentration decreases OR shorter time more protein present as time decreases the protein concentration increases; ACE interpretation 1 mp1 Additional guidance Ignore (inversely/directly) proportional Idea of (longer time in contact or to collect) protease or enzyme hydrolyses or digests or breaks down protein; mp2 Additional guidance R if in context of change in concentration Ignore beads (longer time) idea of ref. ES complexes or described OR (more likely) ref active sites used; (shorter time) idea of ref ES complexes or described OR (less likely) ref active sites used; ACE conclusions 2 mp3 Additional guidance R if protein used again R enzyme all used up (iii) [2] [1] 0.5 divided by / 15 multiplied by × 100; ACE interpretation 2 [1] correct answer; ecf for 1 /15 × 100 [Total: 22]
Mark scheme, page 9
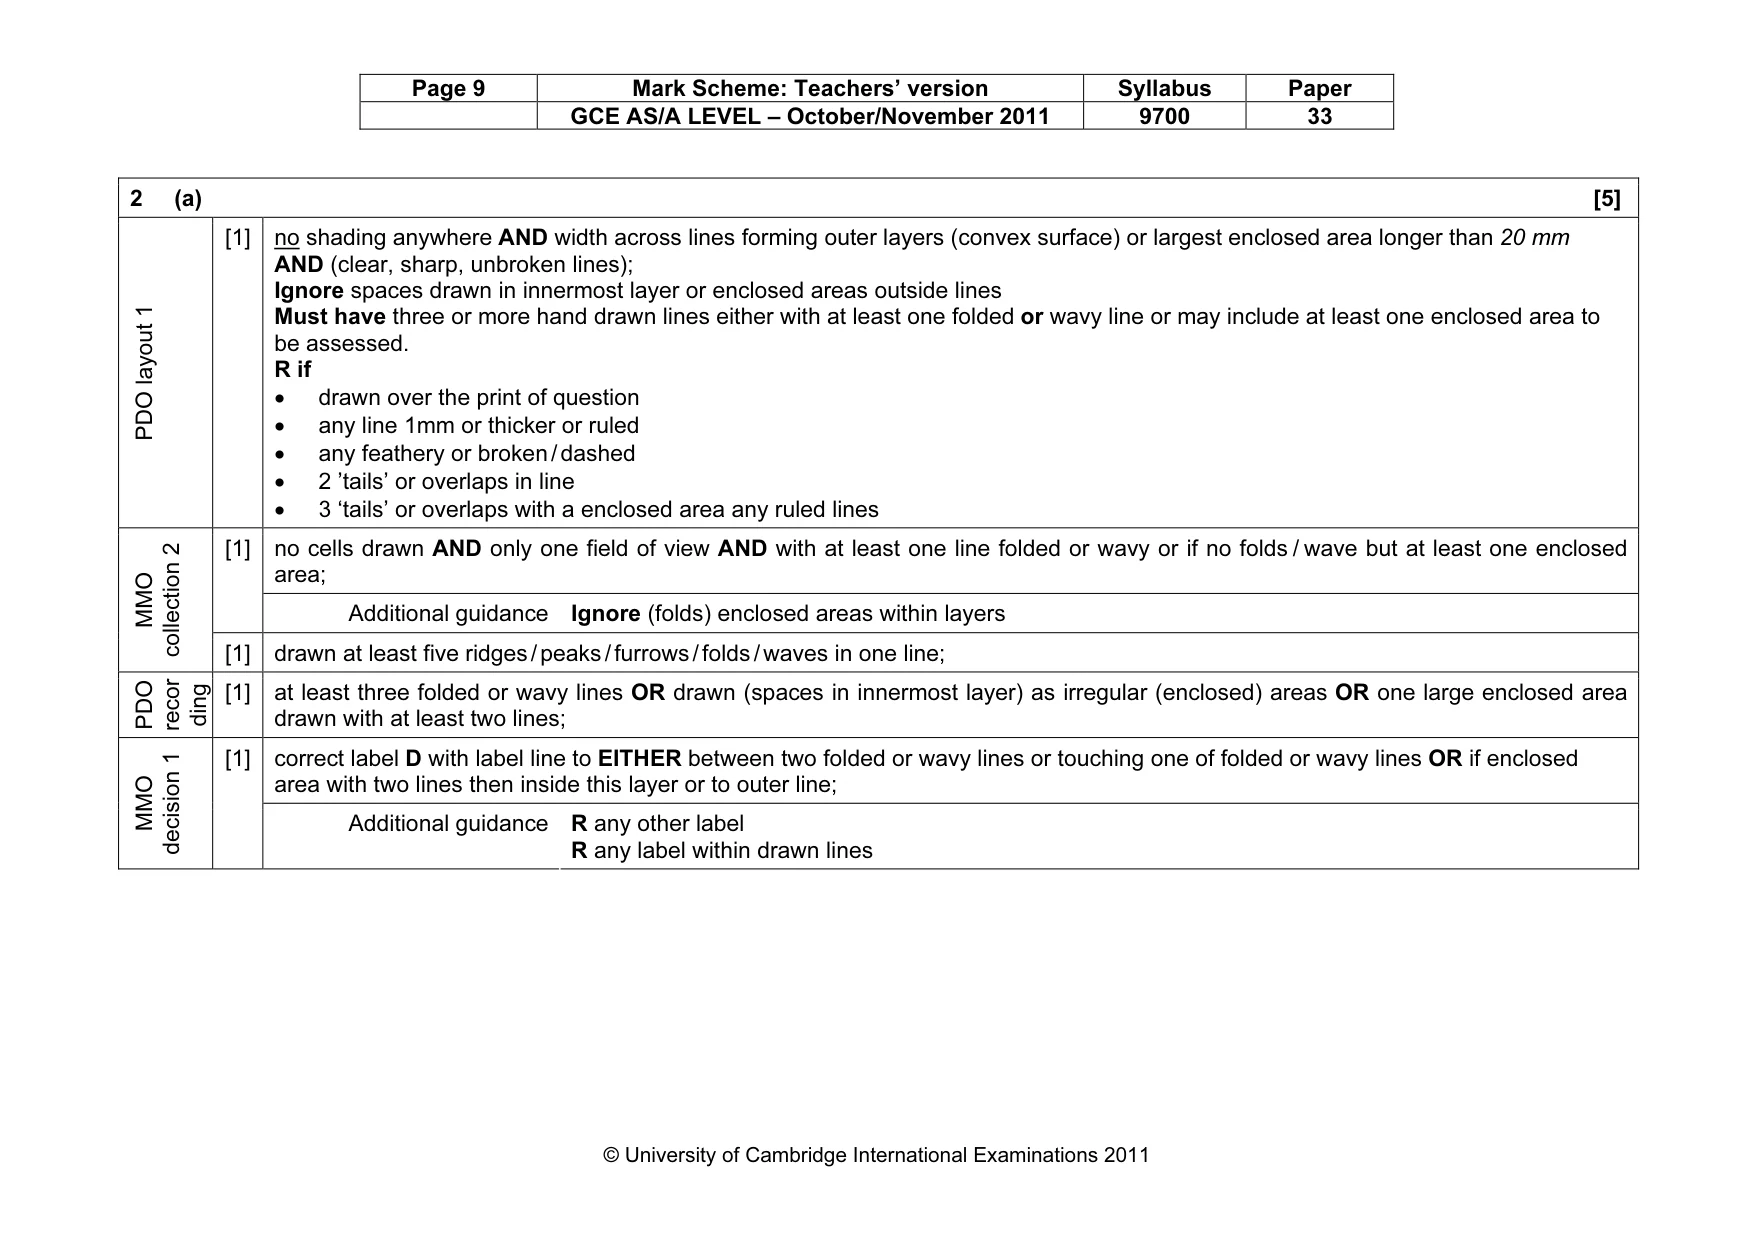
Page 9 Mark Scheme: Teachers’ version Syllabus Paper GCE AS/A LEVEL – October/November 2011 9700 33 © University of Cambridge International Examinations 2011 2 (a) [5] PDO layout 1 [1] no shading anywhere AND width across lines forming outer layers (convex surface) or largest enclosed area longer than 20 mm AND (clear, sharp, unbroken lines); Ignore spaces drawn in innermost layer or enclosed areas outside lines Must have three or more hand drawn lines either with at least one folded or wavy line or may include at least one enclosed area to be assessed. R if • drawn over the print of question • any line 1mm or thicker or ruled • any feathery or broken / dashed • 2 ’tails’ or overlaps in line • 3 ‘tails’ or overlaps with a enclosed area any ruled lines no cells drawn AND only one field of view AND with at least one line folded or wavy or if no folds / wave but at least one enclosed area; [1] Additional guidance Ignore (folds) enclosed areas within layers MMO collection 2 [1] drawn at least five ridges / peaks / furrows / folds / waves in one line; PDO recor ding [1] at least three folded or wavy lines OR drawn (spaces in innermost layer) as irregular (enclosed) areas OR one large enclosed area drawn with at least two lines; correct label D with label line to EITHER between two folded or wavy lines or touching one of folded or wavy lines OR if enclosed area with two lines then inside this layer or to outer line; MMO decision 1 [1] Additional guidance R any other label R any label within drawn lines
Mark scheme, page 10
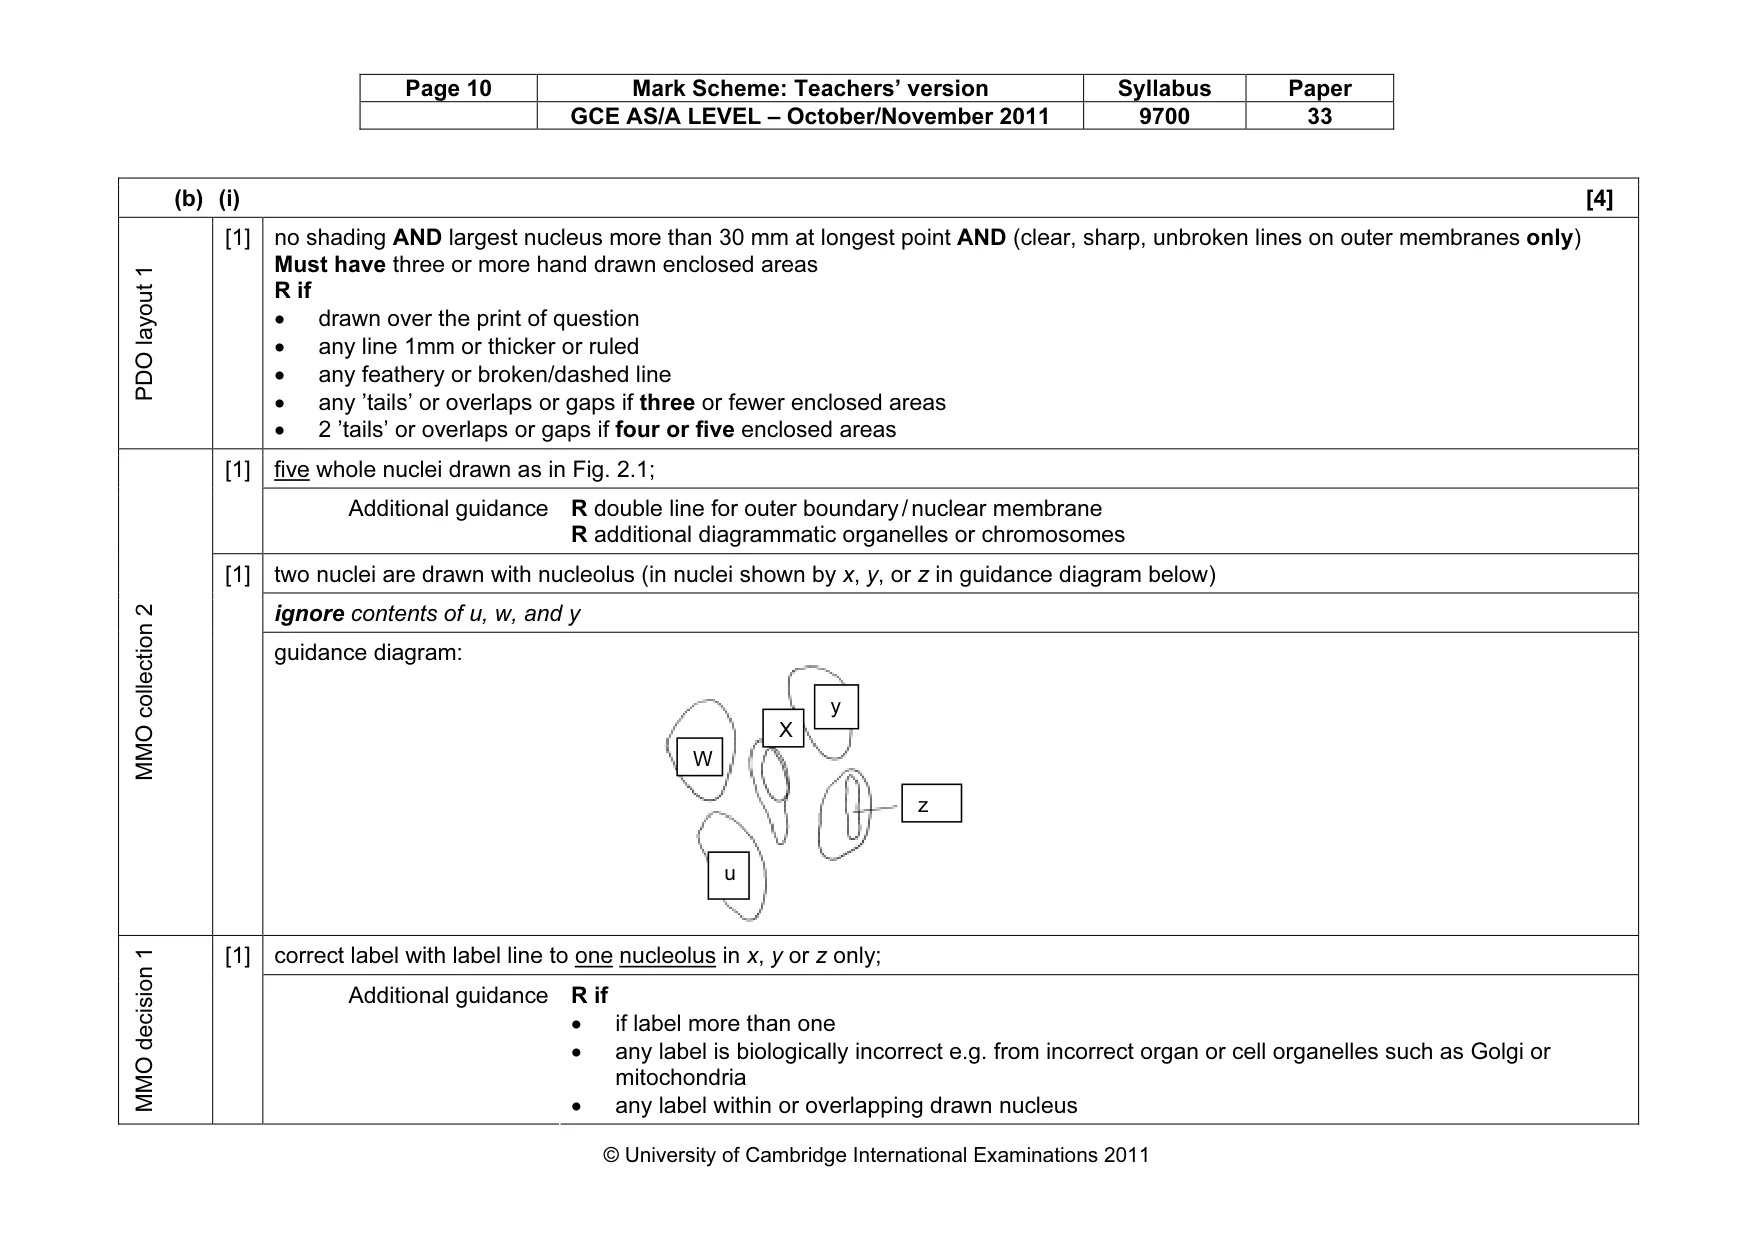
Page 10 Mark Scheme: Teachers’ version Syllabus Paper GCE AS/A LEVEL – October/November 2011 9700 33 © University of Cambridge International Examinations 2011 (b) (i) [4] PDO layout 1 [1] no shading AND largest nucleus more than 30 mm at longest point AND (clear, sharp, unbroken lines on outer membranes only) Must have three or more hand drawn enclosed areas R if • drawn over the print of question • any line 1mm or thicker or ruled • any feathery or broken/dashed line • any ’tails’ or overlaps or gaps if three or fewer enclosed areas • 2 ’tails’ or overlaps or gaps if four or five enclosed areas five whole nuclei drawn as in Fig. 2.1; [1] Additional guidance R double line for outer boundary / nuclear membrane R additional diagrammatic organelles or chromosomes two nuclei are drawn with nucleolus (in nuclei shown by x, y, or z in guidance diagram below) ignore contents of u, w, and y MMO collection 2 [1] guidance diagram: correct label with label line to one nucleolus in x, y or z only; MMO decision 1 [1] Additional guidance R if • if label more than one • any label is biologically incorrect e.g. from incorrect organ or cell organelles such as Golgi or mitochondria • any label within or overlapping drawn nucleus W y X z u
Mark scheme, page 11
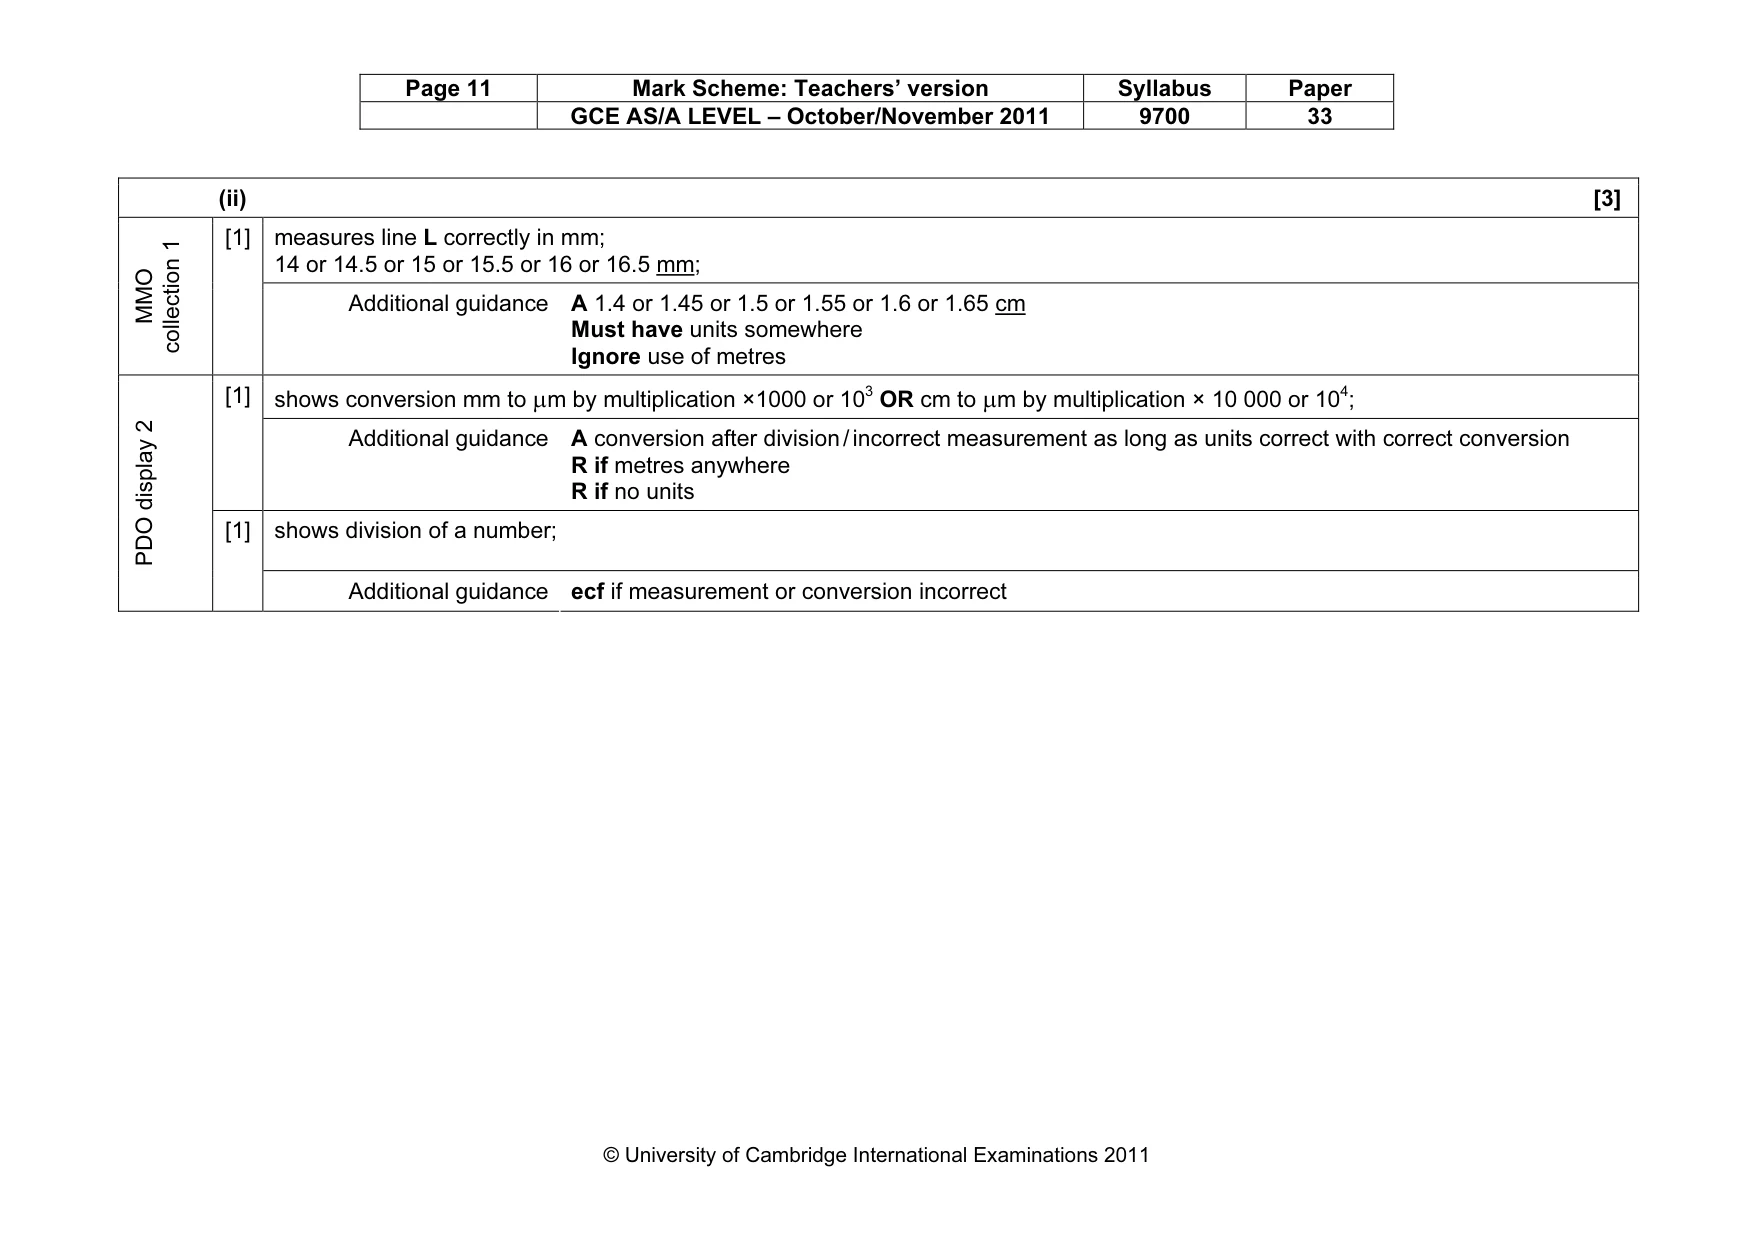
Page 11 Mark Scheme: Teachers’ version Syllabus Paper GCE AS/A LEVEL – October/November 2011 9700 33 © University of Cambridge International Examinations 2011 (ii) [3] measures line L correctly in mm; 14 or 14.5 or 15 or 15.5 or 16 or 16.5 mm; MMO collection 1 [1] Additional guidance A 1.4 or 1.45 or 1.5 or 1.55 or 1.6 or 1.65 cm Must have units somewhere Ignore use of metres shows conversion mm to µm by multiplication ×1000 or 103 OR cm to µm by multiplication × 10 000 or 104; [1] Additional guidance A conversion after division / incorrect measurement as long as units correct with correct conversion R if metres anywhere R if no units shows division of a number; PDO display 2 [1] Additional guidance ecf if measurement or conversion incorrect
Mark scheme, page 12
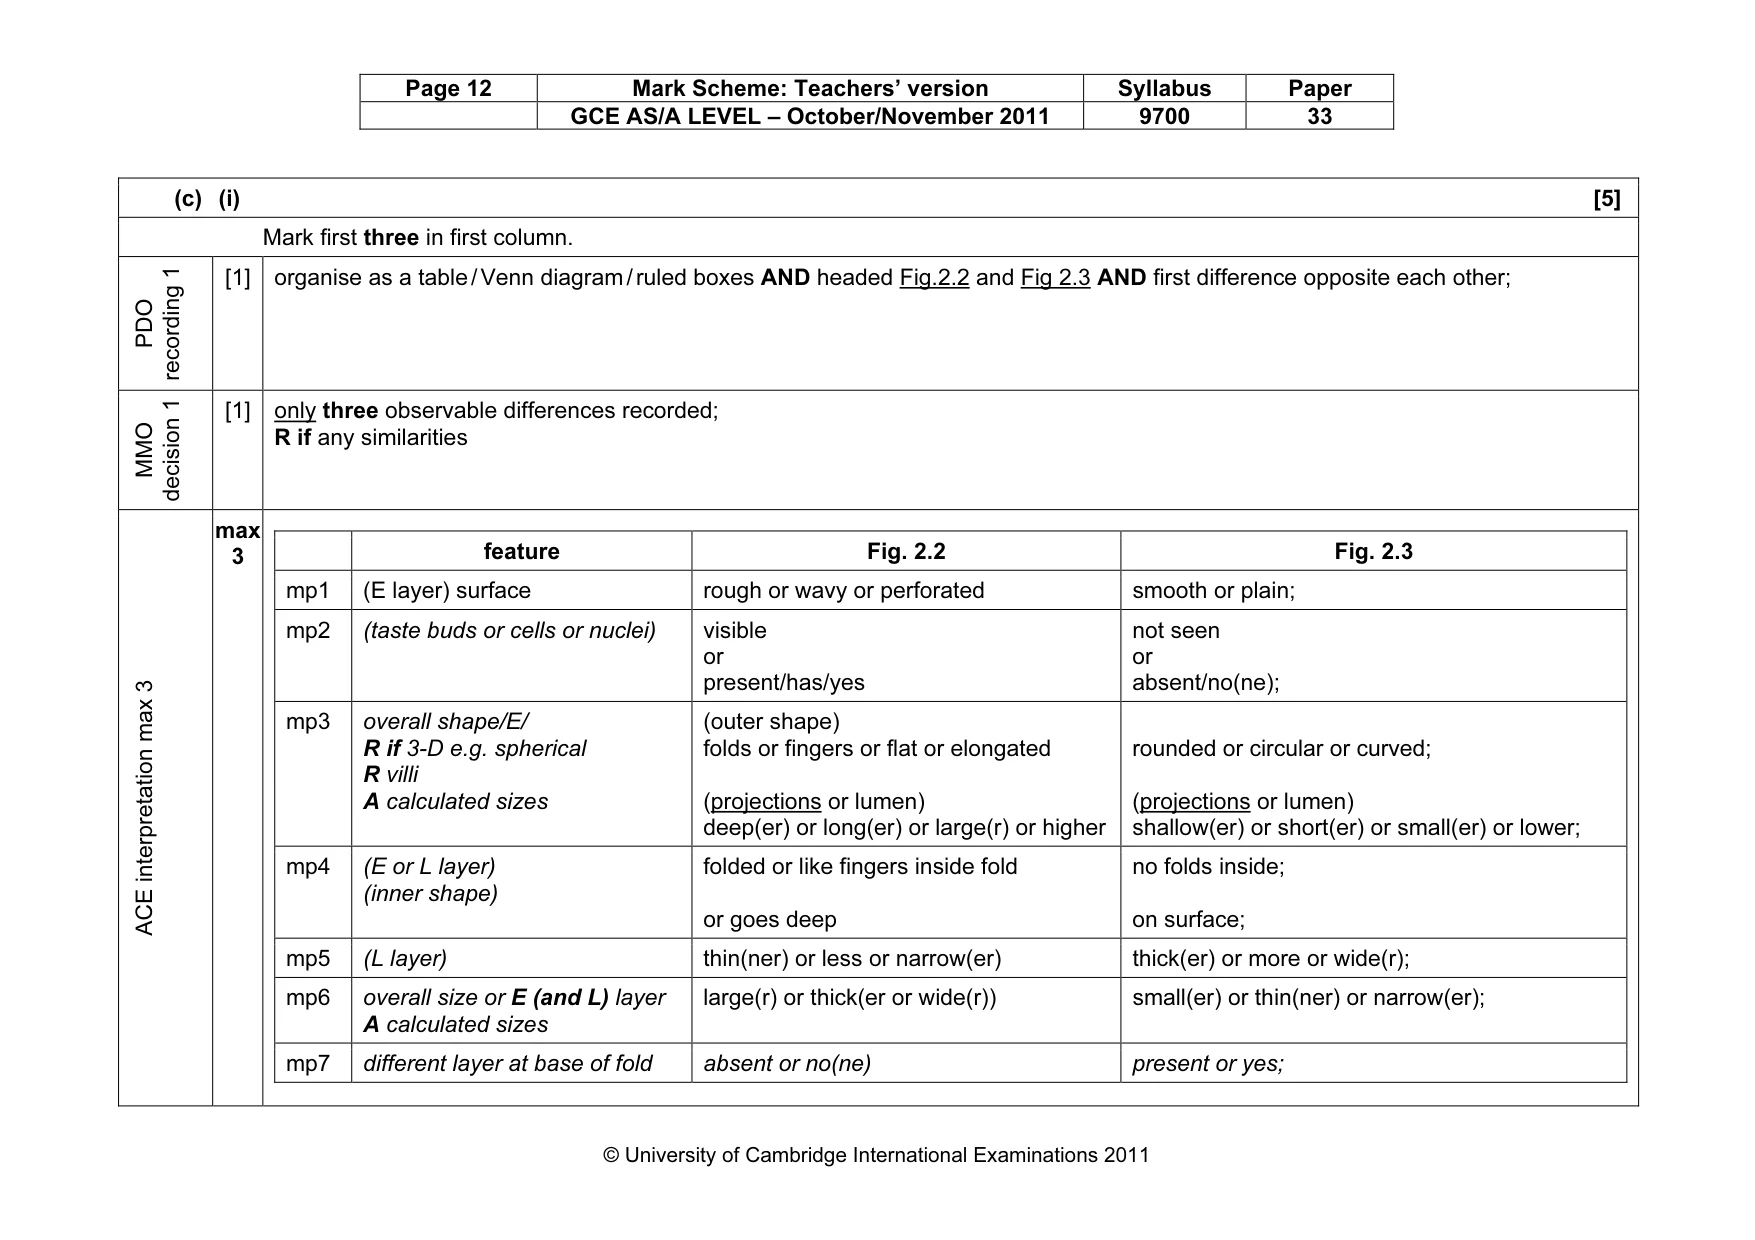
Page 12 Mark Scheme: Teachers’ version Syllabus Paper GCE AS/A LEVEL – October/November 2011 9700 33 © University of Cambridge International Examinations 2011 (c) (i) [5] Mark first three in first column. PDO recording 1 [1] organise as a table / Venn diagram / ruled boxes AND headed Fig.2.2 and Fig 2.3 AND first difference opposite each other; MMO decision 1 [1] only three observable differences recorded; R if any similarities ACE interpretation max 3 max 3 feature Fig. 2.2 Fig. 2.3 mp1 (E layer) surface rough or wavy or perforated smooth or plain; mp2 (taste buds or cells or nuclei) visible or present/has/yes not seen or absent/no(ne); mp3 overall shape/E/ R if 3-D e.g. spherical R villi A calculated sizes (outer shape) folds or fingers or flat or elongated (projections or lumen) deep(er) or long(er) or large(r) or higher rounded or circular or curved; (projections or lumen) shallow(er) or short(er) or small(er) or lower; mp4 (E or L layer) (inner shape) folded or like fingers inside fold or goes deep no folds inside; on surface; mp5 (L layer) thin(ner) or less or narrow(er) thick(er) or more or wide(r); mp6 overall size or E (and L) layer A calculated sizes large(r) or thick(er or wide(r)) small(er) or thin(ner) or narrow(er); mp7 different layer at base of fold absent or no(ne) present or yes;
Mark scheme, page 13
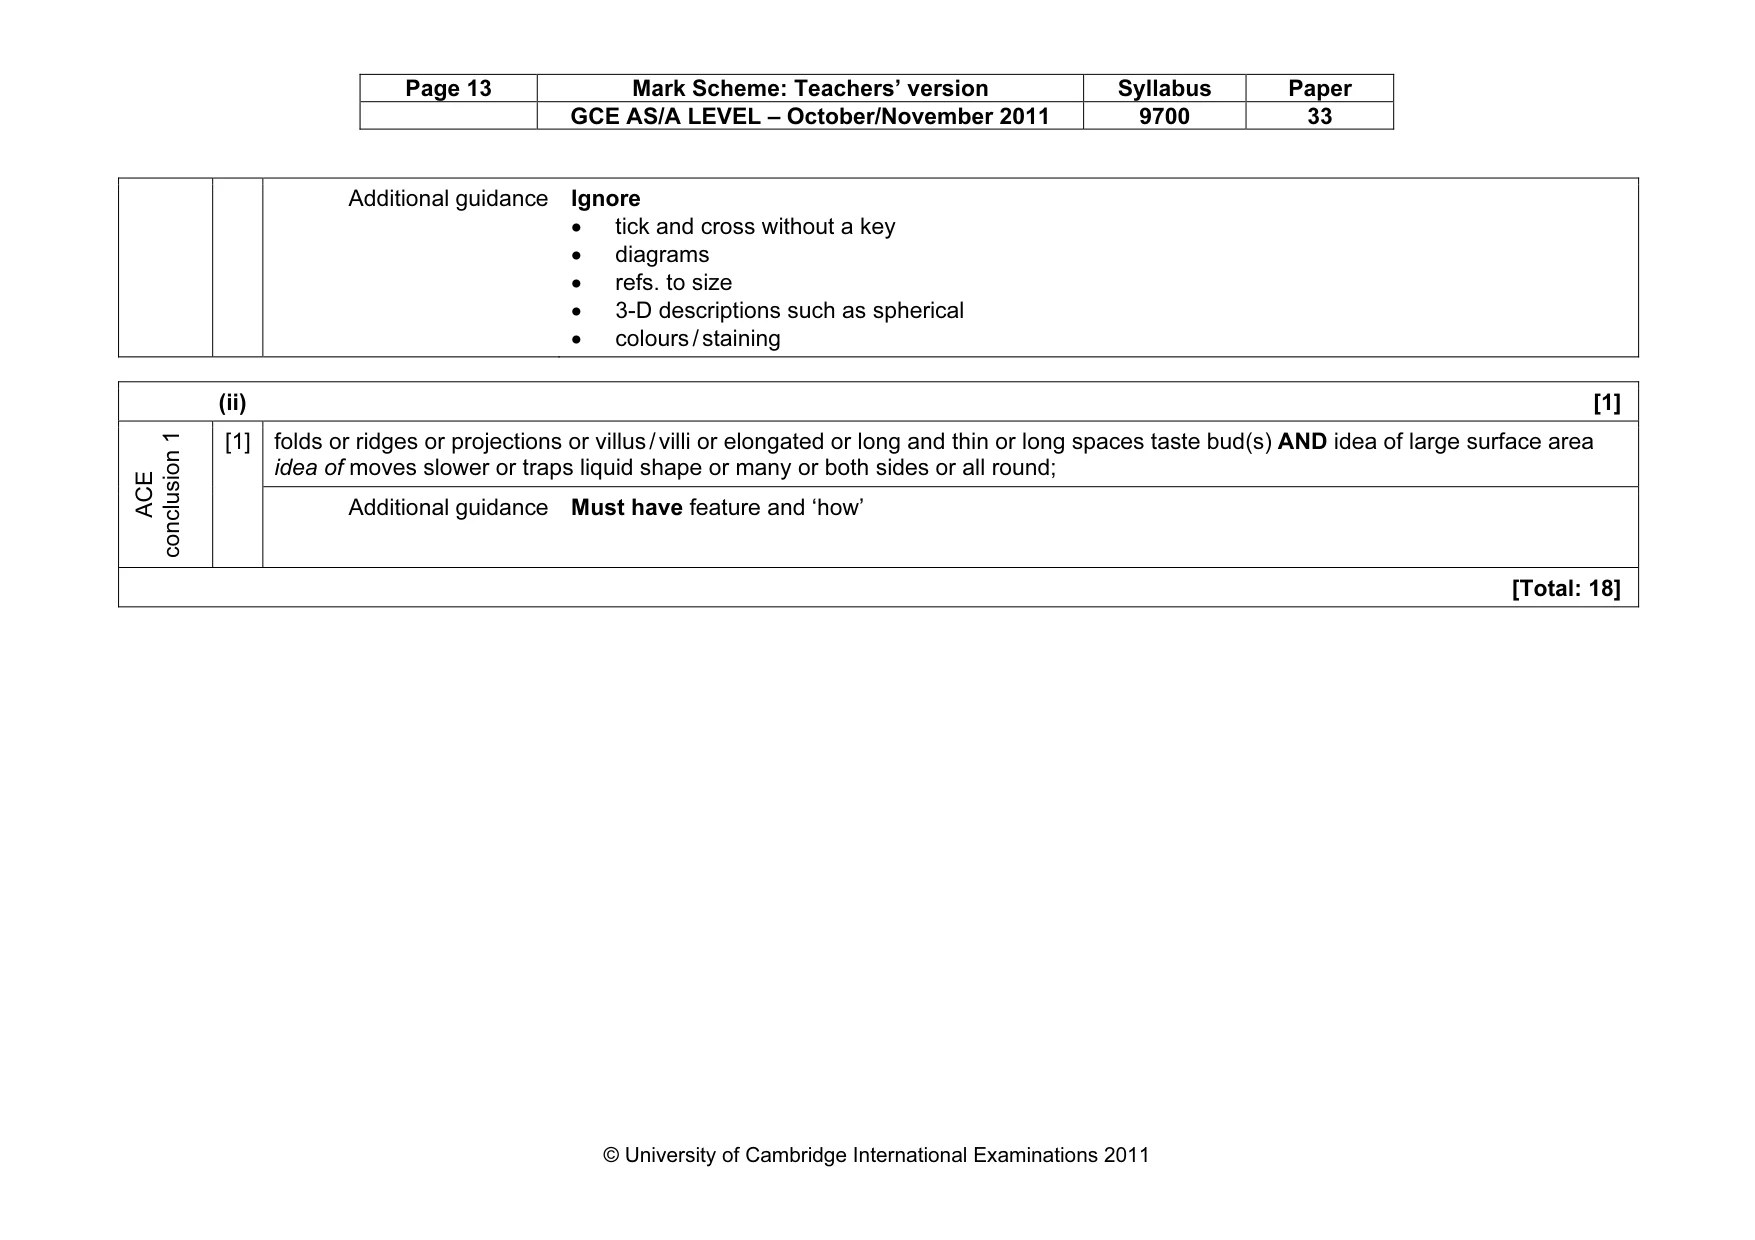
Page 13 Mark Scheme: Teachers’ version Syllabus Paper GCE AS/A LEVEL – October/November 2011 9700 33 © University of Cambridge International Examinations 2011 Additional guidance Ignore • tick and cross without a key • diagrams • refs. to size • 3-D descriptions such as spherical • colours / staining (ii) [1] folds or ridges or projections or villus / villi or elongated or long and thin or long spaces taste bud(s) AND idea of large surface area idea of moves slower or traps liquid shape or many or both sides or all round; ACE conclusion 1 [1] Additional guidance Must have feature and ‘how’ [Total: 18]
What you needed in this session
Cambridge’s own grade thresholds for 2011 Oct/Nov, Paper 3 · Variant 3. A higher threshold means an easier paper — the bar moves with how the cohort did.