Cambridge A Level Biology 9700 — 2011 May/June Paper 3 · Variant 1
9700/31/M/J/11 · 40 marks · ≈45 min
The question paper and its mark scheme, free to read here and free to download. This is Cambridge’s own paper, exactly as it was sat.
Question paper12 pages
Mark scheme20 pages
Answers below. Sit the paper first if you are practising.
Paper as text
Question paper, page 1
This document consists of 11 printed pages and 1 blank page. DC (CW/DJ) 31753/6 © UCLES 2011 [Turn over UNIVERSITY OF CAMBRIDGE INTERNATIONAL EXAMINATIONS General Certificate of Education Advanced Subsidiary Level and Advanced Level READ THESE INSTRUCTIONS FIRST Write your Centre number, candidate number and name on all the work you hand in. Write in dark blue or black ink. You may use a pencil for any diagrams, graphs or rough working. Do not use red ink, staples, paper clips, highlighters, glue or correction fluid. DO NOT WRITE IN ANY BARCODES. Answer all questions. You may lose marks if you do not show your working or if you do not use appropriate units. At the end of the examination, fasten all your work securely together. The number of marks is given in brackets [ ] at the end of each question or part question. * 1 9 1 8 9 8 9 7 3 9 * BIOLOGY 9700/31 Advanced Practical Skills 1 May/June 2011 2 hours Candidates answer on the Question Paper. Additional Materials: As listed in the Confidential Instructions. For Examiner’s Use 1 2 Total
Question paper, page 2
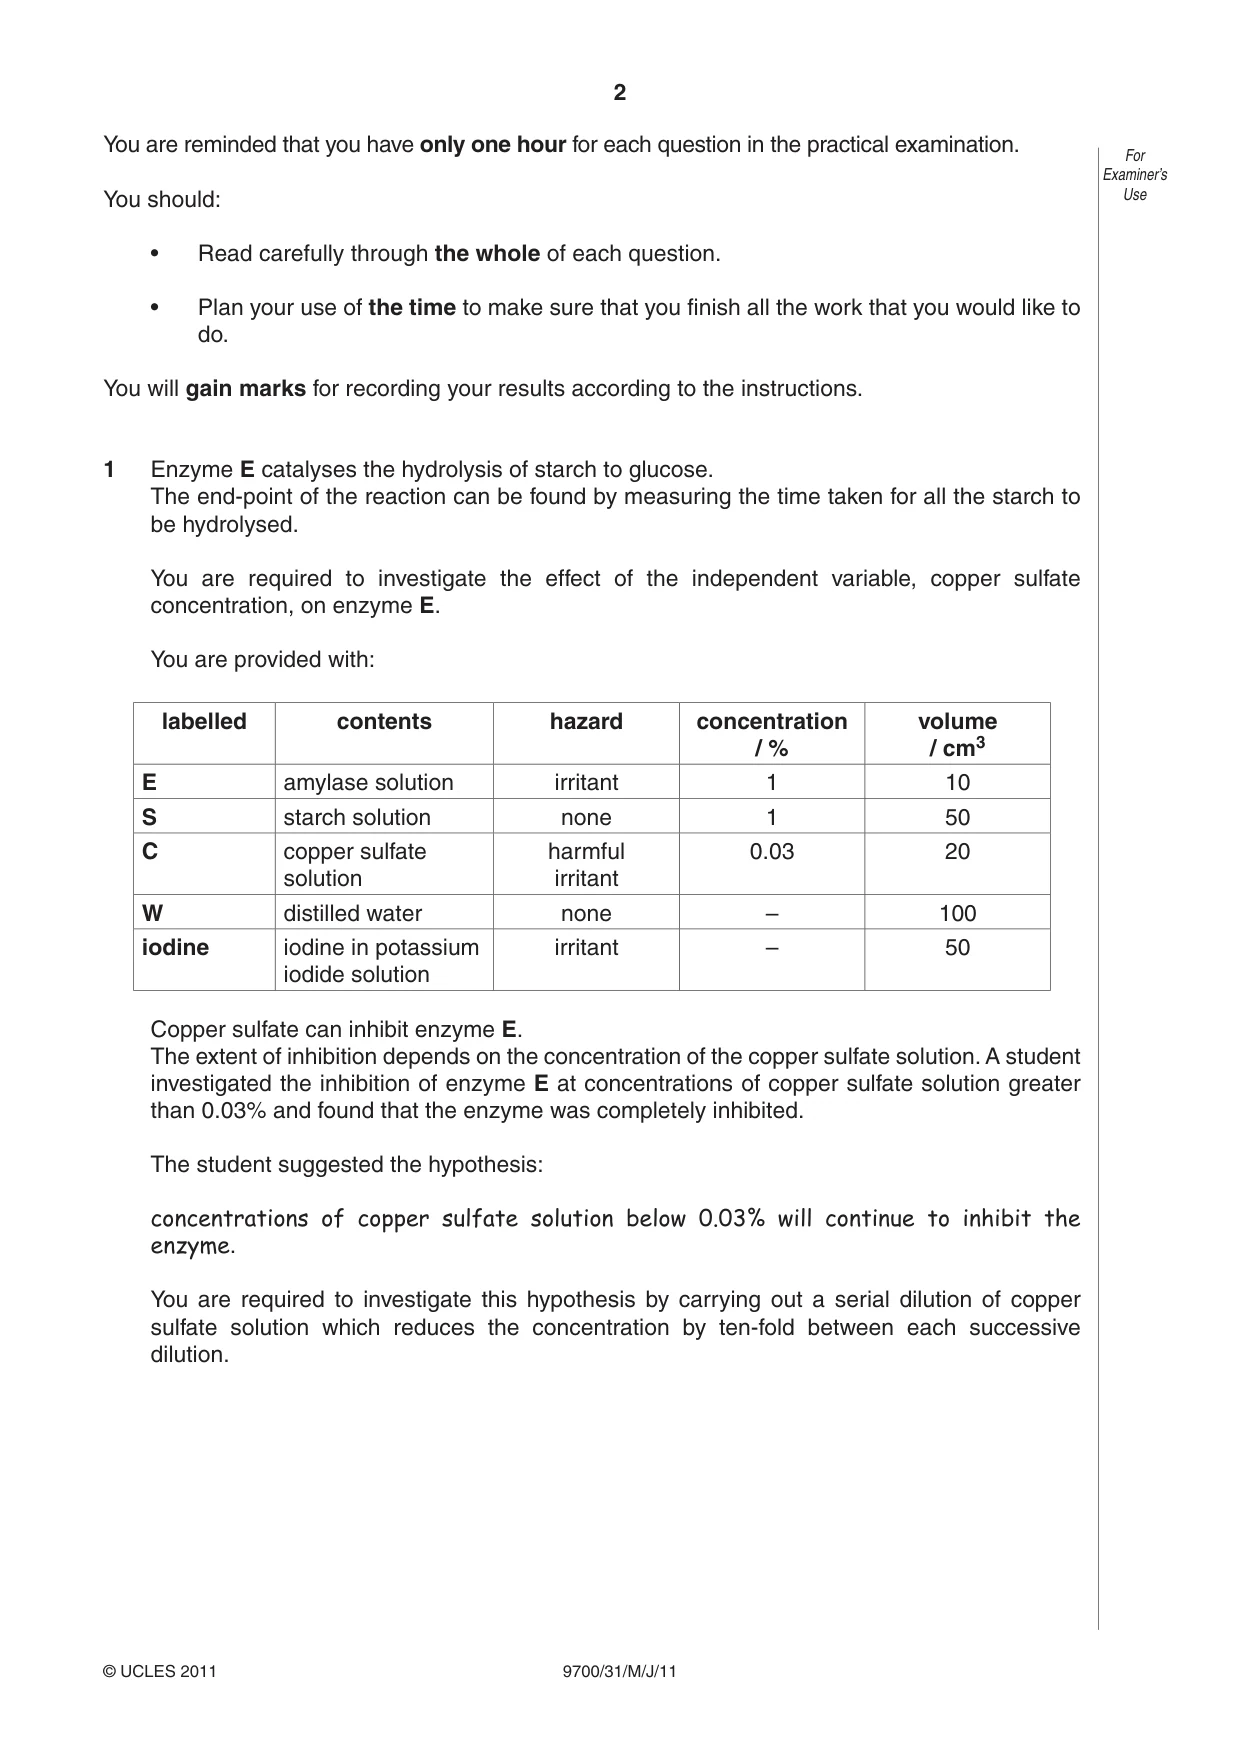
2 9700/31/M/J/11 © UCLES 2011 For Examiner’s Use You are reminded that you have only one hour for each question in the practical examination. You should: • Read carefully through the whole of each question. • Plan your use of the time to make sure that you finish all the work that you would like to do. You will gain marks for recording your results according to the instructions. 1 Enzyme E catalyses the hydrolysis of starch to glucose. The end-point of the reaction can be found by measuring the time taken for all the starch to be hydrolysed. You are required to investigate the effect of the independent variable, copper sulfate concentration, on enzyme E. You are provided with: labelled contents hazard concentration / % volume / cm3 E amylase solution irritant 1 10 S starch solution none 1 50 C copper sulfate solution harmful irritant 0.03 20 W distilled water none – 100 iodine iodine in potassium iodide solution irritant – 50 Copper sulfate can inhibit enzyme E. The extent of inhibition depends on the concentration of the copper sulfate solution. A student investigated the inhibition of enzyme E at concentrations of copper sulfate solution greater than 0.03% and found that the enzyme was completely inhibited. The student suggested the hypothesis: concentrations of copper sulfate solution below 0.03% will continue to inhibit the enzyme. You are required to investigate this hypothesis by carrying out a serial dilution of copper sulfate solution which reduces the concentration by ten-fold between each successive dilution.
Question paper, page 3
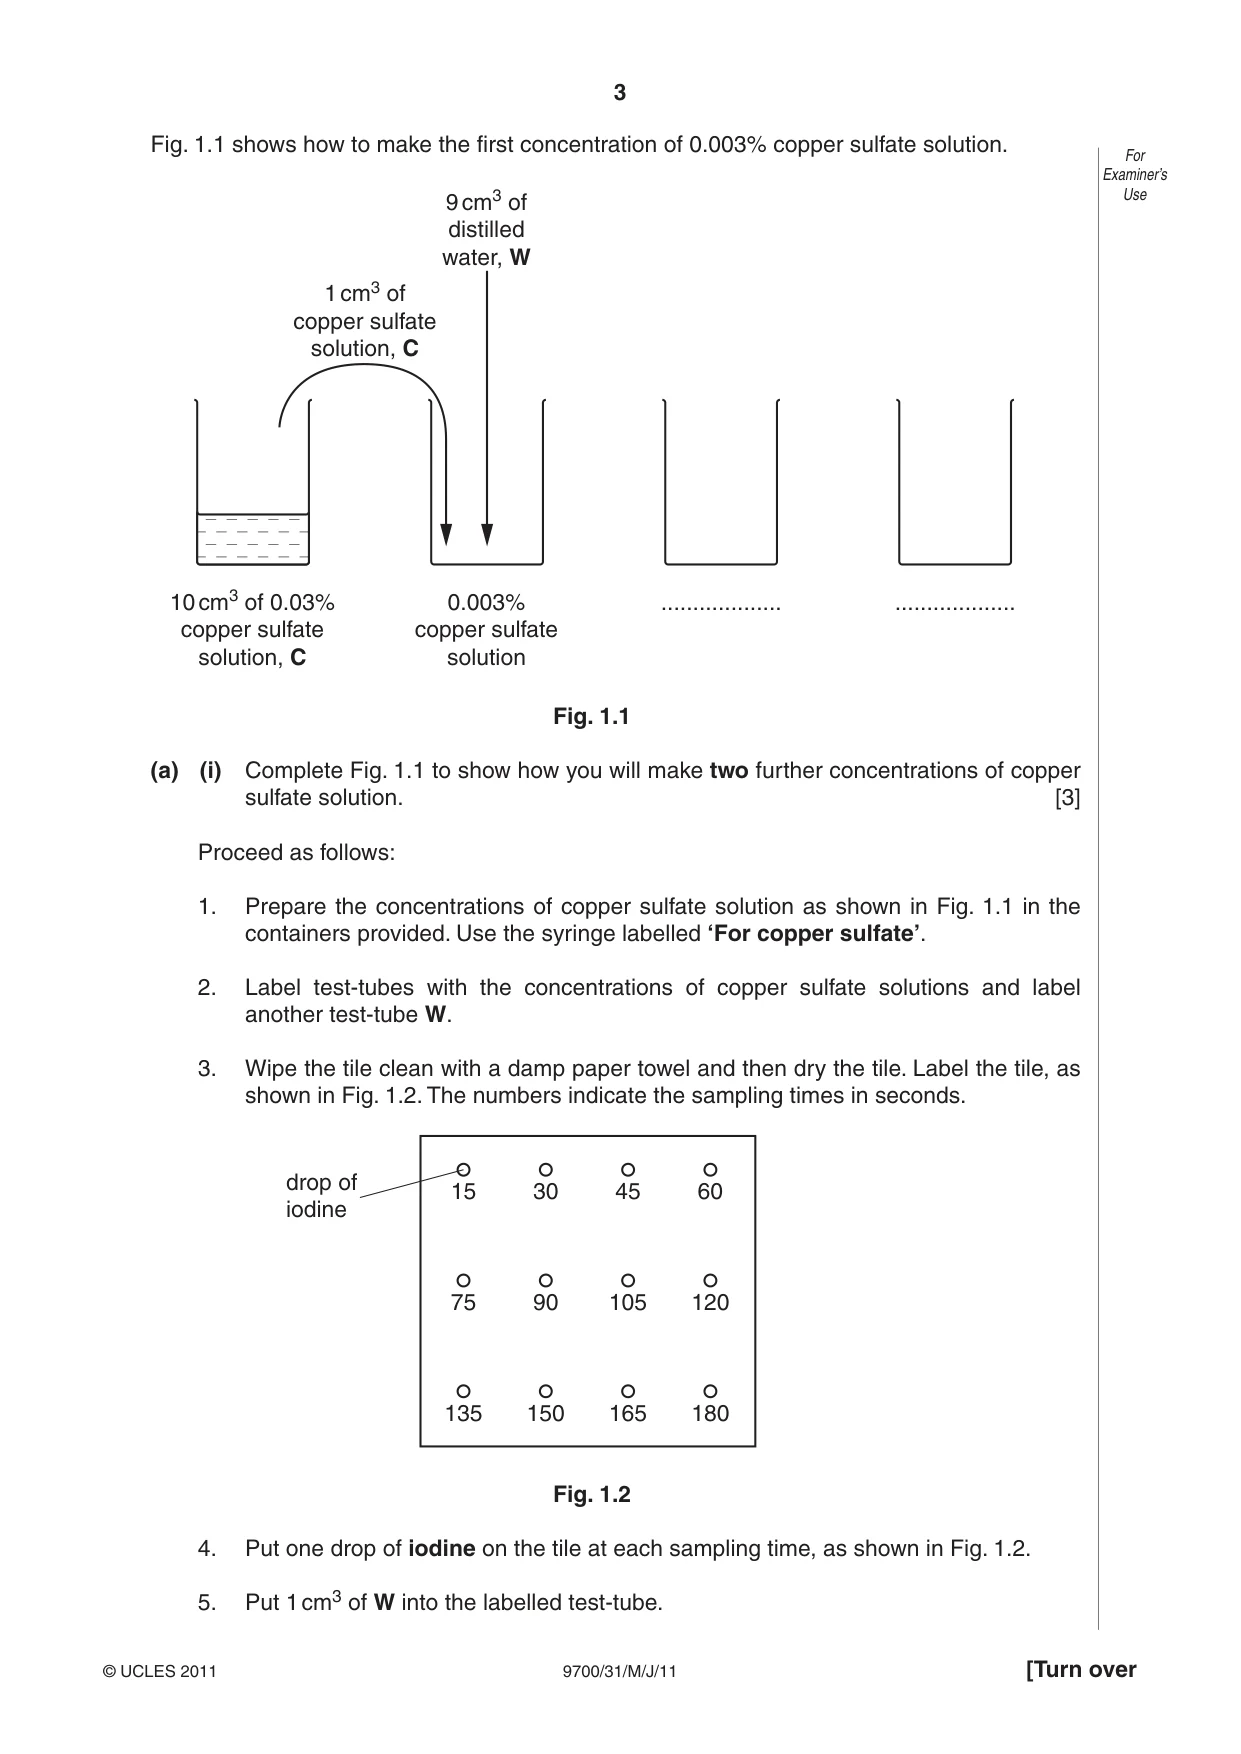
3 9700/31/M/J/11 © UCLES 2011 [Turn over For Examiner’s Use Fig. 1.1 shows how to make the first concentration of 0.003% copper sulfate solution. 10 cm3 of 0.03% copper sulfate solution, C 0.003% copper sulfate solution … … 9 cm3 of distilled water, W 1 cm3 of copper sulfate solution, C Fig. 1.1 (a) (i) Complete Fig. 1.1 to show how you will make two further concentrations of copper sulfate solution. [3] Proceed as follows: 1. Prepare the concentrations of copper sulfate solution as shown in Fig. 1.1 in the containers provided. Use the syringe labelled ‘For copper sulfate’. 2. Label test-tubes with the concentrations of copper sulfate solutions and label another test-tube W. 3. Wipe the tile clean with a damp paper towel and then dry the tile. Label the tile, as shown in Fig. 1.2. The numbers indicate the sampling times in seconds. 15 30 45 60 75 90 105 120 135 150 165 180 drop of iodine Fig. 1.2 4. Put one drop of iodine on the tile at each sampling time, as shown in Fig. 1.2. 5. Put 1 cm3 of W into the labelled test-tube.
Question paper, page 4
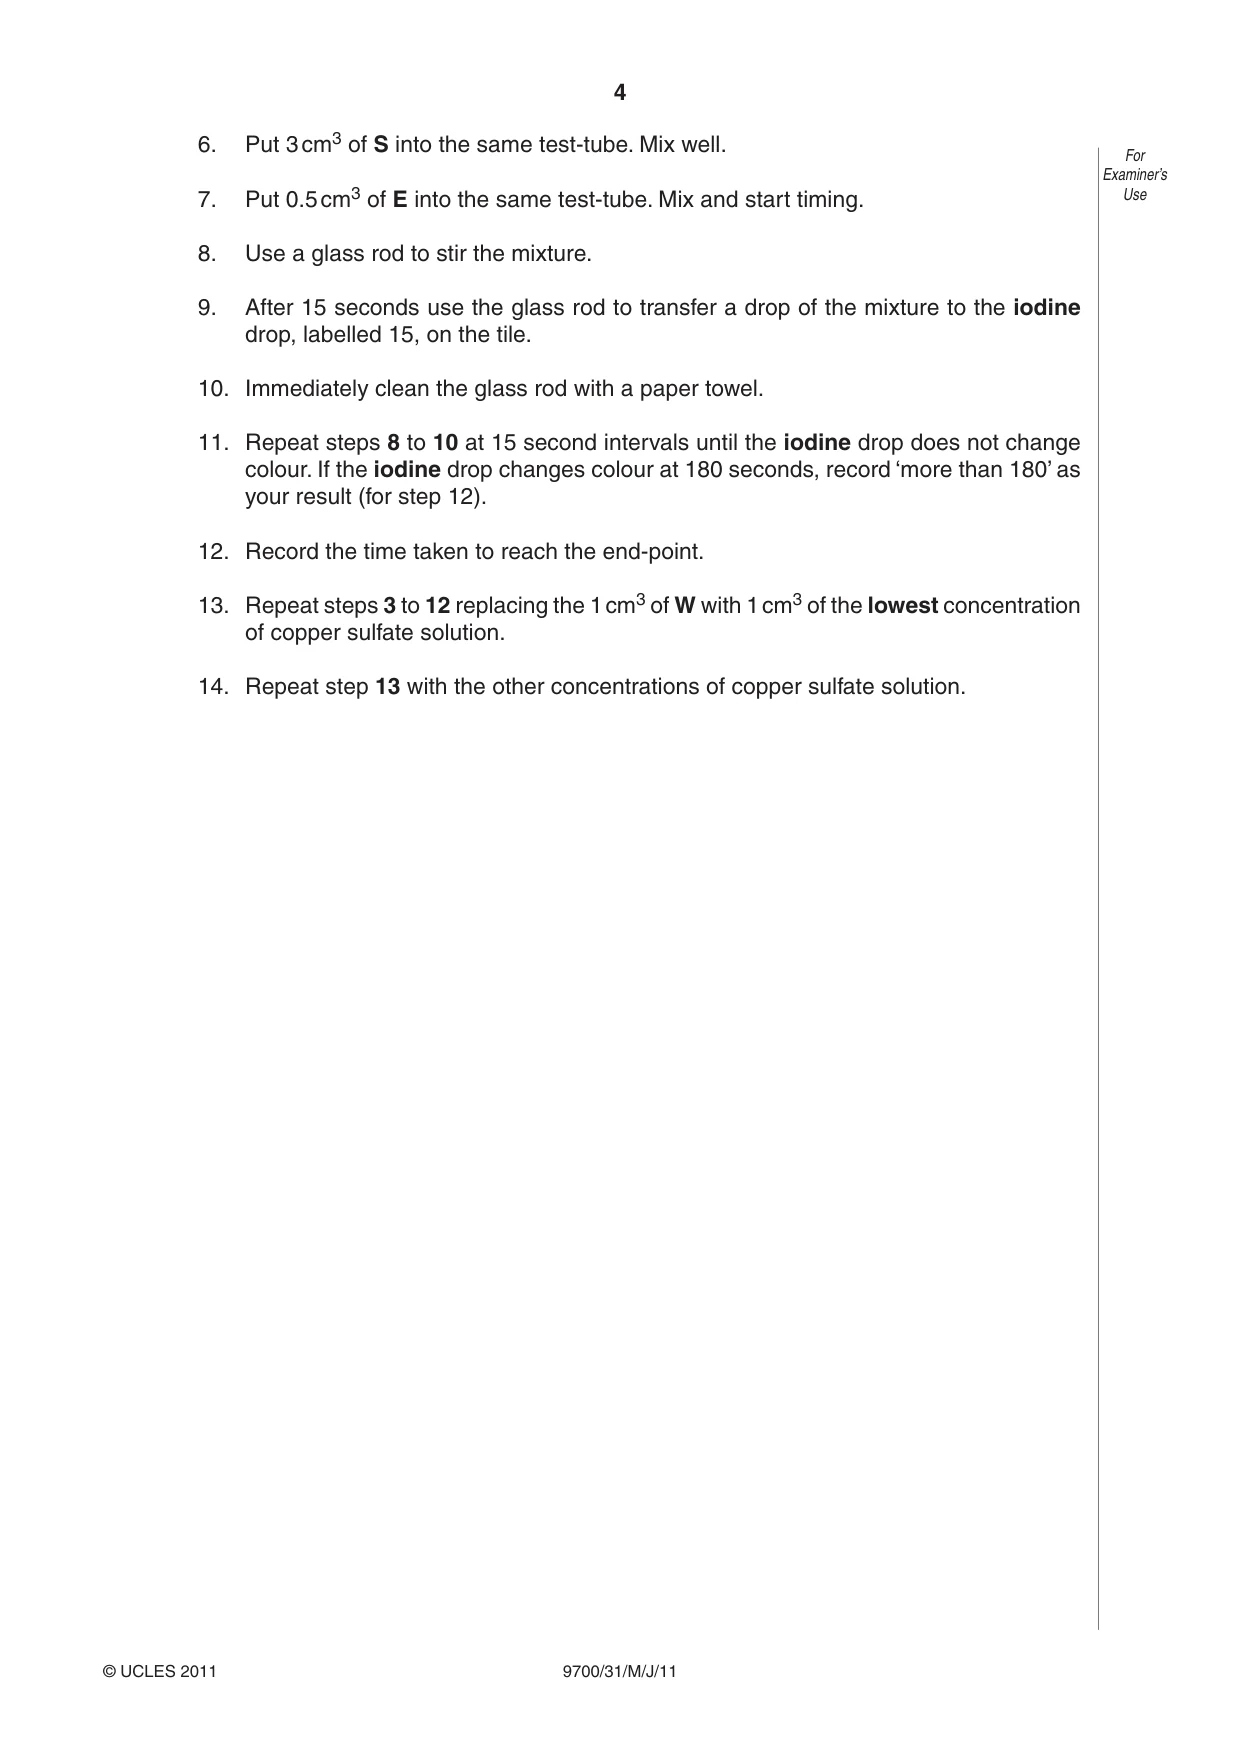
4 9700/31/M/J/11 © UCLES 2011 For Examiner’s Use 6. Put 3 cm3 of S into the same test-tube. Mix well. 7. Put 0.5 cm3 of E into the same test-tube. Mix and start timing. 8. Use a glass rod to stir the mixture. 9. After 15 seconds use the glass rod to transfer a drop of the mixture to the iodine drop, labelled 15, on the tile. 10. Immediately clean the glass rod with a paper towel. 11. Repeat steps 8 to 10 at 15 second intervals until the iodine drop does not change colour. If the iodine drop changes colour at 180 seconds, record ‘more than 180’ as your result (for step 12). 12. Record the time taken to reach the end-point. 13. Repeat steps 3 to 12 replacing the 1 cm3 of W with 1 cm3 of the lowest concentration of copper sulfate solution. 14. Repeat step 13 with the other concentrations of copper sulfate solution.
Question paper, page 5
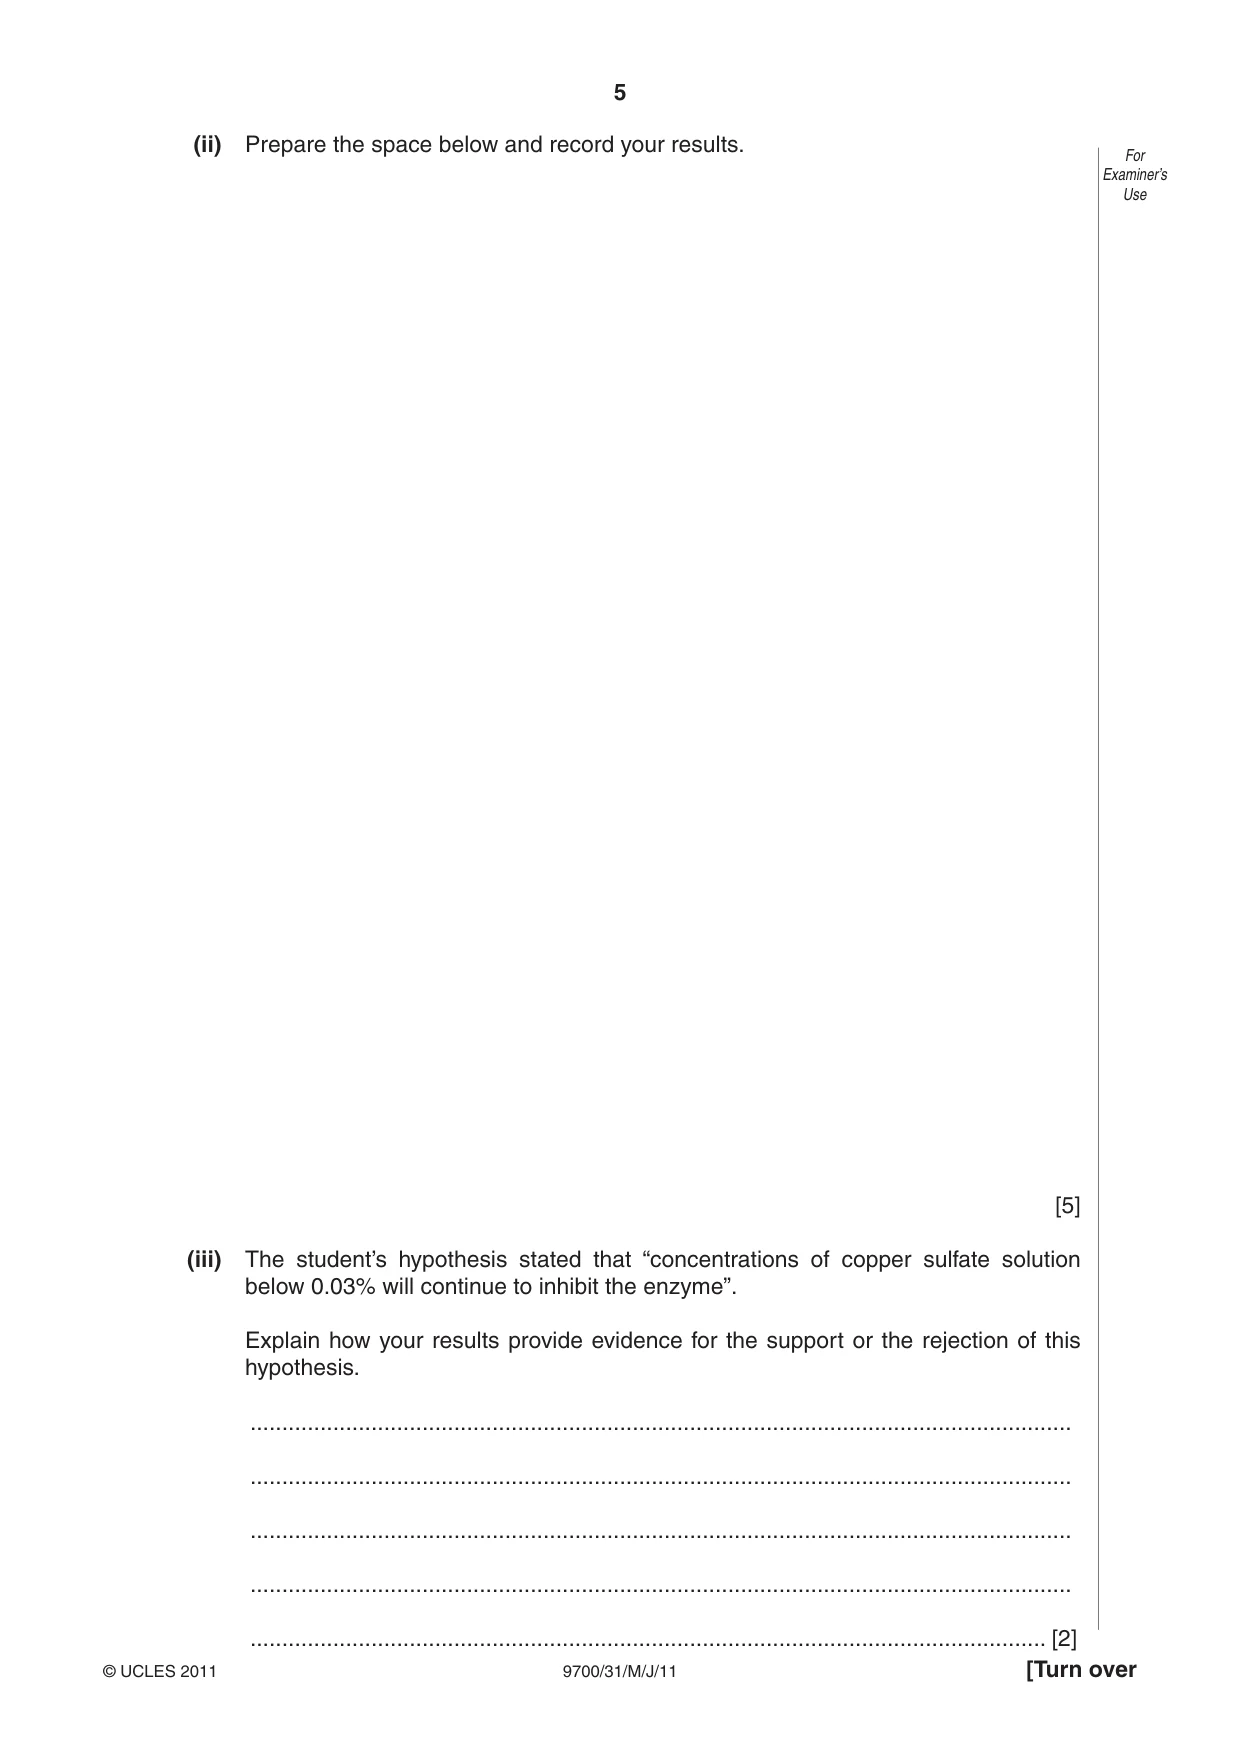
5 9700/31/M/J/11 © UCLES 2011 [Turn over For Examiner’s Use (ii) Prepare the space below and record your results. [5] (iii) The student’s hypothesis stated that “concentrations of copper sulfate solution below 0.03% will continue to inhibit the enzyme”. Explain how your results provide evidence for the support or the rejection of this hypothesis. … … … … … [2]
Question paper, page 6
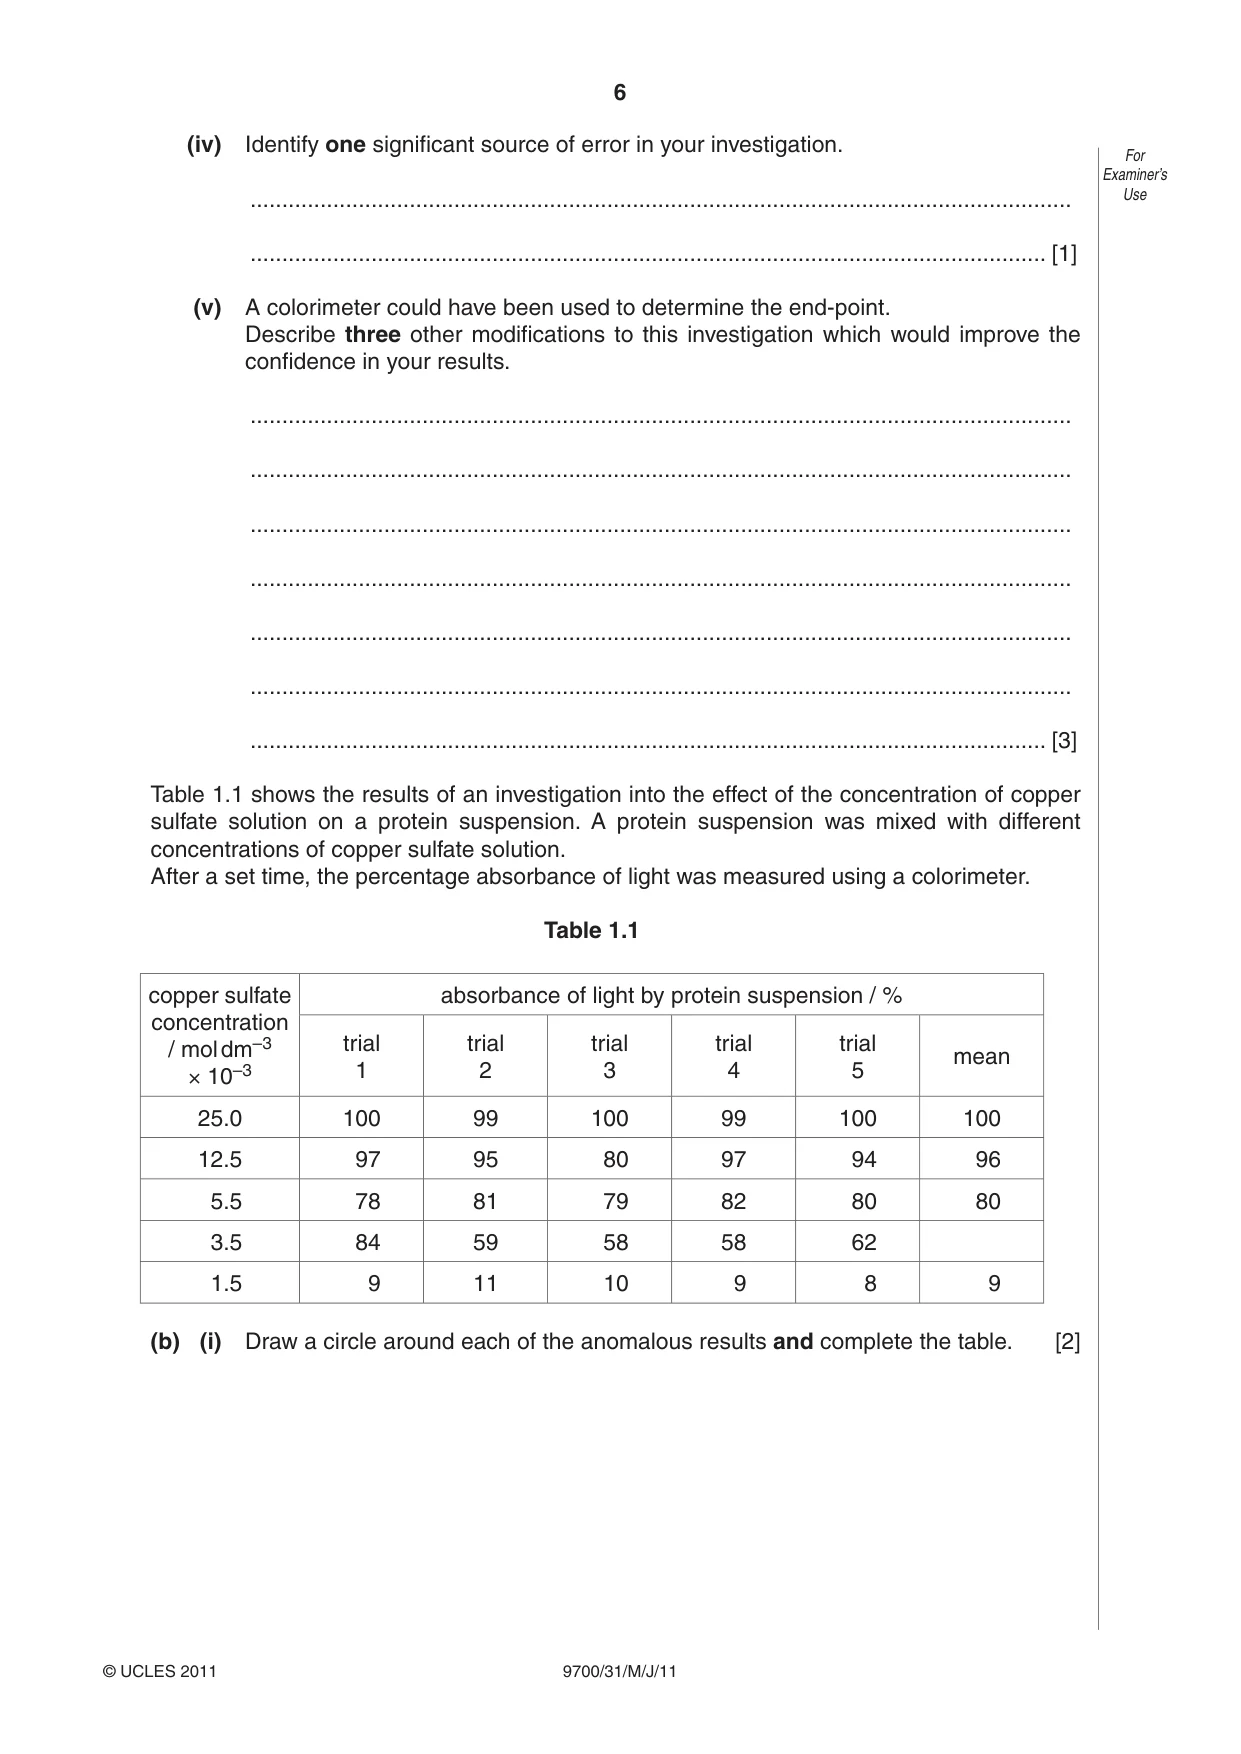
6 9700/31/M/J/11 © UCLES 2011 For Examiner’s Use (iv) Identify one significant source of error in your investigation. … … [1] (v) A colorimeter could have been used to determine the end-point. Describe three other modifications to this investigation which would improve the confidence in your results. … … … … … … … [3] Table 1.1 shows the results of an investigation into the effect of the concentration of copper sulfate solution on a protein suspension. A protein suspension was mixed with different concentrations of copper sulfate solution. After a set time, the percentage absorbance of light was measured using a colorimeter. Table 1.1 copper sulfate concentration / mol dm–3 × 10⁻³ absorbance of light by protein suspension / % trial 1 trial 2 trial 3 trial 4 trial 5 mean 25.0 100 99 100 99 100 100 12.5 97 95 80 97 94 96 5.5 78 81 79 82 80 80 3.5 84 59 58 58 62 1.5 9 11 10 9 8 9 (b) (i) Draw a circle around each of the anomalous results and complete the table. [2]
Question paper, page 7
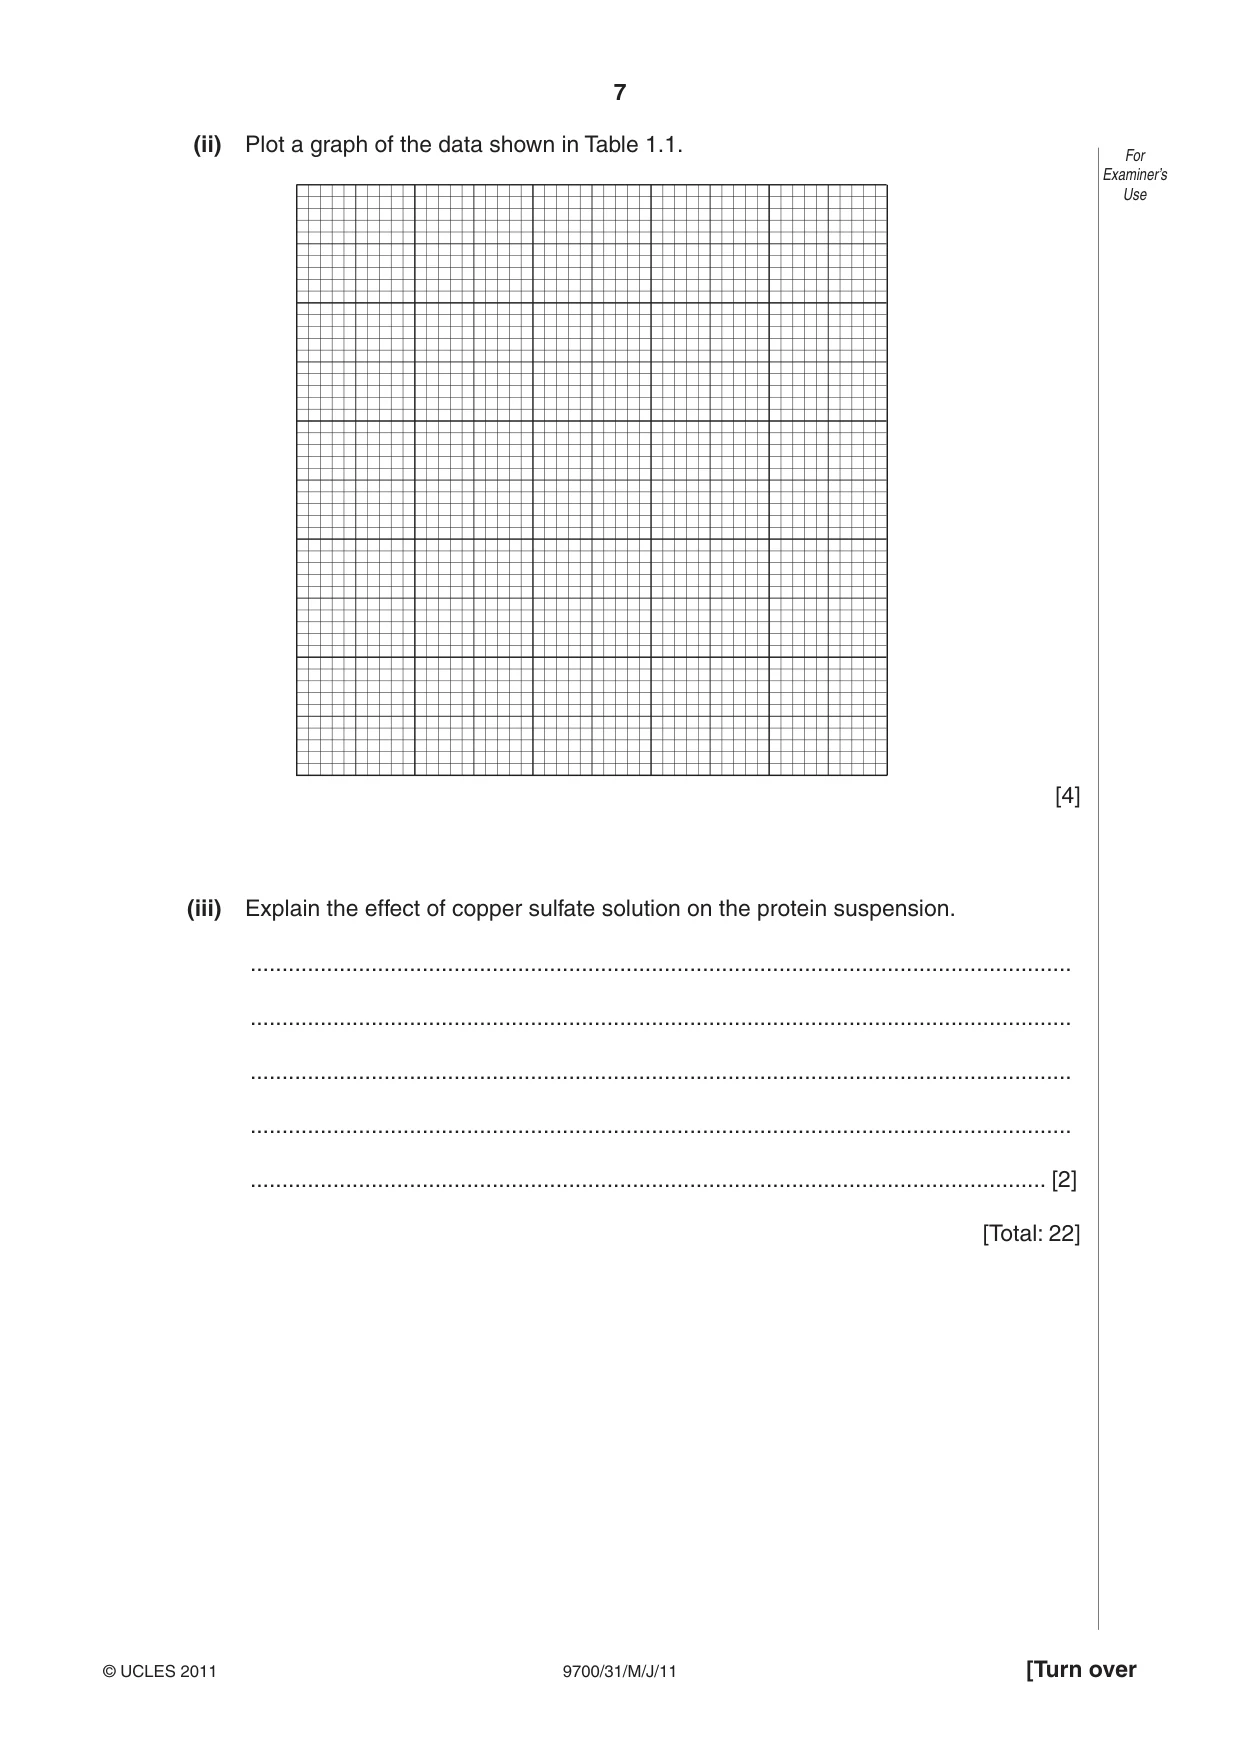
7 9700/31/M/J/11 © UCLES 2011 [Turn over For Examiner’s Use (ii) Plot a graph of the data shown in Table 1.1. [4] (iii) Explain the effect of copper sulfate solution on the protein suspension. … … … … … [2] [Total: 22]
Question paper, page 8
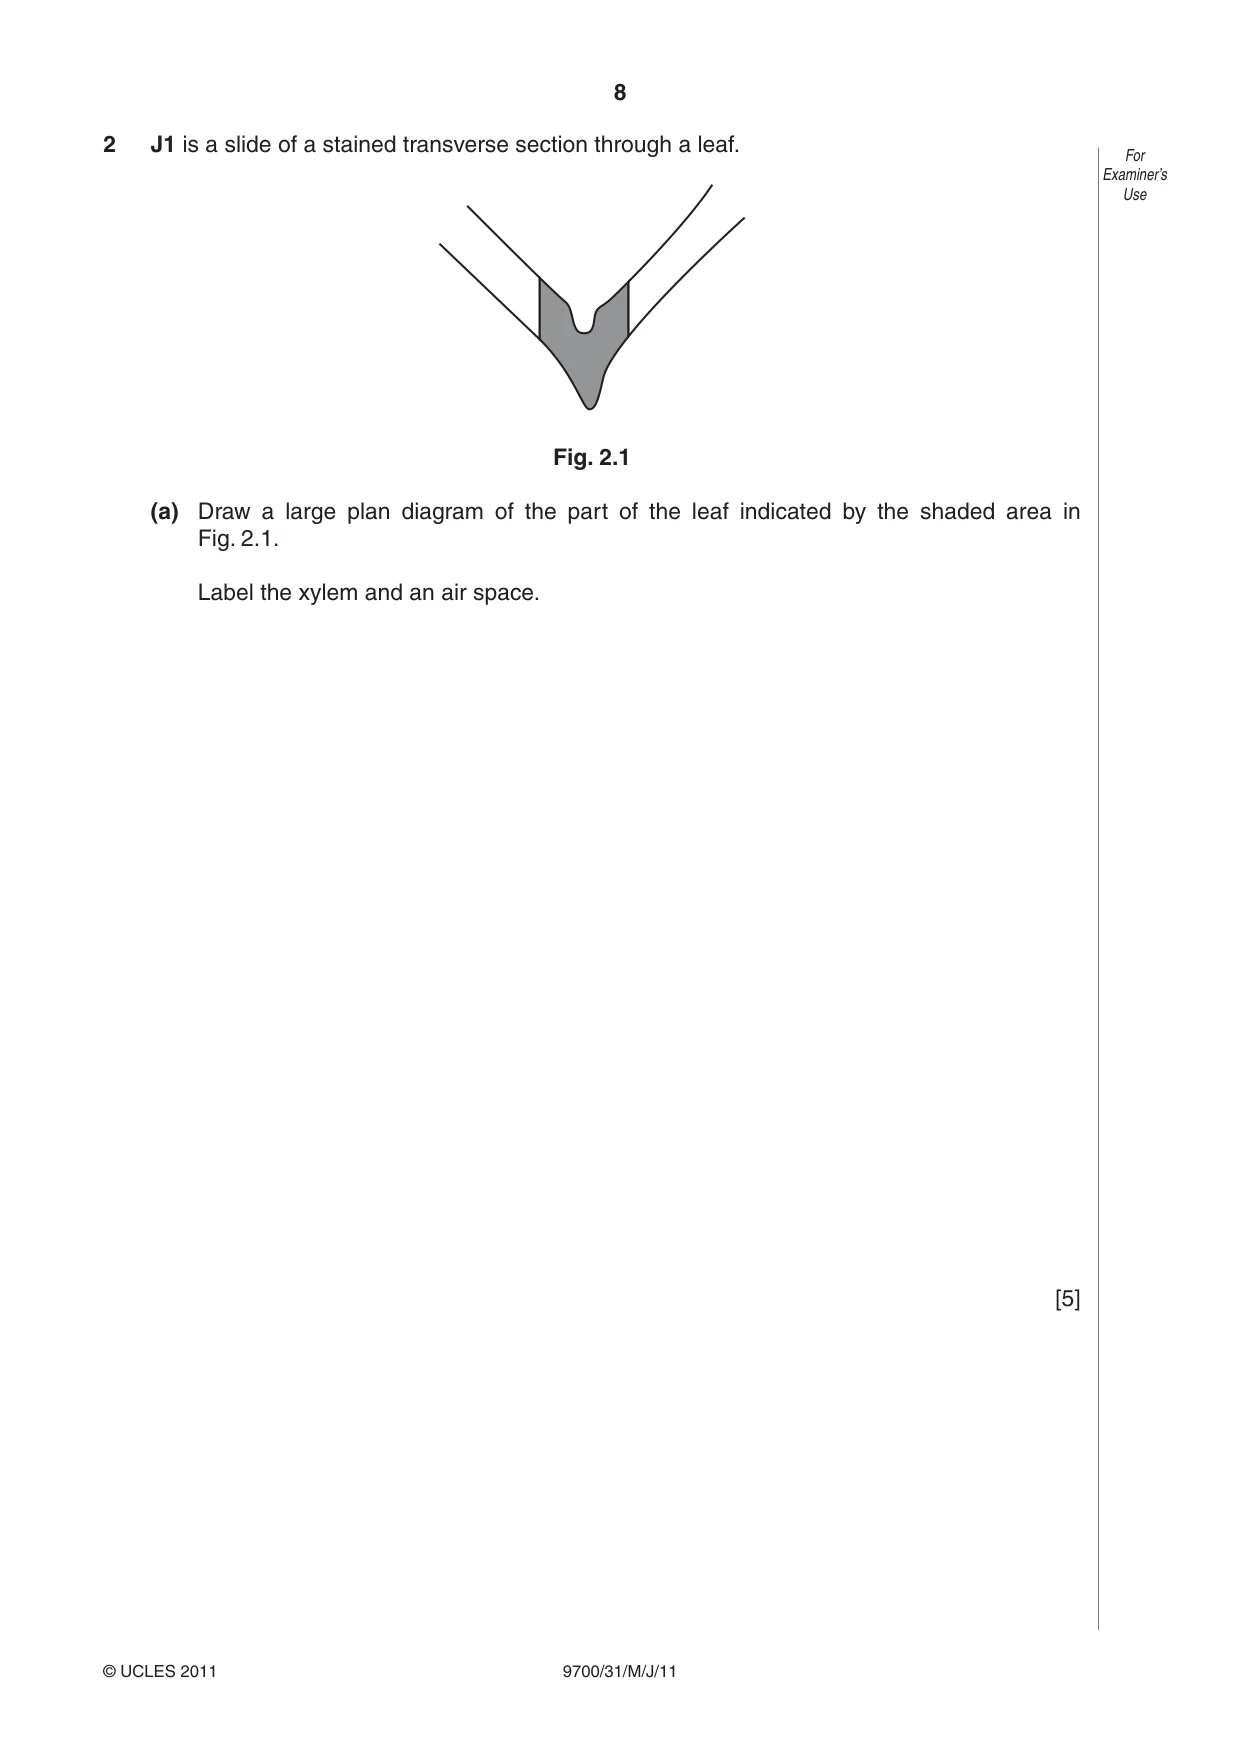
8 9700/31/M/J/11 © UCLES 2011 For Examiner’s Use 2 J1 is a slide of a stained transverse section through a leaf. Fig. 2.1 (a) Draw a large plan diagram of the part of the leaf indicated by the shaded area in Fig. 2.1. Label the xylem and an air space. [5]
Question paper, page 9
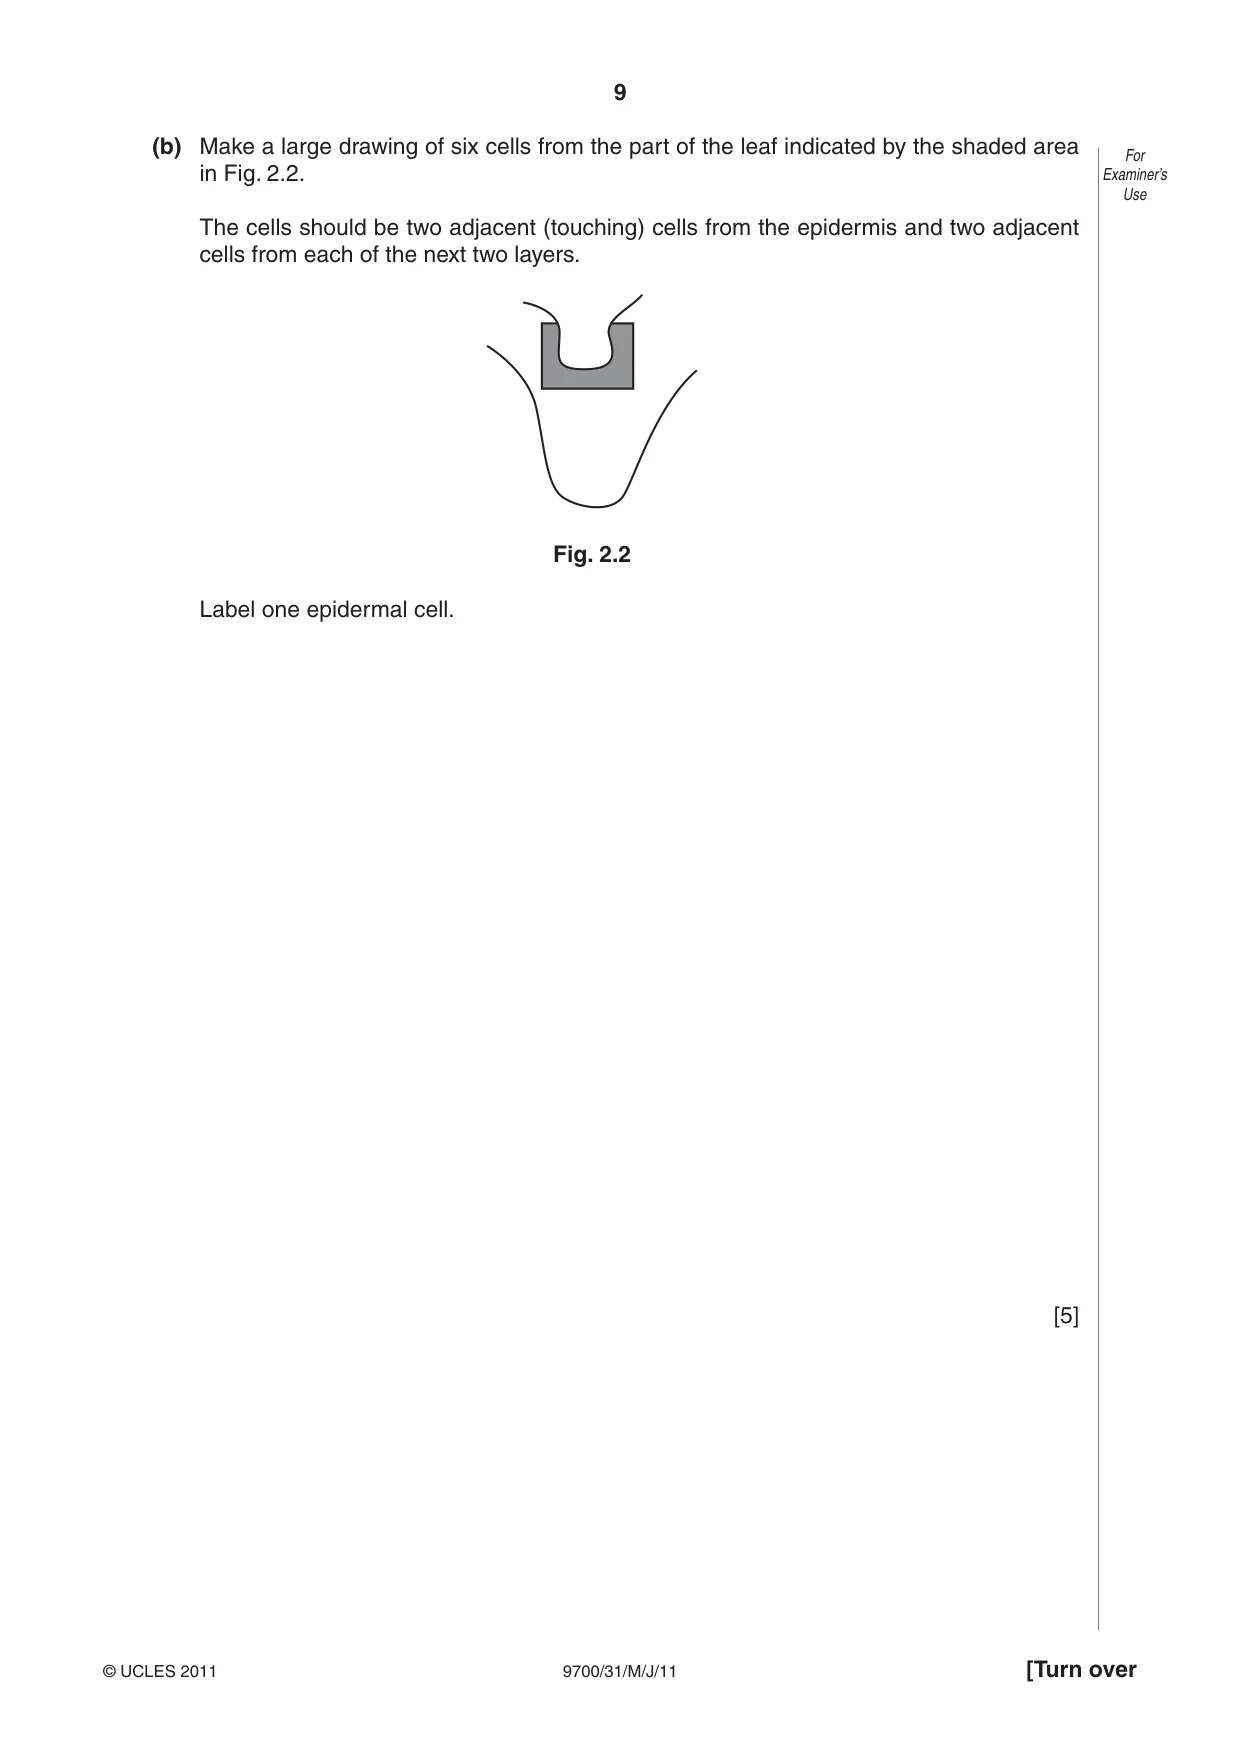
9 9700/31/M/J/11 © UCLES 2011 [Turn over For Examiner’s Use (b) Make a large drawing of six cells from the part of the leaf indicated by the shaded area in Fig. 2.2. The cells should be two adjacent (touching) cells from the epidermis and two adjacent cells from each of the next two layers. Fig. 2.2 Label one epidermal cell. [5]
Question paper, page 10
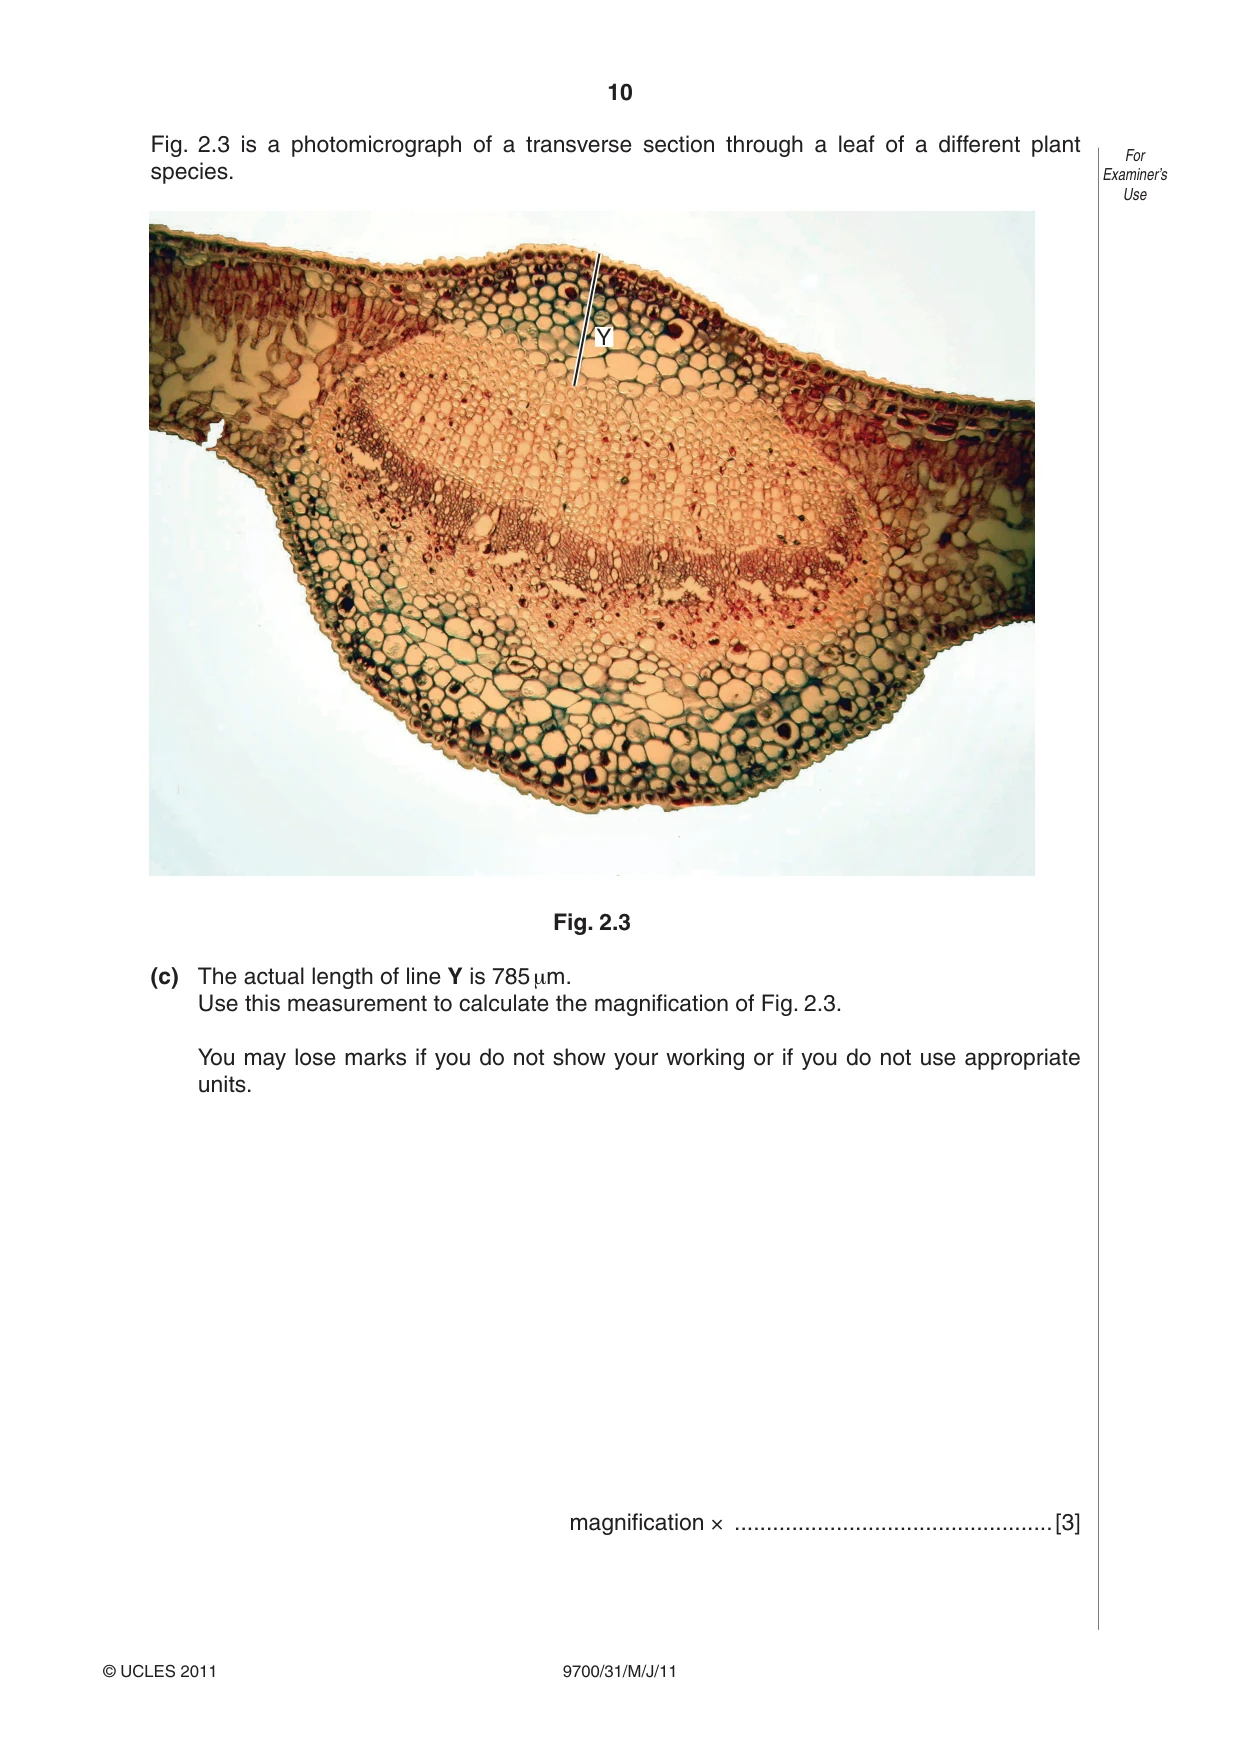
10 9700/31/M/J/11 © UCLES 2011 For Examiner’s Use Fig. 2.3 is a photomicrograph of a transverse section through a leaf of a different plant species. Y Fig. 2.3 (c) The actual length of line Y is 785 μm. Use this measurement to calculate the magnification of Fig. 2.3. You may lose marks if you do not show your working or if you do not use appropriate units. magnification × …[3]
Question paper, page 11
11 9700/31/M/J/11 © UCLES 2011 For Examiner’s Use (d) Prepare the space below so that it is suitable for you to record the observable differences between the specimens on J1 and in Fig. 2.3. Record your observations in the space you have prepared. [5] [Total: 18]
Question paper, page 12
12 9700/31/M/J/11 © UCLES 2011 BLANK PAGE Permission to reproduce items where third-party owned material protected by copyright is included has been sought and cleared where possible. Every reasonable effort has been made by the publisher (UCLES) to trace copyright holders, but if any items requiring clearance have unwittingly been included, the publisher will be pleased to make amends at the earliest possible opportunity. University of Cambridge International Examinations is part of the Cambridge Assessment Group. Cambridge Assessment is the brand name of University of Cambridge Local Examinations Syndicate (UCLES), which is itself a department of the University of Cambridge.
Mark scheme, page 1
UNIVERSITY OF CAMBRIDGE INTERNATIONAL EXAMINATIONS GCE Advanced Subsidiary Level and GCE Advanced Level MARK SCHEME for the May/June 2011 question paper for the guidance of teachers 9700 BIOLOGY 9700/31 Paper 31 (Advanced Practical Skills 1), maximum raw mark 40 This mark scheme is published as an aid to teachers and candidates, to indicate the requirements of the examination. It shows the basis on which Examiners were instructed to award marks. It does not indicate the details of the discussions that took place at an Examiners’ meeting before marking began, which would have considered the acceptability of alternative answers. Mark schemes must be read in conjunction with the question papers and the report on the examination. • Cambridge will not enter into discussions or correspondence in connection with these mark schemes. Cambridge is publishing the mark schemes for the May/June 2011 question papers for most IGCSE, GCE Advanced Level and Advanced Subsidiary Level syllabuses and some Ordinary Level syllabuses.
Mark scheme, page 2
Page 2 Mark Scheme: Teachers’ version Syllabus Paper GCE AS/A LEVEL – May/June 2011 9700 31 © University of Cambridge International Examinations 2011 Mark scheme abbreviations: ; separates marking points / alternative answers for the same point R reject A accept (for answers correctly cued by the question, or by extra guidance) AW alternative wording (where responses vary more than usual) underline actual word given must be used by candidate (grammatical variants excepted) max indicates the maximum number of marks that can be given ora or reverse argument MP marking point (with relevant number) ECF error carried forward I ignore ACE Analysis, Conclusions and Evaluation (skills) MMO Manipulations, Measurement and Observation (skills) PDO Presentation of Data and Observations (skills)
Mark scheme, page 3
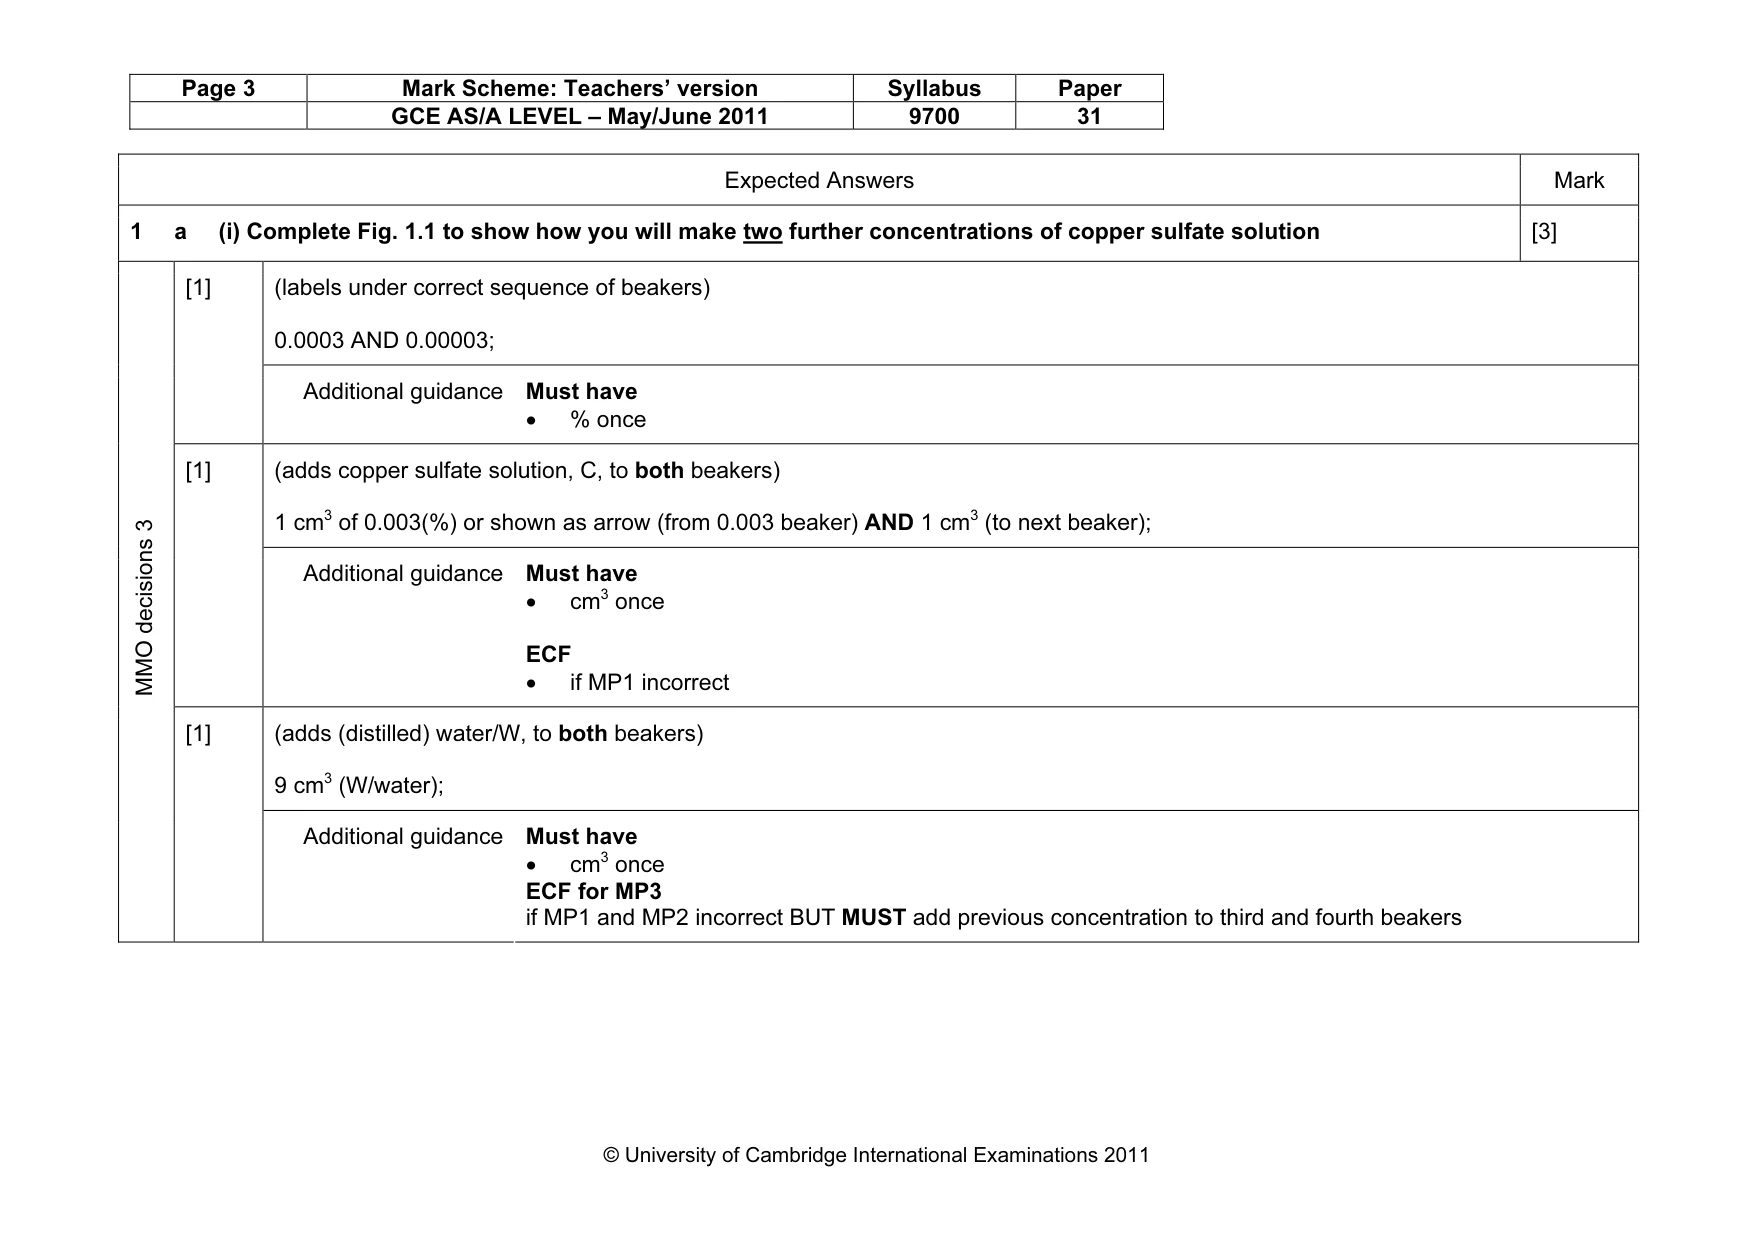
Page 3 Mark Scheme: Teachers’ version Syllabus Paper GCE AS/A LEVEL – May/June 2011 9700 31 © University of Cambridge International Examinations 2011 Expected Answers Mark 1 a (i) Complete Fig. 1.1 to show how you will make two further concentrations of copper sulfate solution [3] (labels under correct sequence of beakers) 0.0003 AND 0.00003; [1] Additional guidance Must have • % once (adds copper sulfate solution, C, to both beakers) 1 cm3 of 0.003(%) or shown as arrow (from 0.003 beaker) AND 1 cm3 (to next beaker); [1] Additional guidance Must have • cm3 once ECF • if MP1 incorrect (adds (distilled) water/W, to both beakers) 9 cm3 (W/water); MMO decisions 3 [1] Additional guidance Must have • cm3 once ECF for MP3 if MP1 and MP2 incorrect BUT MUST add previous concentration to third and fourth beakers
Mark scheme, page 4
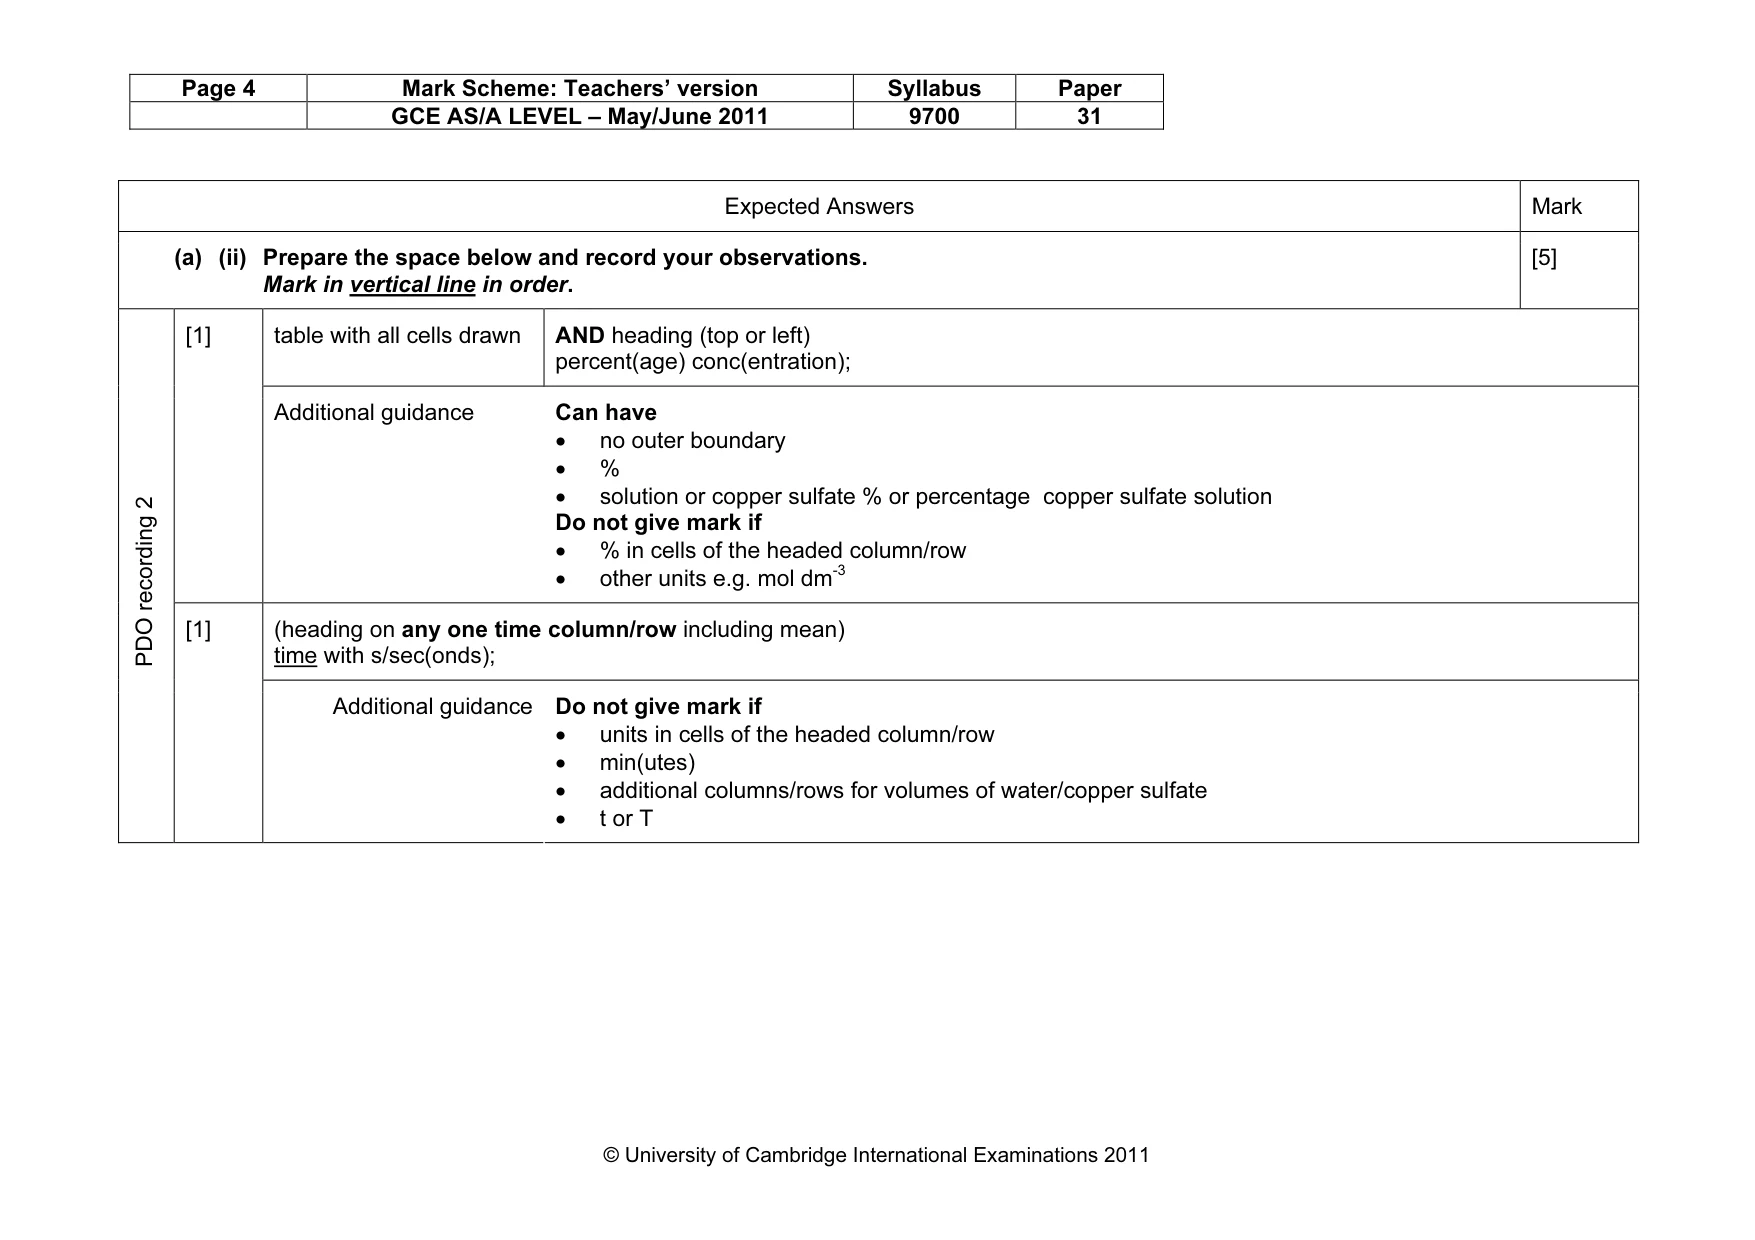
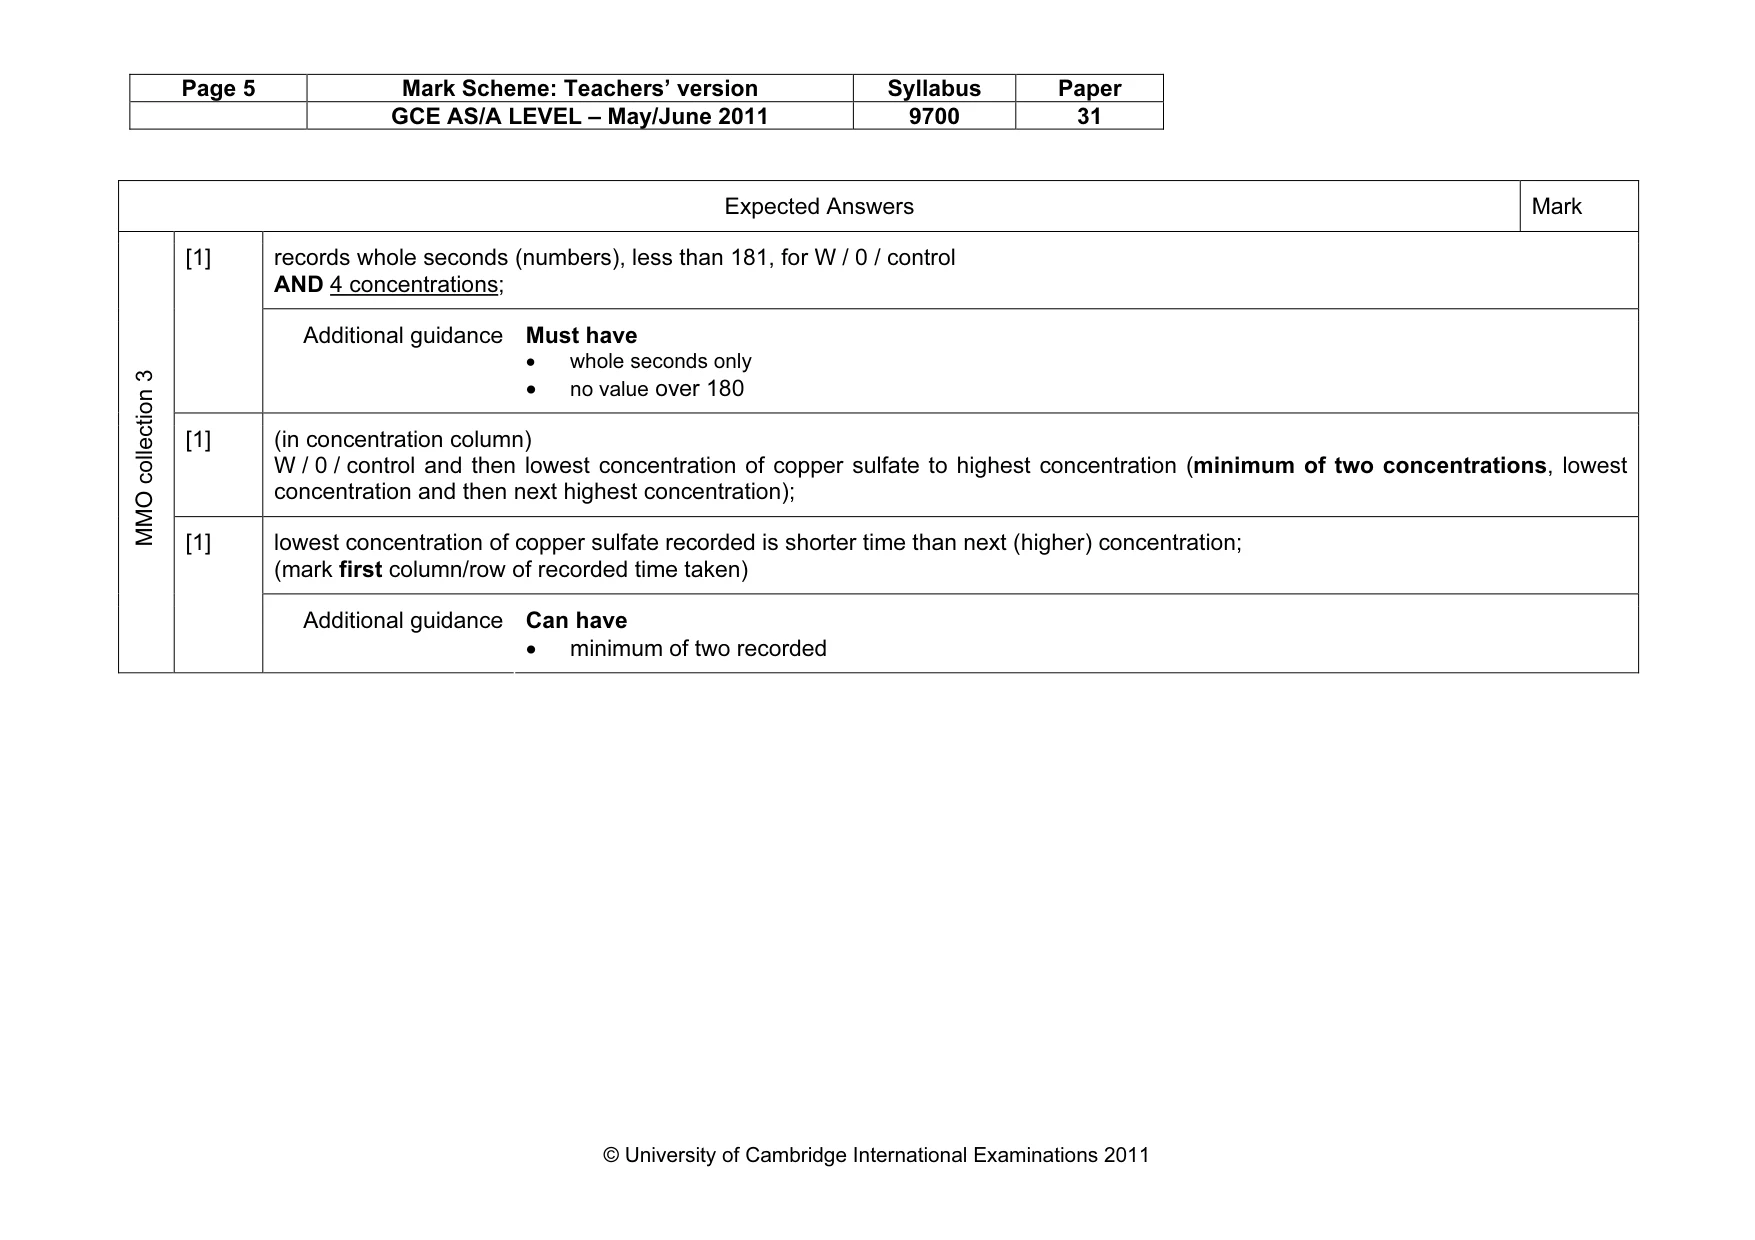
Page 4 Mark Scheme: Teachers’ version Syllabus Paper GCE AS/A LEVEL – May/June 2011 9700 31 © University of Cambridge International Examinations 2011 Expected Answers Mark (a) (ii) Prepare the space below and record your observations. Mark in vertical line in order. [5] table with all cells drawn AND heading (top or left) percent(age) conc(entration); [1] Additional guidance Can have • no outer boundary • % • solution or copper sulfate % or percentage copper sulfate solution Do not give mark if • % in cells of the headed column/row • other units e.g. mol dm-3 (heading on any one time column/row including mean) time with s/sec(onds); PDO recording 2 [1] Additional guidance Do not give mark if • units in cells of the headed column/row • min(utes) • additional columns/rows for volumes of water/copper sulfate • t or T
Mark scheme, page 5
Page 5 Mark Scheme: Teachers’ version Syllabus Paper GCE AS/A LEVEL – May/June 2011 9700 31 © University of Cambridge International Examinations 2011 Expected Answers Mark records whole seconds (numbers), less than 181, for W / 0 / control AND 4 concentrations; [1] Additional guidance Must have • whole seconds only • no value over 180 [1] (in concentration column) W / 0 / control and then lowest concentration of copper sulfate to highest concentration (minimum of two concentrations, lowest concentration and then next highest concentration); lowest concentration of copper sulfate recorded is shorter time than next (higher) concentration; (mark first column/row of recorded time taken) MMO collection 3 [1] Additional guidance Can have • minimum of two recorded
Mark scheme, page 6
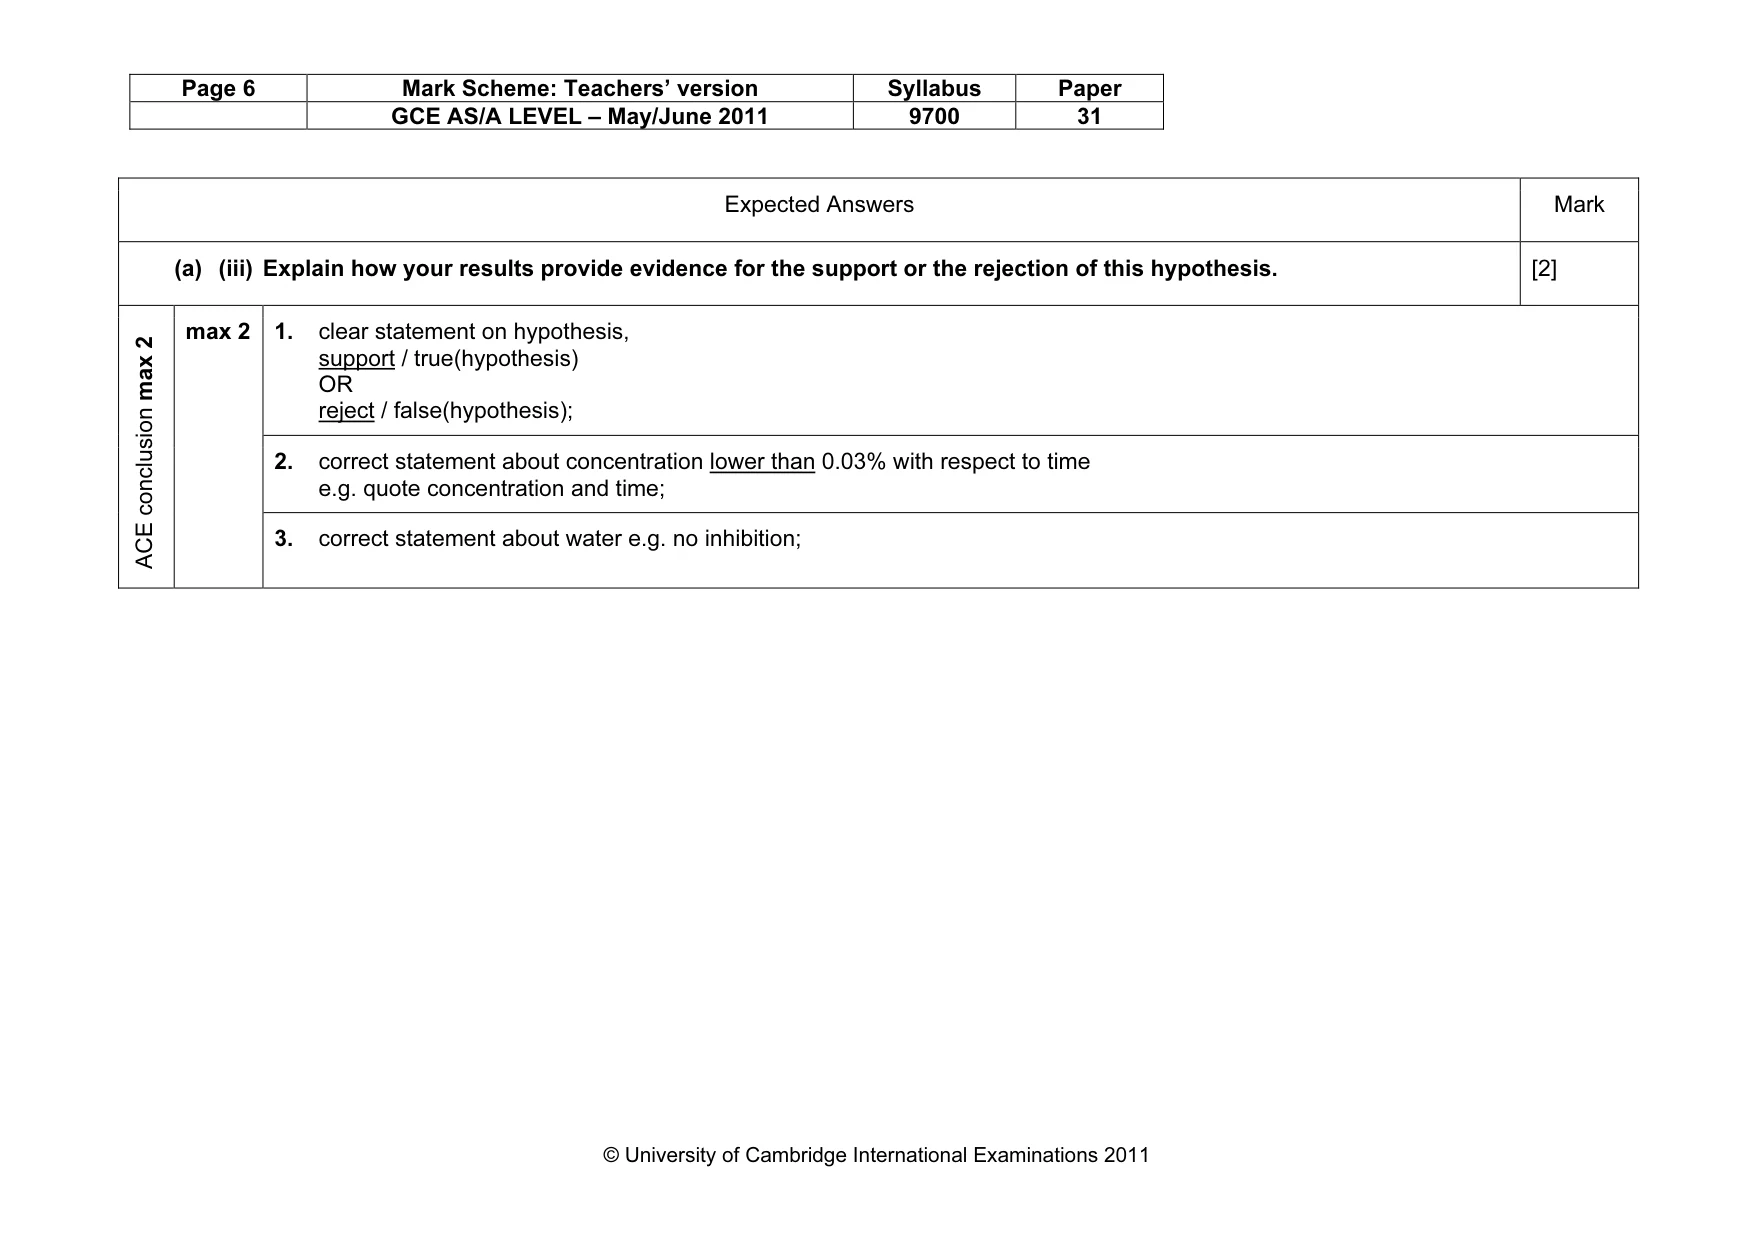
Page 6 Mark Scheme: Teachers’ version Syllabus Paper GCE AS/A LEVEL – May/June 2011 9700 31 © University of Cambridge International Examinations 2011 Expected Answers Mark (a) (iii) Explain how your results provide evidence for the support or the rejection of this hypothesis. [2] 1. clear statement on hypothesis, support / true(hypothesis) OR reject / false(hypothesis); 2. correct statement about concentration lower than 0.03% with respect to time e.g. quote concentration and time; ACE conclusion max 2 max 2 3. correct statement about water e.g. no inhibition;
Mark scheme, page 7
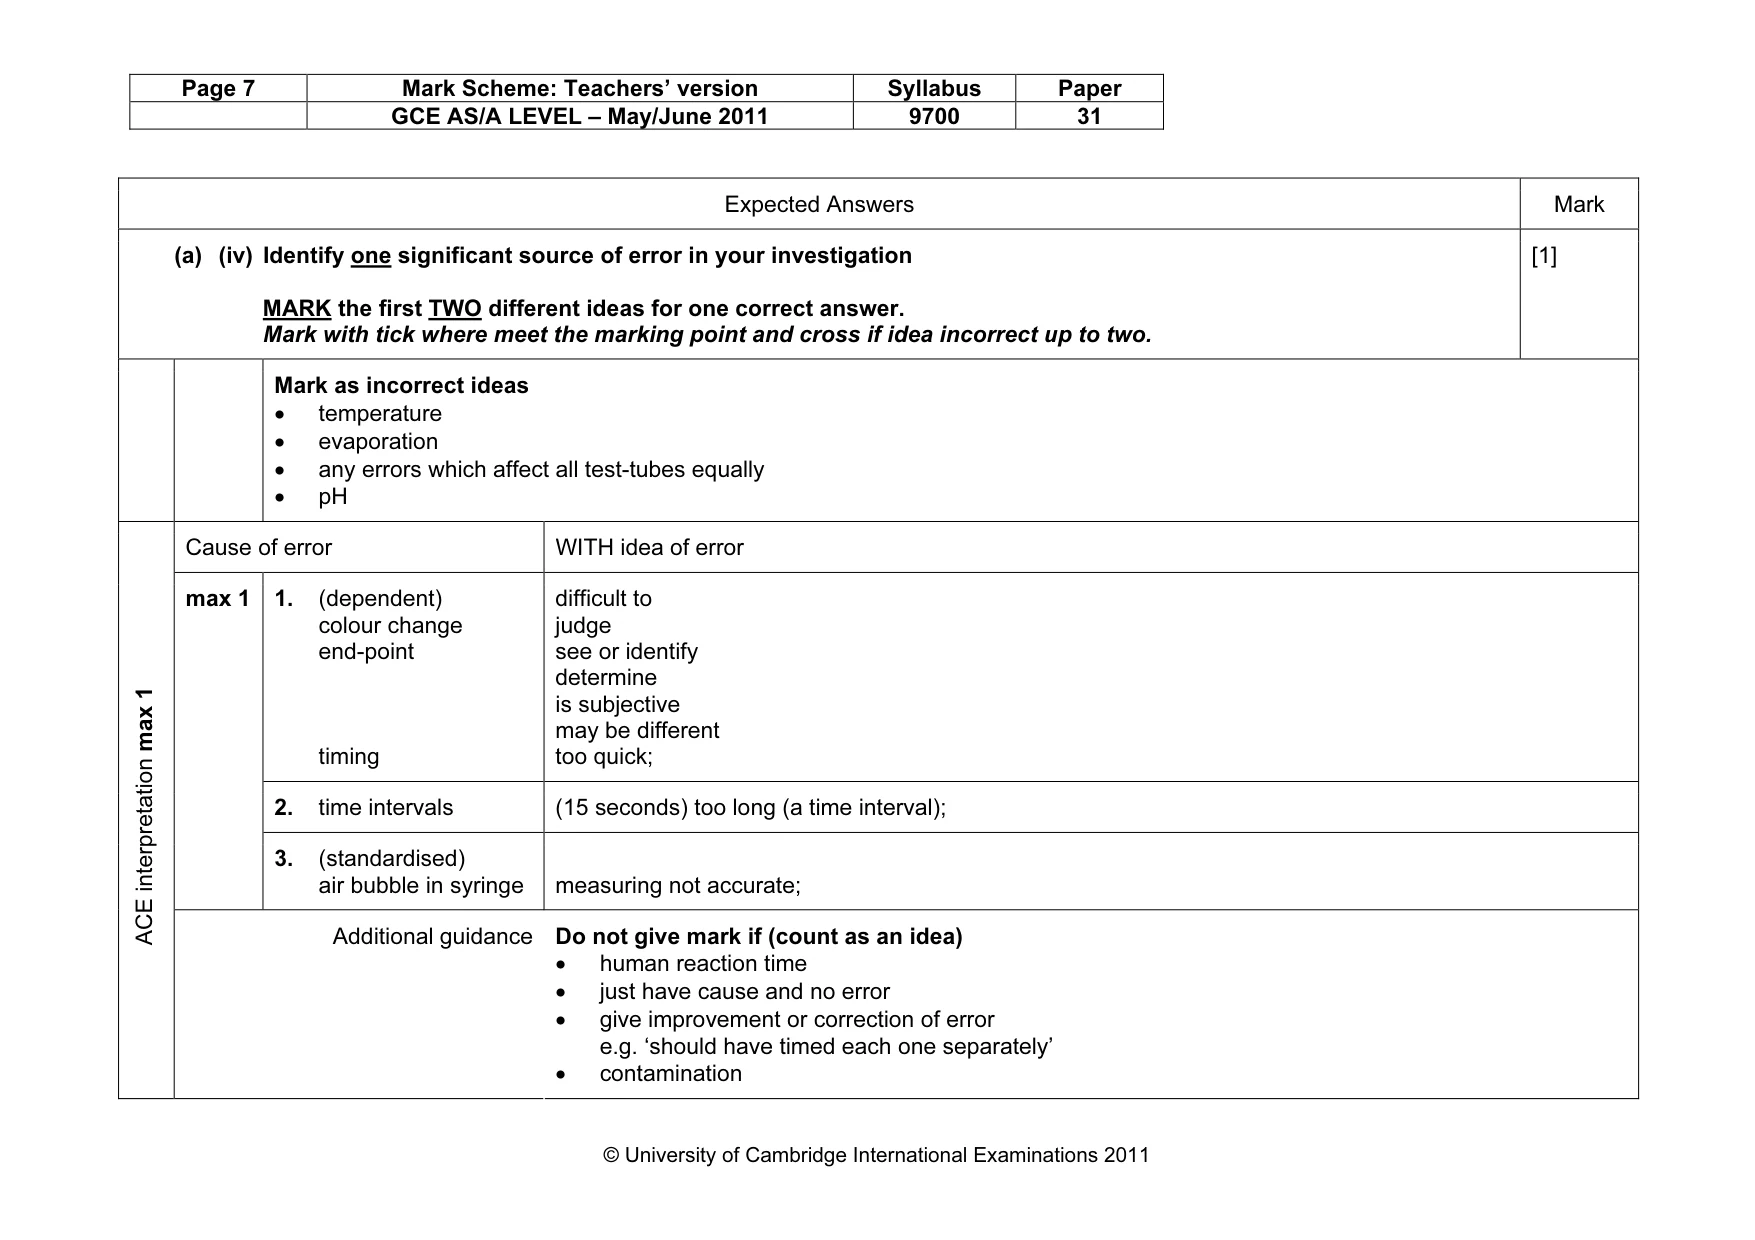
Page 7 Mark Scheme: Teachers’ version Syllabus Paper GCE AS/A LEVEL – May/June 2011 9700 31 © University of Cambridge International Examinations 2011 Expected Answers Mark (a) (iv) Identify one significant source of error in your investigation MARK the first TWO different ideas for one correct answer. Mark with tick where meet the marking point and cross if idea incorrect up to two. [1] Mark as incorrect ideas • temperature • evaporation • any errors which affect all test-tubes equally • pH Cause of error WITH idea of error 1. (dependent) colour change end-point timing difficult to judge see or identify determine is subjective may be different too quick; 2. time intervals (15 seconds) too long (a time interval); max 1 3. (standardised) air bubble in syringe measuring not accurate; ACE interpretation max 1 Additional guidance Do not give mark if (count as an idea) • human reaction time • just have cause and no error • give improvement or correction of error e.g. ‘should have timed each one separately’ • contamination
Mark scheme, page 8
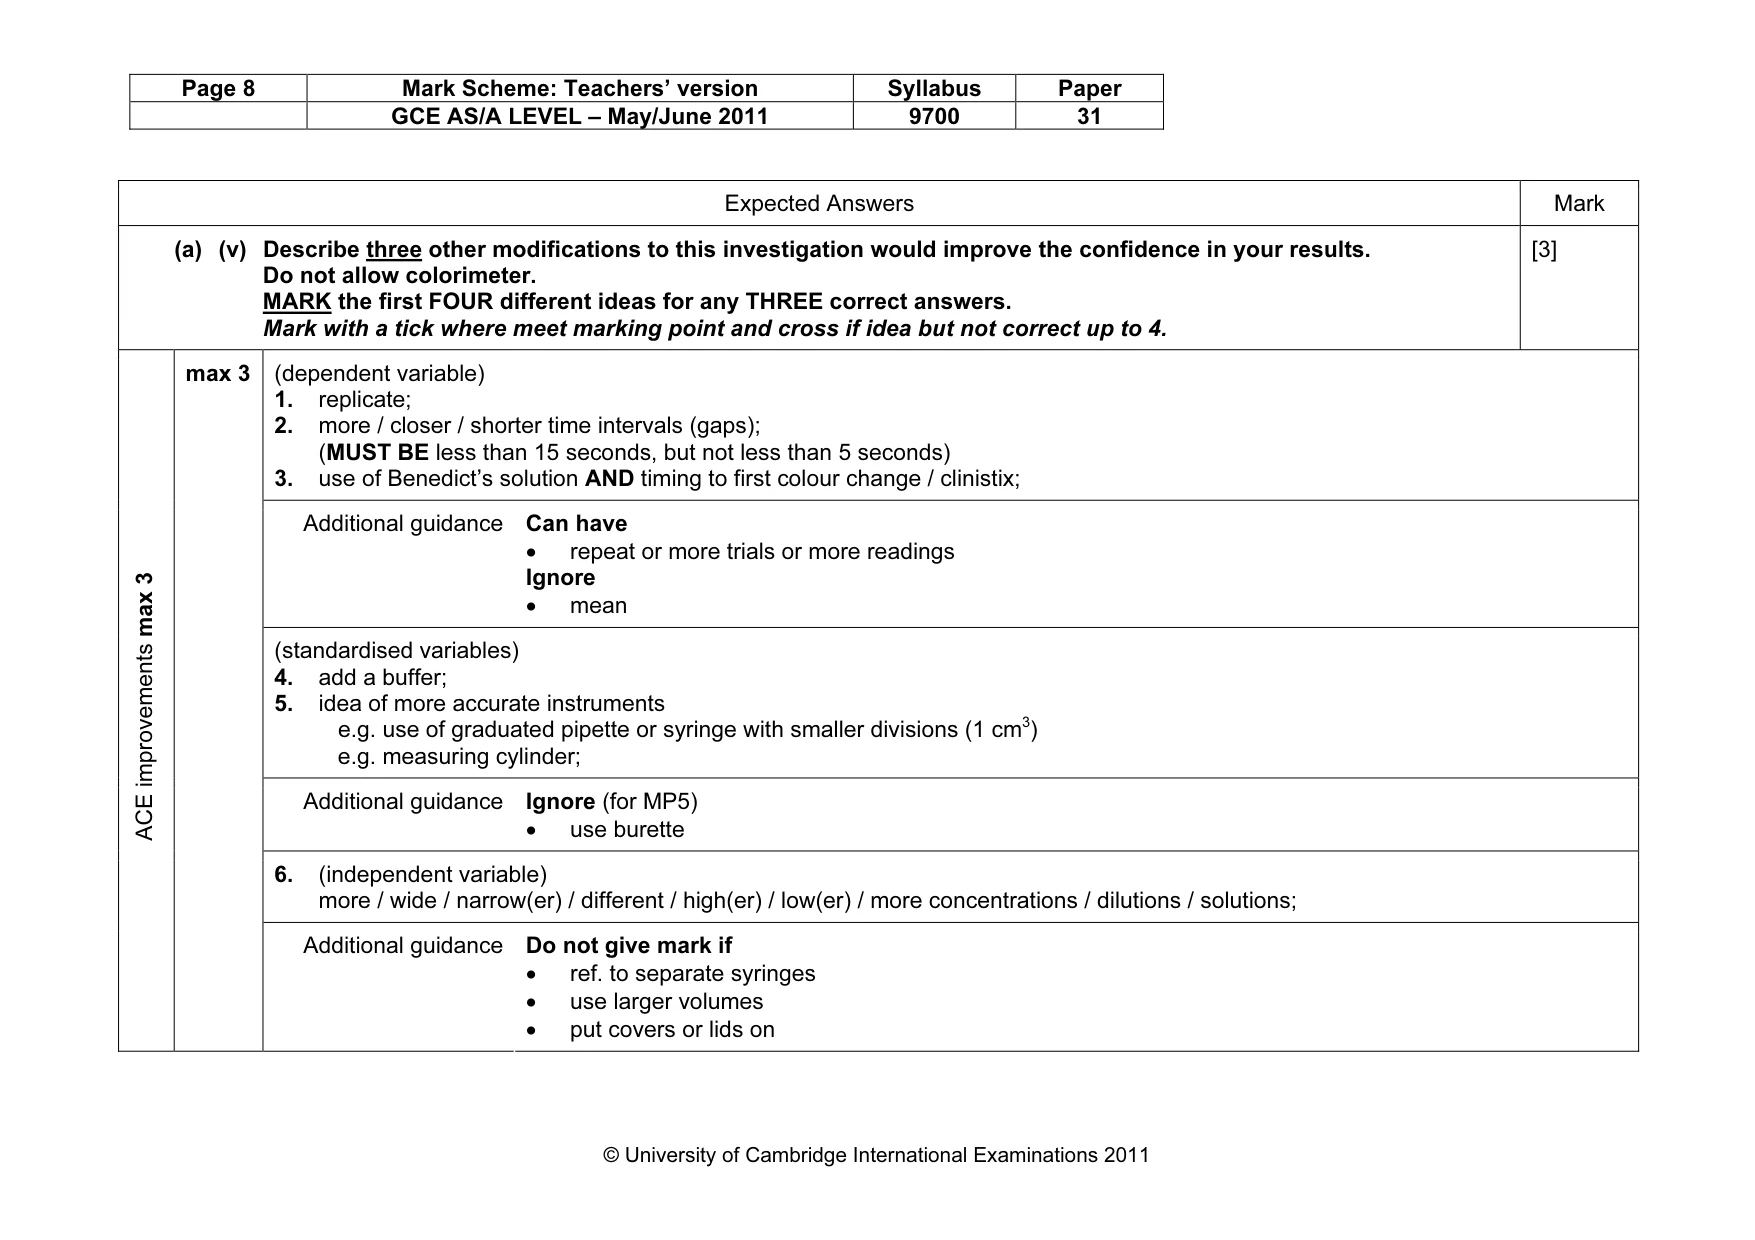
Page 8 Mark Scheme: Teachers’ version Syllabus Paper GCE AS/A LEVEL – May/June 2011 9700 31 © University of Cambridge International Examinations 2011 Expected Answers Mark (a) (v) Describe three other modifications to this investigation would improve the confidence in your results. Do not allow colorimeter. MARK the first FOUR different ideas for any THREE correct answers. Mark with a tick where meet marking point and cross if idea but not correct up to 4. [3] (dependent variable) 1. replicate; 2. more / closer / shorter time intervals (gaps); (MUST BE less than 15 seconds, but not less than 5 seconds) 3. use of Benedict’s solution AND timing to first colour change / clinistix; Additional guidance Can have • repeat or more trials or more readings Ignore • mean (standardised variables) 4. add a buffer; 5. idea of more accurate instruments e.g. use of graduated pipette or syringe with smaller divisions (1 cm3) e.g. measuring cylinder; Additional guidance Ignore (for MP5) • use burette 6. (independent variable) more / wide / narrow(er) / different / high(er) / low(er) / more concentrations / dilutions / solutions; ACE improvements max 3 max 3 Additional guidance Do not give mark if • ref. to separate syringes • use larger volumes • put covers or lids on
Mark scheme, page 9
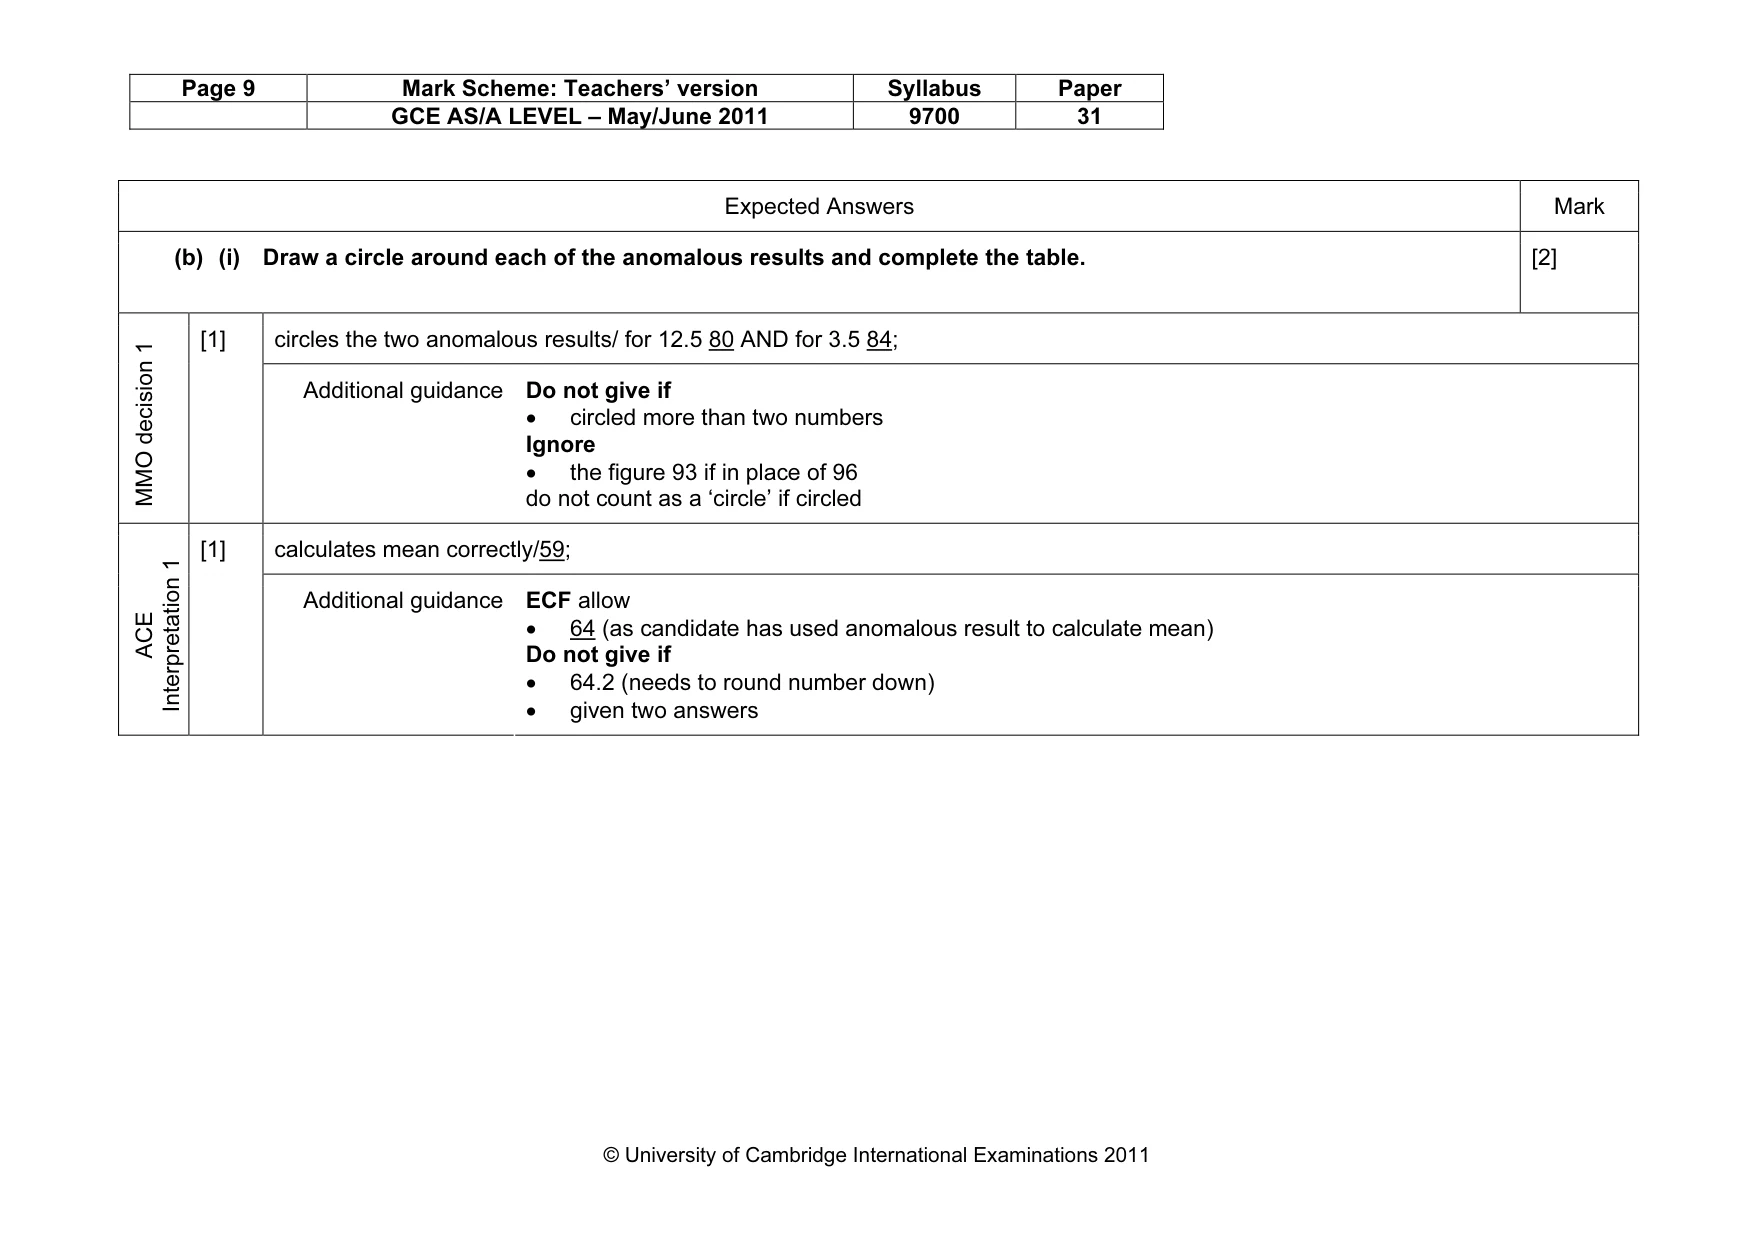
Page 9 Mark Scheme: Teachers’ version Syllabus Paper GCE AS/A LEVEL – May/June 2011 9700 31 © University of Cambridge International Examinations 2011 Expected Answers Mark (b) (i) Draw a circle around each of the anomalous results and complete the table. [2] circles the two anomalous results/ for 12.5 80 AND for 3.5 84; MMO decision 1 [1] Additional guidance Do not give if • circled more than two numbers Ignore • the figure 93 if in place of 96 do not count as a ‘circle’ if circled calculates mean correctly/59; ACE Interpretation 1 [1] Additional guidance ECF allow • 64 (as candidate has used anomalous result to calculate mean) Do not give if • 64.2 (needs to round number down) • given two answers
Mark scheme, page 10
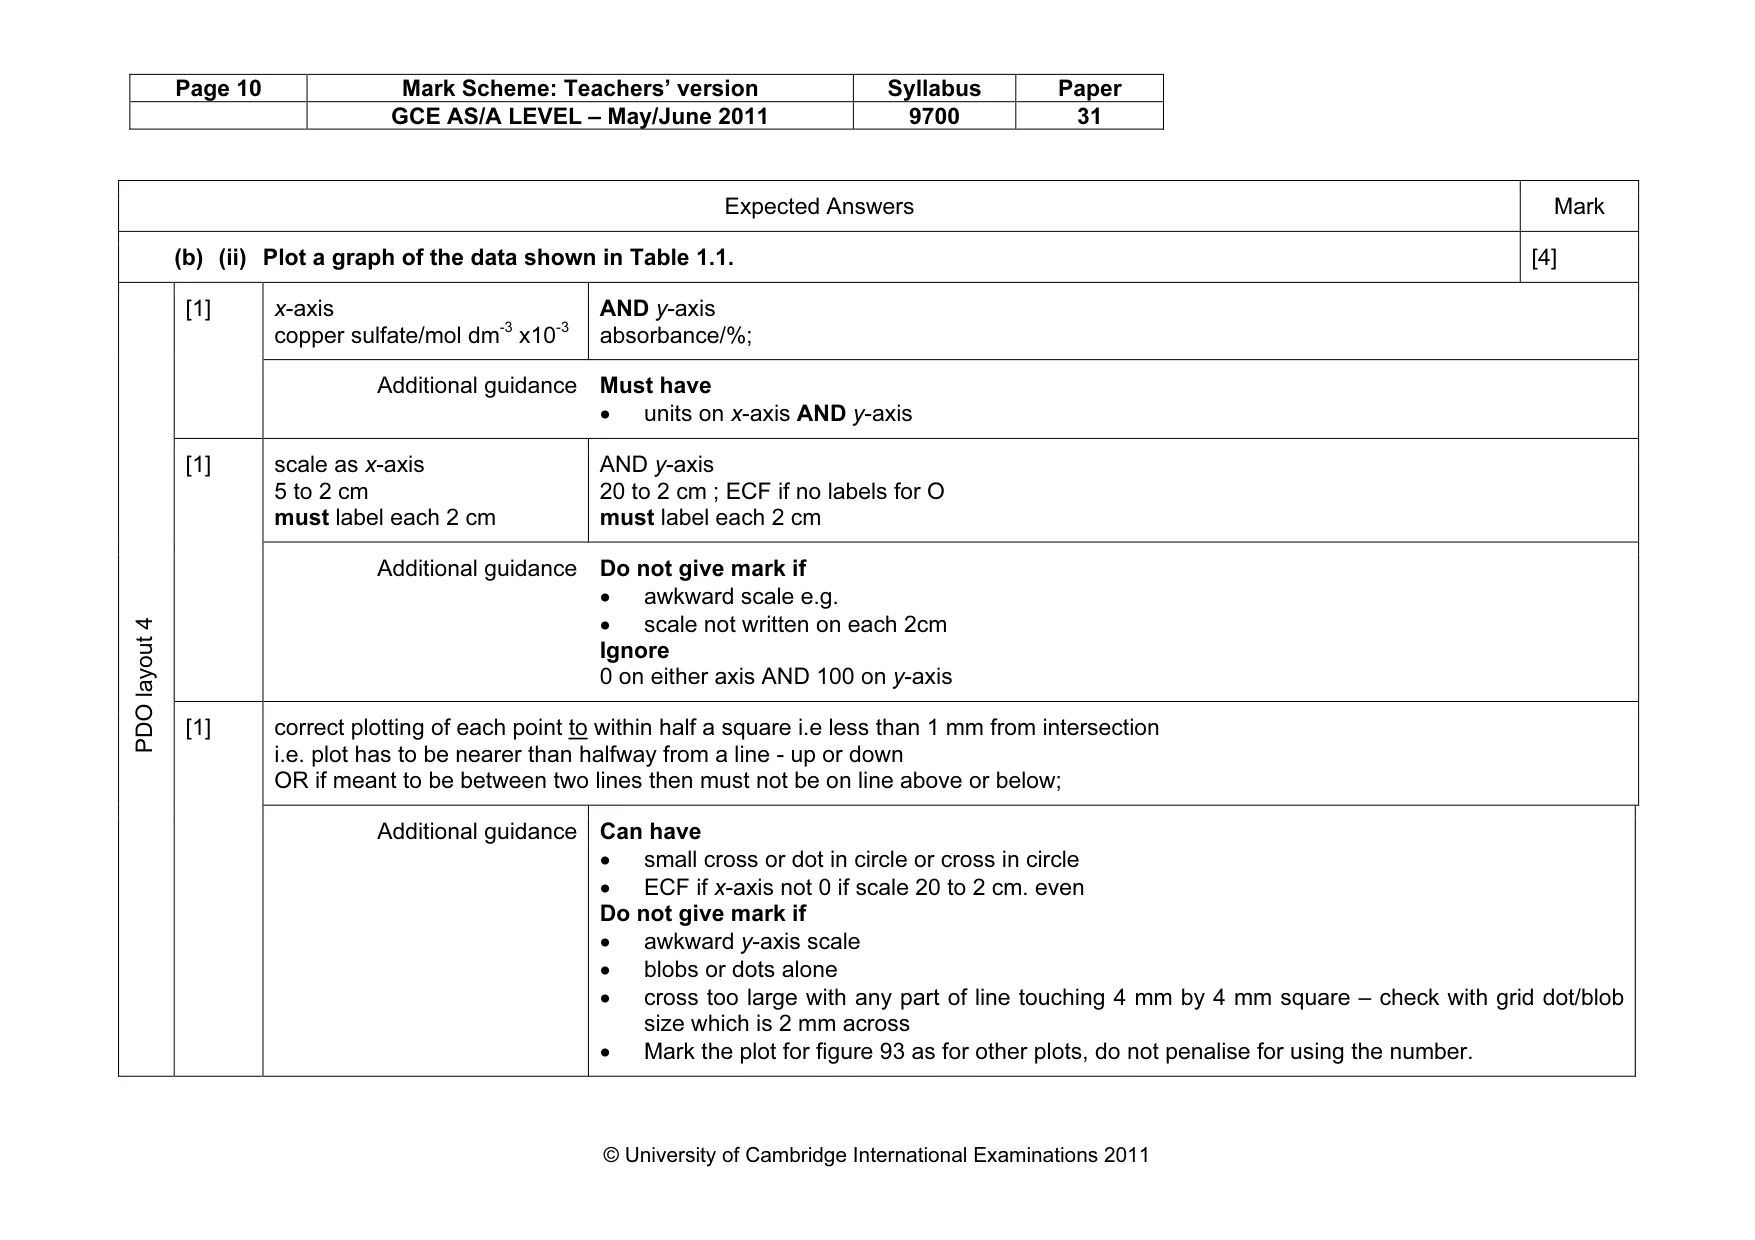
Page 10 Mark Scheme: Teachers’ version Syllabus Paper GCE AS/A LEVEL – May/June 2011 9700 31 © University of Cambridge International Examinations 2011 Expected Answers Mark (b) (ii) Plot a graph of the data shown in Table 1.1. [4] x-axis copper sulfate/mol dm-3 x10⁻³ AND y-axis absorbance/%; [1] Additional guidance Must have • units on x-axis AND y-axis scale as x-axis 5 to 2 cm must label each 2 cm AND y-axis 20 to 2 cm ; ECF if no labels for O must label each 2 cm [1] Additional guidance Do not give mark if • awkward scale e.g. • scale not written on each 2cm Ignore 0 on either axis AND 100 on y-axis correct plotting of each point to within half a square i.e less than 1 mm from intersection i.e. plot has to be nearer than halfway from a line - up or down OR if meant to be between two lines then must not be on line above or below; PDO layout 4 [1] Additional guidance Can have • small cross or dot in circle or cross in circle • ECF if x-axis not 0 if scale 20 to 2 cm. even Do not give mark if • awkward y-axis scale • blobs or dots alone • cross too large with any part of line touching 4 mm by 4 mm square – check with grid dot/blob size which is 2 mm across • Mark the plot for figure 93 as for other plots, do not penalise for using the number.
Mark scheme, page 11
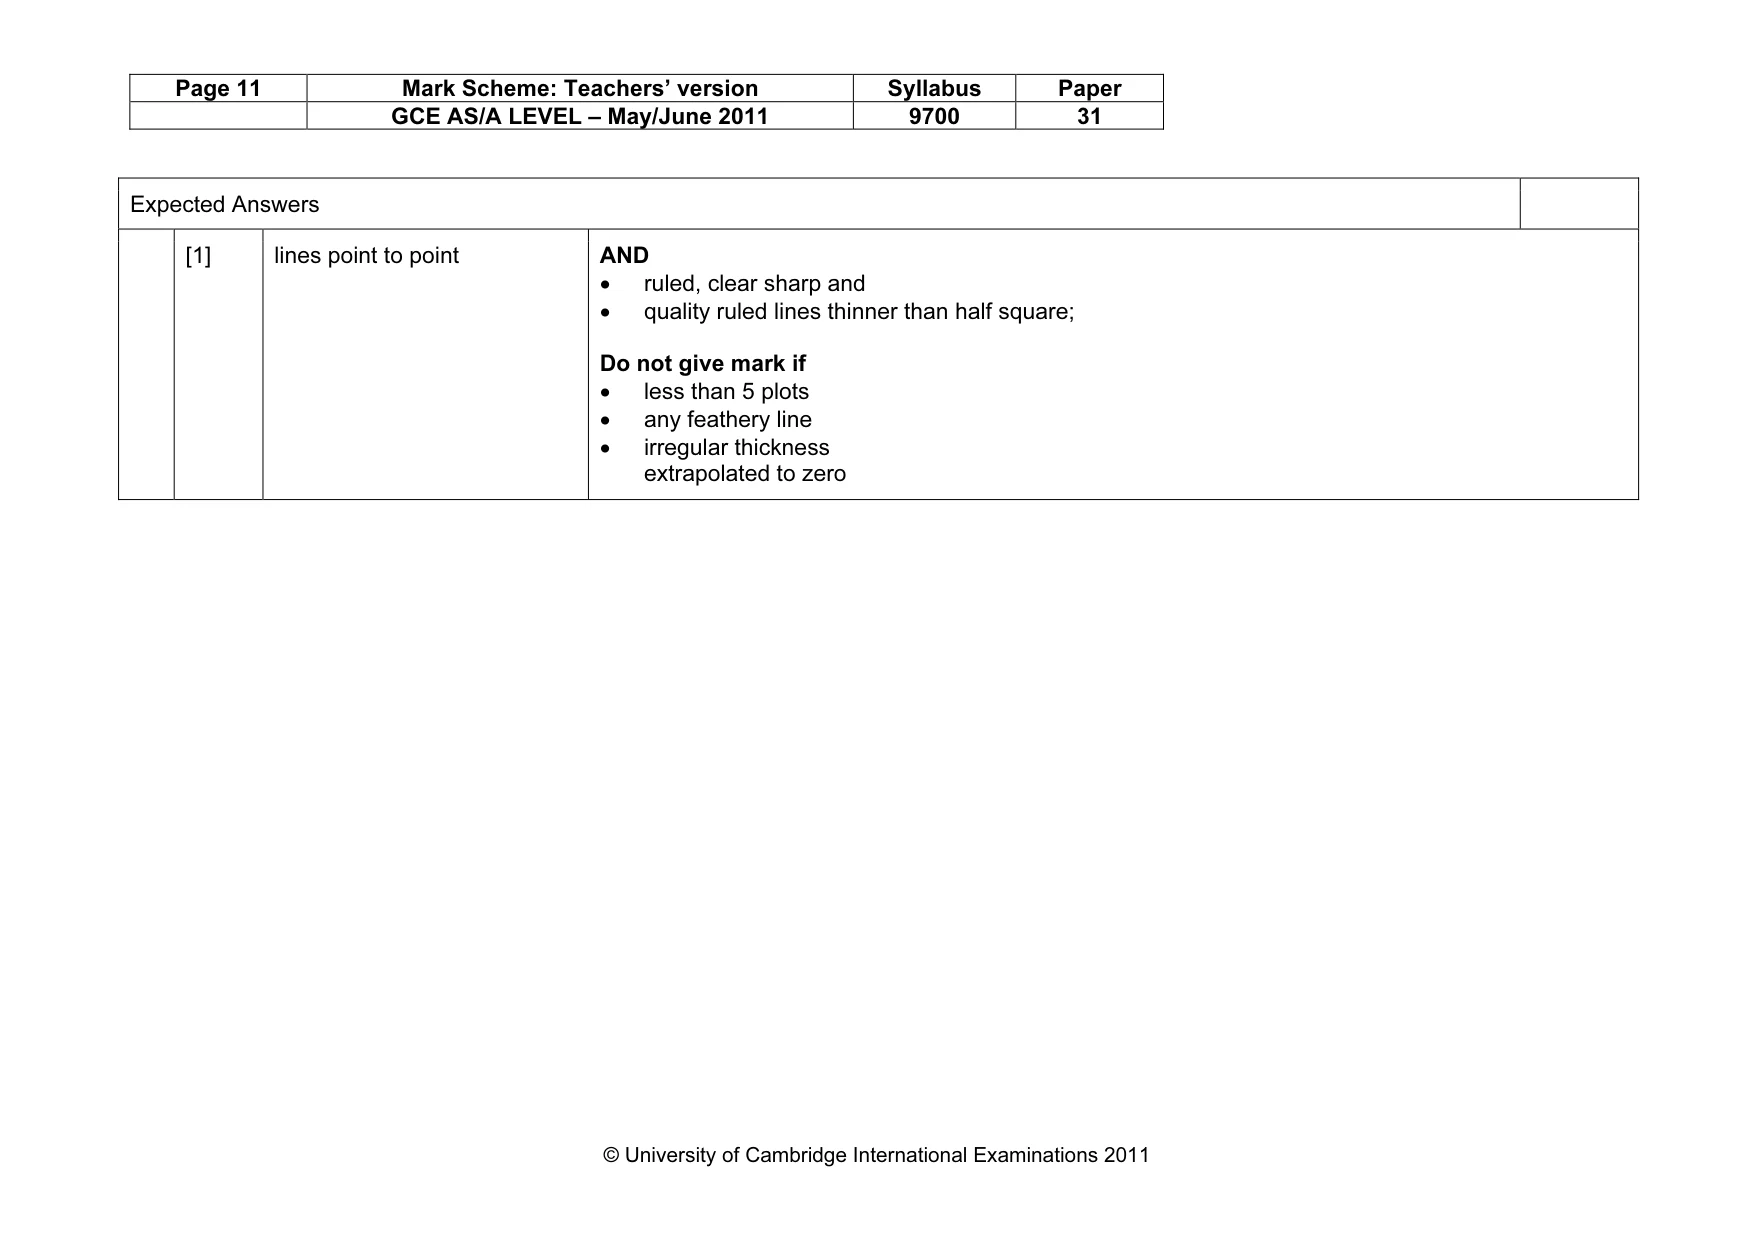
Page 11 Mark Scheme: Teachers’ version Syllabus Paper GCE AS/A LEVEL – May/June 2011 9700 31 © University of Cambridge International Examinations 2011 Expected Answers [1] lines point to point AND • ruled, clear sharp and • quality ruled lines thinner than half square; Do not give mark if • less than 5 plots • any feathery line • irregular thickness extrapolated to zero
Mark scheme, page 12
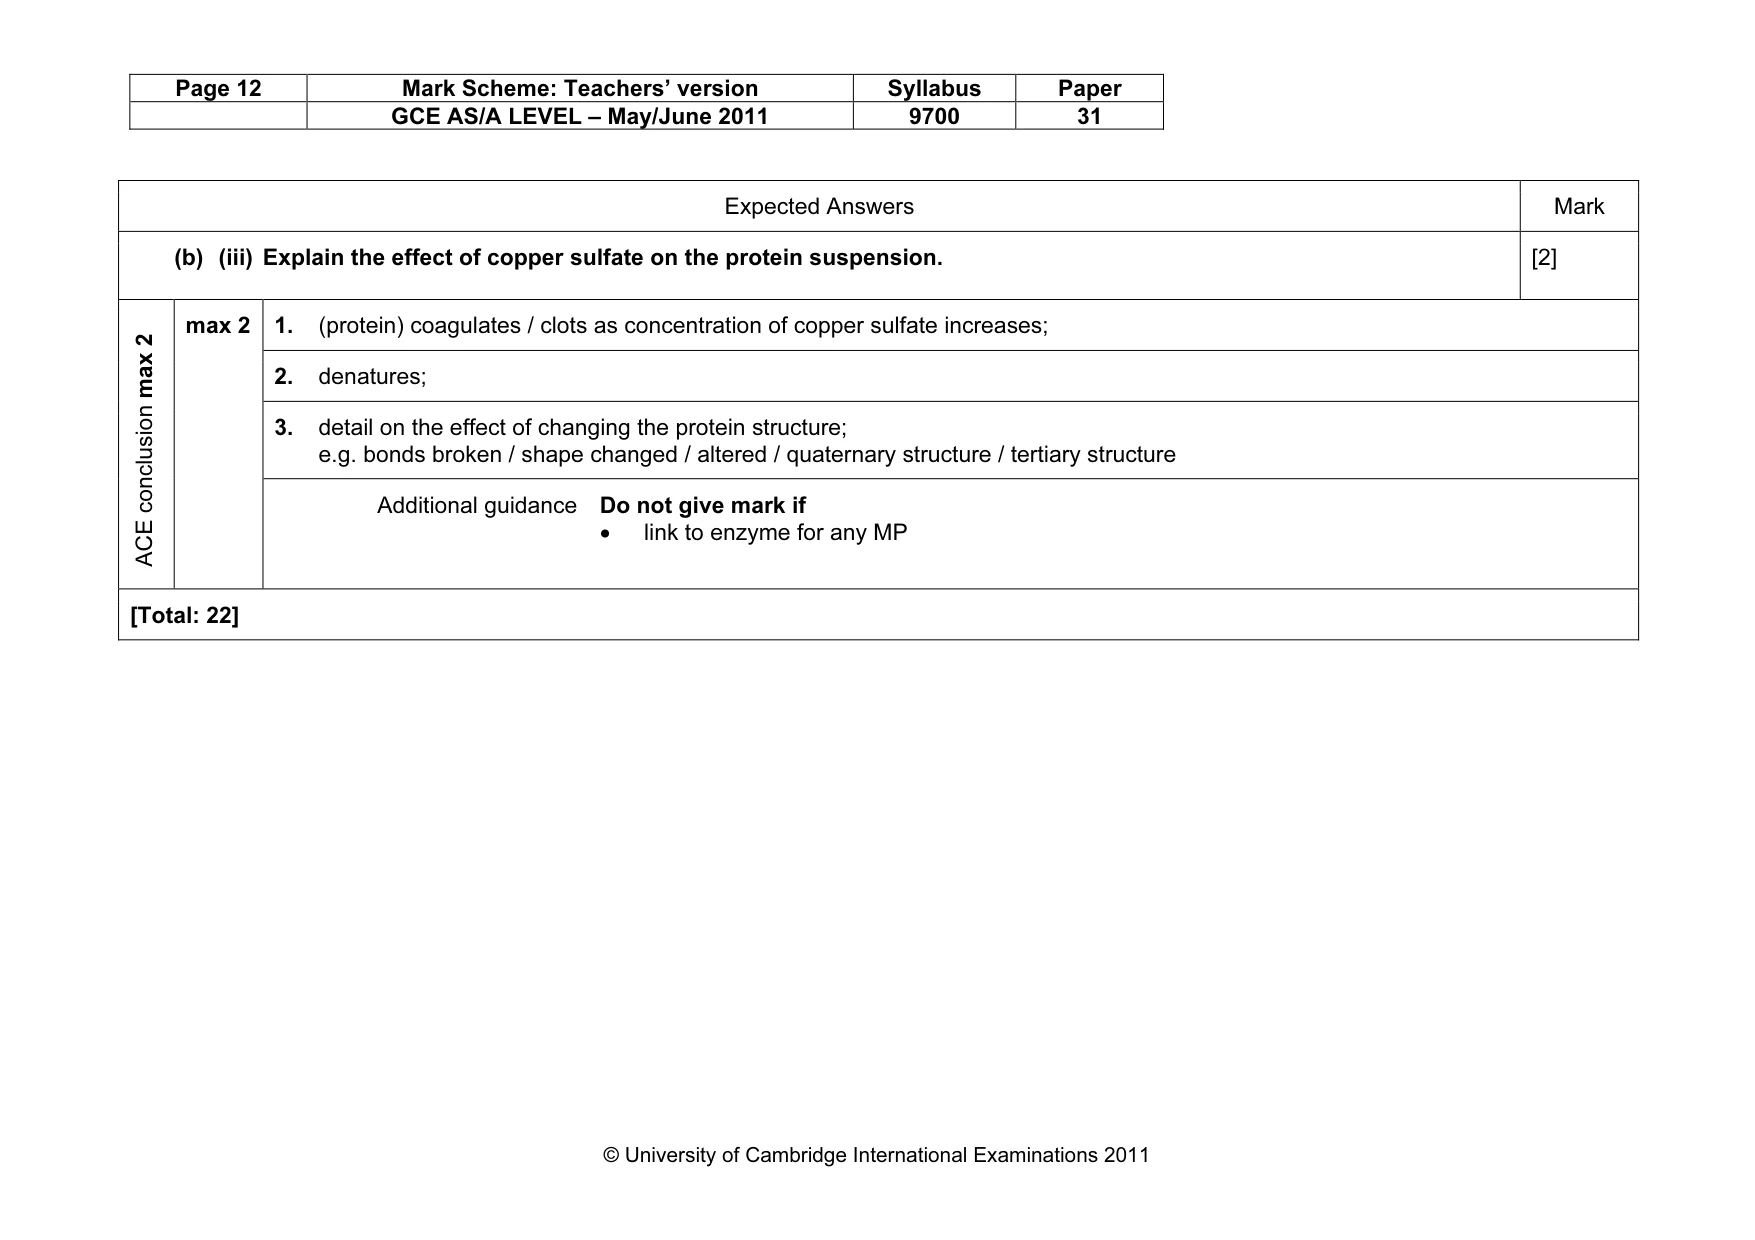
Page 12 Mark Scheme: Teachers’ version Syllabus Paper GCE AS/A LEVEL – May/June 2011 9700 31 © University of Cambridge International Examinations 2011 Expected Answers Mark (b) (iii) Explain the effect of copper sulfate on the protein suspension. [2] 1. (protein) coagulates / clots as concentration of copper sulfate increases; 2. denatures; 3. detail on the effect of changing the protein structure; e.g. bonds broken / shape changed / altered / quaternary structure / tertiary structure ACE conclusion max 2 max 2 Additional guidance Do not give mark if • link to enzyme for any MP [Total: 22]
Mark scheme, page 13
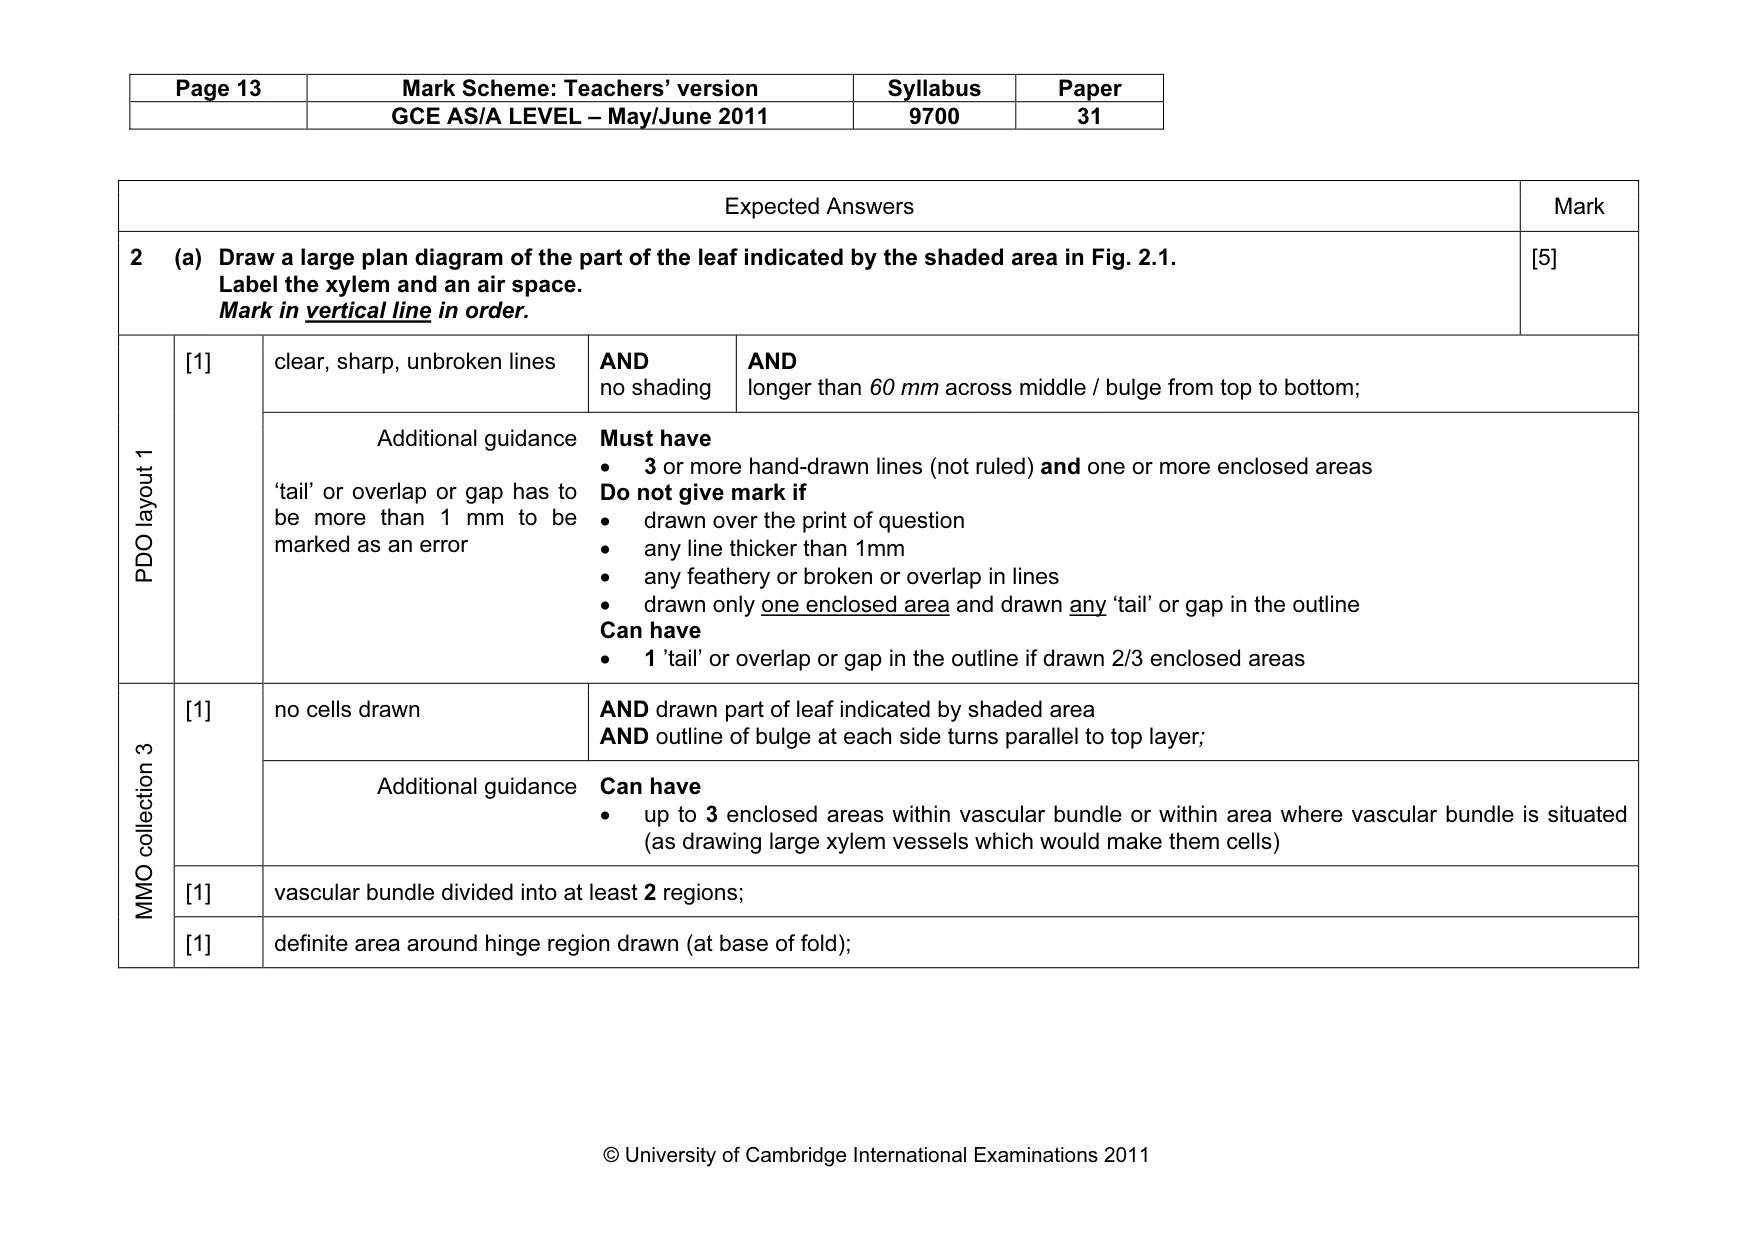
Page 13 Mark Scheme: Teachers’ version Syllabus Paper GCE AS/A LEVEL – May/June 2011 9700 31 © University of Cambridge International Examinations 2011 Expected Answers Mark 2 (a) Draw a large plan diagram of the part of the leaf indicated by the shaded area in Fig. 2.1. Label the xylem and an air space. Mark in vertical line in order. [5] clear, sharp, unbroken lines AND no shading AND longer than 60 mm across middle / bulge from top to bottom; PDO layout 1 [1] Additional guidance ‘tail’ or overlap or gap has to be more than 1 mm to be marked as an error Must have • 3 or more hand-drawn lines (not ruled) and one or more enclosed areas Do not give mark if • drawn over the print of question • any line thicker than 1mm • any feathery or broken or overlap in lines • drawn only one enclosed area and drawn any ‘tail’ or gap in the outline Can have • 1 ’tail’ or overlap or gap in the outline if drawn 2/3 enclosed areas no cells drawn AND drawn part of leaf indicated by shaded area AND outline of bulge at each side turns parallel to top layer; [1] Additional guidance Can have • up to 3 enclosed areas within vascular bundle or within area where vascular bundle is situated (as drawing large xylem vessels which would make them cells) [1] vascular bundle divided into at least 2 regions; MMO collection 3 [1] definite area around hinge region drawn (at base of fold);
Mark scheme, page 14
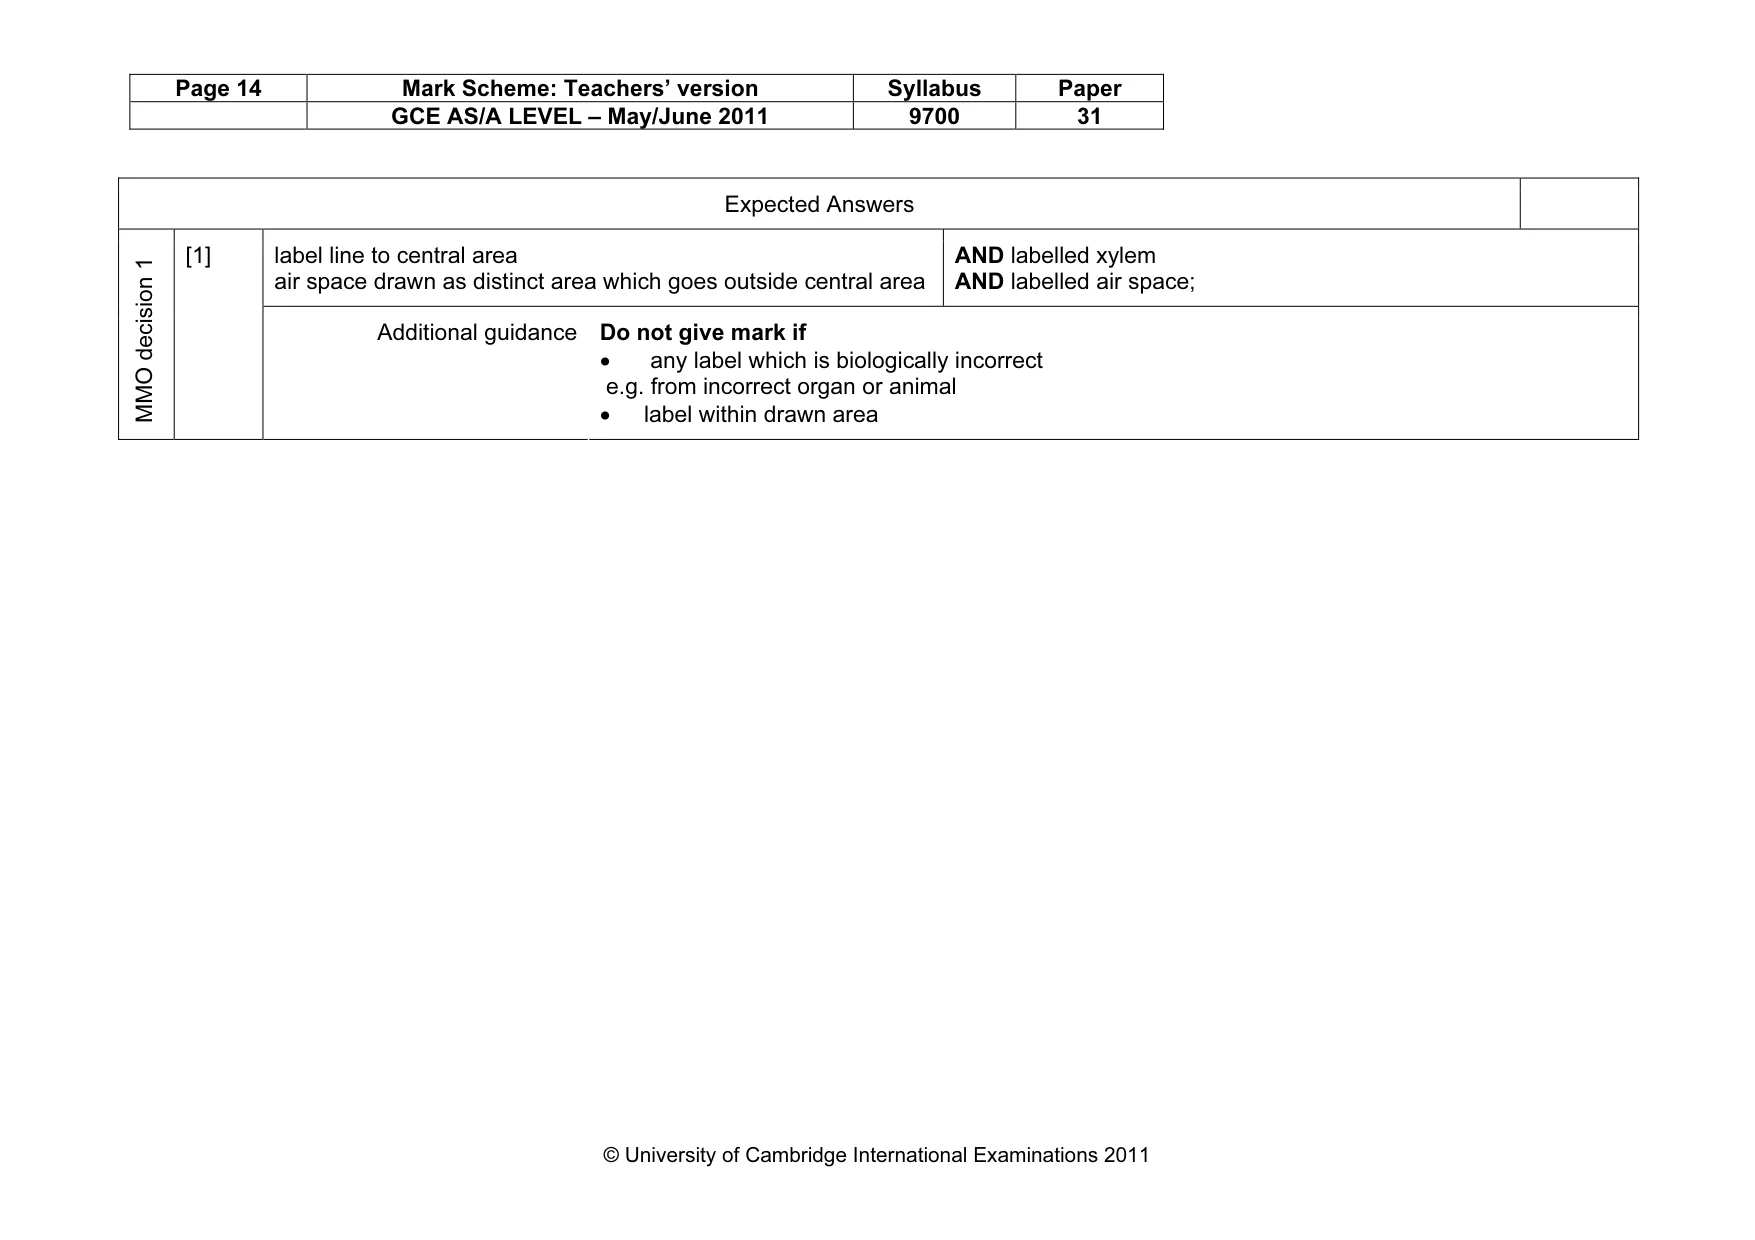
Page 14 Mark Scheme: Teachers’ version Syllabus Paper GCE AS/A LEVEL – May/June 2011 9700 31 © University of Cambridge International Examinations 2011 Expected Answers label line to central area air space drawn as distinct area which goes outside central area AND labelled xylem AND labelled air space; MMO decision 1 [1] Additional guidance Do not give mark if • any label which is biologically incorrect e.g. from incorrect organ or animal • label within drawn area
Mark scheme, page 15
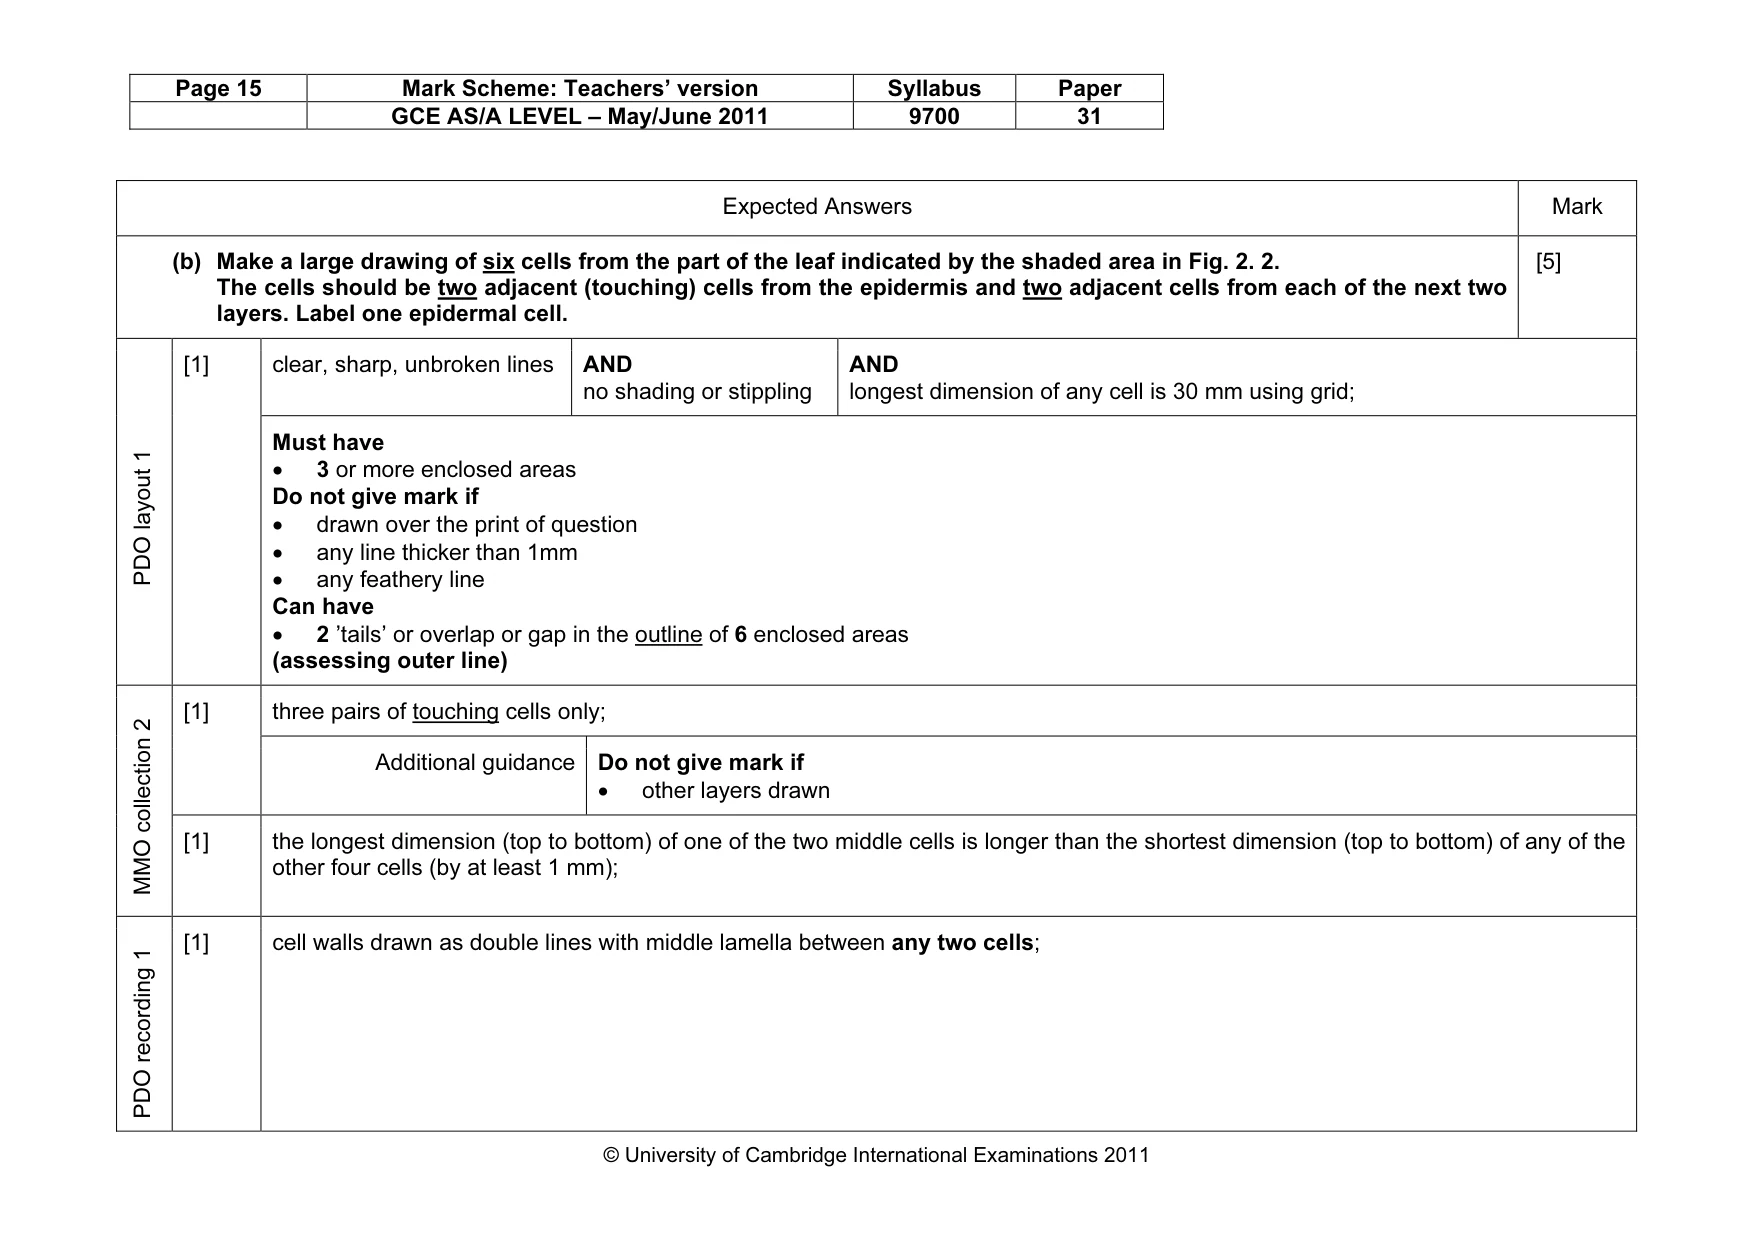
Page 15 Mark Scheme: Teachers’ version Syllabus Paper GCE AS/A LEVEL – May/June 2011 9700 31 © University of Cambridge International Examinations 2011 Expected Answers Mark (b) Make a large drawing of six cells from the part of the leaf indicated by the shaded area in Fig. 2. 2. The cells should be two adjacent (touching) cells from the epidermis and two adjacent cells from each of the next two layers. Label one epidermal cell. [5] clear, sharp, unbroken lines AND no shading or stippling AND longest dimension of any cell is 30 mm using grid; PDO layout 1 [1] Must have • 3 or more enclosed areas Do not give mark if • drawn over the print of question • any line thicker than 1mm • any feathery line Can have • 2 ’tails’ or overlap or gap in the outline of 6 enclosed areas (assessing outer line) three pairs of touching cells only; [1] Additional guidance Do not give mark if • other layers drawn MMO collection 2 [1] the longest dimension (top to bottom) of one of the two middle cells is longer than the shortest dimension (top to bottom) of any of the other four cells (by at least 1 mm); PDO recording 1 [1] cell walls drawn as double lines with middle lamella between any two cells;
Mark scheme, page 16
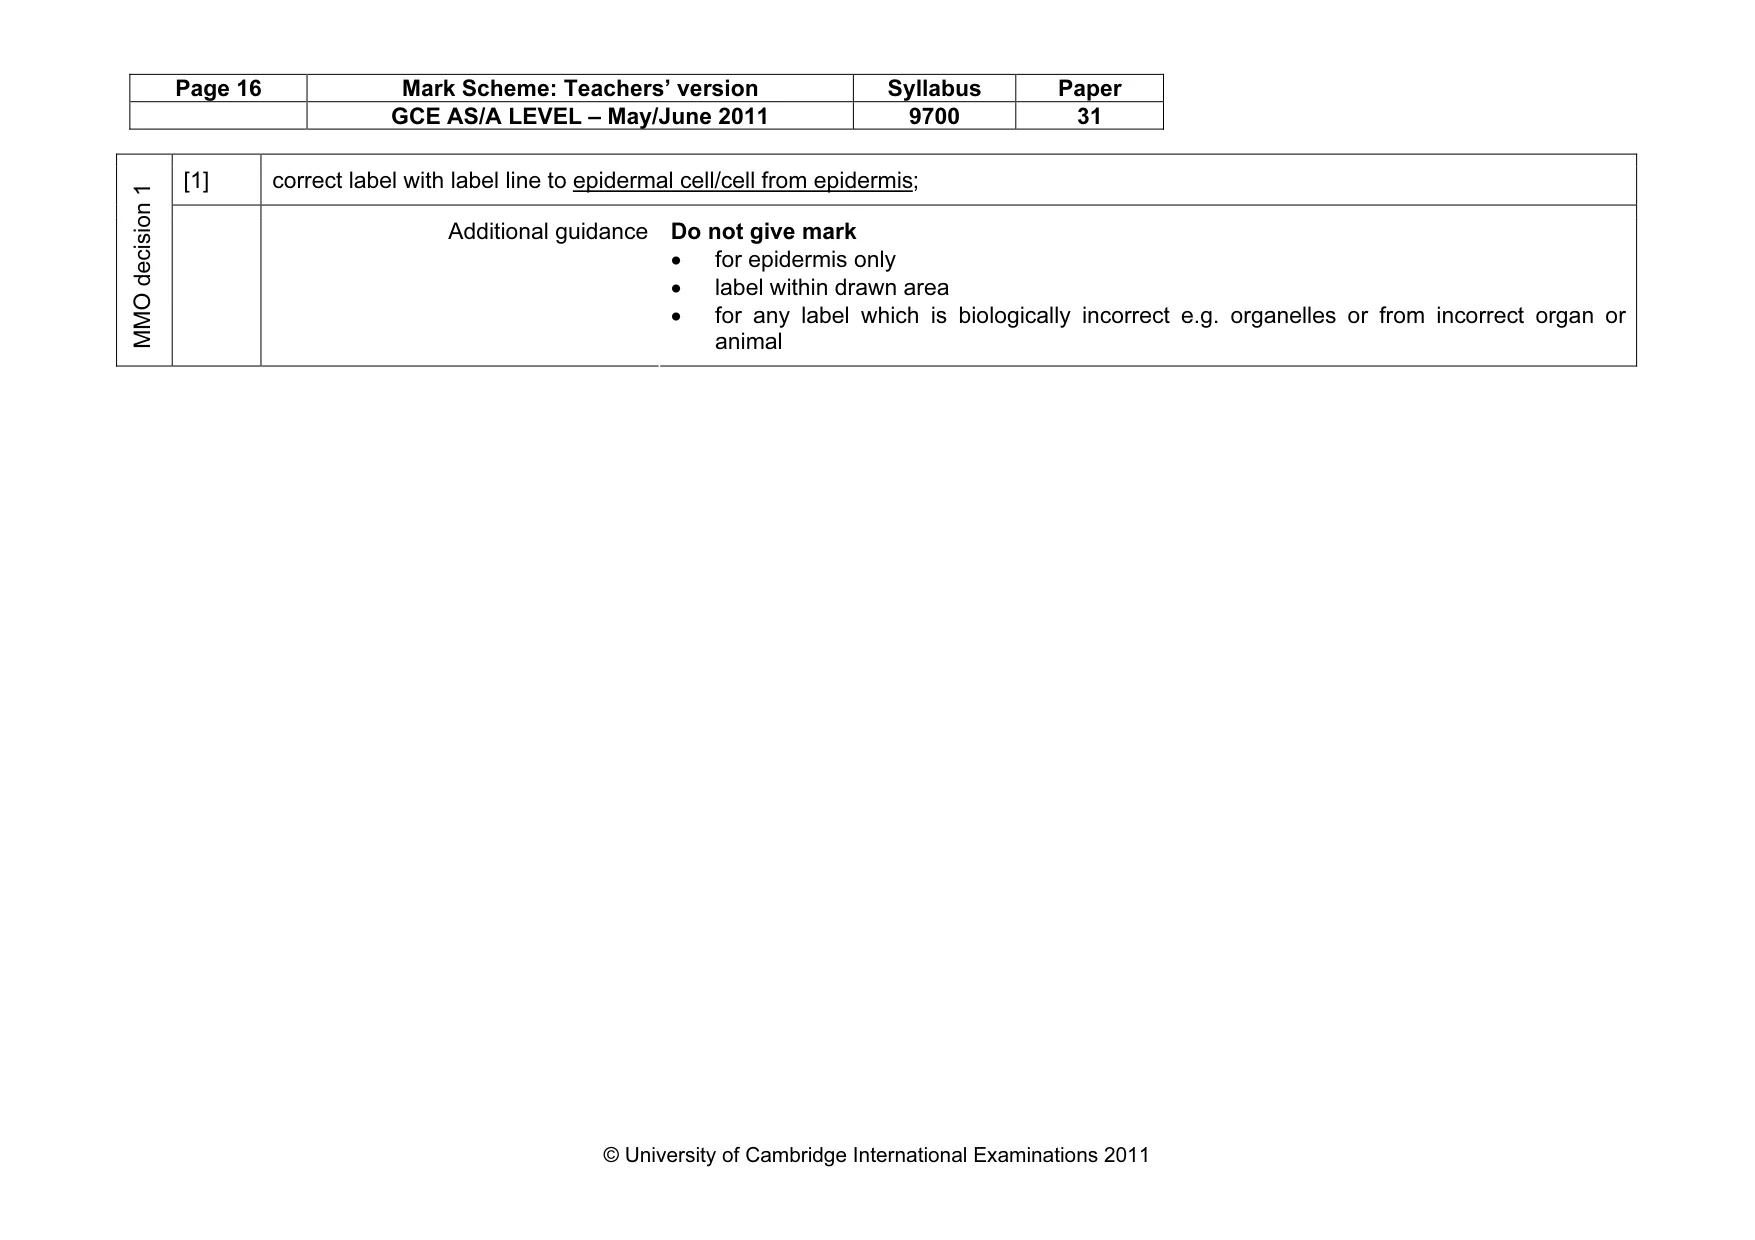
Page 16 Mark Scheme: Teachers’ version Syllabus Paper GCE AS/A LEVEL – May/June 2011 9700 31 © University of Cambridge International Examinations 2011 [1] correct label with label line to epidermal cell/cell from epidermis; MMO decision 1 Additional guidance Do not give mark • for epidermis only • label within drawn area • for any label which is biologically incorrect e.g. organelles or from incorrect organ or animal
Mark scheme, page 17
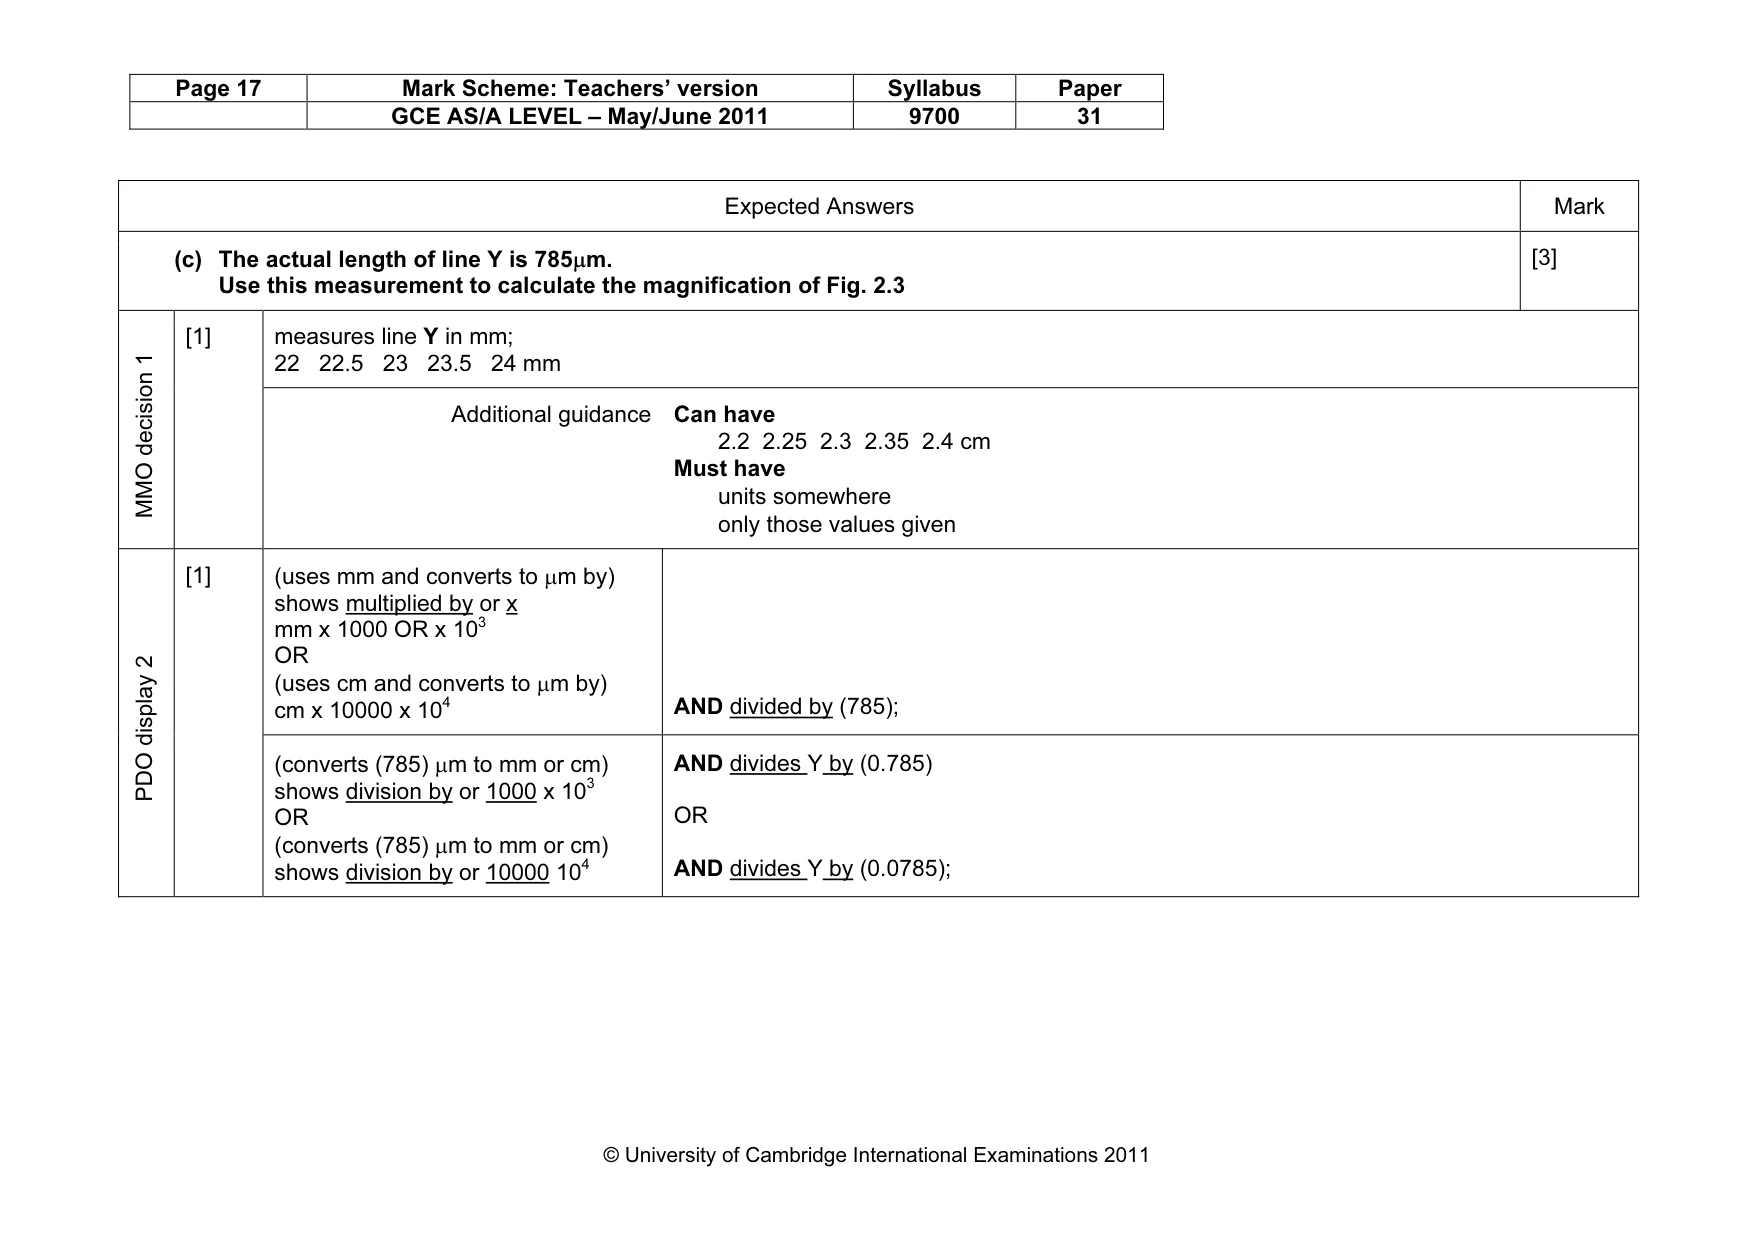
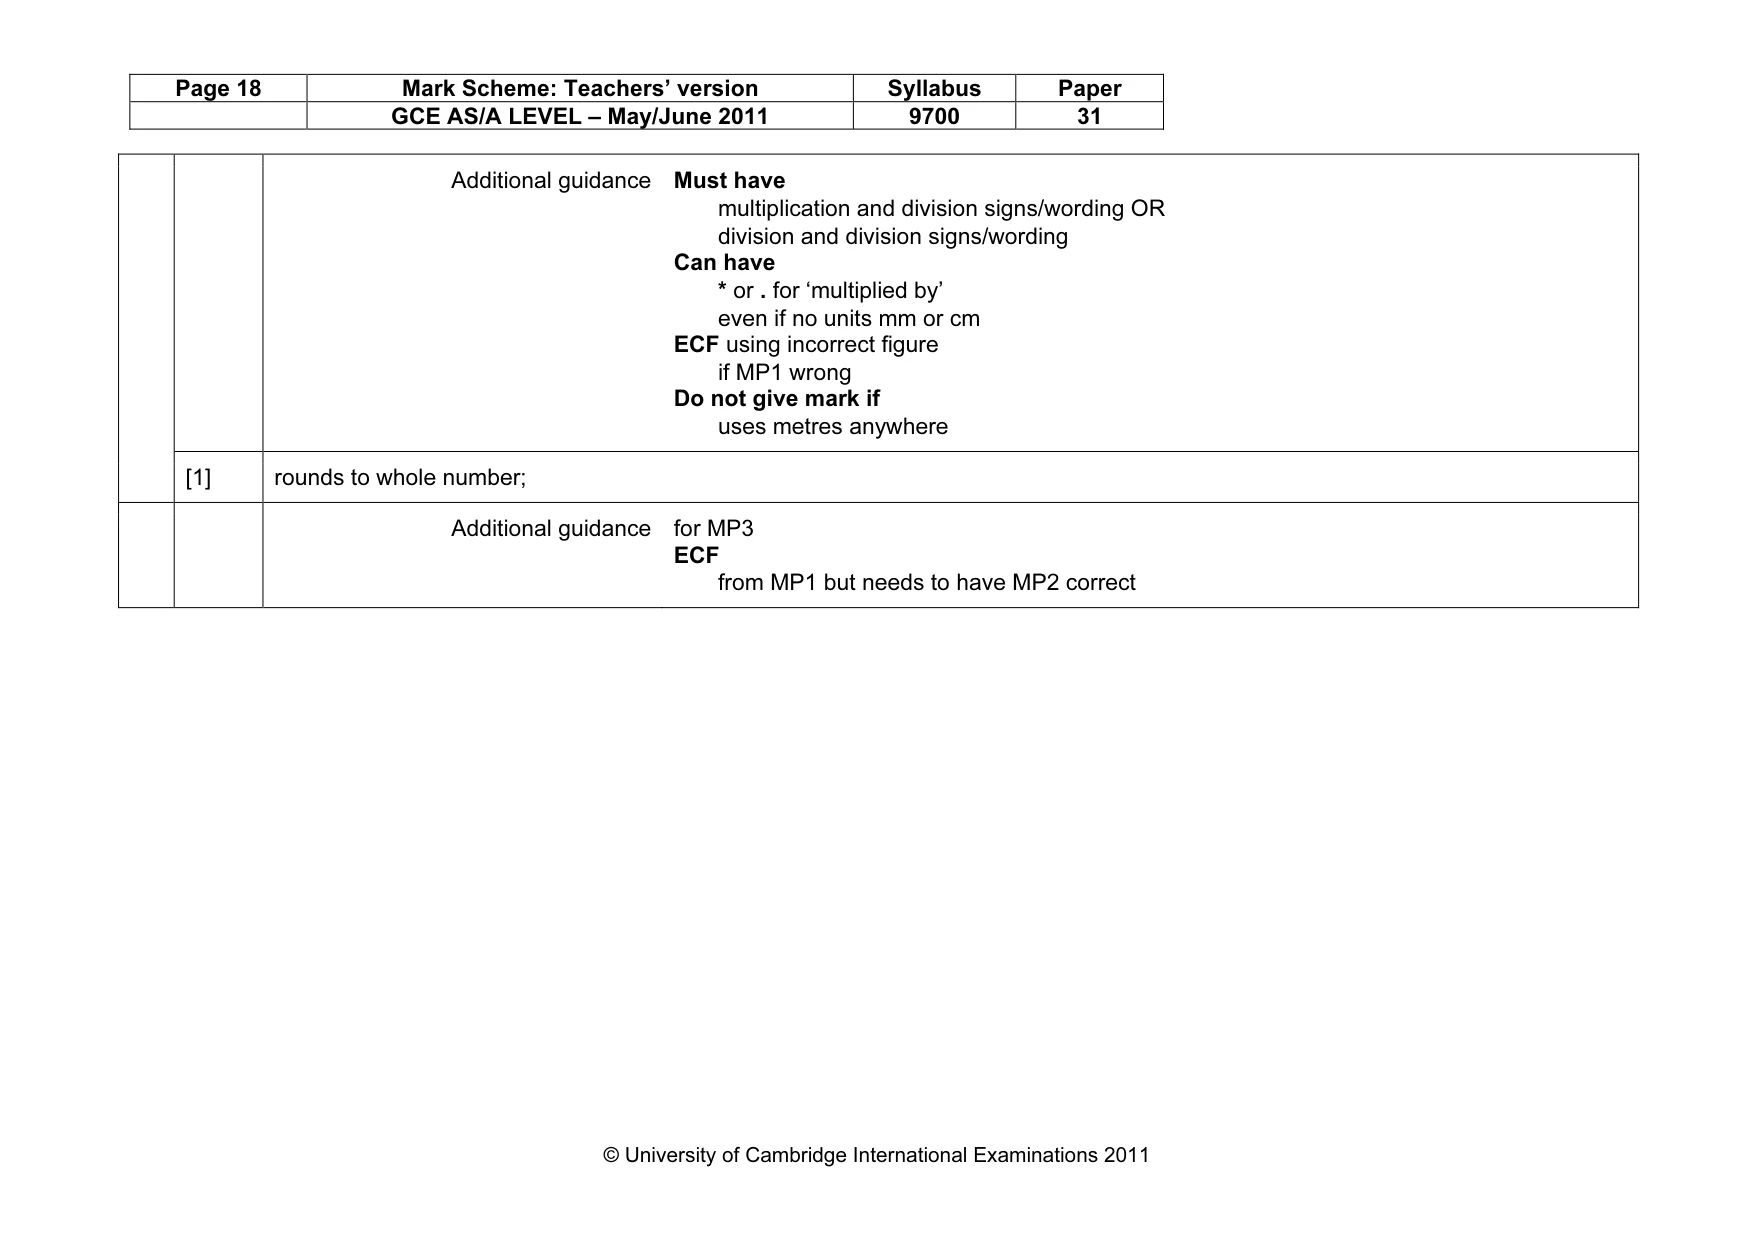
Page 17 Mark Scheme: Teachers’ version Syllabus Paper GCE AS/A LEVEL – May/June 2011 9700 31 © University of Cambridge International Examinations 2011 Expected Answers Mark (c) The actual length of line Y is 785µm. Use this measurement to calculate the magnification of Fig. 2.3 [3] measures line Y in mm; 22 22.5 23 23.5 24 mm MMO decision 1 [1] Additional guidance Can have 2.2 2.25 2.3 2.35 2.4 cm Must have units somewhere only those values given (uses mm and converts to µm by) shows multiplied by or x mm x 1000 OR x 103 OR (uses cm and converts to µm by) cm x 10000 x 104 AND divided by (785); PDO display 2 [1] (converts (785) µm to mm or cm) shows division by or 1000 x 103 OR (converts (785) µm to mm or cm) shows division by or 10000 104 AND divides Y by (0.785) OR AND divides Y by (0.0785);
Mark scheme, page 18
Page 18 Mark Scheme: Teachers’ version Syllabus Paper GCE AS/A LEVEL – May/June 2011 9700 31 © University of Cambridge International Examinations 2011 Additional guidance Must have multiplication and division signs/wording OR division and division signs/wording Can have * or . for ‘multiplied by’ even if no units mm or cm ECF using incorrect figure if MP1 wrong Do not give mark if uses metres anywhere [1] rounds to whole number; Additional guidance for MP3 ECF from MP1 but needs to have MP2 correct
Mark scheme, page 19
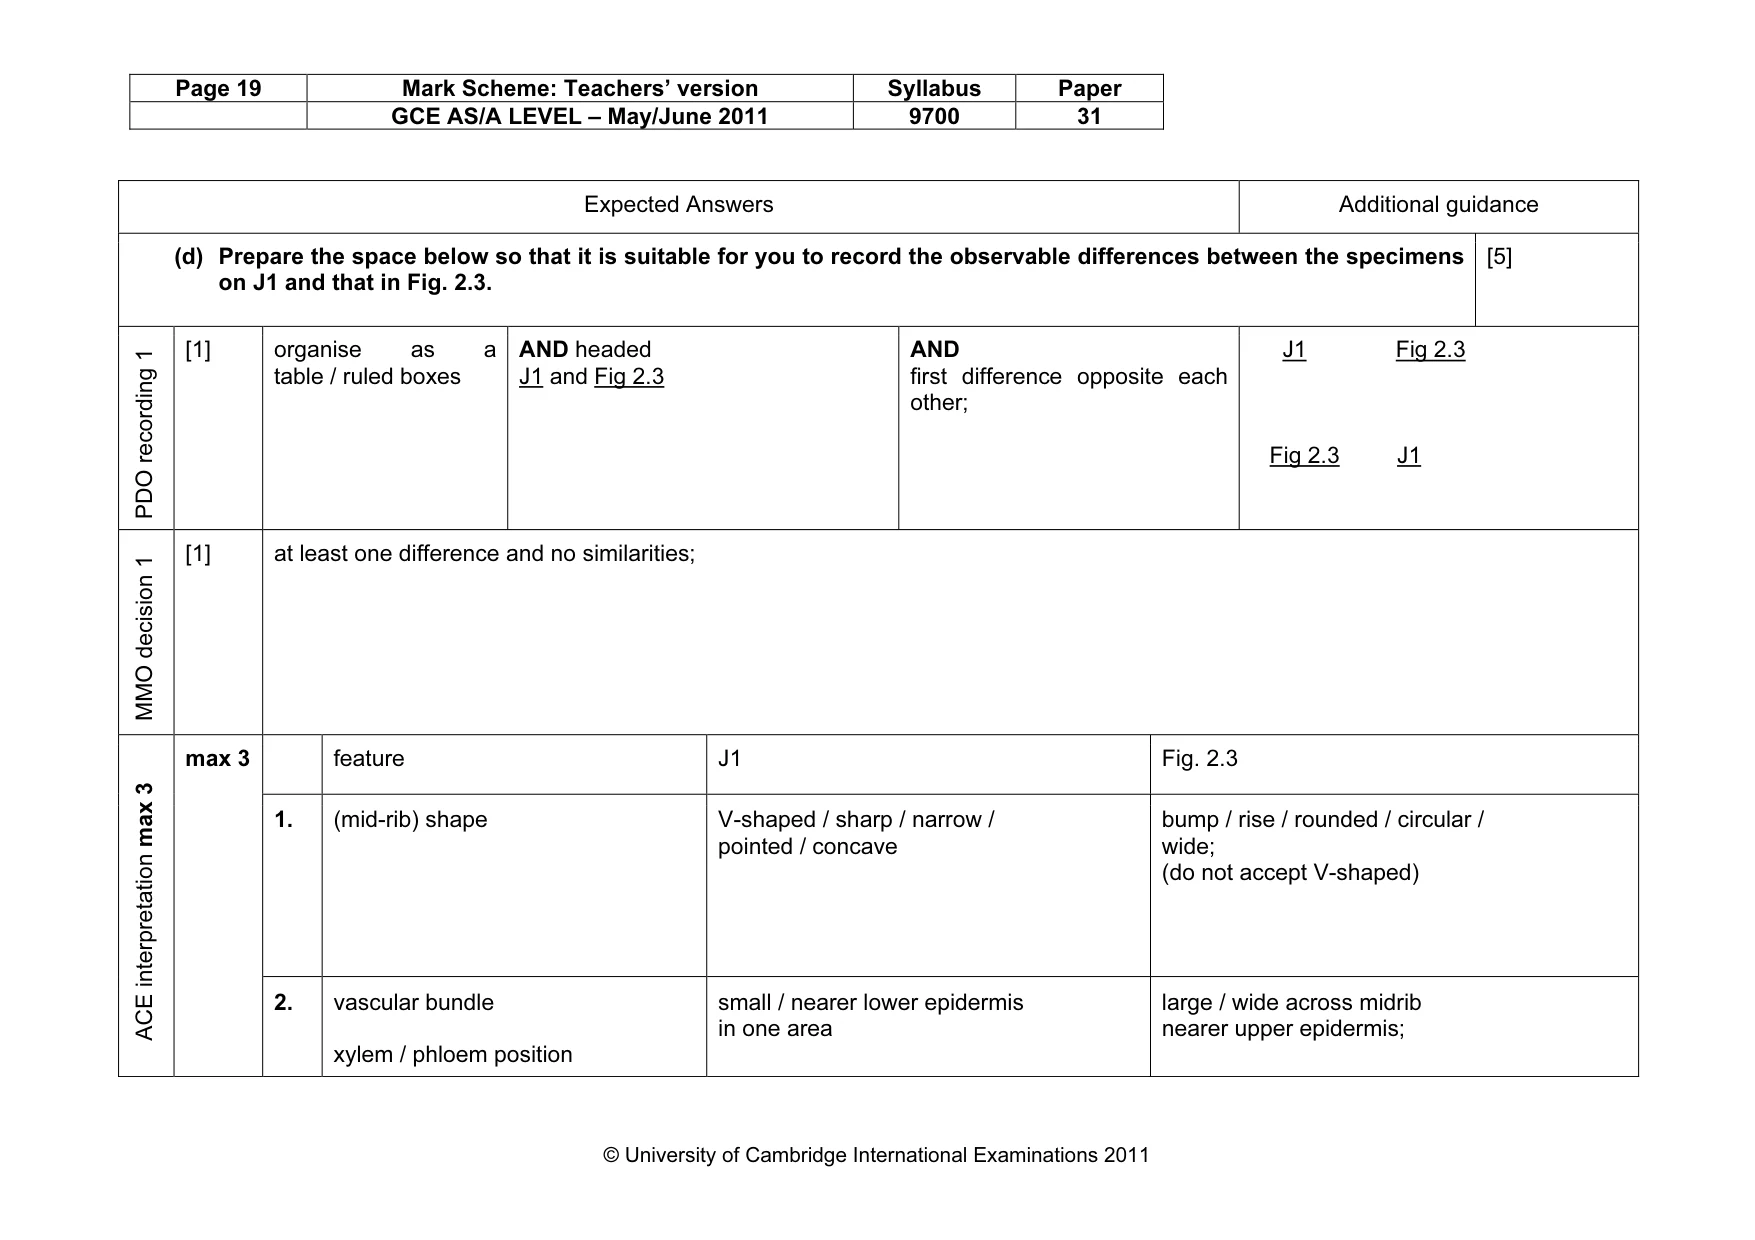
Page 19 Mark Scheme: Teachers’ version Syllabus Paper GCE AS/A LEVEL – May/June 2011 9700 31 © University of Cambridge International Examinations 2011 Expected Answers Additional guidance (d) Prepare the space below so that it is suitable for you to record the observable differences between the specimens on J1 and that in Fig. 2.3. [5] PDO recording 1 [1] organise as a table / ruled boxes AND headed J1 and Fig 2.3 AND first difference opposite each other; J1 Fig 2.3 Fig 2.3 J1 MMO decision 1 [1] at least one difference and no similarities; feature J1 Fig. 2.3 1. (mid-rib) shape V-shaped / sharp / narrow / pointed / concave bump / rise / rounded / circular / wide; (do not accept V-shaped) ACE interpretation max 3 max 3 2. vascular bundle xylem / phloem position small / nearer lower epidermis in one area large / wide across midrib nearer upper epidermis;
Mark scheme, page 20
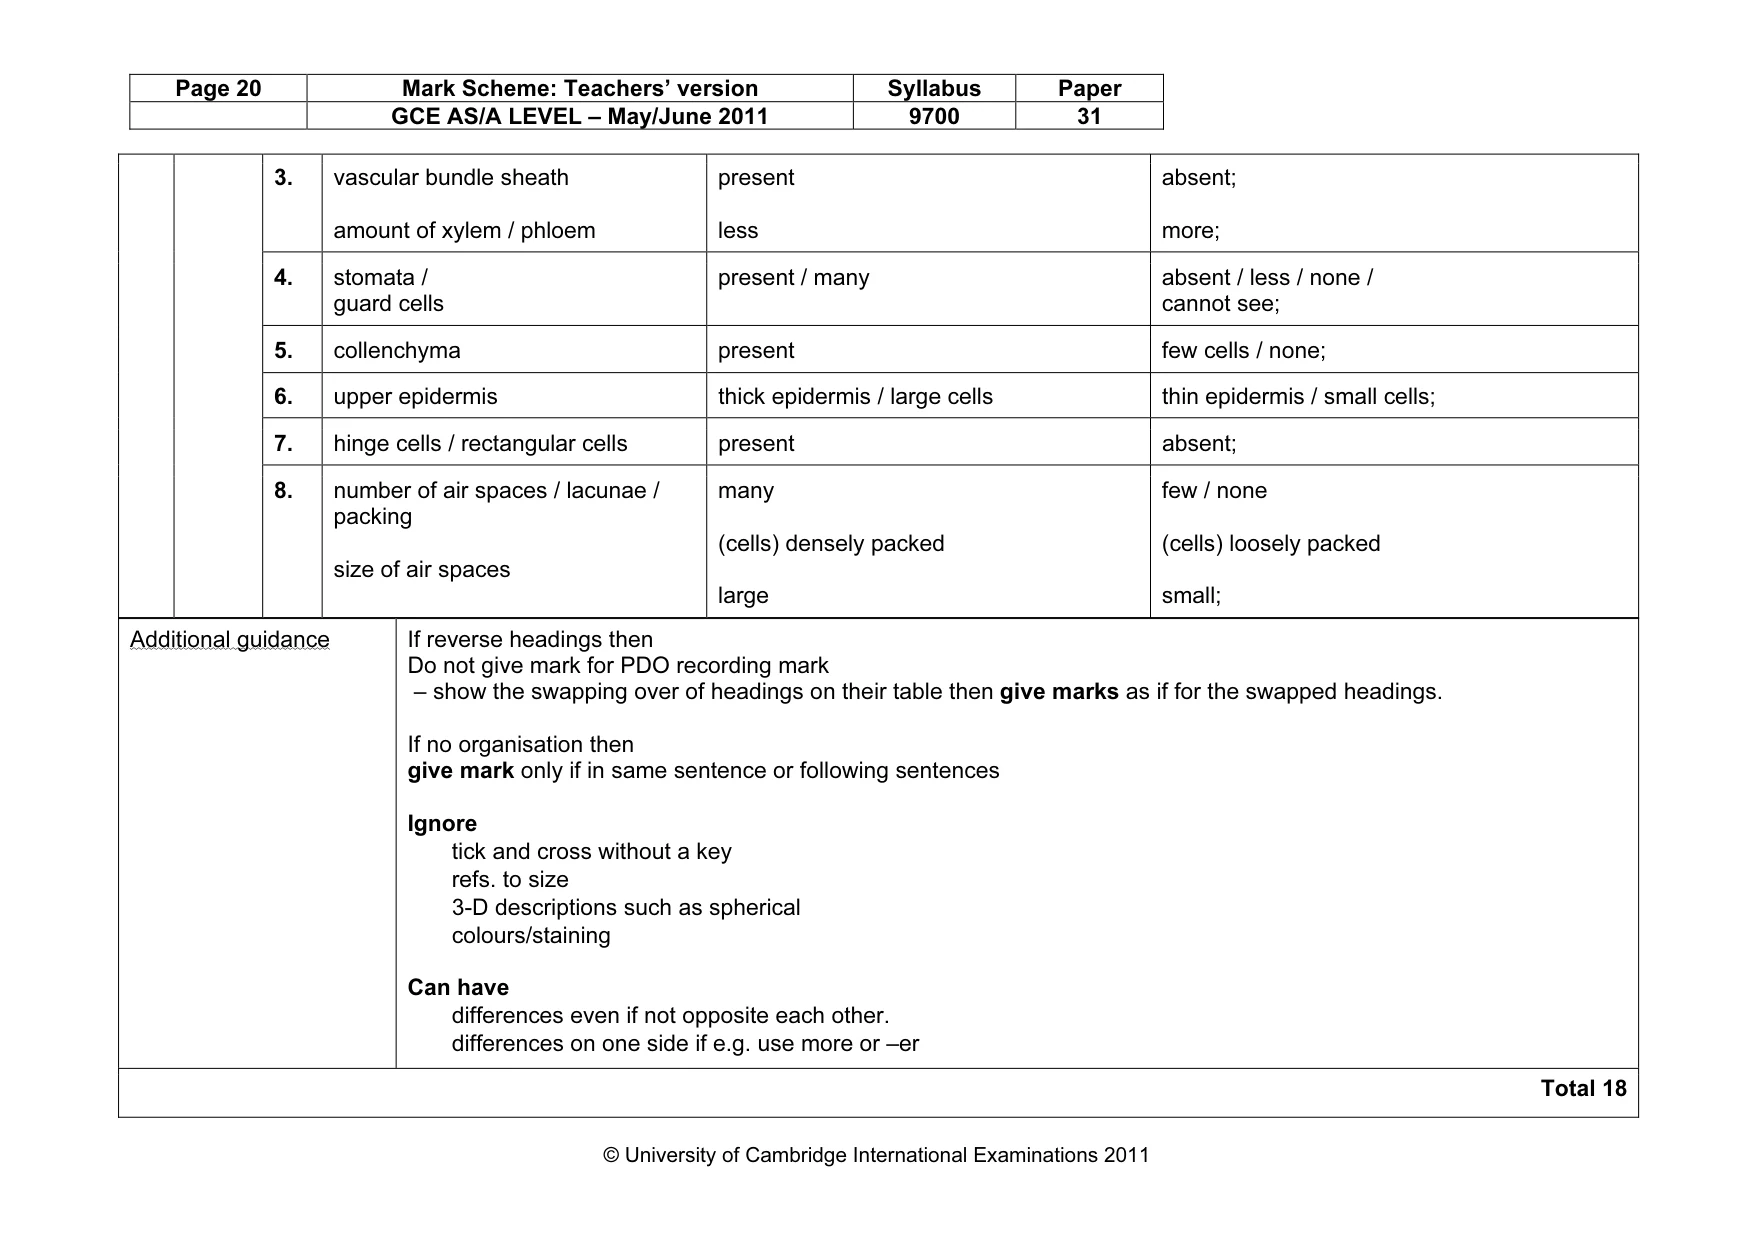
Page 20 Mark Scheme: Teachers’ version Syllabus Paper GCE AS/A LEVEL – May/June 2011 9700 31 © University of Cambridge International Examinations 2011 Additional guidance If reverse headings then Do not give mark for PDO recording mark – show the swapping over of headings on their table then give marks as if for the swapped headings. If no organisation then give mark only if in same sentence or following sentences Ignore tick and cross without a key refs. to size 3-D descriptions such as spherical colours/staining Can have differences even if not opposite each other. differences on one side if e.g. use more or –er Total 18 3. vascular bundle sheath amount of xylem / phloem present less absent; more; 4. stomata / guard cells present / many absent / less / none / cannot see; 5. collenchyma present few cells / none; 6. upper epidermis thick epidermis / large cells thin epidermis / small cells; 7. hinge cells / rectangular cells present absent; 8. number of air spaces / lacunae / packing size of air spaces many (cells) densely packed large few / none (cells) loosely packed small;
What you needed in this session
Cambridge’s own grade thresholds for 2011 May/June, Paper 3 · Variant 1. A higher threshold means an easier paper — the bar moves with how the cohort did.