Cambridge A Level Biology 9700 — 2011 May/June Paper 3 · Variant 3
9700/33/M/J/11 · 40 marks · ≈45 min
The question paper and its mark scheme, free to read here and free to download. This is Cambridge’s own paper, exactly as it was sat.
Question paper12 pages

Mark scheme14 pages
Answers below. Sit the paper first if you are practising.
Paper as text
Question paper, page 1
This document consists of 11 printed pages and 1 blank page. DC (CW/DJ) 31760/6 © UCLES 2011 [Turn over UNIVERSITY OF CAMBRIDGE INTERNATIONAL EXAMINATIONS General Certificate of Education Advanced Subsidiary Level and Advanced Level READ THESE INSTRUCTIONS FIRST Write your Centre number, candidate number and name on all the work you hand in. Write in dark blue or black ink. You may use a pencil for any diagrams, graphs or rough working. Do not use red ink, staples, paper clips, highlighters, glue or correction fluid. DO NOT WRITE IN ANY BARCODES. Answer all questions. You may lose marks if you do not show your working or if you do not use appropriate units. At the end of the examination, fasten all your work securely together. The number of marks is given in brackets [ ] at the end of each question or part question. * 3 9 5 7 8 6 4 0 6 0 * BIOLOGY 9700/33 Advanced Practical Skills 1 May/June 2011 2 hours Candidates answer on the Question Paper. Additional Materials: As listed in the Confidential Instructions. For Examiner’s Use 1 2 Total
Question paper, page 2
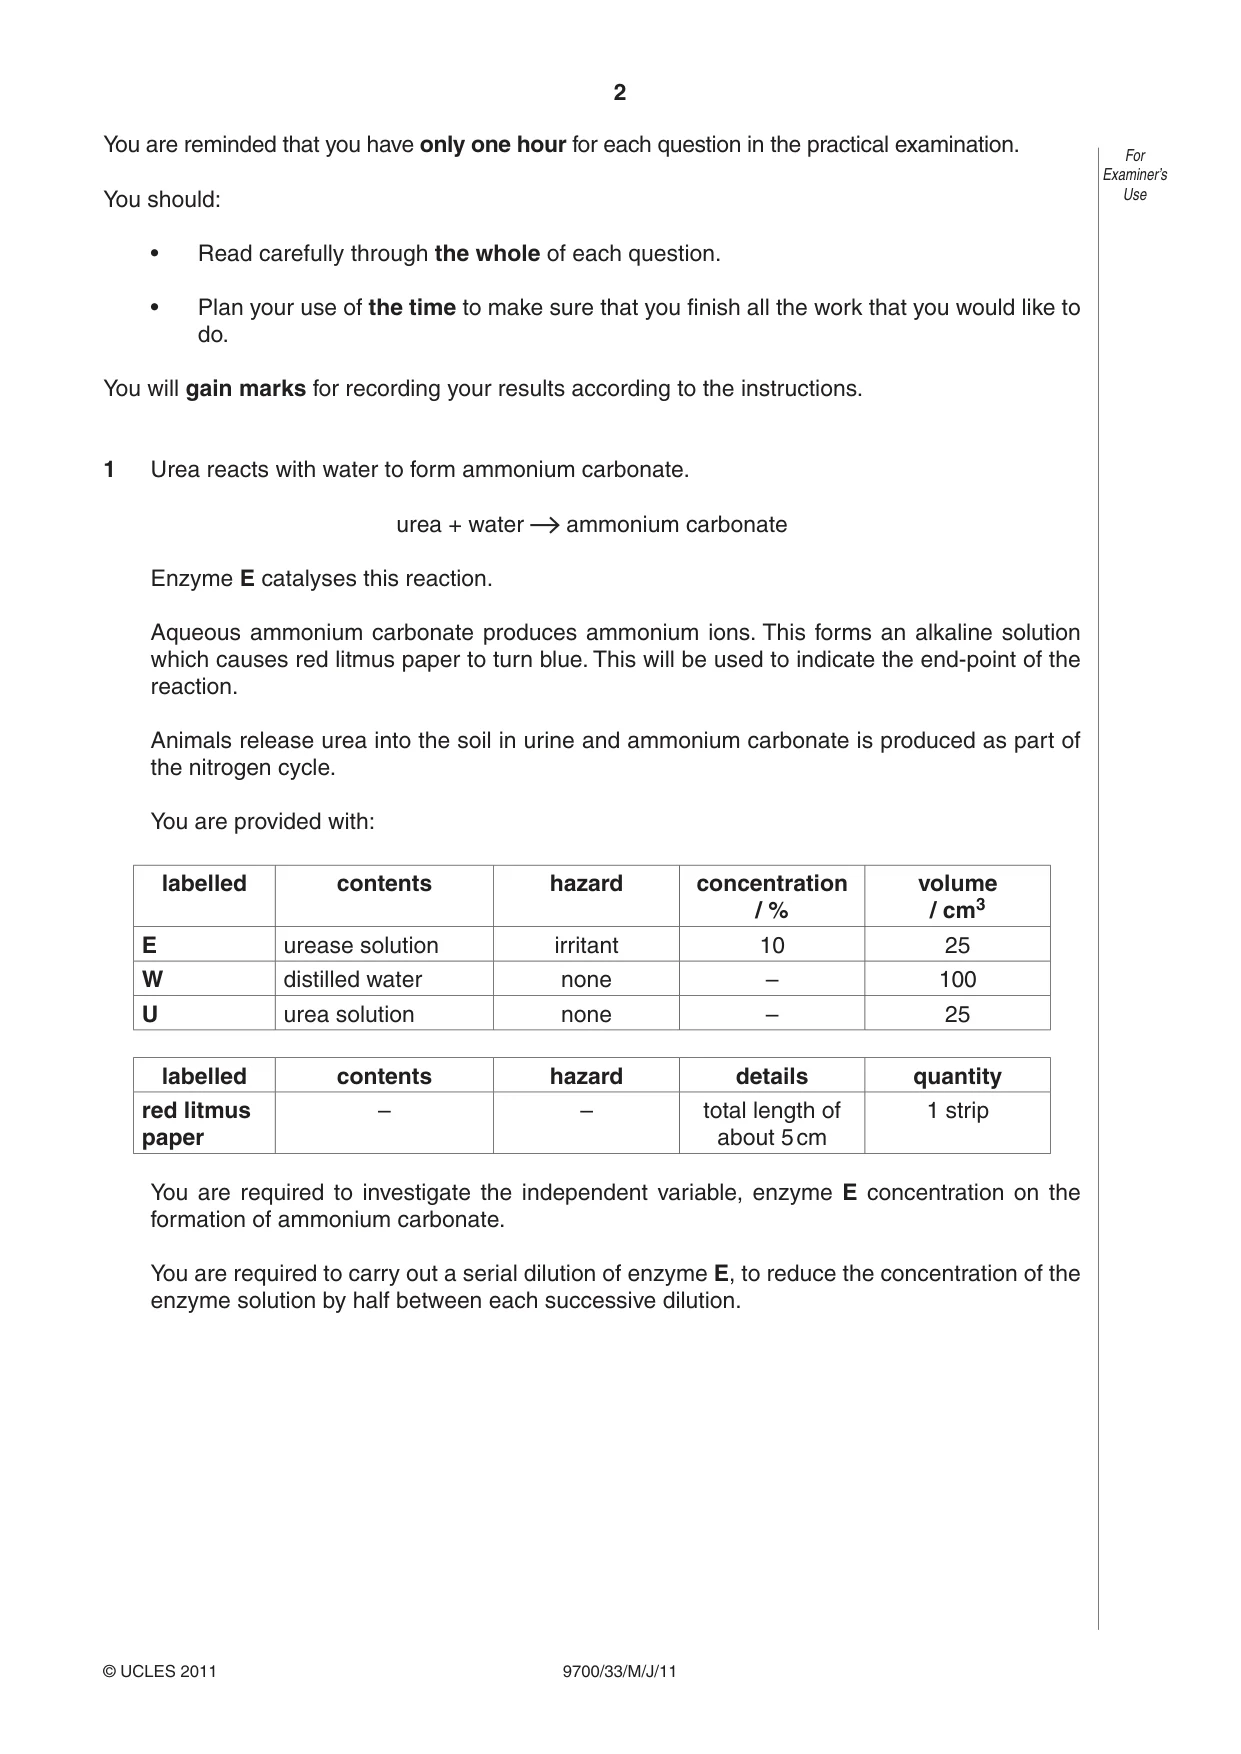
2 9700/33/M/J/11 © UCLES 2011 For Examiner’s Use You are reminded that you have only one hour for each question in the practical examination. You should: • Read carefully through the whole of each question. • Plan your use of the time to make sure that you finish all the work that you would like to do. You will gain marks for recording your results according to the instructions. 1 Urea reacts with water to form ammonium carbonate. urea + water ammonium carbonate Enzyme E catalyses this reaction. Aqueous ammonium carbonate produces ammonium ions. This forms an alkaline solution which causes red litmus paper to turn blue. This will be used to indicate the end-point of the reaction. Animals release urea into the soil in urine and ammonium carbonate is produced as part of the nitrogen cycle. You are provided with: labelled contents hazard concentration / % volume / cm3 E urease solution irritant 10 25 W distilled water none – 100 U urea solution none – 25 labelled contents hazard details quantity red litmus paper – – total length of about 5 cm 1 strip You are required to investigate the independent variable, enzyme E concentration on the formation of ammonium carbonate. You are required to carry out a serial dilution of enzyme E, to reduce the concentration of the enzyme solution by half between each successive dilution.
Question paper, page 3
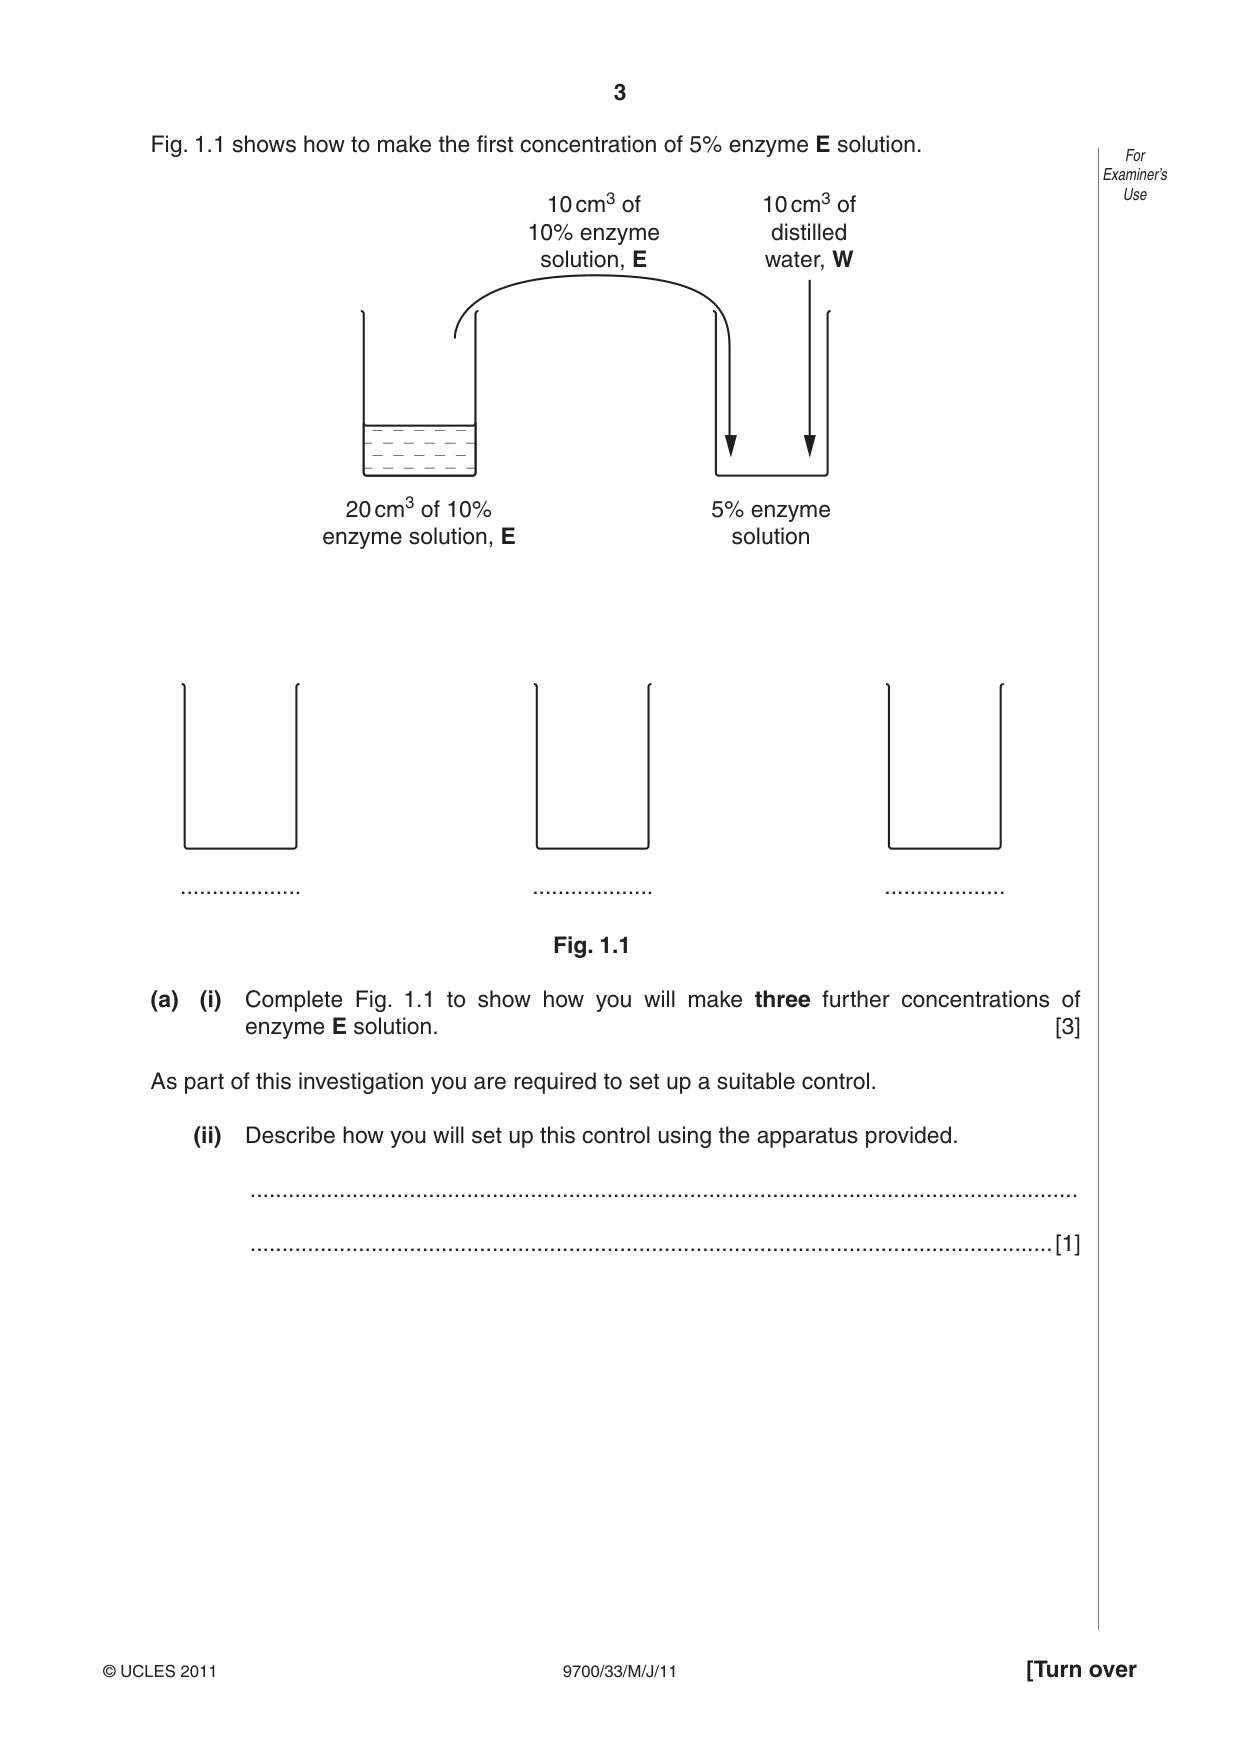
3 9700/33/M/J/11 © UCLES 2011 [Turn over For Examiner’s Use Fig. 1.1 shows how to make the first concentration of 5% enzyme E solution. … … … 20 cm3 of 10% enzyme solution, E 5% enzyme solution 10 cm3 of distilled water, W 10 cm3 of 10% enzyme solution, E Fig. 1.1 (a) (i) Complete Fig. 1.1 to show how you will make three further concentrations of enzyme E solution. [3] As part of this investigation you are required to set up a suitable control. (ii) Describe how you will set up this control using the apparatus provided. … …[1]
Question paper, page 4
4 9700/33/M/J/11 © UCLES 2011 For Examiner’s Use Proceed as follows: 1. Prepare the concentrations of E as shown in Fig. 1.1 in the containers provided. 2. Label test-tubes with the concentrations of E and the control. 3. Cut the red litmus paper into lengths of 0.5 cm. Add one piece of litmus paper to each test-tube. 4. Put 2 cm3 of U into each test-tube. 5. Put 2 cm3 of the lowest concentration of E into the labelled test-tube and mix well. 6. Repeat step 5 with each of the other concentrations of E and the control. Immediately start timing. 7. Record the time taken for the first appearance of blue colour in each piece of litmus paper. This is the end-point of the reaction. If a piece of litmus paper does not reach the end-point in ten minutes, record ‘more than 600’ for that dilution as your result. (iii) Prepare the space below and record your results. [5]
Question paper, page 5
5 9700/33/M/J/11 © UCLES 2011 [Turn over For Examiner’s Use (iv) Calculate the rate of reaction for the 10% E concentration. rate of reaction …[1] (v) Identify one significant error in your investigation. … …[1] (vi) Suggest how you would make two improvements to this investigation. … … … … …[2]
Question paper, page 6
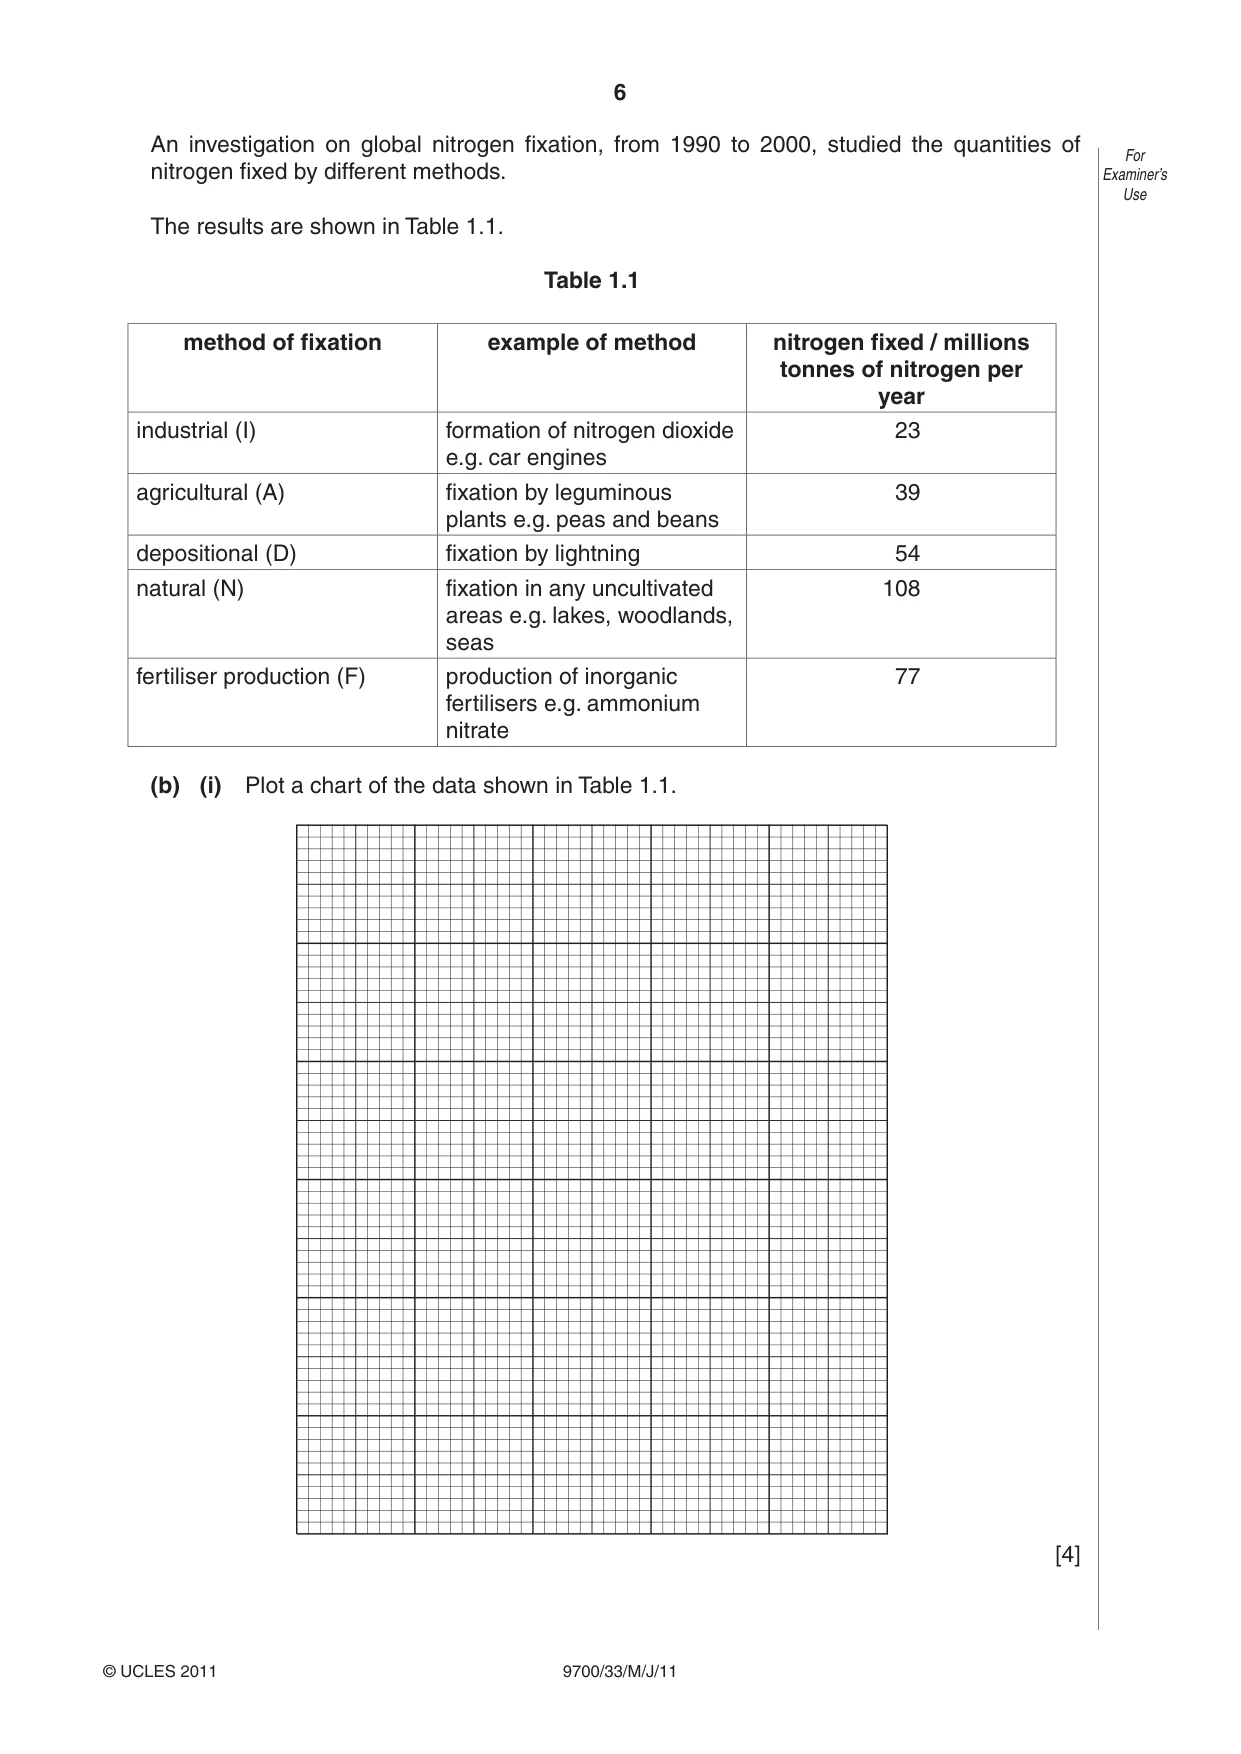
6 9700/33/M/J/11 © UCLES 2011 For Examiner’s Use An investigation on global nitrogen fixation, from 1990 to 2000, studied the quantities of nitrogen fixed by different methods. The results are shown in Table 1.1. Table 1.1 method of fixation example of method nitrogen fixed / millions tonnes of nitrogen per year industrial (I) formation of nitrogen dioxide e.g. car engines 23 agricultural (A) fixation by leguminous plants e.g. peas and beans 39 depositional (D) fixation by lightning 54 natural (N) fixation in any uncultivated areas e.g. lakes, woodlands, seas 108 fertiliser production (F) production of inorganic fertilisers e.g. ammonium nitrate 77 (b) (i) Plot a chart of the data shown in Table 1.1. [4]
Question paper, page 7
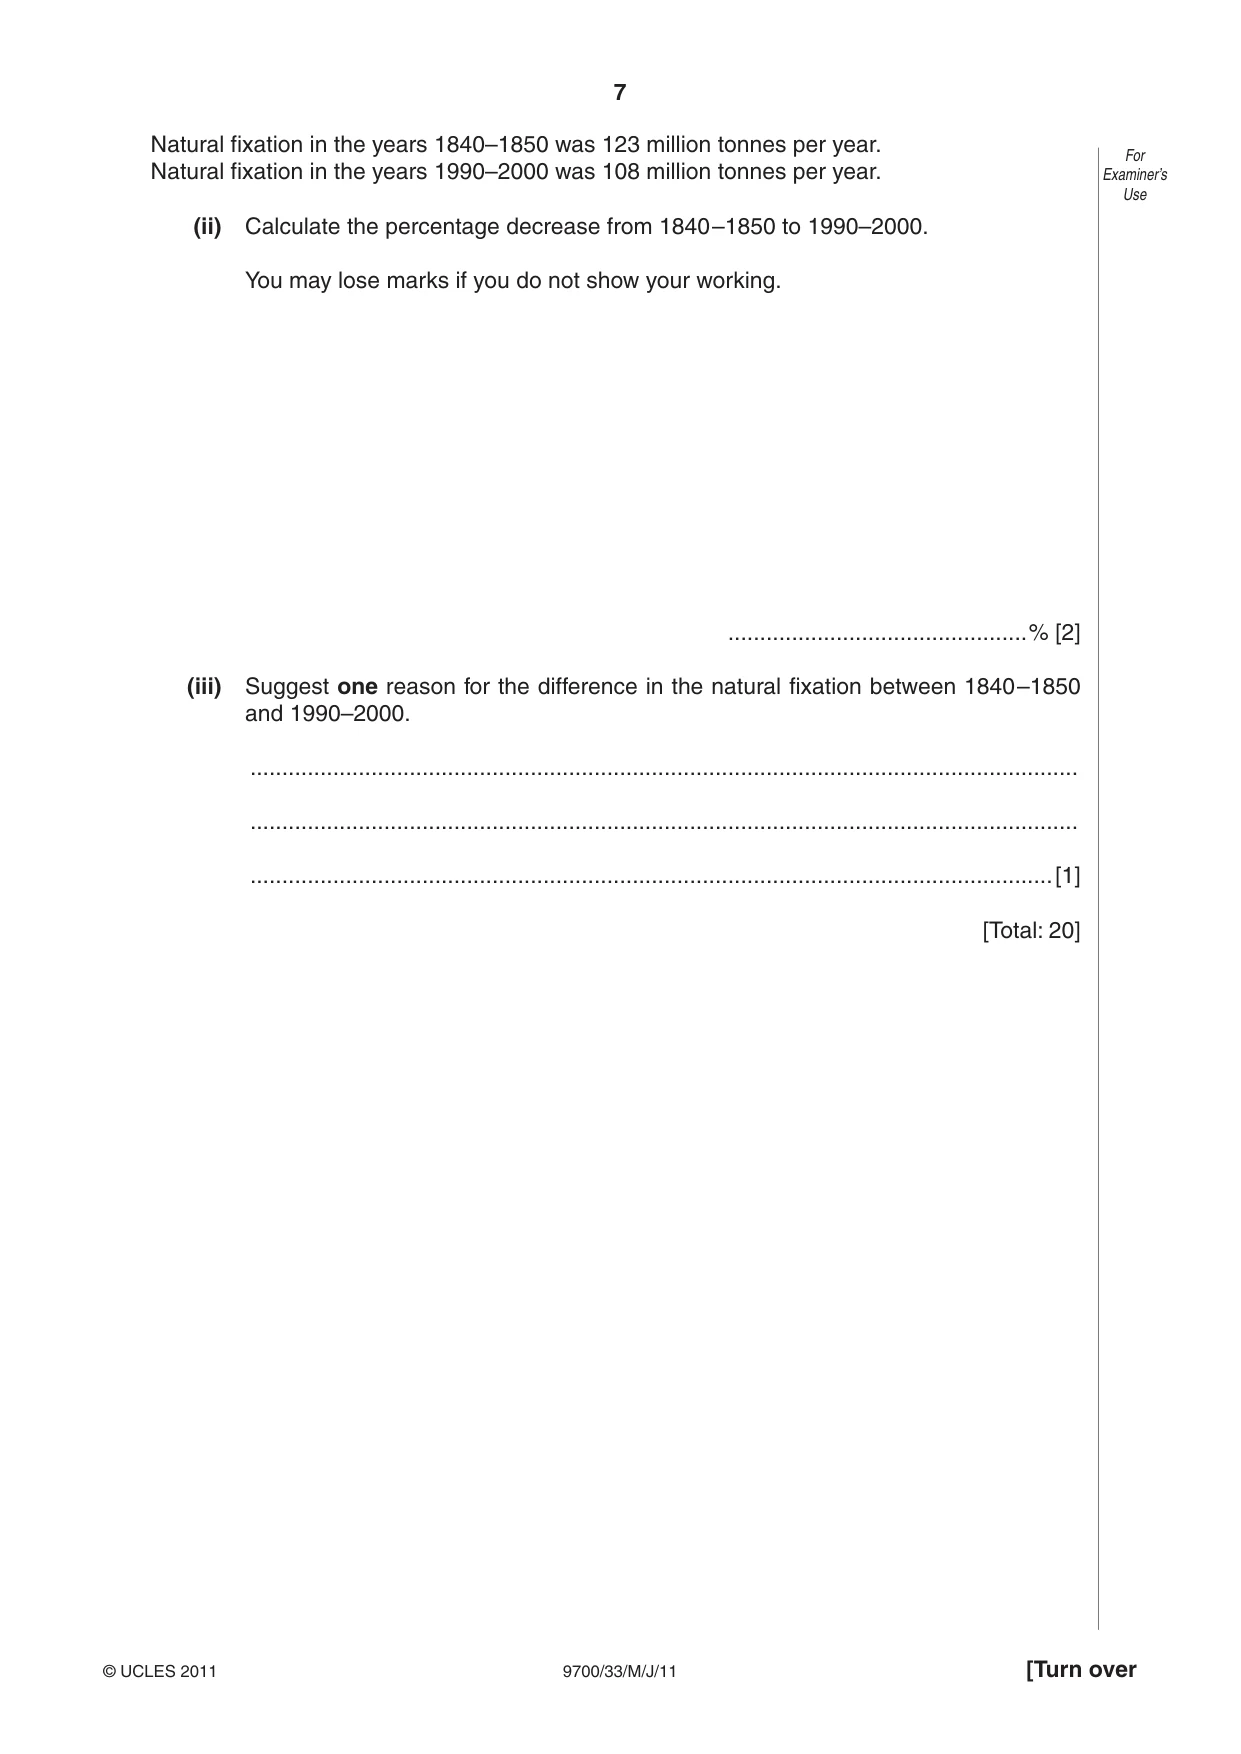
7 9700/33/M/J/11 © UCLES 2011 [Turn over For Examiner’s Use Natural fixation in the years 1840–1850 was 123 million tonnes per year. Natural fixation in the years 1990–2000 was 108 million tonnes per year. (ii) Calculate the percentage decrease from 1840 –1850 to 1990–2000. You may lose marks if you do not show your working. …% [2] (iii) Suggest one reason for the difference in the natural fixation between 1840 –1850 and 1990–2000. … … …[1] [Total: 20]
Question paper, page 8
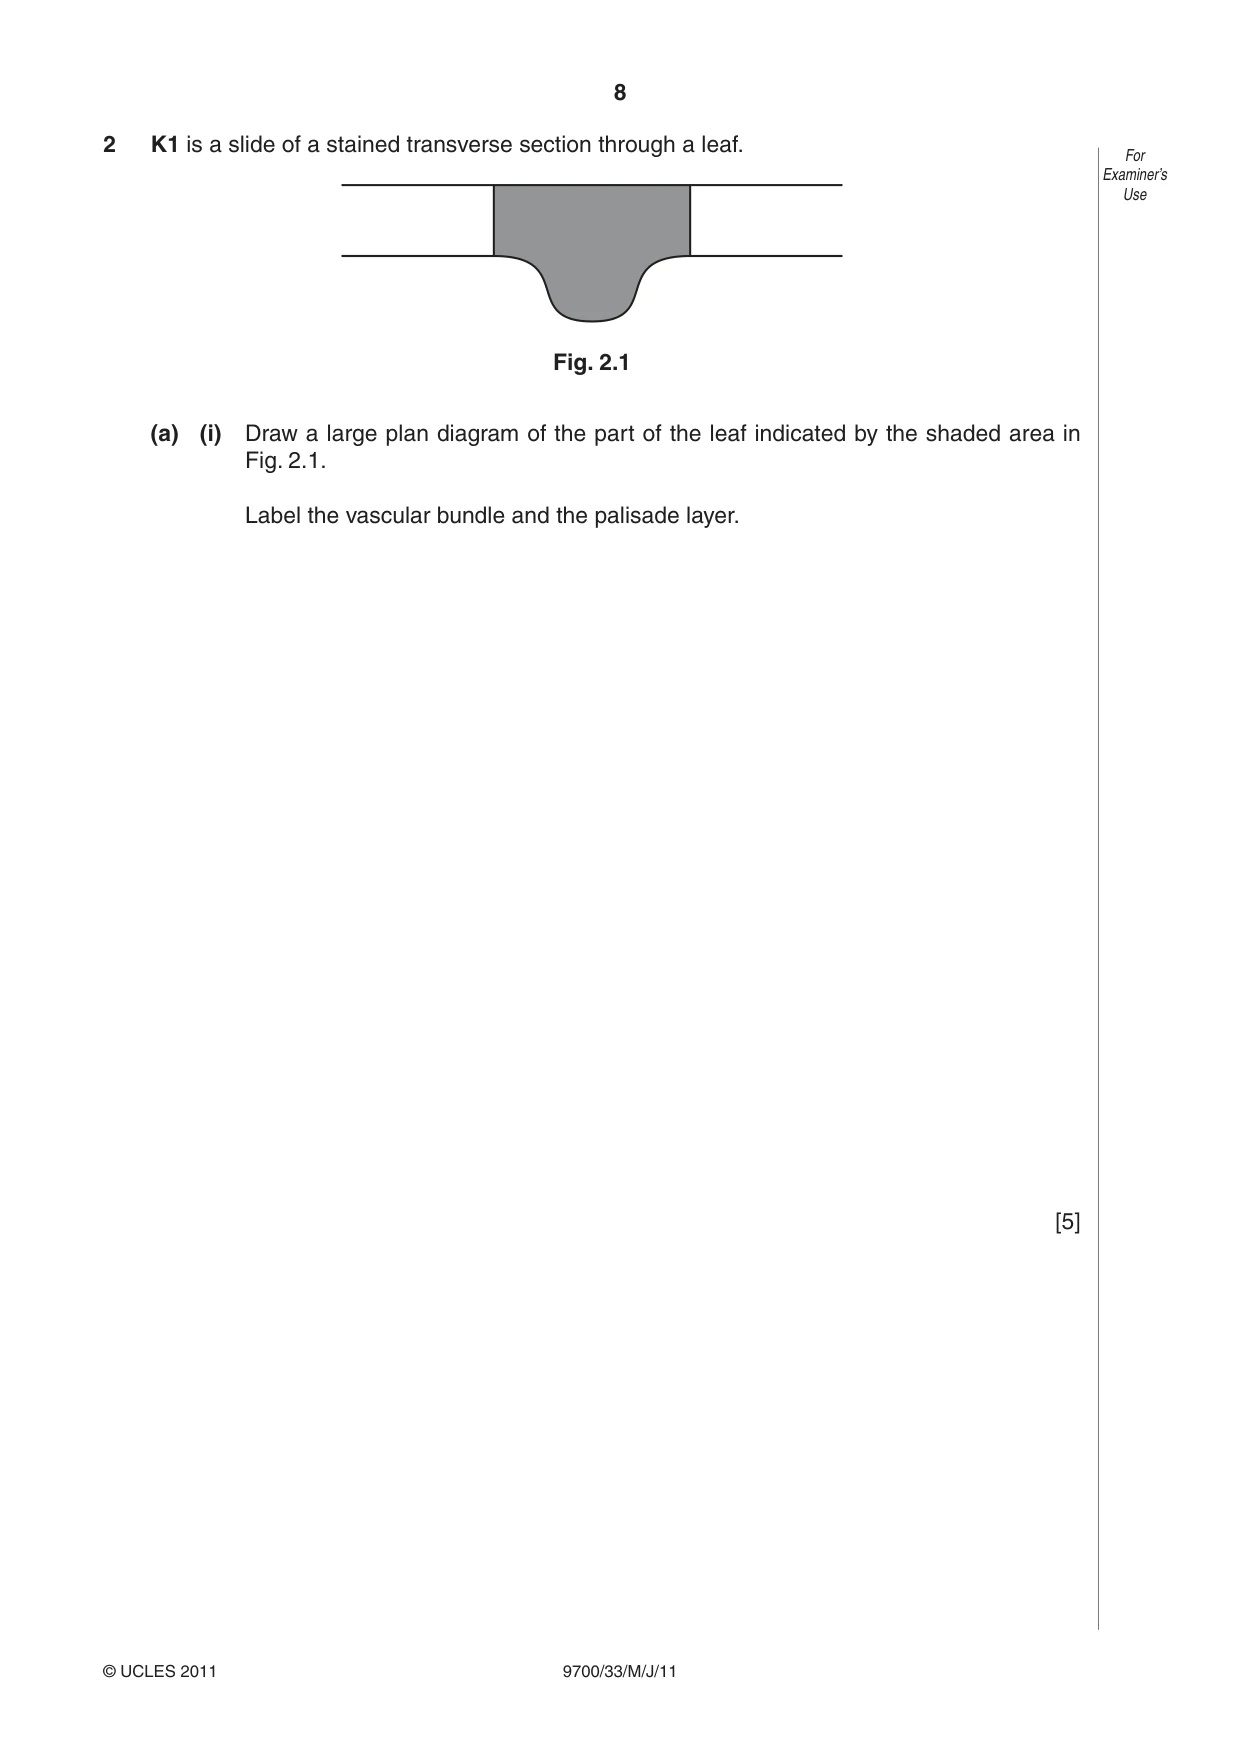
8 9700/33/M/J/11 © UCLES 2011 For Examiner’s Use 2 K1 is a slide of a stained transverse section through a leaf. Fig. 2.1 (a) (i) Draw a large plan diagram of the part of the leaf indicated by the shaded area in Fig. 2.1. Label the vascular bundle and the palisade layer. [5]
Question paper, page 9
9 9700/33/M/J/11 © UCLES 2011 [Turn over For Examiner’s Use (ii) From K1, make a large drawing of one epidermal cell with one attached, whole trichome (hair). Label the trichome (hair) and the epidermal cell. [5] (iii) State two observable features of K1 which support the conclusion that this is a leaf from a plant growing in a dry habitat. Explain how these features reduce water loss. … … … …[2]
Question paper, page 10
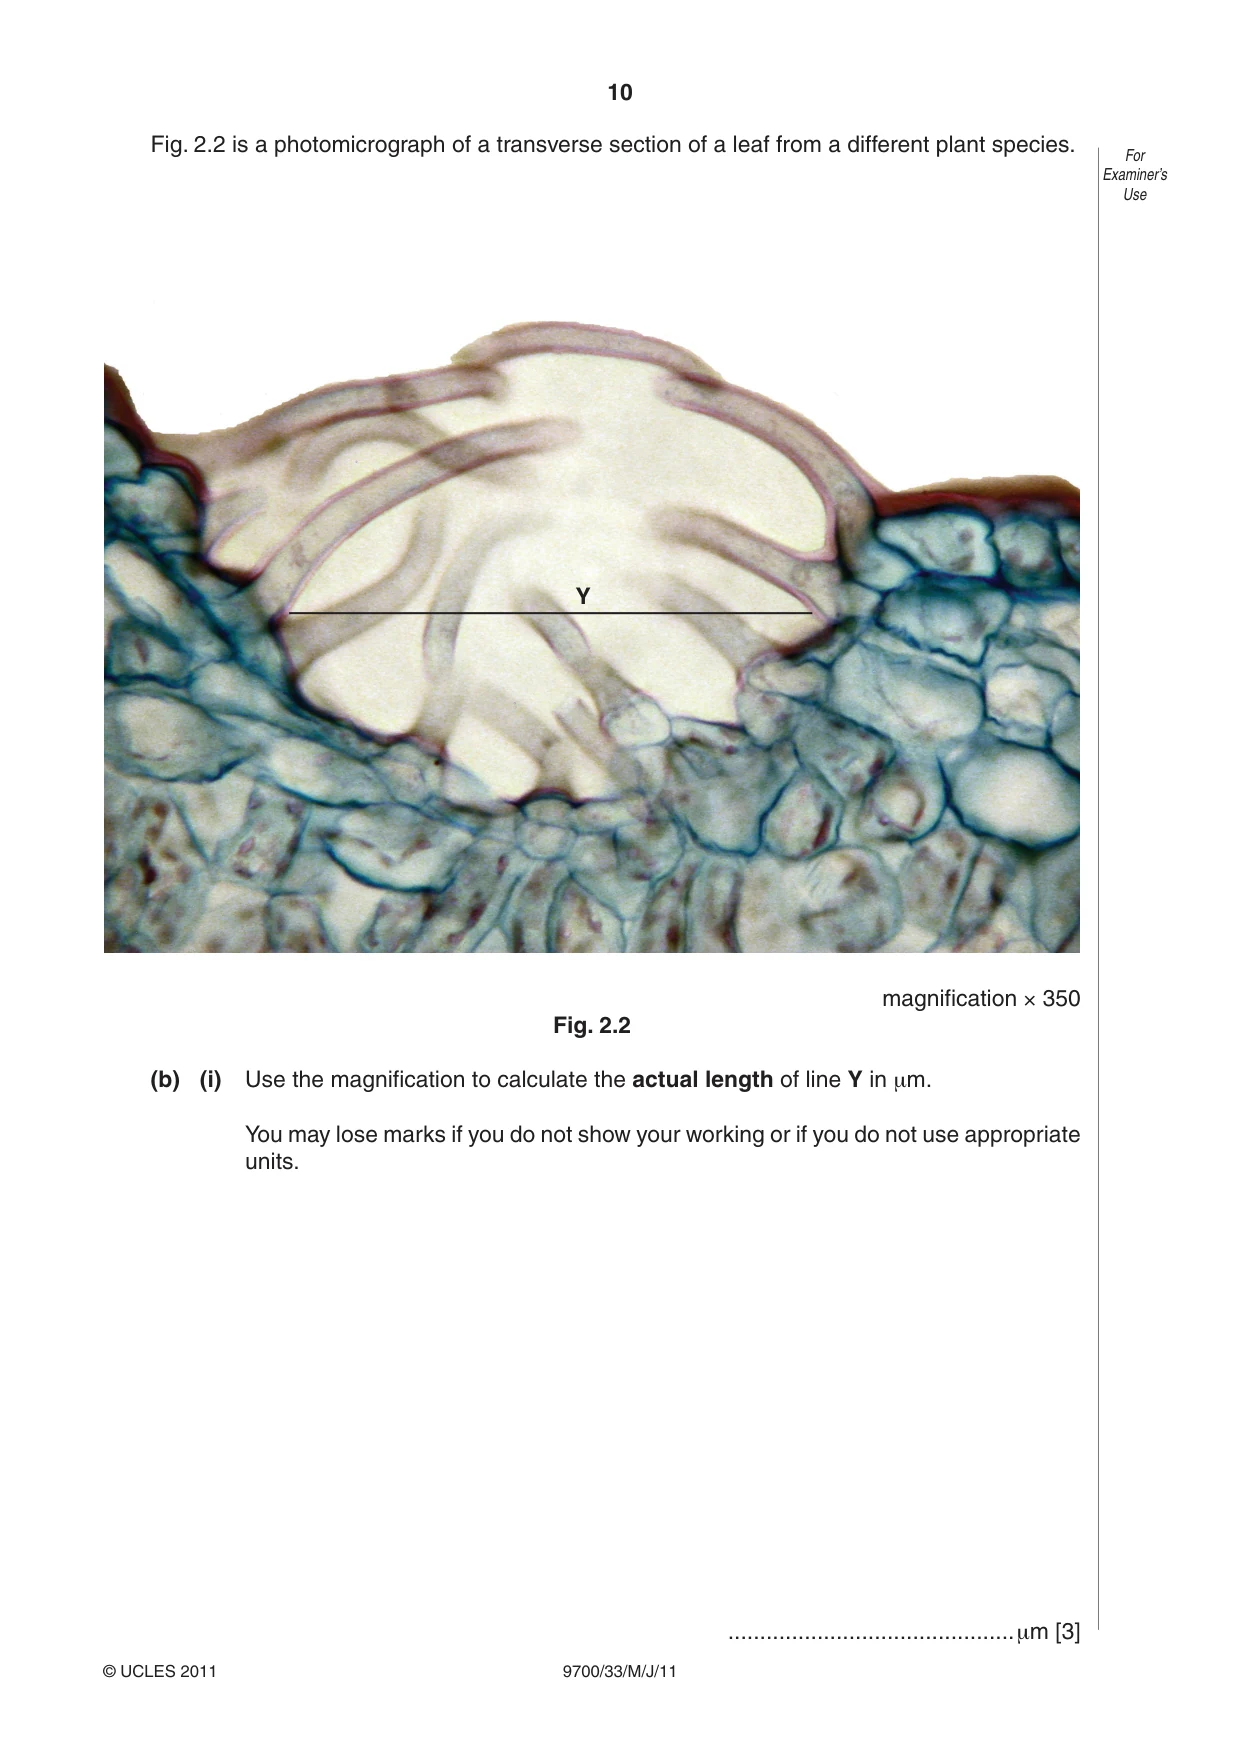
10 9700/33/M/J/11 © UCLES 2011 For Examiner’s Use Fig. 2.2 is a photomicrograph of a transverse section of a leaf from a different plant species. Y magnification × 350 Fig. 2.2 (b) (i) Use the magnification to calculate the actual length of line Y in μm. You may lose marks if you do not show your working or if you do not use appropriate units. …μm [3]
Question paper, page 11
11 9700/33/M/J/11 © UCLES 2011 For Examiner’s Use (ii) Prepare the space below so that it is suitable for you to record the observable similarities and differences between the specimens on K1 and in Fig. 2.2. Record your observations in the space you have prepared. [5] [Total: 20]
Question paper, page 12
12 9700/33/M/J/11 © UCLES 2011 BLANK PAGE Permission to reproduce items where third-party owned material protected by copyright is included has been sought and cleared where possible. Every reasonable effort has been made by the publisher (UCLES) to trace copyright holders, but if any items requiring clearance have unwittingly been included, the publisher will be pleased to make amends at the earliest possible opportunity. University of Cambridge International Examinations is part of the Cambridge Assessment Group. Cambridge Assessment is the brand name of University of Cambridge Local Examinations Syndicate (UCLES), which is itself a department of the University of Cambridge.
Mark scheme, page 1
UNIVERSITY OF CAMBRIDGE INTERNATIONAL EXAMINATIONS GCE Advanced Subsidiary Level and GCE Advanced Level MARK SCHEME for the May/June 2011 question paper for the guidance of teachers 9700 BIOLOGY 9700/33 Paper 31 (Advanced Practical Skills 1), maximum raw mark 40 This mark scheme is published as an aid to teachers and candidates, to indicate the requirements of the examination. It shows the basis on which Examiners were instructed to award marks. It does not indicate the details of the discussions that took place at an Examiners’ meeting before marking began, which would have considered the acceptability of alternative answers. Mark schemes must be read in conjunction with the question papers and the report on the examination. • Cambridge will not enter into discussions or correspondence in connection with these mark schemes. Cambridge is publishing the mark schemes for the May/June 2011 question papers for most IGCSE, GCE Advanced Level and Advanced Subsidiary Level syllabuses and some Ordinary Level syllabuses.
Mark scheme, page 2
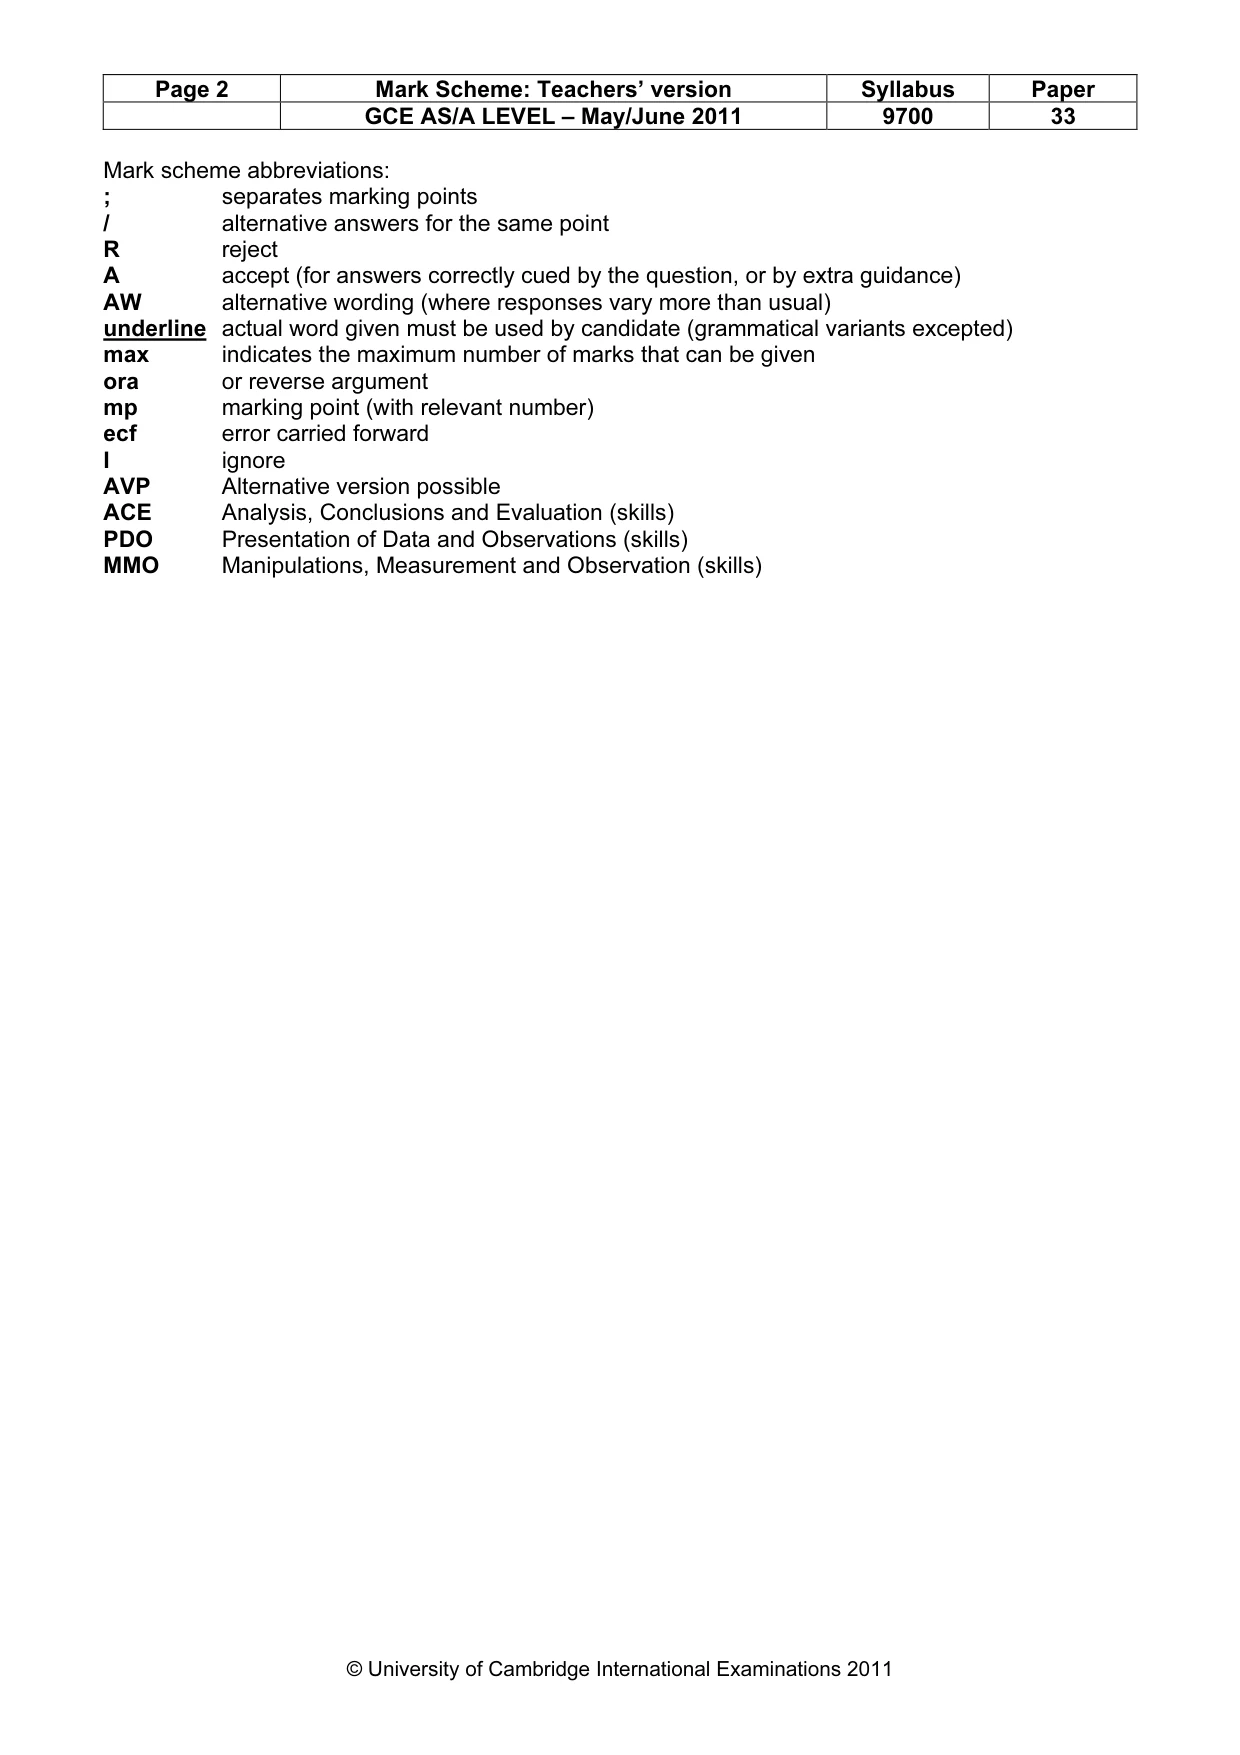
Page 2 Mark Scheme: Teachers’ version Syllabus Paper GCE AS/A LEVEL – May/June 2011 9700 33 © University of Cambridge International Examinations 2011 Mark scheme abbreviations: ; separates marking points / alternative answers for the same point R reject A accept (for answers correctly cued by the question, or by extra guidance) AW alternative wording (where responses vary more than usual) underline actual word given must be used by candidate (grammatical variants excepted) max indicates the maximum number of marks that can be given ora or reverse argument mp marking point (with relevant number) ecf error carried forward I ignore AVP Alternative version possible ACE Analysis, Conclusions and Evaluation (skills) PDO Presentation of Data and Observations (skills) MMO Manipulations, Measurement and Observation (skills)
Mark scheme, page 3
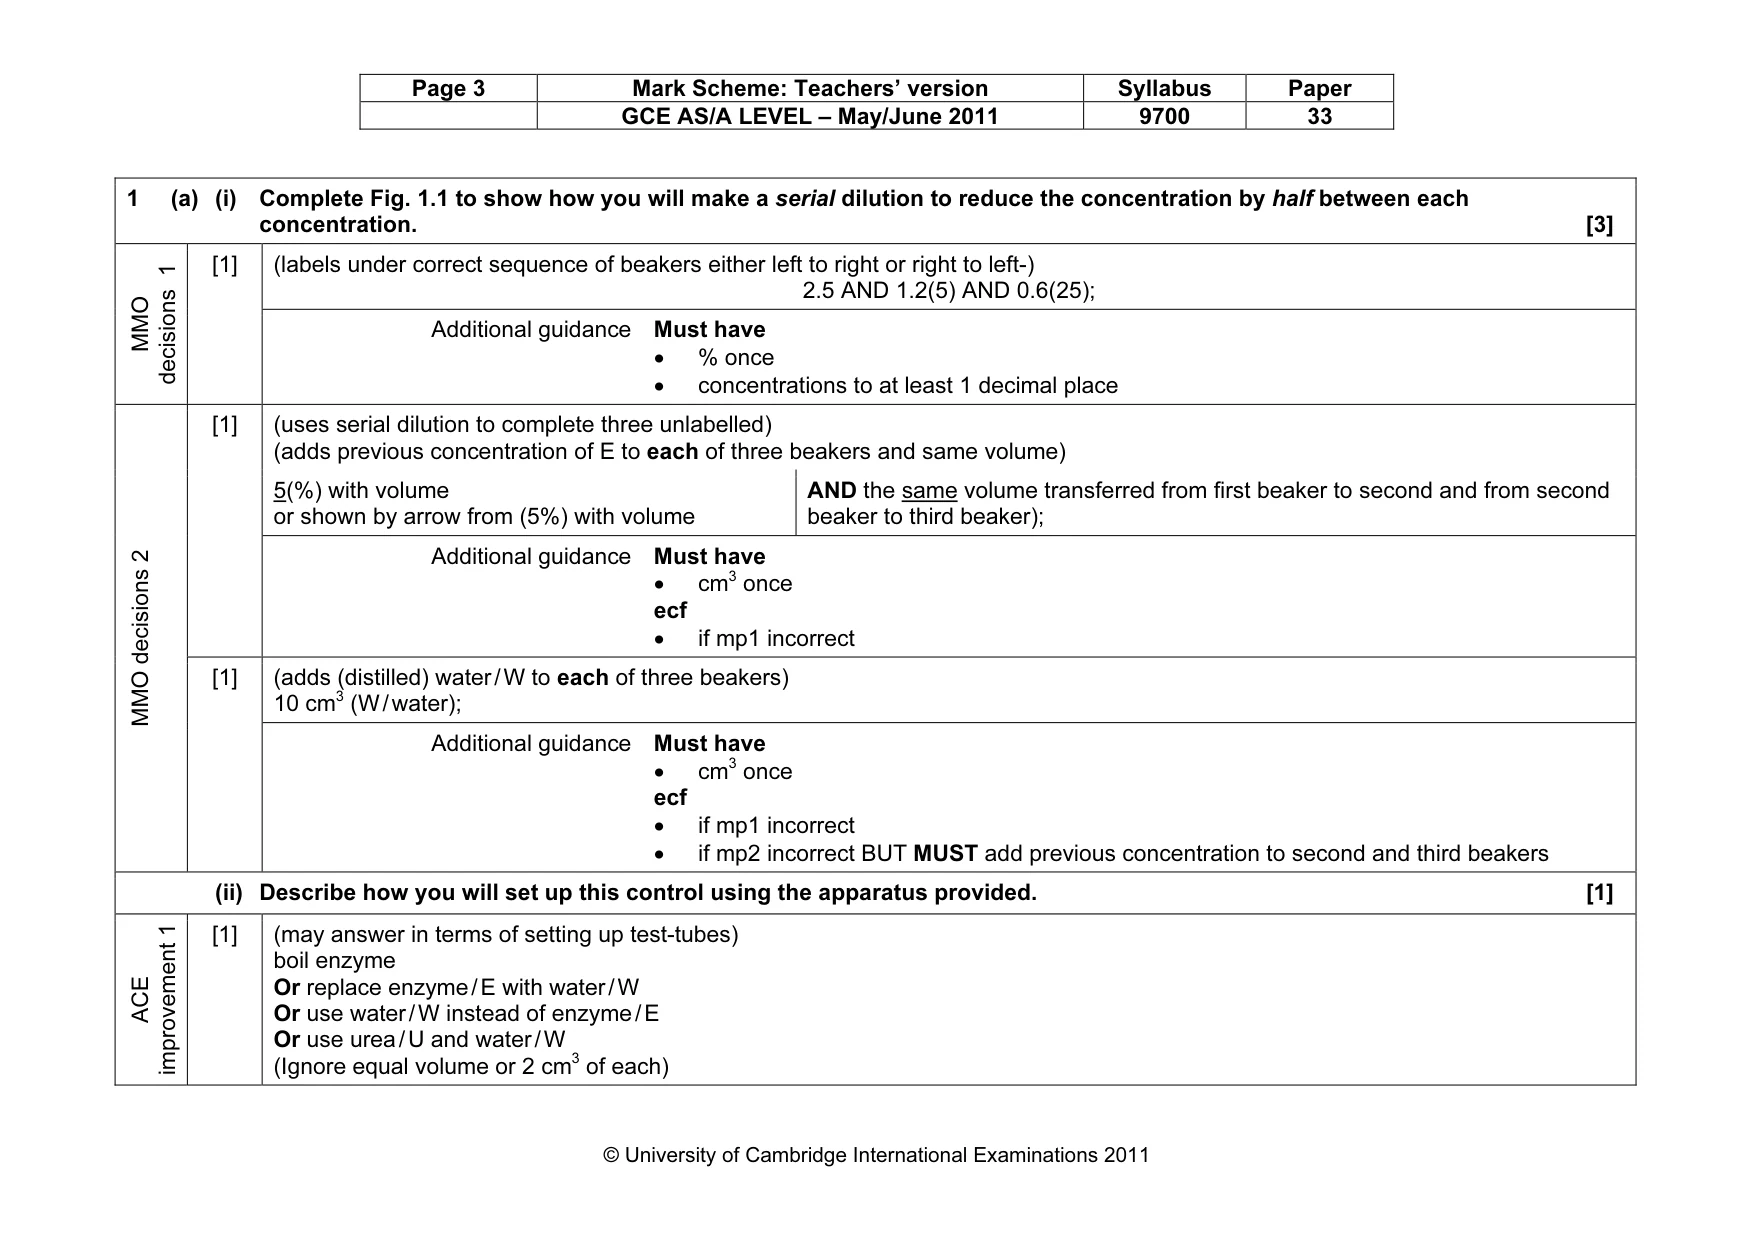
Page 3 Mark Scheme: Teachers’ version Syllabus Paper GCE AS/A LEVEL – May/June 2011 9700 33 © University of Cambridge International Examinations 2011 1 (a) (i) Complete Fig. 1.1 to show how you will make a serial dilution to reduce the concentration by half between each concentration. [3] (labels under correct sequence of beakers either left to right or right to left-) 2.5 AND 1.2(5) AND 0.6(25); MMO decisions 1 [1] Additional guidance Must have • % once • concentrations to at least 1 decimal place (uses serial dilution to complete three unlabelled) (adds previous concentration of E to each of three beakers and same volume) 5(%) with volume or shown by arrow from (5%) with volume AND the same volume transferred from first beaker to second and from second beaker to third beaker); [1] Additional guidance Must have • cm3 once ecf • if mp1 incorrect (adds (distilled) water / W to each of three beakers) 10 cm3 (W / water); MMO decisions 2 [1] Additional guidance Must have • cm3 once ecf • if mp1 incorrect • if mp2 incorrect BUT MUST add previous concentration to second and third beakers (ii) Describe how you will set up this control using the apparatus provided. [1] ACE improvement 1 [1] (may answer in terms of setting up test-tubes) boil enzyme Or replace enzyme / E with water / W Or use water / W instead of enzyme / E Or use urea / U and water / W (Ignore equal volume or 2 cm3 of each)
Mark scheme, page 4
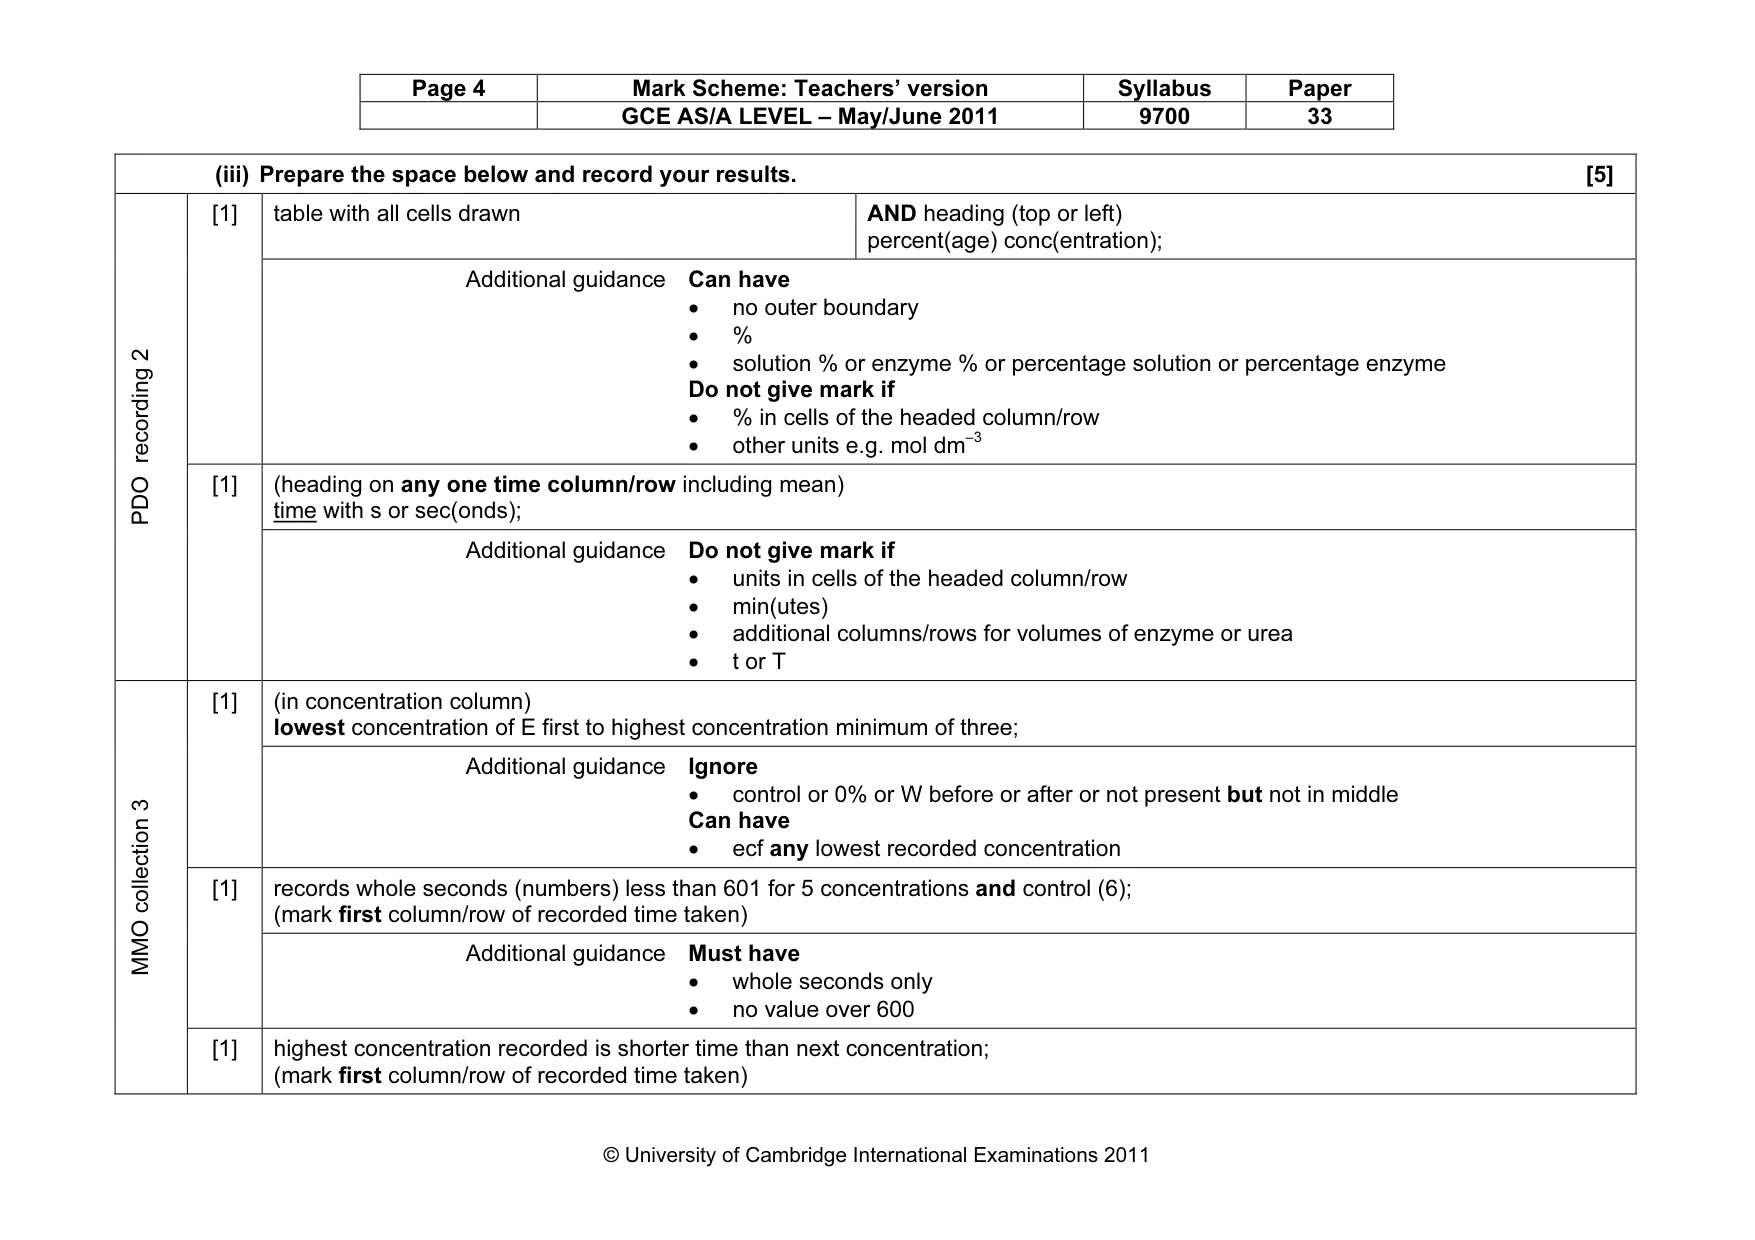
Page 4 Mark Scheme: Teachers’ version Syllabus Paper GCE AS/A LEVEL – May/June 2011 9700 33 © University of Cambridge International Examinations 2011 (iii) Prepare the space below and record your results. [5] table with all cells drawn AND heading (top or left) percent(age) conc(entration); [1] Additional guidance Can have • no outer boundary • % • solution % or enzyme % or percentage solution or percentage enzyme Do not give mark if • % in cells of the headed column/row • other units e.g. mol dm–3 (heading on any one time column/row including mean) time with s or sec(onds); PDO recording 2 [1] Additional guidance Do not give mark if • units in cells of the headed column/row • min(utes) • additional columns/rows for volumes of enzyme or urea • t or T (in concentration column) lowest concentration of E first to highest concentration minimum of three; [1] Additional guidance Ignore • control or 0% or W before or after or not present but not in middle Can have • ecf any lowest recorded concentration records whole seconds (numbers) less than 601 for 5 concentrations and control (6); (mark first column/row of recorded time taken) [1] Additional guidance Must have • whole seconds only • no value over 600 MMO collection 3 [1] highest concentration recorded is shorter time than next concentration; (mark first column/row of recorded time taken)
Mark scheme, page 5
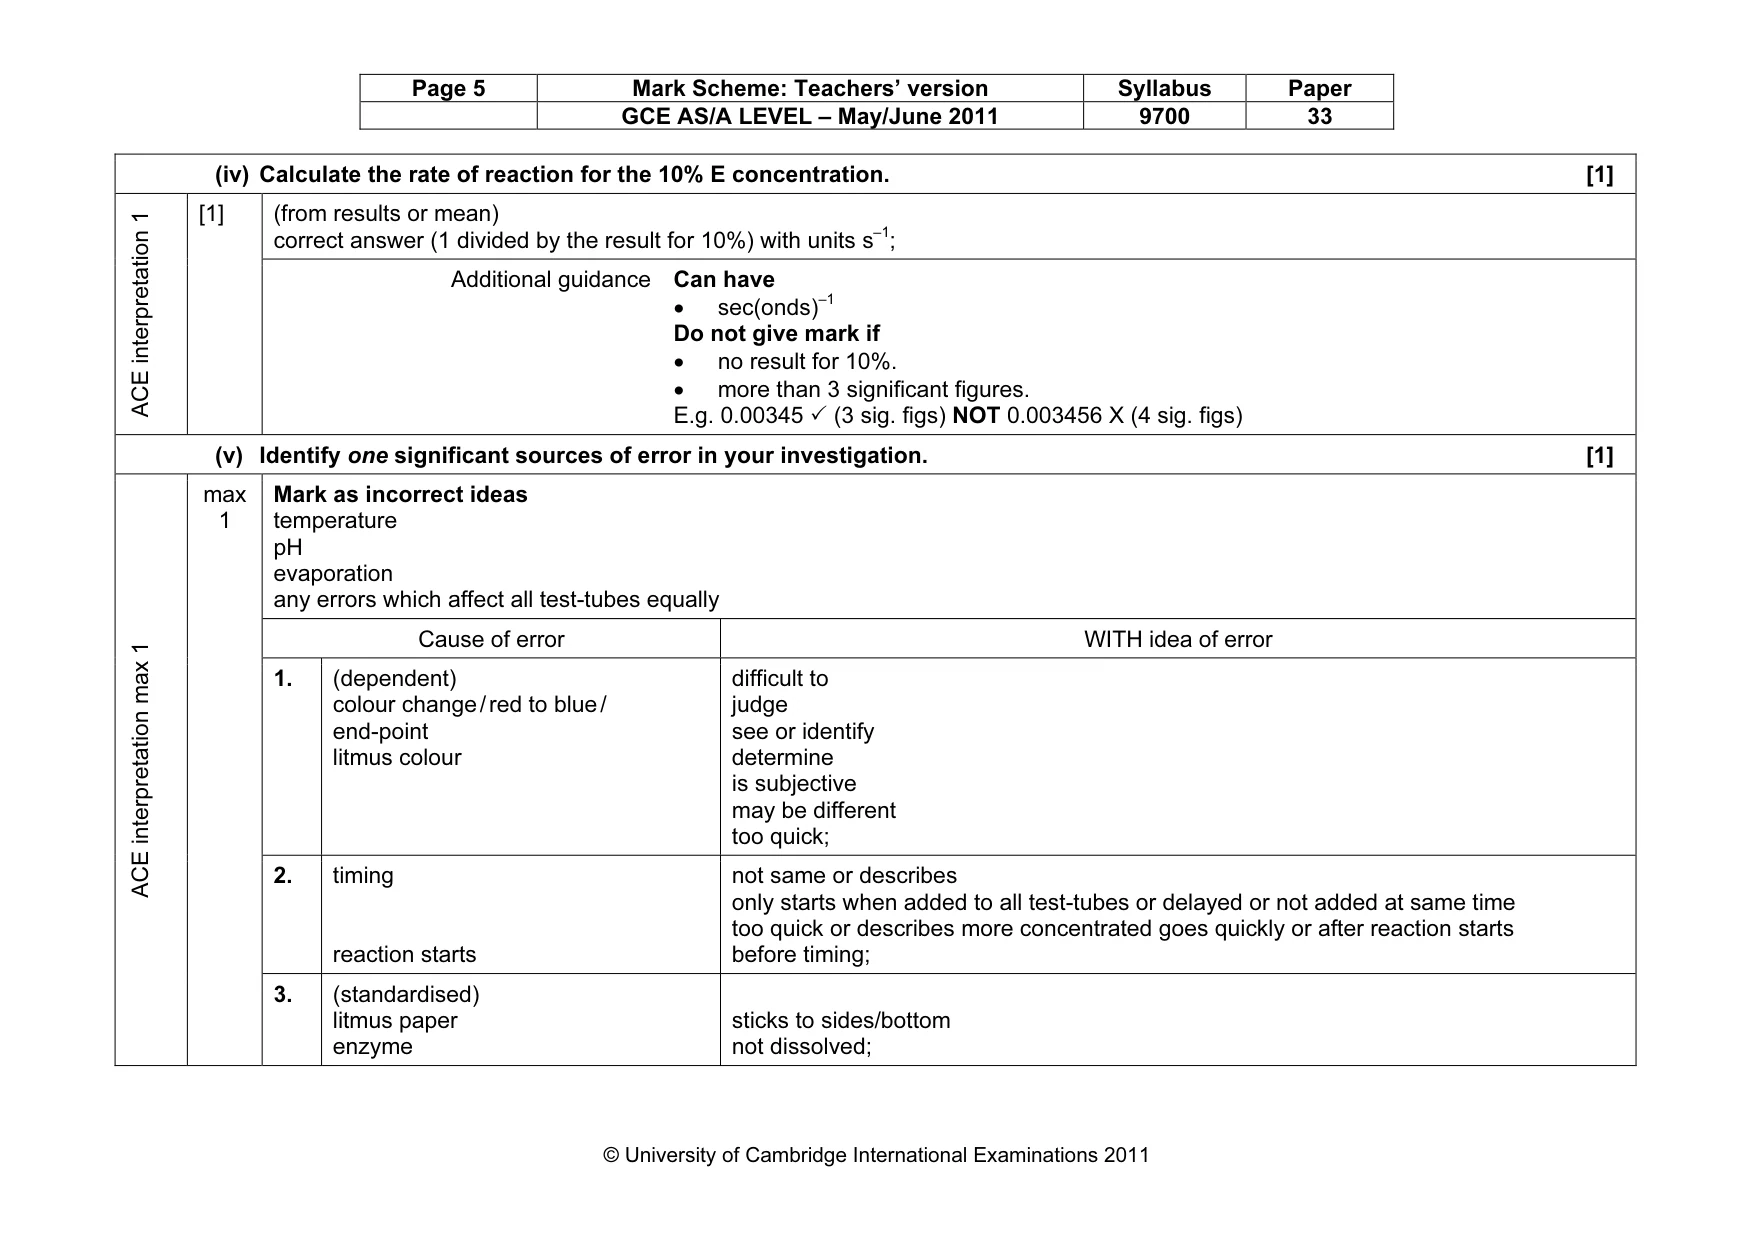
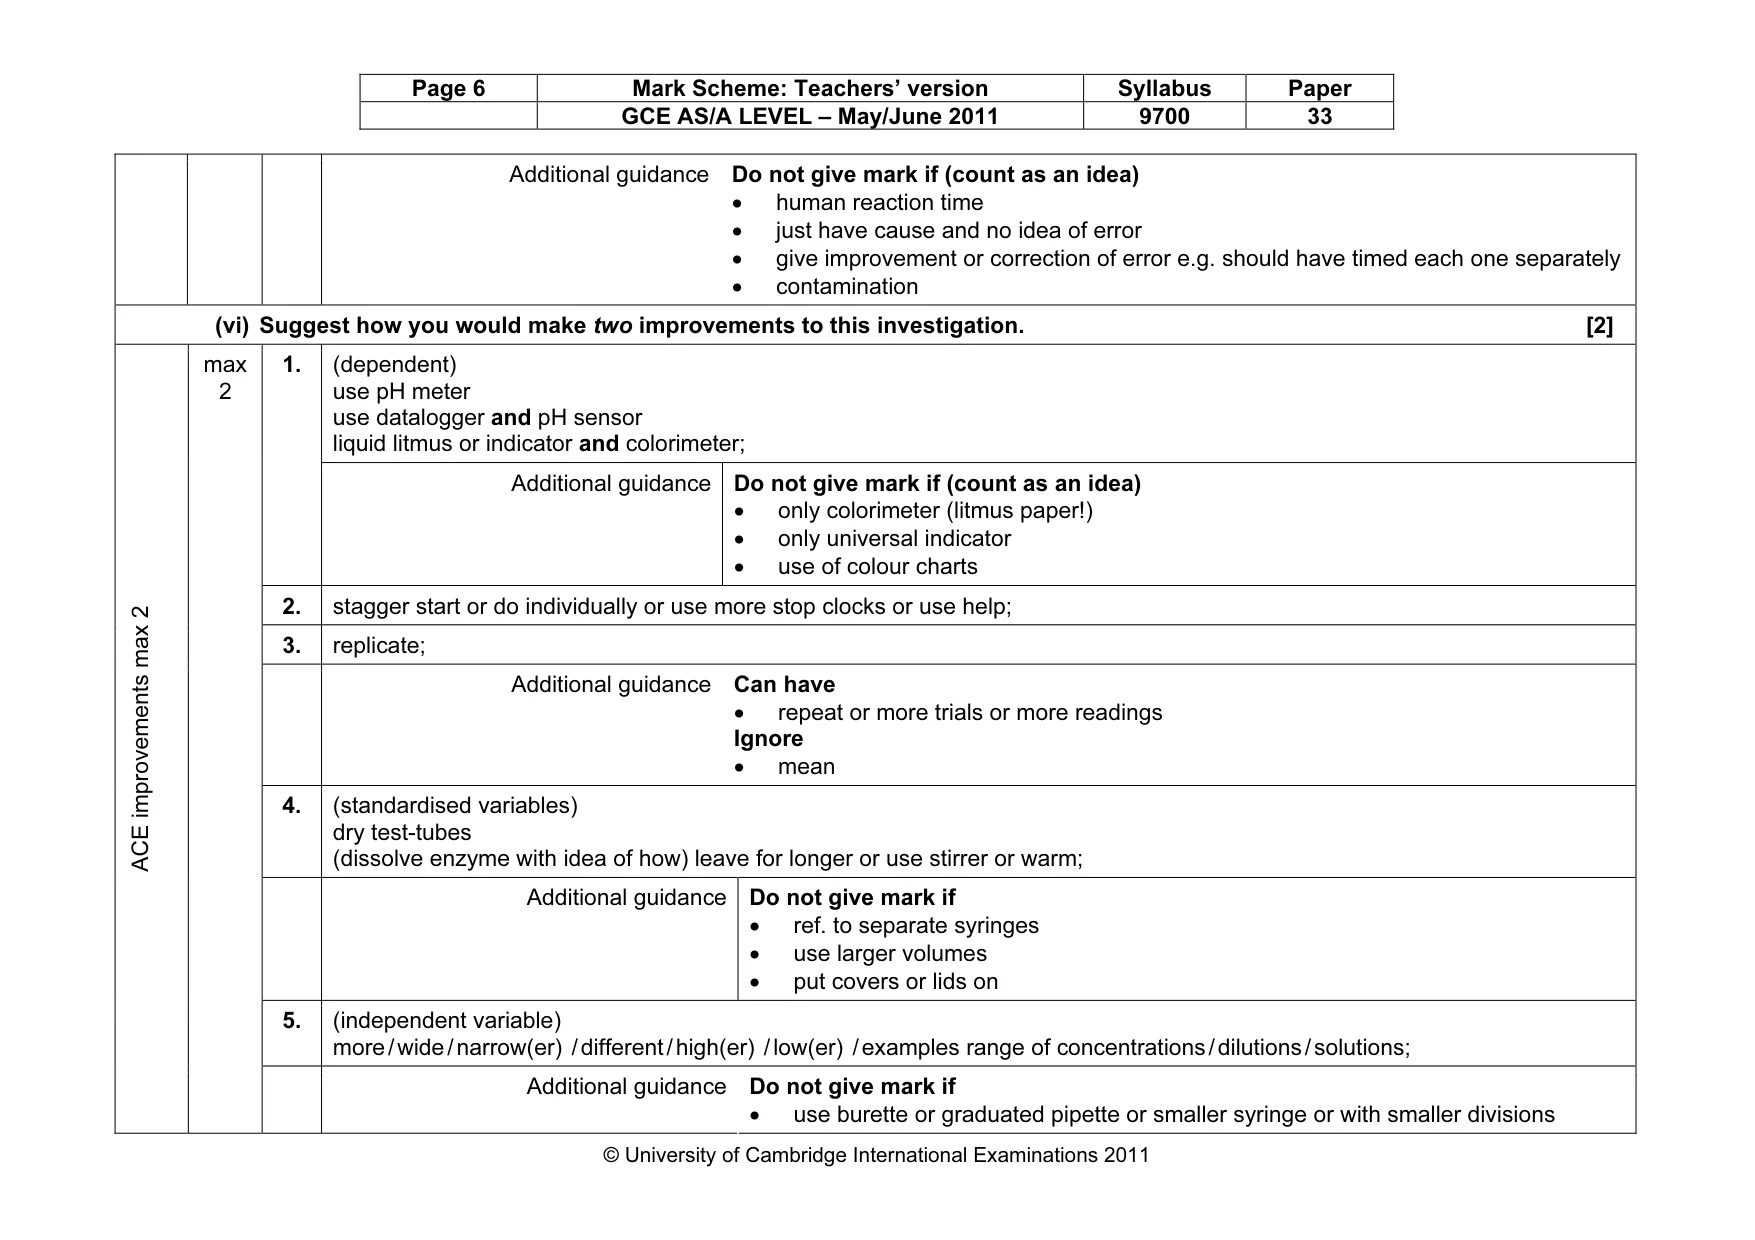
Page 5 Mark Scheme: Teachers’ version Syllabus Paper GCE AS/A LEVEL – May/June 2011 9700 33 © University of Cambridge International Examinations 2011 (iv) Calculate the rate of reaction for the 10% E concentration. [1] (from results or mean) correct answer (1 divided by the result for 10%) with units s–1; ACE interpretation 1 [1] Additional guidance Can have • sec(onds)–1 Do not give mark if • no result for 10%. • more than 3 significant figures. E.g. 0.00345 ✓ (3 sig. figs) NOT 0.003456 X (4 sig. figs) (v) Identify one significant sources of error in your investigation. [1] Mark as incorrect ideas temperature pH evaporation any errors which affect all test-tubes equally Cause of error WITH idea of error 1. (dependent) colour change / red to blue / end-point litmus colour difficult to judge see or identify determine is subjective may be different too quick; 2. timing reaction starts not same or describes only starts when added to all test-tubes or delayed or not added at same time too quick or describes more concentrated goes quickly or after reaction starts before timing; ACE interpretation max 1 max 1 3. (standardised) litmus paper enzyme sticks to sides/bottom not dissolved;
Mark scheme, page 6
Page 6 Mark Scheme: Teachers’ version Syllabus Paper GCE AS/A LEVEL – May/June 2011 9700 33 © University of Cambridge International Examinations 2011 Additional guidance Do not give mark if (count as an idea) • human reaction time • just have cause and no idea of error • give improvement or correction of error e.g. should have timed each one separately • contamination (vi) Suggest how you would make two improvements to this investigation. [2] 1. (dependent) use pH meter use datalogger and pH sensor liquid litmus or indicator and colorimeter; Additional guidance Do not give mark if (count as an idea) • only colorimeter (litmus paper!) • only universal indicator • use of colour charts 2. stagger start or do individually or use more stop clocks or use help; 3. replicate; Additional guidance Can have • repeat or more trials or more readings Ignore • mean 4. (standardised variables) dry test-tubes (dissolve enzyme with idea of how) leave for longer or use stirrer or warm; Additional guidance Do not give mark if • ref. to separate syringes • use larger volumes • put covers or lids on 5. (independent variable) more / wide / narrow(er) / different / high(er) / low(er) / examples range of concentrations / dilutions / solutions; ACE improvements max 2 max 2 Additional guidance Do not give mark if • use burette or graduated pipette or smaller syringe or with smaller divisions
Mark scheme, page 7
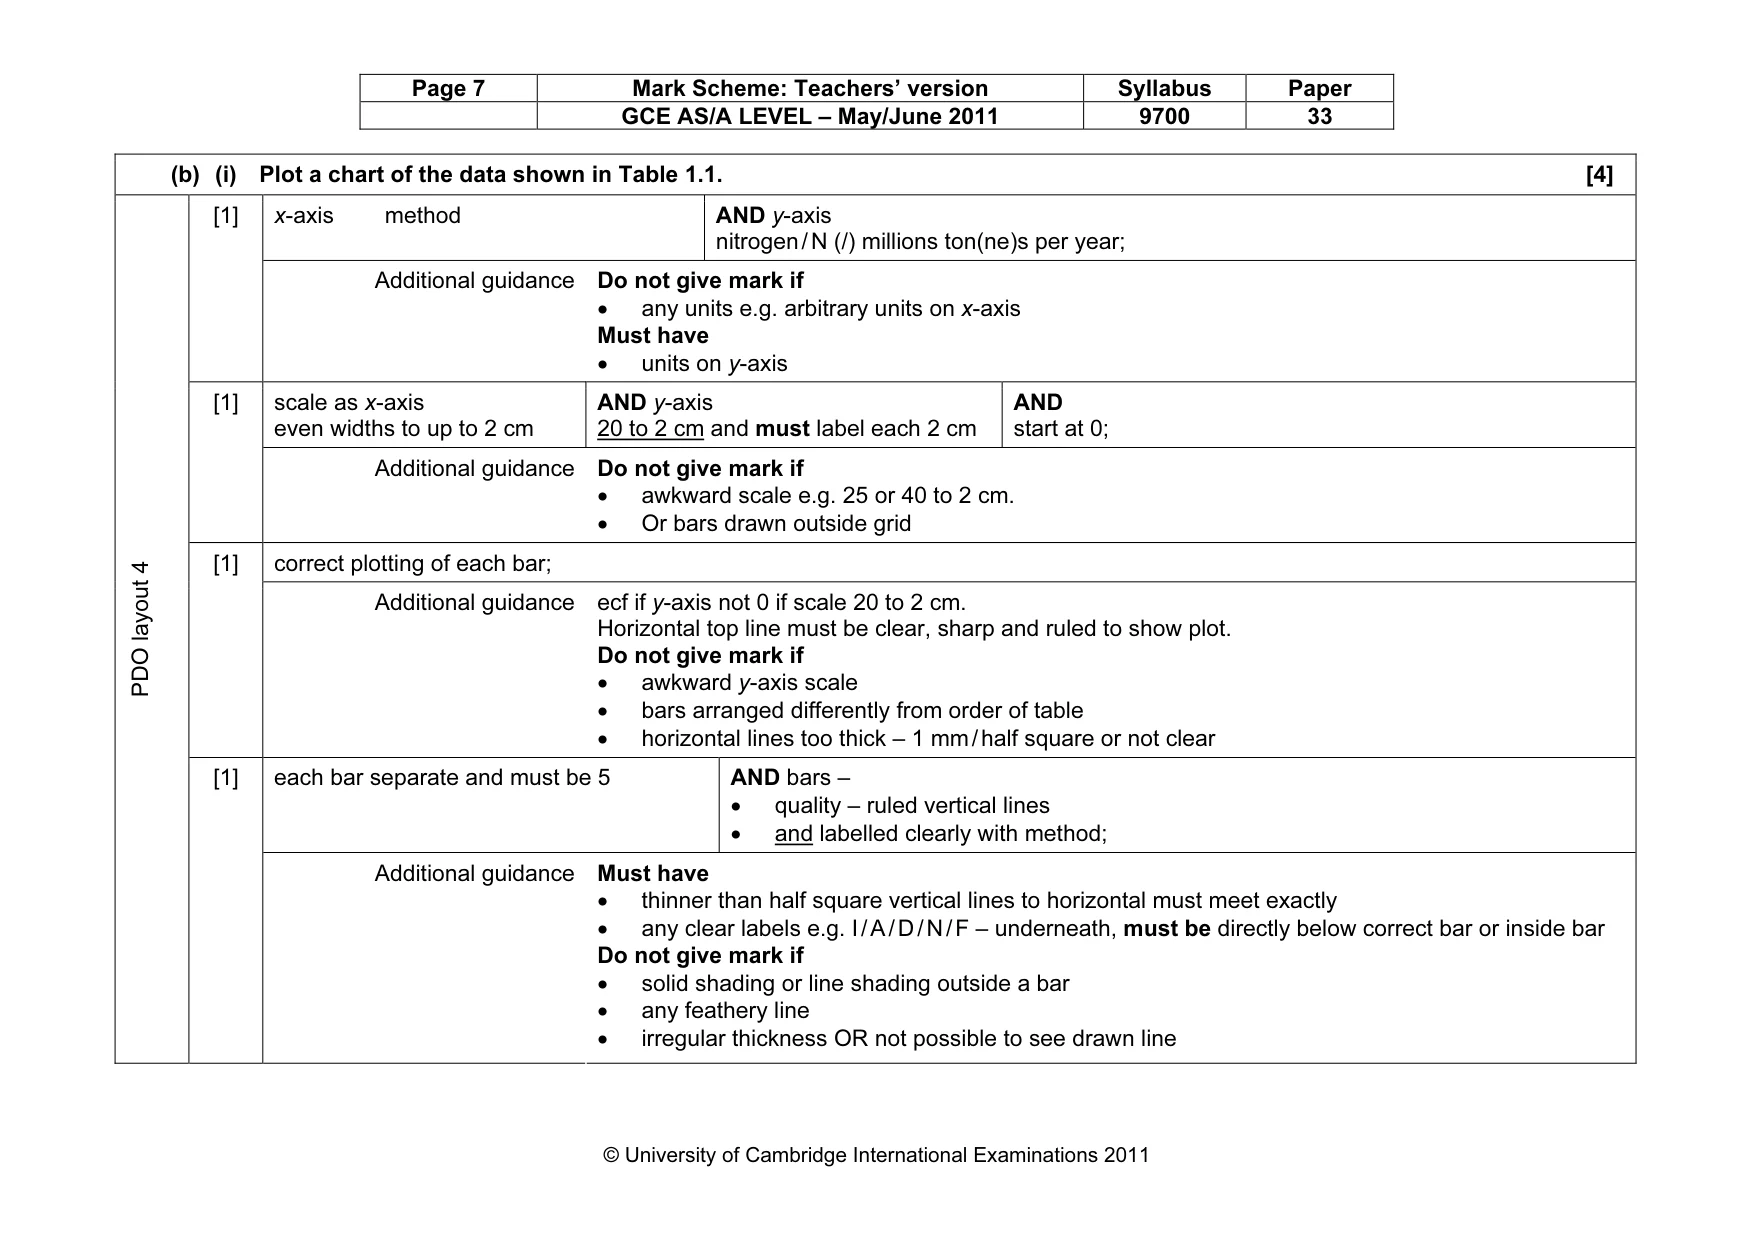
Page 7 Mark Scheme: Teachers’ version Syllabus Paper GCE AS/A LEVEL – May/June 2011 9700 33 © University of Cambridge International Examinations 2011 (b) (i) Plot a chart of the data shown in Table 1.1. [4] x-axis method AND y-axis nitrogen / N (/) millions ton(ne)s per year; [1] Additional guidance Do not give mark if • any units e.g. arbitrary units on x-axis Must have • units on y-axis scale as x-axis even widths to up to 2 cm AND y-axis 20 to 2 cm and must label each 2 cm AND start at 0; [1] Additional guidance Do not give mark if • awkward scale e.g. 25 or 40 to 2 cm. • Or bars drawn outside grid correct plotting of each bar; [1] Additional guidance ecf if y-axis not 0 if scale 20 to 2 cm. Horizontal top line must be clear, sharp and ruled to show plot. Do not give mark if • awkward y-axis scale • bars arranged differently from order of table • horizontal lines too thick – 1 mm / half square or not clear each bar separate and must be 5 AND bars – • quality – ruled vertical lines • and labelled clearly with method; PDO layout 4 [1] Additional guidance Must have • thinner than half square vertical lines to horizontal must meet exactly • any clear labels e.g. I / A / D / N / F – underneath, must be directly below correct bar or inside bar Do not give mark if • solid shading or line shading outside a bar • any feathery line • irregular thickness OR not possible to see drawn line
Mark scheme, page 8
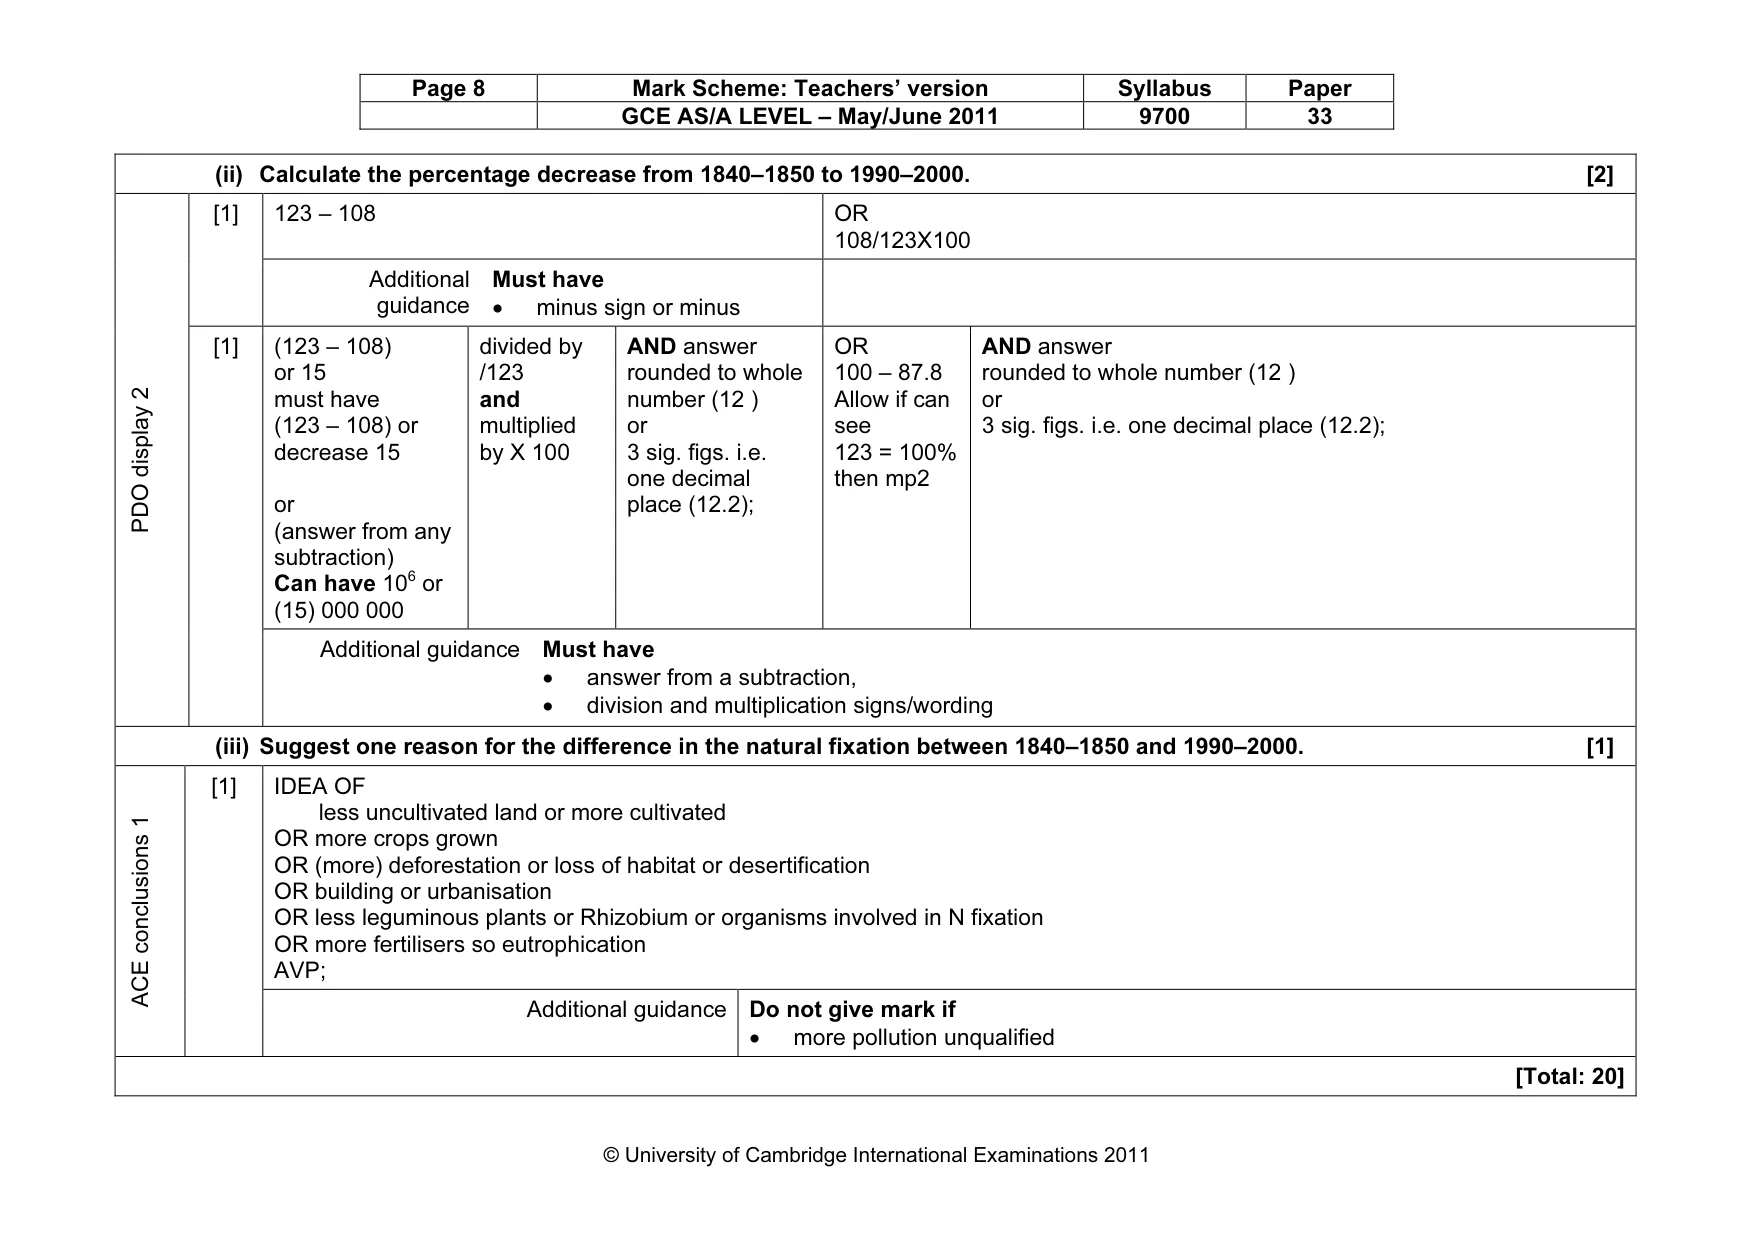
Page 8 Mark Scheme: Teachers’ version Syllabus Paper GCE AS/A LEVEL – May/June 2011 9700 33 © University of Cambridge International Examinations 2011 (ii) Calculate the percentage decrease from 1840–1850 to 1990–2000. [2] 123 – 108 OR 108/123X100 [1] Additional guidance Must have • minus sign or minus (123 – 108) or 15 must have (123 – 108) or decrease 15 or (answer from any subtraction) Can have 106 or (15) 000 000 divided by /123 and multiplied by X 100 AND answer rounded to whole number (12 ) or 3 sig. figs. i.e. one decimal place (12.2); OR 100 – 87.8 Allow if can see 123 = 100% then mp2 AND answer rounded to whole number (12 ) or 3 sig. figs. i.e. one decimal place (12.2); PDO display 2 [1] Additional guidance Must have • answer from a subtraction, • division and multiplication signs/wording (iii) Suggest one reason for the difference in the natural fixation between 1840–1850 and 1990–2000. [1] IDEA OF less uncultivated land or more cultivated OR more crops grown OR (more) deforestation or loss of habitat or desertification OR building or urbanisation OR less leguminous plants or Rhizobium or organisms involved in N fixation OR more fertilisers so eutrophication AVP; ACE conclusions 1 [1] Additional guidance Do not give mark if • more pollution unqualified [Total: 20]
Mark scheme, page 9
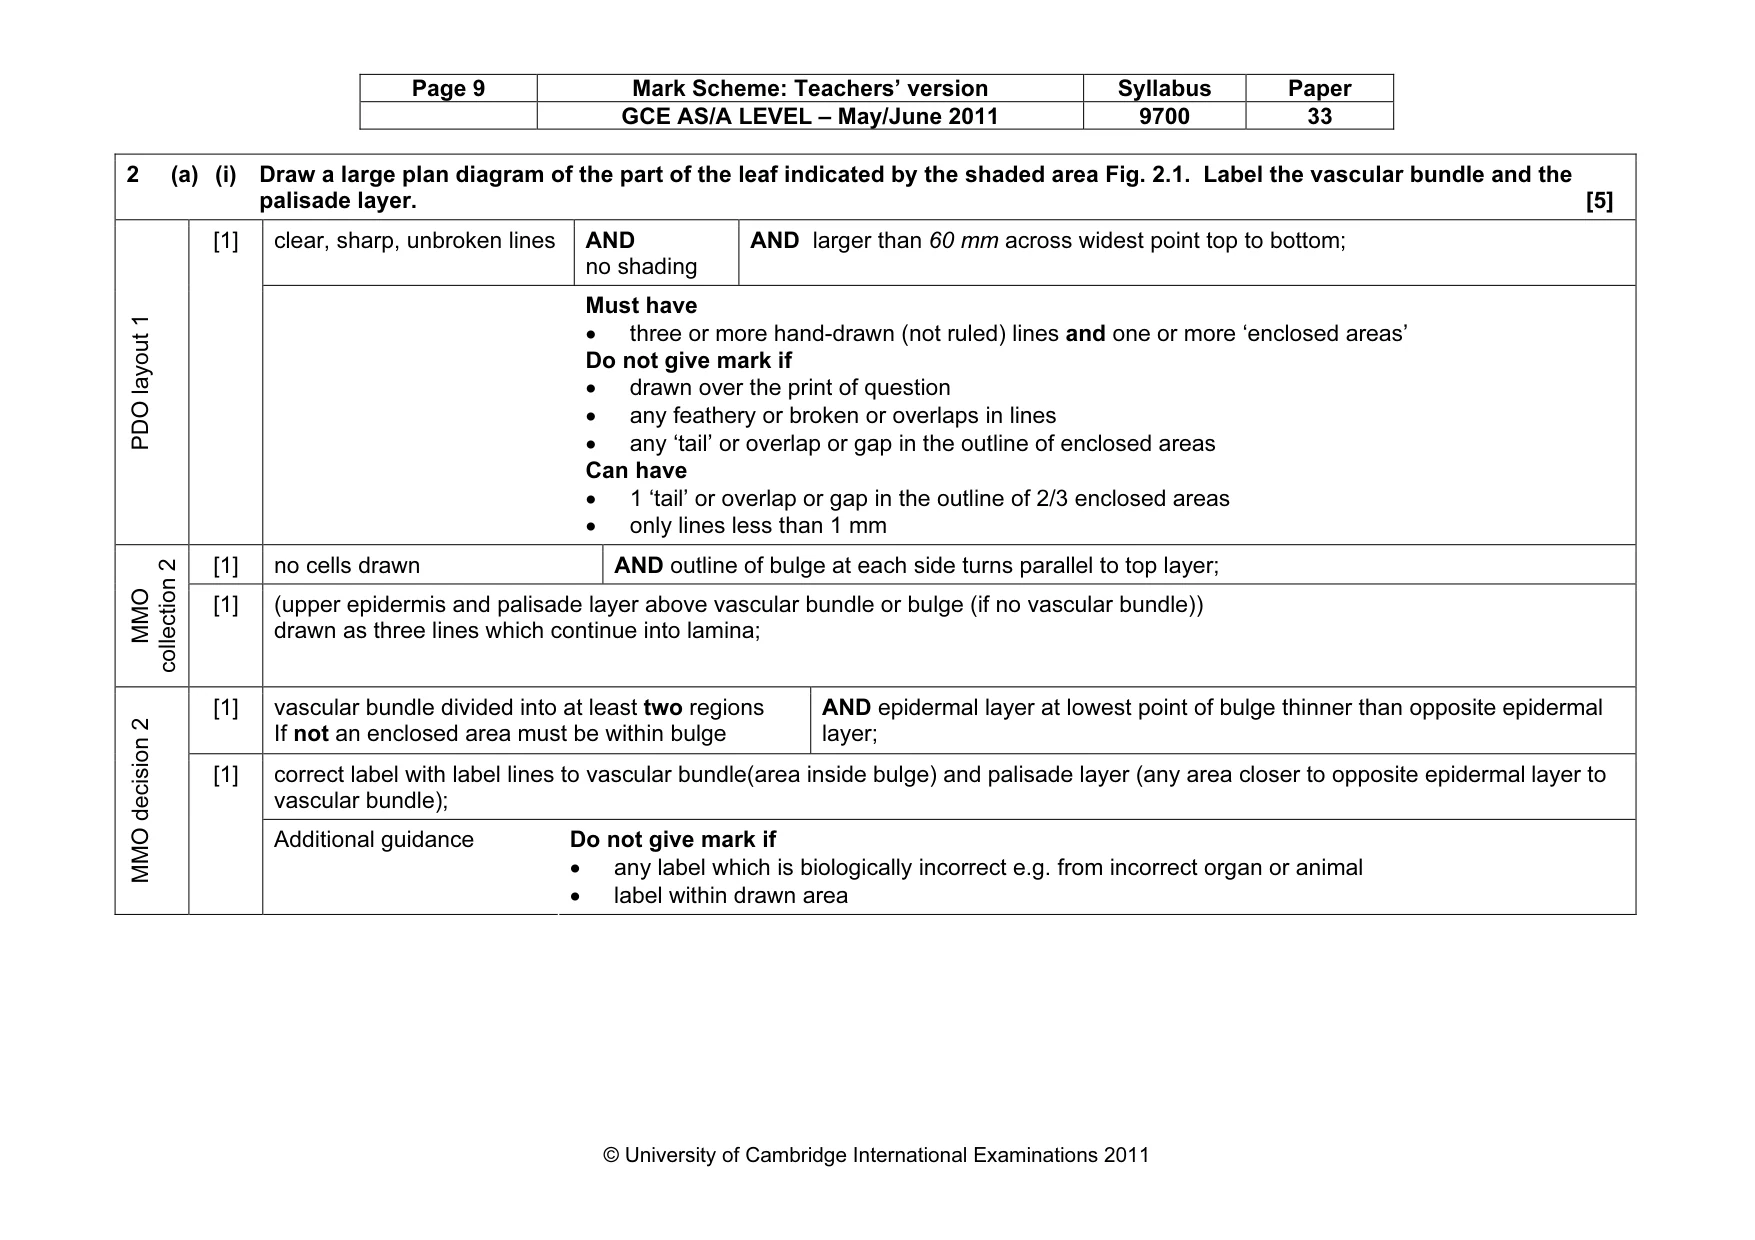
Page 9 Mark Scheme: Teachers’ version Syllabus Paper GCE AS/A LEVEL – May/June 2011 9700 33 © University of Cambridge International Examinations 2011 2 (a) (i) Draw a large plan diagram of the part of the leaf indicated by the shaded area Fig. 2.1. Label the vascular bundle and the palisade layer. [5] clear, sharp, unbroken lines AND no shading AND larger than 60 mm across widest point top to bottom; PDO layout 1 [1] Must have • three or more hand-drawn (not ruled) lines and one or more ‘enclosed areas’ Do not give mark if • drawn over the print of question • any feathery or broken or overlaps in lines • any ‘tail’ or overlap or gap in the outline of enclosed areas Can have • 1 ‘tail’ or overlap or gap in the outline of 2/3 enclosed areas • only lines less than 1 mm [1] no cells drawn AND outline of bulge at each side turns parallel to top layer; MMO collection 2 [1] (upper epidermis and palisade layer above vascular bundle or bulge (if no vascular bundle)) drawn as three lines which continue into lamina; [1] vascular bundle divided into at least two regions If not an enclosed area must be within bulge AND epidermal layer at lowest point of bulge thinner than opposite epidermal layer; correct label with label lines to vascular bundle(area inside bulge) and palisade layer (any area closer to opposite epidermal layer to vascular bundle); MMO decision 2 [1] Additional guidance Do not give mark if • any label which is biologically incorrect e.g. from incorrect organ or animal • label within drawn area
Mark scheme, page 10
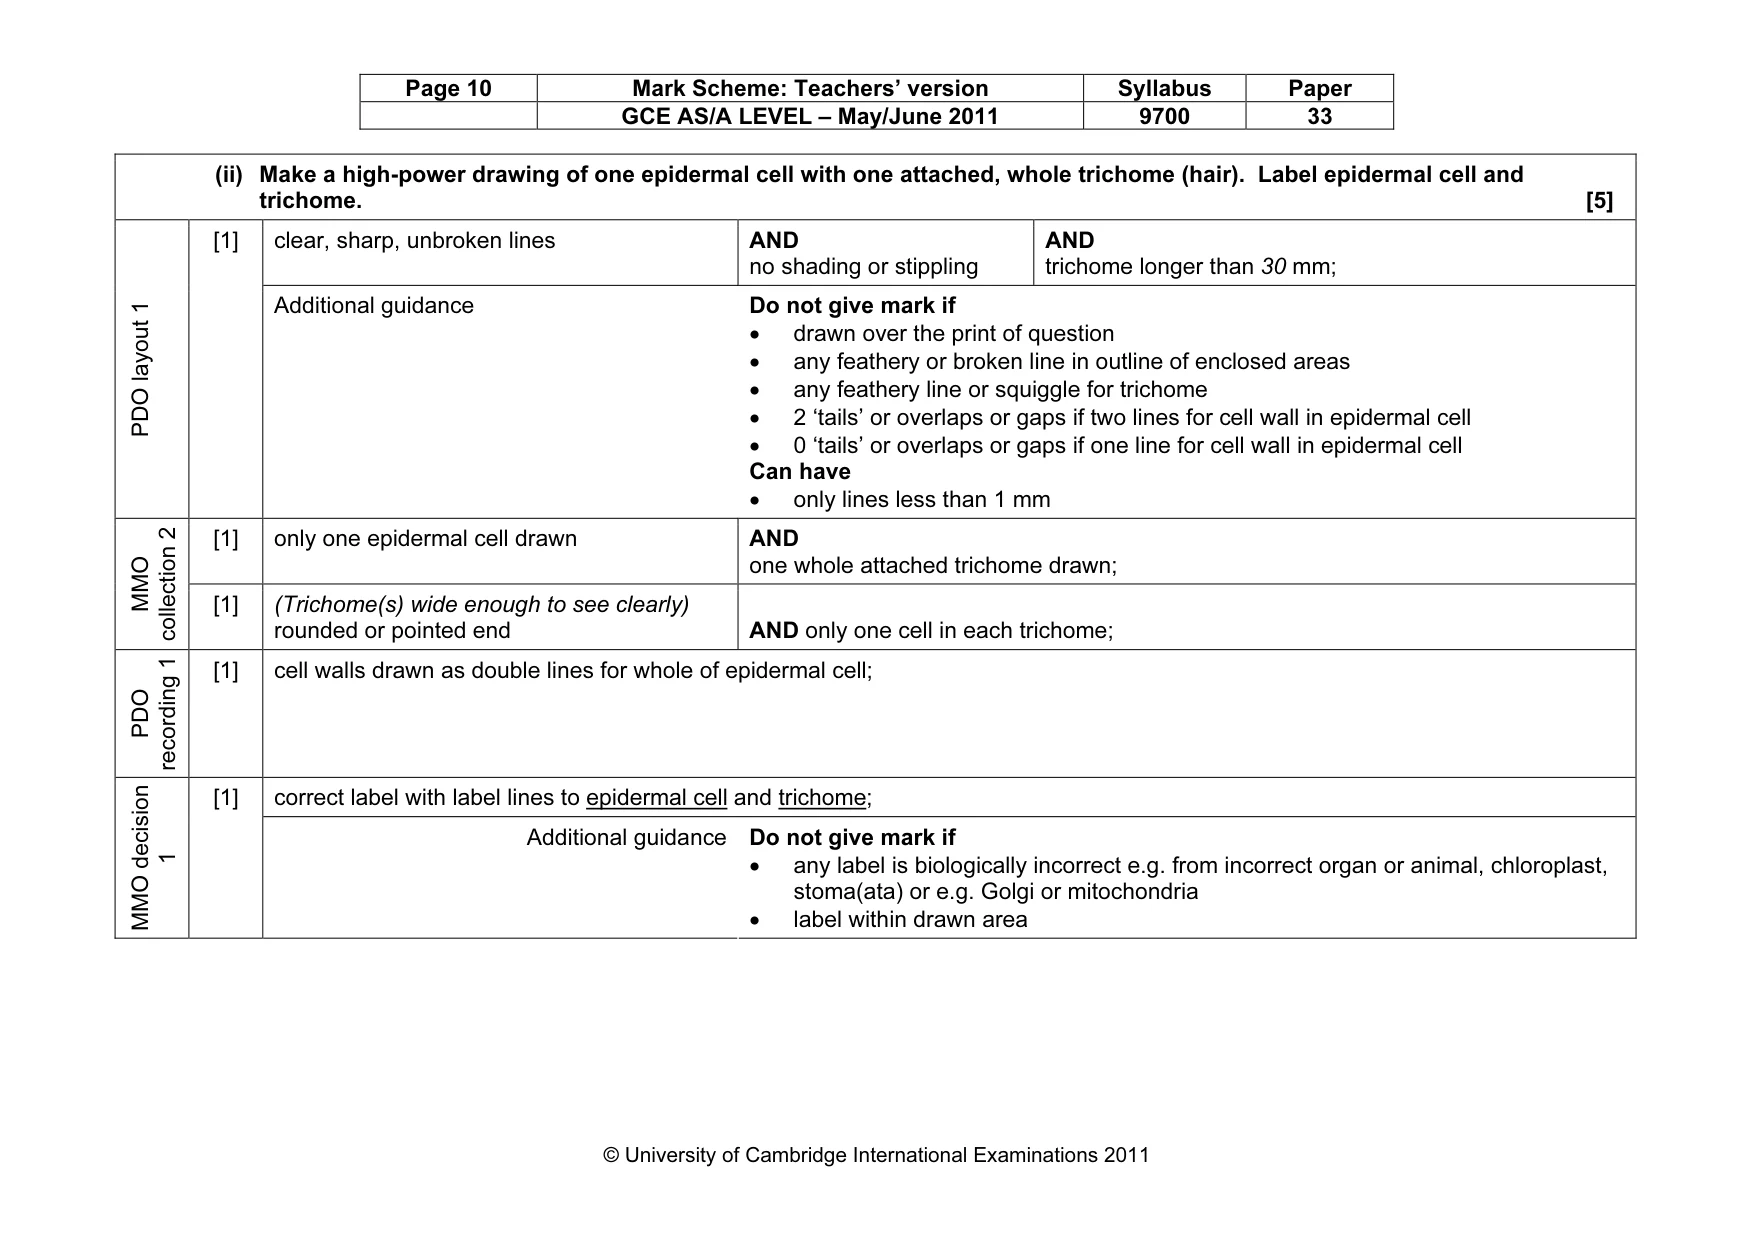
Page 10 Mark Scheme: Teachers’ version Syllabus Paper GCE AS/A LEVEL – May/June 2011 9700 33 © University of Cambridge International Examinations 2011 (ii) Make a high-power drawing of one epidermal cell with one attached, whole trichome (hair). Label epidermal cell and trichome. [5] clear, sharp, unbroken lines AND no shading or stippling AND trichome longer than 30 mm; PDO layout 1 [1] Additional guidance Do not give mark if • drawn over the print of question • any feathery or broken line in outline of enclosed areas • any feathery line or squiggle for trichome • 2 ‘tails’ or overlaps or gaps if two lines for cell wall in epidermal cell • 0 ‘tails’ or overlaps or gaps if one line for cell wall in epidermal cell Can have • only lines less than 1 mm [1] only one epidermal cell drawn AND one whole attached trichome drawn; MMO collection 2 [1] (Trichome(s) wide enough to see clearly) rounded or pointed end AND only one cell in each trichome; PDO recording 1 [1] cell walls drawn as double lines for whole of epidermal cell; correct label with label lines to epidermal cell and trichome; MMO decision 1 [1] Additional guidance Do not give mark if • any label is biologically incorrect e.g. from incorrect organ or animal, chloroplast, stoma(ata) or e.g. Golgi or mitochondria • label within drawn area
Mark scheme, page 11
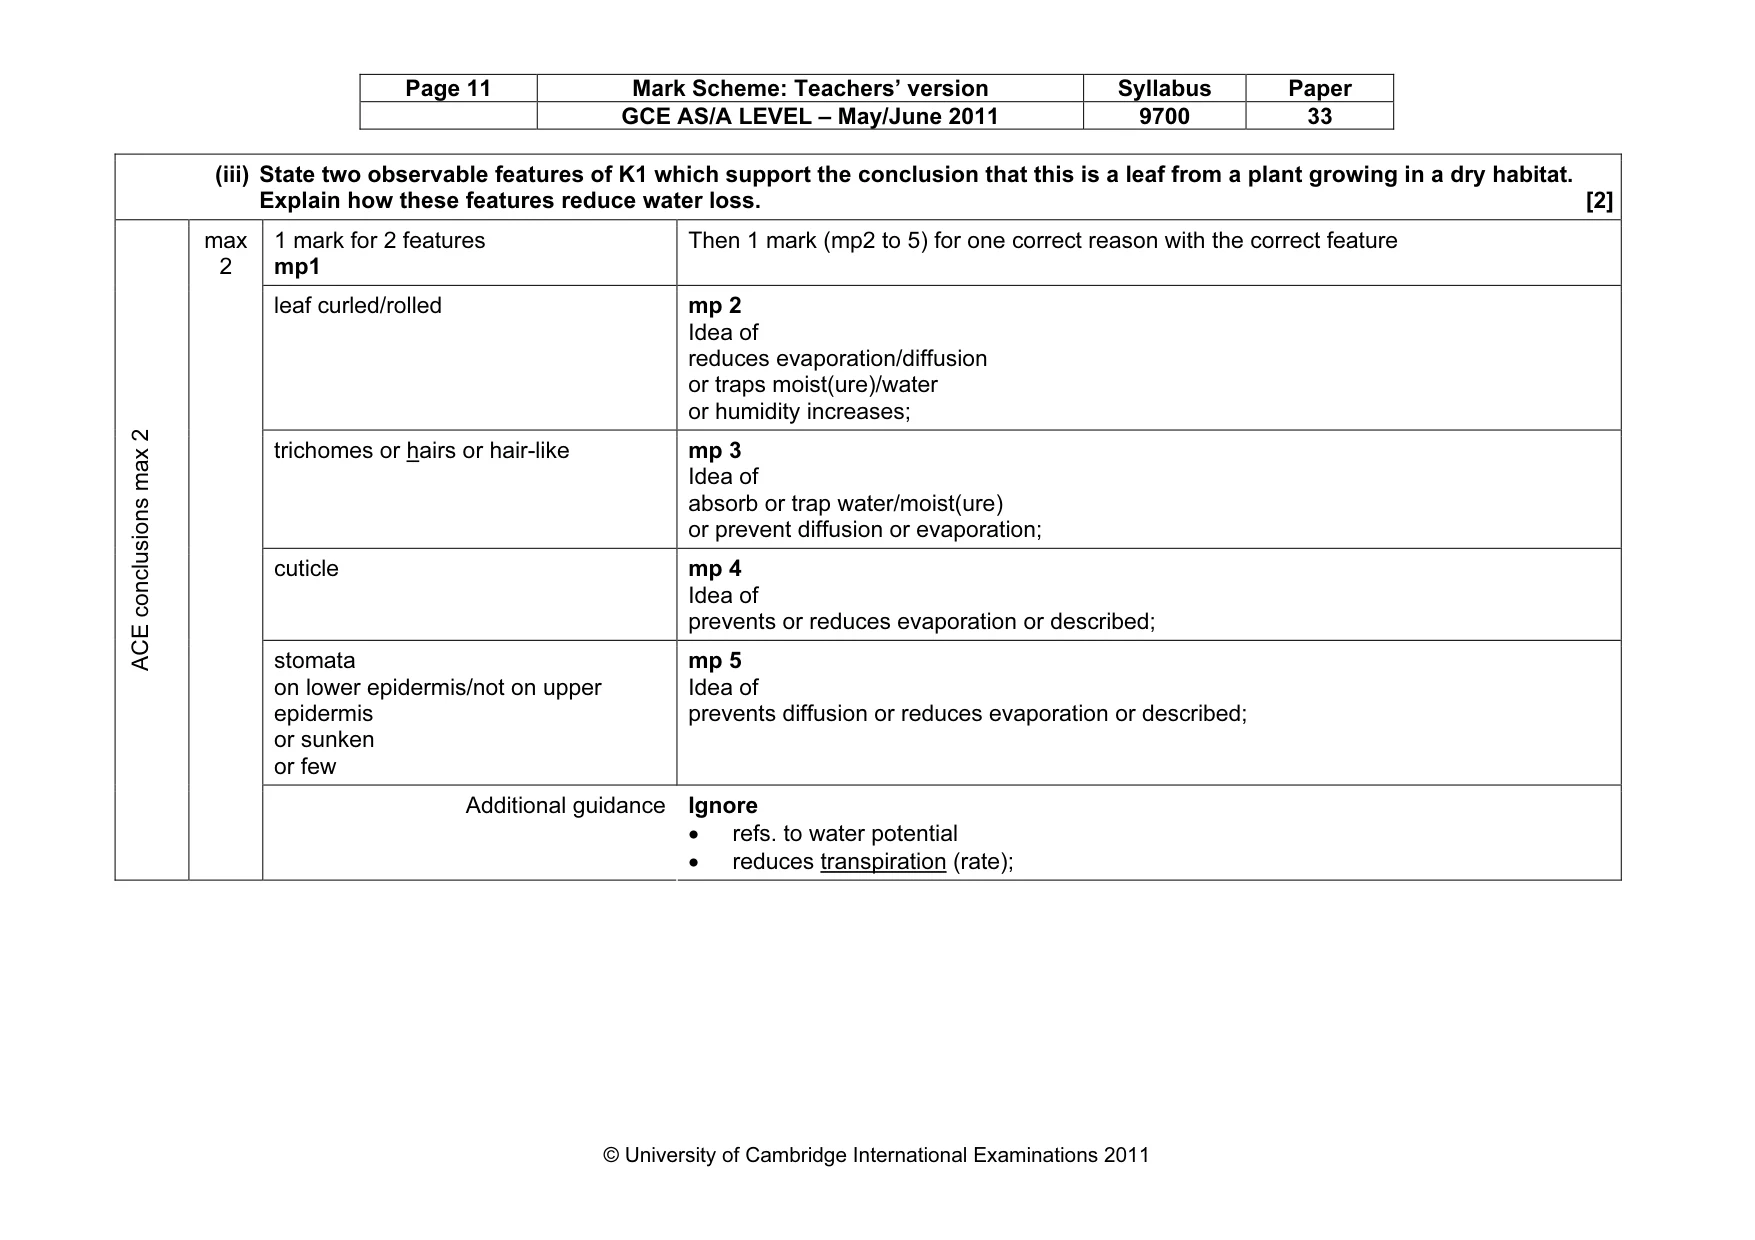
Page 11 Mark Scheme: Teachers’ version Syllabus Paper GCE AS/A LEVEL – May/June 2011 9700 33 © University of Cambridge International Examinations 2011 (iii) State two observable features of K1 which support the conclusion that this is a leaf from a plant growing in a dry habitat. Explain how these features reduce water loss. [2] 1 mark for 2 features mp1 Then 1 mark (mp2 to 5) for one correct reason with the correct feature leaf curled/rolled mp 2 Idea of reduces evaporation/diffusion or traps moist(ure)/water or humidity increases; trichomes or hairs or hair-like mp 3 Idea of absorb or trap water/moist(ure) or prevent diffusion or evaporation; cuticle mp 4 Idea of prevents or reduces evaporation or described; stomata on lower epidermis/not on upper epidermis or sunken or few mp 5 Idea of prevents diffusion or reduces evaporation or described; ACE conclusions max 2 max 2 Additional guidance Ignore • refs. to water potential • reduces transpiration (rate);
Mark scheme, page 12
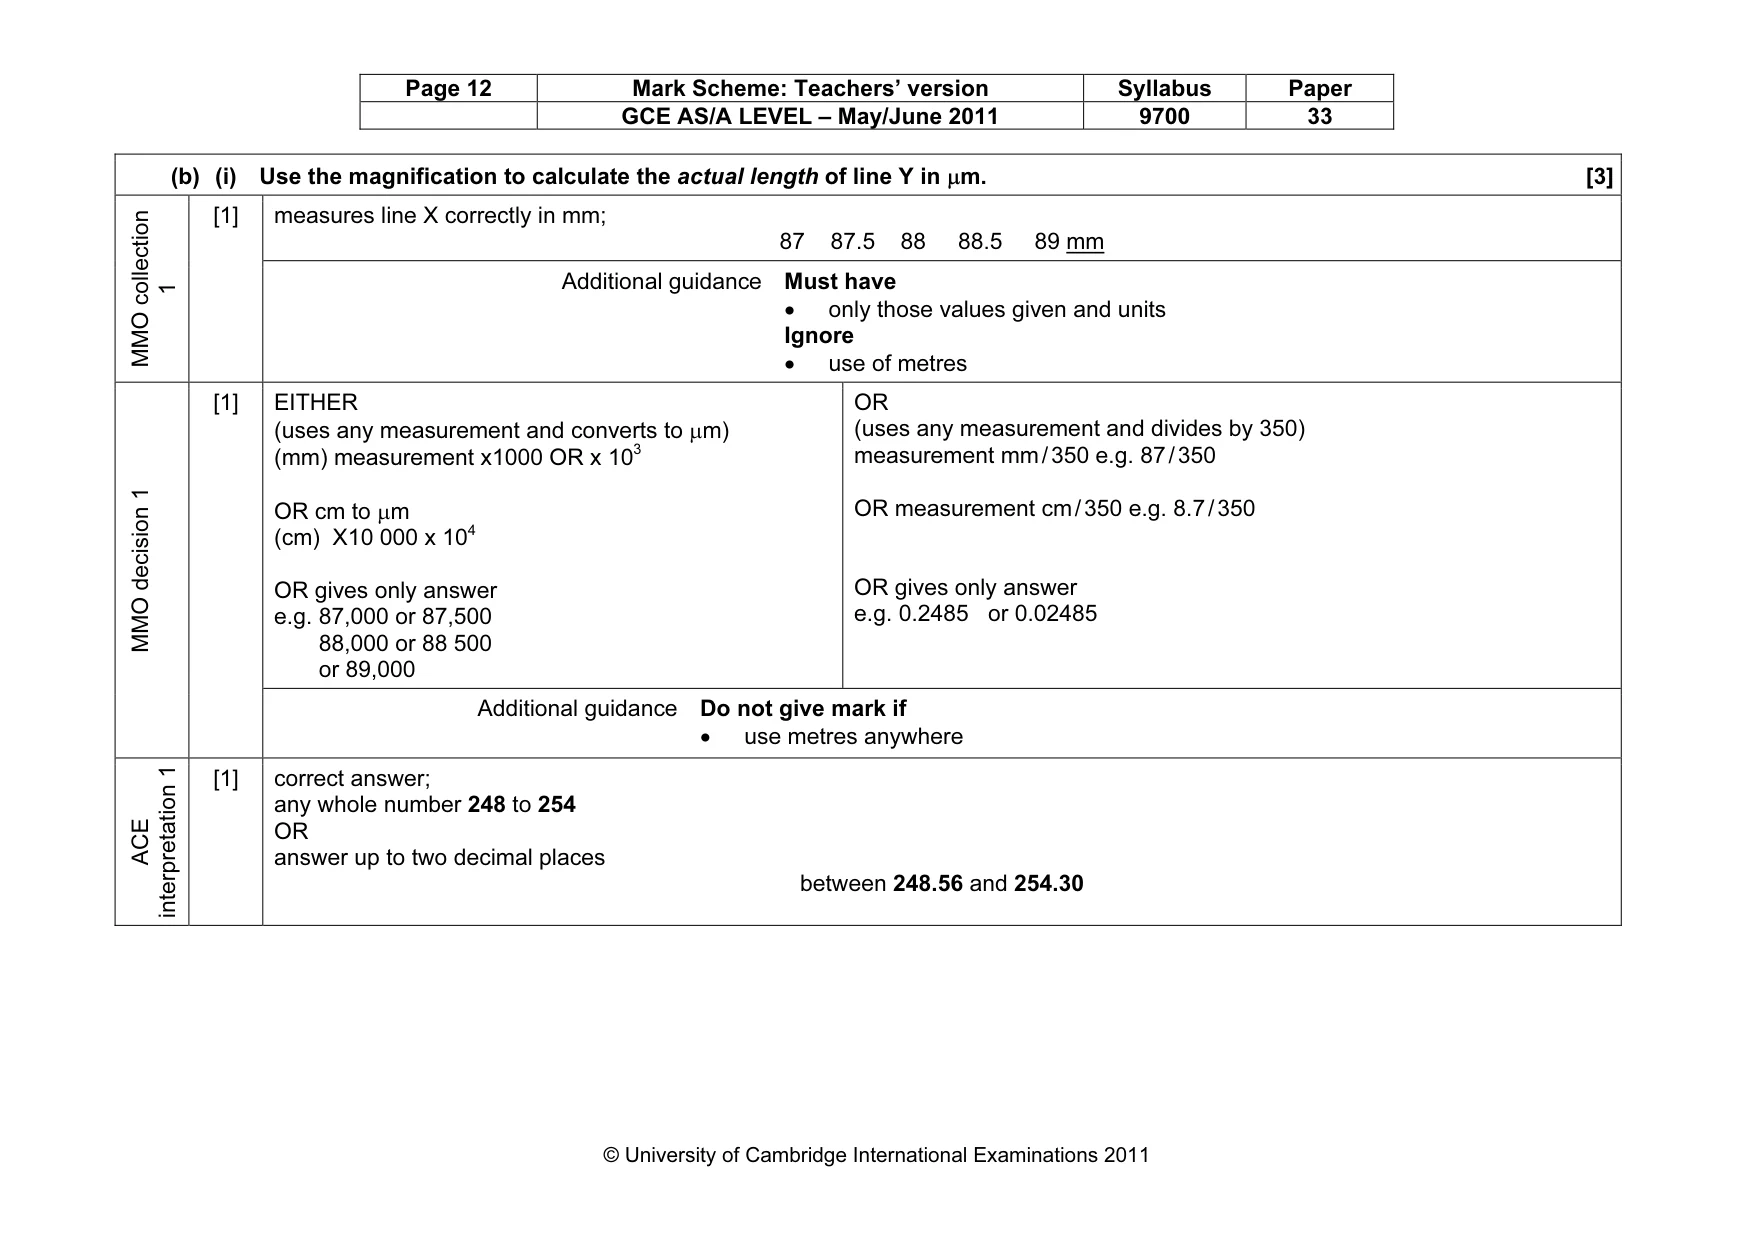
Page 12 Mark Scheme: Teachers’ version Syllabus Paper GCE AS/A LEVEL – May/June 2011 9700 33 © University of Cambridge International Examinations 2011 (b) (i) Use the magnification to calculate the actual length of line Y in µm. [3] measures line X correctly in mm; 87 87.5 88 88.5 89 mm MMO collection 1 [1] Additional guidance Must have • only those values given and units Ignore • use of metres EITHER (uses any measurement and converts to µm) (mm) measurement x1000 OR x 103 OR cm to µm (cm) X10 000 x 104 OR gives only answer e.g. 87,000 or 87,500 88,000 or 88 500 or 89,000 OR (uses any measurement and divides by 350) measurement mm / 350 e.g. 87 / 350 OR measurement cm / 350 e.g. 8.7 / 350 OR gives only answer e.g. 0.2485 or 0.02485 MMO decision 1 [1] Additional guidance Do not give mark if • use metres anywhere ACE interpretation 1 [1] correct answer; any whole number 248 to 254 OR answer up to two decimal places between 248.56 and 254.30
Mark scheme, page 13
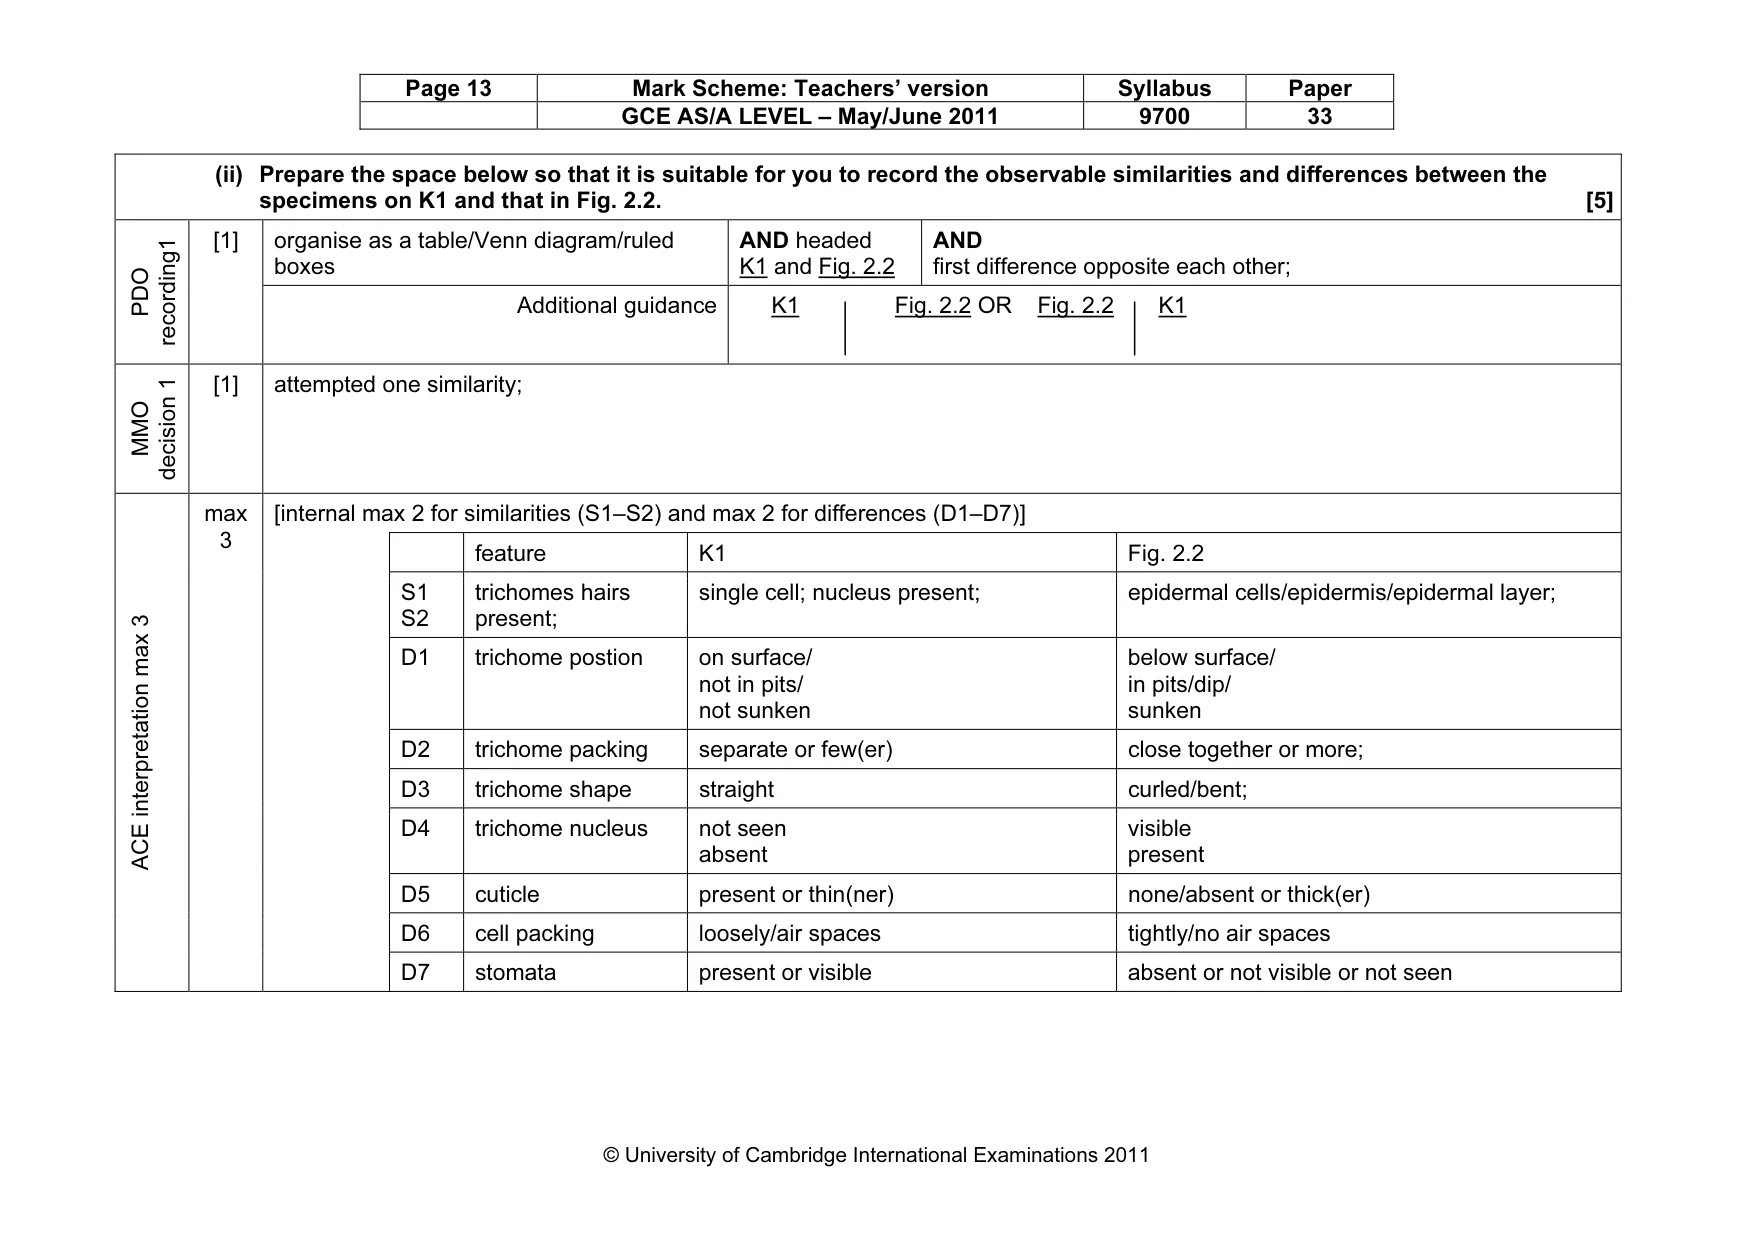
Page 13 Mark Scheme: Teachers’ version Syllabus Paper GCE AS/A LEVEL – May/June 2011 9700 33 © University of Cambridge International Examinations 2011 (ii) Prepare the space below so that it is suitable for you to record the observable similarities and differences between the specimens on K1 and that in Fig. 2.2. [5] organise as a table/Venn diagram/ruled boxes AND headed K1 and Fig. 2.2 AND first difference opposite each other; PDO recording1 [1] Additional guidance K1 Fig. 2.2 OR Fig. 2.2 K1 MMO decision 1 [1] attempted one similarity; [internal max 2 for similarities (S1–S2) and max 2 for differences (D1–D7)] feature K1 Fig. 2.2 max 3 S1 S2 trichomes hairs present; single cell; nucleus present; epidermal cells/epidermis/epidermal layer; D1 trichome postion on surface/ not in pits/ not sunken below surface/ in pits/dip/ sunken D2 trichome packing separate or few(er) close together or more; D3 trichome shape straight curled/bent; D4 trichome nucleus not seen absent visible present D5 cuticle present or thin(ner) none/absent or thick(er) D6 cell packing loosely/air spaces tightly/no air spaces ACE interpretation max 3 D7 stomata present or visible absent or not visible or not seen
Mark scheme, page 14
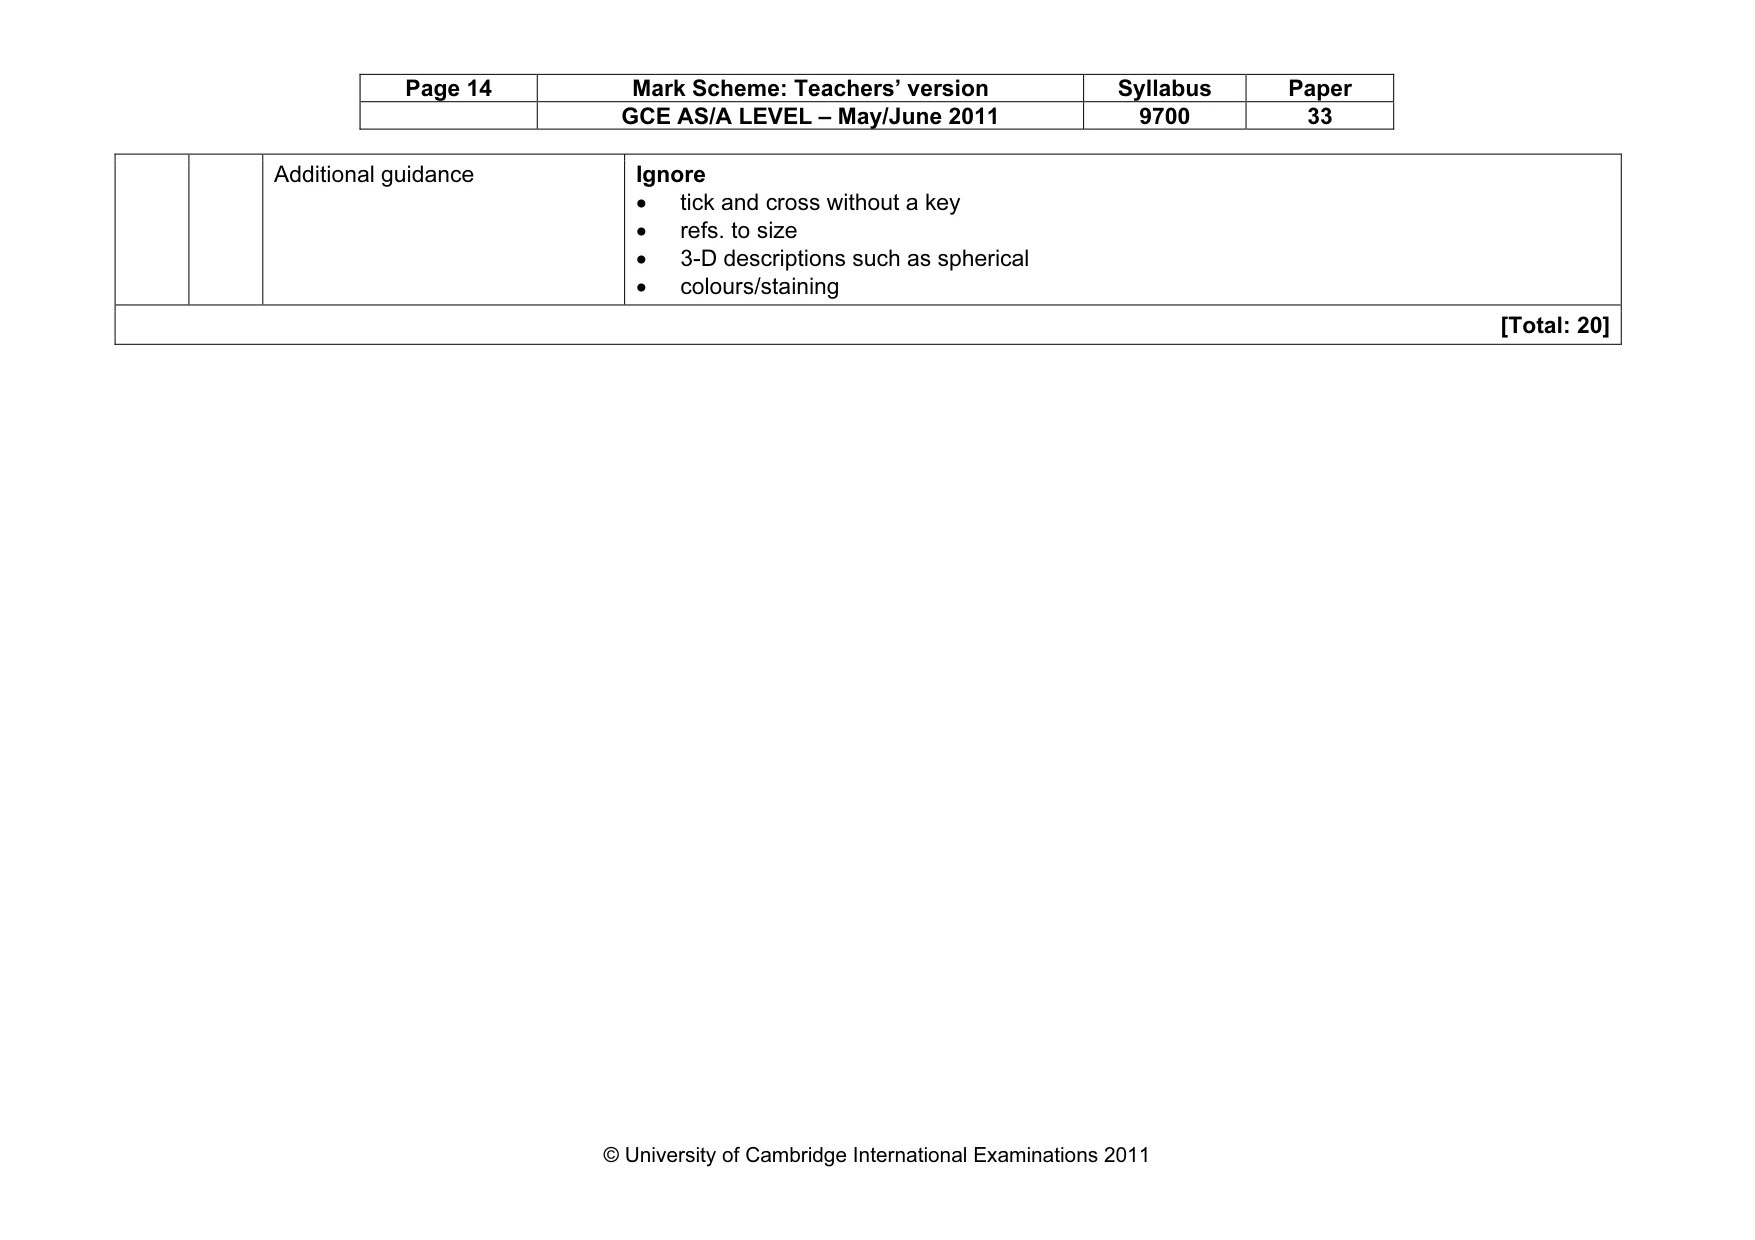
Page 14 Mark Scheme: Teachers’ version Syllabus Paper GCE AS/A LEVEL – May/June 2011 9700 33 © University of Cambridge International Examinations 2011 Additional guidance Ignore • tick and cross without a key • refs. to size • 3-D descriptions such as spherical • colours/staining [Total: 20]
What you needed in this session
Cambridge’s own grade thresholds for 2011 May/June, Paper 3 · Variant 3. A higher threshold means an easier paper — the bar moves with how the cohort did.