Cambridge A Level Biology 9700 — 2009 Oct/Nov Paper 3 · Variant 1
9700/31/O/N/09
The question paper and its mark scheme, free to read here and free to download. This is Cambridge’s own paper, exactly as it was sat.
Question paper12 pages


Mark scheme10 pages
Answers below. Sit the paper first if you are practising.
Paper as text
Question paper, page 1
This document consists of 9 printed pages and 3 blank pages. DC (SHW 00338 7/08) 16159/4 © UCLES 2009 [Turn over UNIVERSITY OF CAMBRIDGE INTERNATIONAL EXAMINATIONS General Certificate of Education Advanced Subsidiary Level and Advanced Level READ THESE INSTRUCTIONS FIRST Write your Centre number, candidate number and name on all the work you hand in. Write in dark blue or black pen. You may use a pencil for any diagrams, graphs or rough working. Do not use staples, paper clips, highlighters, glue or correction fluid. DO NOT WRITE IN ANY BARCODES. Answer all questions. At the end of the examination, fasten all your work securely together. The number of marks is given in brackets [ ] at the end of each question or part question. * 4 5 4 6 7 5 3 8 6 7 * BIOLOGY 9700/31 Paper 3 Advanced Practical Skills October/November 2009 2 hours Candidates answer on the Question Paper. Additional Materials: As listed in the Confidential Instructions For Examiner’s Use 1 2 3 Total
Question paper, page 2
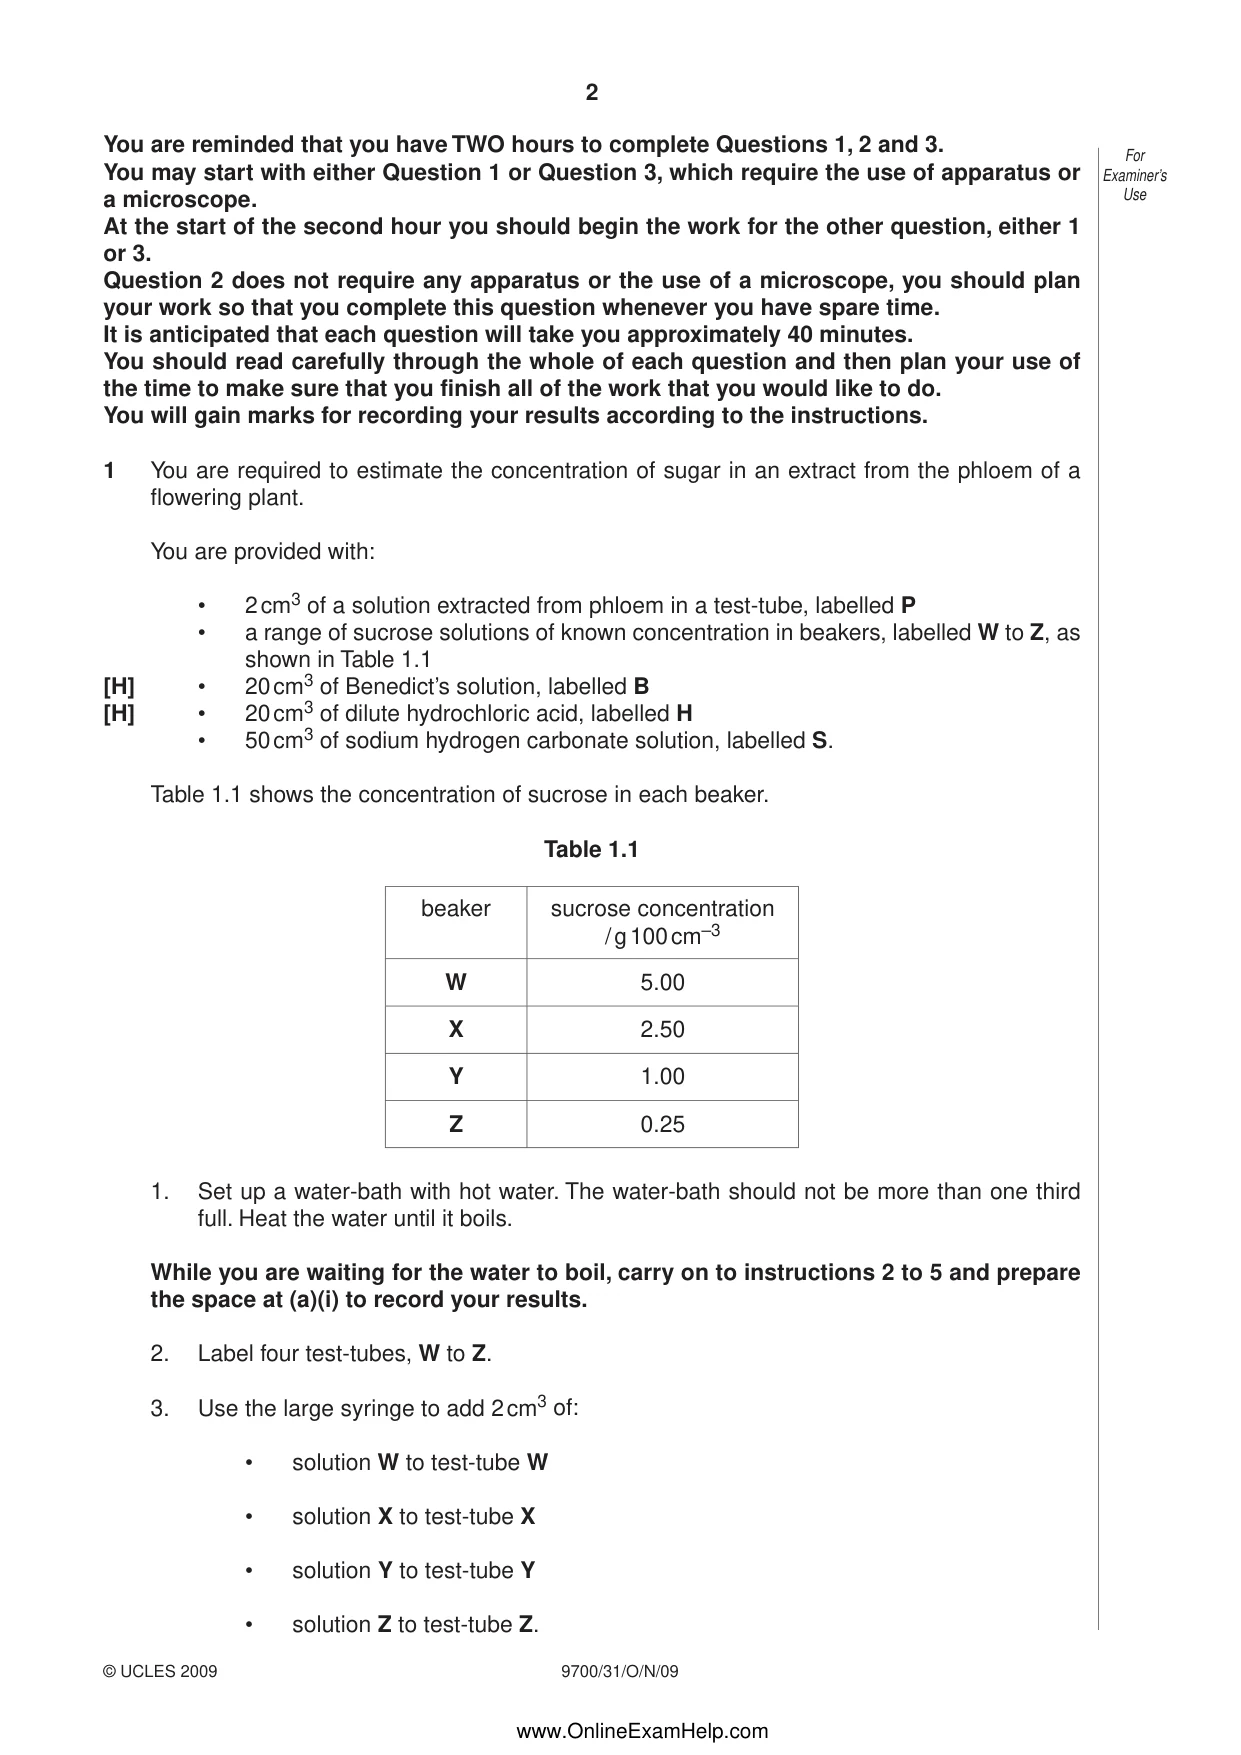
9700/31/O/N/09 © UCLES 2009 For Examiner’s Use You are reminded that you have TWO hours to complete Questions 1, 2 and 3. You may start with either Question 1 or Question 3, which require the use of apparatus or a microscope. At the start of the second hour you should begin the work for the other question, either 1 or 3. Question 2 does not require any apparatus or the use of a microscope, you should plan your work so that you complete this question whenever you have spare time. It is anticipated that each question will take you approximately 40 minutes. You should read carefully through the whole of each question and then plan your use of the time to make sure that you finish all of the work that you would like to do. You will gain marks for recording your results according to the instructions. 1 You are required to estimate the concentration of sugar in an extract from the phloem of a flowering plant. You are provided with: • 2 cm3 of a solution extracted from phloem in a test-tube, labelled P • a range of sucrose solutions of known concentration in beakers, labelled W to Z, as shown in Table 1.1 [H] • 20 cm3 of Benedict’s solution, labelled B [H] • 20 cm3 of dilute hydrochloric acid, labelled H • 50 cm3 of sodium hydrogen carbonate solution, labelled S. Table 1.1 shows the concentration of sucrose in each beaker. Table 1.1 beaker sucrose concentration / g 100 cm–3 W 5.00 X 2.50 Y 1.00 Z 0.25 1. Set up a water-bath with hot water. The water-bath should not be more than one third full. Heat the water until it boils. While you are waiting for the water to boil, carry on to instructions 2 to 5 and prepare the space at (a)(i) to record your results. 2. Label four test-tubes, W to Z. 3. Use the large syringe to add 2 cm3 of: • solution W to test-tube W • solution X to test-tube X • solution Y to test-tube Y • solution Z to test-tube Z. 2 www.OnlineExamHelp.com
Question paper, page 3
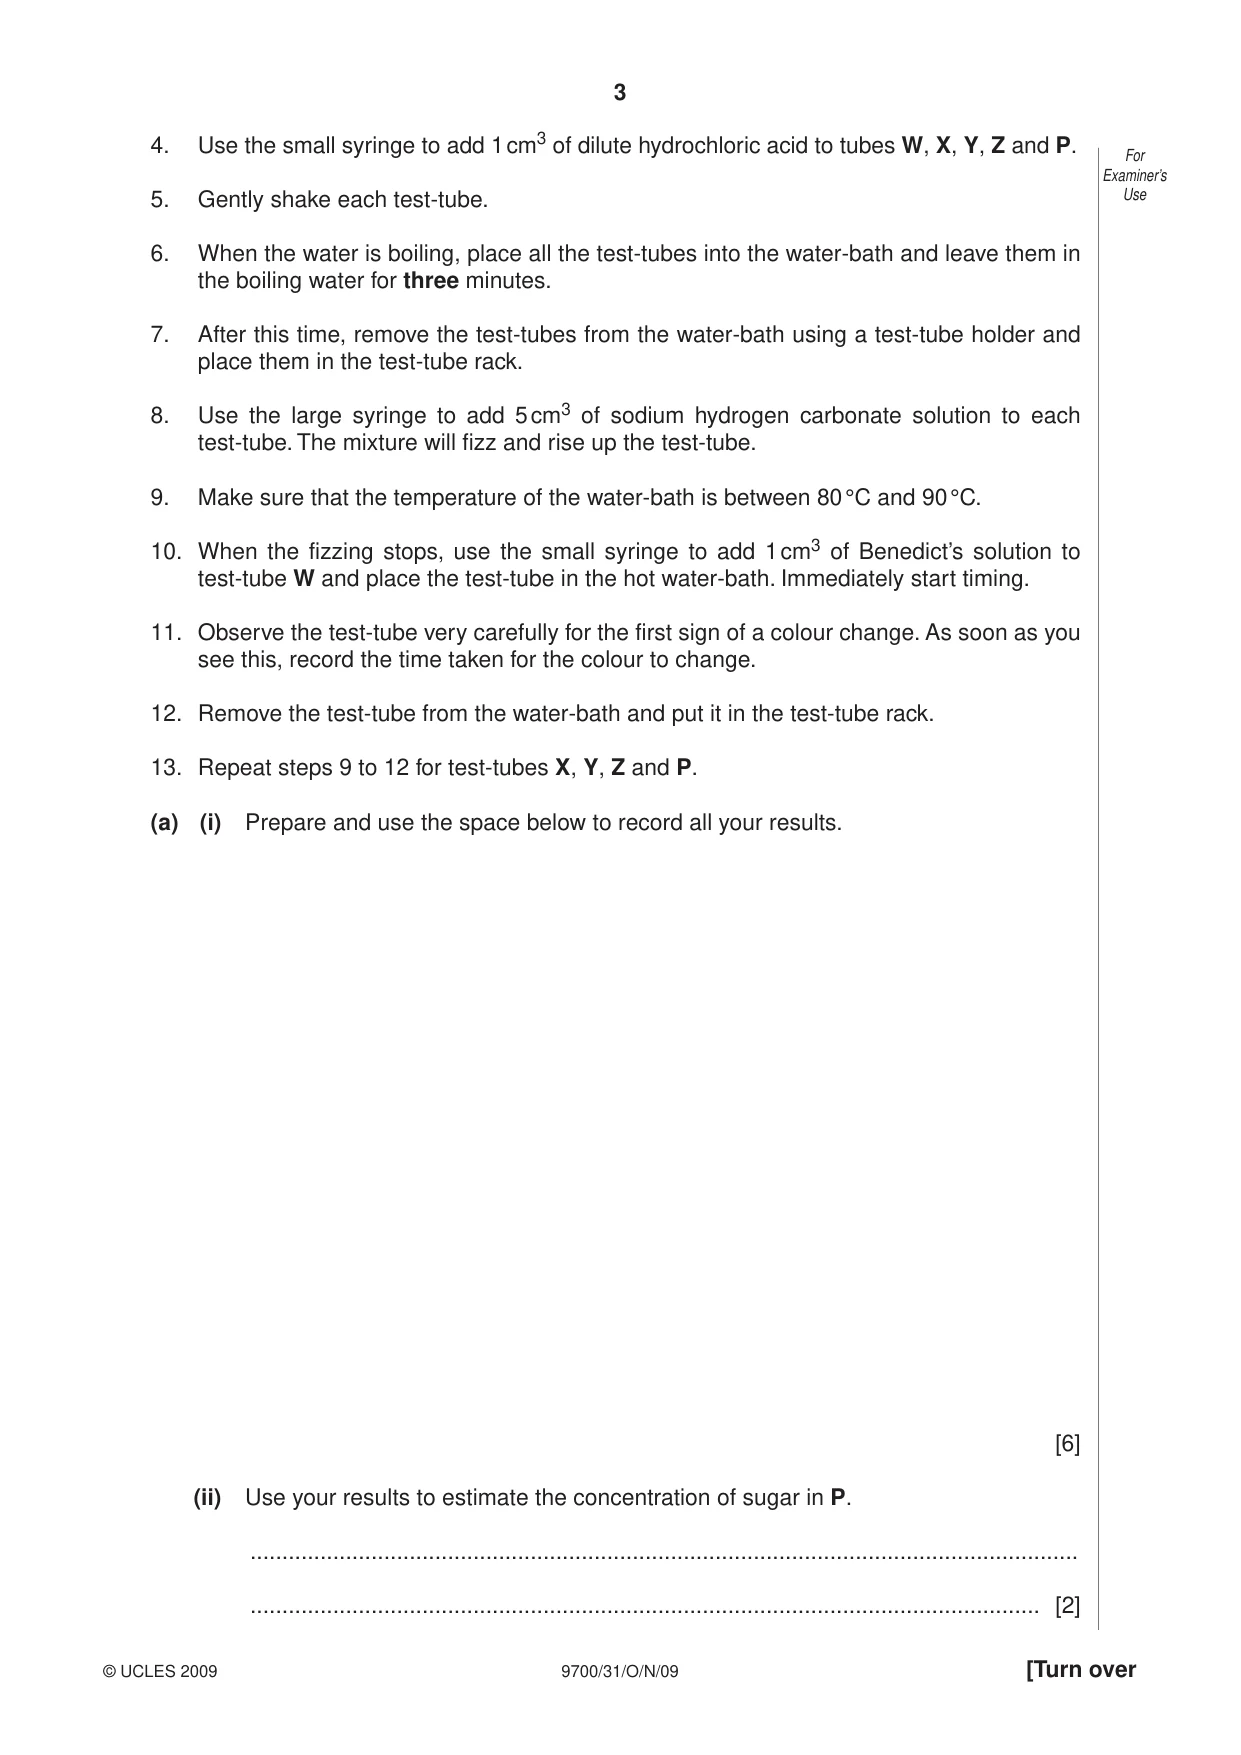
3 9700/31/O/N/09 © UCLES 2009 [Turn over For Examiner’s Use 4. Use the small syringe to add 1 cm3 of dilute hydrochloric acid to tubes W, X, Y, Z and P. 5. Gently shake each test-tube. 6. When the water is boiling, place all the test-tubes into the water-bath and leave them in the boiling water for three minutes. 7. After this time, remove the test-tubes from the water-bath using a test-tube holder and place them in the test-tube rack. 8. Use the large syringe to add 5 cm3 of sodium hydrogen carbonate solution to each test-tube. The mixture will fizz and rise up the test-tube. 9. Make sure that the temperature of the water-bath is between 80 °C and 90 °C. 10. When the fizzing stops, use the small syringe to add 1 cm3 of Benedict’s solution to test-tube W and place the test-tube in the hot water-bath. Immediately start timing. 11. Observe the test-tube very carefully for the first sign of a colour change. As soon as you see this, record the time taken for the colour to change. 12. Remove the test-tube from the water-bath and put it in the test-tube rack. 13. Repeat steps 9 to 12 for test-tubes X, Y, Z and P. (a) (i) Prepare and use the space below to record all your results. [6] (ii) Use your results to estimate the concentration of sugar in P. … … [2]
Question paper, page 4
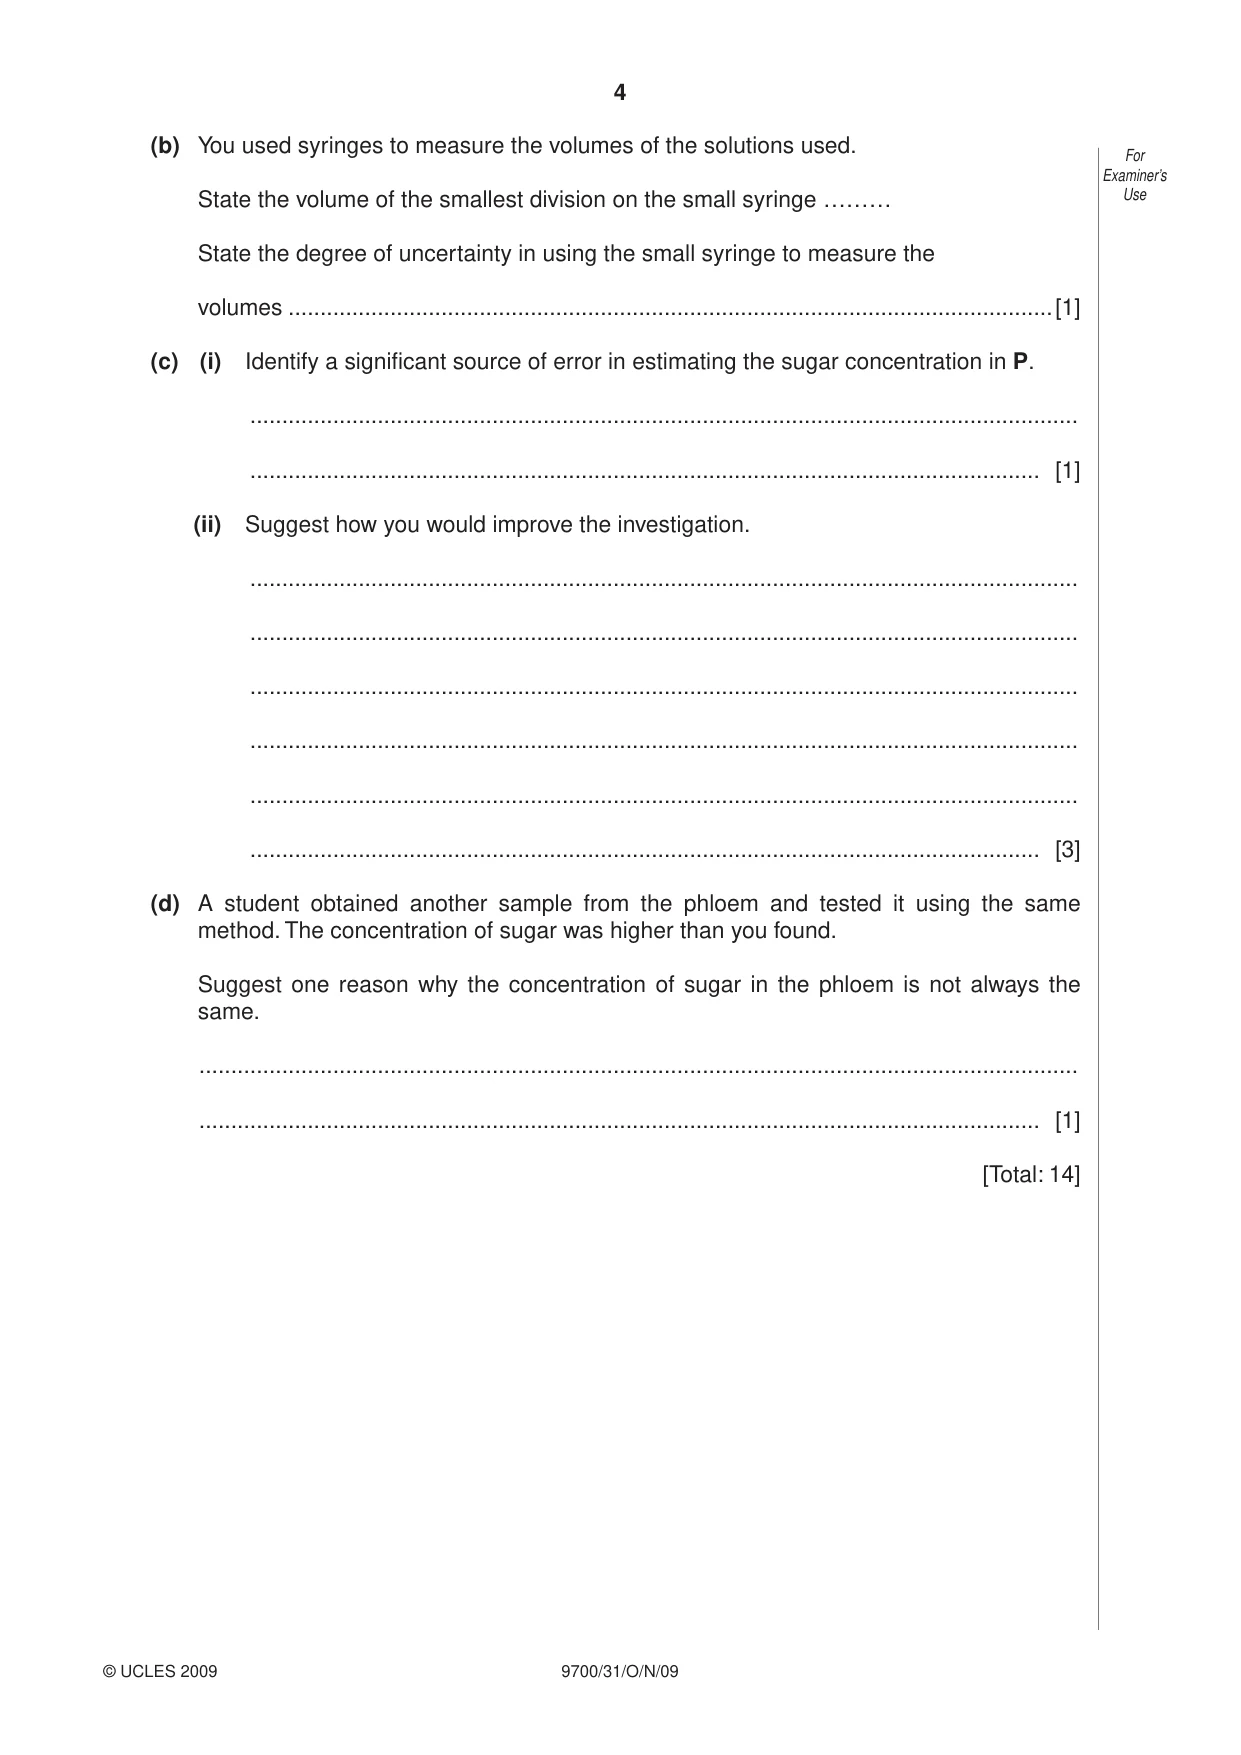
4 9700/31/O/N/09 © UCLES 2009 For Examiner’s Use (b) You used syringes to measure the volumes of the solutions used. State the volume of the smallest division on the small syringe ……… State the degree of uncertainty in using the small syringe to measure the volumes …[1] (c) (i) Identify a significant source of error in estimating the sugar concentration in P. … … [1] (ii) Suggest how you would improve the investigation. … … … … … … [3] (d) A student obtained another sample from the phloem and tested it using the same method. The concentration of sugar was higher than you found. Suggest one reason why the concentration of sugar in the phloem is not always the same. … … [1] [Total: 14]
Question paper, page 5
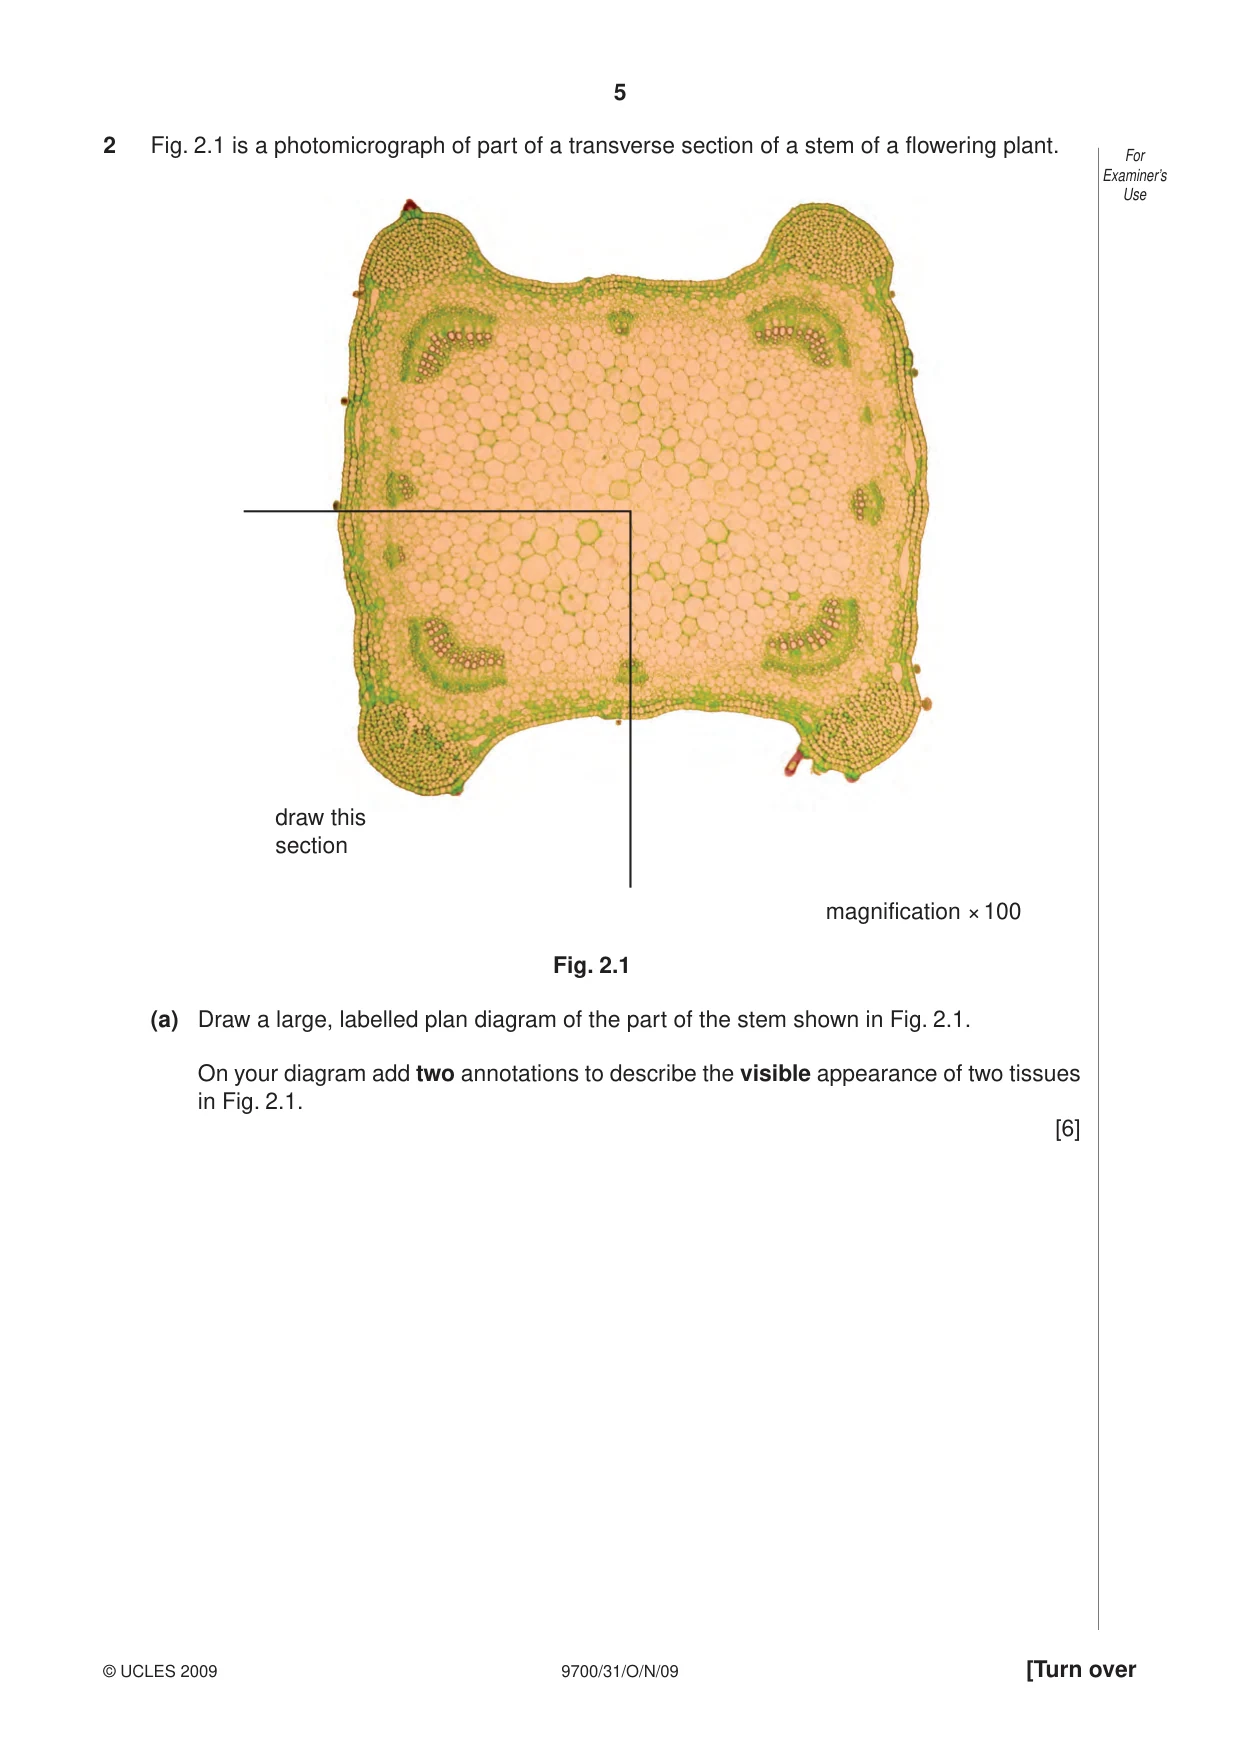
5 9700/31/O/N/09 © UCLES 2009 [Turn over For Examiner’s Use 2 Fig. 2.1 is a photomicrograph of part of a transverse section of a stem of a flowering plant. draw this section magnification × 100 Fig. 2.1 (a) Draw a large, labelled plan diagram of the part of the stem shown in Fig. 2.1. On your diagram add two annotations to describe the visible appearance of two tissues in Fig. 2.1. [6]
Question paper, page 6
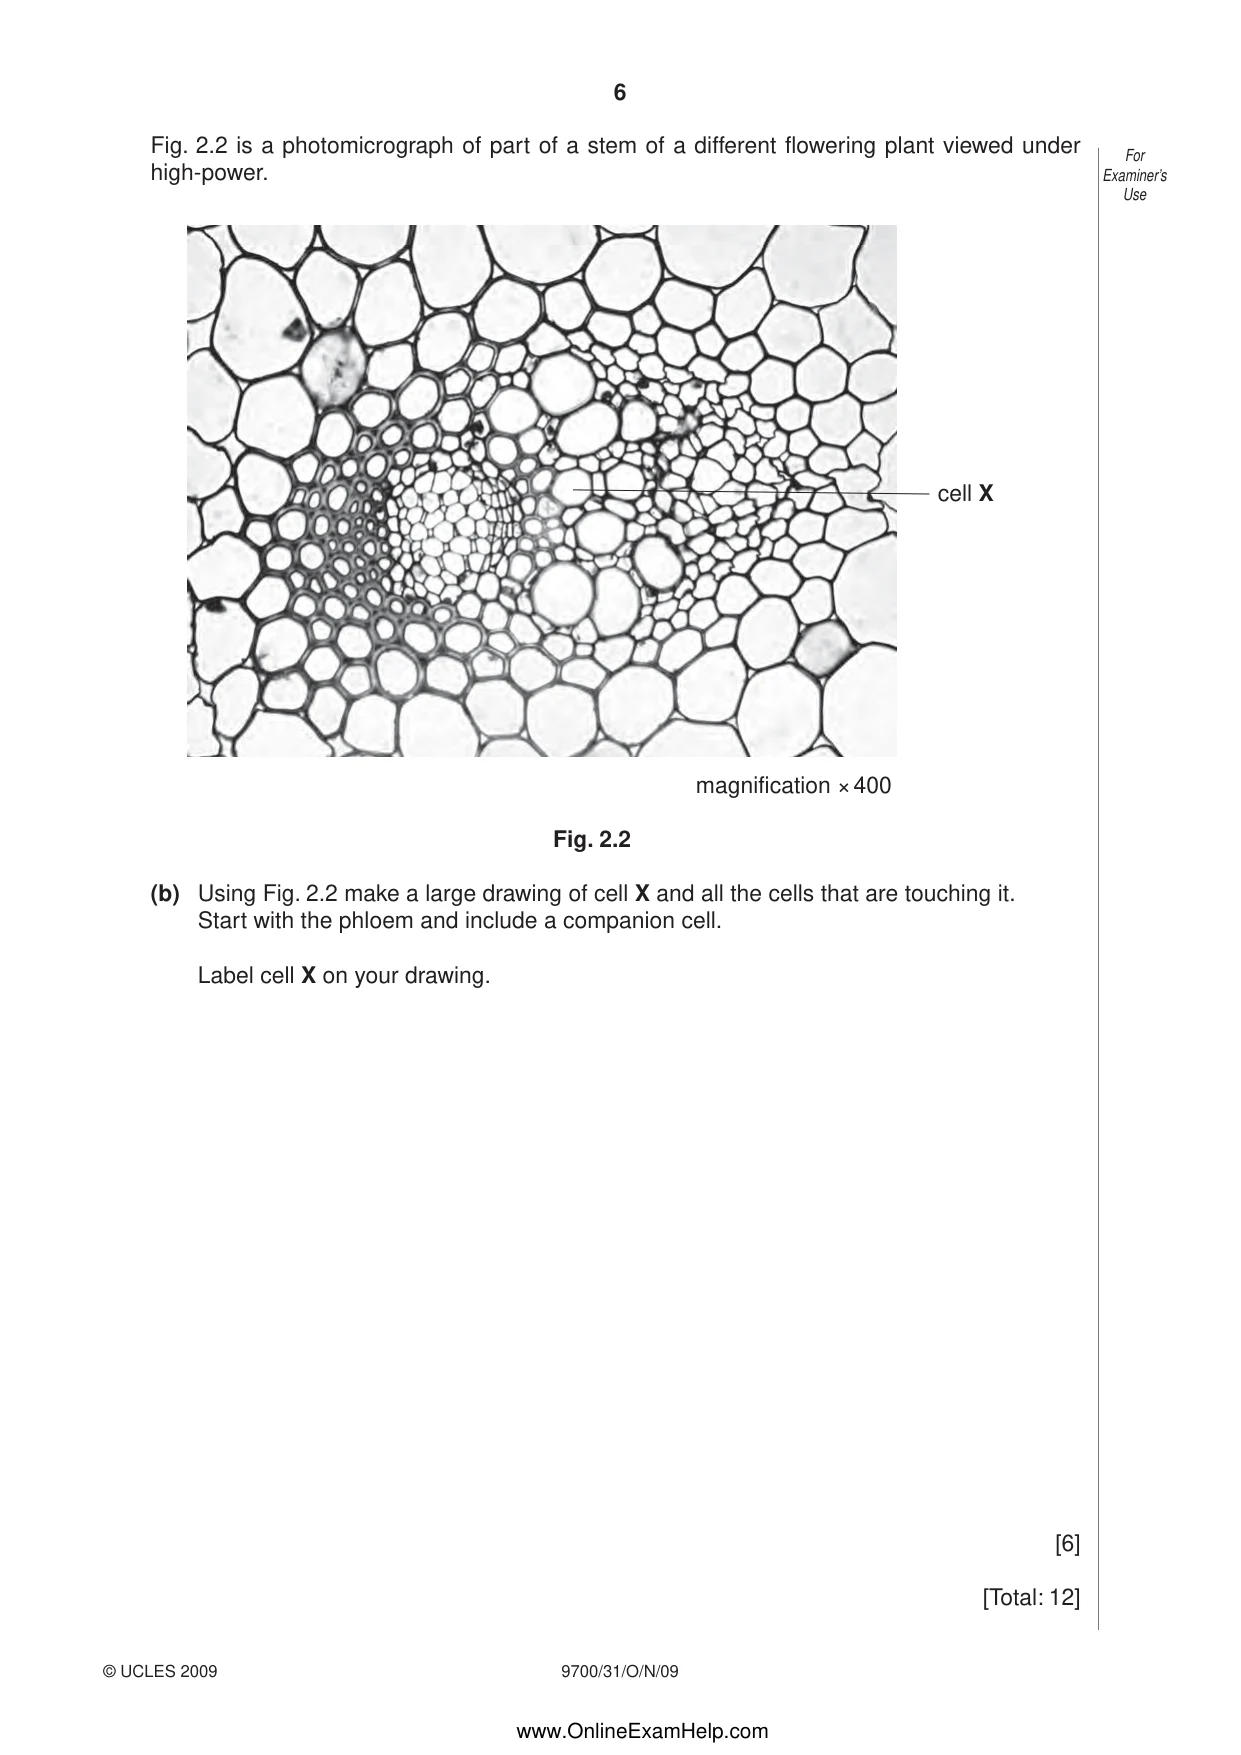
6 9700/31/O/N/09 © UCLES 2009 For Examiner’s Use Fig. 2.2 is a photomicrograph of part of a stem of a different flowering plant viewed under high-power. cell X magnification × 400 Fig. 2.2 (b) Using Fig. 2.2 make a large drawing of cell X and all the cells that are touching it. Start with the phloem and include a companion cell. Label cell X on your drawing. [6] [Total: 12] www.OnlineExamHelp.com
Question paper, page 7
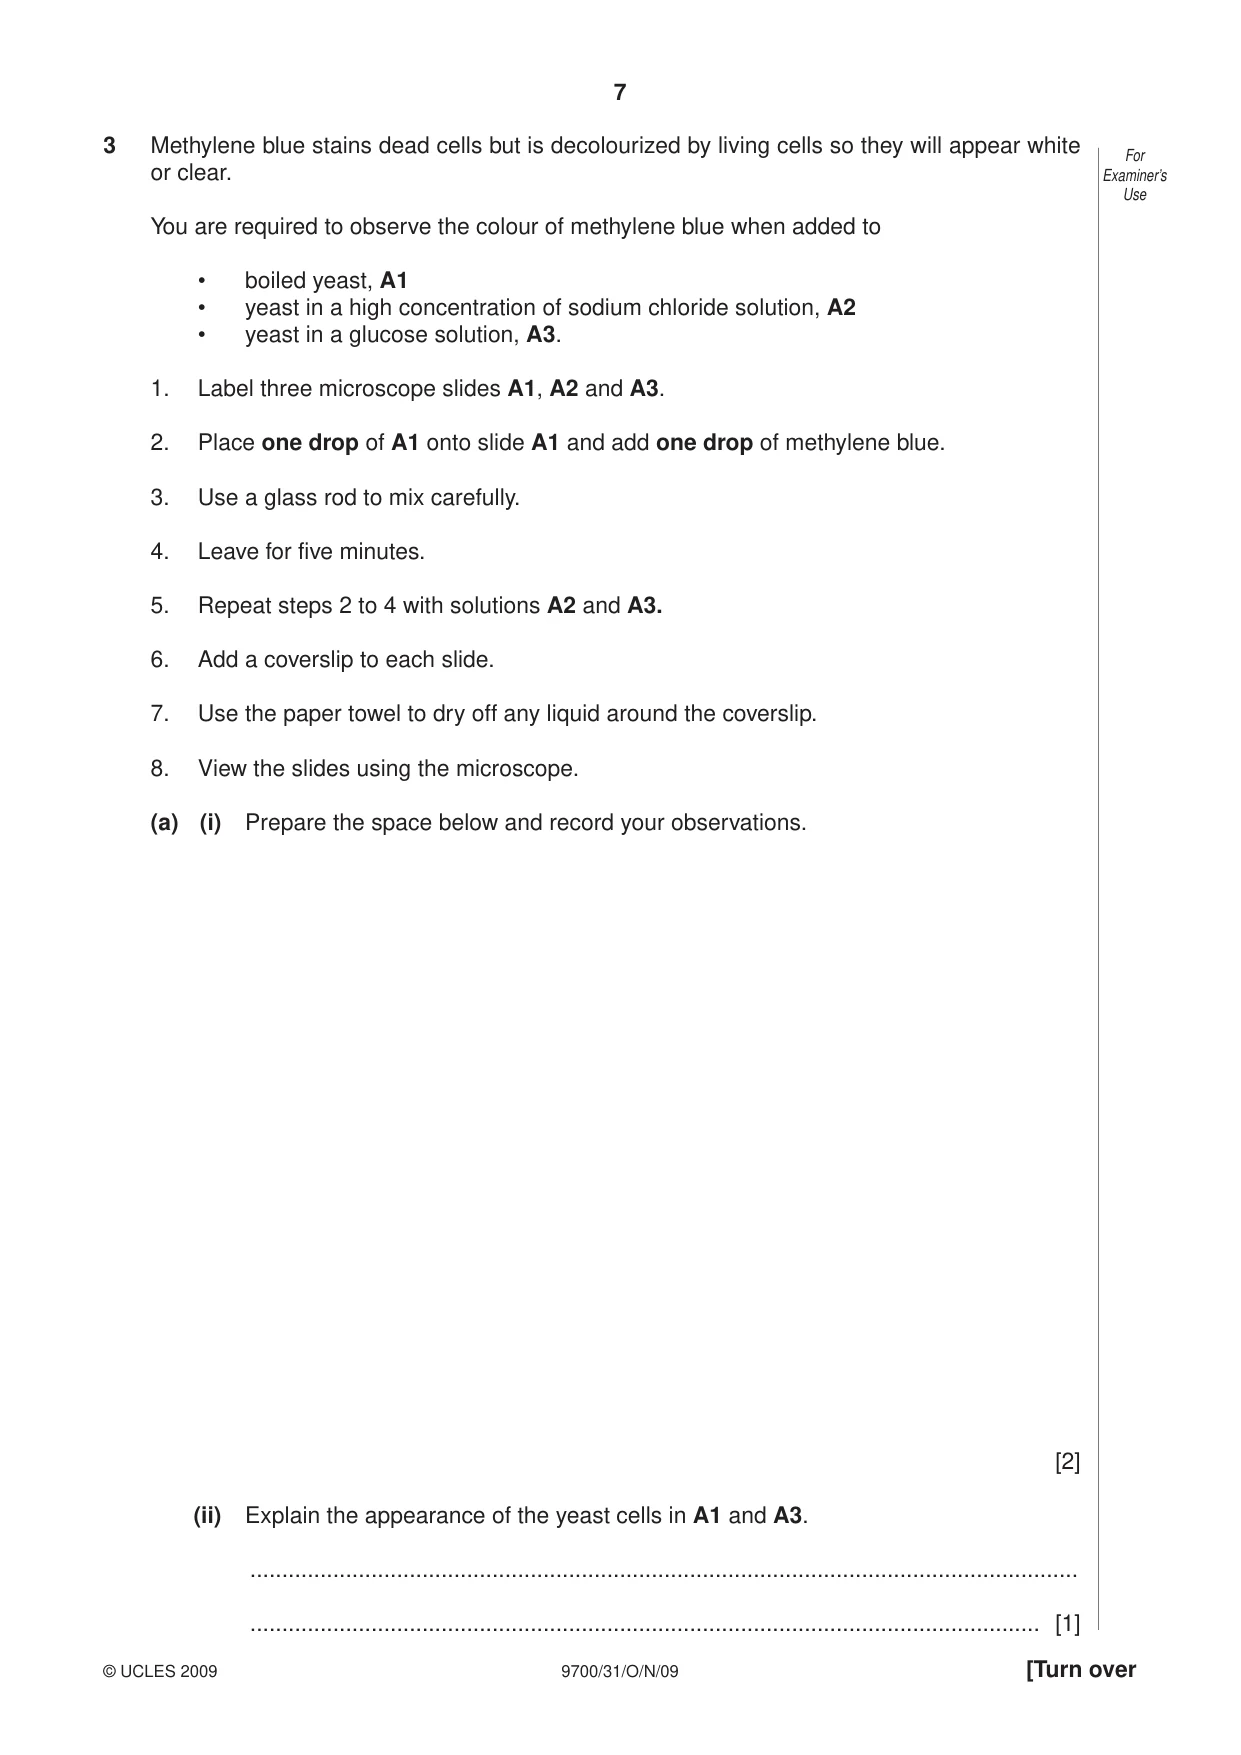
7 9700/31/O/N/09 © UCLES 2009 [Turn over For Examiner’s Use 3 Methylene blue stains dead cells but is decolourized by living cells so they will appear white or clear. You are required to observe the colour of methylene blue when added to • boiled yeast, A1 • yeast in a high concentration of sodium chloride solution, A2 • yeast in a glucose solution, A3. 1. Label three microscope slides A1, A2 and A3. 2. Place one drop of A1 onto slide A1 and add one drop of methylene blue. 3. Use a glass rod to mix carefully. 4. Leave for five minutes. 5. Repeat steps 2 to 4 with solutions A2 and A3. 6. Add a coverslip to each slide. 7. Use the paper towel to dry off any liquid around the coverslip. 8. View the slides using the microscope. (a) (i) Prepare the space below and record your observations. [2] (ii) Explain the appearance of the yeast cells in A1 and A3. … … [1]
Question paper, page 8
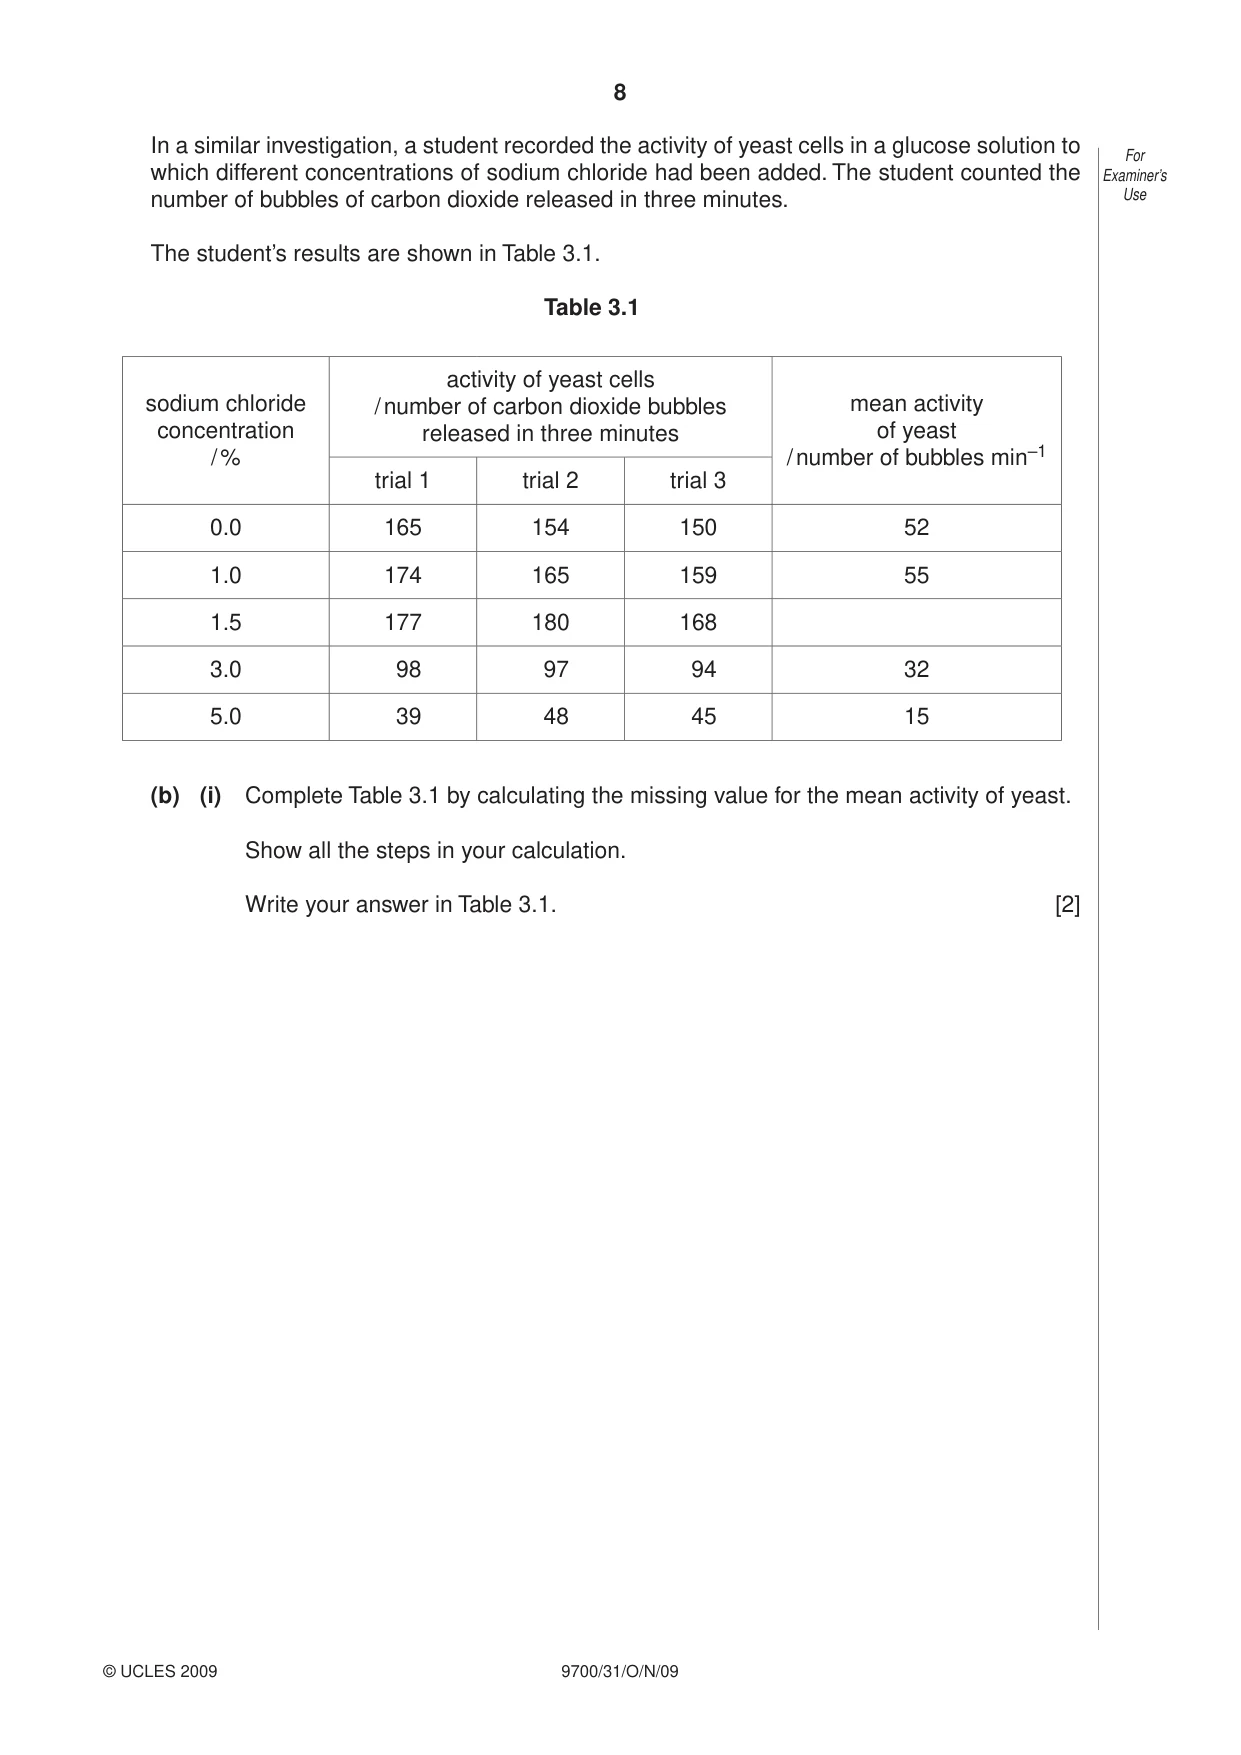
8 9700/31/O/N/09 © UCLES 2009 For Examiner’s Use In a similar investigation, a student recorded the activity of yeast cells in a glucose solution to which different concentrations of sodium chloride had been added. The student counted the number of bubbles of carbon dioxide released in three minutes. The student’s results are shown in Table 3.1. Table 3.1 sodium chloride concentration / % activity of yeast cells / number of carbon dioxide bubbles released in three minutes mean activity of yeast / number of bubbles min–1 trial 1 trial 2 trial 3 0.0 165 154 150 52 1.0 174 165 159 55 1.5 177 180 168 3.0 98 97 94 32 5.0 39 48 45 15 (b) (i) Complete Table 3.1 by calculating the missing value for the mean activity of yeast. Show all the steps in your calculation. Write your answer in Table 3.1. [2]
Question paper, page 9
9 9700/31/O/N/09 © UCLES 2009 For Examiner’s Use (ii) Plot a graph of these data shown in Table 3.1. [4] (iii) Describe the results shown in your graph. … … … … [2] (iv) From your graph estimate the mean activity of yeast in a 2.0 % sodium chloride solution. … [1] (v) Explain the difference in the activity between 0.0 % and 1.5 % sodium chloride solution … … 3.0 % and 5.0 % sodium chloride solution. … … [2] [Total: 14]
Question paper, page 11
11 9700/31/O/N/09 BLANK PAGE www.OnlineExamHelp.com
Question paper, page 12
12 9700/31/O/N/09 BLANK PAGE Permission to reproduce items where third-party owned material protected by copyright is included has been sought and cleared where possible. Every reasonable effort has been made by the publisher (UCLES) to trace copyright holders, but if any items requiring clearance have unwittingly been included, the publisher will be pleased to make amends at the earliest possible opportunity. University of Cambridge International Examinations is part of the Cambridge Assessment Group. Cambridge Assessment is the brand name of University of Cambridge Local Examinations Syndicate (UCLES), which is itself a department of the University of Cambridge. www.OnlineExamHelp.com
Mark scheme, page 1
UNIVERSITY OF CAMBRIDGE INTERNATIONAL EXAMINATIONS GCE Advanced Subsidiary Level and GCE Advanced Level MARK SCHEME for the October/November 2009 question paper for the guidance of teachers 9700 BIOLOGY 9700/31 Paper 31 (Advanced Practical 1), maximum raw mark 40 This mark scheme is published as an aid to teachers and candidates, to indicate the requirements of the examination. It shows the basis on which Examiners were instructed to award marks. It does not indicate the details of the discussions that took place at an Examiners’ meeting before marking began, which would have considered the acceptability of alternative answers. Mark schemes must be read in conjunction with the question papers and the report on the examination. • CIE will not enter into discussions or correspondence in connection with these mark schemes. CIE is publishing the mark schemes for the October/November 2009 question papers for most IGCSE, GCE Advanced Level and Advanced Subsidiary Level syllabuses and some Ordinary Level syllabuses.
Mark scheme, page 2
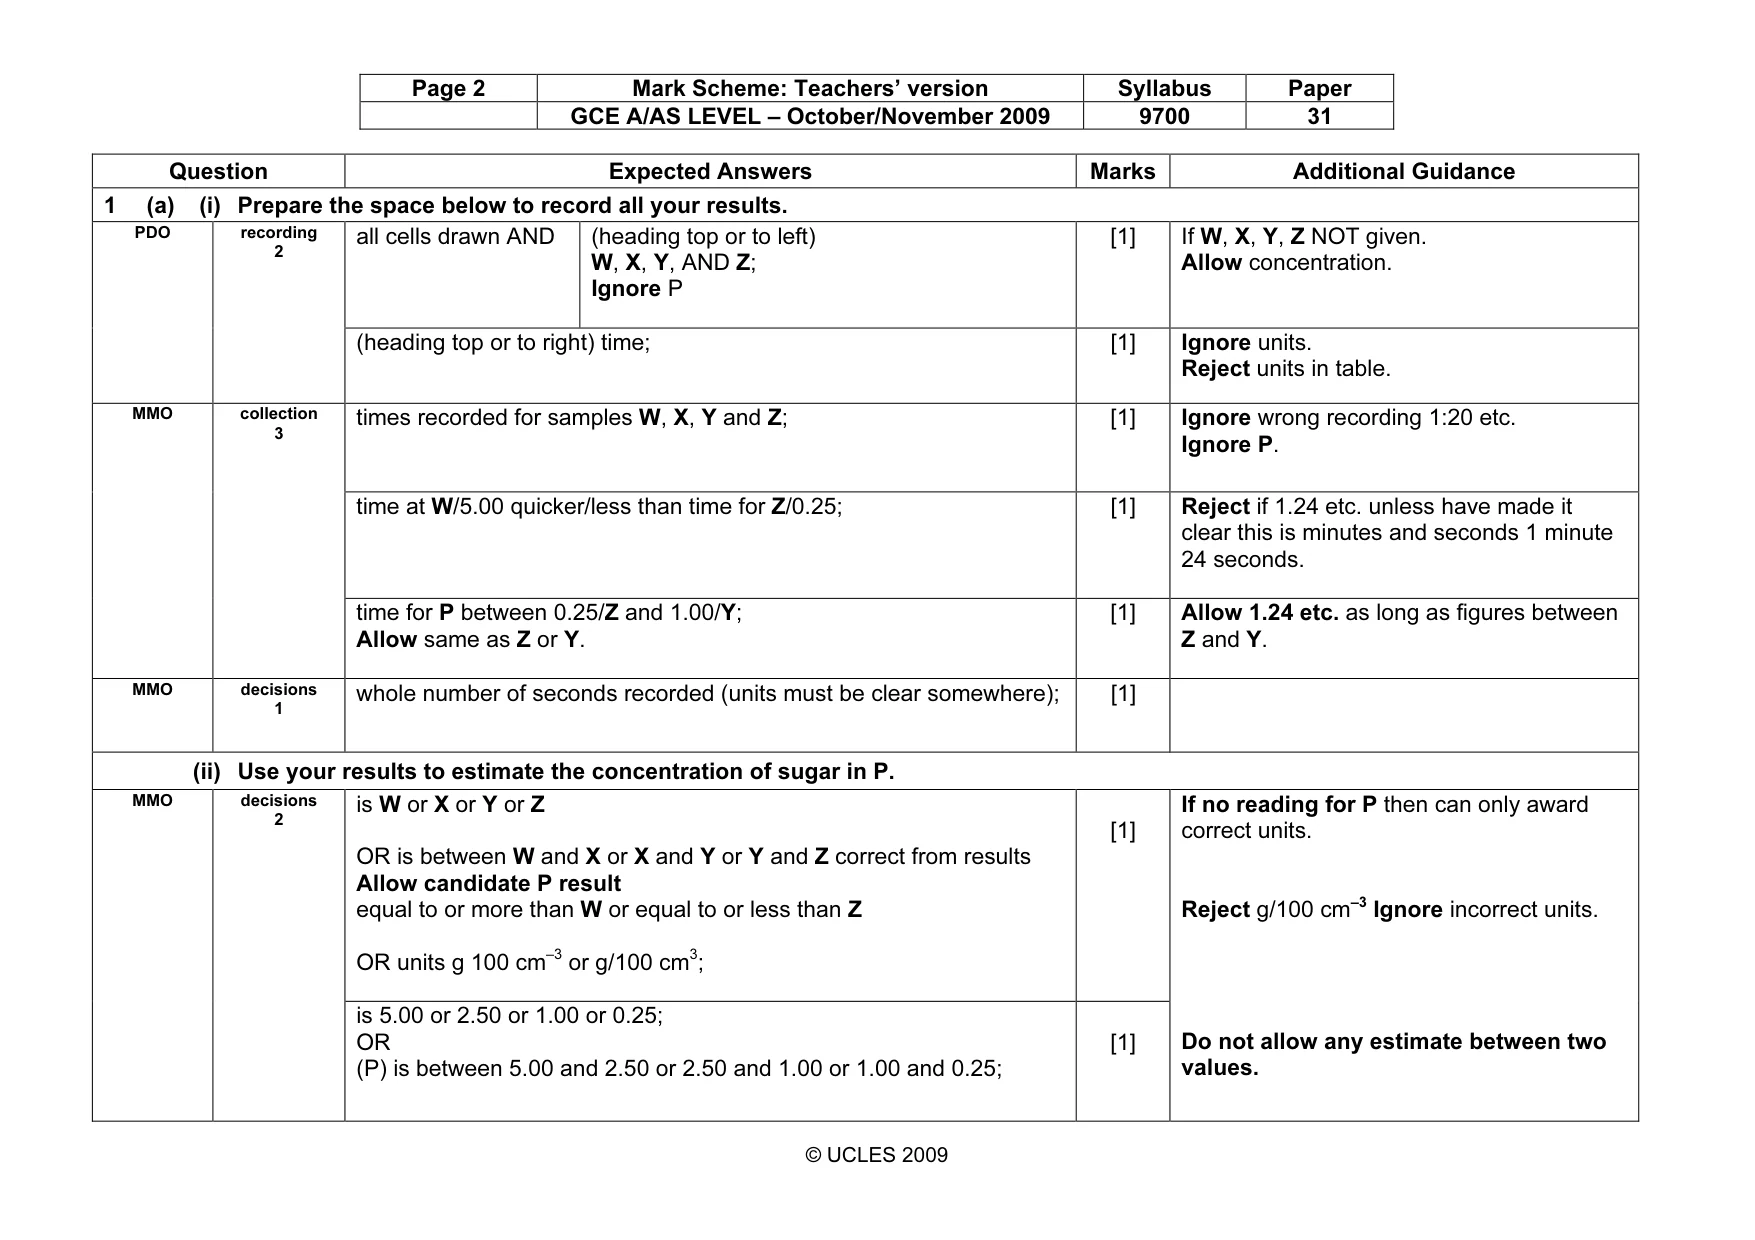
Page 2 Mark Scheme: Teachers’ version Syllabus Paper GCE A/AS LEVEL – October/November 2009 9700 31 © UCLES 2009 Question Expected Answers Marks Additional Guidance 1 (a) (i) Prepare the space below to record all your results. all cells drawn AND (heading top or to left) W, X, Y, AND Z; Ignore P [1] If W, X, Y, Z NOT given. Allow concentration. PDO recording 2 (heading top or to right) time; [1] Ignore units. Reject units in table. times recorded for samples W, X, Y and Z; [1] Ignore wrong recording 1:20 etc. Ignore P. time at W/5.00 quicker/less than time for Z/0.25; [1] Reject if 1.24 etc. unless have made it clear this is minutes and seconds 1 minute 24 seconds. MMO collection 3 time for P between 0.25/Z and 1.00/Y; Allow same as Z or Y. [1] Allow 1.24 etc. as long as figures between Z and Y. MMO decisions 1 whole number of seconds recorded (units must be clear somewhere); [1] (ii) Use your results to estimate the concentration of sugar in P. is W or X or Y or Z OR is between W and X or X and Y or Y and Z correct from results Allow candidate P result equal to or more than W or equal to or less than Z OR units g 100 cm–3 or g/100 cm3; [1] MMO decisions 2 is 5.00 or 2.50 or 1.00 or 0.25; OR (P) is between 5.00 and 2.50 or 2.50 and 1.00 or 1.00 and 0.25; [1] If no reading for P then can only award correct units. Reject g/100 cm–3 Ignore incorrect units. Do not allow any estimate between two values.
Mark scheme, page 3
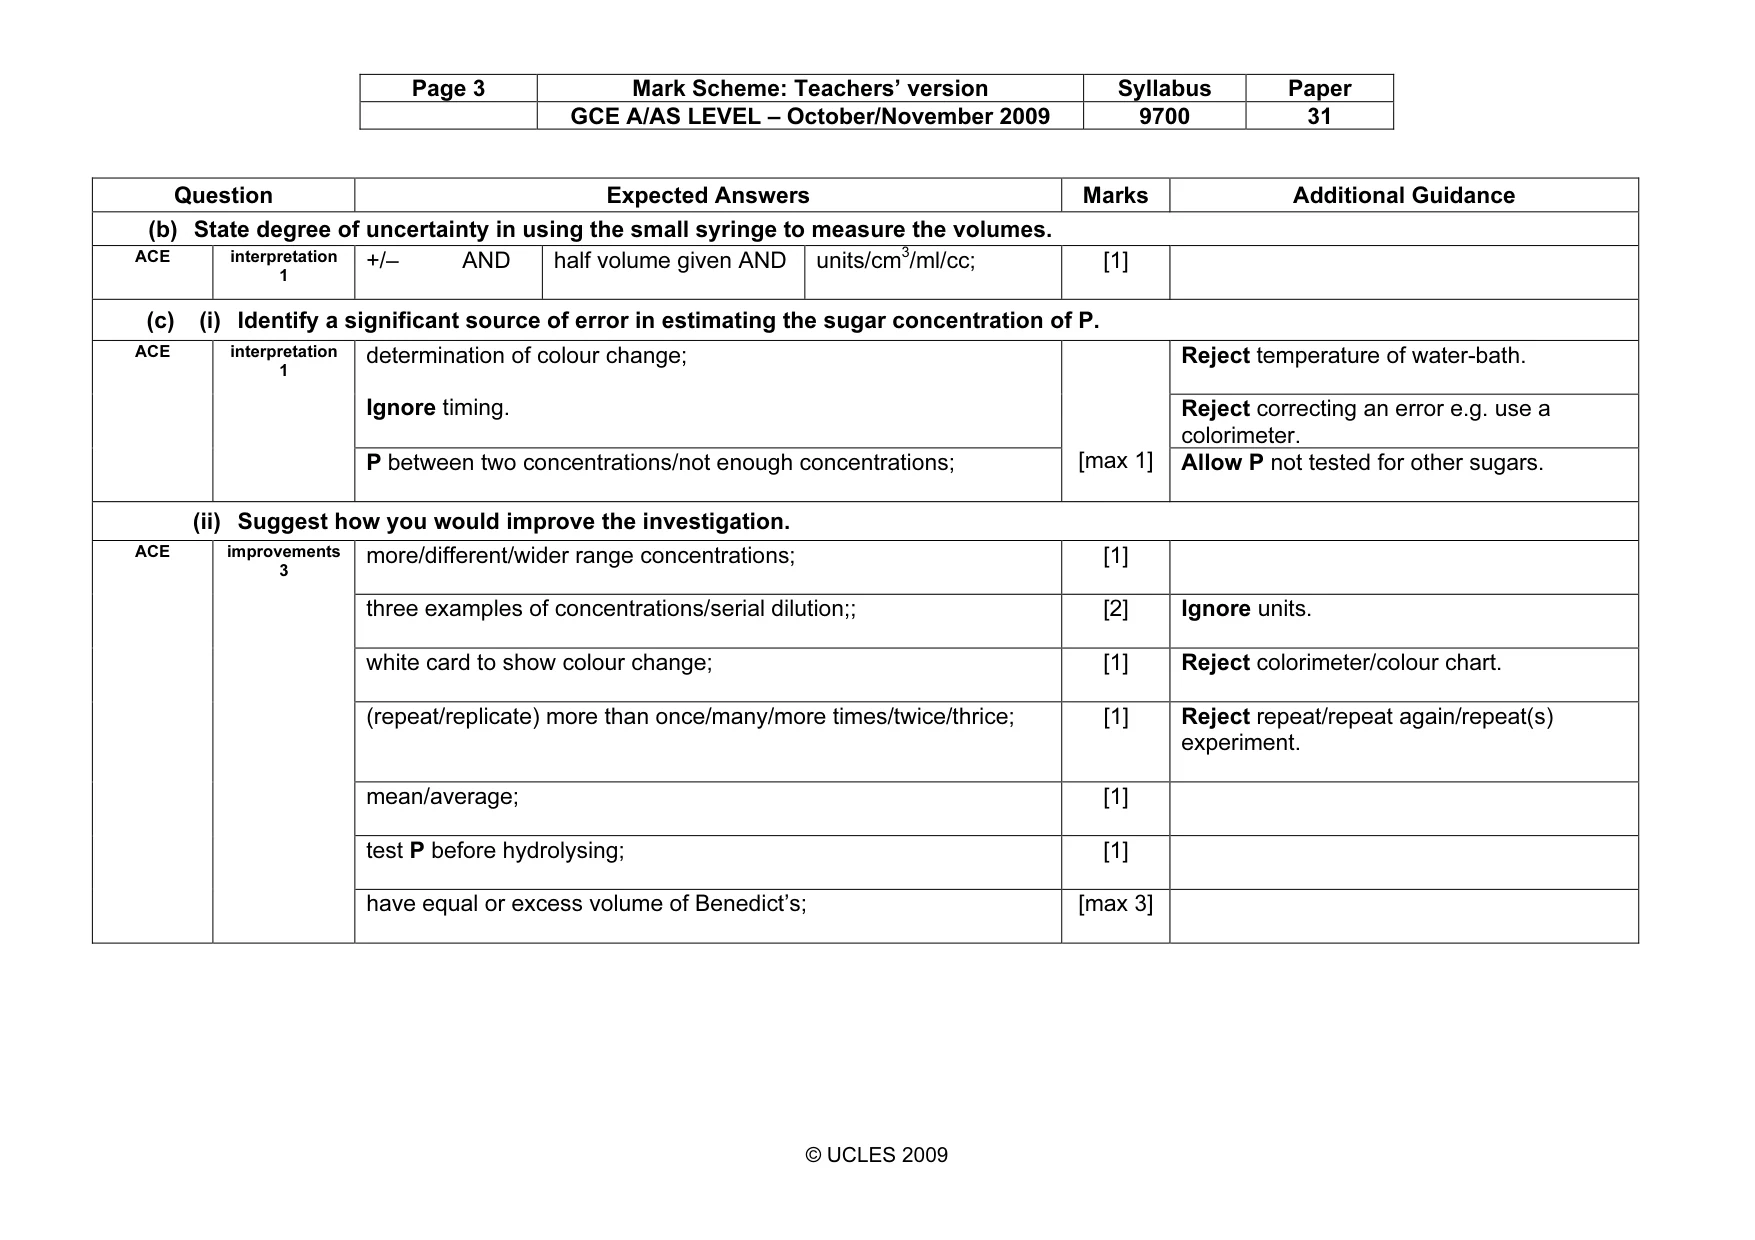
Page 3 Mark Scheme: Teachers’ version Syllabus Paper GCE A/AS LEVEL – October/November 2009 9700 31 © UCLES 2009 Question Expected Answers Marks Additional Guidance (b) State degree of uncertainty in using the small syringe to measure the volumes. ACE interpretation 1 +/– AND half volume given AND units/cm3/ml/cc; [1] (c) (i) Identify a significant source of error in estimating the sugar concentration of P. Reject temperature of water-bath. determination of colour change; Ignore timing. Reject correcting an error e.g. use a colorimeter. ACE interpretation 1 P between two concentrations/not enough concentrations; [max 1] Allow P not tested for other sugars. (ii) Suggest how you would improve the investigation. more/different/wider range concentrations; [1] three examples of concentrations/serial dilution;; [2] Ignore units. white card to show colour change; [1] Reject colorimeter/colour chart. (repeat/replicate) more than once/many/more times/twice/thrice; [1] Reject repeat/repeat again/repeat(s) experiment. mean/average; [1] test P before hydrolysing; [1] ACE improvements 3 have equal or excess volume of Benedict’s; [max 3]
Mark scheme, page 4
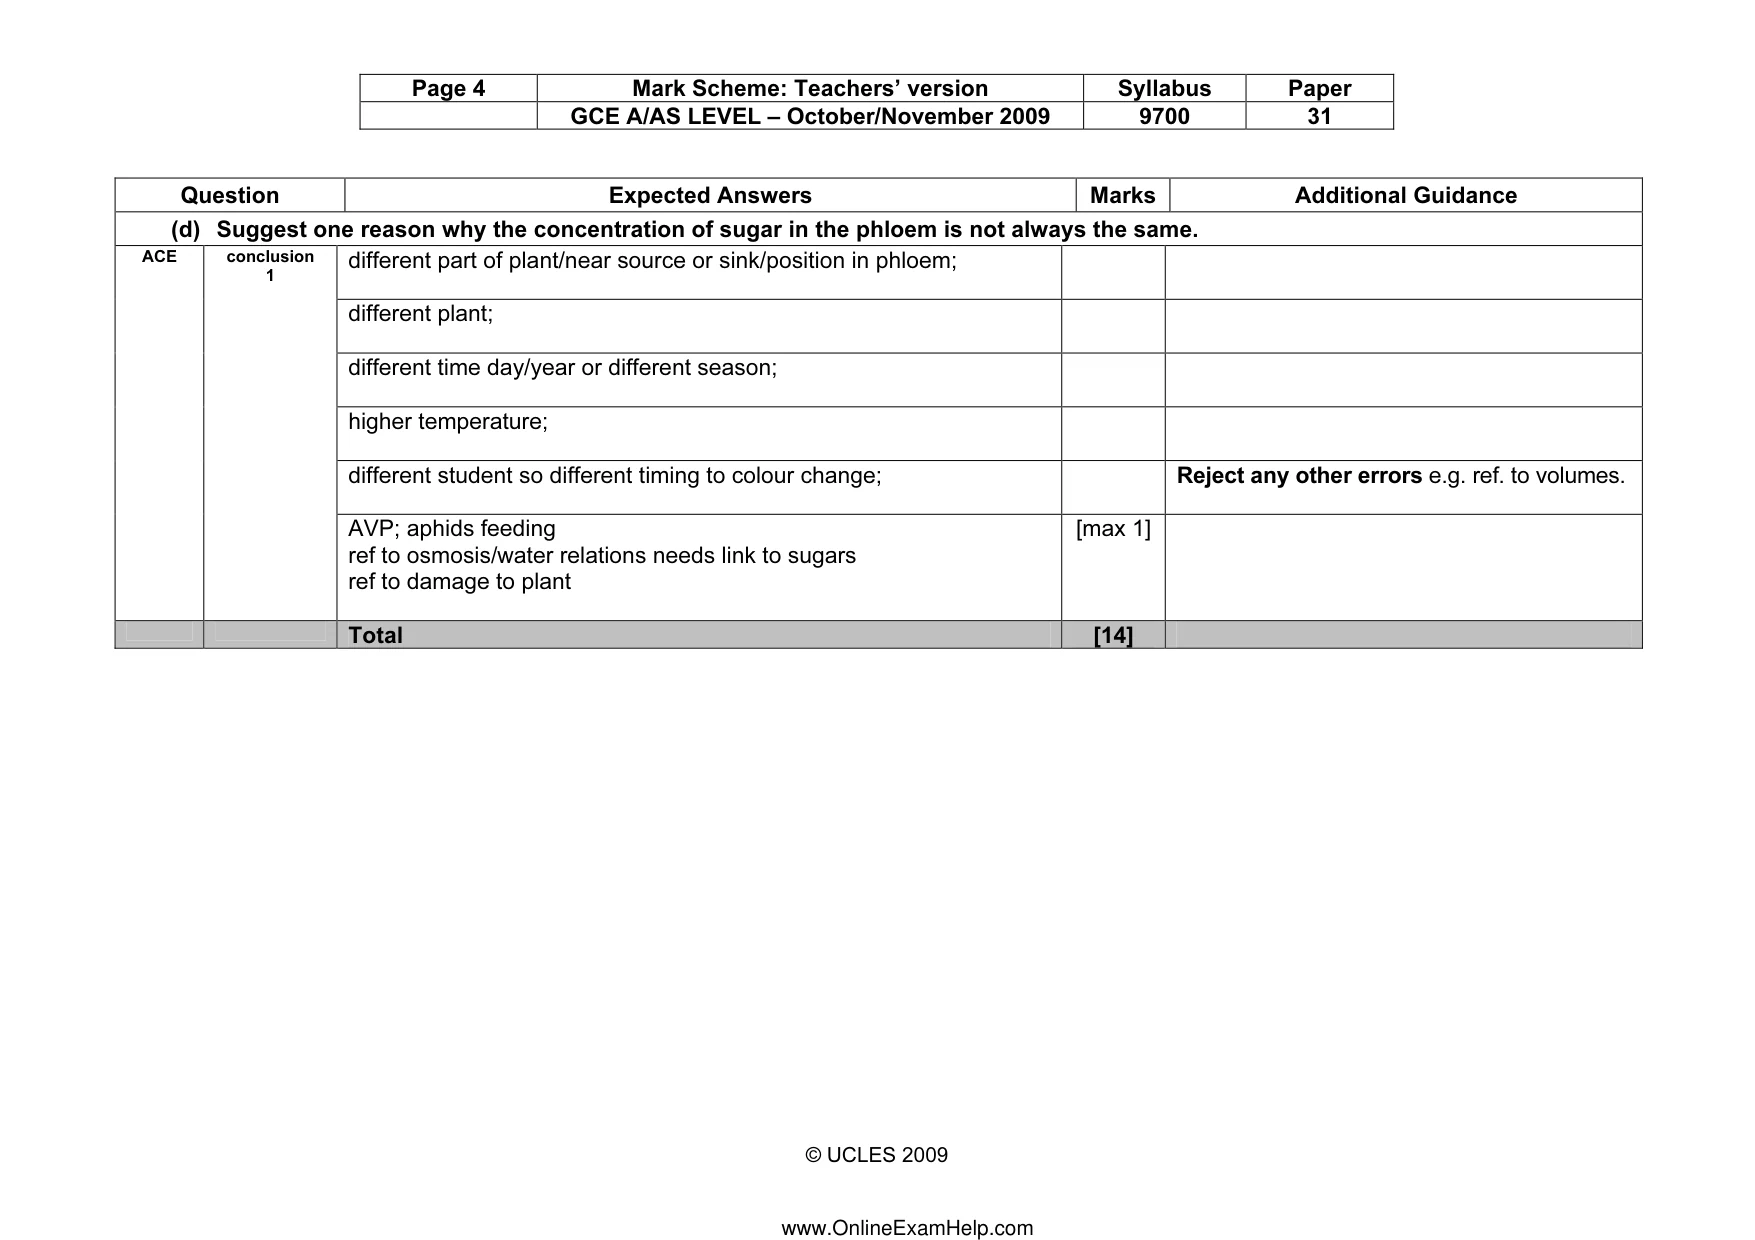
Page 4 Mark Scheme: Teachers’ version Syllabus Paper GCE A/AS LEVEL – October/November 2009 9700 31 © UCLES 2009 Question Expected Answers Marks Additional Guidance (d) Suggest one reason why the concentration of sugar in the phloem is not always the same. different part of plant/near source or sink/position in phloem; different plant; different time day/year or different season; higher temperature; different student so different timing to colour change; Reject any other errors e.g. ref. to volumes. ACE conclusion 1 AVP; aphids feeding ref to osmosis/water relations needs link to sugars ref to damage to plant [max 1] Total [14] www.OnlineExamHelp.com
Mark scheme, page 5
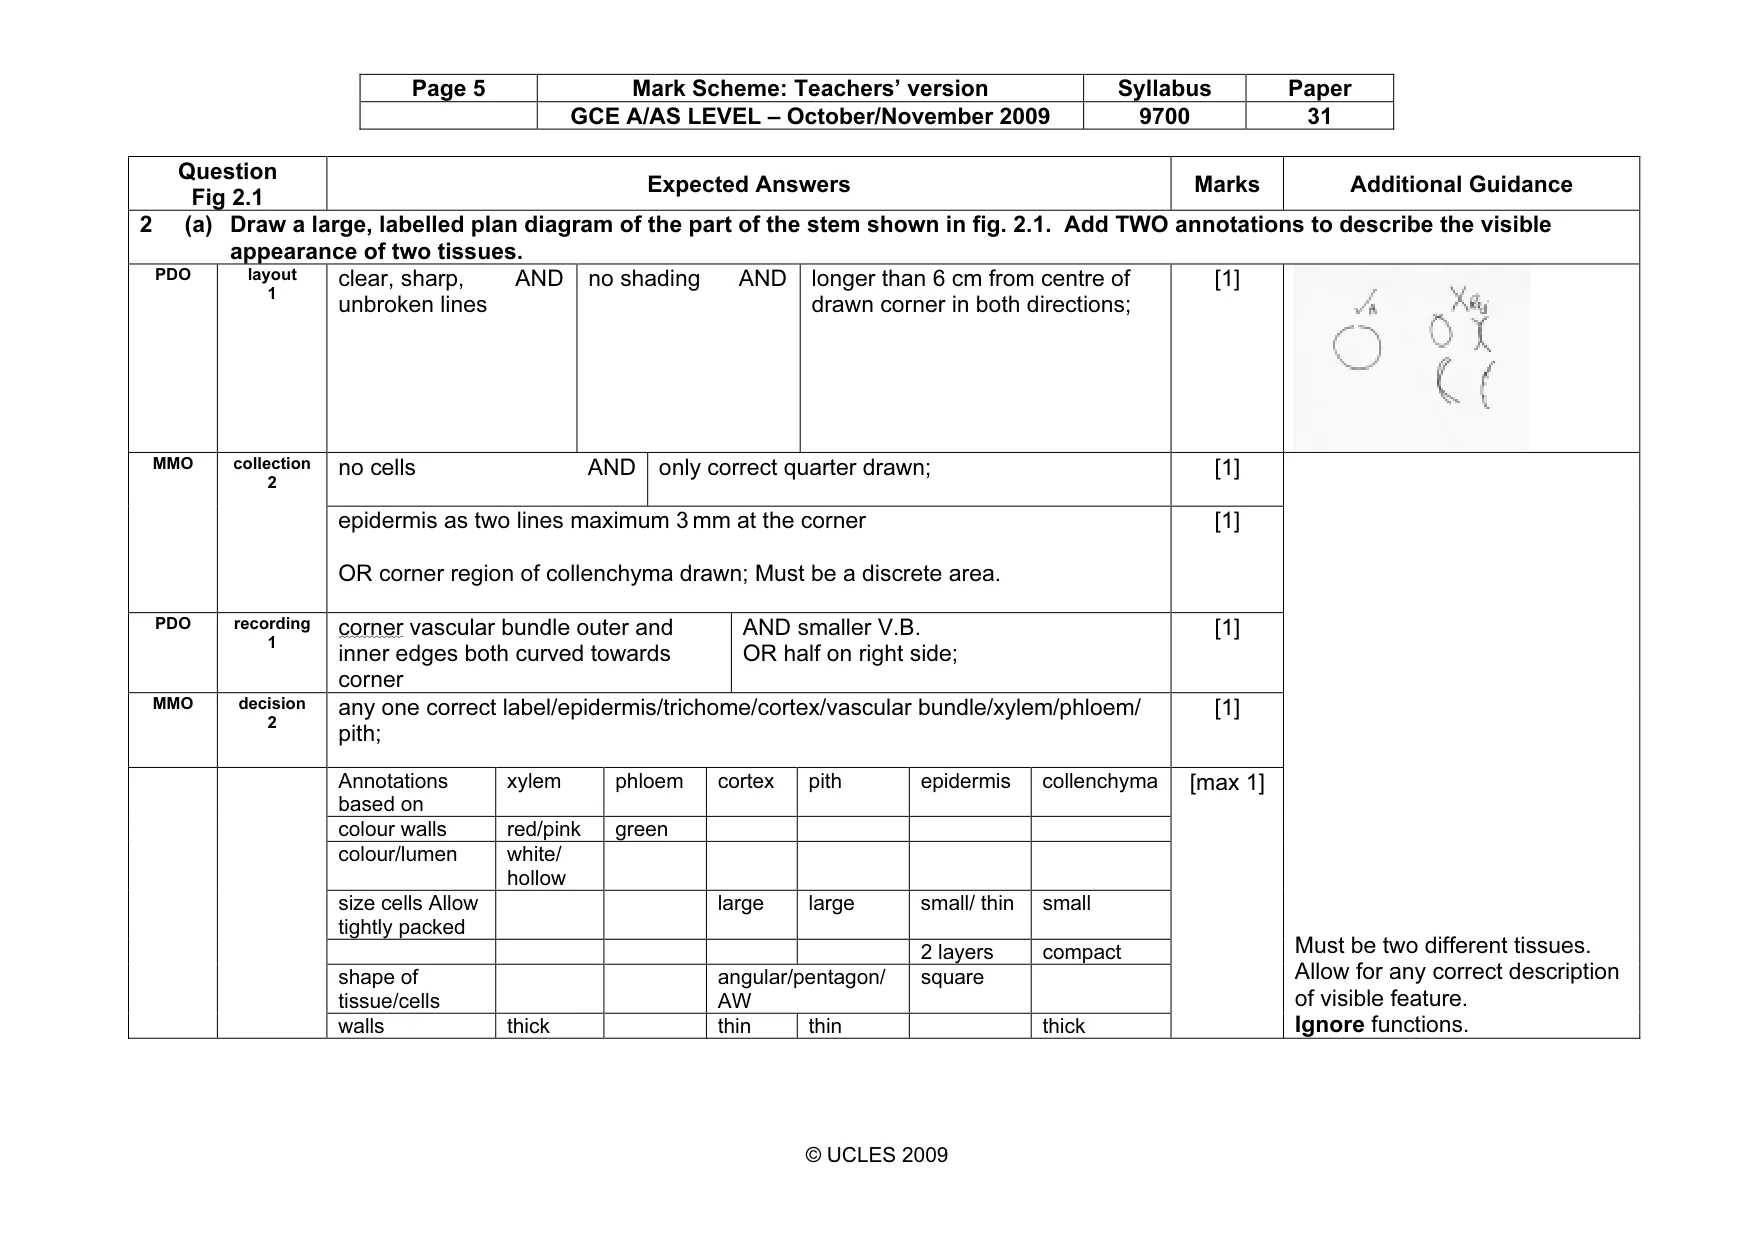
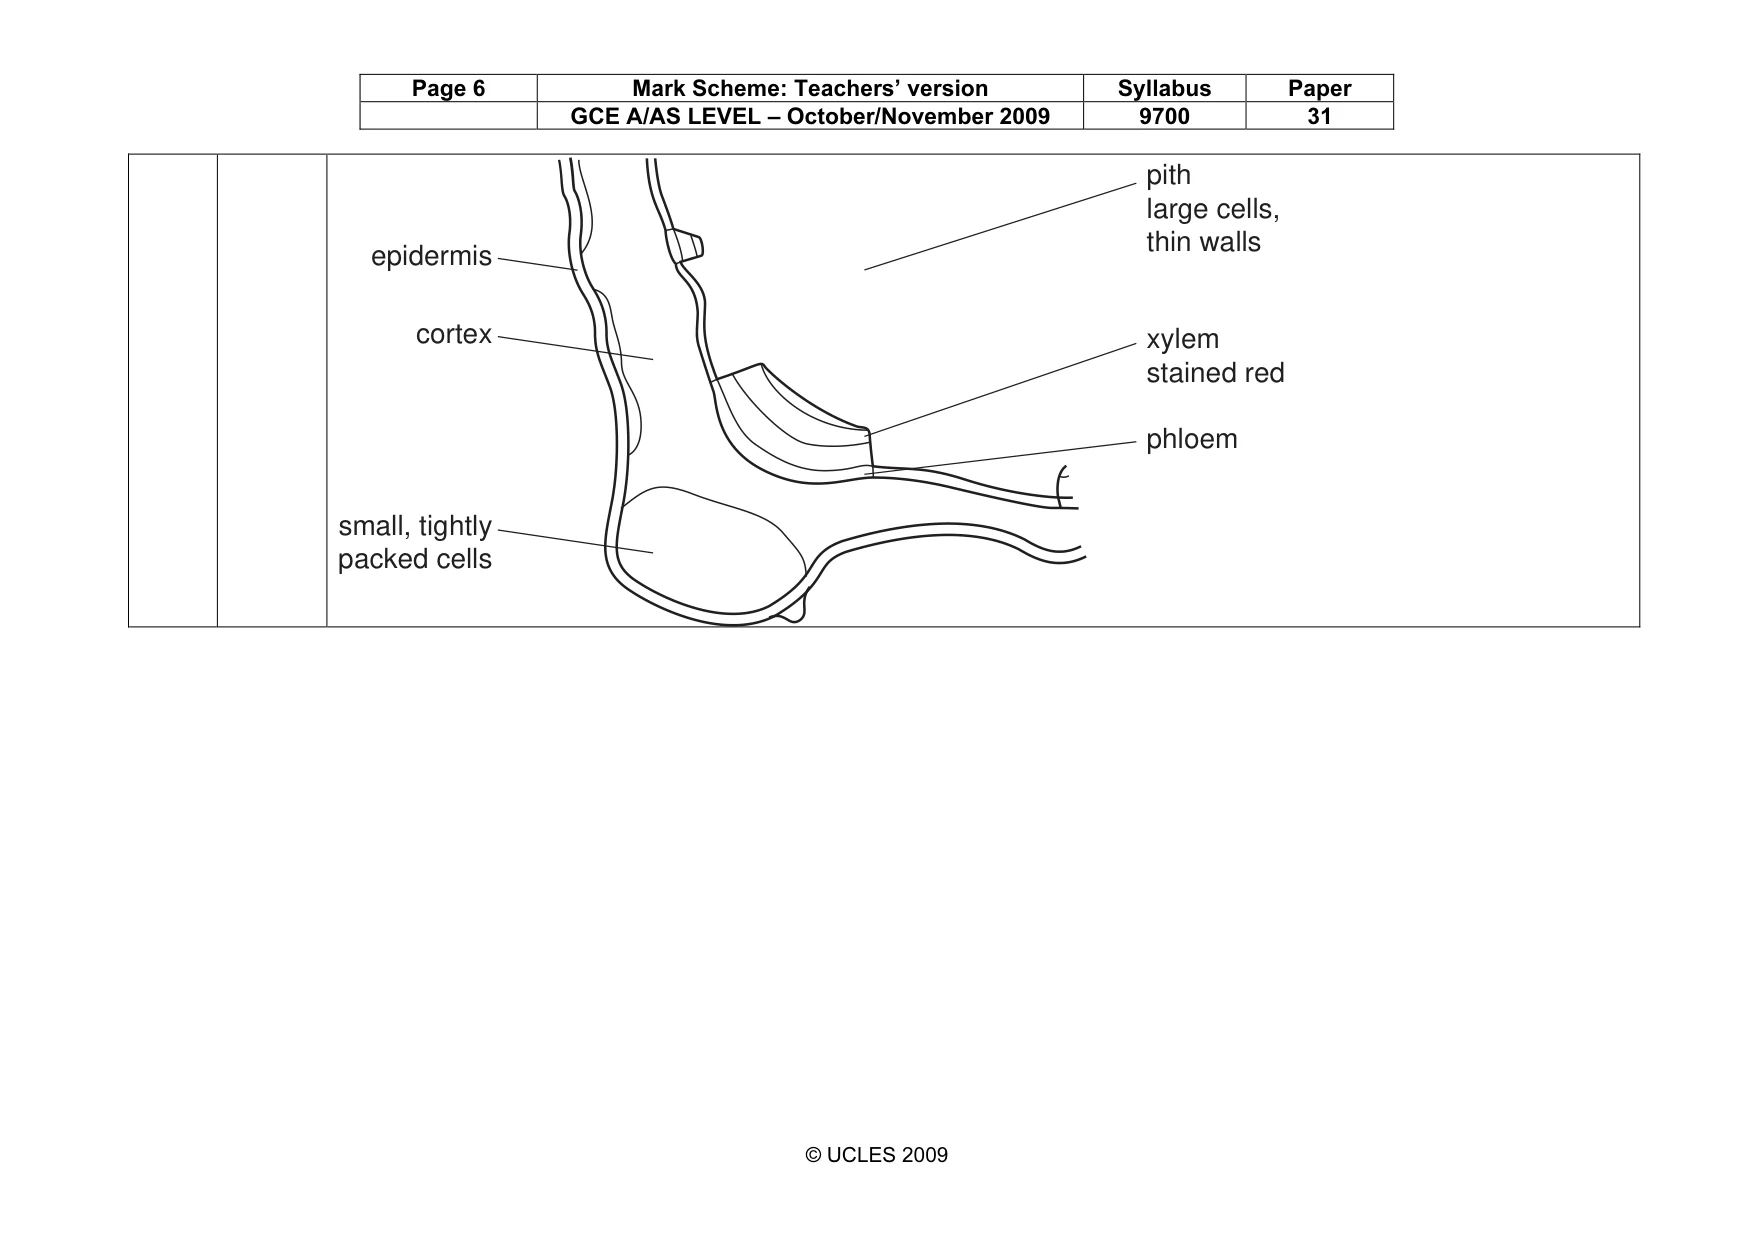
Page 5 Mark Scheme: Teachers’ version Syllabus Paper GCE A/AS LEVEL – October/November 2009 9700 31 © UCLES 2009 Question Fig 2.1 Expected Answers Marks Additional Guidance 2 (a) Draw a large, labelled plan diagram of the part of the stem shown in fig. 2.1. Add TWO annotations to describe the visible appearance of two tissues. PDO layout 1 clear, sharp, AND unbroken lines no shading AND longer than 6 cm from centre of drawn corner in both directions; [1] no cells AND only correct quarter drawn; [1] MMO collection 2 epidermis as two lines maximum 3 mm at the corner OR corner region of collenchyma drawn; Must be a discrete area. [1] PDO recording 1 corner vascular bundle outer and inner edges both curved towards corner AND smaller V.B. OR half on right side; [1] MMO decision 2 any one correct label/epidermis/trichome/cortex/vascular bundle/xylem/phloem/ pith; [1] Annotations based on xylem phloem cortex pith epidermis collenchyma colour walls red/pink green colour/lumen white/ hollow size cells Allow tightly packed large large small/ thin small 2 layers compact shape of tissue/cells angular/pentagon/ AW square walls thick thin thin thick [max 1] Must be two different tissues. Allow for any correct description of visible feature. Ignore functions.
Mark scheme, page 6
Page 6 Mark Scheme: Teachers’ version Syllabus Paper GCE A/AS LEVEL – October/November 2009 9700 31 © UCLES 2009 epidermis cortex small, tightly packed cells pith large cells, thin walls xylem stained red phloem
Mark scheme, page 7
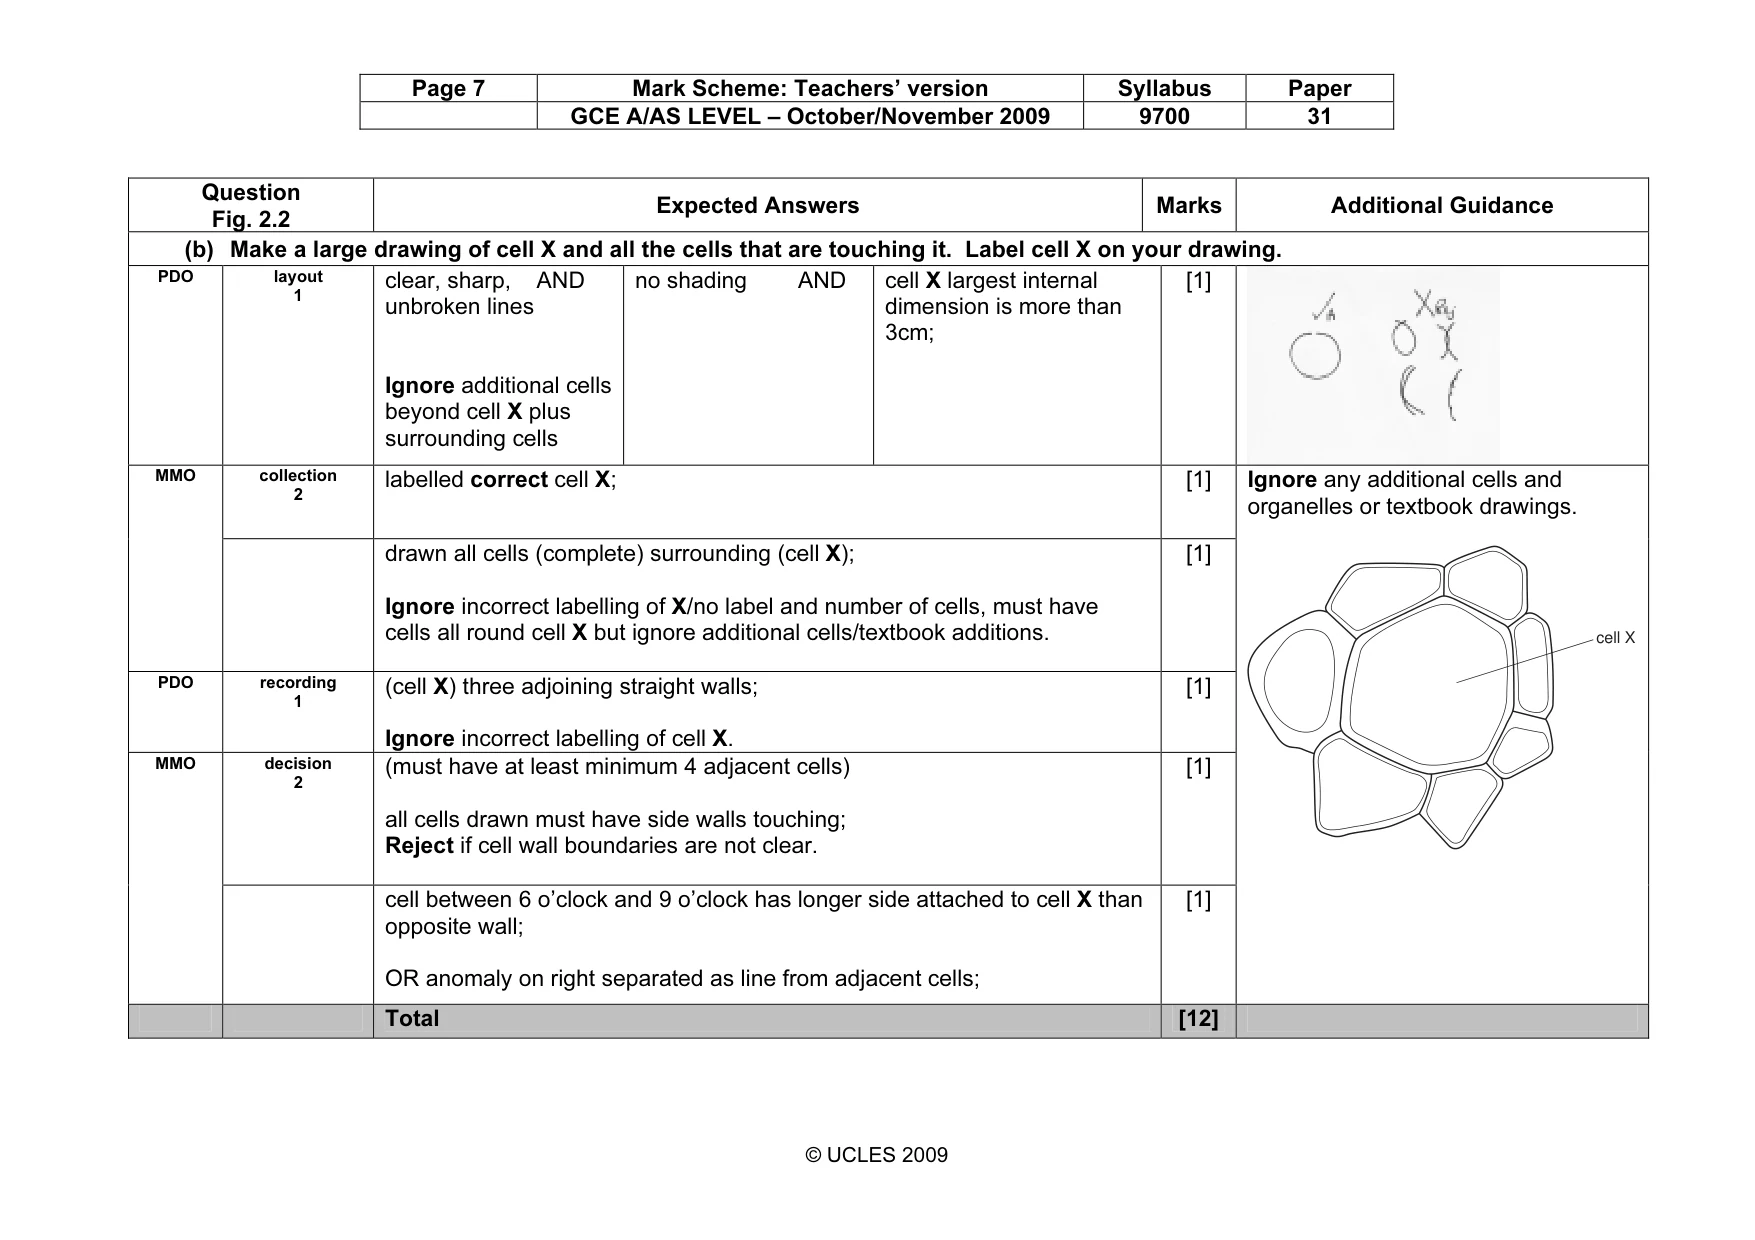
Page 7 Mark Scheme: Teachers’ version Syllabus Paper GCE A/AS LEVEL – October/November 2009 9700 31 © UCLES 2009 Question Fig. 2.2 Expected Answers Marks Additional Guidance (b) Make a large drawing of cell X and all the cells that are touching it. Label cell X on your drawing. PDO layout 1 clear, sharp, AND unbroken lines Ignore additional cells beyond cell X plus surrounding cells no shading AND cell X largest internal dimension is more than 3cm; [1] collection 2 labelled correct cell X; [1] MMO drawn all cells (complete) surrounding (cell X); Ignore incorrect labelling of X/no label and number of cells, must have cells all round cell X but ignore additional cells/textbook additions. [1] PDO recording 1 (cell X) three adjoining straight walls; Ignore incorrect labelling of cell X. [1] decision 2 (must have at least minimum 4 adjacent cells) all cells drawn must have side walls touching; Reject if cell wall boundaries are not clear. [1] MMO cell between 6 o’clock and 9 o’clock has longer side attached to cell X than opposite wall; OR anomaly on right separated as line from adjacent cells; [1] Ignore any additional cells and organelles or textbook drawings. cell X Total [12]
Mark scheme, page 8
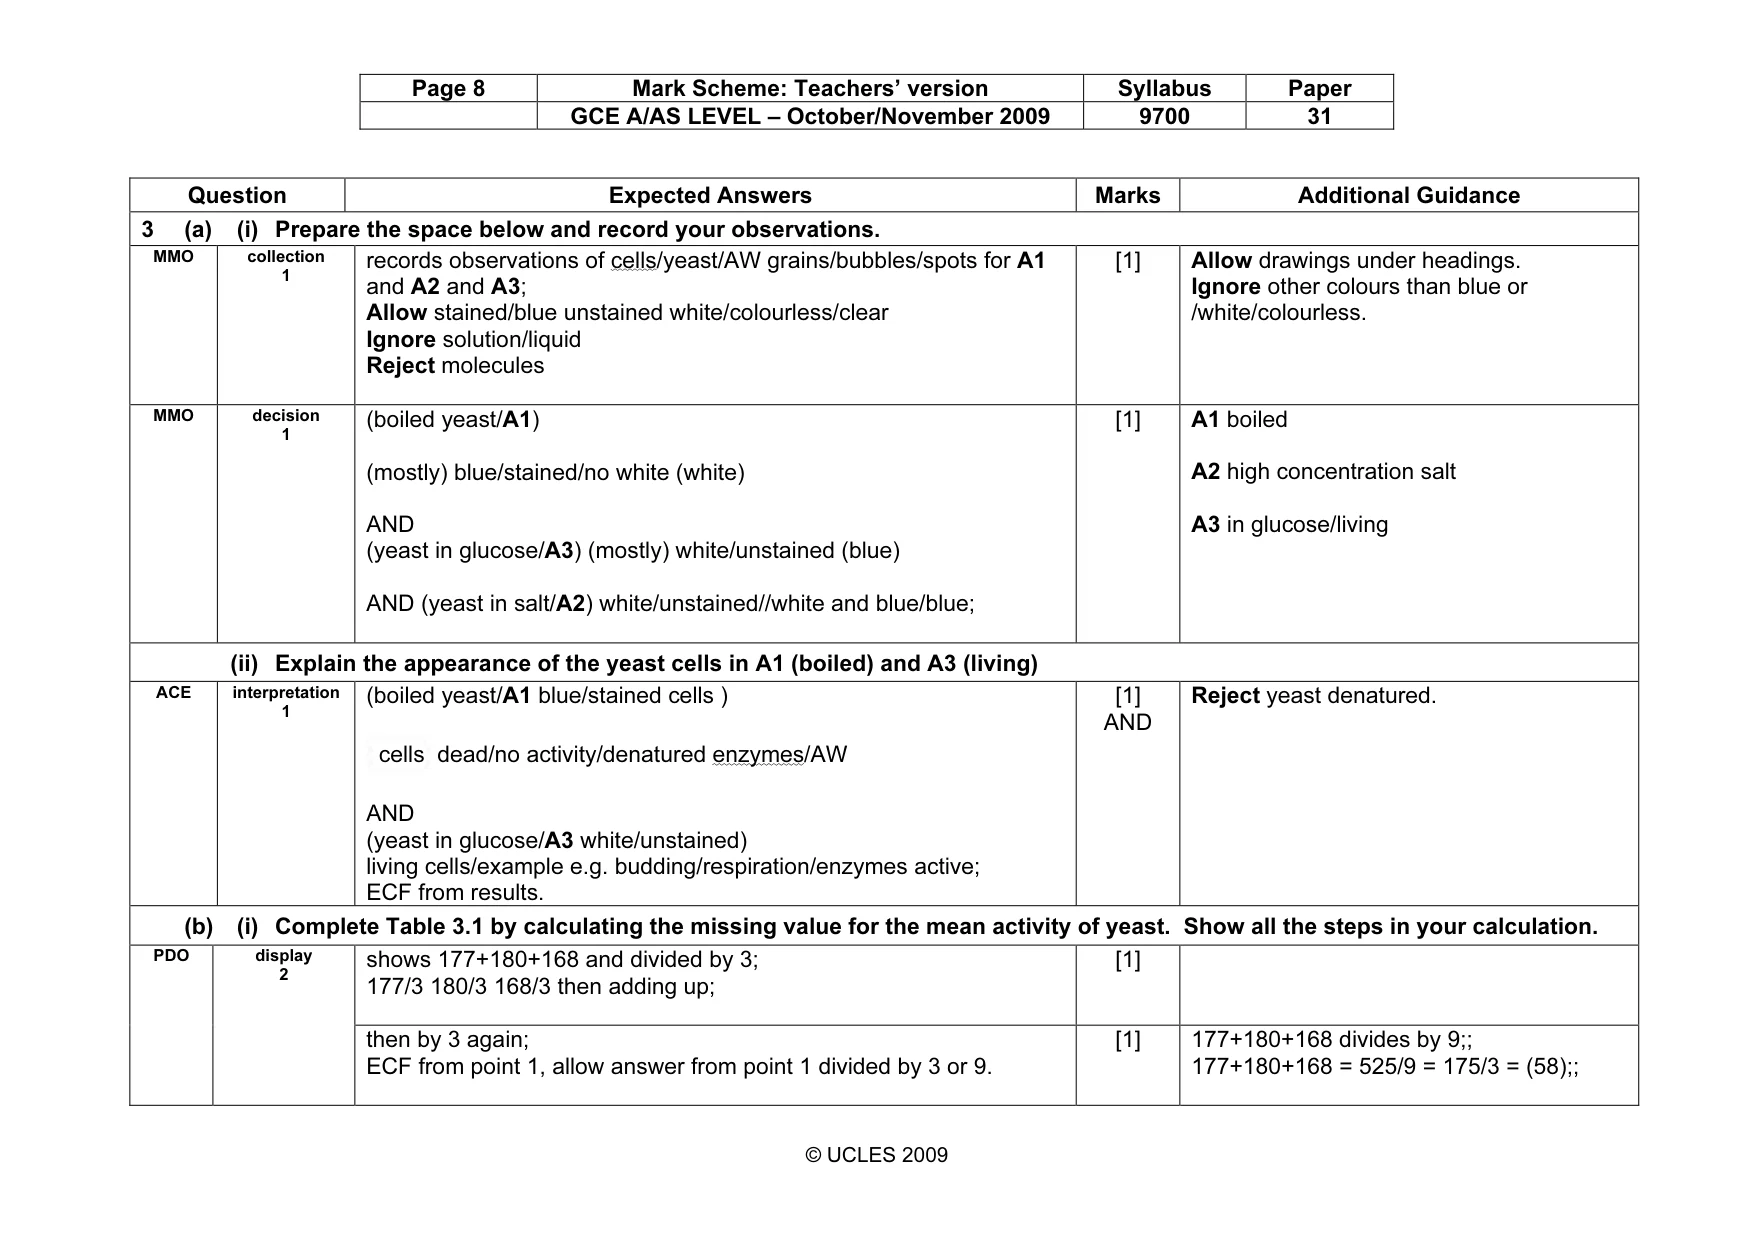
Page 8 Mark Scheme: Teachers’ version Syllabus Paper GCE A/AS LEVEL – October/November 2009 9700 31 © UCLES 2009 Question Expected Answers Marks Additional Guidance 3 (a) (i) Prepare the space below and record your observations. MMO collection 1 records observations of cells/yeast/AW grains/bubbles/spots for A1 and A2 and A3; Allow stained/blue unstained white/colourless/clear Ignore solution/liquid Reject molecules [1] Allow drawings under headings. Ignore other colours than blue or /white/colourless. MMO decision 1 (boiled yeast/A1) (mostly) blue/stained/no white (white) AND (yeast in glucose/A3) (mostly) white/unstained (blue) AND (yeast in salt/A2) white/unstained//white and blue/blue; [1] A1 boiled A2 high concentration salt A3 in glucose/living (ii) Explain the appearance of the yeast cells in A1 (boiled) and A3 (living) ACE interpretation 1 (boiled yeast/A1 blue/stained cells ) cells dead/no activity/denatured enzymes/AW AND (yeast in glucose/A3 white/unstained) living cells/example e.g. budding/respiration/enzymes active; ECF from results. [1] AND Reject yeast denatured. (b) (i) Complete Table 3.1 by calculating the missing value for the mean activity of yeast. Show all the steps in your calculation. shows 177+180+168 and divided by 3; 177/3 180/3 168/3 then adding up; [1] PDO display 2 then by 3 again; ECF from point 1, allow answer from point 1 divided by 3 or 9. [1] 177+180+168 divides by 9;; 177+180+168 = 525/9 = 175/3 = (58);;
Mark scheme, page 9
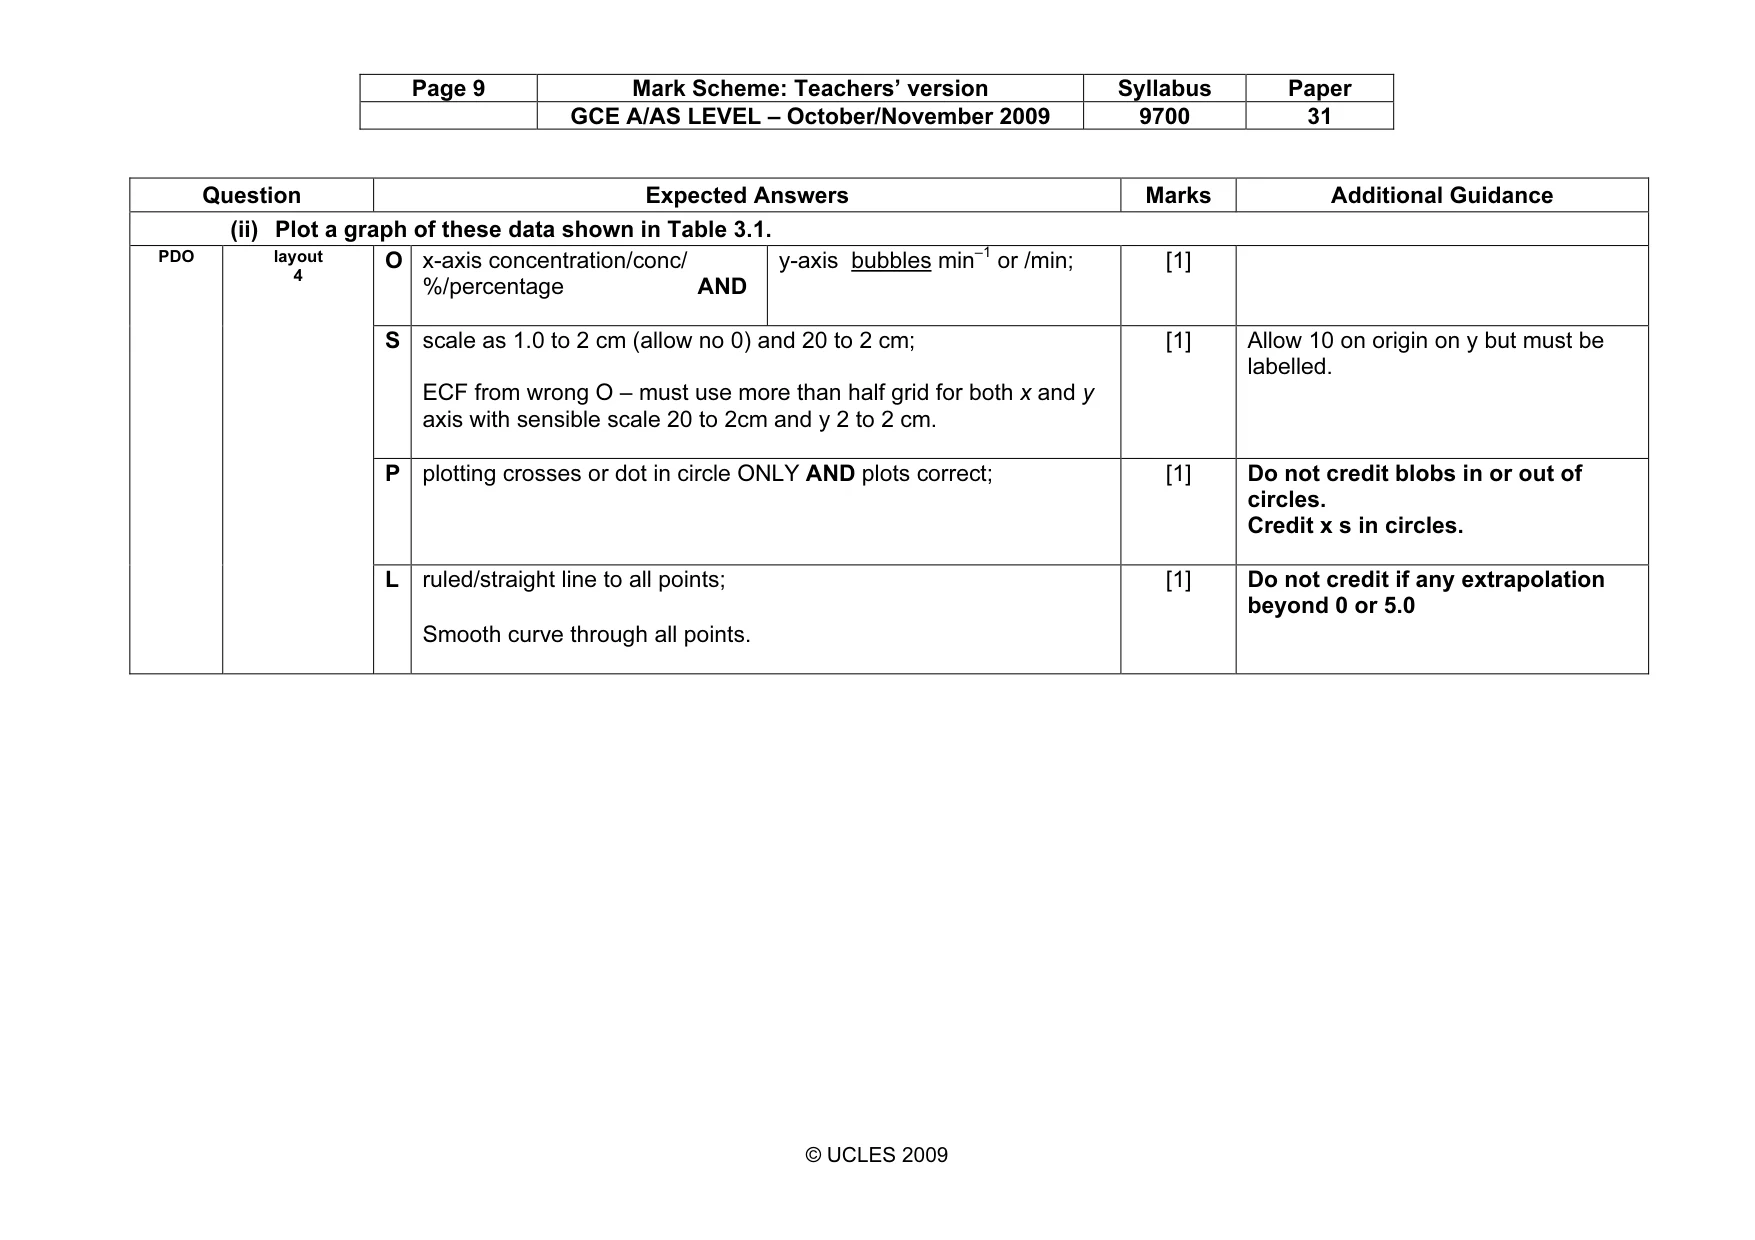
Page 9 Mark Scheme: Teachers’ version Syllabus Paper GCE A/AS LEVEL – October/November 2009 9700 31 © UCLES 2009 Question Expected Answers Marks Additional Guidance (ii) Plot a graph of these data shown in Table 3.1. O x-axis concentration/conc/ %/percentage AND y-axis bubbles min–1 or /min; [1] S scale as 1.0 to 2 cm (allow no 0) and 20 to 2 cm; ECF from wrong O – must use more than half grid for both x and y axis with sensible scale 20 to 2cm and y 2 to 2 cm. [1] Allow 10 on origin on y but must be labelled. P plotting crosses or dot in circle ONLY AND plots correct; [1] Do not credit blobs in or out of circles. Credit x s in circles. PDO layout 4 L ruled/straight line to all points; Smooth curve through all points. [1] Do not credit if any extrapolation beyond 0 or 5.0
Mark scheme, page 10
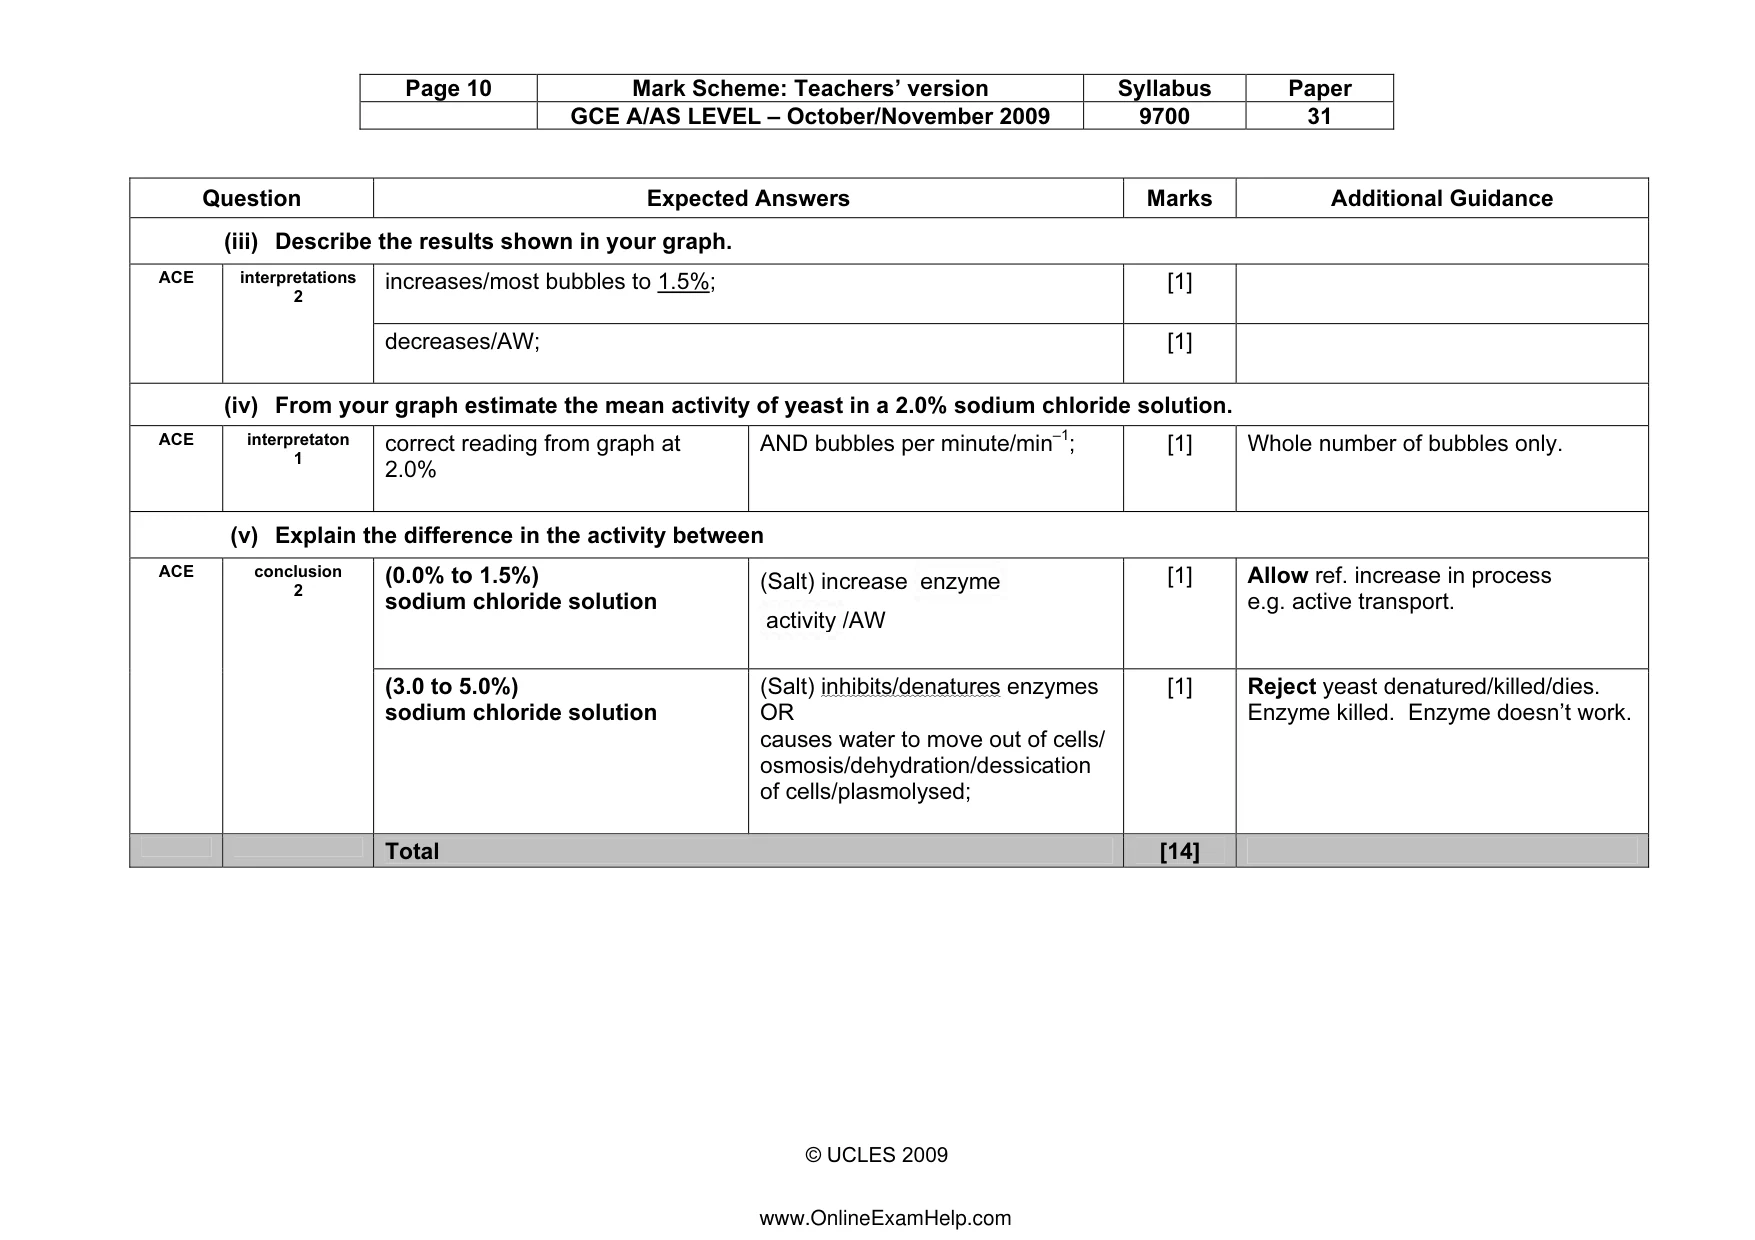
Page 10 Mark Scheme: Teachers’ version Syllabus Paper GCE A/AS LEVEL – October/November 2009 9700 31 © UCLES 2009 Question Expected Answers Marks Additional Guidance (iii) Describe the results shown in your graph. increases/most bubbles to 1.5%; [1] ACE interpretations 2 decreases/AW; [1] (iv) From your graph estimate the mean activity of yeast in a 2.0% sodium chloride solution. ACE interpretaton 1 correct reading from graph at 2.0% AND bubbles per minute/min–1; [1] Whole number of bubbles only. (v) Explain the difference in the activity between (0.0% to 1.5%) sodium chloride solution (Salt) increase enzyme activity /AW [1] Allow ref. increase in process e.g. active transport. ACE conclusion 2 (3.0 to 5.0%) sodium chloride solution (Salt) inhibits/denatures enzymes OR causes water to move out of cells/ osmosis/dehydration/dessication of cells/plasmolysed; [1] Reject yeast denatured/killed/dies. Enzyme killed. Enzyme doesn’t work. Total [14] www.OnlineExamHelp.com