Cambridge A Level Biology 9700 — 2007 May/June Paper 3 · Variant 2
9700/32/M/J/07 · 40 marks · ≈45 min
The question paper and its mark scheme, free to read here and free to download. This is Cambridge’s own paper, exactly as it was sat.
Question paper12 pages




Mark scheme3 pages
Answers below. Sit the paper first if you are practising.
Paper as text
Question paper, page 1
This document consists of 10 printed pages and 2 blank pages. SP (CW/CGW) T26267/5 © UCLES 2007 [Turn over UNIVERSITY OF CAMBRIDGE INTERNATIONAL EXAMINATIONS General Certificate of Education Advanced Subsidiary Level and Advanced Level READ THESE INSTRUCTIONS FIRST Write your Centre number, candidate number and name on all the work you hand in. Write in dark blue or black pen. You may use a soft pencil for any diagrams, graphs or rough working. Do not use staples, paper clips, highlighters, glue or correction fluid. DO NOT WRITE IN ANY BARCODES. Answer all questions. At the end of the examination, fasten all your work securely together. The number of marks is given in brackets [ ] at the end of each question or part question. * 6 1 2 3 4 4 7 4 0 8 * BIOLOGY 9700/32 Paper 3 Advanced Practical Skills May/June 2007 2 hours Candidates answer on the Question Paper. Additional Materials: As listed in the Instructions to Supervisors. For Examiner’s Use 1 2 Total
Question paper, page 2
2 9700/32/M/J/07 For Examiner’s Use © UCLES 2007 You are reminded that you have only one hour for each question in the practical examination. You should read carefully through the whole of each question and then plan your use of the time to make sure that you finish all of the work that you would like to do. 1 You are required to estimate the concentration of reducing sugar in a fruit juice, labelled F1, by comparison with that in a range of glucose solutions. You are provided with a 0.8% solution of glucose, labelled F2, Benedict’s solution, distilled water and five test-tubes. (a) Carry out the Benedict’s test on fruit juice F1. Describe and explain your results. … … … … … …[3] (b) You are now going to test a range of glucose solutions that you will prepare yourself using F2 and distilled water. Carefully follow the instructions below. You should present and record your observations and data in the space provided. You will need to: • read through the instructions carefully • prepare the space on the next page so that it is ready for you to record the readings • decide how many different strength glucose solutions you will need and prepare these by serial dilution • carry out the tests so that you can compare your results with the result for the fruit juice.
Question paper, page 3
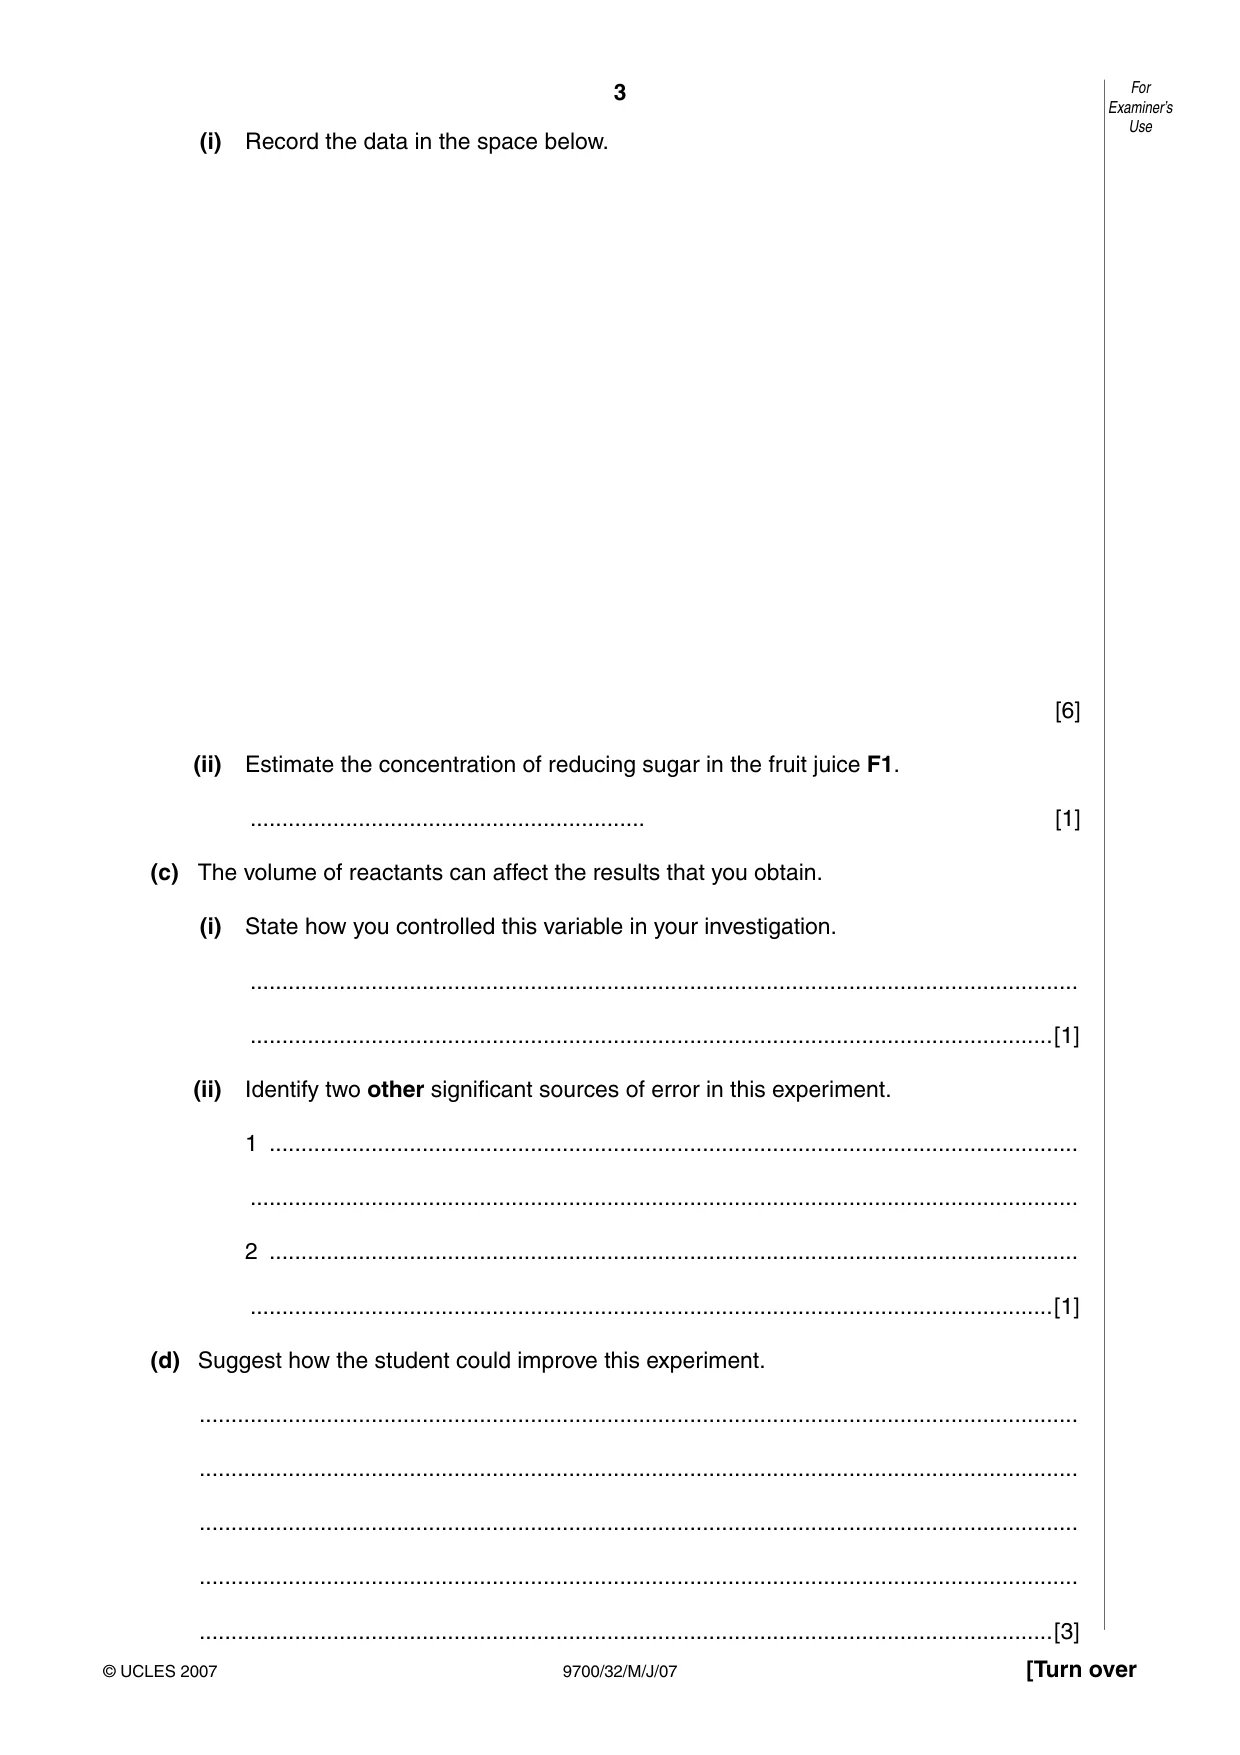
3 9700/32/M/J/07 [Turn over For Examiner’s Use © UCLES 2007 (i) Record the data in the space below. [6] (ii) Estimate the concentration of reducing sugar in the fruit juice F1. … [1] (c) The volume of reactants can affect the results that you obtain. (i) State how you controlled this variable in your investigation. … …[1] (ii) Identify two other significant sources of error in this experiment. 1 … … 2 … …[1] (d) Suggest how the student could improve this experiment. … … … … …[3]
Question paper, page 4
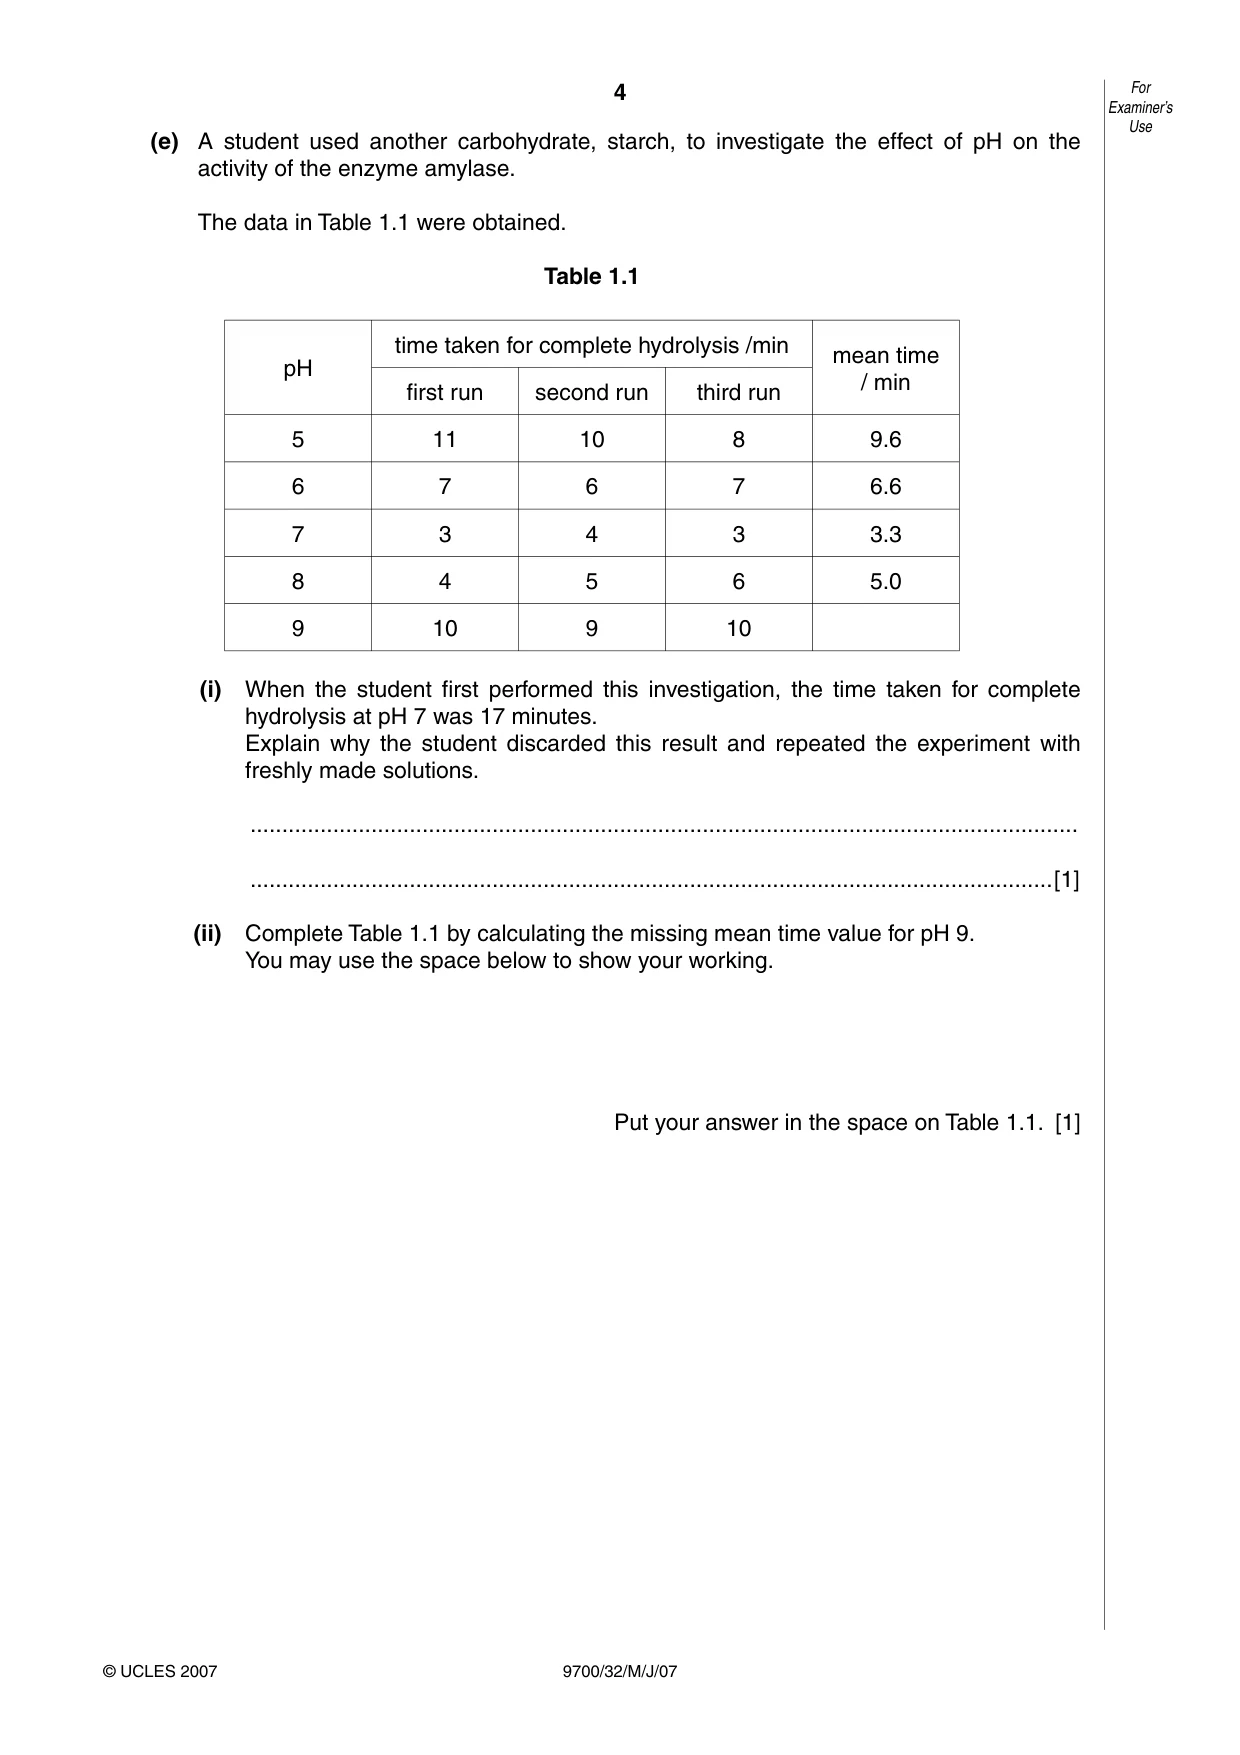
4 9700/32/M/J/07 For Examiner’s Use © UCLES 2007 (e) A student used another carbohydrate, starch, to investigate the effect of pH on the activity of the enzyme amylase. The data in Table 1.1 were obtained. Table 1.1 pH time taken for complete hydrolysis /min mean time / min first run second run third run 5 11 10 8 9.6 6 7 6 7 6.6 7 3 4 3 3.3 8 4 5 6 5.0 9 10 9 10 (i) When the student first performed this investigation, the time taken for complete hydrolysis at pH 7 was 17 minutes. Explain why the student discarded this result and repeated the experiment with freshly made solutions. … …[1] (ii) Complete Table 1.1 by calculating the missing mean time value for pH 9. You may use the space below to show your working. Put your answer in the space on Table 1.1. [1]
Question paper, page 5
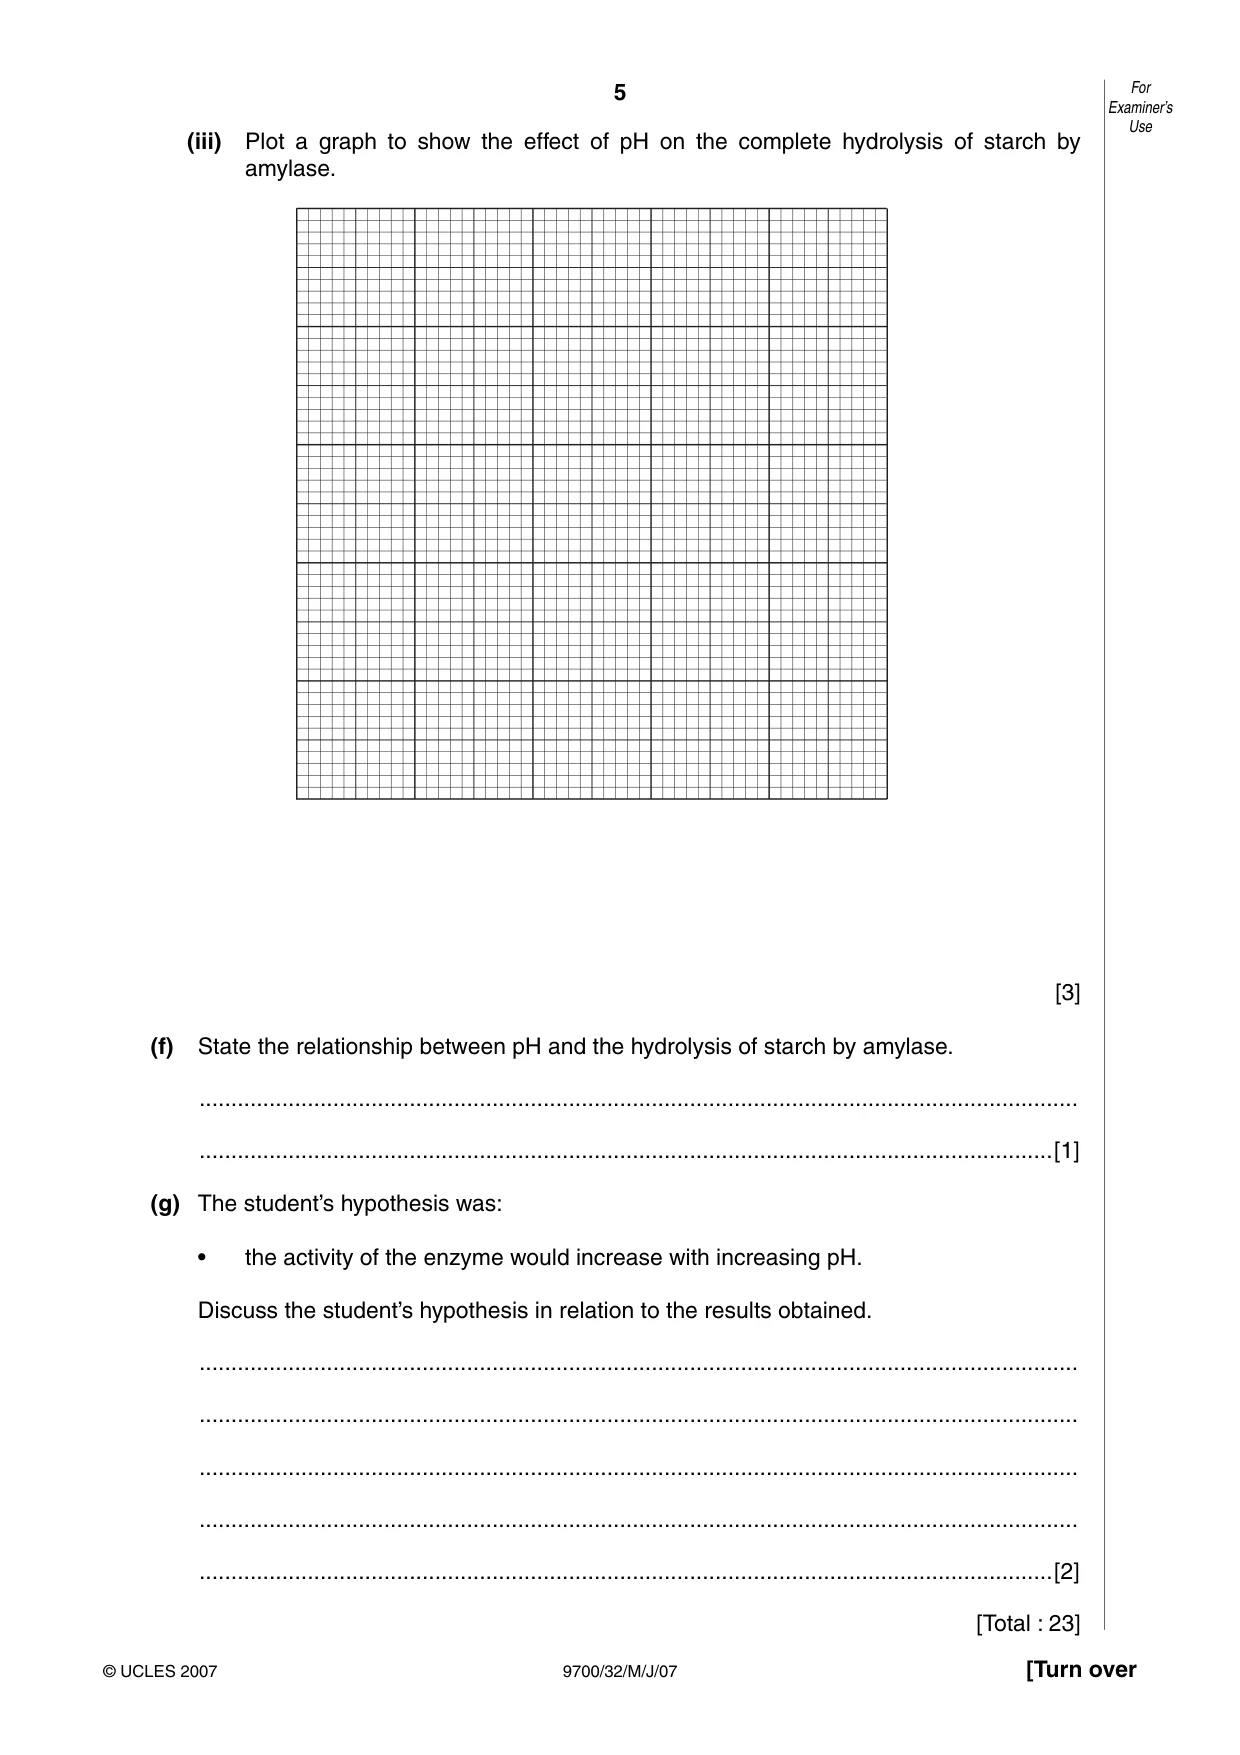
5 9700/32/M/J/07 [Turn over For Examiner’s Use © UCLES 2007 (iii) Plot a graph to show the effect of pH on the complete hydrolysis of starch by amylase. [3] (f) State the relationship between pH and the hydrolysis of starch by amylase. … …[1] (g) The student’s hypothesis was: • the activity of the enzyme would increase with increasing pH. Discuss the student’s hypothesis in relation to the results obtained. … … … … …[2] [Total : 23]
Question paper, page 6
6 9700/32/M/J/07 For Examiner’s Use © UCLES 2007 2 R1 is a slide of a stained longitudinal section through a root tip. You are also provided with an eyepiece graticule that has been fitted to the eyepiece of your microscope and a stage scale (stage micrometer) printed on acetate sheet. The 1 cm stage scale is divided into 100 divisions. Each division is 0.1 mm (a) (i) Draw a low-power plan diagram of R1 and show the area in which you can see cells undergoing mitosis. [2]
Question paper, page 7
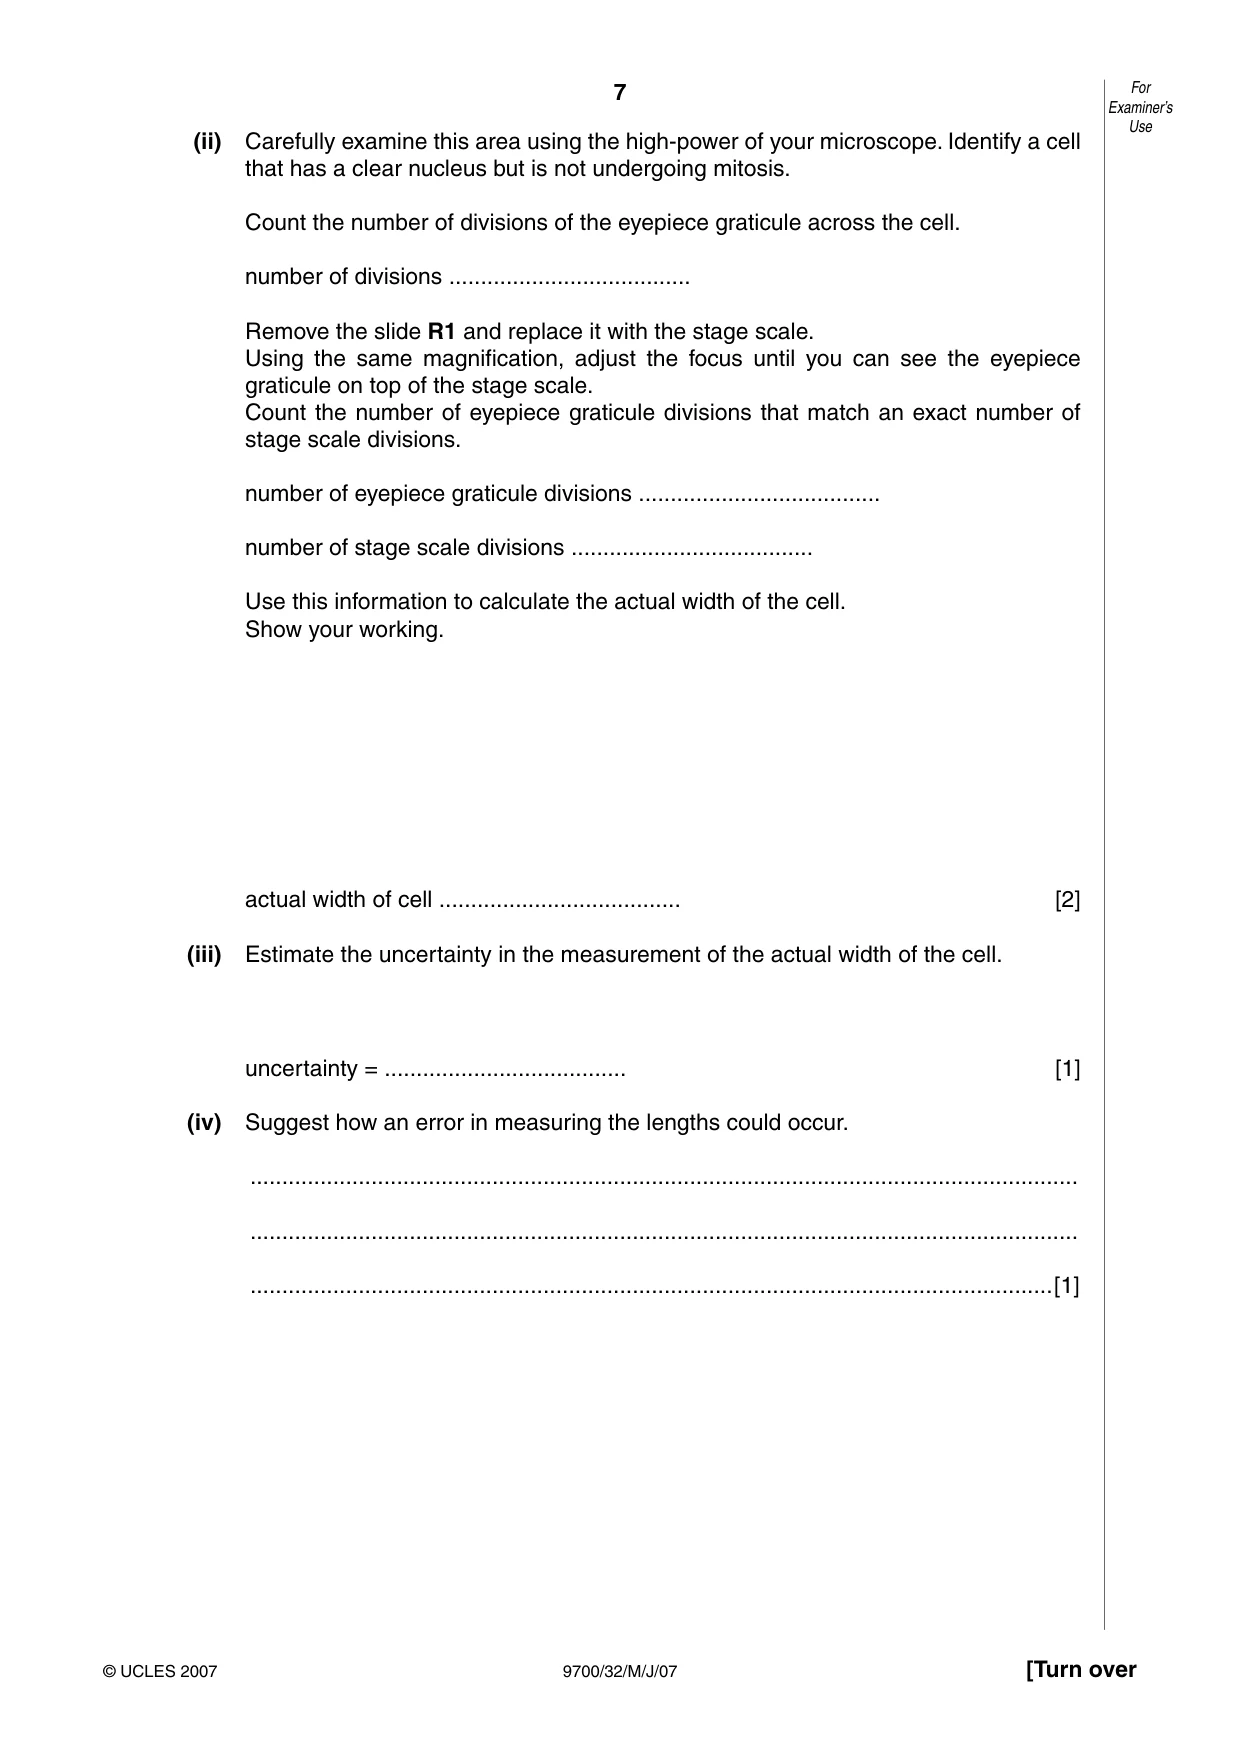
7 9700/32/M/J/07 [Turn over For Examiner’s Use © UCLES 2007 (ii) Carefully examine this area using the high-power of your microscope. Identify a cell that has a clear nucleus but is not undergoing mitosis. Count the number of divisions of the eyepiece graticule across the cell. number of divisions … Remove the slide R1 and replace it with the stage scale. Using the same magnification, adjust the focus until you can see the eyepiece graticule on top of the stage scale. Count the number of eyepiece graticule divisions that match an exact number of stage scale divisions. number of eyepiece graticule divisions … number of stage scale divisions … Use this information to calculate the actual width of the cell. Show your working. actual width of cell … [2] (iii) Estimate the uncertainty in the measurement of the actual width of the cell. uncertainty = … [1] (iv) Suggest how an error in measuring the lengths could occur. … … …[1]
Question paper, page 8
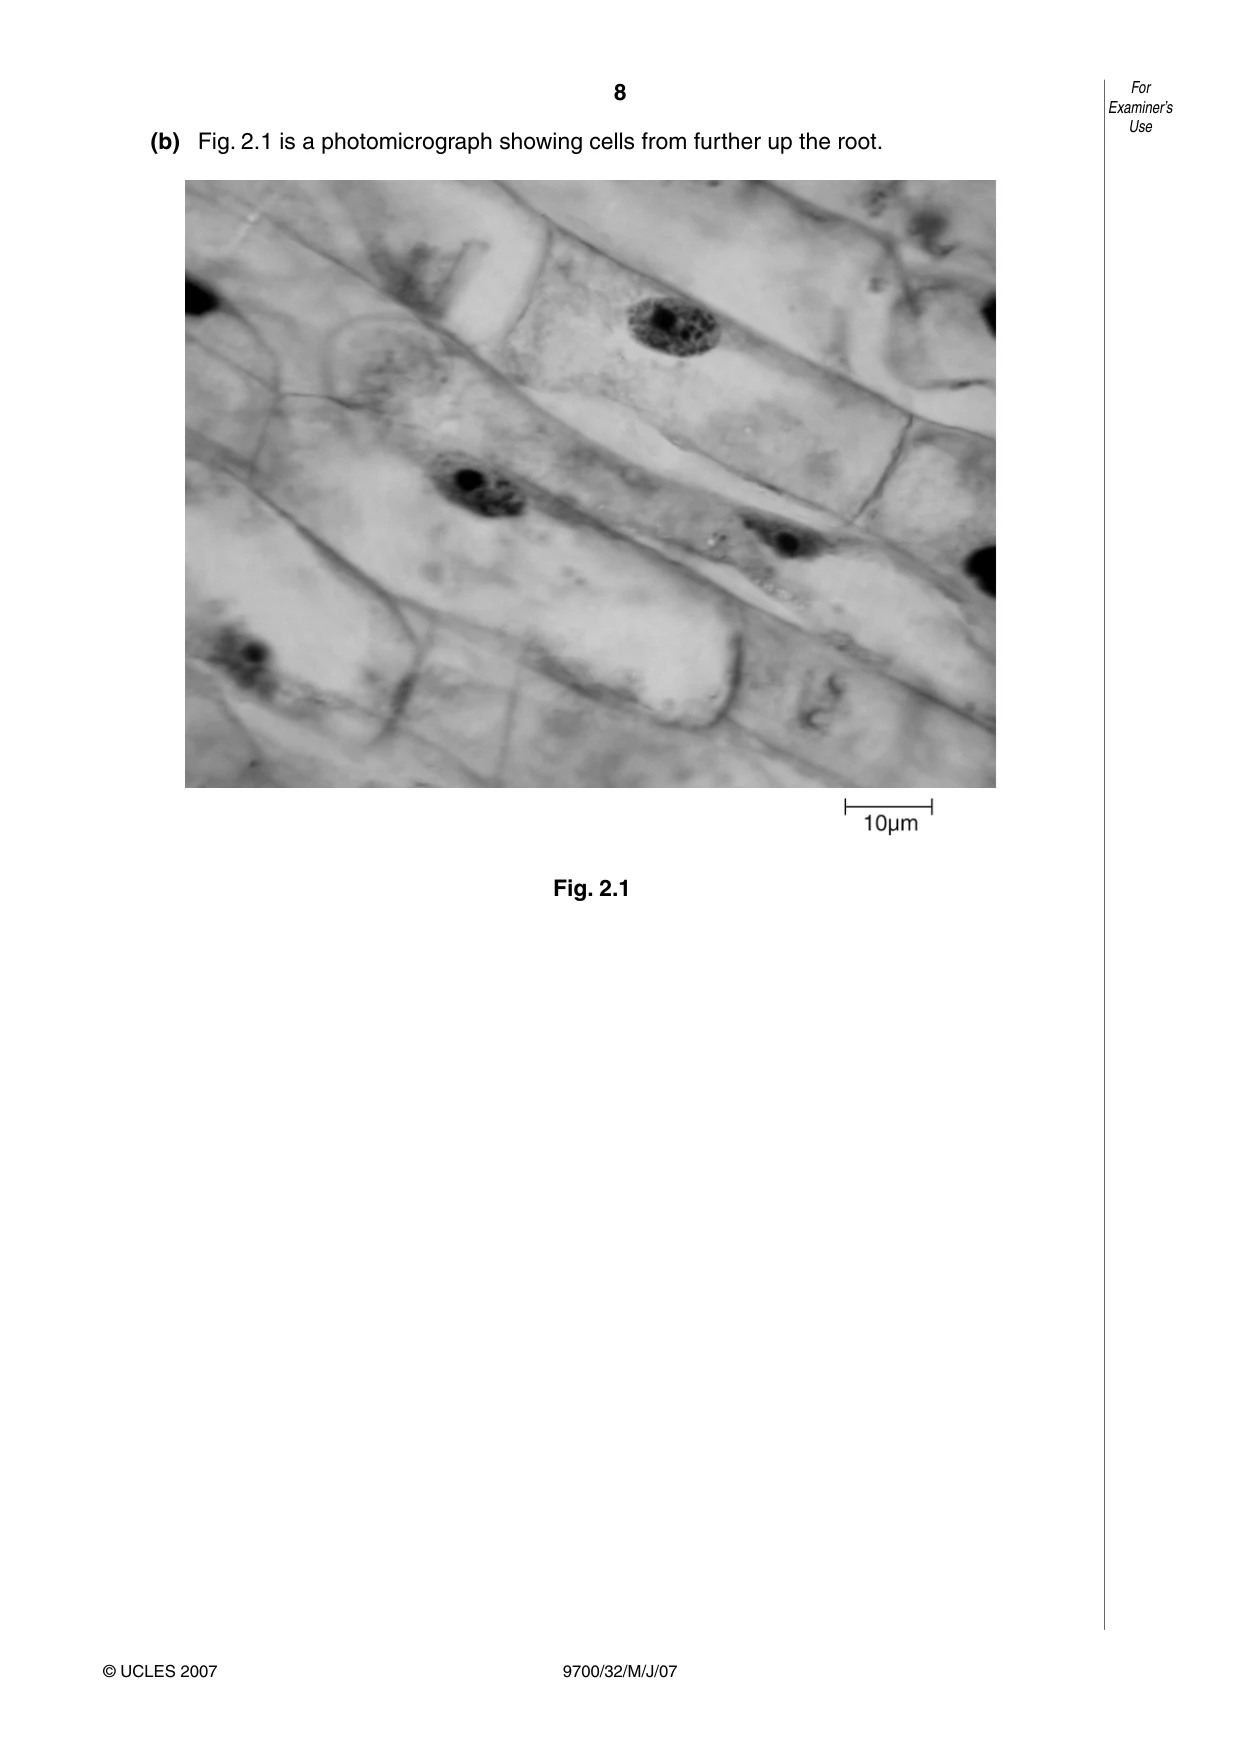
8 9700/32/M/J/07 For Examiner’s Use © UCLES 2007 (b) Fig. 2.1 is a photomicrograph showing cells from further up the root. Fig. 2.1
Question paper, page 9
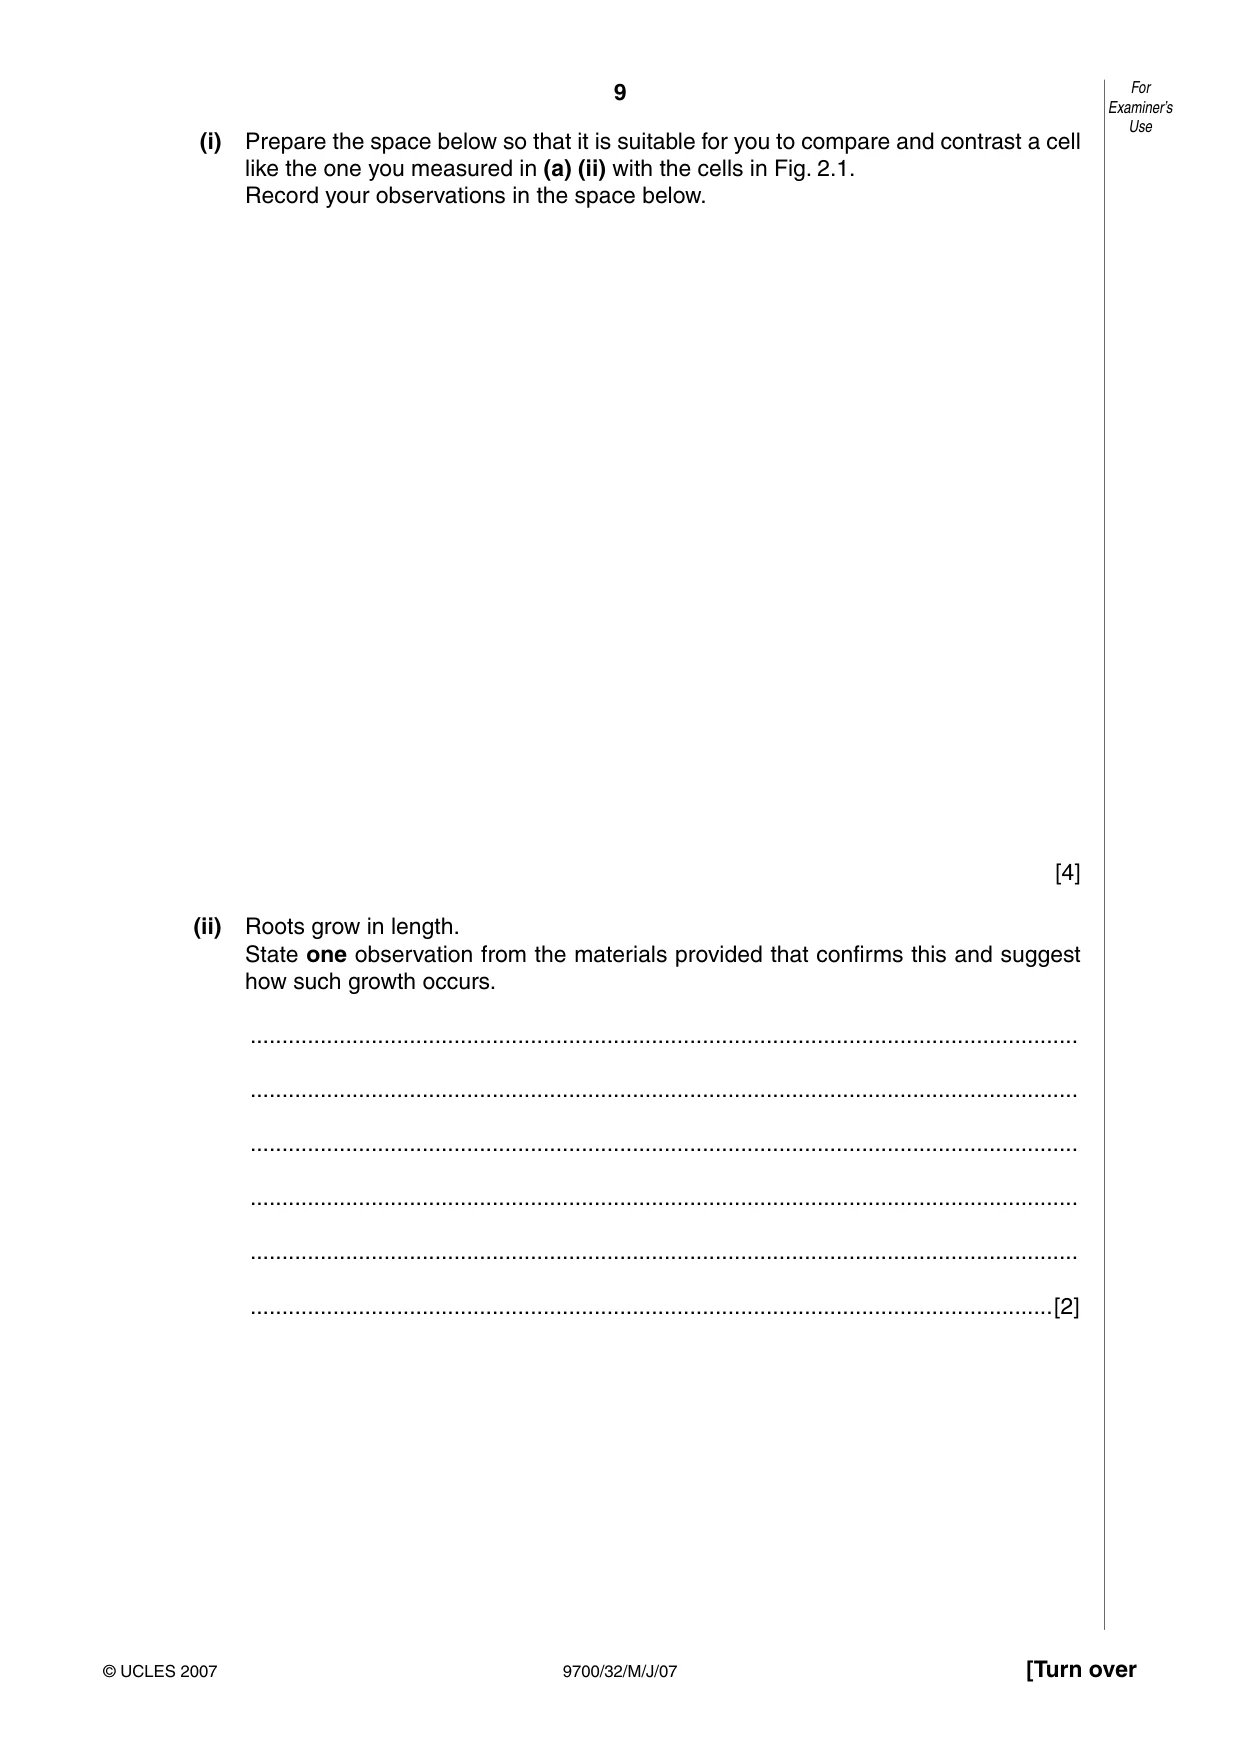
9 9700/32/M/J/07 [Turn over For Examiner’s Use © UCLES 2007 (i) Prepare the space below so that it is suitable for you to compare and contrast a cell like the one you measured in (a) (ii) with the cells in Fig. 2.1. Record your observations in the space below. [4] (ii) Roots grow in length. State one observation from the materials provided that confirms this and suggest how such growth occurs. … … … … … …[2]
Question paper, page 10
10 9700/32/M/J/07 For Examiner’s Use © UCLES 2007 (c) Cells undergoing mitosis can be seen in the specimen on slide R1. In the space below, make a high-power labelled, drawing of two cells showing chromosomes, undergoing different stages of mitosis. [5] [Total : 17] [Paper total : 40]
Question paper, page 12
12 9700/32/M/J/07 BLANK PAGE Permission to reproduce items where third-party owned material protected by copyright is included has been sought and cleared where possible. Every reasonable effort has been made by the publisher (UCLES) to trace copyright holders, but if any items requiring clearance have unwittingly been included, the publisher will be pleased to make amends at the earliest possible opportunity. University of Cambridge International Examinations is part of the Cambridge Assessment Group. Cambridge Assessment is the brand name of University of Cambridge Local Examinations Syndicate (UCLES), which is itself a department of the University of Cambridge.
Mark scheme, page 1
UNIVERSITY OF CAMBRIDGE INTERNATIONAL EXAMINATIONS GCE Advanced Subsidiary Level and GCE Advanced Level MARK SCHEME for the May/June 2007 question paper 9700 BIOLOGY 9700/32 Paper 32 (Advanced Practical Skills 2), maximum raw mark 40 This mark scheme is published as an aid to teachers and candidates, to indicate the requirements of the examination. It shows the basis on which Examiners were instructed to award marks. It does not indicate the details of the discussions that took place at an Examiners’ meeting before marking began. All Examiners are instructed that alternative correct answers and unexpected approaches in candidates’ scripts must be given marks that fairly reflect the relevant knowledge and skills demonstrated. Mark schemes must be read in conjunction with the question papers and the report on the examination. • CIE will not enter into discussions or correspondence in connection with these mark schemes. CIE is publishing the mark schemes for the May/June 2007 question papers for most IGCSE, GCE Advanced Level and Advanced Subsidiary Level syllabuses and some Ordinary Level syllabuses.
Mark scheme, page 2
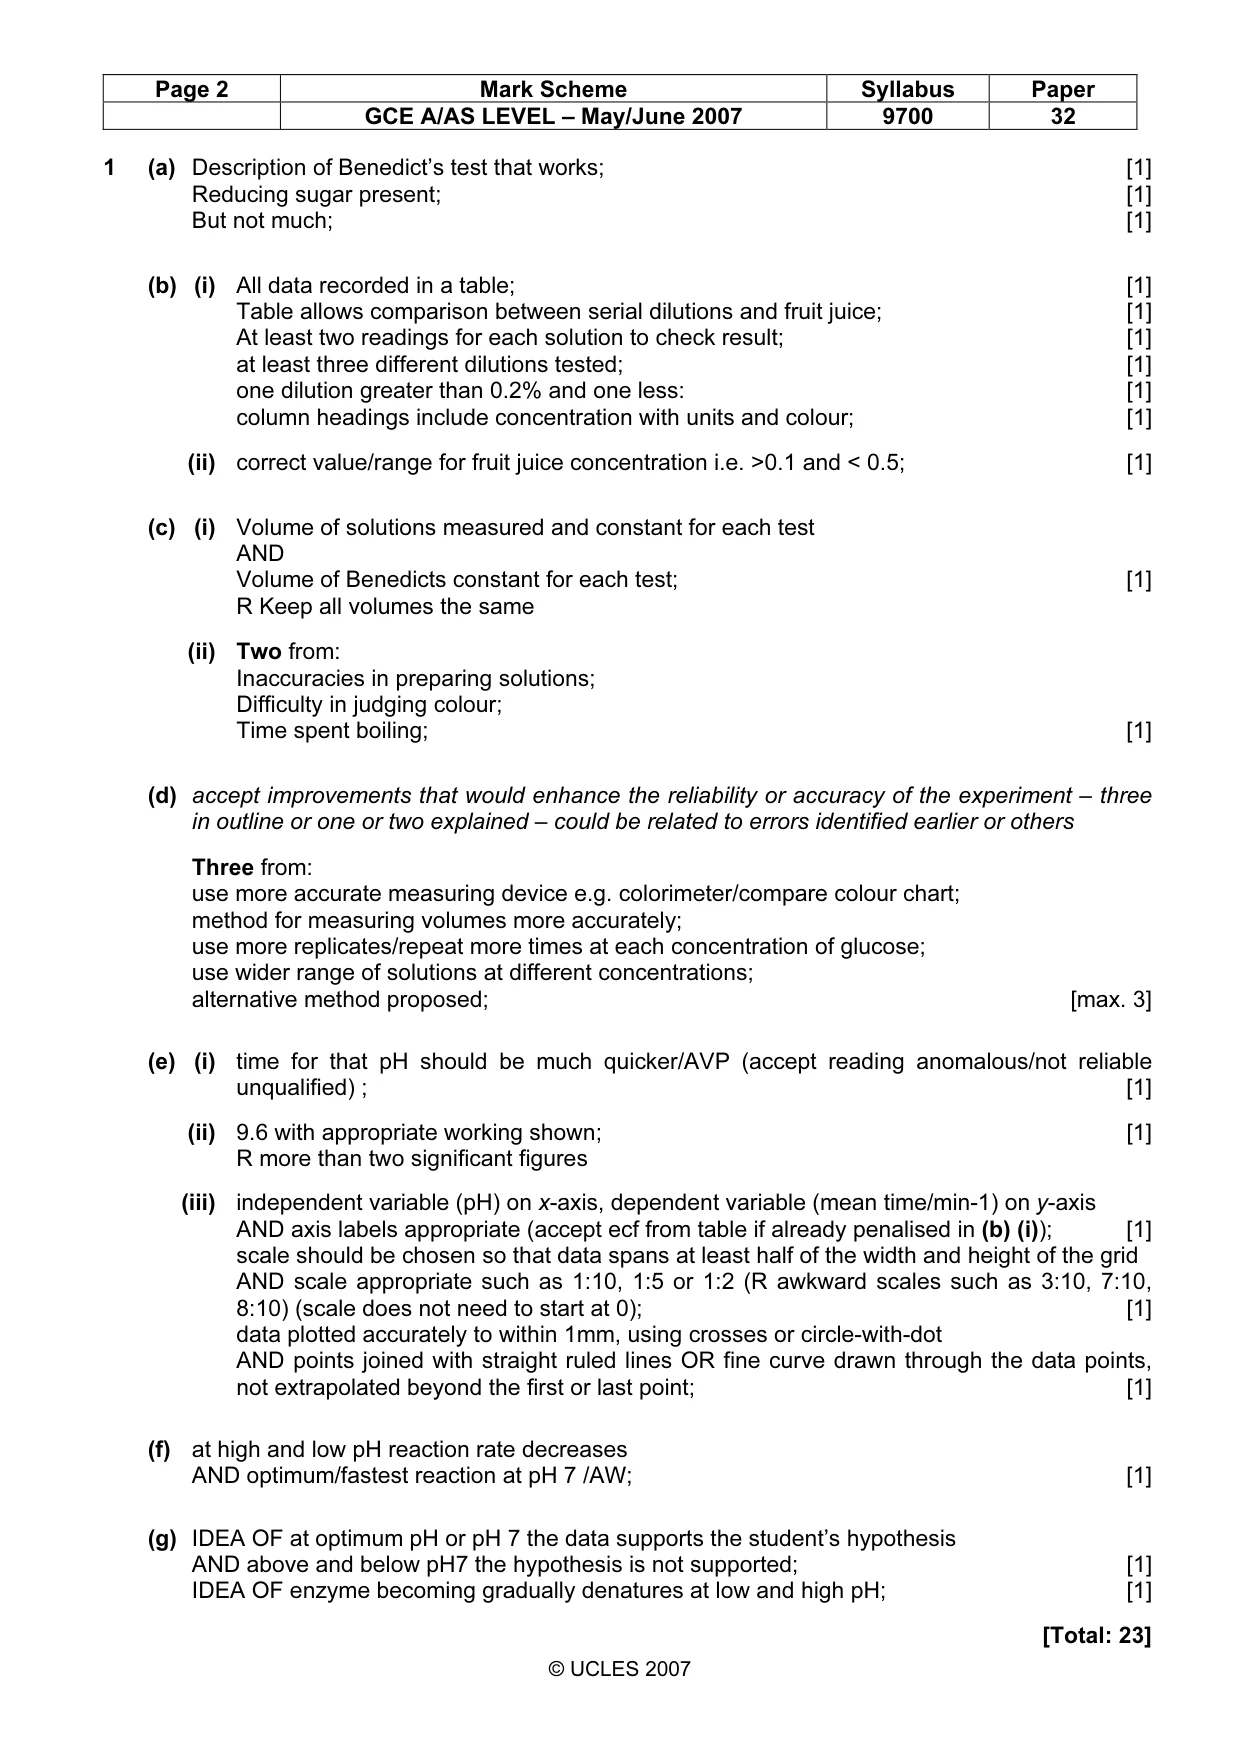
Page 2 Mark Scheme Syllabus Paper GCE A/AS LEVEL – May/June 2007 9700 32 © UCLES 2007 1 (a) Description of Benedict’s test that works; [1] Reducing sugar present; [1] But not much; [1] (b) (i) All data recorded in a table; [1] Table allows comparison between serial dilutions and fruit juice; [1] At least two readings for each solution to check result; [1] at least three different dilutions tested; [1] one dilution greater than 0.2% and one less: [1] column headings include concentration with units and colour; [1] (ii) correct value/range for fruit juice concentration i.e. >0.1 and < 0.5; [1] (c) (i) Volume of solutions measured and constant for each test AND Volume of Benedicts constant for each test; [1] R Keep all volumes the same (ii) Two from: Inaccuracies in preparing solutions; Difficulty in judging colour; Time spent boiling; [1] (d) accept improvements that would enhance the reliability or accuracy of the experiment – three in outline or one or two explained – could be related to errors identified earlier or others Three from: use more accurate measuring device e.g. colorimeter/compare colour chart; method for measuring volumes more accurately; use more replicates/repeat more times at each concentration of glucose; use wider range of solutions at different concentrations; alternative method proposed; [max. 3] (e) (i) time for that pH should be much quicker/AVP (accept reading anomalous/not reliable unqualified) ; [1] (ii) 9.6 with appropriate working shown; [1] R more than two significant figures (iii) independent variable (pH) on x-axis, dependent variable (mean time/min-1) on y-axis AND axis labels appropriate (accept ecf from table if already penalised in (b) (i)); [1] scale should be chosen so that data spans at least half of the width and height of the grid AND scale appropriate such as 1:10, 1:5 or 1:2 (R awkward scales such as 3:10, 7:10, 8:10) (scale does not need to start at 0); [1] data plotted accurately to within 1mm, using crosses or circle-with-dot AND points joined with straight ruled lines OR fine curve drawn through the data points, not extrapolated beyond the first or last point; [1] (f) at high and low pH reaction rate decreases AND optimum/fastest reaction at pH 7 /AW; [1] (g) IDEA OF at optimum pH or pH 7 the data supports the student’s hypothesis AND above and below pH7 the hypothesis is not supported; [1] IDEA OF enzyme becoming gradually denatures at low and high pH; [1] [Total: 23]
Mark scheme, page 3
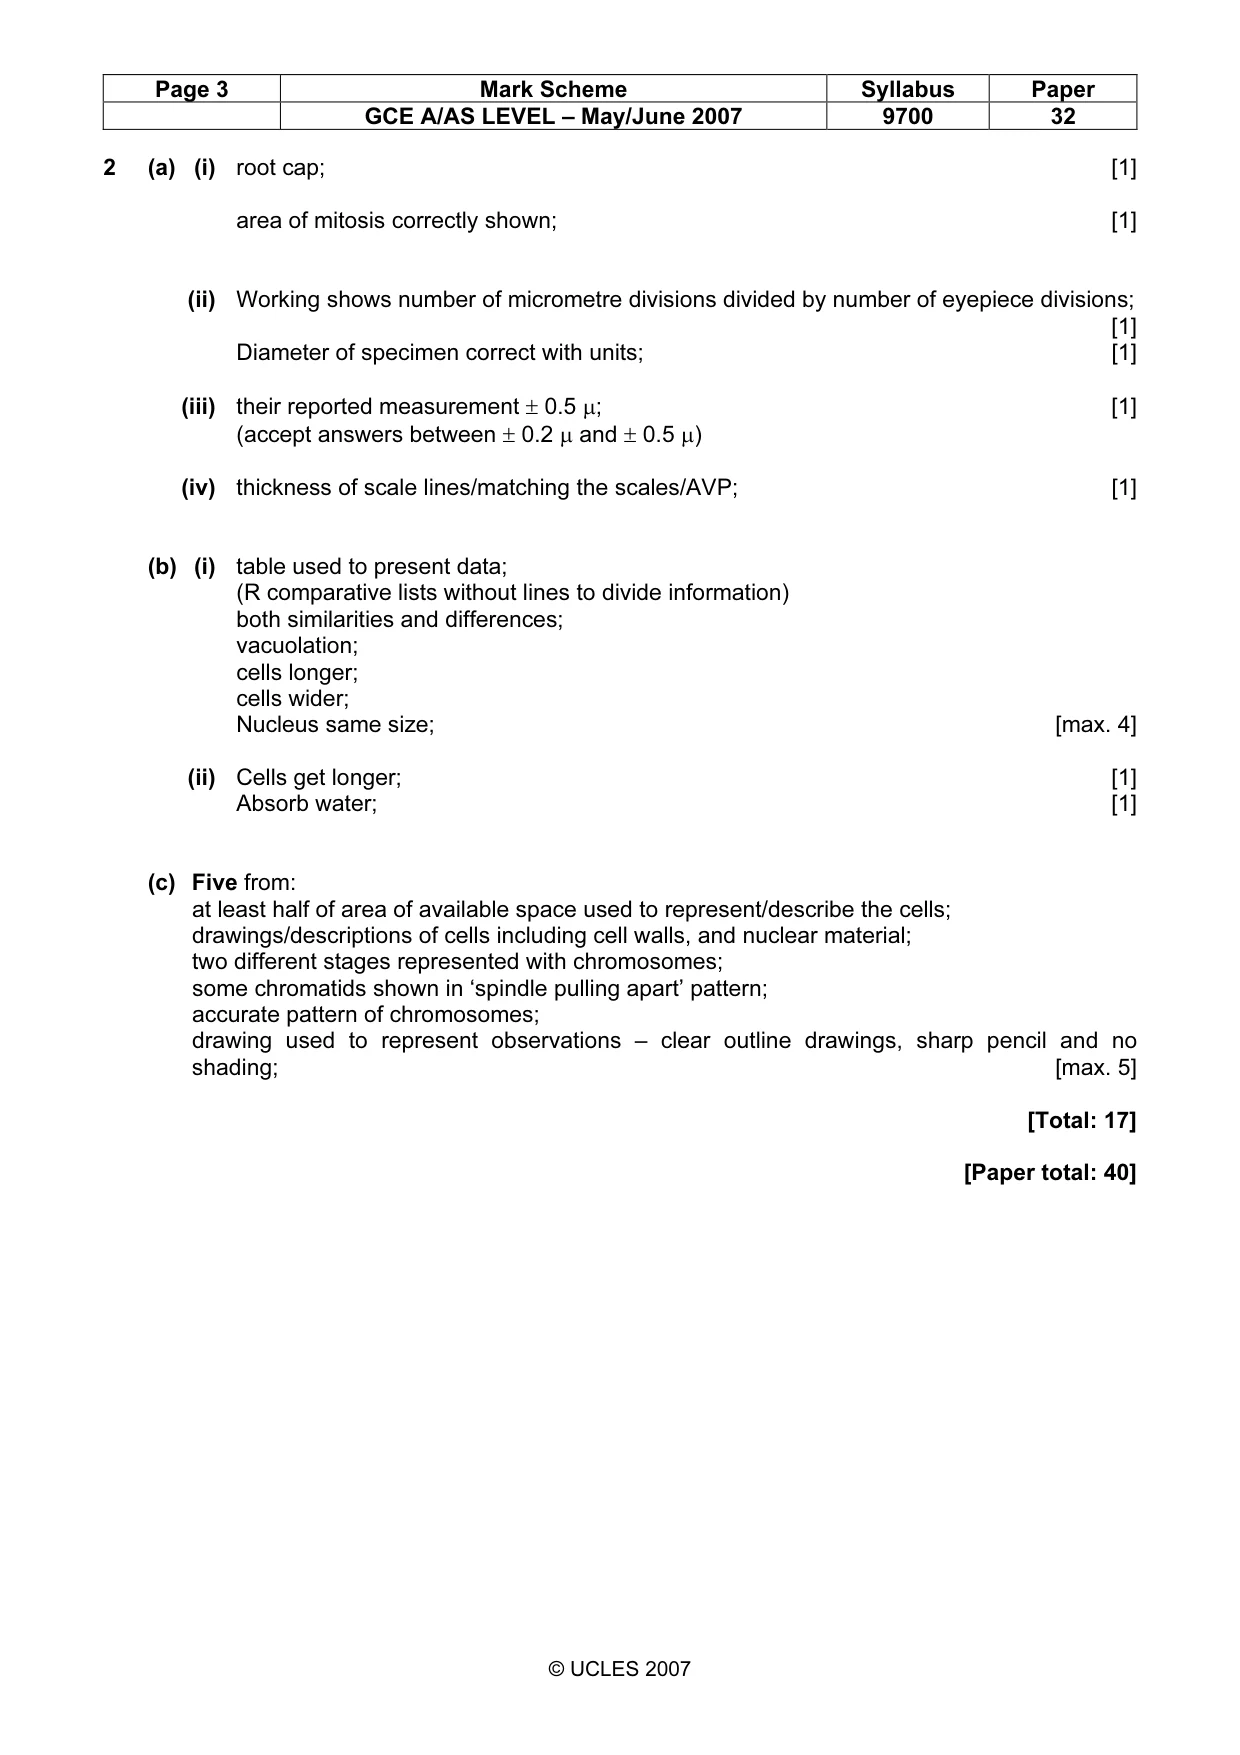
Page 3 Mark Scheme Syllabus Paper GCE A/AS LEVEL – May/June 2007 9700 32 © UCLES 2007 2 (a) (i) root cap; [1] area of mitosis correctly shown; [1] (ii) Working shows number of micrometre divisions divided by number of eyepiece divisions; [1] Diameter of specimen correct with units; [1] (iii) their reported measurement ± 0.5 µ; [1] (accept answers between ± 0.2 µ and ± 0.5 µ) (iv) thickness of scale lines/matching the scales/AVP; [1] (b) (i) table used to present data; (R comparative lists without lines to divide information) both similarities and differences; vacuolation; cells longer; cells wider; Nucleus same size; [max. 4] (ii) Cells get longer; [1] Absorb water; [1] (c) Five from: at least half of area of available space used to represent/describe the cells; drawings/descriptions of cells including cell walls, and nuclear material; two different stages represented with chromosomes; some chromatids shown in ‘spindle pulling apart’ pattern; accurate pattern of chromosomes; drawing used to represent observations – clear outline drawings, sharp pencil and no shading; [max. 5] [Total: 17] [Paper total: 40]
What you needed in this session
Cambridge’s own grade thresholds for 2007 May/June, Paper 3 · Variant 2. A higher threshold means an easier paper — the bar moves with how the cohort did.