Cambridge IGCSE Sciences - Co-ordinated (Double) 0654 — 2022 May/June Paper 5 · Variant 3
0654/53/M/J/22 · 6 questions · 60 marks · ≈68 min
The question paper and its mark scheme, free to read here and free to download. This is Cambridge’s own paper, exactly as it was sat.
Question paper20 pages





Mark scheme12 pages
Answers below. Sit the paper first if you are practising.
Questions as text
Q1 · Catalase is an enzyme found in living cells such as celery cells
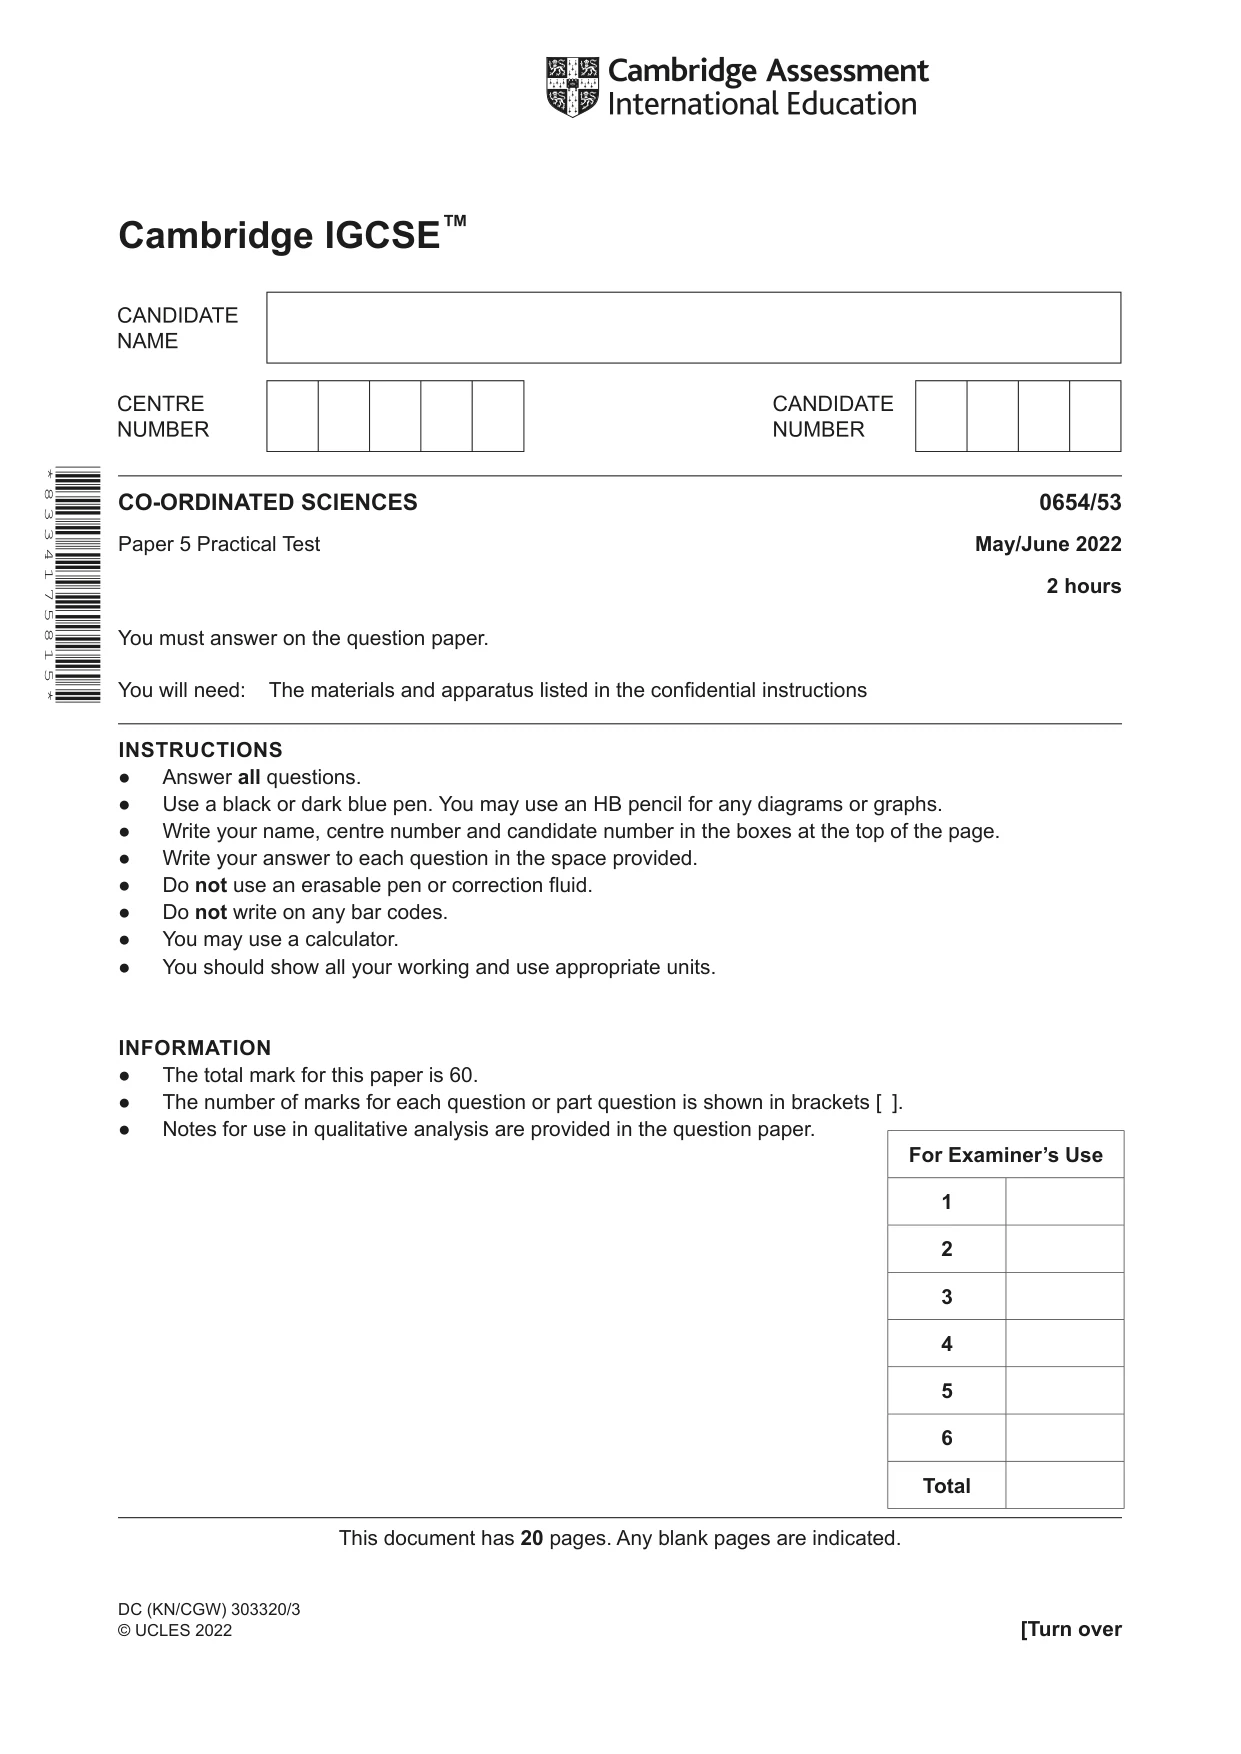
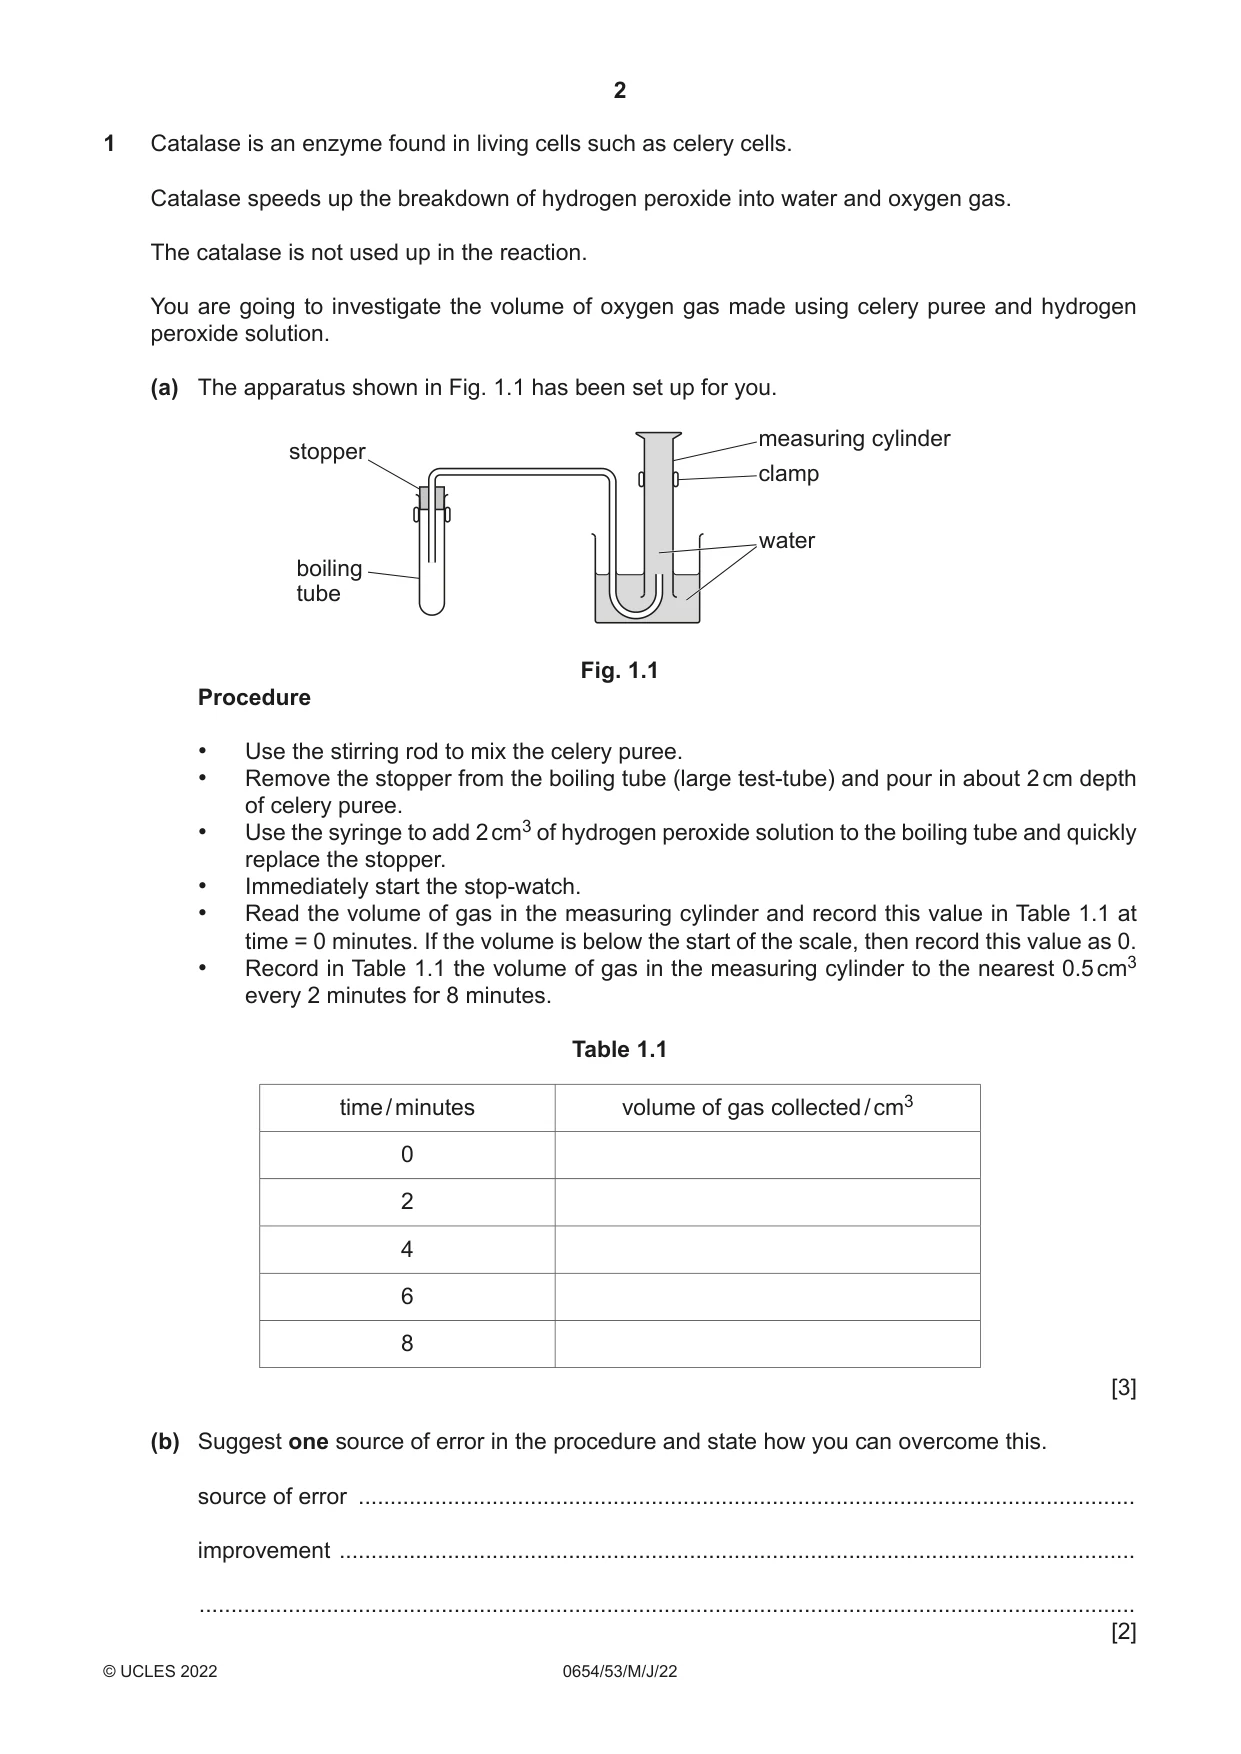
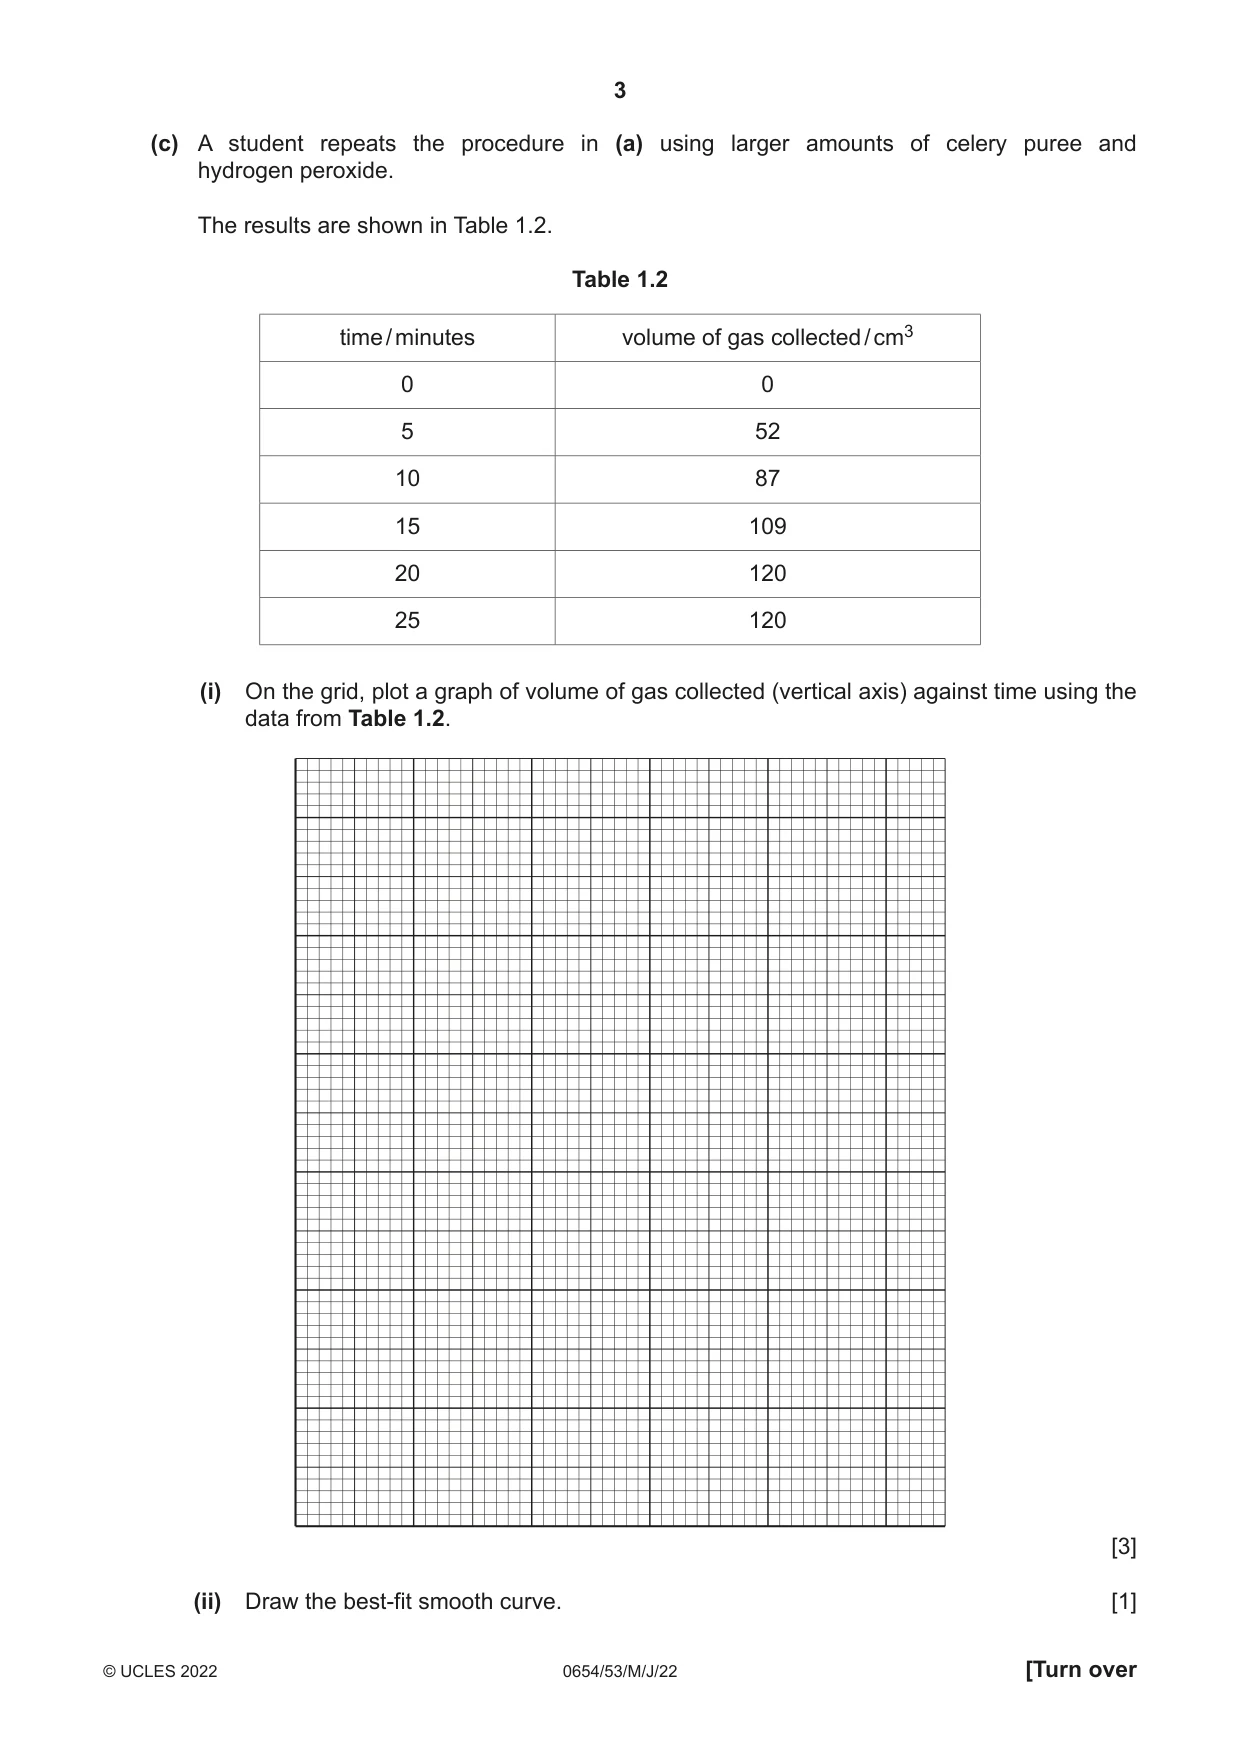
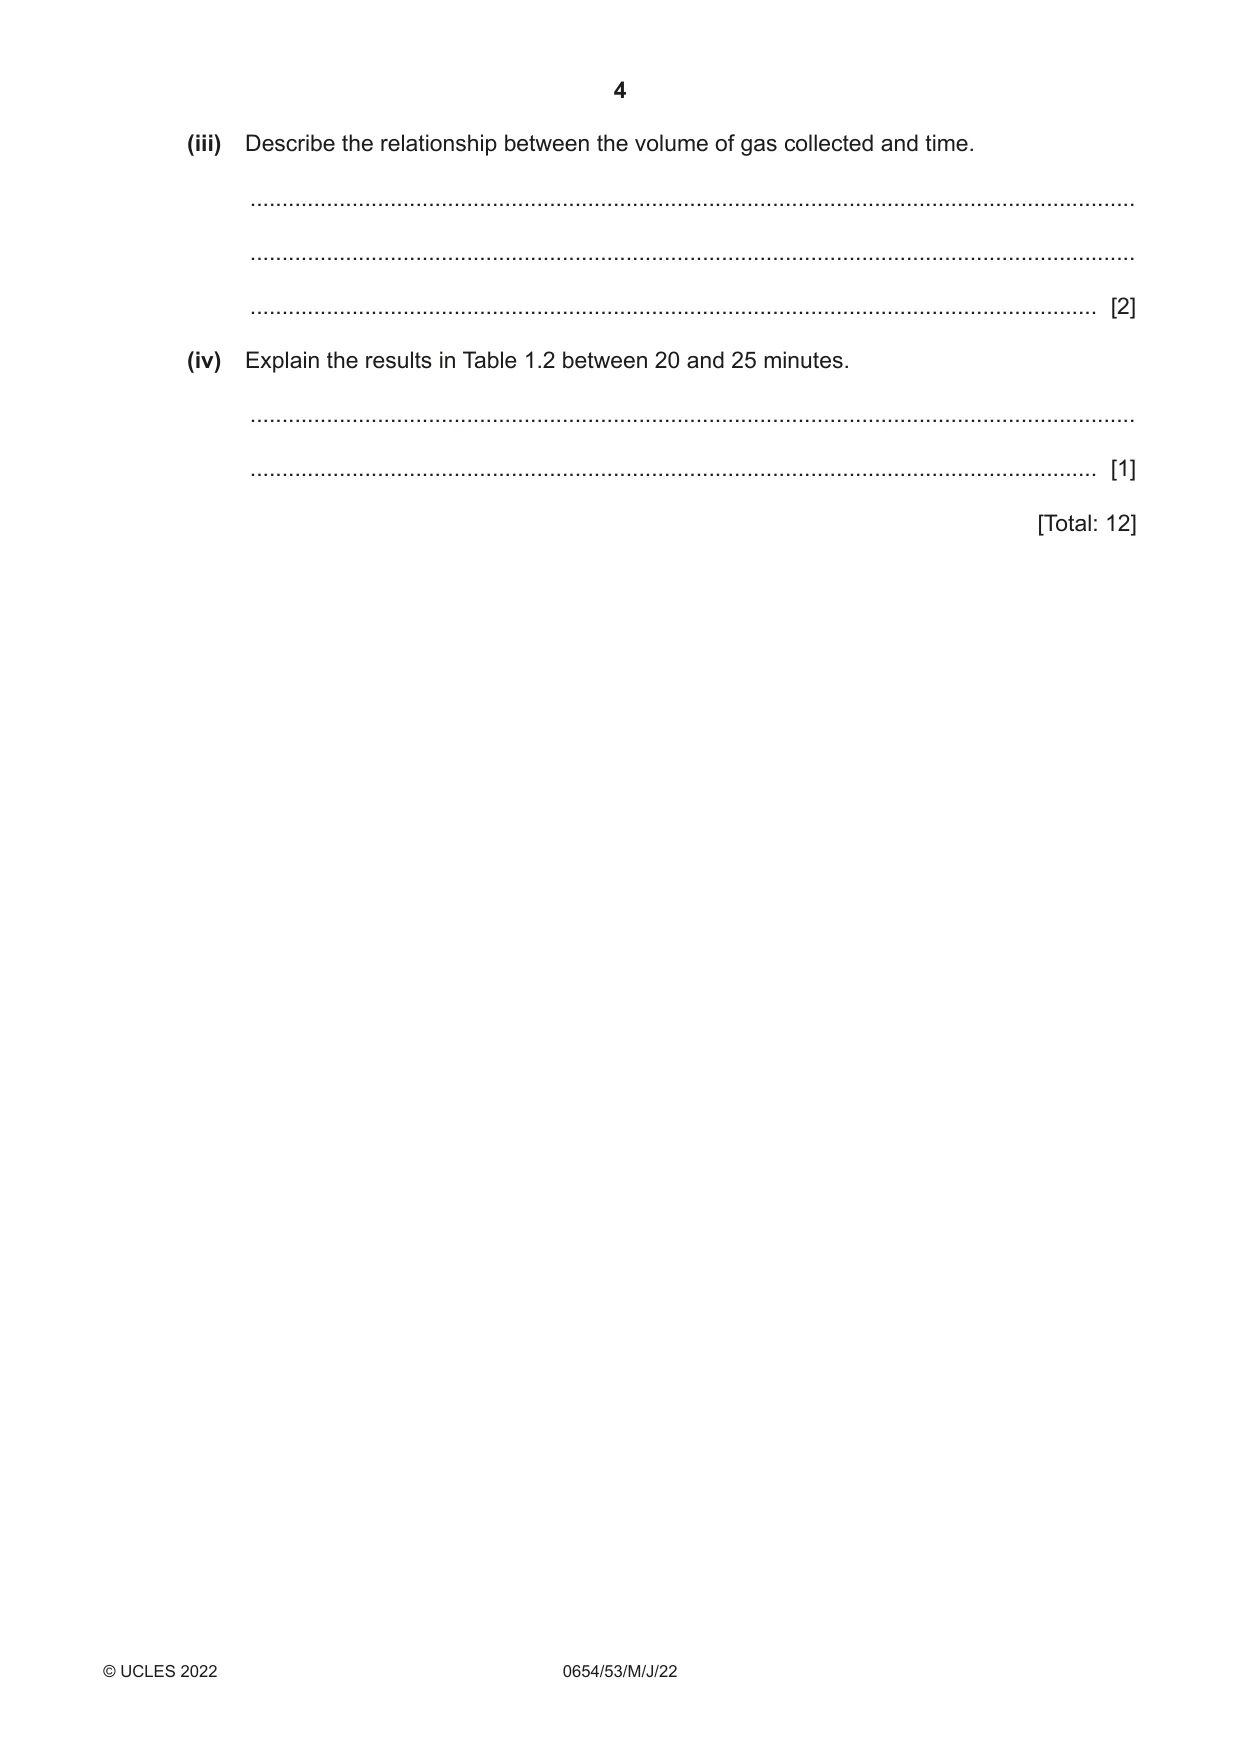
1 Catalase is an enzyme found in living cells such as celery cells. Catalase speeds up the breakdown of hydrogen peroxide into water and oxygen gas. The catalase is not used up in the reaction. You are going to investigate the volume of oxygen gas made using celery puree and hydrogen peroxide solution. (a) The apparatus shown in Fig. 1.1 has been set up for you. measuring cylinder stopper clamp water boiling tube Fig. 1.1 Procedure • Use the stirring rod to mix the celery puree. • Remove the stopper from the boiling tube (large test-tube) and pour in about 2 cm depth of celery puree. • Use the syringe to add 2 cm3 of hydrogen peroxide solution to the boiling tube and quickly replace the stopper. • Immediately start the stop-watch. • Read the volume of gas in the measuring cylinder and record this value in Table 1.1 at time = 0 minutes. If the volume is below the start of the scale, then record this value as 0. • Record in Table 1.1 the volume of gas in the measuring cylinder to the nearest 0.5 cm3 every 2 minutes for 8 minutes. Table 1.1 time / minutes volume of gas collected / cm3 0 2 4 6 8 [3] (b) Suggest one source of error in the procedure and state how you can overcome this. source of error .......................................................................................................................... improvement ............................................................................................................................. ................................................................................................................................................... [2] (c) A student repeats the procedure in (a) using larger amounts of celery puree and hydrogen peroxide. The results are shown in Table 1.2. Table 1.2 time / minutes volume of gas collected / cm3 0 0 5 52 10 87 15 109 20 120 25 120 (i) On the grid, plot a graph of volume of gas collected (vertical axis) against time using the data from Table 1.2. [3] (ii) Draw the best-fit smooth curve. [1] (iii) Describe the relationship between the volume of gas collected and time. ........................................................................................................................................... ........................................................................................................................................... ..................................................................................................................................... [2] (iv) Explain the results in Table 1.2 between 20 and 25 minutes. ........................................................................................................................................... ..................................................................................................................................... [1] [Total: 12]
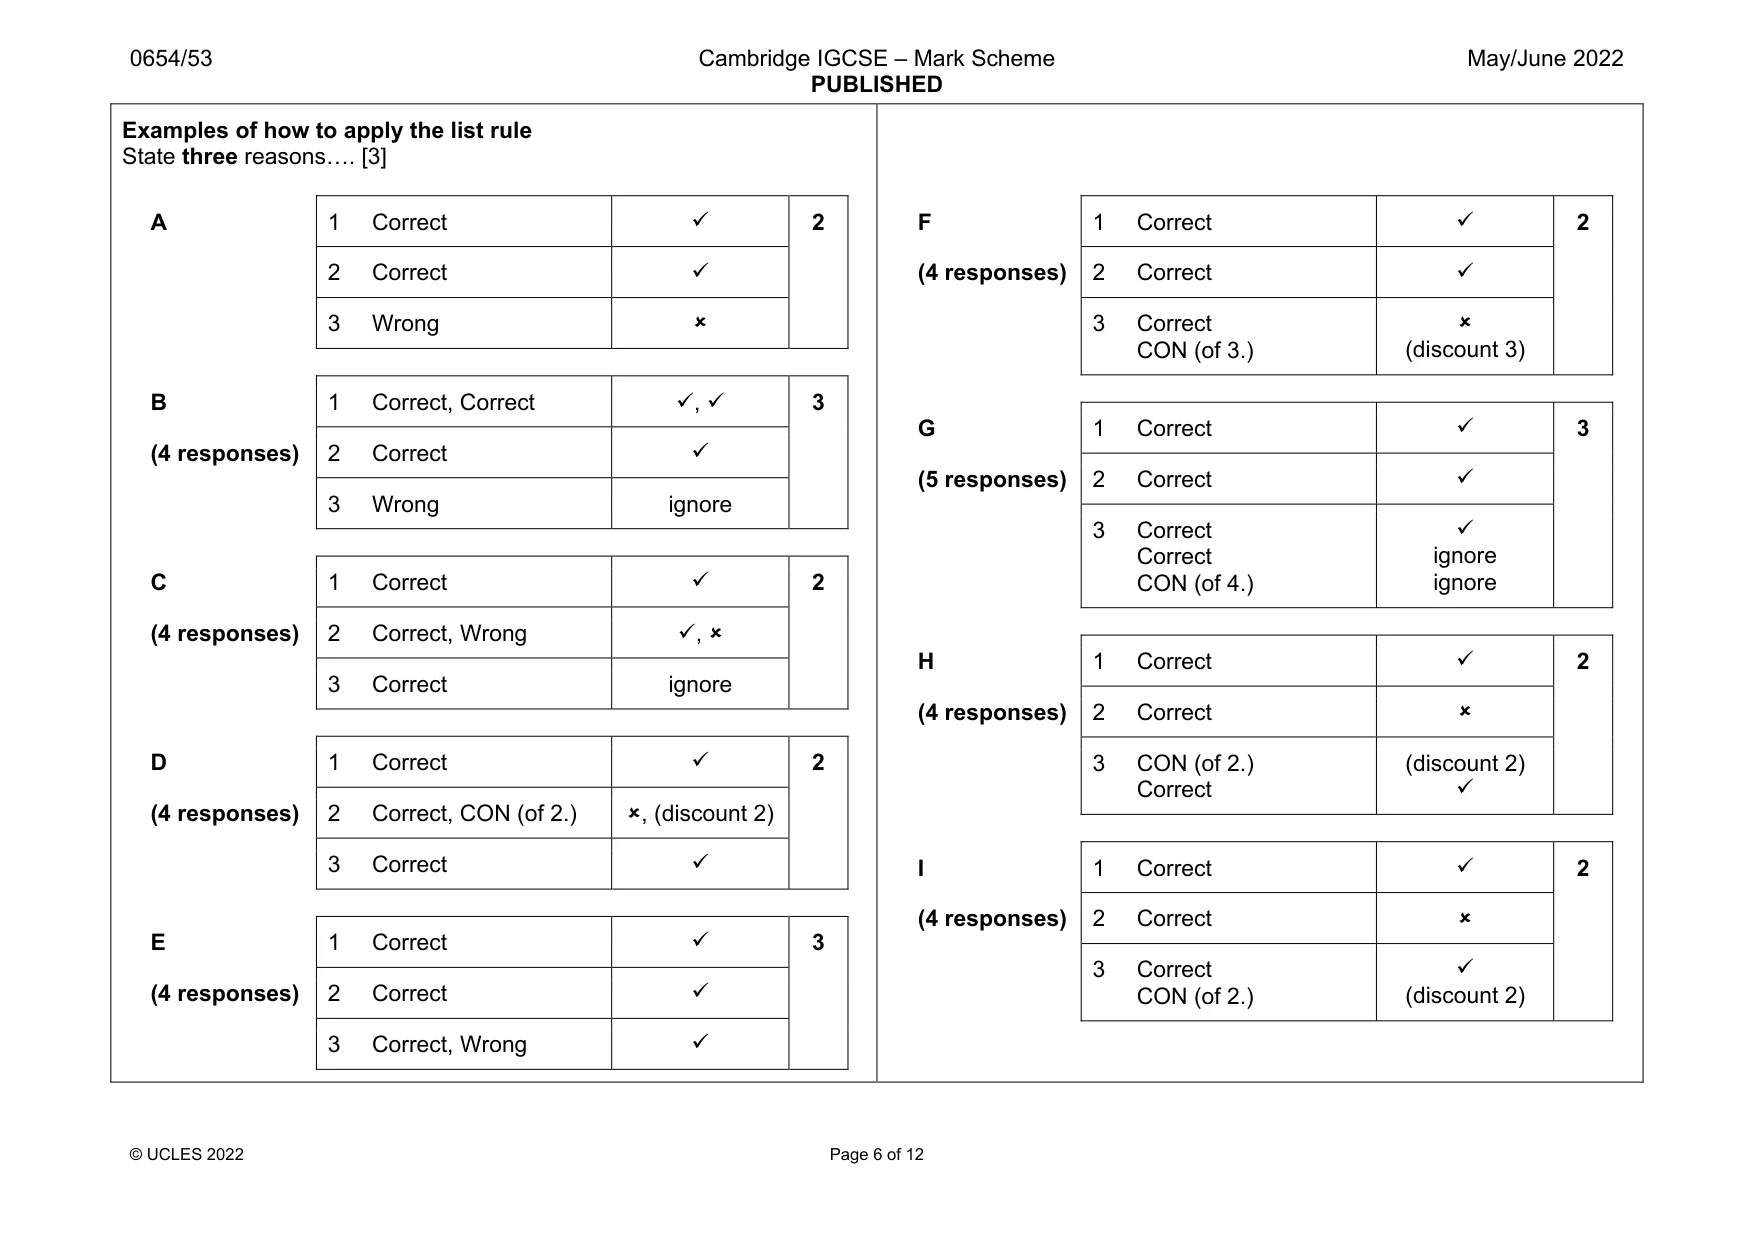
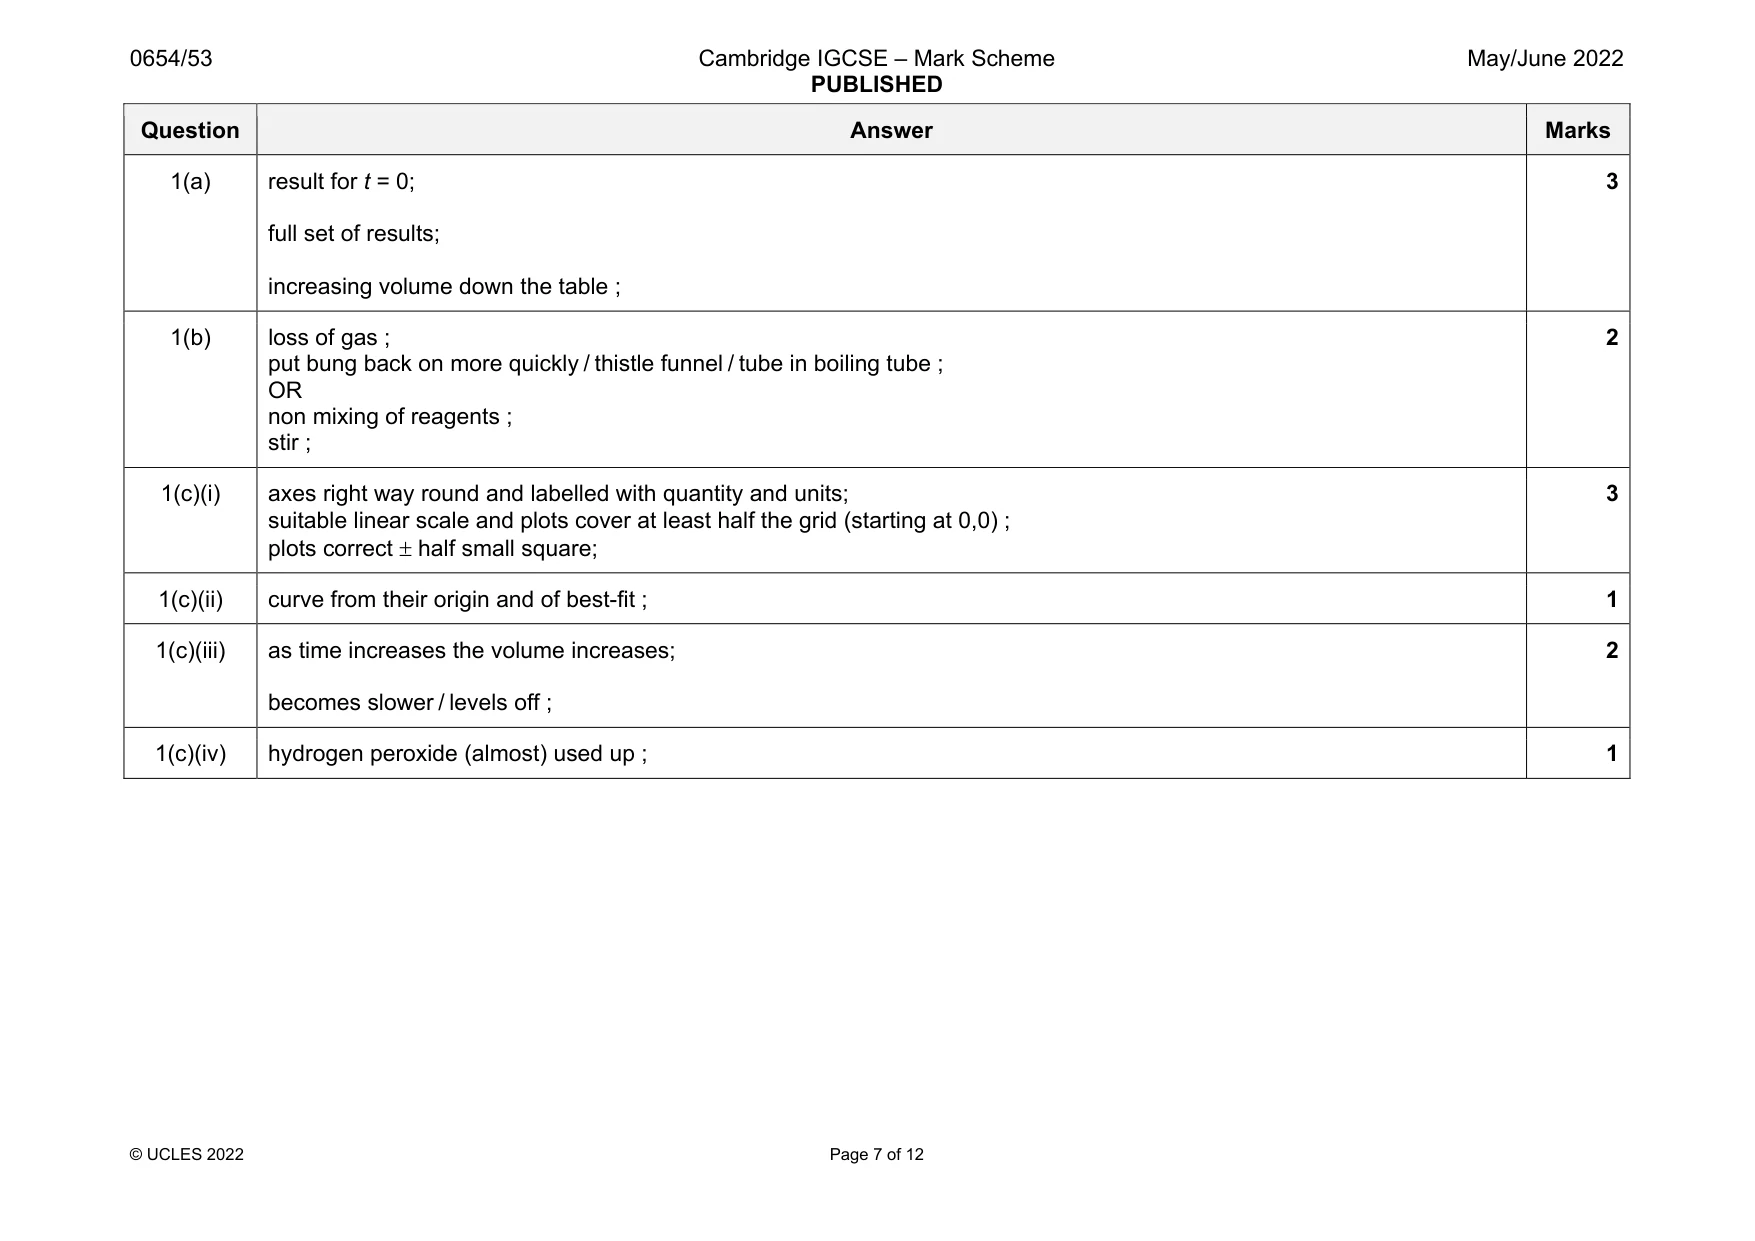
Mark scheme: 1(a) result for t = 0; full set of results; increasing volume down the table ; 3 1(b) loss of gas ; put bung back on more quickly / thistle funnel / tube in boiling tube ; OR non mixing of reagents ; stir ; 2 1(c)(i) axes right way round and labelled with quantity and units; suitable linear scale and plots cover at least half the grid (starting at 0,0) ; plots correct half small square; 3 1(c)(ii) curve from their origin and of best-fit ; 1 1(c)(iii) as time increases the volume increases; becomes slower / levels off ; 2 1(c)(iv) hydrogen peroxide (almost) used up ; 1
Q2 · You are going to investigate the nutrient content of celery and potato
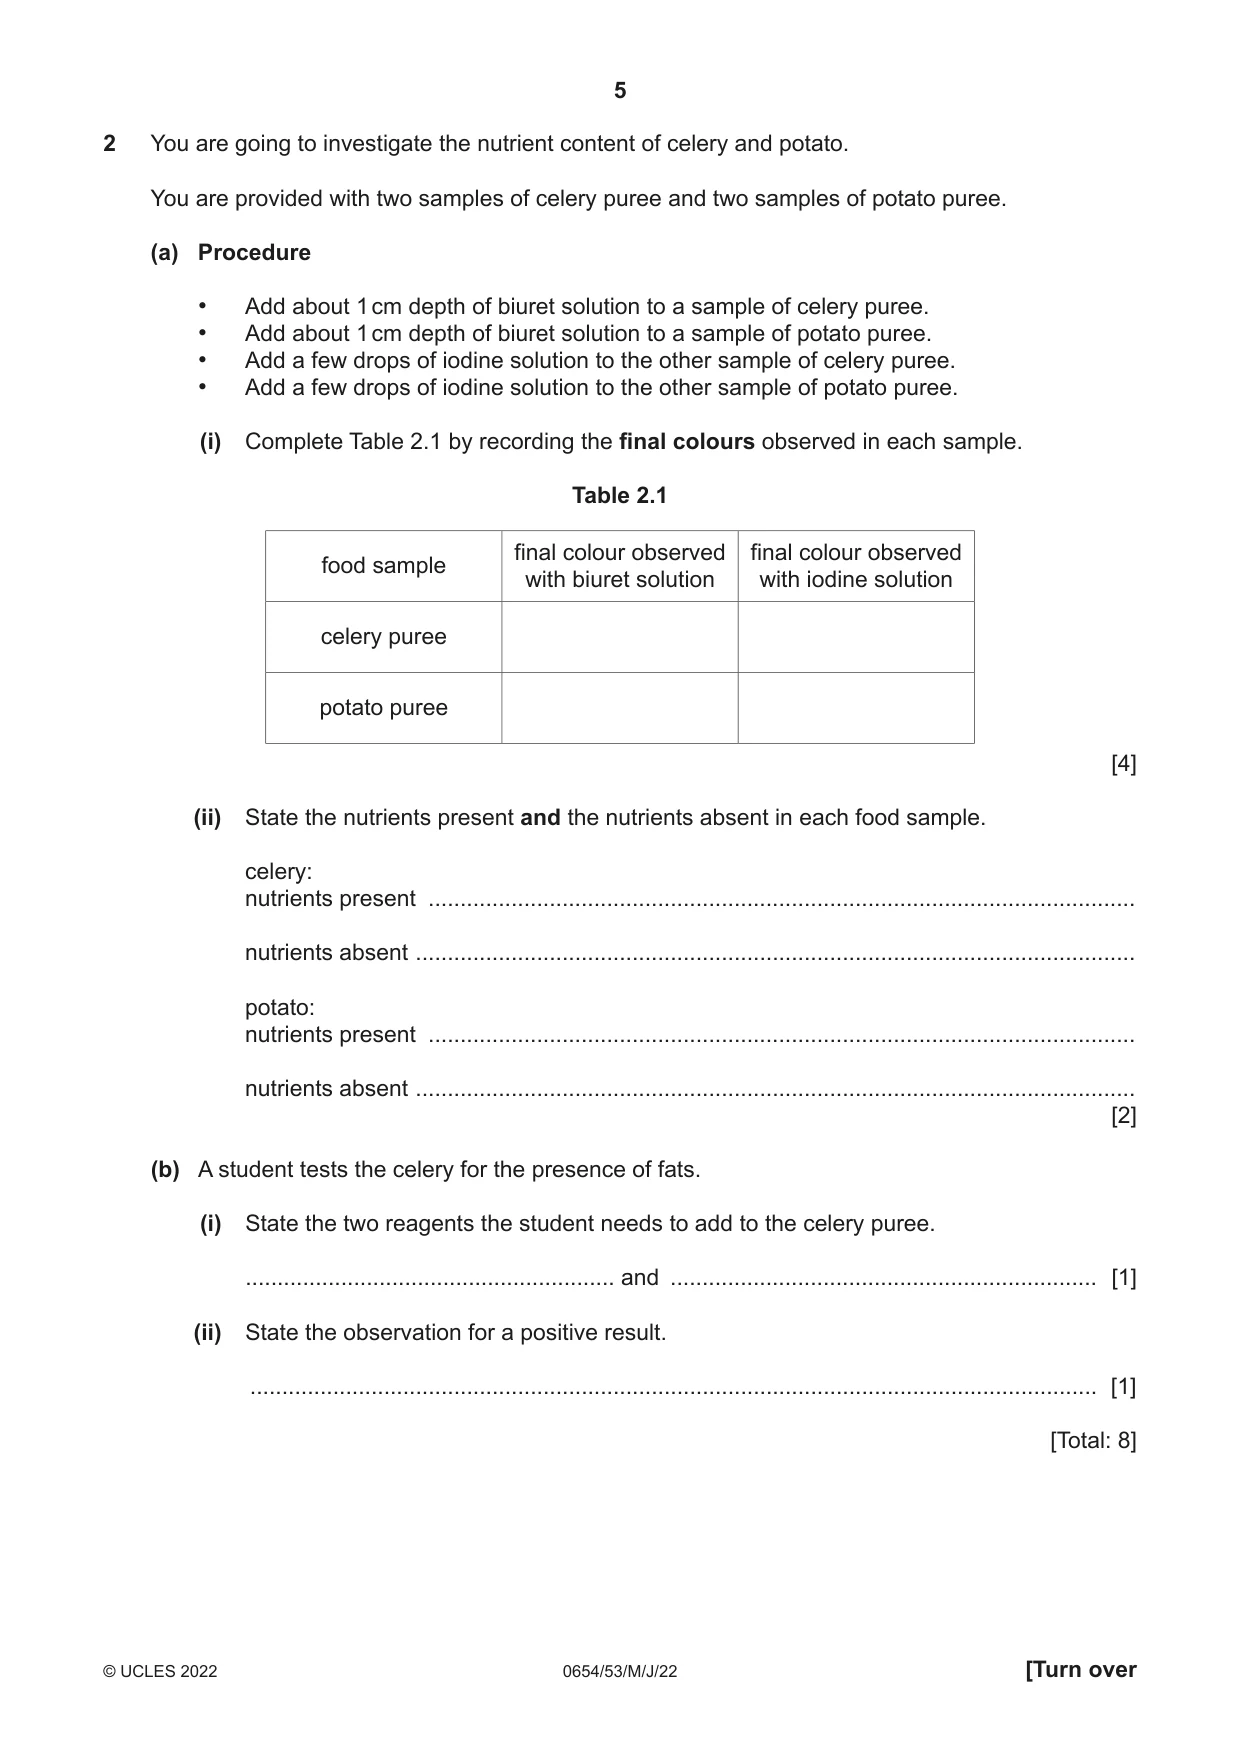
2 You are going to investigate the nutrient content of celery and potato. You are provided with two samples of celery puree and two samples of potato puree. (a) Procedure • Add about 1 cm depth of biuret solution to a sample of celery puree. • Add about 1 cm depth of biuret solution to a sample of potato puree. • Add a few drops of iodine solution to the other sample of celery puree. • Add a few drops of iodine solution to the other sample of potato puree. (i) Complete Table 2.1 by recording the final colours observed in each sample. Table 2.1 final colour observed final colour observed food sample with biuret solution with iodine solution celery puree potato puree [4] (ii) State the nutrients present and the nutrients absent in each food sample. celery: nutrients present ............................................................................................................... nutrients absent ................................................................................................................. potato: nutrients present ............................................................................................................... nutrients absent ................................................................................................................. [2] (b) A student tests the celery for the presence of fats. (i) State the two reagents the student needs to add to the celery puree. .......................................................... and ................................................................... [1] (ii) State the observation for a positive result. ..................................................................................................................................... [1] [Total: 8]
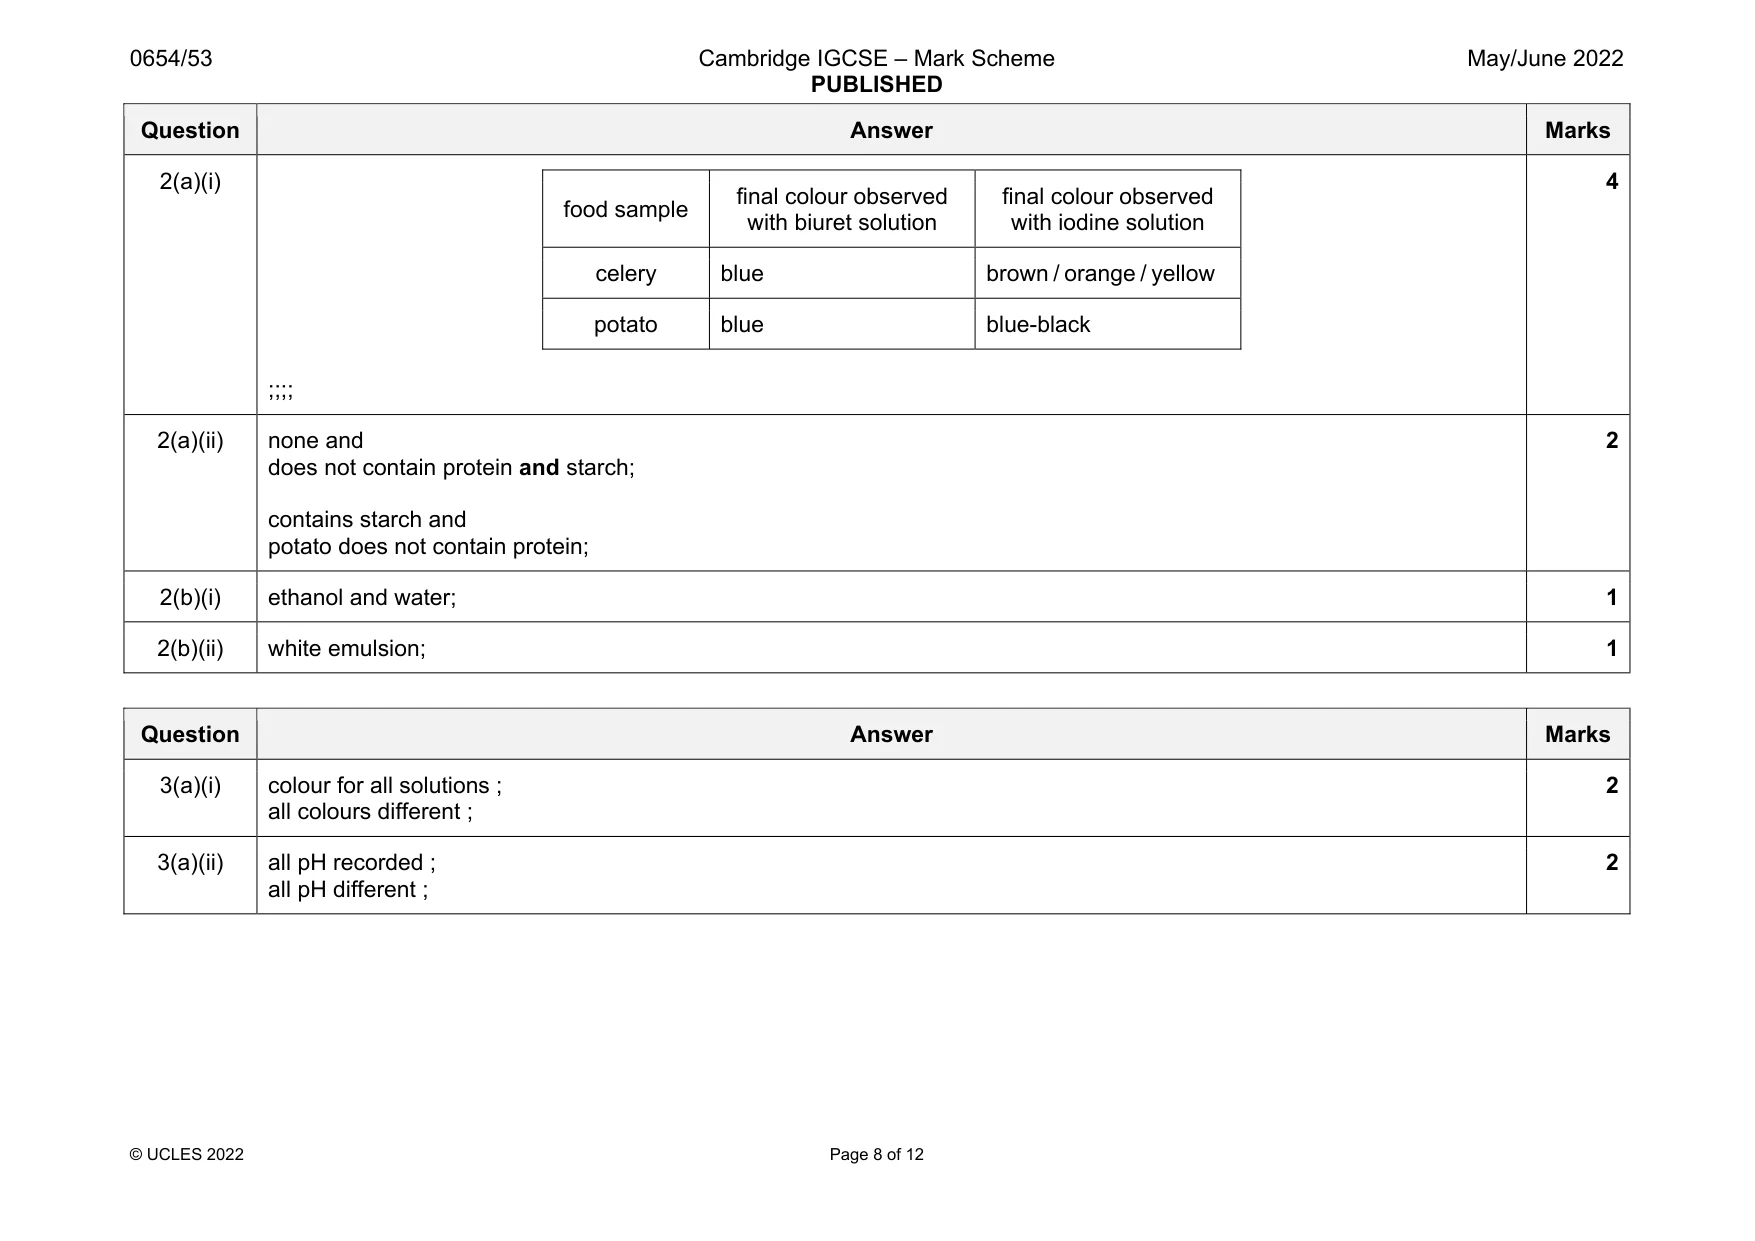
Mark scheme: 2(a)(i) food sample final colour observed with biuret solution final colour observed with iodine solution celery blue brown / orange / yellow potato blue blue-black ;;;; 4 2(a)(ii) none and does not contain protein and starch; contains starch and potato does not contain protein; 2 2(b)(i) ethanol and water; 1 2(b)(ii) white emulsion; 1
Q3 · You are going to investigate the pH of several solutions and their reactivity with sodium…
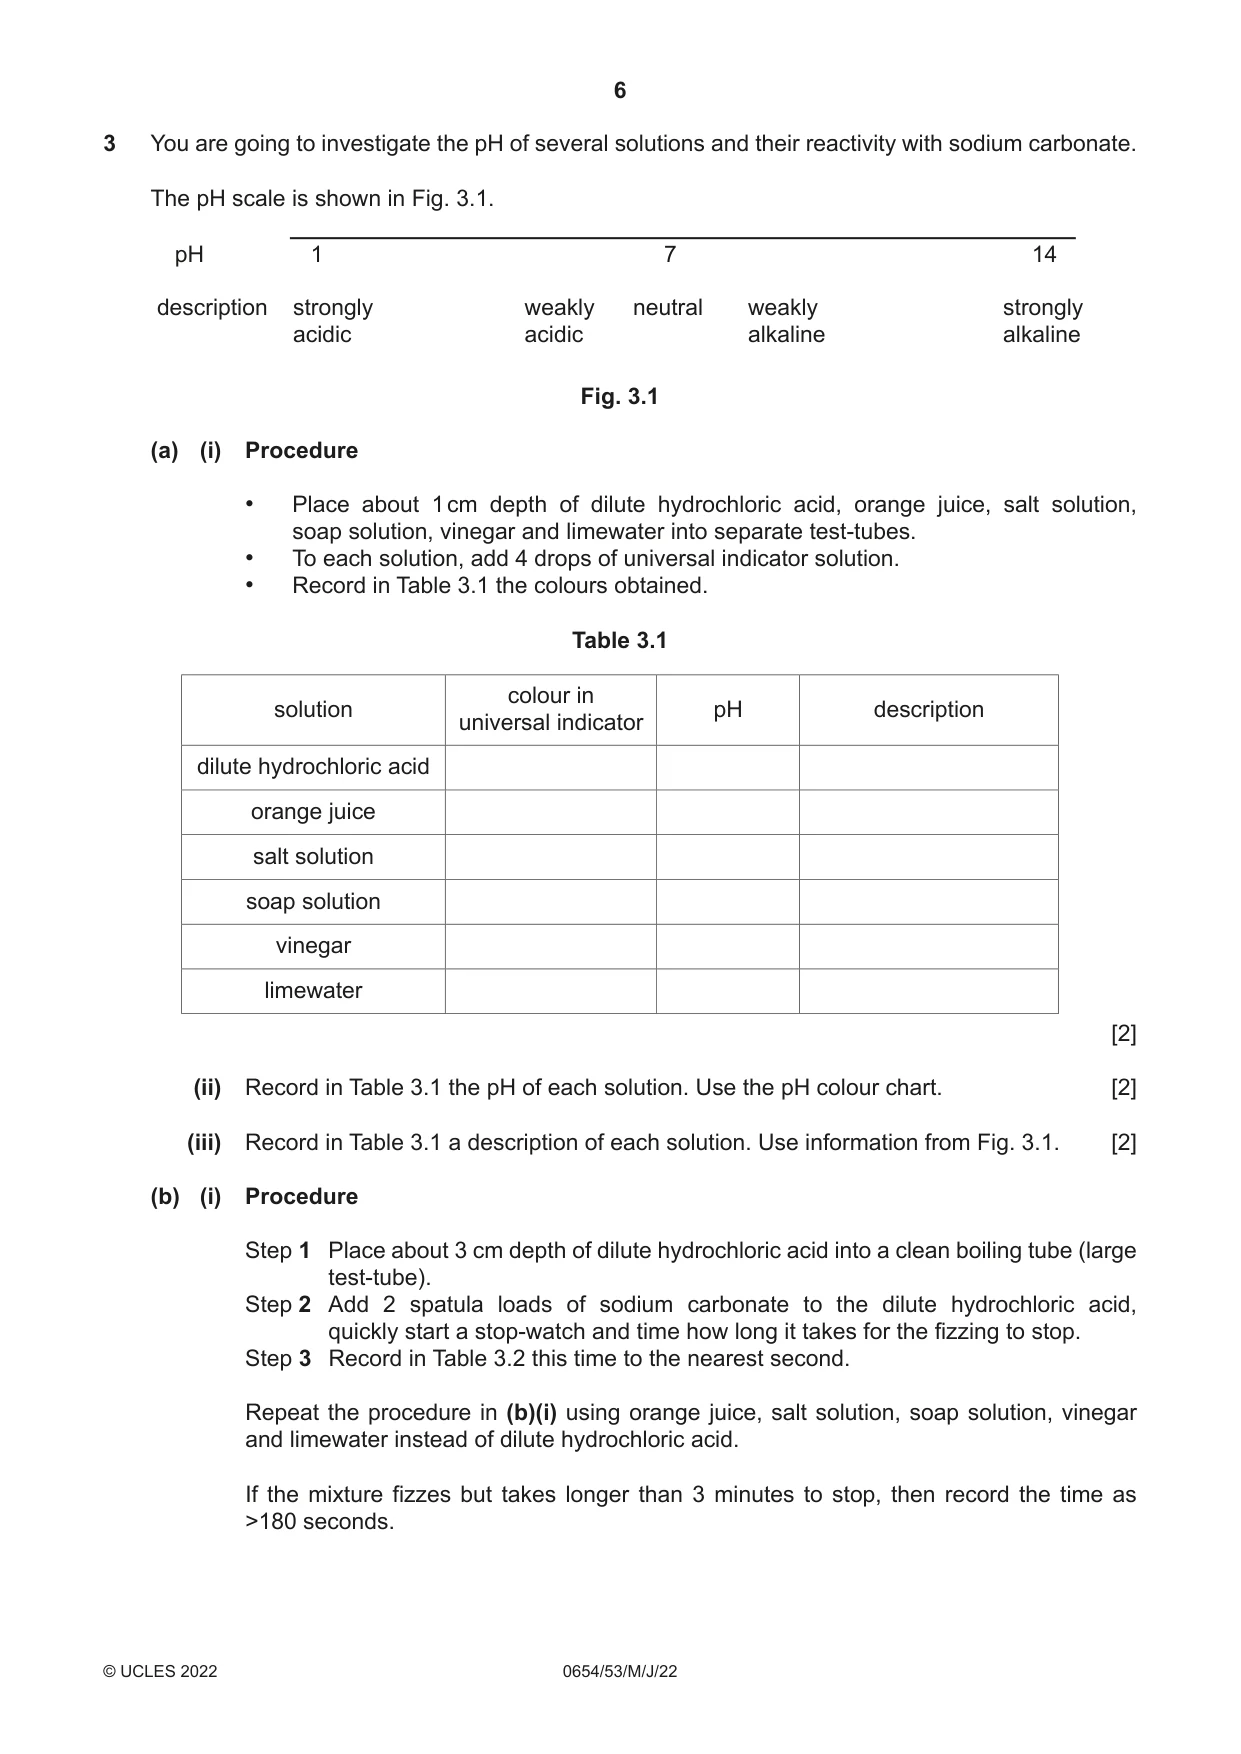
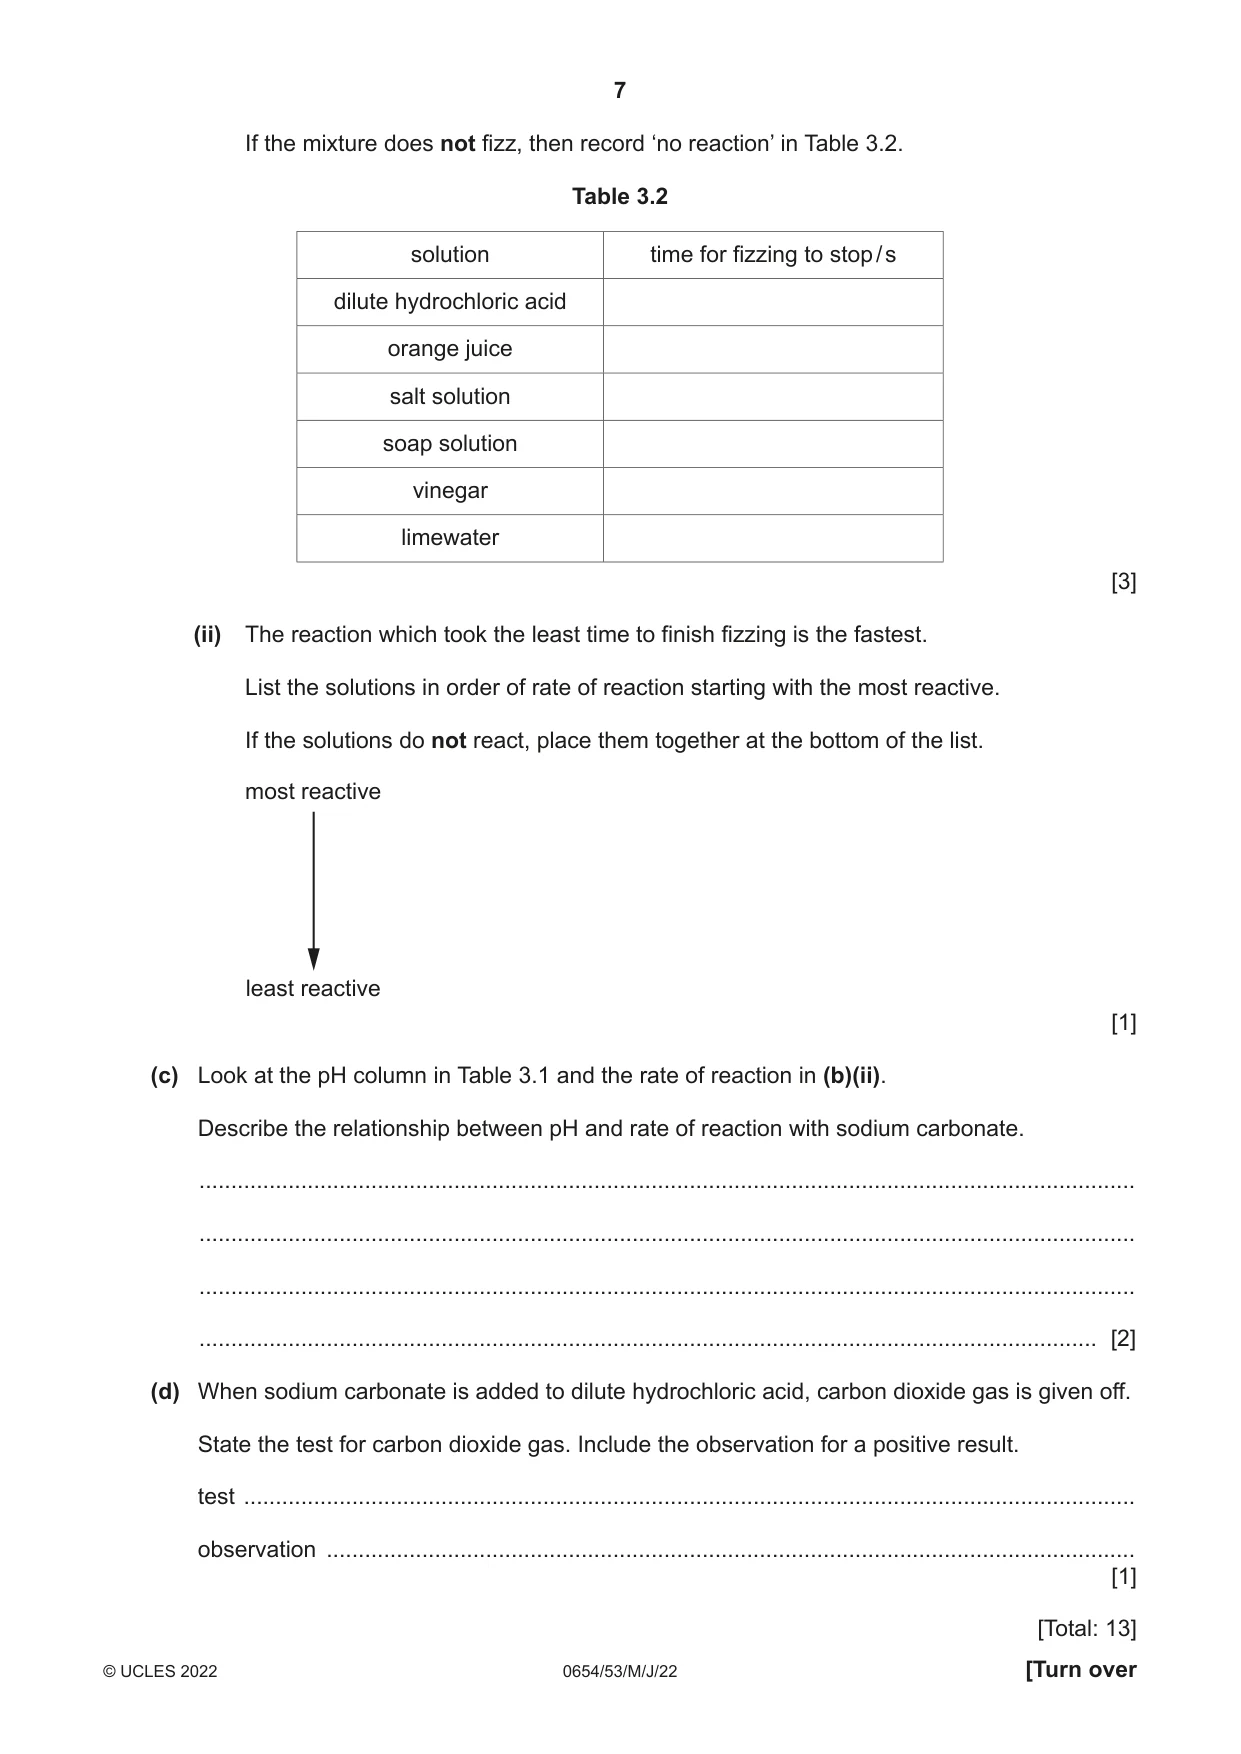
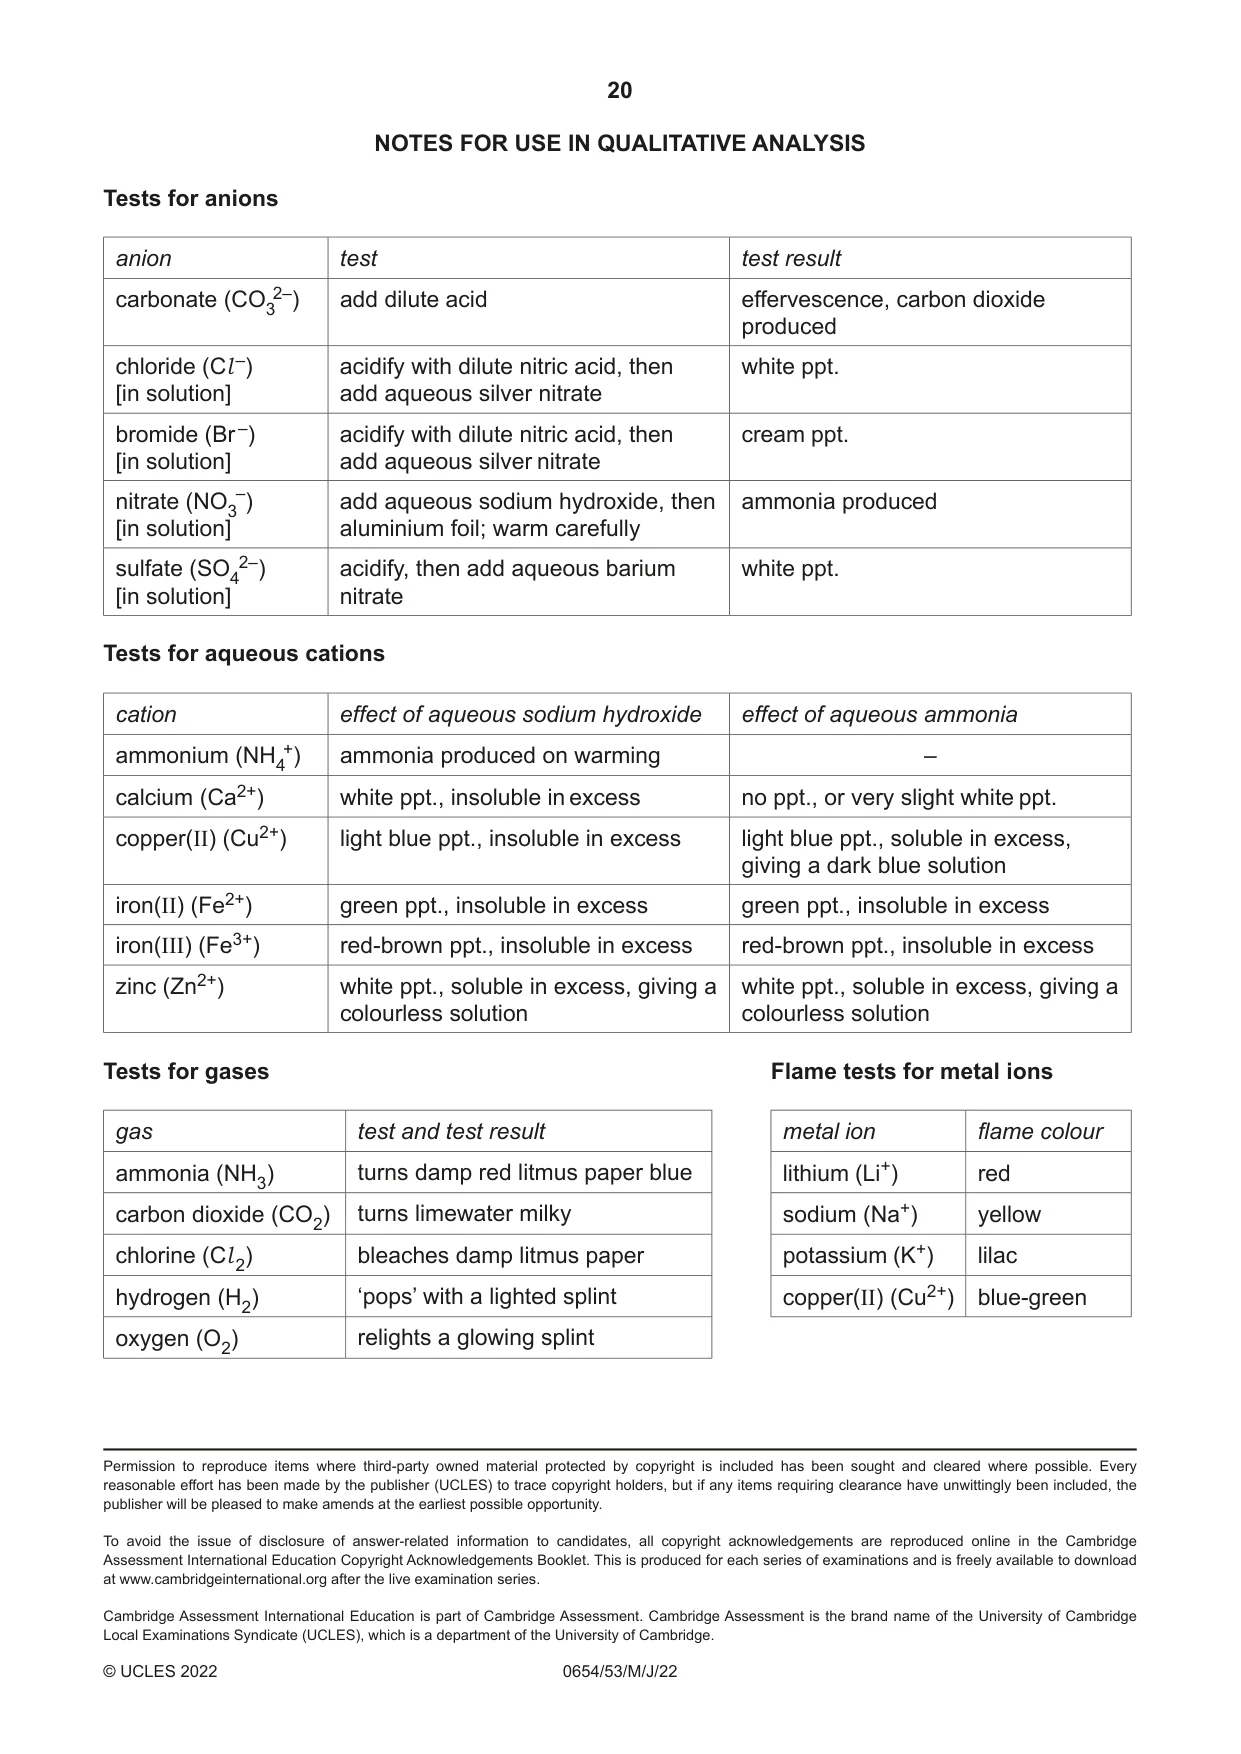
3 You are going to investigate the pH of several solutions and their reactivity with sodium carbonate. The pH scale is shown in Fig. 3.1. pH 1 7 14 description strongly weakly neutral weakly strongly acidic acidic alkaline alkaline Fig. 3.1 (a) (i) Procedure • Place about 1 cm depth of dilute hydrochloric acid, orange juice, salt solution, soap solution, vinegar and limewater into separate test-tubes. • To each solution, add 4 drops of universal indicator solution. • Record in Table 3.1 the colours obtained. Table 3.1 colour in solution pH description universal indicator dilute hydrochloric acid orange juice salt solution soap solution vinegar limewater [2] (ii) Record in Table 3.1 the pH of each solution. Use the pH colour chart. [2] (iii) Record in Table 3.1 a description of each solution. Use information from Fig. 3.1. [2] (b) (i) Procedure Step 1 Place about 3 cm depth of dilute hydrochloric acid into a clean boiling tube (large test-tube). Step 2 Add 2 spatula loads of sodium carbonate to the dilute hydrochloric acid, quickly start a stop-watch and time how long it takes for the fizzing to stop. Step 3 Record in Table 3.2 this time to the nearest second. Repeat the procedure in (b)(i) using orange juice, salt solution, soap solution, vinegar and limewater instead of dilute hydrochloric acid. If the mixture fizzes but takes longer than 3 minutes to stop, then record the time as >180 seconds. If the mixture does not fizz, then record ‘no reaction’ in Table 3.2. Table 3.2 solution time for fizzing to stop / s dilute hydrochloric acid orange juice salt solution soap solution vinegar limewater [3] (ii) The reaction which took the least time to finish fizzing is the fastest. List the solutions in order of rate of reaction starting with the most reactive. If the solutions do not react, place them together at the bottom of the list. most reactive least reactive [1] (c) Look at the pH column in Table 3.1 and the rate of reaction in (b)(ii). Describe the relationship between pH and rate of reaction with sodium carbonate. ................................................................................................................................................... ................................................................................................................................................... ................................................................................................................................................... ............................................................................................................................................. [2] (d) When sodium carbonate is added to dilute hydrochloric acid, carbon dioxide gas is given off. State the test for carbon dioxide gas. Include the observation for a positive result. test ............................................................................................................................................ observation ............................................................................................................................... [1] [Total: 13]
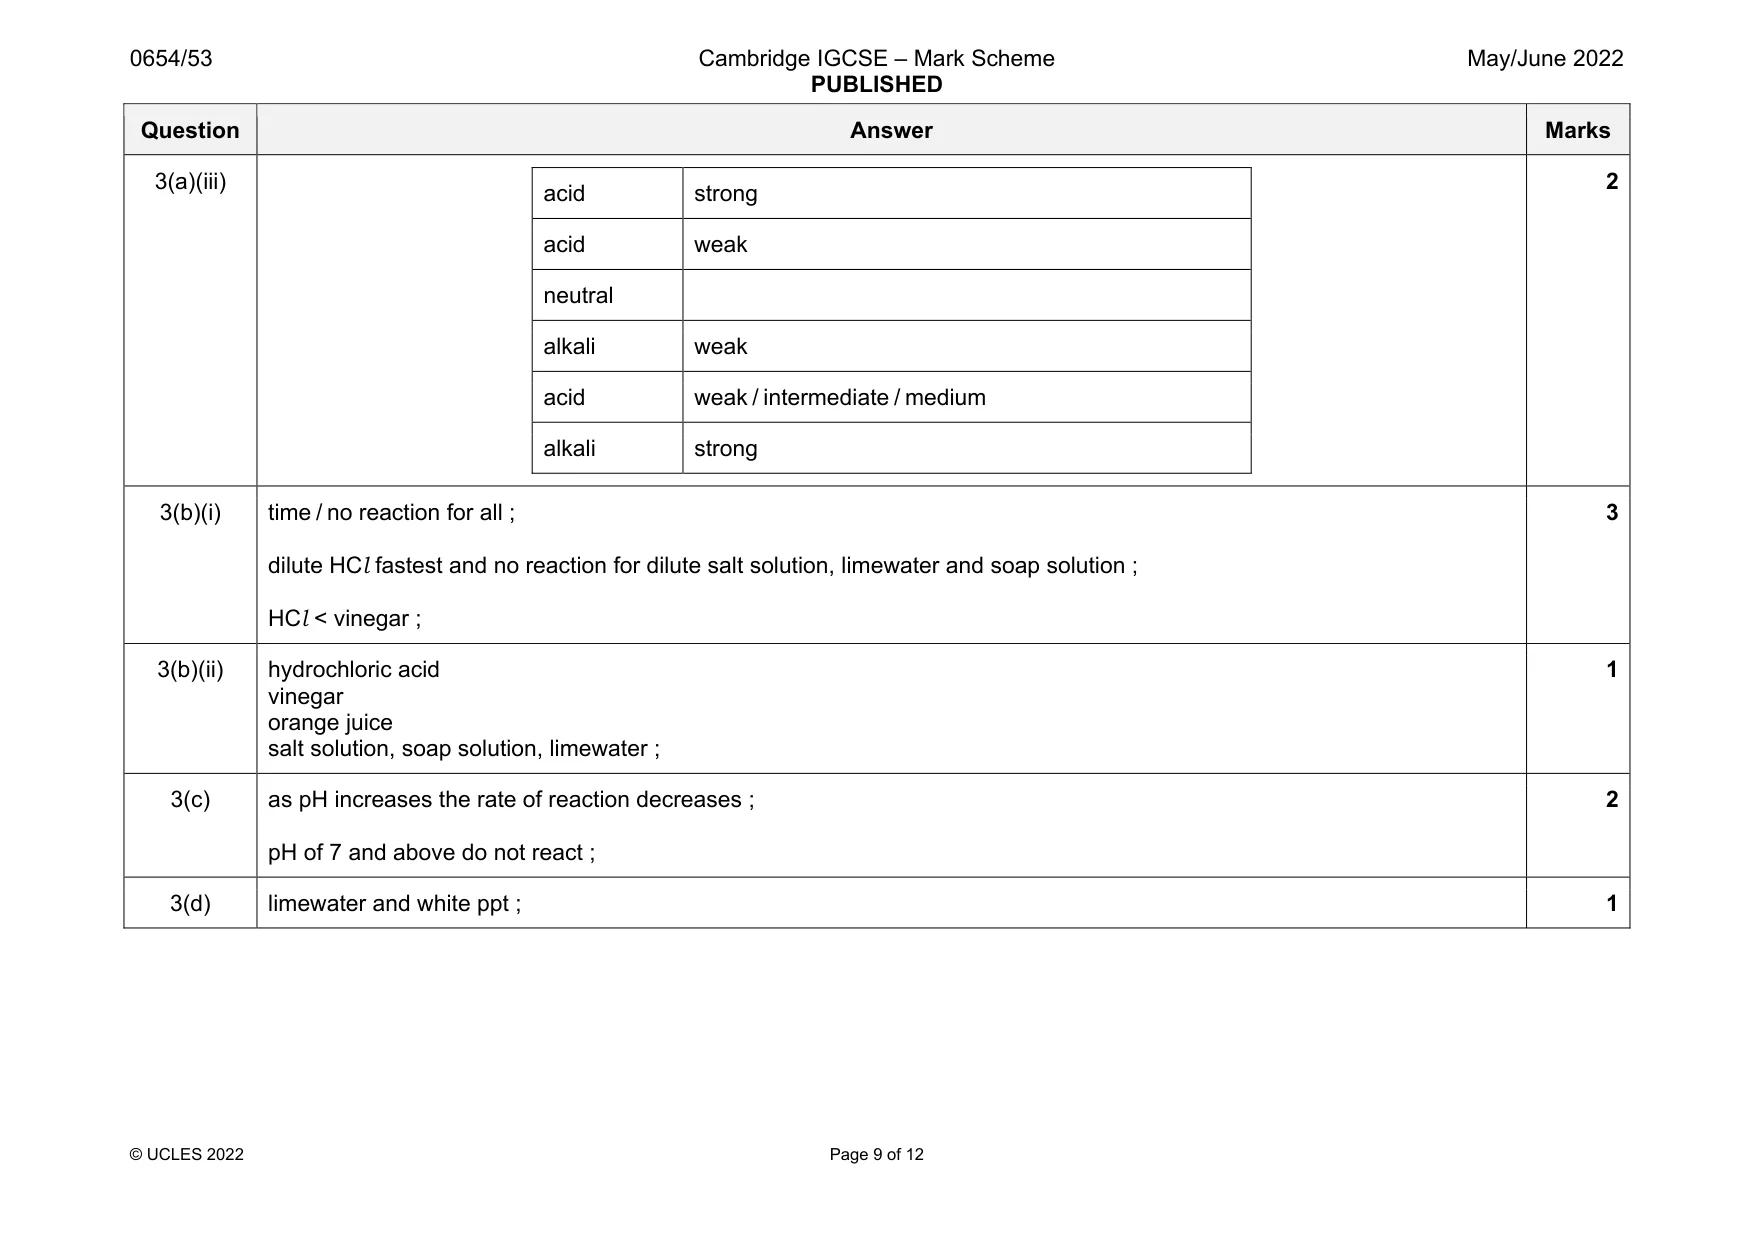
Mark scheme: 3(a)(i) colour for all solutions ; all colours different ; 2 3(a)(ii) all pH recorded ; all pH different ; 2 Question Answer Marks 3(a)(iii) acid strong acid weak neutral alkali weak acid weak / intermediate / medium alkali strong 2 3(b)(i) time / no reaction for all ; dilute HCl fastest and no reaction for dilute salt solution, limewater and soap solution ; HCl < vinegar ; 3 3(b)(ii) hydrochloric acid vinegar orange juice salt solution, soap solution, limewater ; 1 3(c) as pH increases the rate of reaction decreases ; pH of 7 and above do not react ; 2 3(d) limewater and white ppt ; 1
More questions on The characteristic properties of acids and bases
Q4 · Solid sodium carbonate does not decompose when it is heated
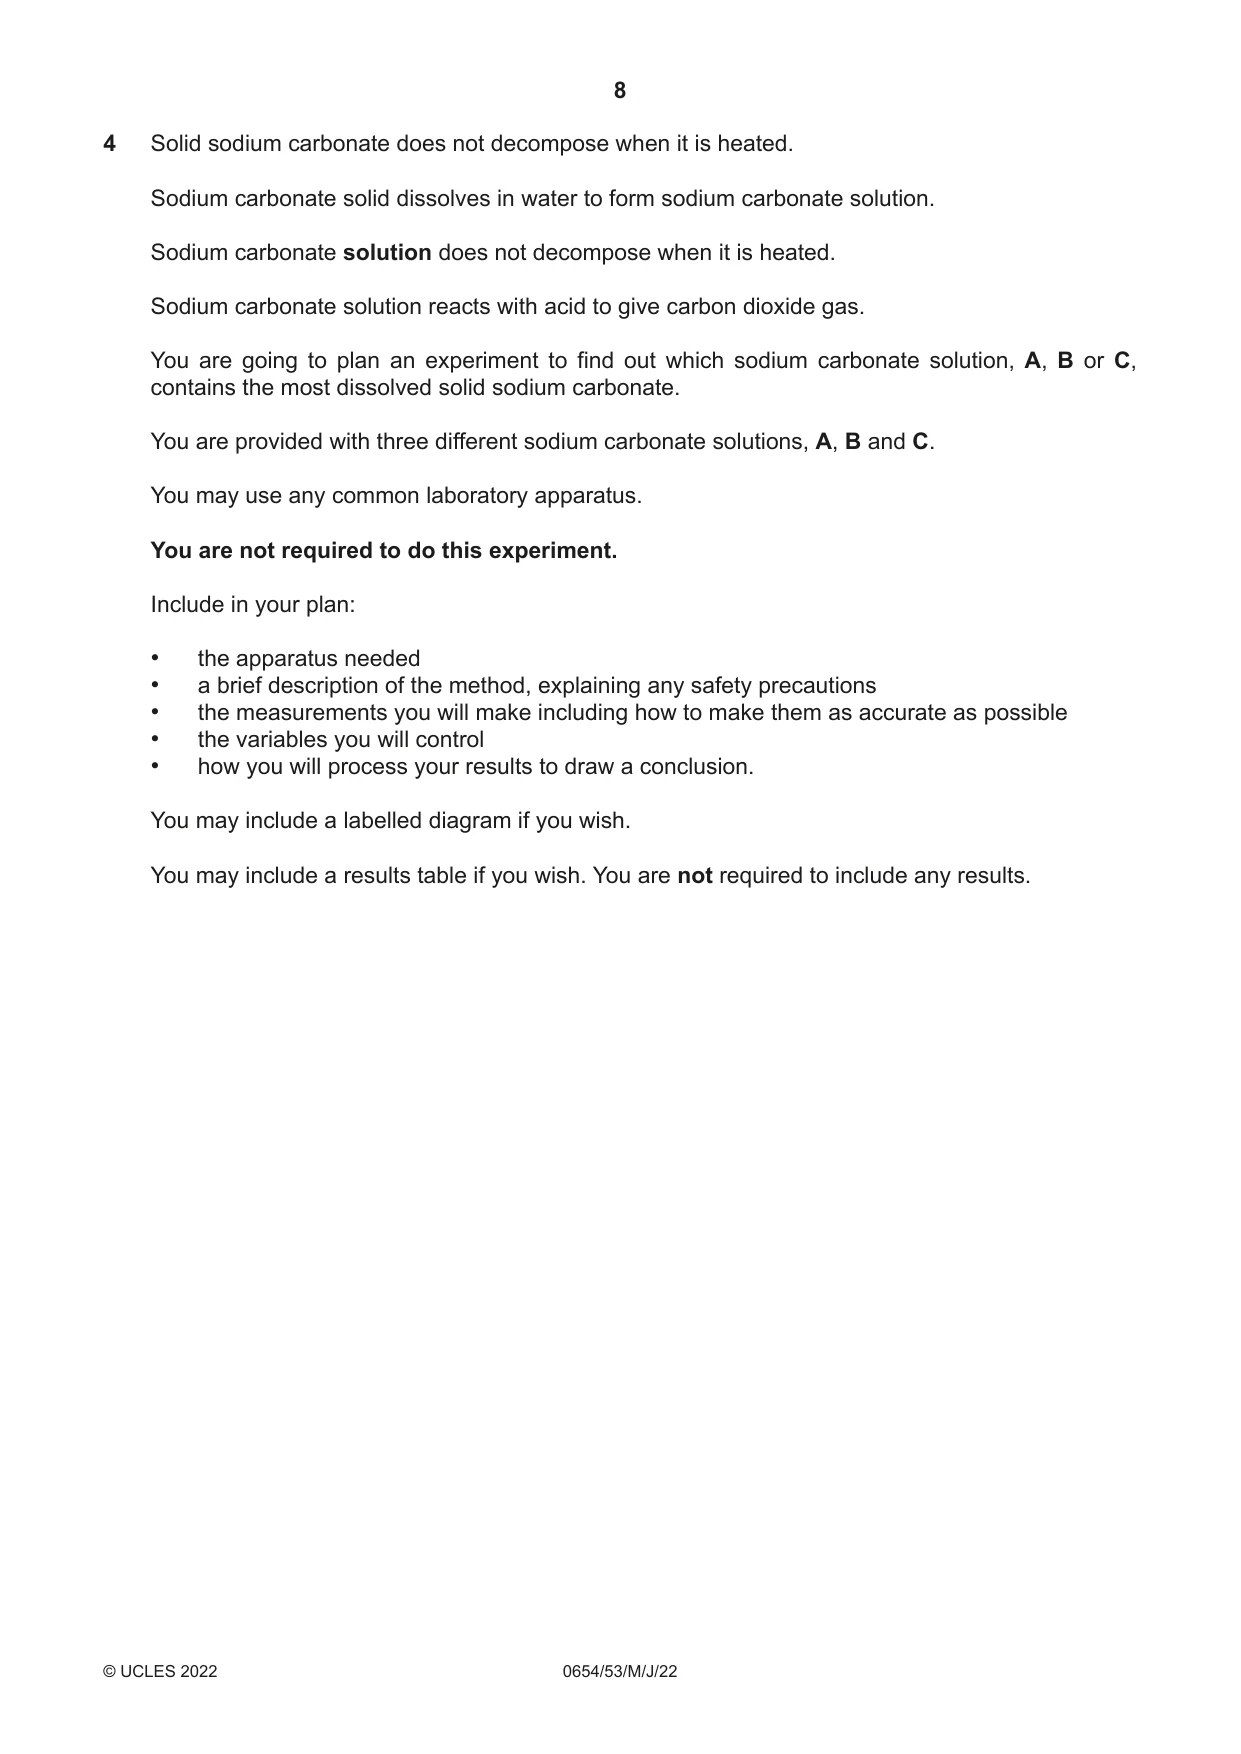
4 Solid sodium carbonate does not decompose when it is heated. Sodium carbonate solid dissolves in water to form sodium carbonate solution. Sodium carbonate solution does not decompose when it is heated. Sodium carbonate solution reacts with acid to give carbon dioxide gas. You are going to plan an experiment to find out which sodium carbonate solution, A, B or C, contains the most dissolved solid sodium carbonate. You are provided with three different sodium carbonate solutions, A, B and C. You may use any common laboratory apparatus. You are not required to do this experiment. Include in your plan: • the apparatus needed • a brief description of the method, explaining any safety precautions • the measurements you will make including how to make them as accurate as possible • the variables you will control • how you will process your results to draw a conclusion. You may include a labelled diagram if you wish. You may include a results table if you wish. You are not required to include any results. ................................................................................................................................................... ................................................................................................................................................... ................................................................................................................................................... ................................................................................................................................................... ................................................................................................................................................... ................................................................................................................................................... ................................................................................................................................................... ................................................................................................................................................... ................................................................................................................................................... ................................................................................................................................................... ................................................................................................................................................... ................................................................................................................................................... ................................................................................................................................................... ................................................................................................................................................... ................................................................................................................................................... ................................................................................................................................................... ................................................................................................................................................... ................................................................................................................................................... ................................................................................................................................................... ................................................................................................................................................... ............................................................................................................................................. [7]
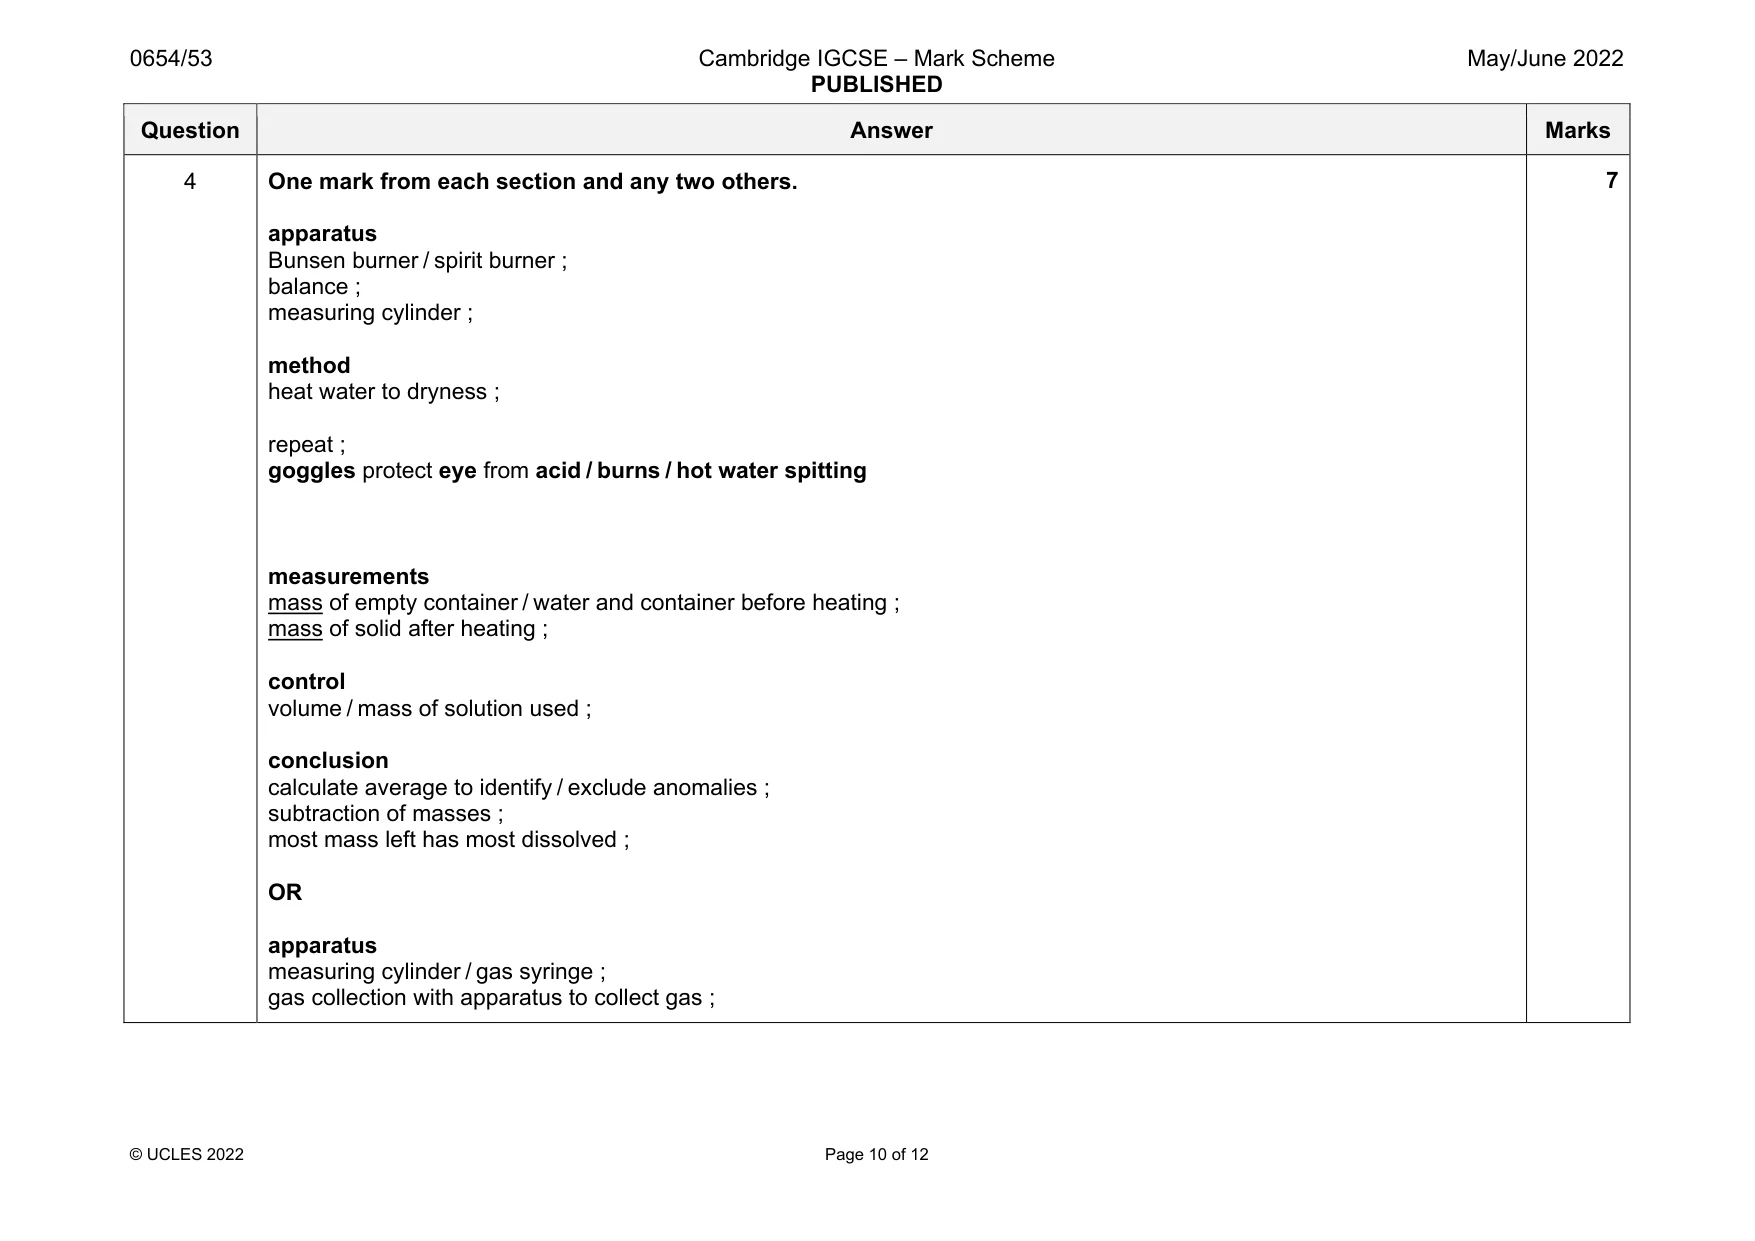
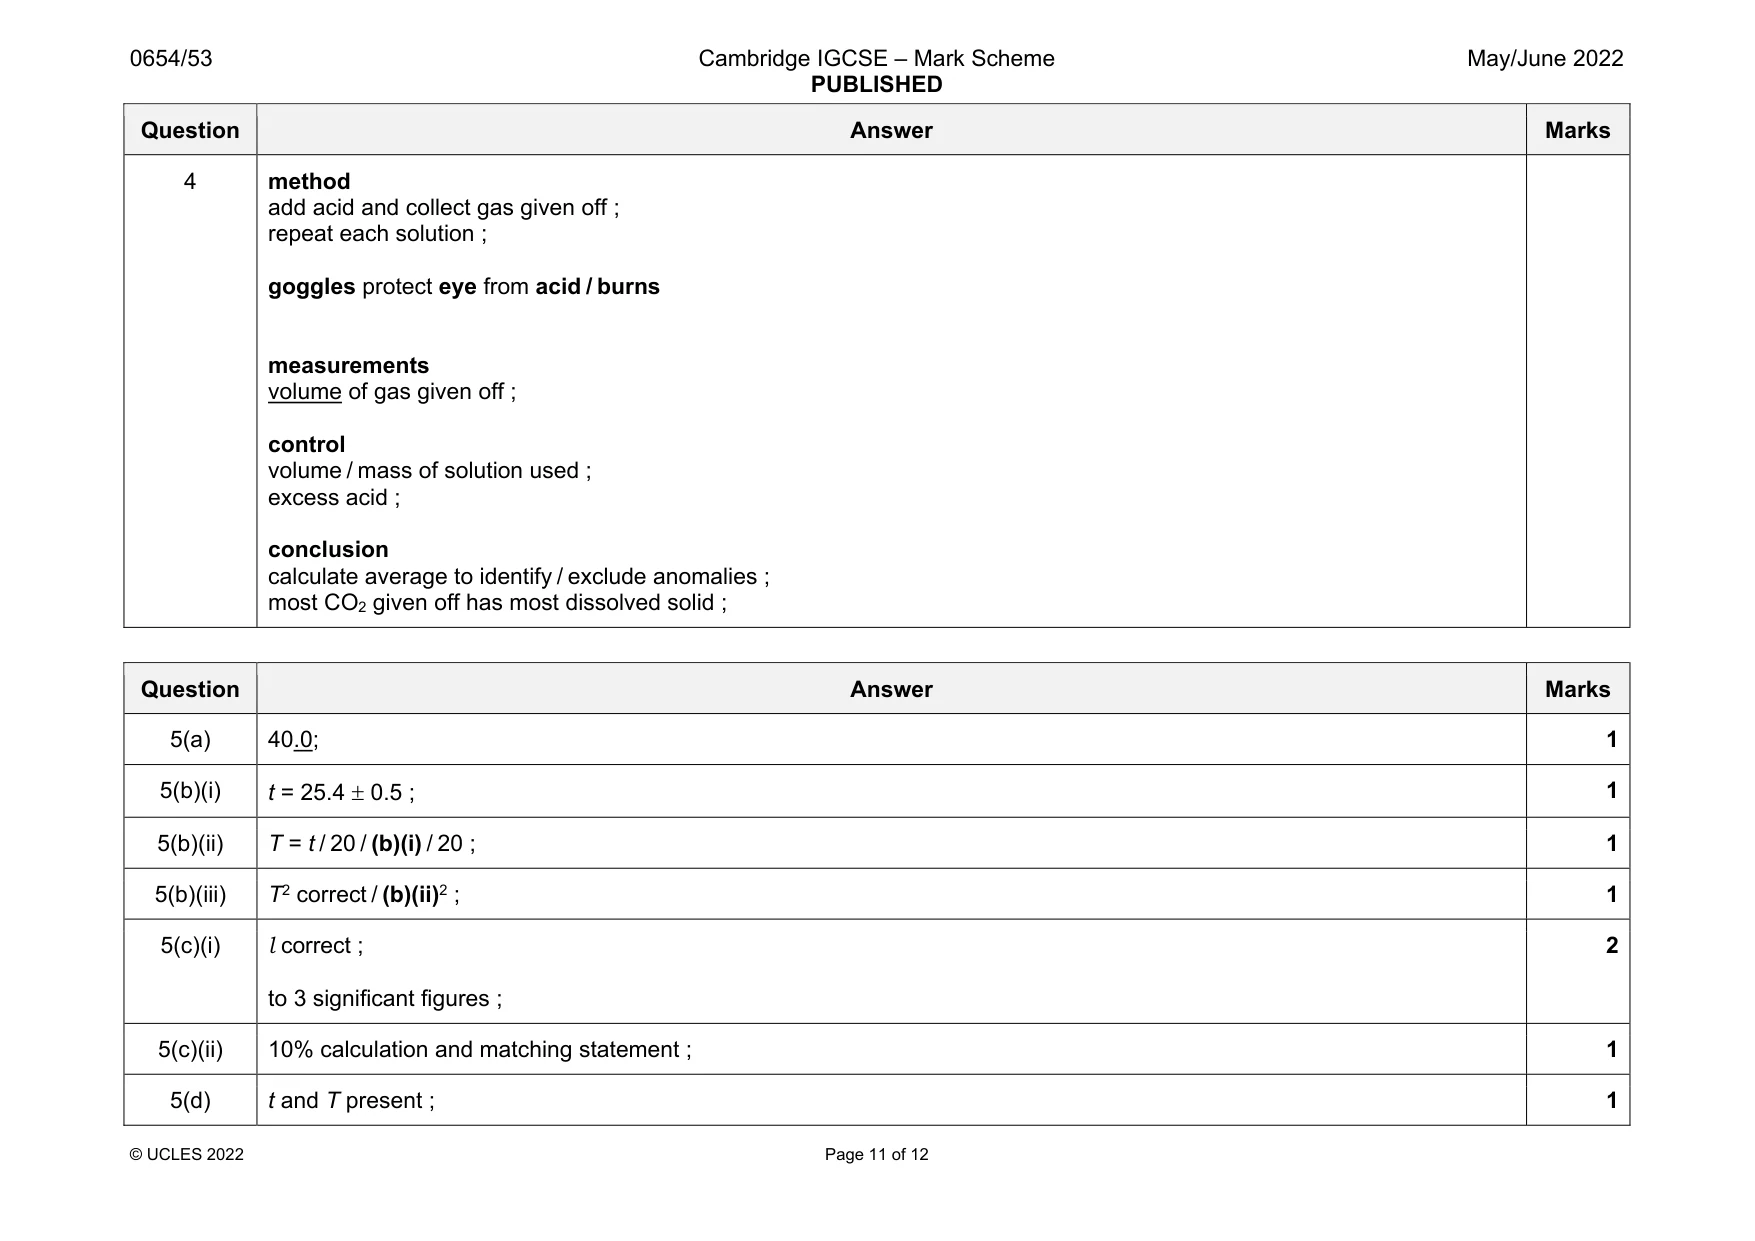
Mark scheme: 4 One mark from each section and any two others. apparatus Bunsen burner / spirit burner ; balance ; measuring cylinder ; method heat water to dryness ; repeat ; goggles protect eye from acid / burns / hot water spitting measurements mass of empty container / water and container before heating ; mass of solid after heating ; control volume / mass of solution used ; conclusion calculate average to identify / exclude anomalies ; subtraction of masses ; most mass left has most dissolved ; OR apparatus measuring cylinder / gas syringe ; gas collection with apparatus to collect gas ; Question Answer Marks 4 method add acid and collect gas given off ; repeat each solution ; goggles protect eye from acid / burns measurements volume of gas given off ; control volume / mass of solution used ; excess acid ; conclusion calculate average to identify / exclude anomalies ; most CO2 given off has most dissolved solid ;
Q5 · You are going to investigate the oscillations of a pendulum
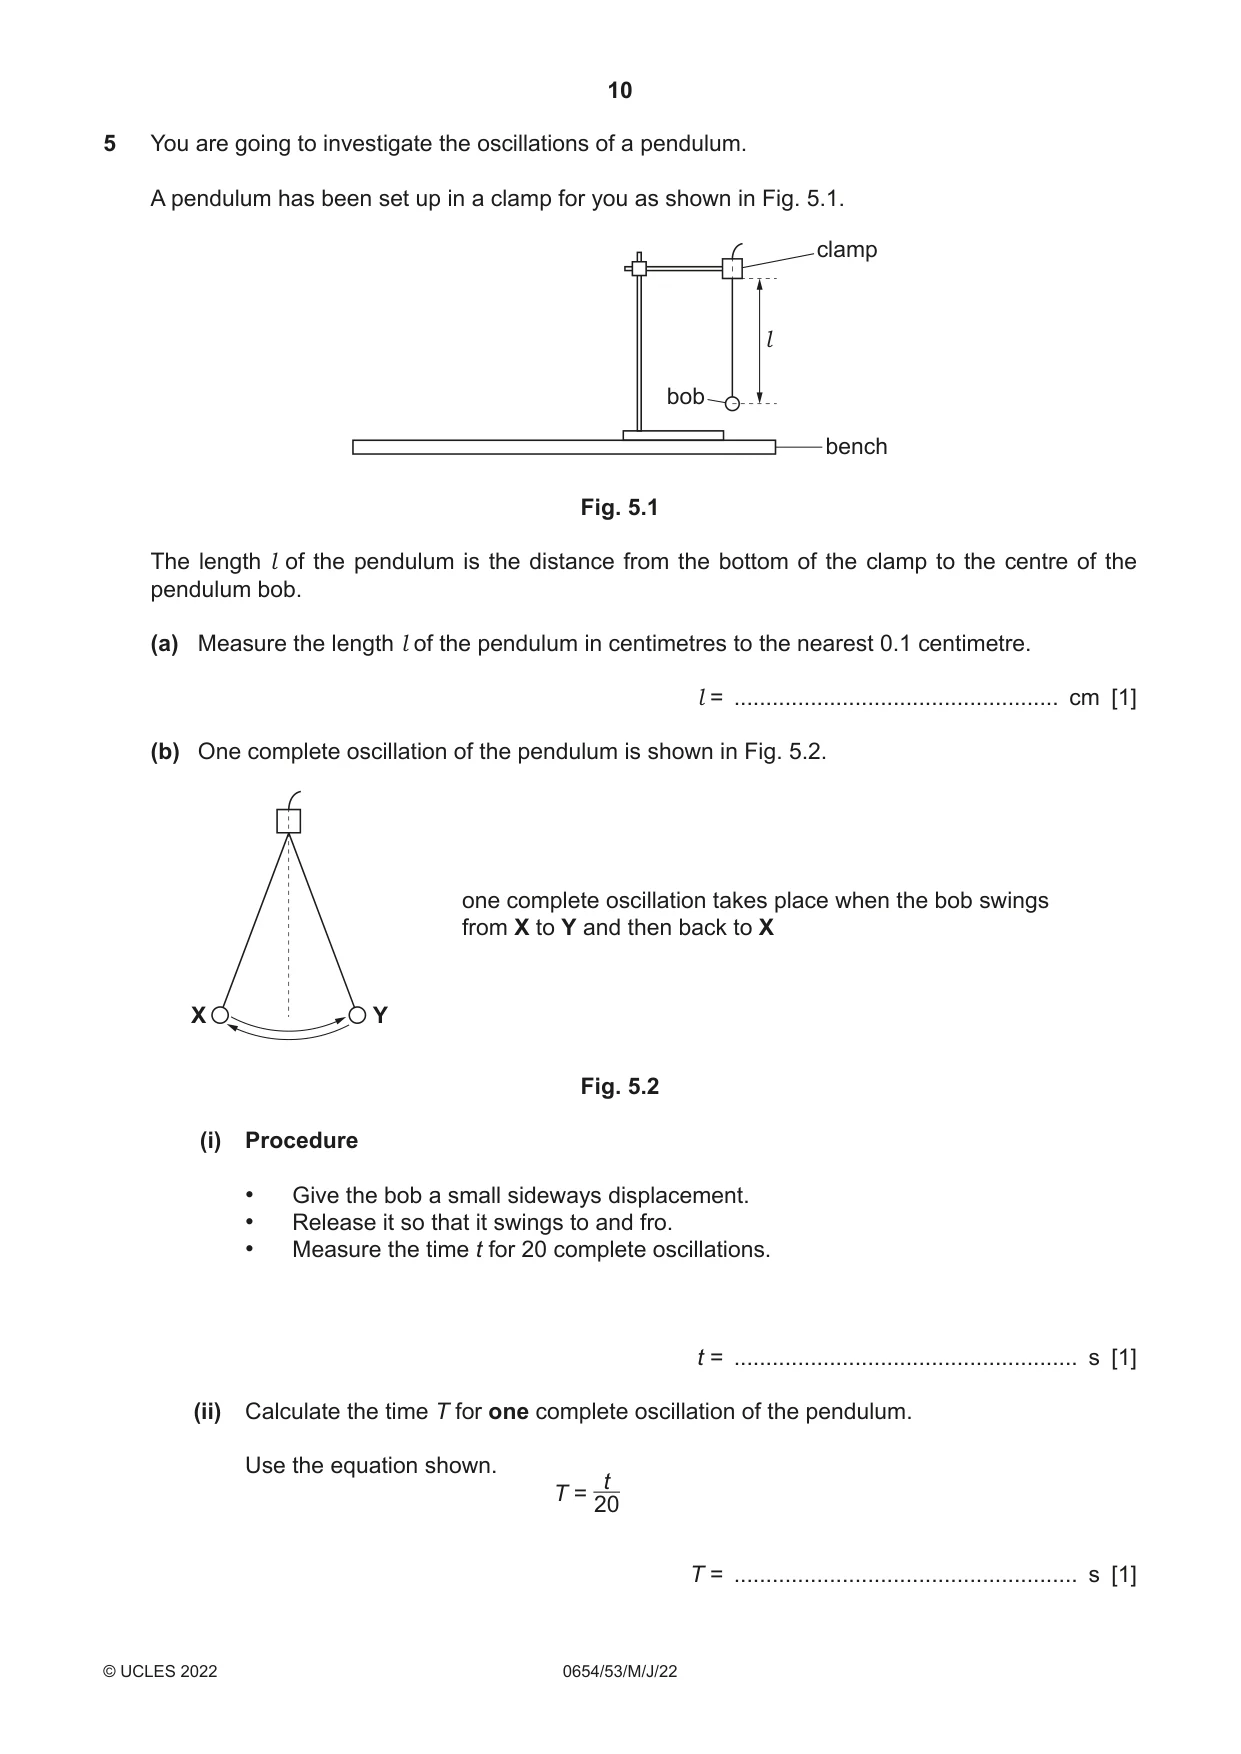
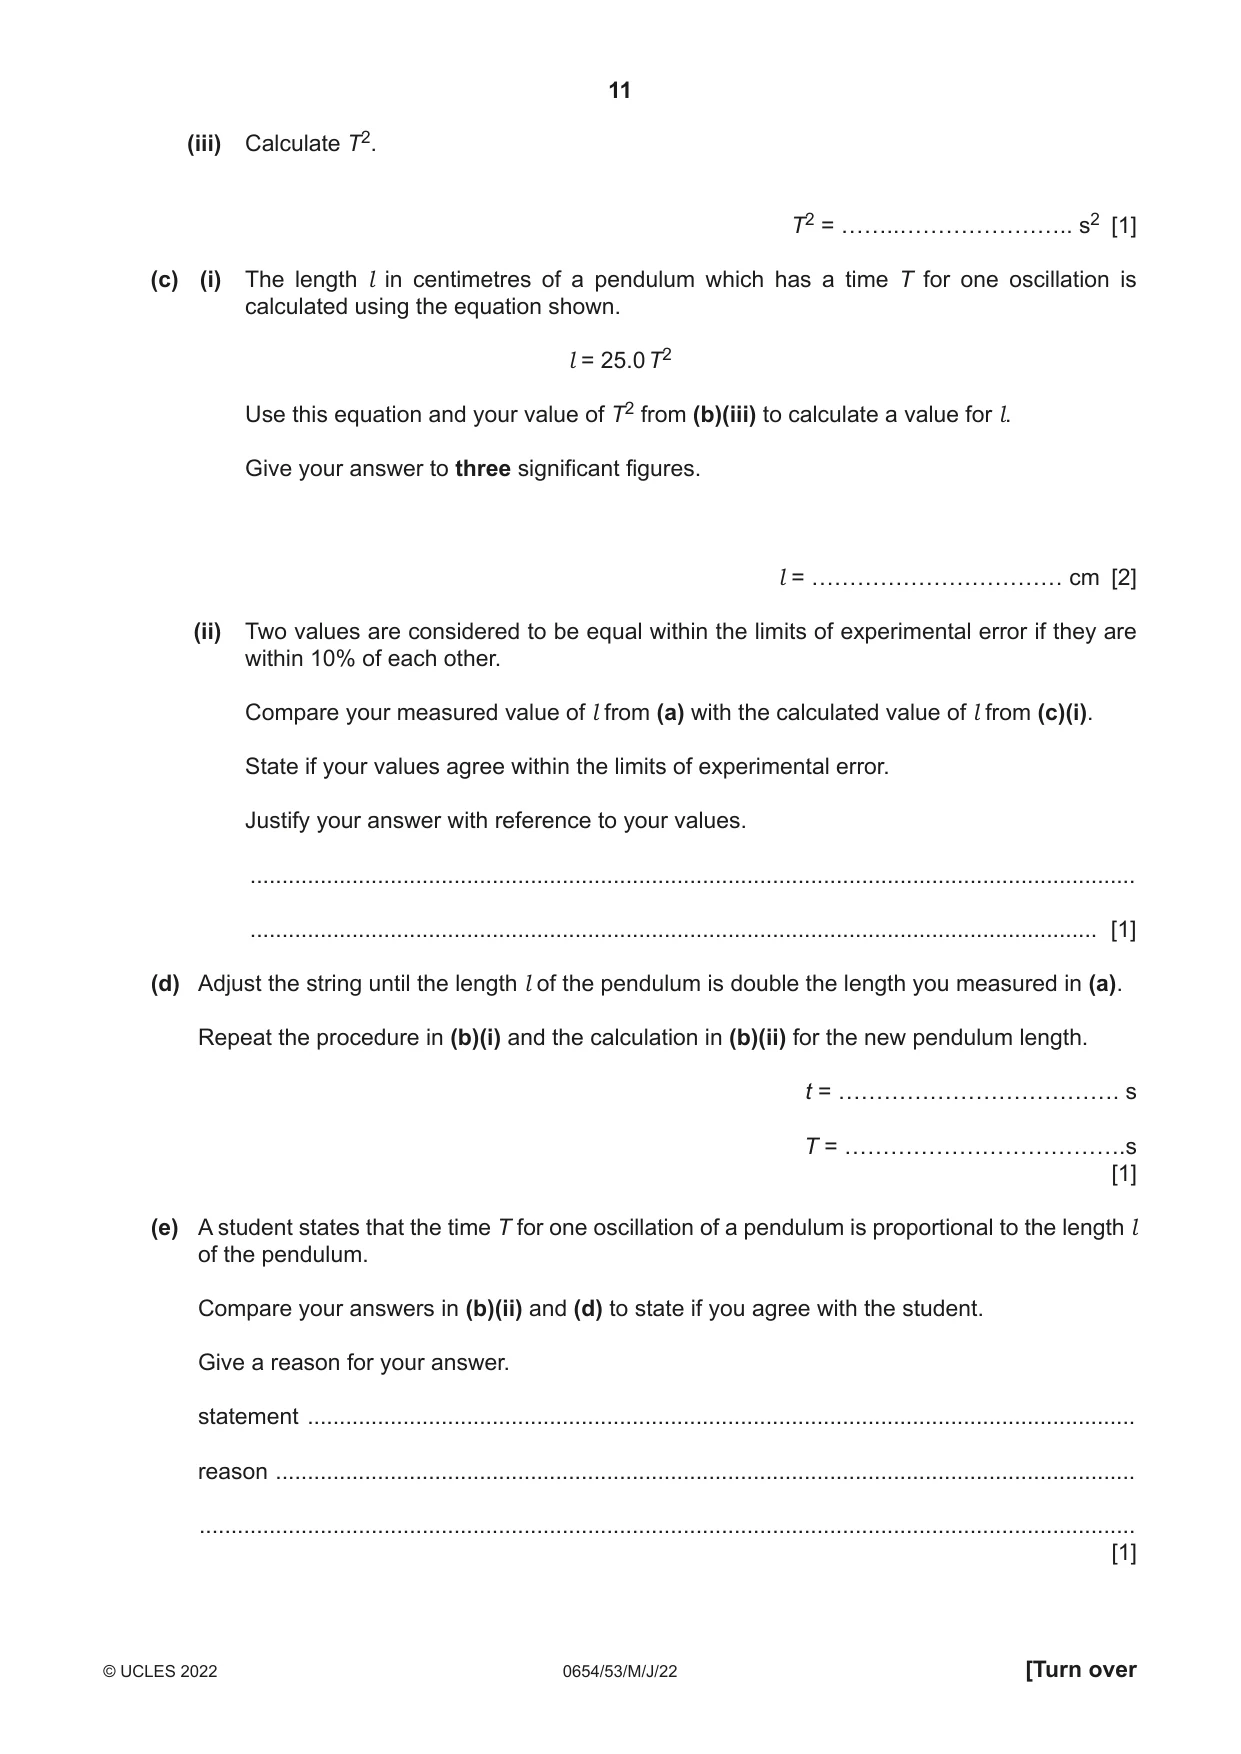
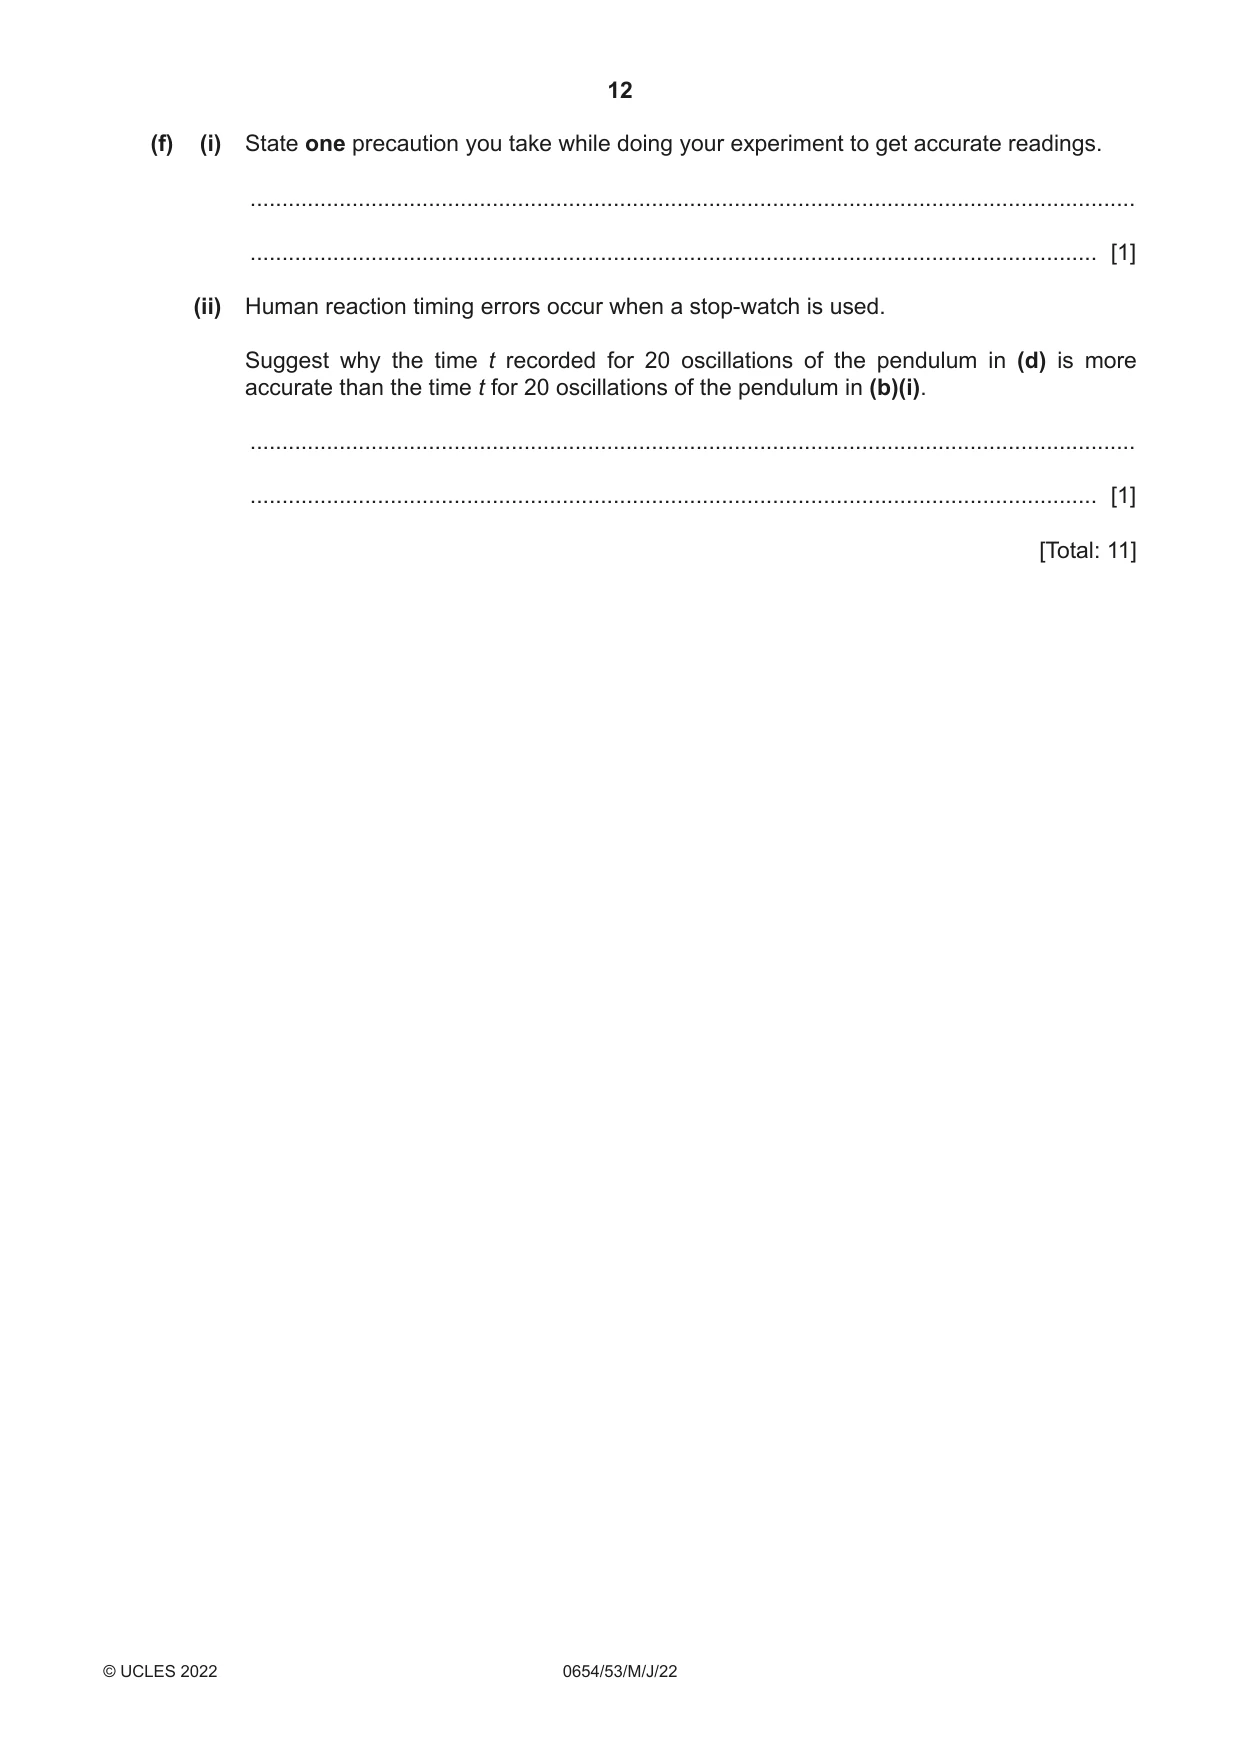
5 You are going to investigate the oscillations of a pendulum. A pendulum has been set up in a clamp for you as shown in Fig. 5.1. clamp l bob bench Fig. 5.1 The length l of the pendulum is the distance from the bottom of the clamp to the centre of the pendulum bob. (a) Measure the length l of the pendulum in centimetres to the nearest 0.1 centimetre. l = ................................................... cm [1] (b) One complete oscillation of the pendulum is shown in Fig. 5.2. one complete oscillation takes place when the bob swings from X to Y and then back to X X Y Fig. 5.2 (i) Procedure • Give the bob a small sideways displacement. • Release it so that it swings to and fro. • Measure the time t for 20 complete oscillations. t = ...................................................... s [1] (ii) Calculate the time T for one complete oscillation of the pendulum. Use the equation shown. t T = 20 T = ...................................................... s [1] (iii) Calculate T2. T2 = ……..………………….. s2 [1] (c) (i) The length l in centimetres of a pendulum which has a time T for one oscillation is calculated using the equation shown. l = 25.0 T2 Use this equation and your value of T2 from (b)(iii) to calculate a value for l. Give your answer to three significant figures. l = …………………………… cm [2] (ii) Two values are considered to be equal within the limits of experimental error if they are within 10% of each other. Compare your measured value of l from (a) with the calculated value of l from (c)(i). State if your values agree within the limits of experimental error. Justify your answer with reference to your values. ........................................................................................................................................... ..................................................................................................................................... [1] (d) Adjust the string until the length l of the pendulum is double the length you measured in (a). Repeat the procedure in (b)(i) and the calculation in (b)(ii) for the new pendulum length. t = ………………………………. s T = ……………………………….s [1] (e) A student states that the time T for one oscillation of a pendulum is proportional to the length l of the pendulum. Compare your answers in (b)(ii) and (d) to state if you agree with the student. Give a reason for your answer. statement .................................................................................................................................. reason ....................................................................................................................................... ................................................................................................................................................... [1] (f) (i) State one precaution you take while doing your experiment to get accurate readings. ........................................................................................................................................... ..................................................................................................................................... [1] (ii) Human reaction timing errors occur when a stop-watch is used. Suggest why the time t recorded for 20 oscillations of the pendulum in (d) is more accurate than the time t for 20 oscillations of the pendulum in (b)(i). ........................................................................................................................................... ..................................................................................................................................... [1] [Total: 11]
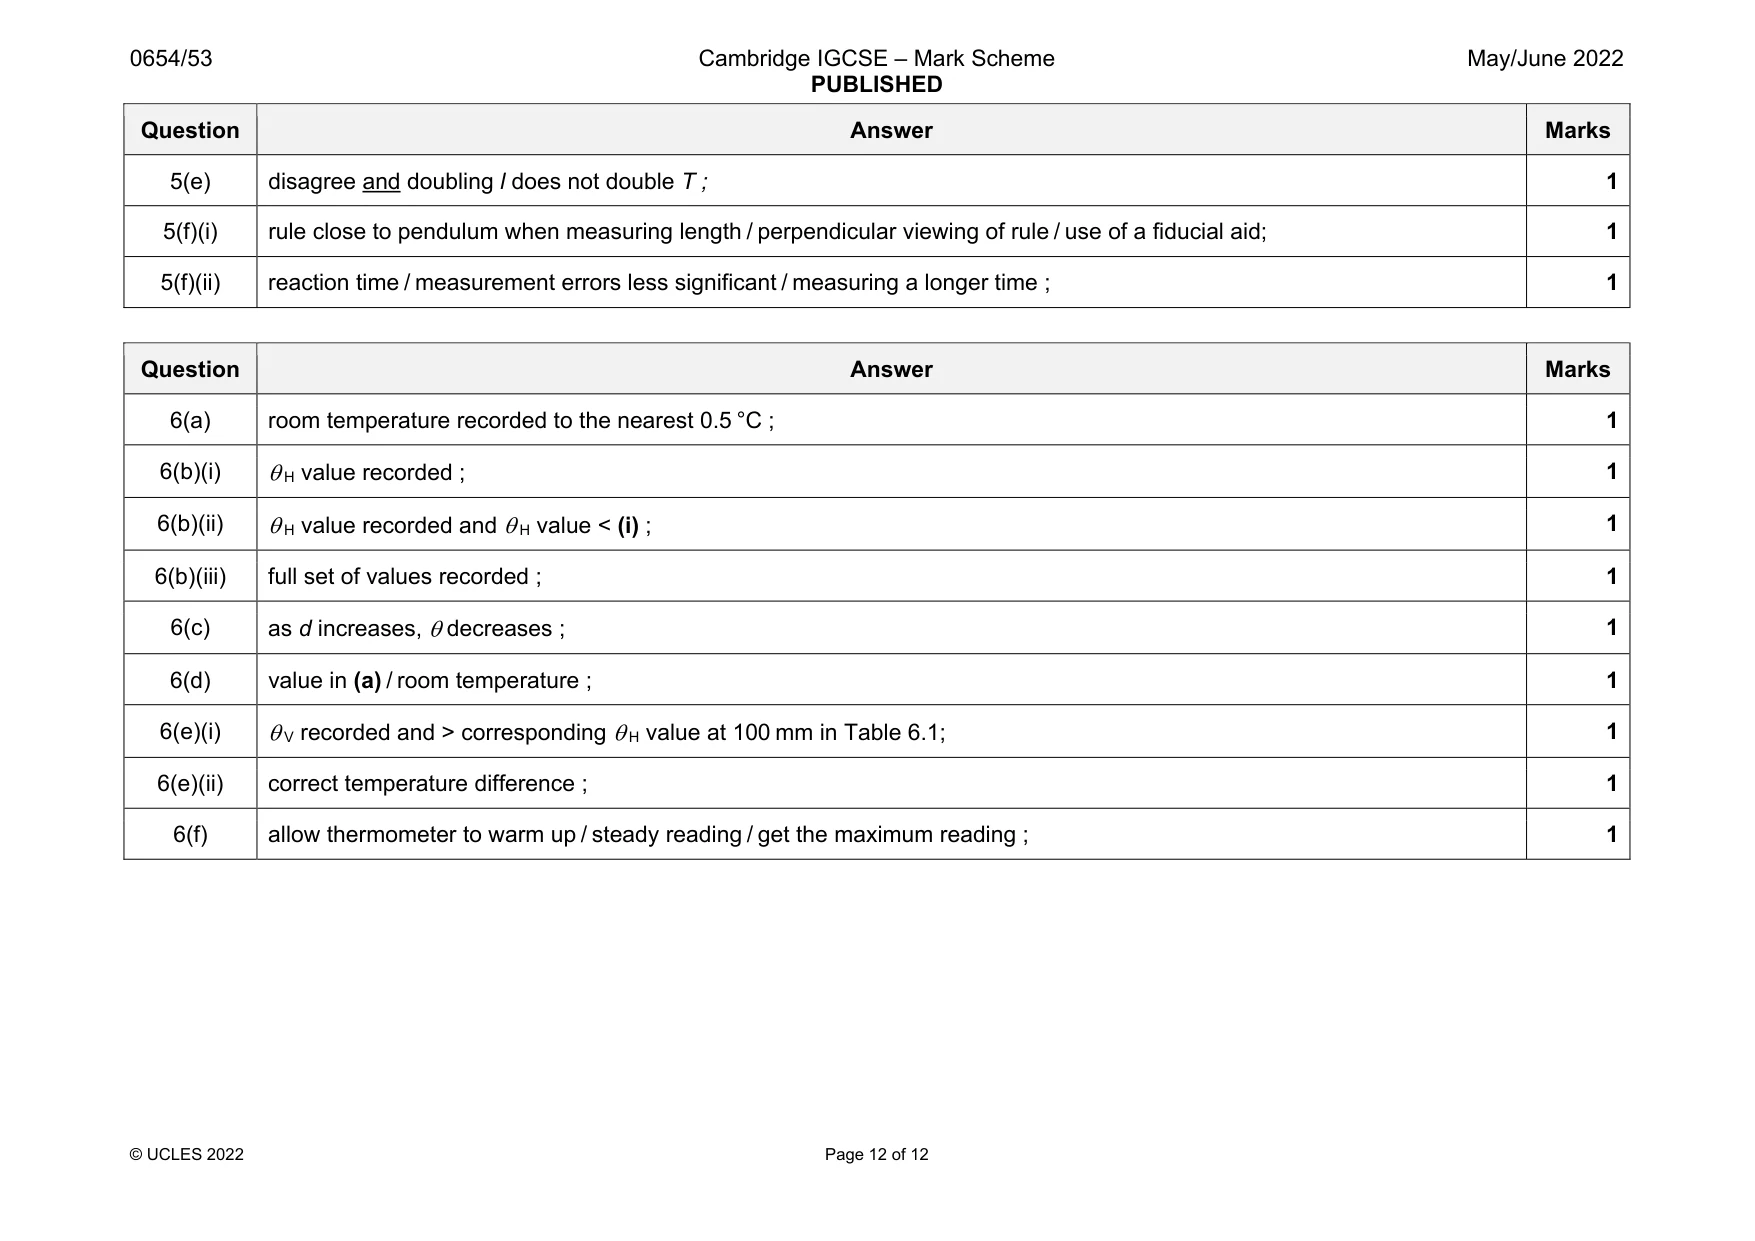
Mark scheme: 5(a) 40.0; 1 5(b)(i) t = 25.4 0.5 ; 1 5(b)(ii) T = t / 20 / (b)(i) / 20 ; 1 5(b)(iii) T2 correct / (b)(ii)2 ; 1 5(c)(i) l correct ; to 3 significant figures ; 2 5(c)(ii) 10% calculation and matching statement ; 1 5(d) t and T present ; 1 Question Answer Marks 5(e) disagree and doubling l does not double T ; 1 5(f)(i) rule close to pendulum when measuring length / perpendicular viewing of rule / use of a fiducial aid; 1 5(f)(ii) reaction time / measurement errors less significant / measuring a longer time ; 1
More questions on Physical quantities and measurement techniques
Q6 · You are going to investigate the temperature of the air at different distances from a lamp
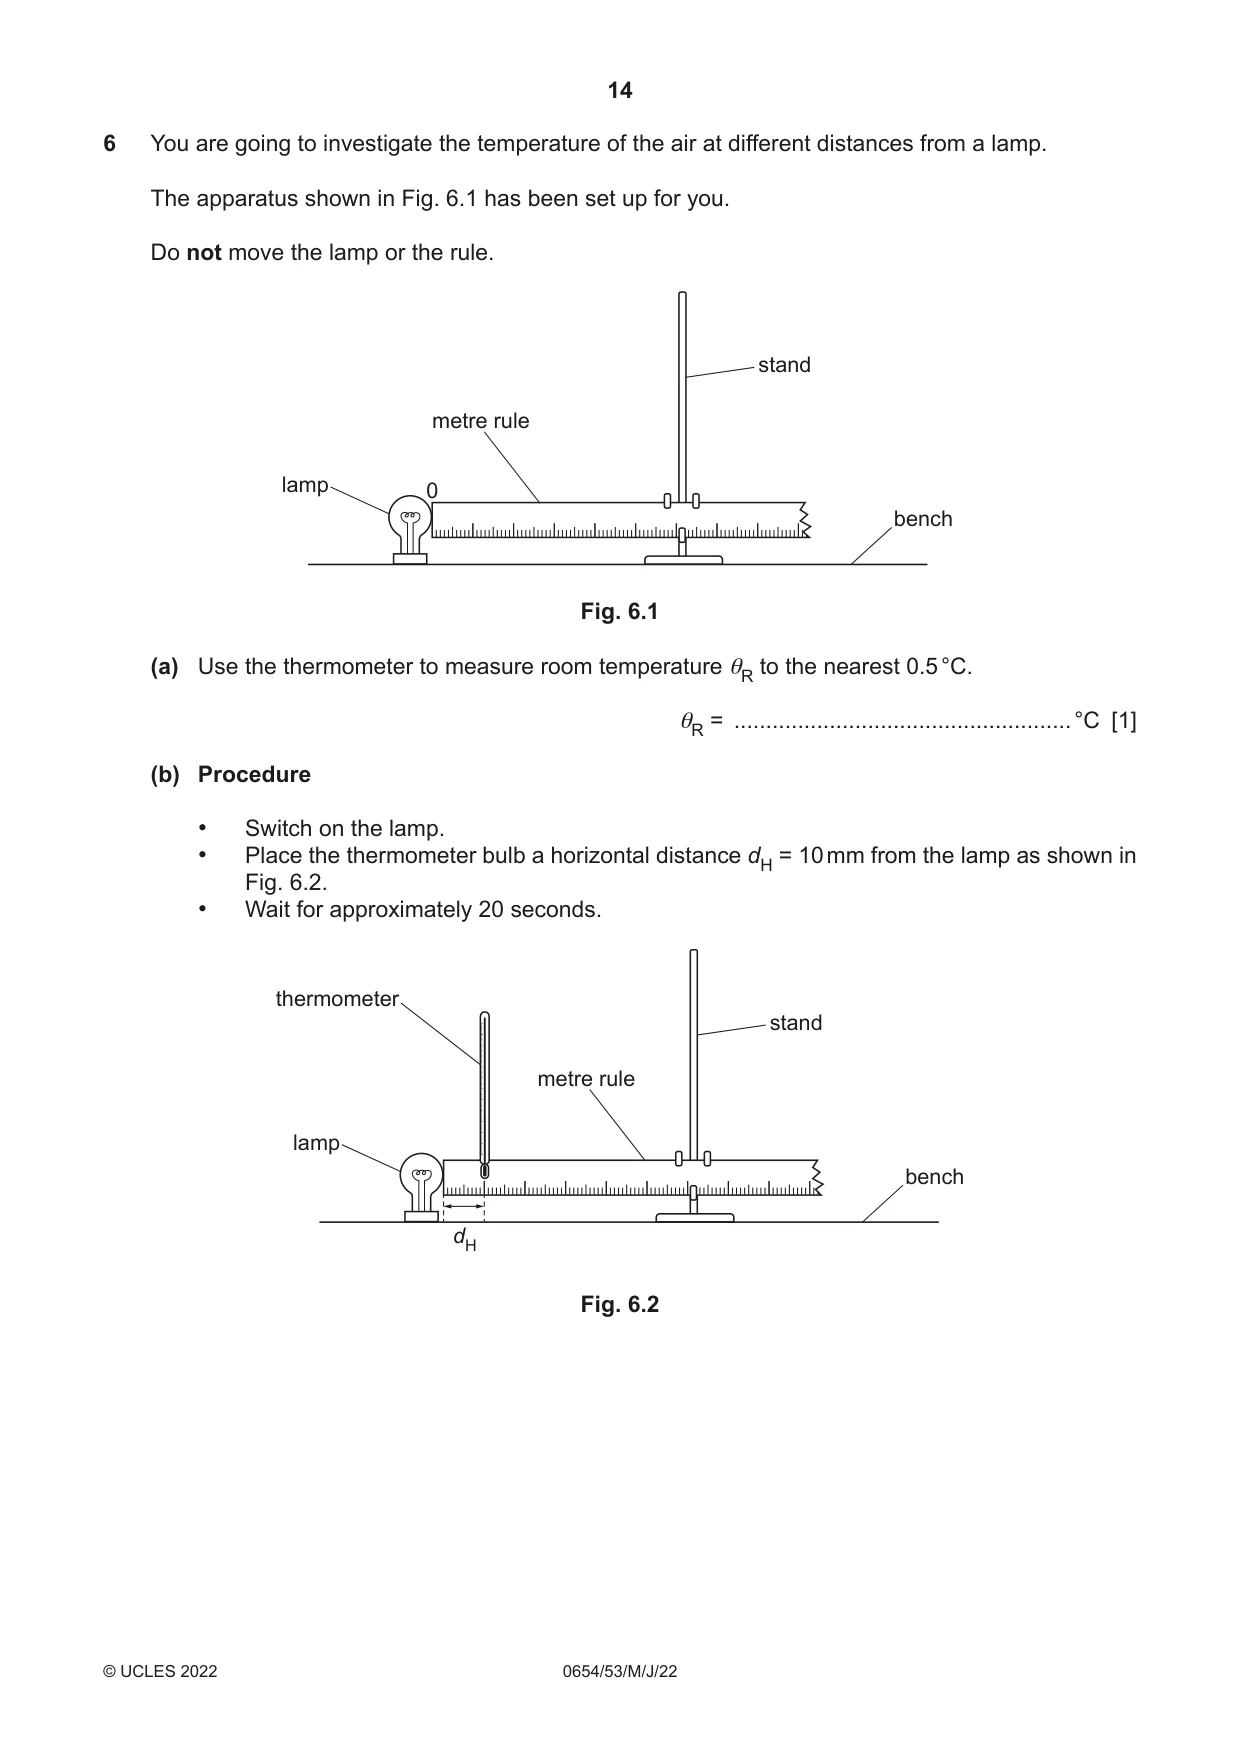
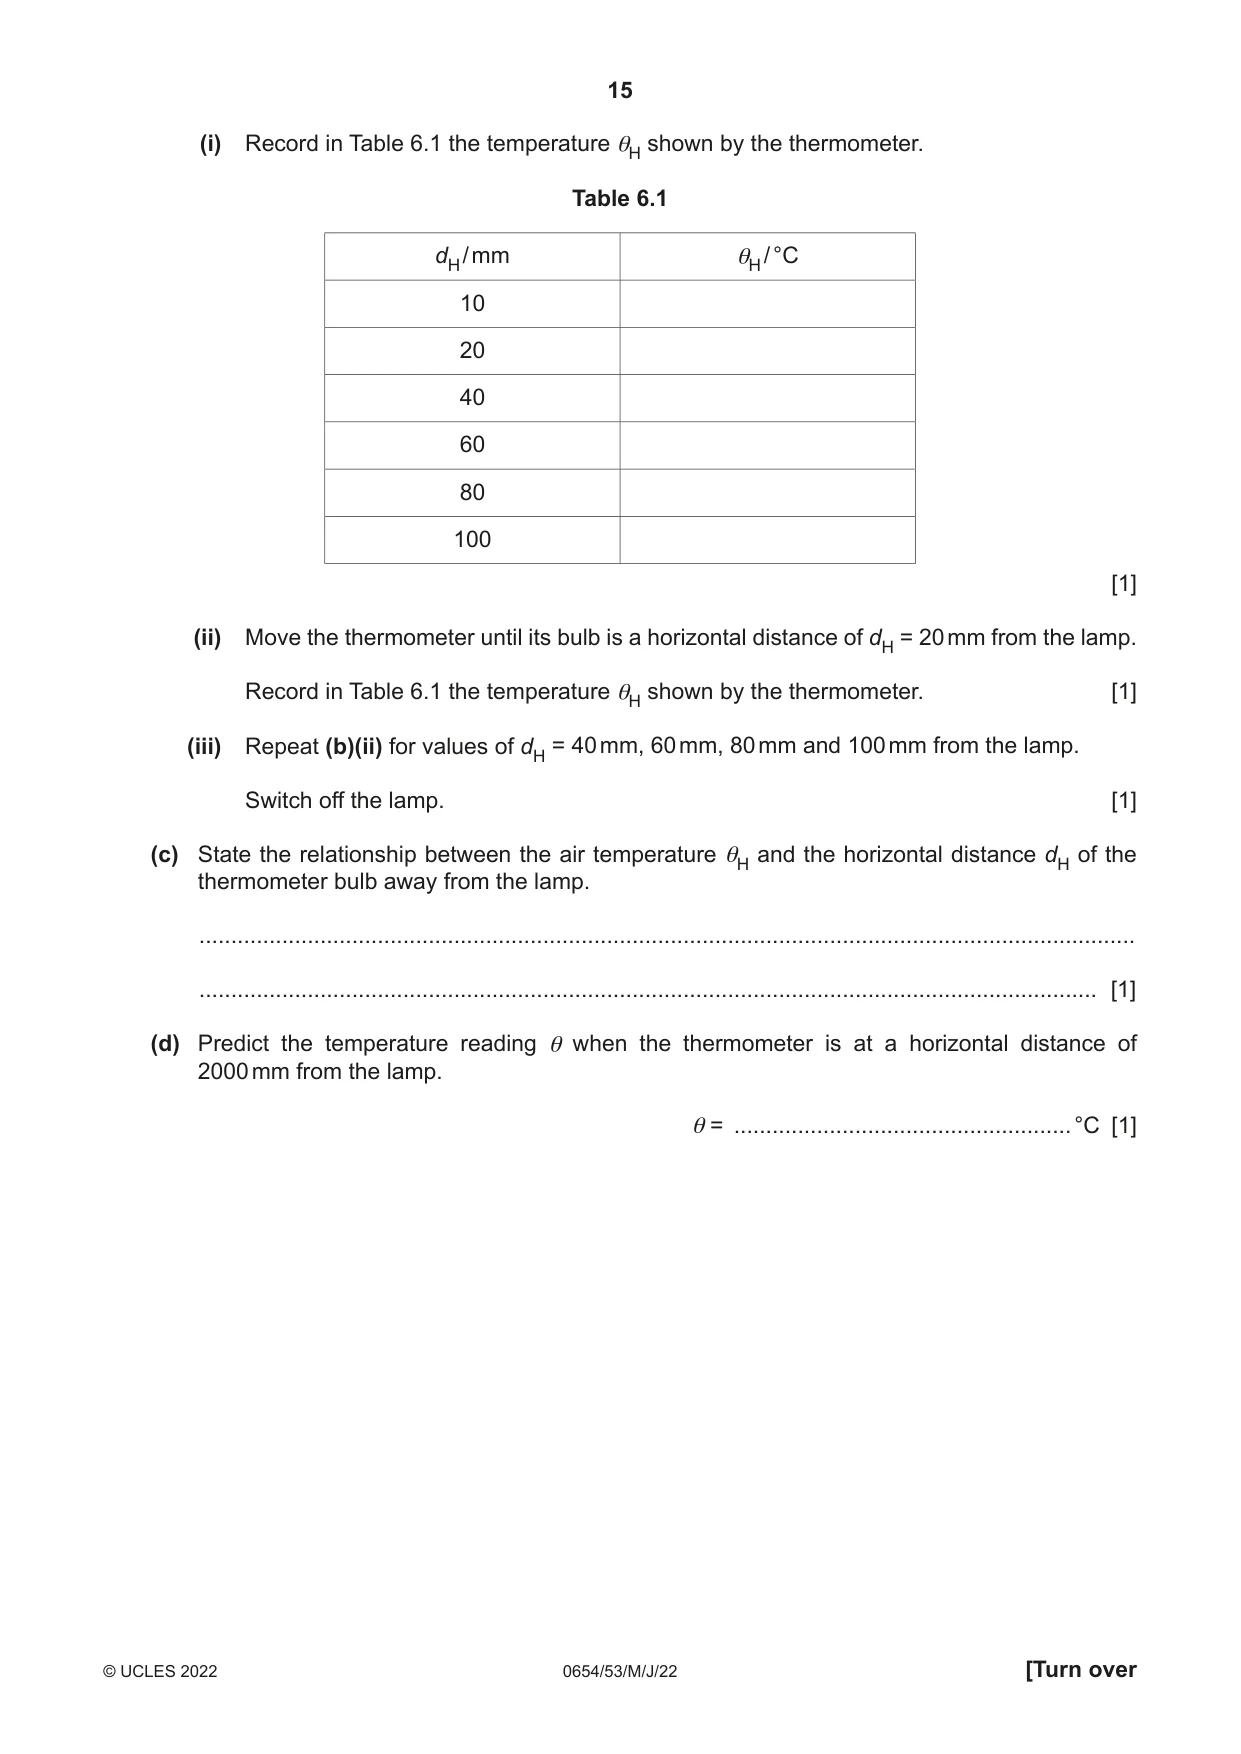
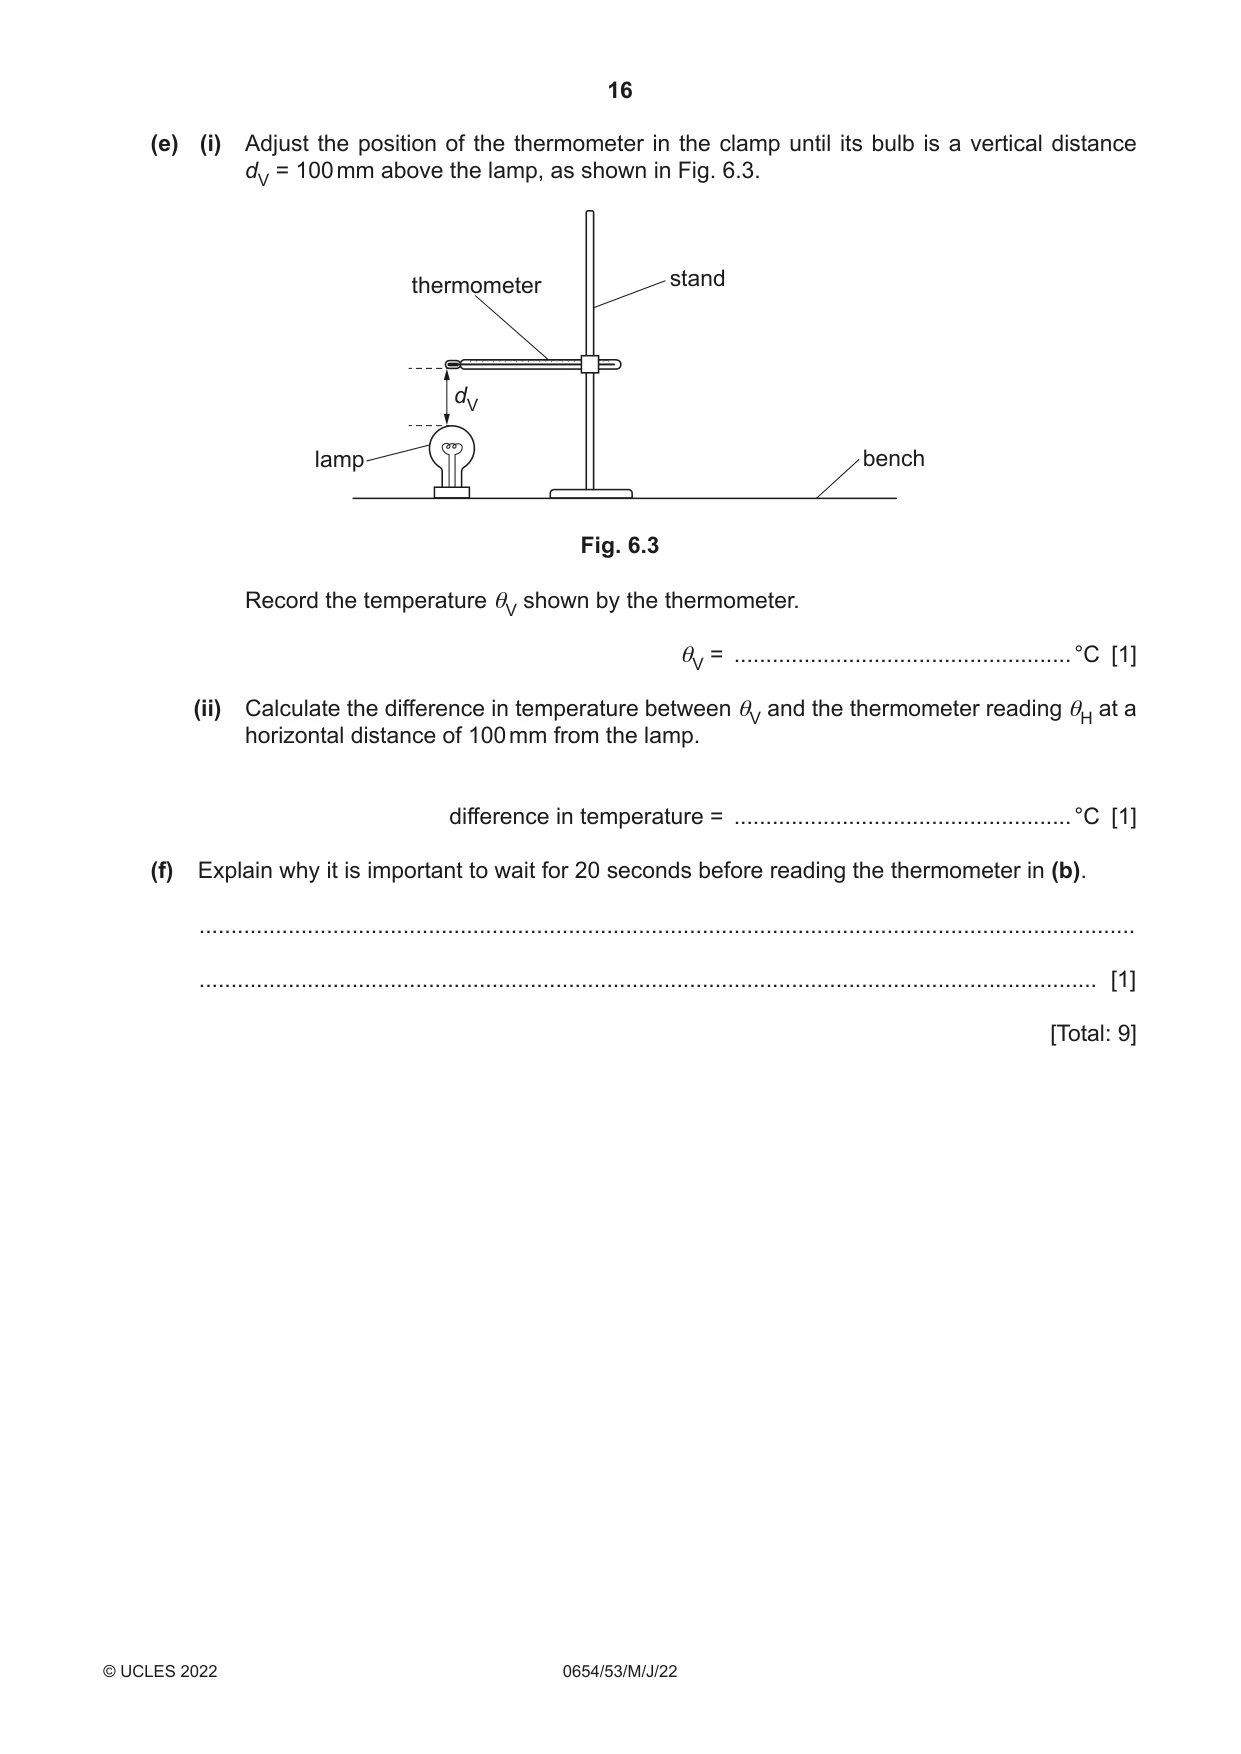
6 You are going to investigate the temperature of the air at different distances from a lamp. The apparatus shown in Fig. 6.1 has been set up for you. Do not move the lamp or the rule. stand metre rule lamp 0 bench Fig. 6.1 (a) Use the thermometer to measure room temperature θR to the nearest 0.5 °C. θR = .....................................................°C [1] (b) Procedure • Switch on the lamp. • Place the thermometer bulb a horizontal distance dH = 10 mm from the lamp as shown in Fig. 6.2. • Wait for approximately 20 seconds. thermometer stand metre rule lamp bench dH Fig. 6.2 (i) Record in Table 6.1 the temperature θH shown by the thermometer. Table 6.1 dH / mm θH / °C 10 20 40 60 80 100 [1] (ii) Move the thermometer until its bulb is a horizontal distance of dH = 20 mm from the lamp. Record in Table 6.1 the temperature θH shown by the thermometer. [1] (iii) Repeat (b)(ii) for values of dH = 40 mm, 60 mm, 80 mm and 100 mm from the lamp. Switch off the lamp. [1] (c) State the relationship between the air temperature θH and the horizontal distance dH of the thermometer bulb away from the lamp. ................................................................................................................................................... ............................................................................................................................................. [1] (d) Predict the temperature reading θ when the thermometer is at a horizontal distance of 2000 mm from the lamp. θ = .....................................................°C [1] (e) (i) Adjust the position of the thermometer in the clamp until its bulb is a vertical distance dV = 100 mm above the lamp, as shown in Fig. 6.3. stand thermometer dV lamp bench Fig. 6.3 Record the temperature θV shown by the thermometer. θV = .....................................................°C [1] (ii) Calculate the difference in temperature between θV and the thermometer reading θH at a horizontal distance of 100 mm from the lamp. difference in temperature = .....................................................°C [1] (f) Explain why it is important to wait for 20 seconds before reading the thermometer in (b). ................................................................................................................................................... ............................................................................................................................................. [1] [Total: 9]
Mark scheme: 6(a) room temperature recorded to the nearest 0.5 °C ; 1 6(b)(i) H value recorded ; 1 6(b)(ii) H value recorded and H value < (i) ; 1 6(b)(iii) full set of values recorded ; 1 6(c) as d increases, decreases ; 1 6(d) value in (a) / room temperature ; 1 6(e)(i) V recorded and > corresponding H value at 100 mm in Table 6.1; 1 6(e)(ii) correct temperature difference ; 1 6(f) allow thermometer to warm up / steady reading / get the maximum reading ; 1
What was in this paper
The subtopics covered by these 6 questions, and how many questions each got. Open one in a new tab to see every Cambridge question on it.
What you needed in this session
Cambridge’s own grade thresholds for 2022 May/June, Paper 5 · Variant 3. A higher threshold means an easier paper — the bar moves with how the cohort did.