Cambridge IGCSE Sciences - Co-ordinated (Double) 0654 — 2022 May/June Paper 5 · Variant 2
0654/52/M/J/22 · 6 questions · 60 marks · ≈68 min
The question paper and its mark scheme, free to read here and free to download. This is Cambridge’s own paper, exactly as it was sat.
Question paper20 pages




Mark scheme9 pages
Answers below. Sit the paper first if you are practising.
Questions as text
Q1 · You are going to investigate the movement of molecules through a cell membrane
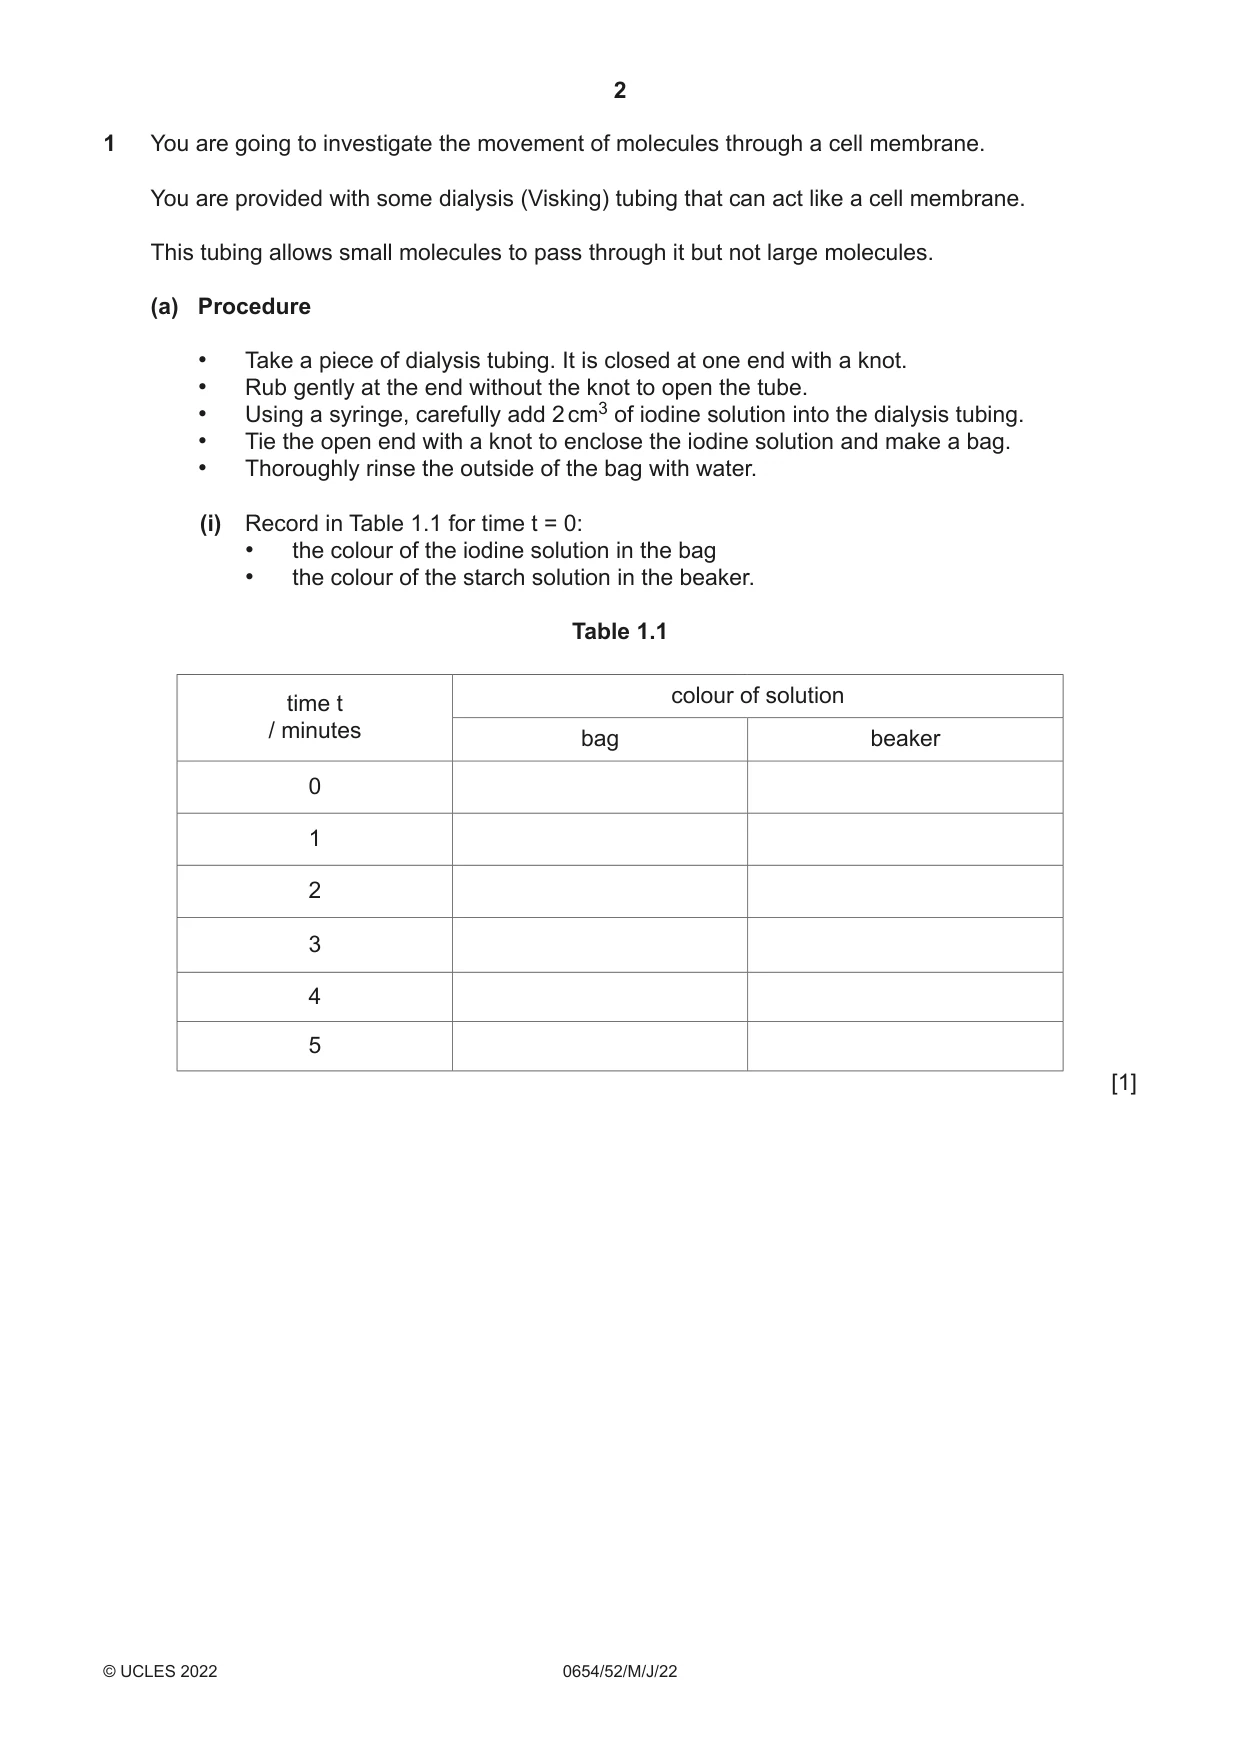
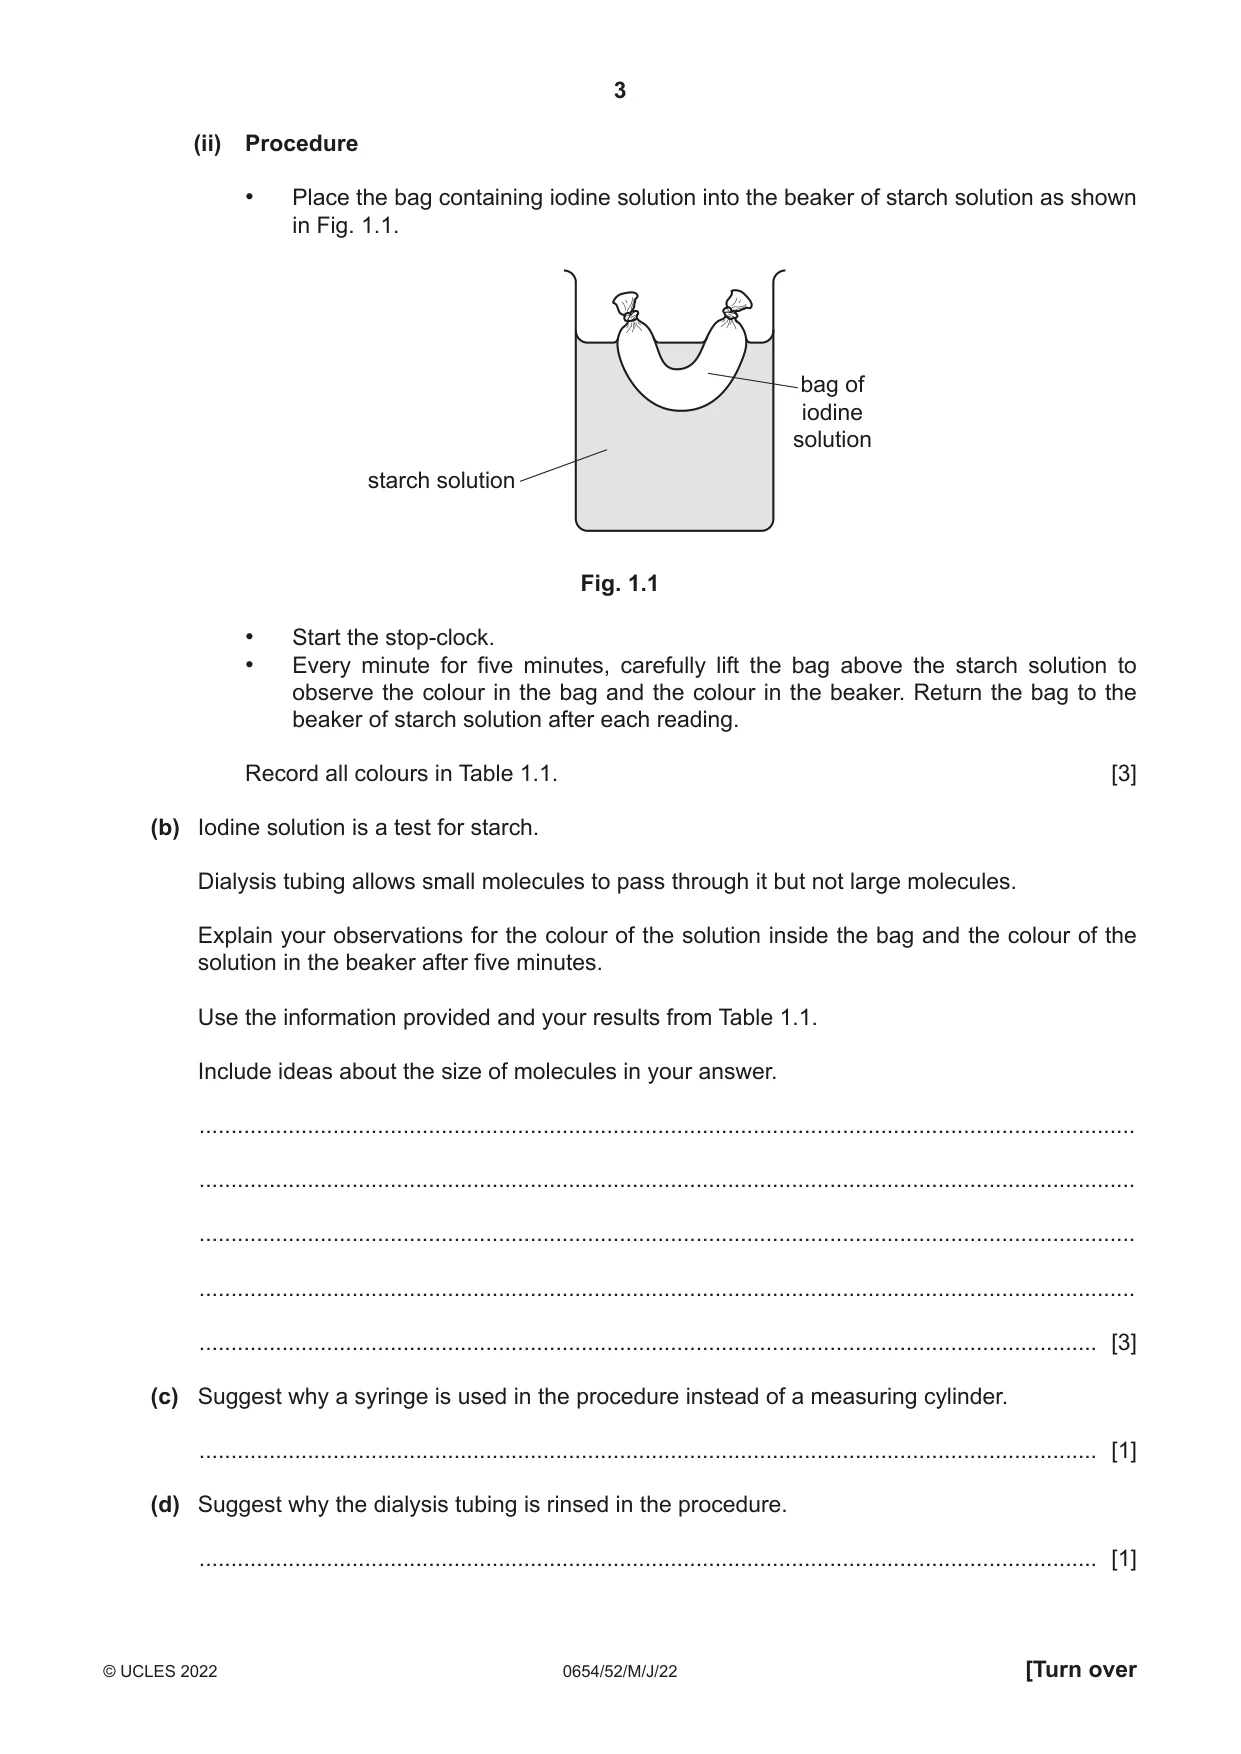
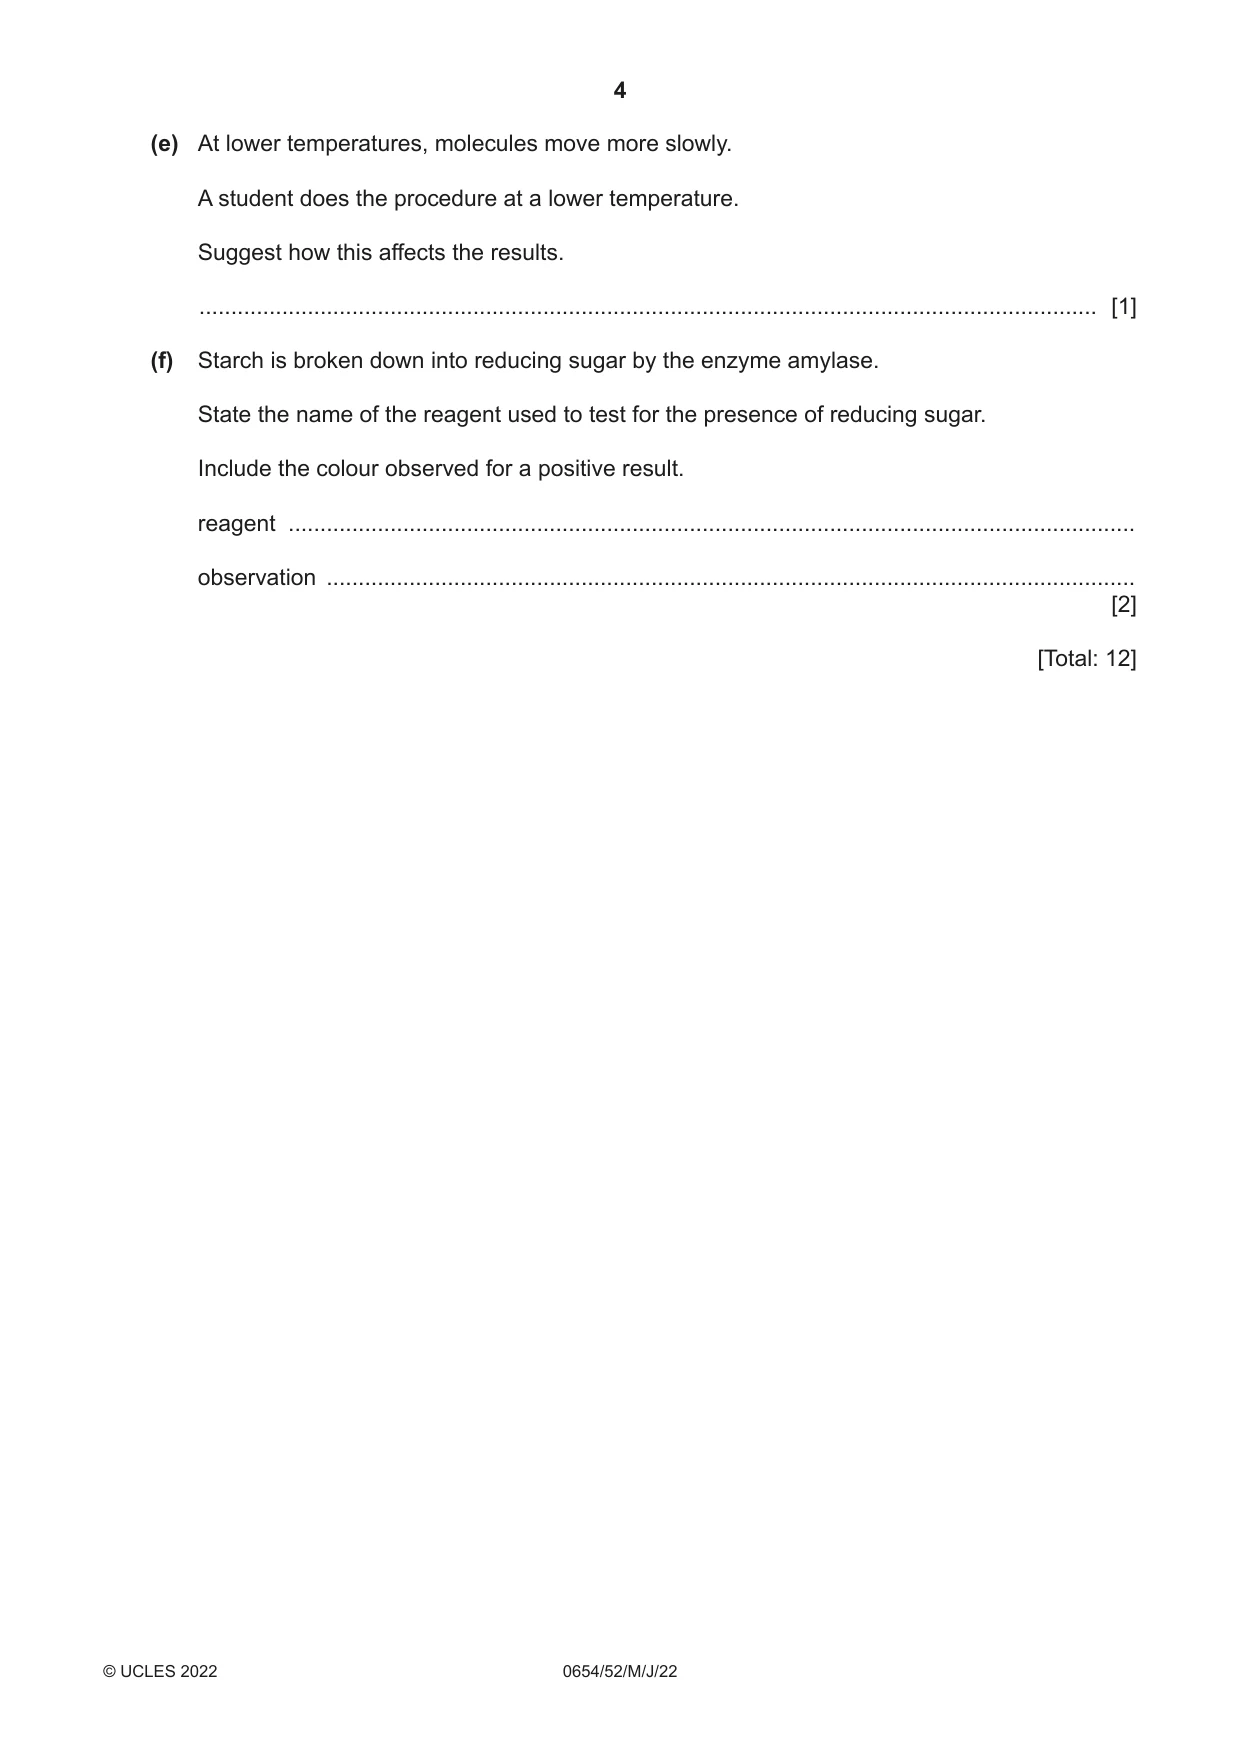
1 You are going to investigate the movement of molecules through a cell membrane. You are provided with some dialysis (Visking) tubing that can act like a cell membrane. This tubing allows small molecules to pass through it but not large molecules. (a) Procedure • Take a piece of dialysis tubing. It is closed at one end with a knot. • Rub gently at the end without the knot to open the tube. • Using a syringe, carefully add 2 cm3 of iodine solution into the dialysis tubing. • Tie the open end with a knot to enclose the iodine solution and make a bag. • Thoroughly rinse the outside of the bag with water. (i) Record in Table 1.1 for time t = 0: • the colour of the iodine solution in the bag • the colour of the starch solution in the beaker. Table 1.1 colour of solution time t / minutes bag beaker 0 1 2 3 4 5 [1] (ii) Procedure • Place the bag containing iodine solution into the beaker of starch solution as shown in Fig. 1.1. bag of iodine solution starch solution Fig. 1.1 • Start the stop-clock. • Every minute for five minutes, carefully lift the bag above the starch solution to observe the colour in the bag and the colour in the beaker. Return the bag to the beaker of starch solution after each reading. Record all colours in Table 1.1. [3] (b) Iodine solution is a test for starch. Dialysis tubing allows small molecules to pass through it but not large molecules. Explain your observations for the colour of the solution inside the bag and the colour of the solution in the beaker after five minutes. Use the information provided and your results from Table 1.1. Include ideas about the size of molecules in your answer. ................................................................................................................................................... ................................................................................................................................................... ................................................................................................................................................... ................................................................................................................................................... ............................................................................................................................................. [3] (c) Suggest why a syringe is used in the procedure instead of a measuring cylinder. ............................................................................................................................................. [1] (d) Suggest why the dialysis tubing is rinsed in the procedure. ............................................................................................................................................. [1] (e) At lower temperatures, molecules move more slowly. A student does the procedure at a lower temperature. Suggest how this affects the results. ............................................................................................................................................. [1] (f) Starch is broken down into reducing sugar by the enzyme amylase. State the name of the reagent used to test for the presence of reducing sugar. Include the colour observed for a positive result. reagent ..................................................................................................................................... observation ............................................................................................................................... [2] [Total: 12]
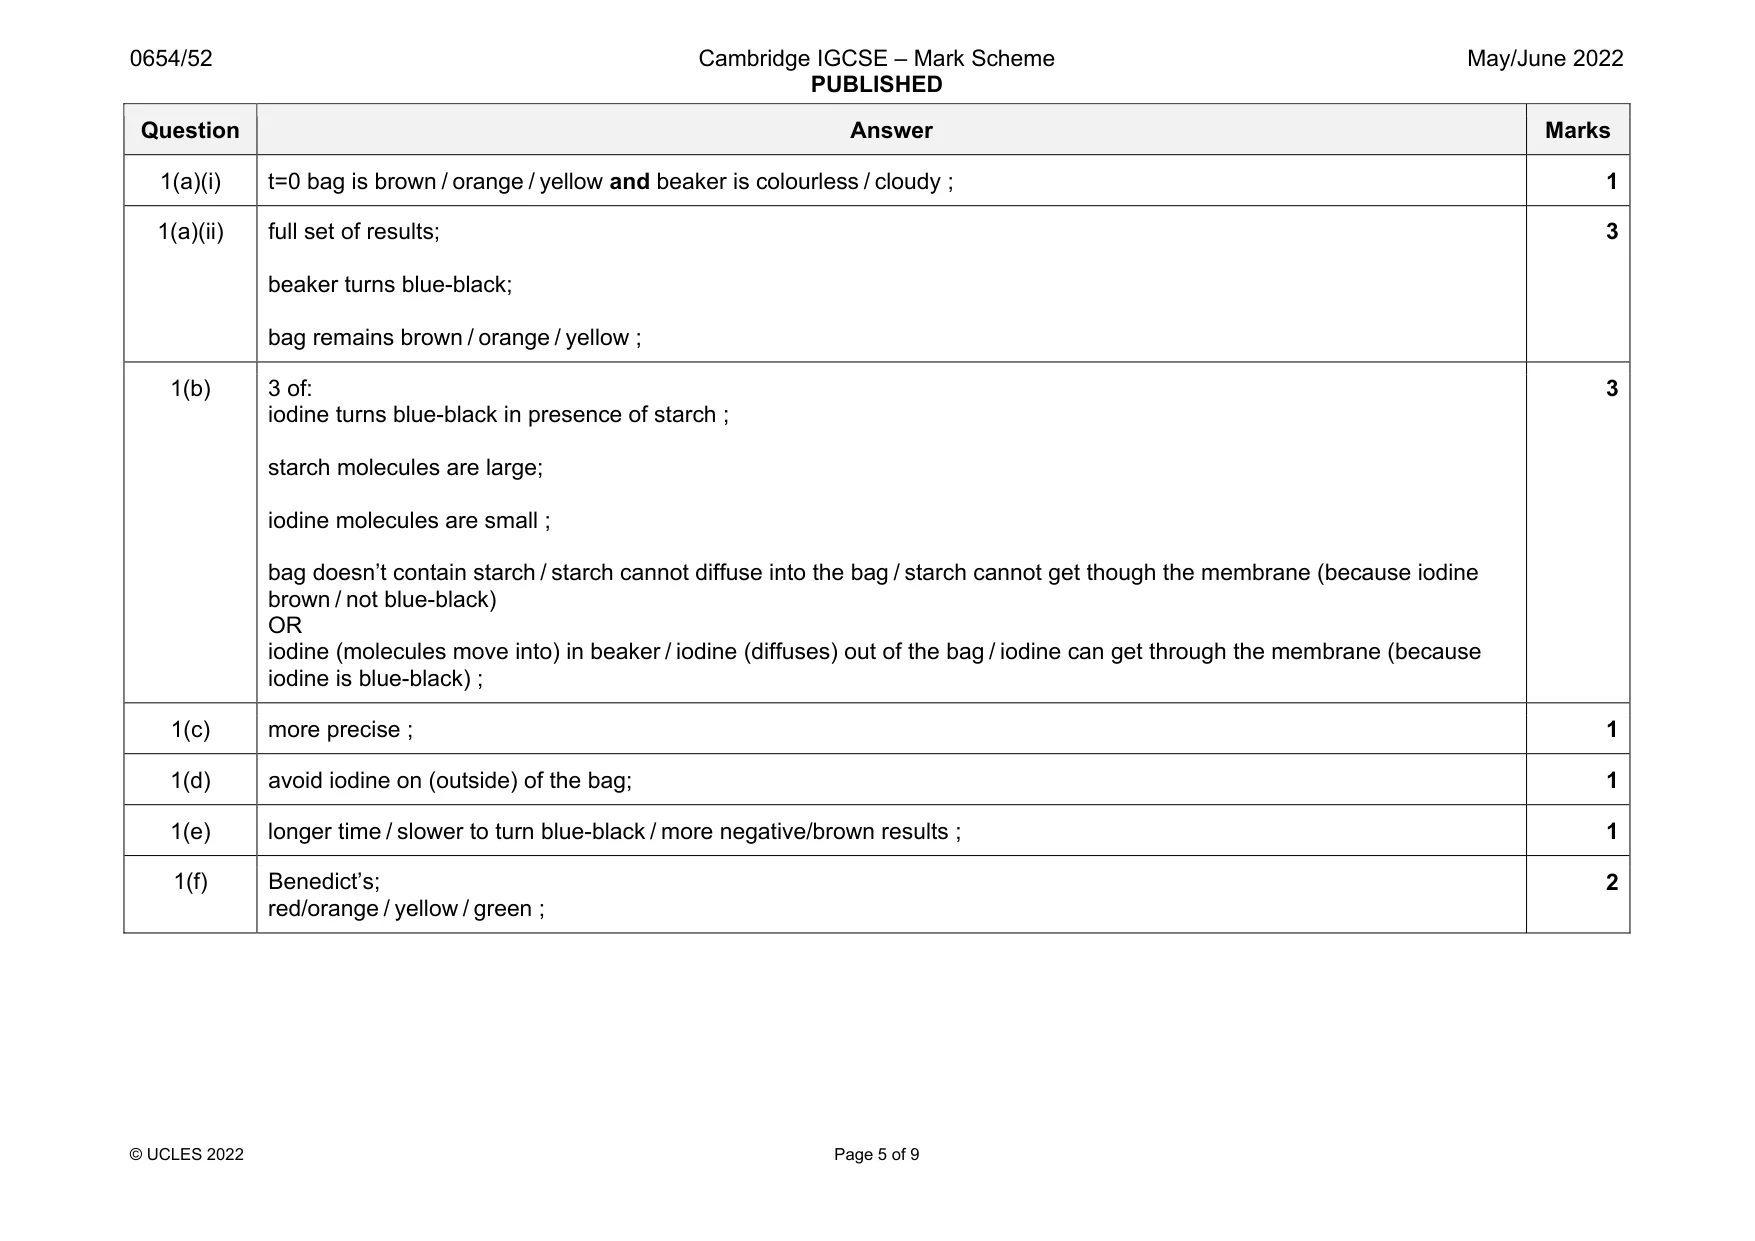
Mark scheme: 1(a)(i) t=0 bag is brown / orange / yellow and beaker is colourless / cloudy ; 1 1(a)(ii) full set of results; beaker turns blue-black; bag remains brown / orange / yellow ; 3 1(b) 3 of: iodine turns blue-black in presence of starch ; starch molecules are large; iodine molecules are small ; bag doesn’t contain starch / starch cannot diffuse into the bag / starch cannot get though the membrane (because iodine brown / not blue-black) OR iodine (molecules move into) in beaker / iodine (diffuses) out of the bag / iodine can get through the membrane (because iodine is blue-black) ; 3 1(c) more precise ; 1 1(d) avoid iodine on (outside) of the bag; 1 1(e) longer time / slower to turn blue-black / more negative/brown results ; 1 1(f) Benedict’s; red/orange / yellow / green ; 2
Q2 · A magnified section through part of a leaf
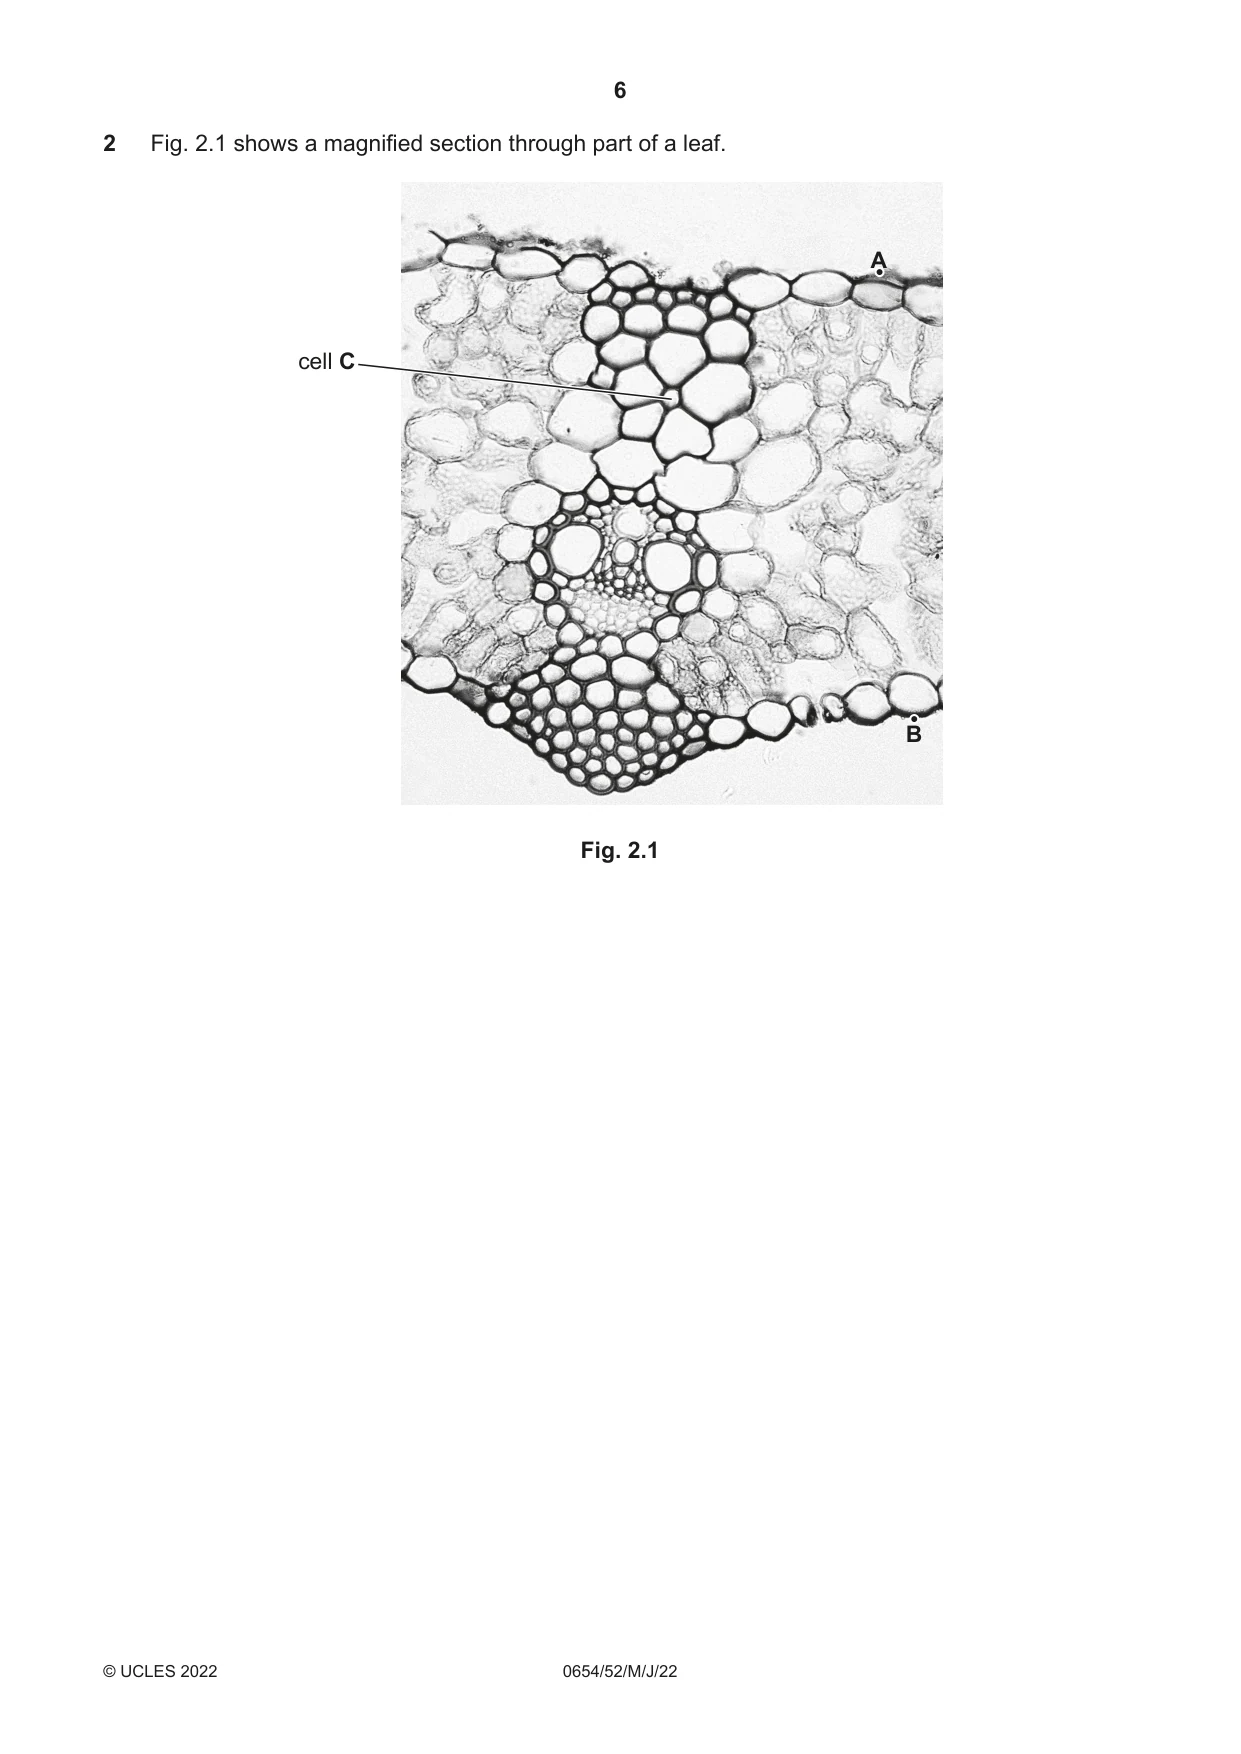
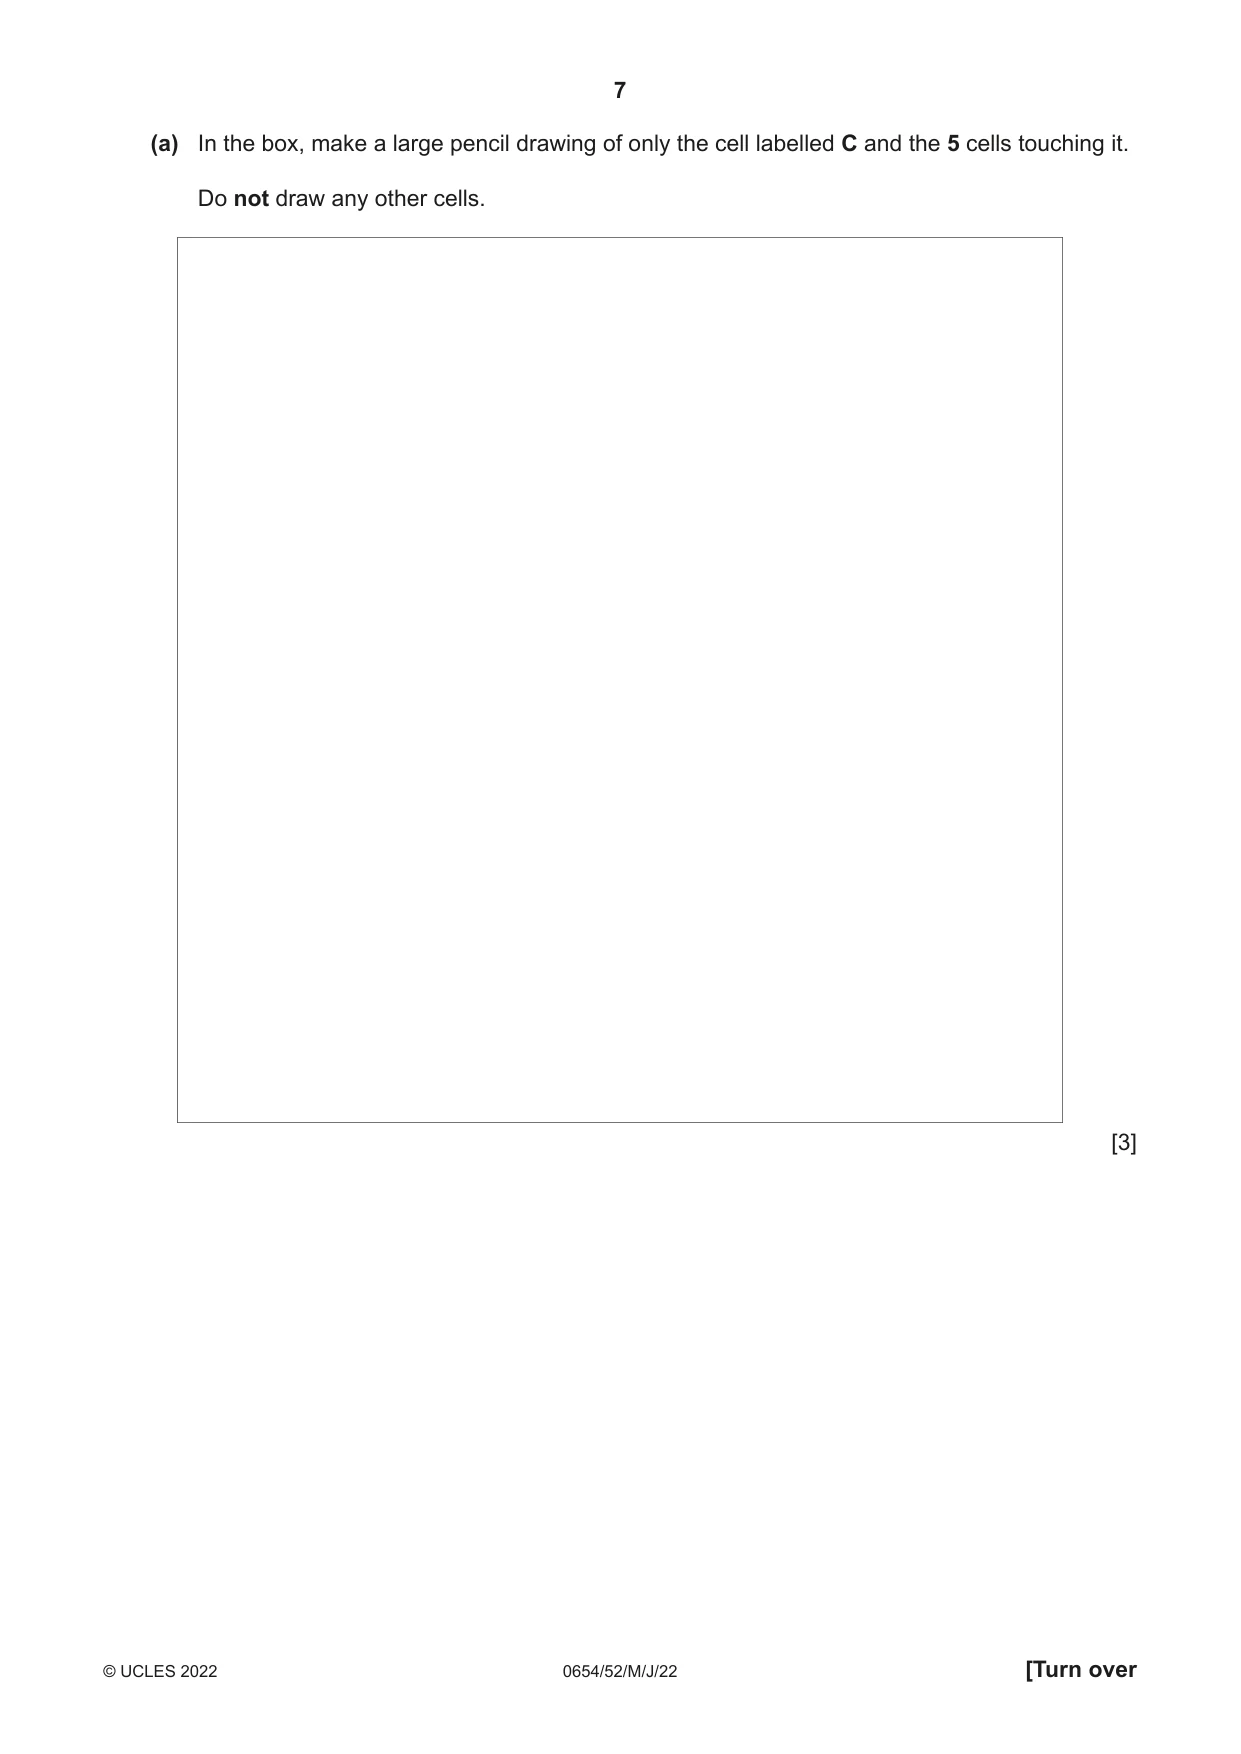
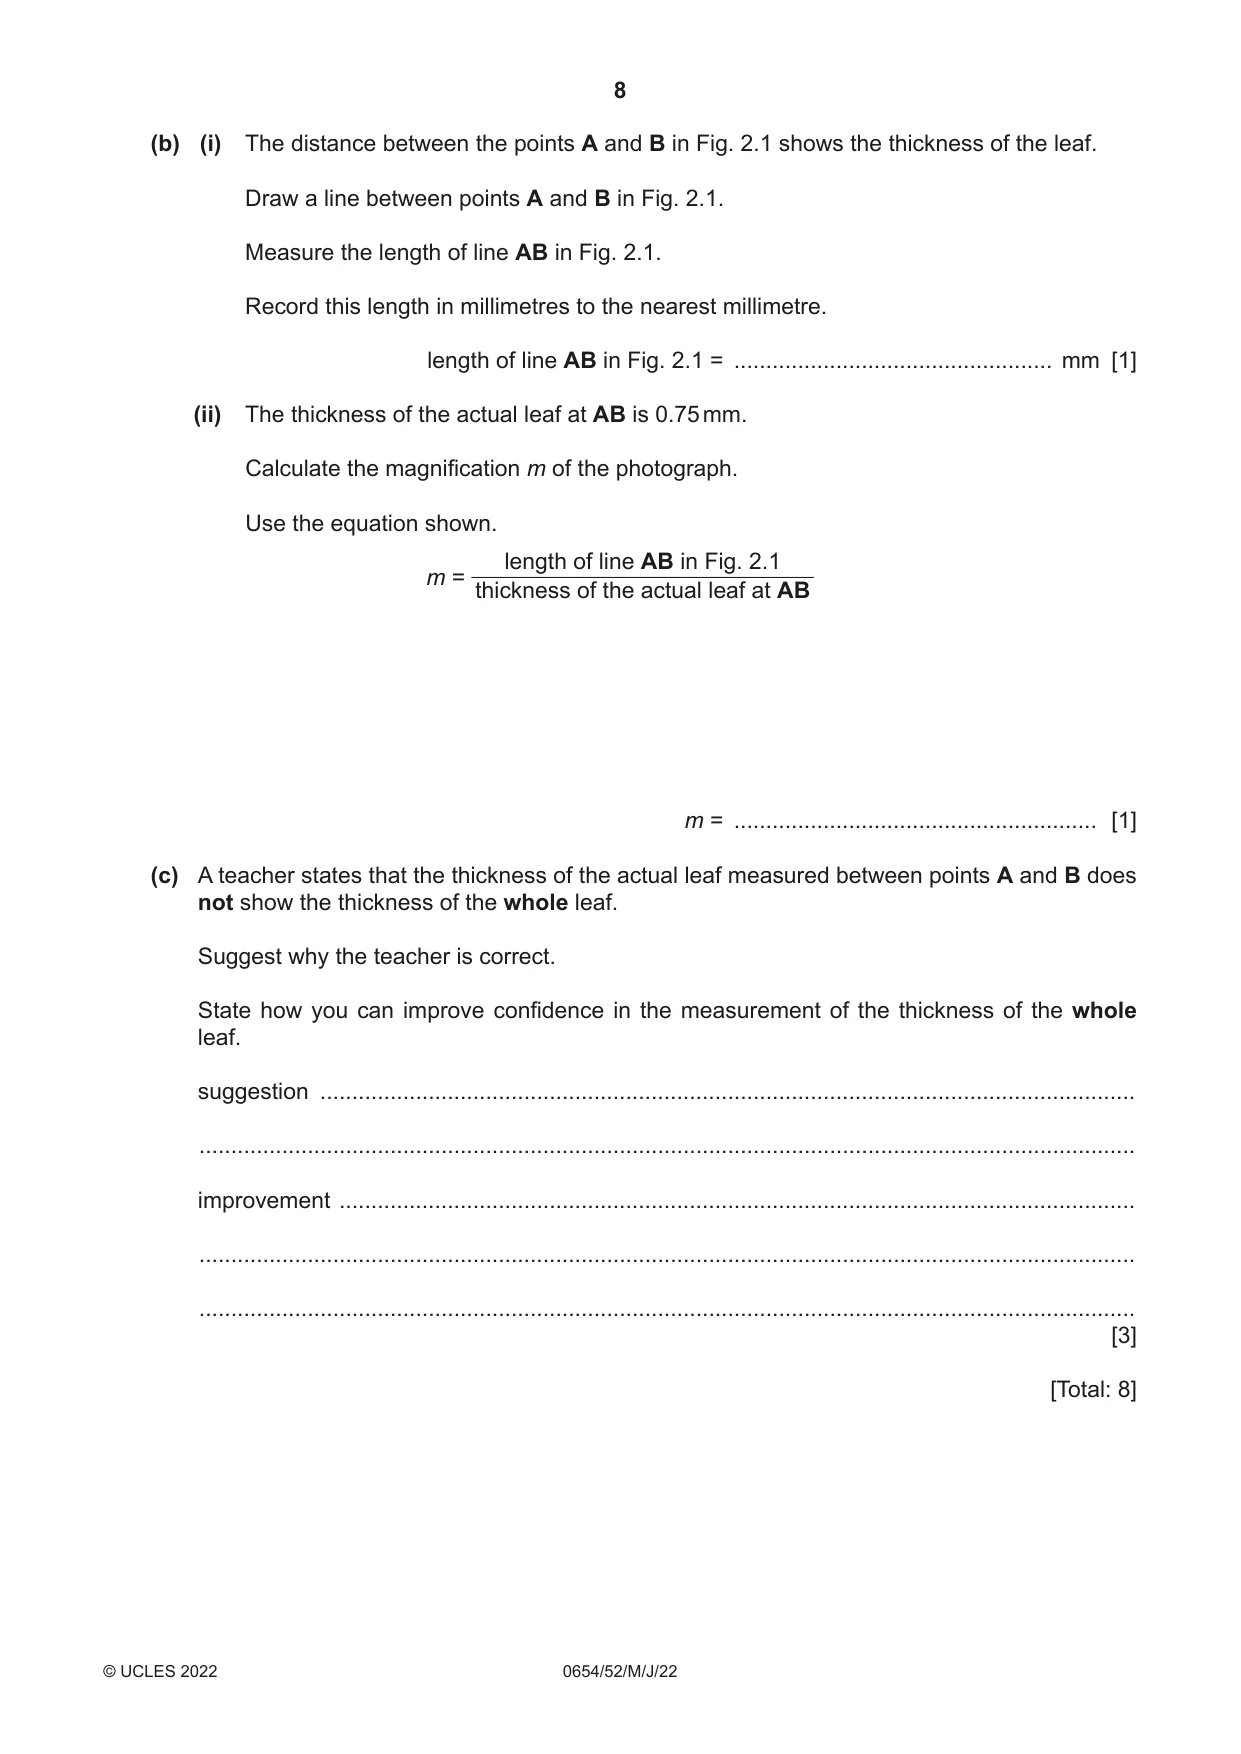
2 Fig. 2.1 shows a magnified section through part of a leaf. A cell C B Fig. 2.1 (a) In the box, make a large pencil drawing of only the cell labelled C and the 5 cells touching it. Do not draw any other cells. [3] (b) (i) The distance between the points A and B in Fig. 2.1 shows the thickness of the leaf. Draw a line between points A and B in Fig. 2.1. Measure the length of line AB in Fig. 2.1. Record this length in millimetres to the nearest millimetre. length of line AB in Fig. 2.1 = .................................................. mm [1] (ii) The thickness of the actual leaf at AB is 0.75 mm. Calculate the magnification m of the photograph. Use the equation shown. length of line AB in Fig. 2.1 m = thickness of the actual leaf at AB m = ......................................................... [1] (c) A teacher states that the thickness of the actual leaf measured between points A and B does not show the thickness of the whole leaf. Suggest why the teacher is correct. State how you can improve confidence in the measurement of the thickness of the whole leaf. suggestion ................................................................................................................................ ................................................................................................................................................... improvement ............................................................................................................................. ................................................................................................................................................... ................................................................................................................................................... [3] [Total: 8]
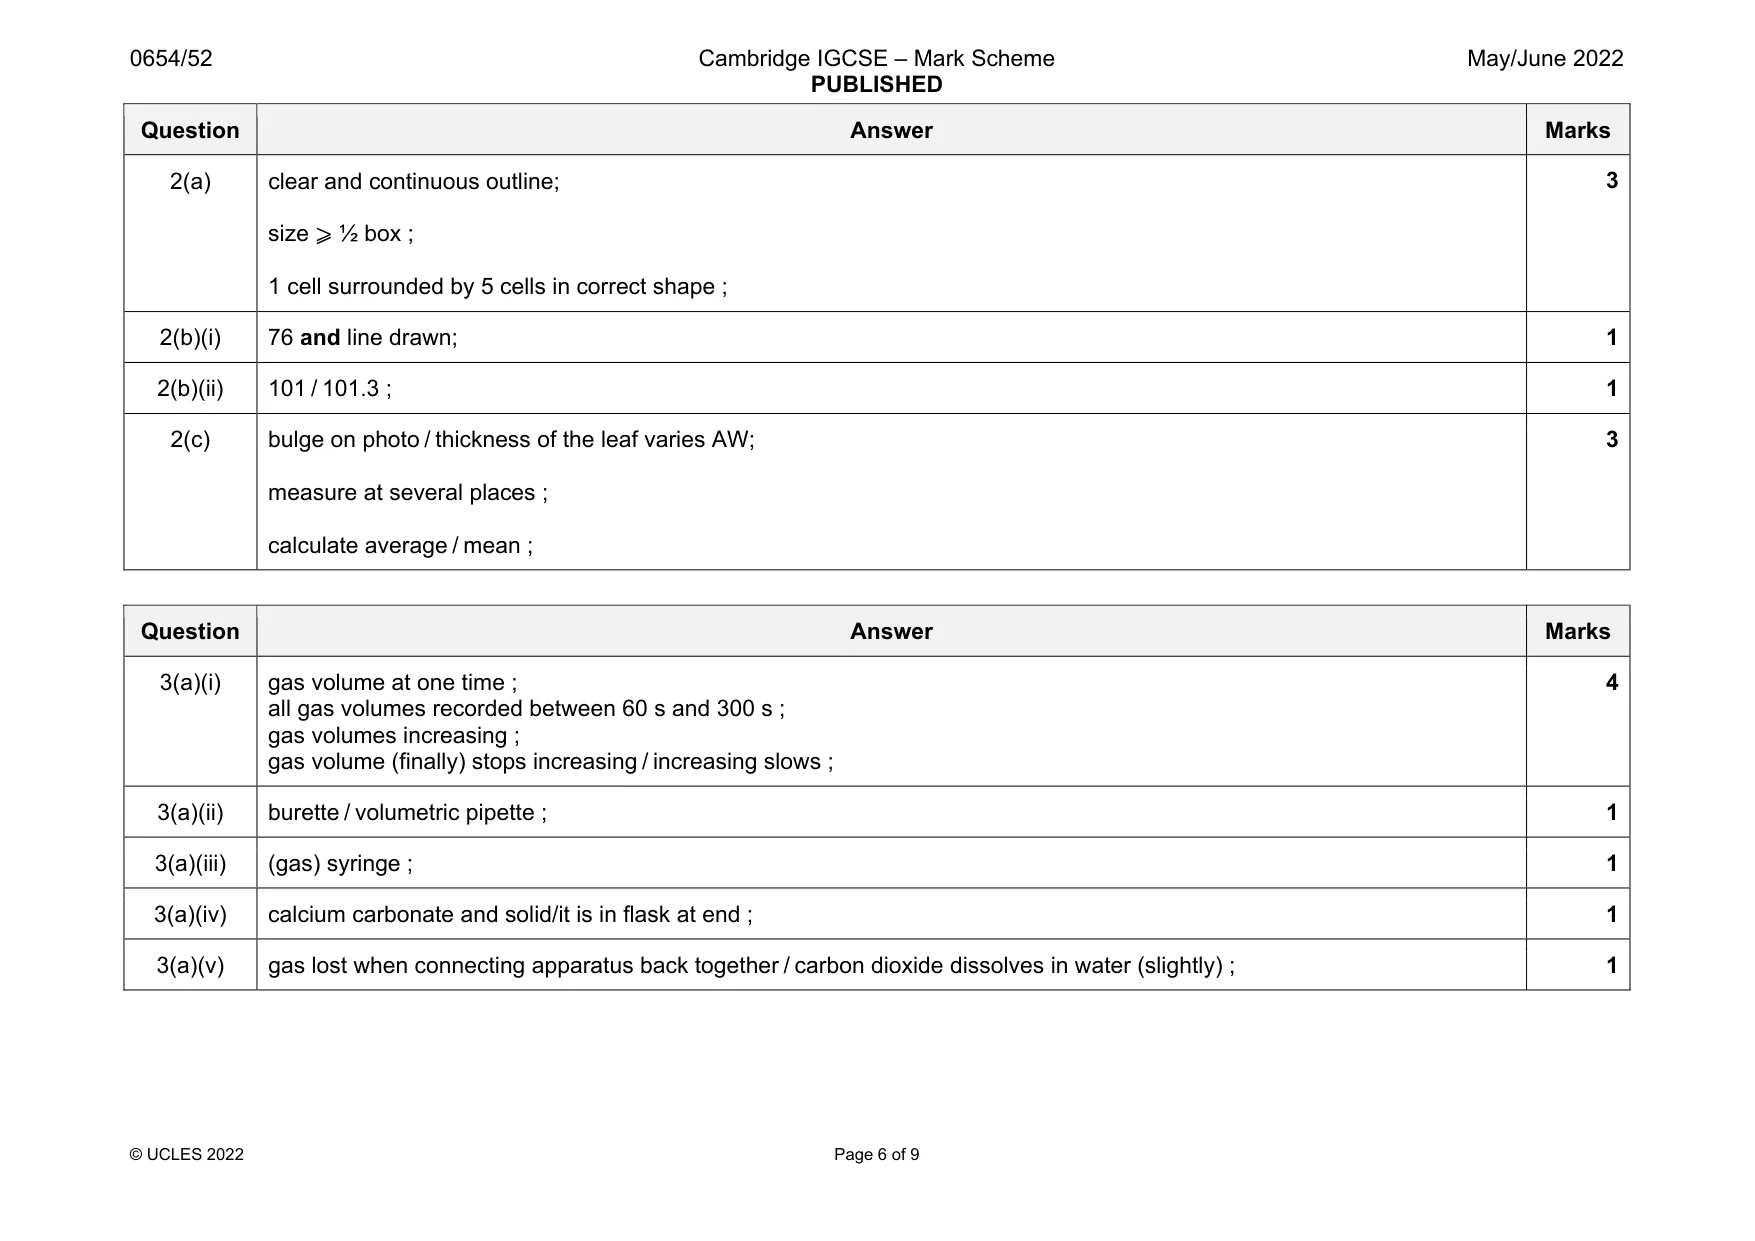
Mark scheme: 2(a) clear and continuous outline; size ⩾ ½ box ; 1 cell surrounded by 5 cells in correct shape ; 2(b)(i) 76 and line drawn; 1 2(b)(ii) 101 / 101.3 ; 1 2(c) bulge on photo / thickness of the leaf varies AW; measure at several places ; calculate average / mean ; 3
Q3 · You are going to investigate the rate of reaction when calcium carbonate reacts with…
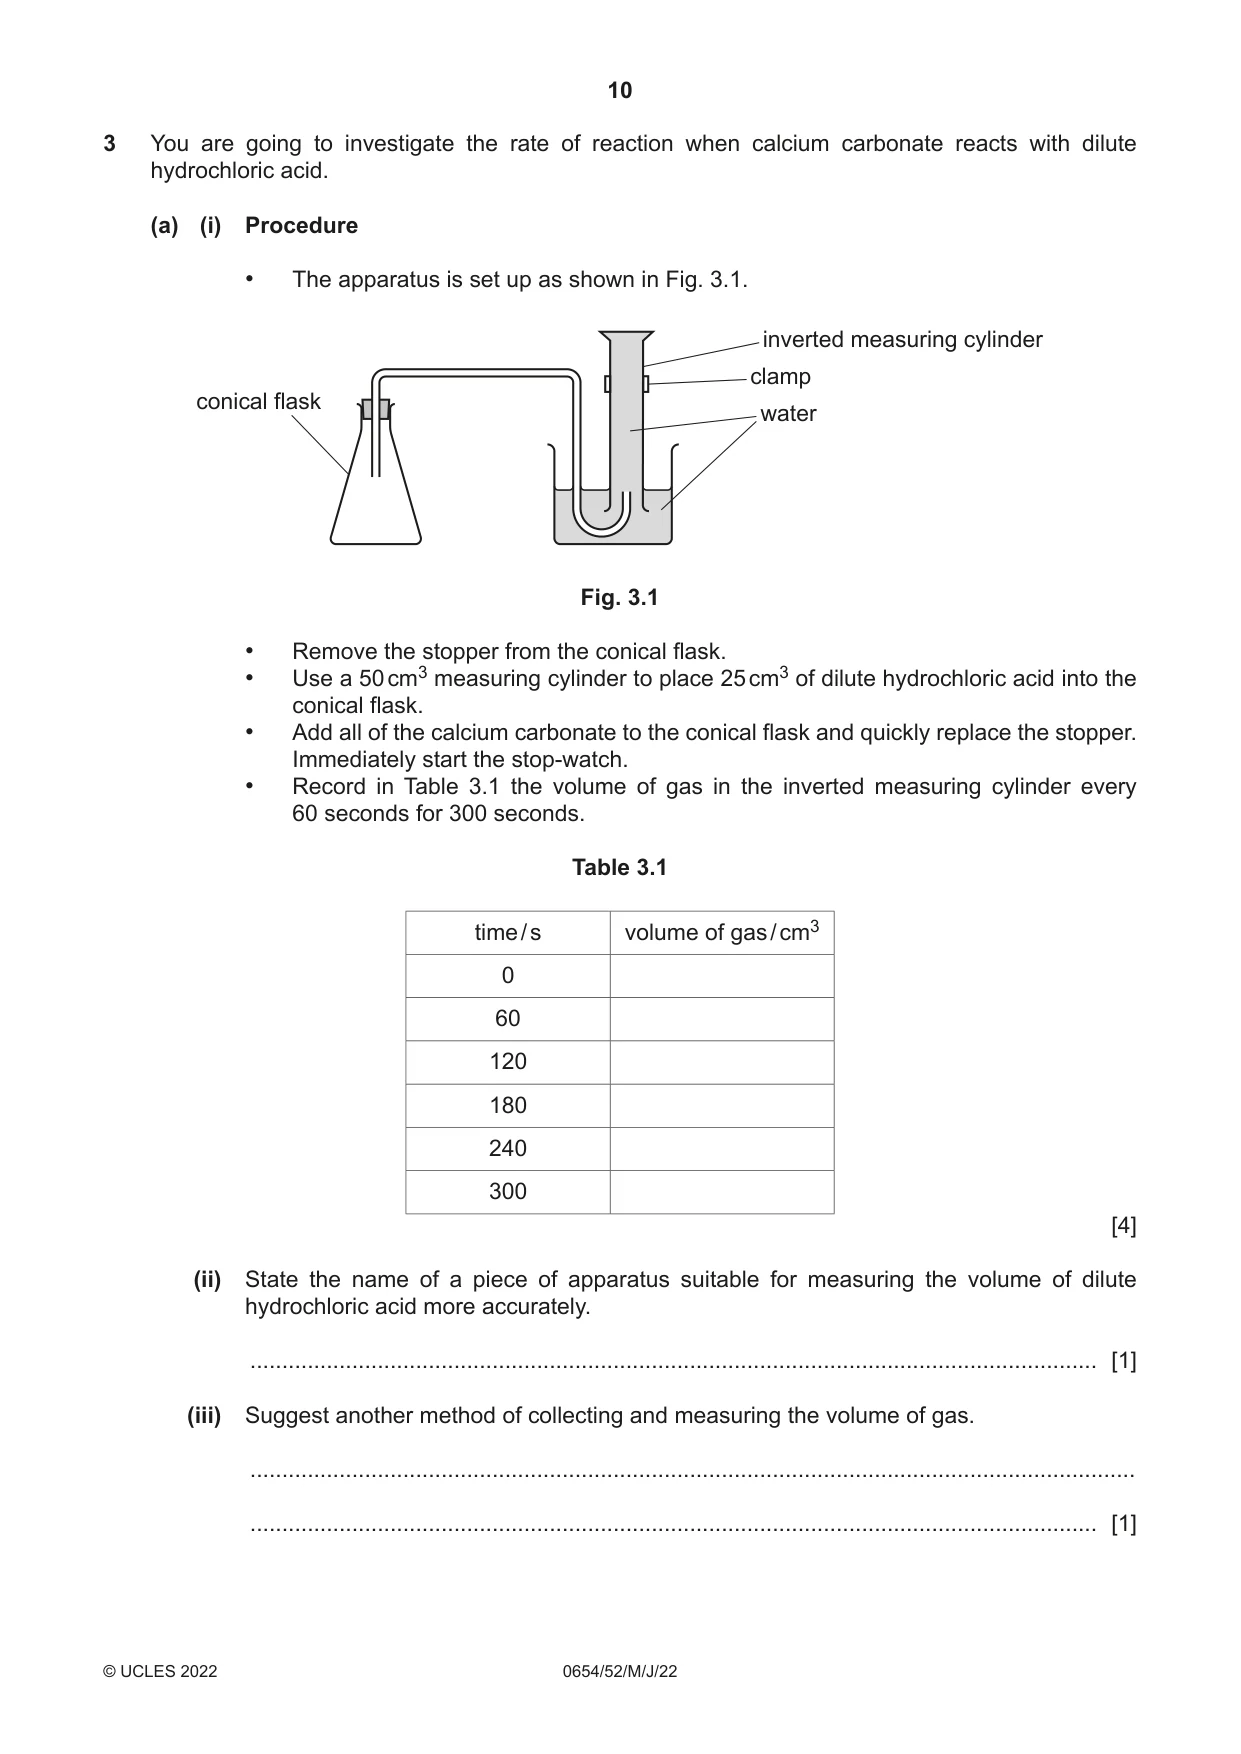
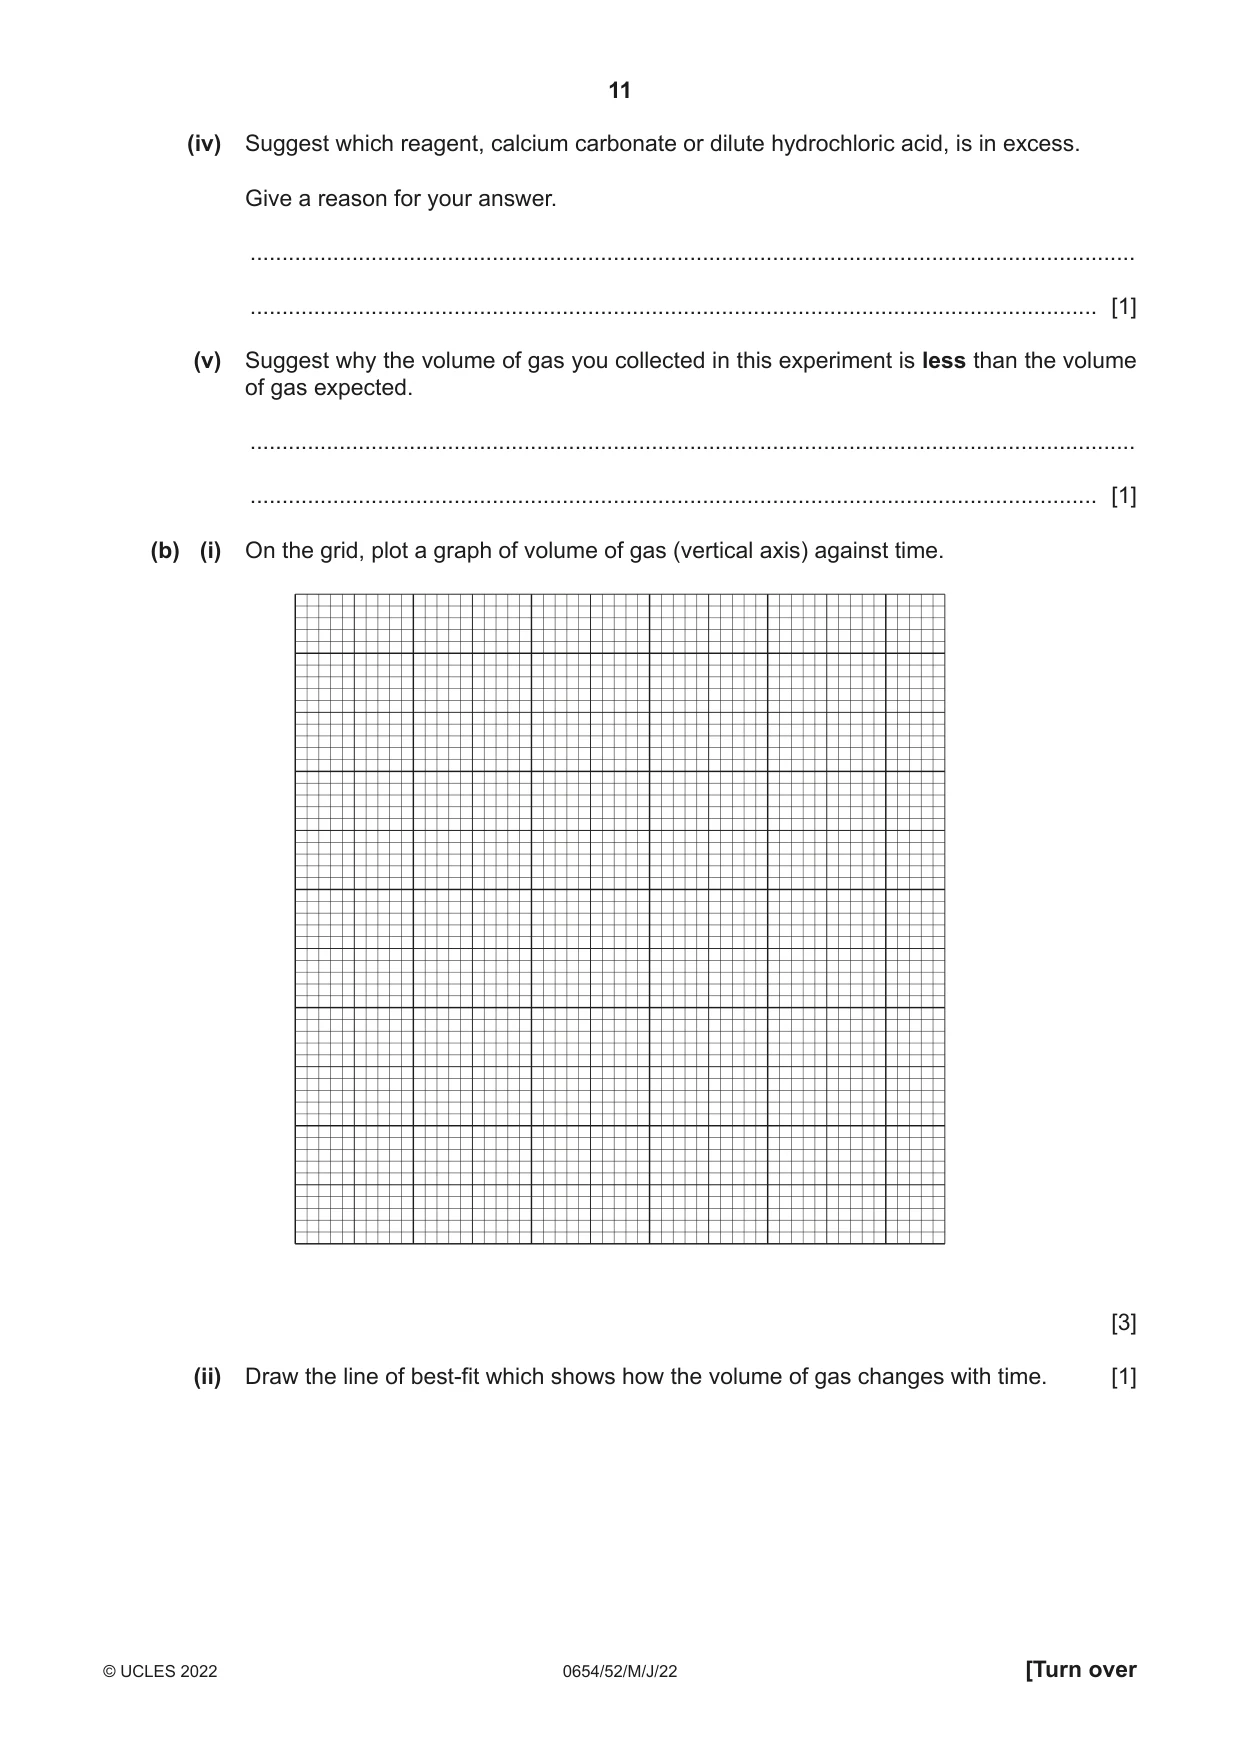
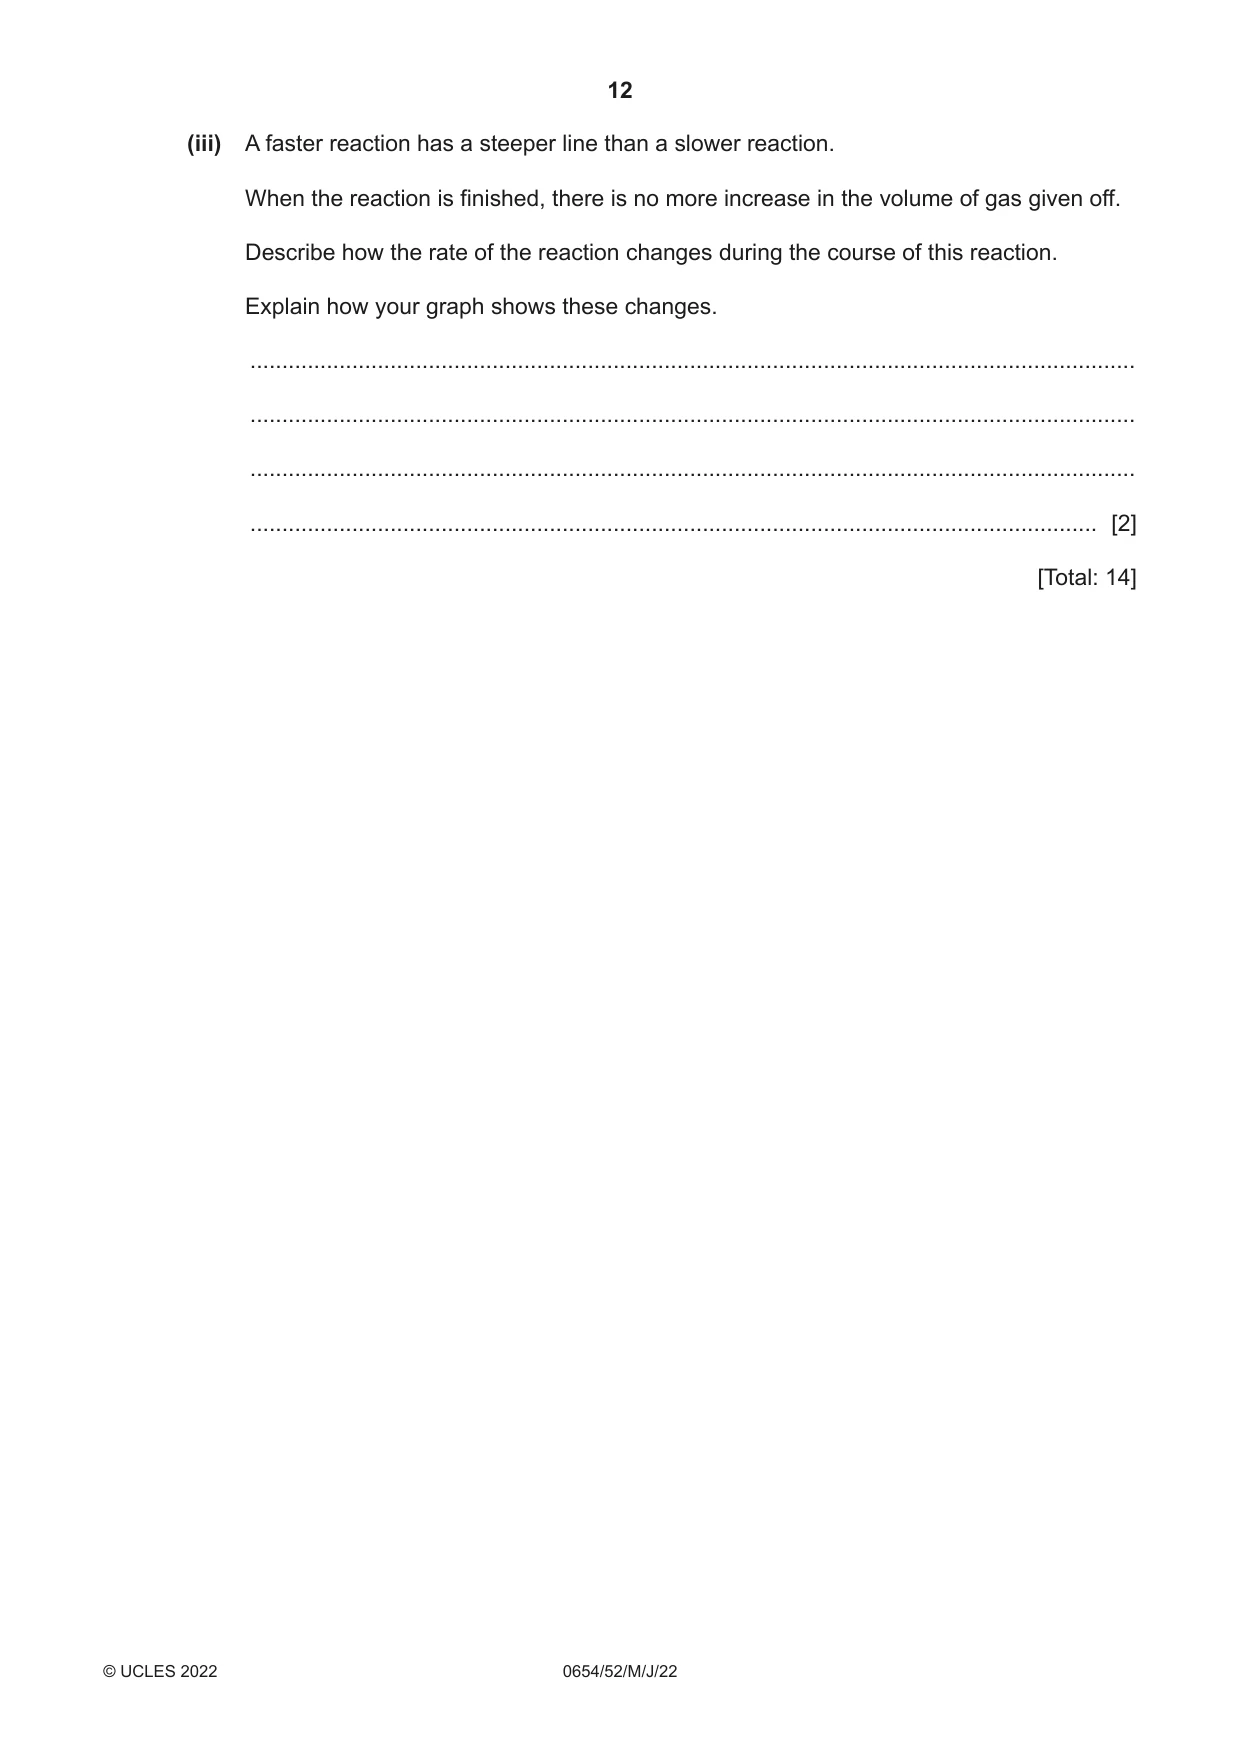
3 You are going to investigate the rate of reaction when calcium carbonate reacts with dilute hydrochloric acid. (a) (i) Procedure • The apparatus is set up as shown in Fig. 3.1. inverted measuring cylinder clamp conical flask water Fig. 3.1 • Remove the stopper from the conical flask. • Use a 50 cm3 measuring cylinder to place 25 cm3 of dilute hydrochloric acid into the conical flask. • Add all of the calcium carbonate to the conical flask and quickly replace the stopper. Immediately start the stop-watch. • Record in Table 3.1 the volume of gas in the inverted measuring cylinder every 60 seconds for 300 seconds. Table 3.1 time / s volume of gas / cm3 0 60 120 180 240 300 [4] (ii) State the name of a piece of apparatus suitable for measuring the volume of dilute hydrochloric acid more accurately. ..................................................................................................................................... [1] (iii) Suggest another method of collecting and measuring the volume of gas. ........................................................................................................................................... ..................................................................................................................................... [1] (iv) Suggest which reagent, calcium carbonate or dilute hydrochloric acid, is in excess. Give a reason for your answer. ........................................................................................................................................... ..................................................................................................................................... [1] (v) Suggest why the volume of gas you collected in this experiment is less than the volume of gas expected. ........................................................................................................................................... ..................................................................................................................................... [1] (b) (i) On the grid, plot a graph of volume of gas (vertical axis) against time. [3] (ii) Draw the line of best-fit which shows how the volume of gas changes with time. [1] (iii) A faster reaction has a steeper line than a slower reaction. When the reaction is finished, there is no more increase in the volume of gas given off. Describe how the rate of the reaction changes during the course of this reaction. Explain how your graph shows these changes. ........................................................................................................................................... ........................................................................................................................................... ........................................................................................................................................... ..................................................................................................................................... [2] [Total: 14]
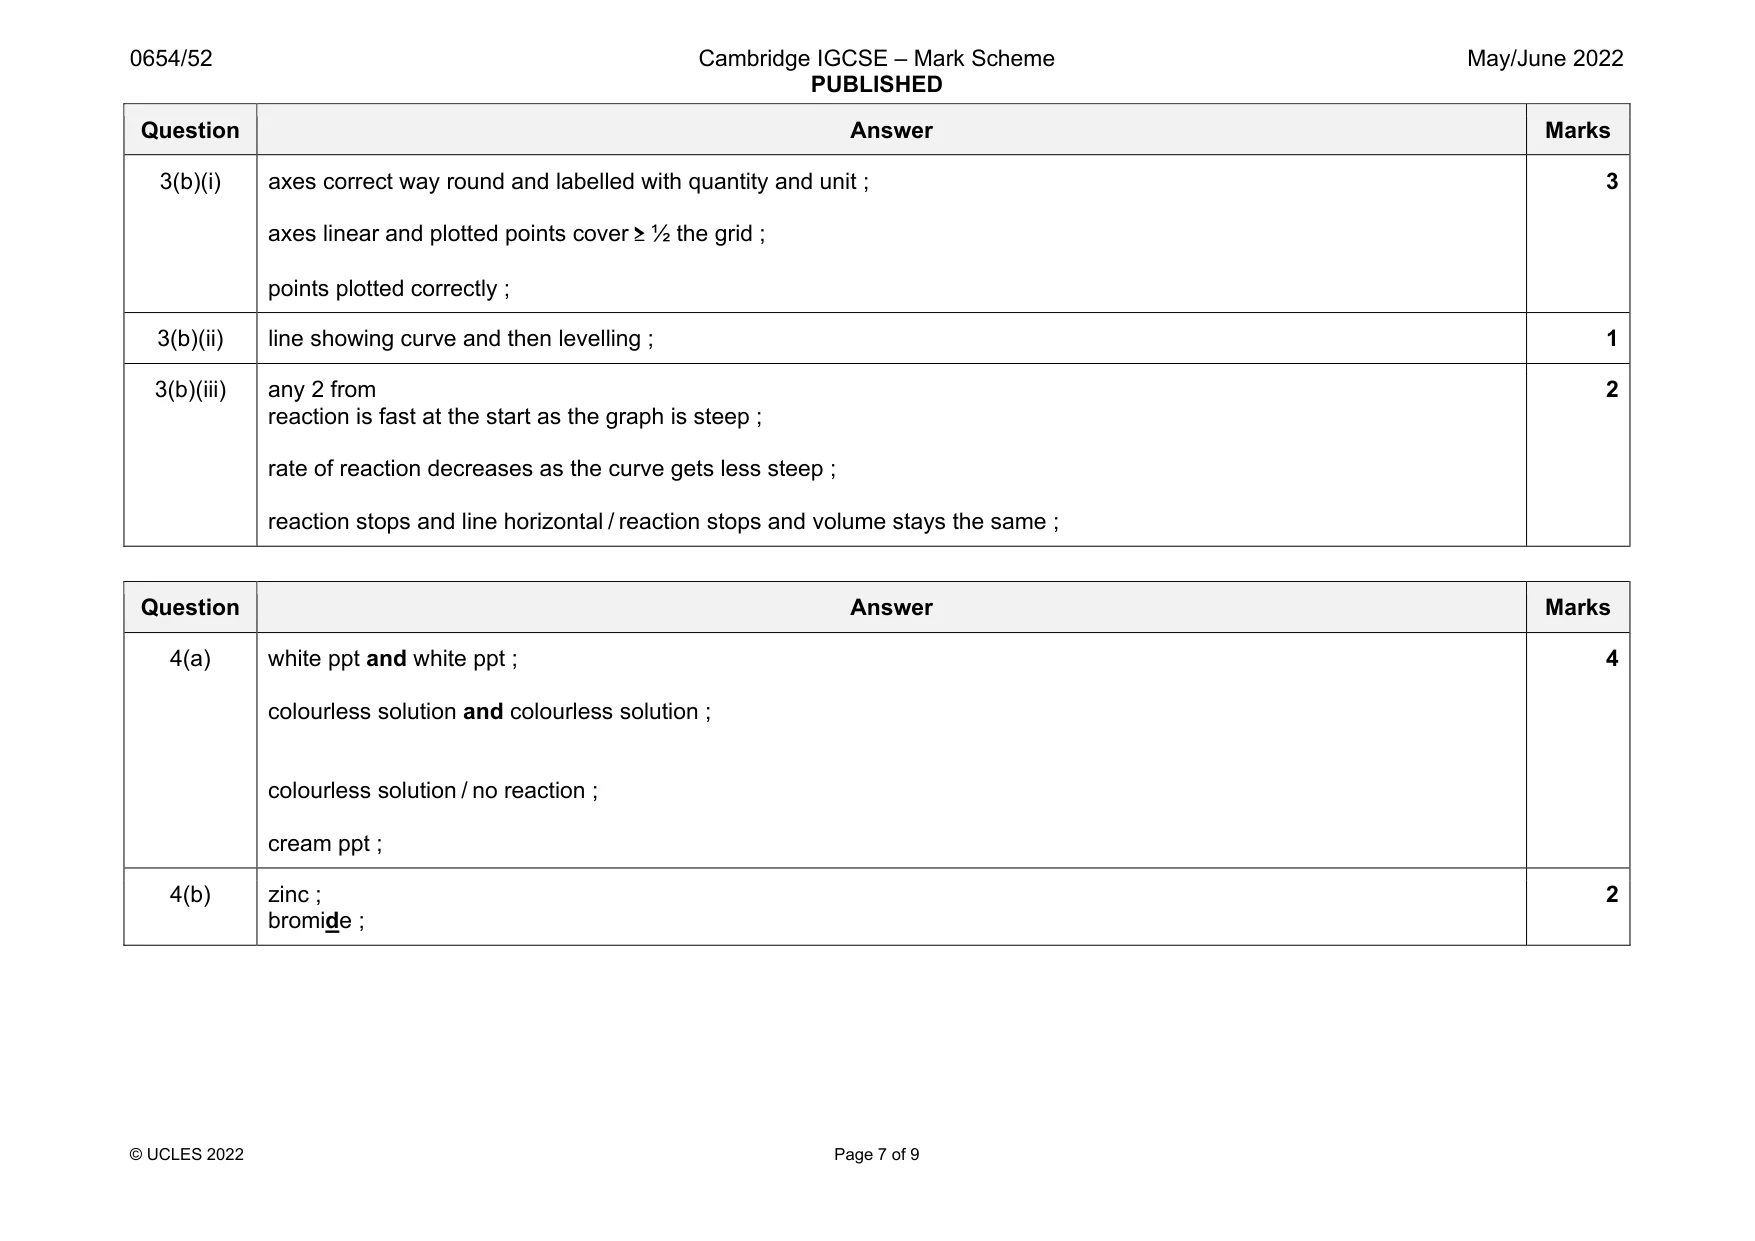
Mark scheme: 3(a)(i) gas volume at one time ; all gas volumes recorded between 60 s and 300 s ; gas volumes increasing ; gas volume (finally) stops increasing / increasing slows ; 3(a)(ii) burette / volumetric pipette ; 1 3(a)(iii) (gas) syringe ; 1 3(a)(iv) calcium carbonate and solid/it is in flask at end ; 1 3(a)(v) gas lost when connecting apparatus back together / carbon dioxide dissolves in water (slightly) ; 1 Question Answer Marks 3(b)(i) axes correct way round and labelled with quantity and unit ; axes linear and plotted points cover ≥ ½ the grid ; points plotted correctly ; 3 3(b)(ii) line showing curve and then levelling ; 1 3(b)(iii) any 2 from reaction is fast at the start as the graph is steep ; rate of reaction decreases as the curve gets less steep ; reaction stops and line horizontal / reaction stops and volume stays the same ; 2
Q4 · You are going to identify the ions present in solution R
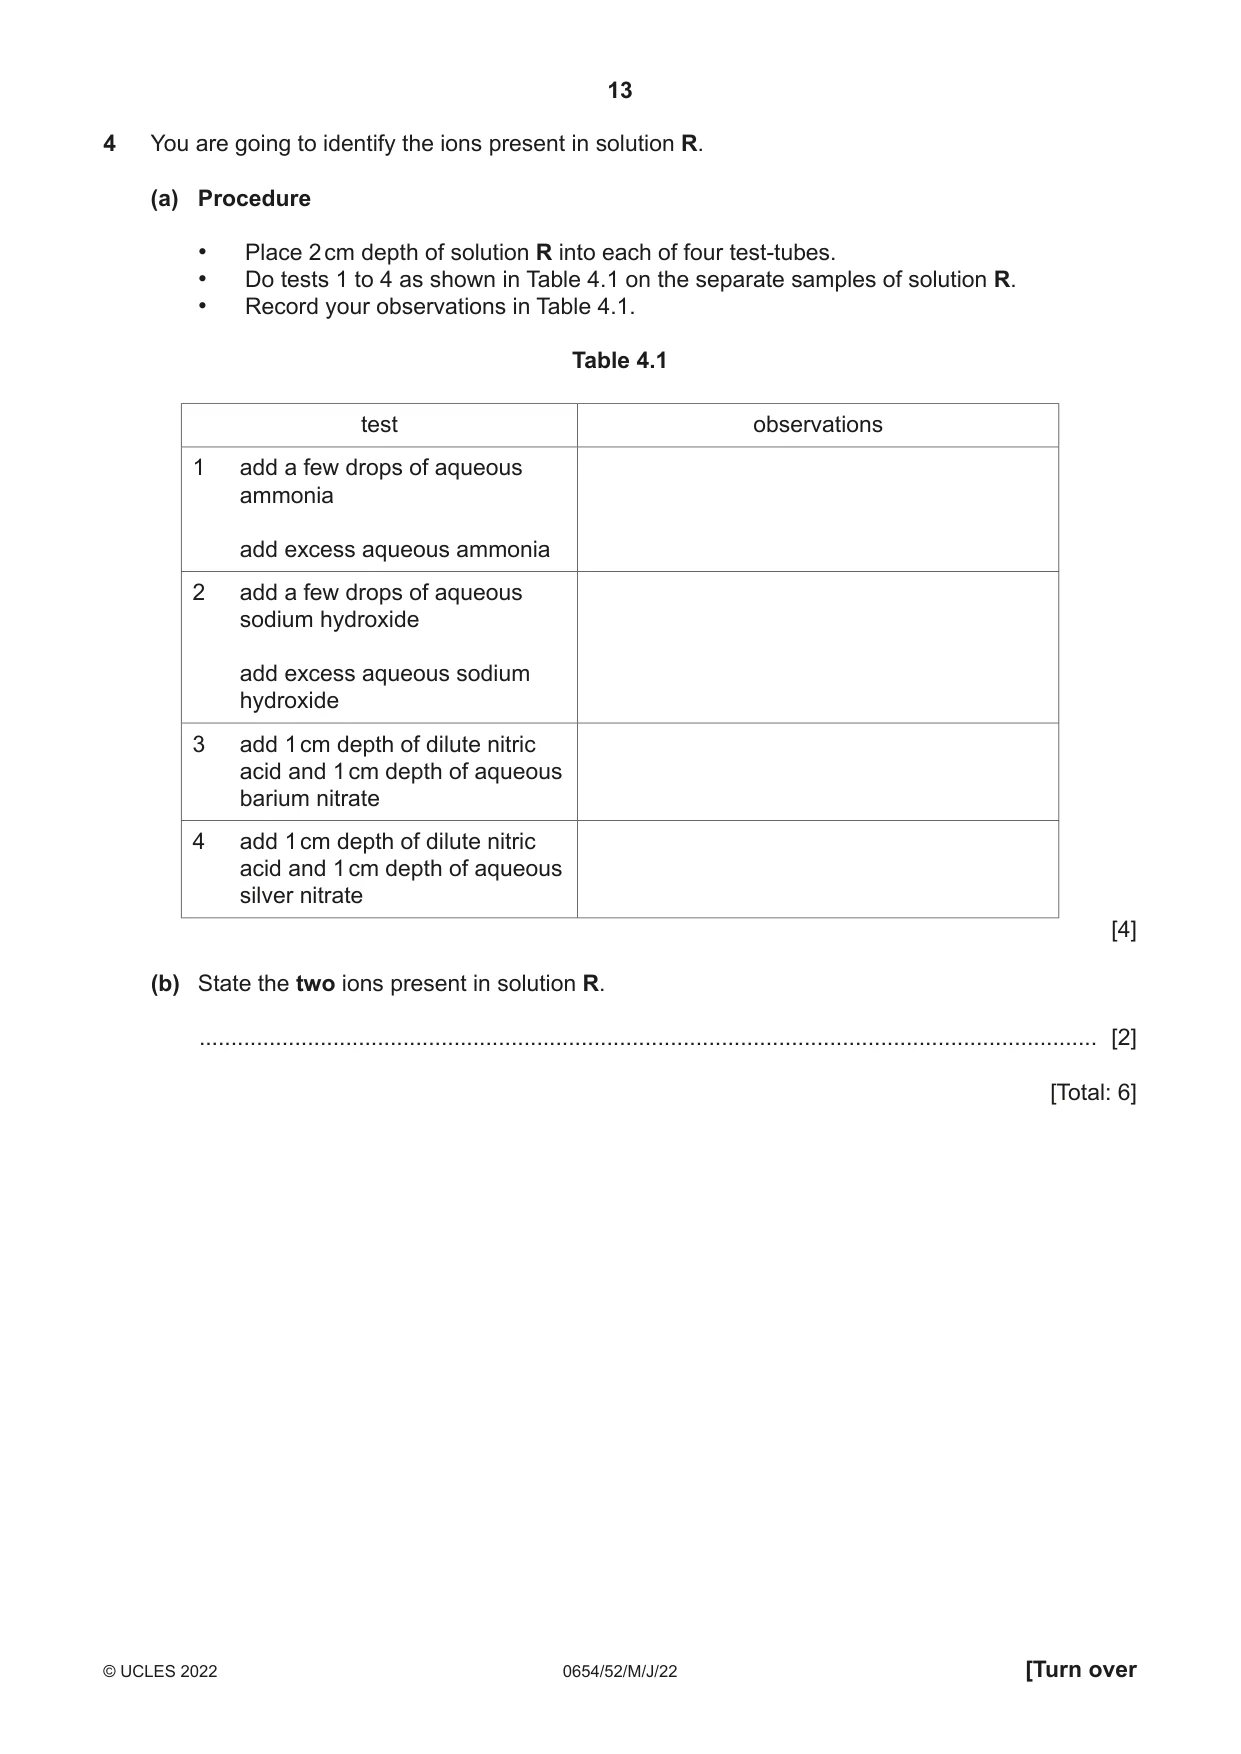
4 You are going to identify the ions present in solution R. (a) Procedure • Place 2 cm depth of solution R into each of four test-tubes. • Do tests 1 to 4 as shown in Table 4.1 on the separate samples of solution R. • Record your observations in Table 4.1. Table 4.1 test observations 1 add a few drops of aqueous ammonia add excess aqueous ammonia 2 add a few drops of aqueous sodium hydroxide add excess aqueous sodium hydroxide 3 add 1 cm depth of dilute nitric acid and 1 cm depth of aqueous barium nitrate 4 add 1 cm depth of dilute nitric acid and 1 cm depth of aqueous silver nitrate [4] (b) State the two ions present in solution R. ............................................................................................................................................. [2] [Total: 6]
Mark scheme: 4(a) white ppt and white ppt ; colourless solution and colourless solution ; colourless solution / no reaction ; cream ppt ; 4(b) zinc ; bromide ; 2
Q5 · You are going to investigate the resistance of different combinations of identical lamps
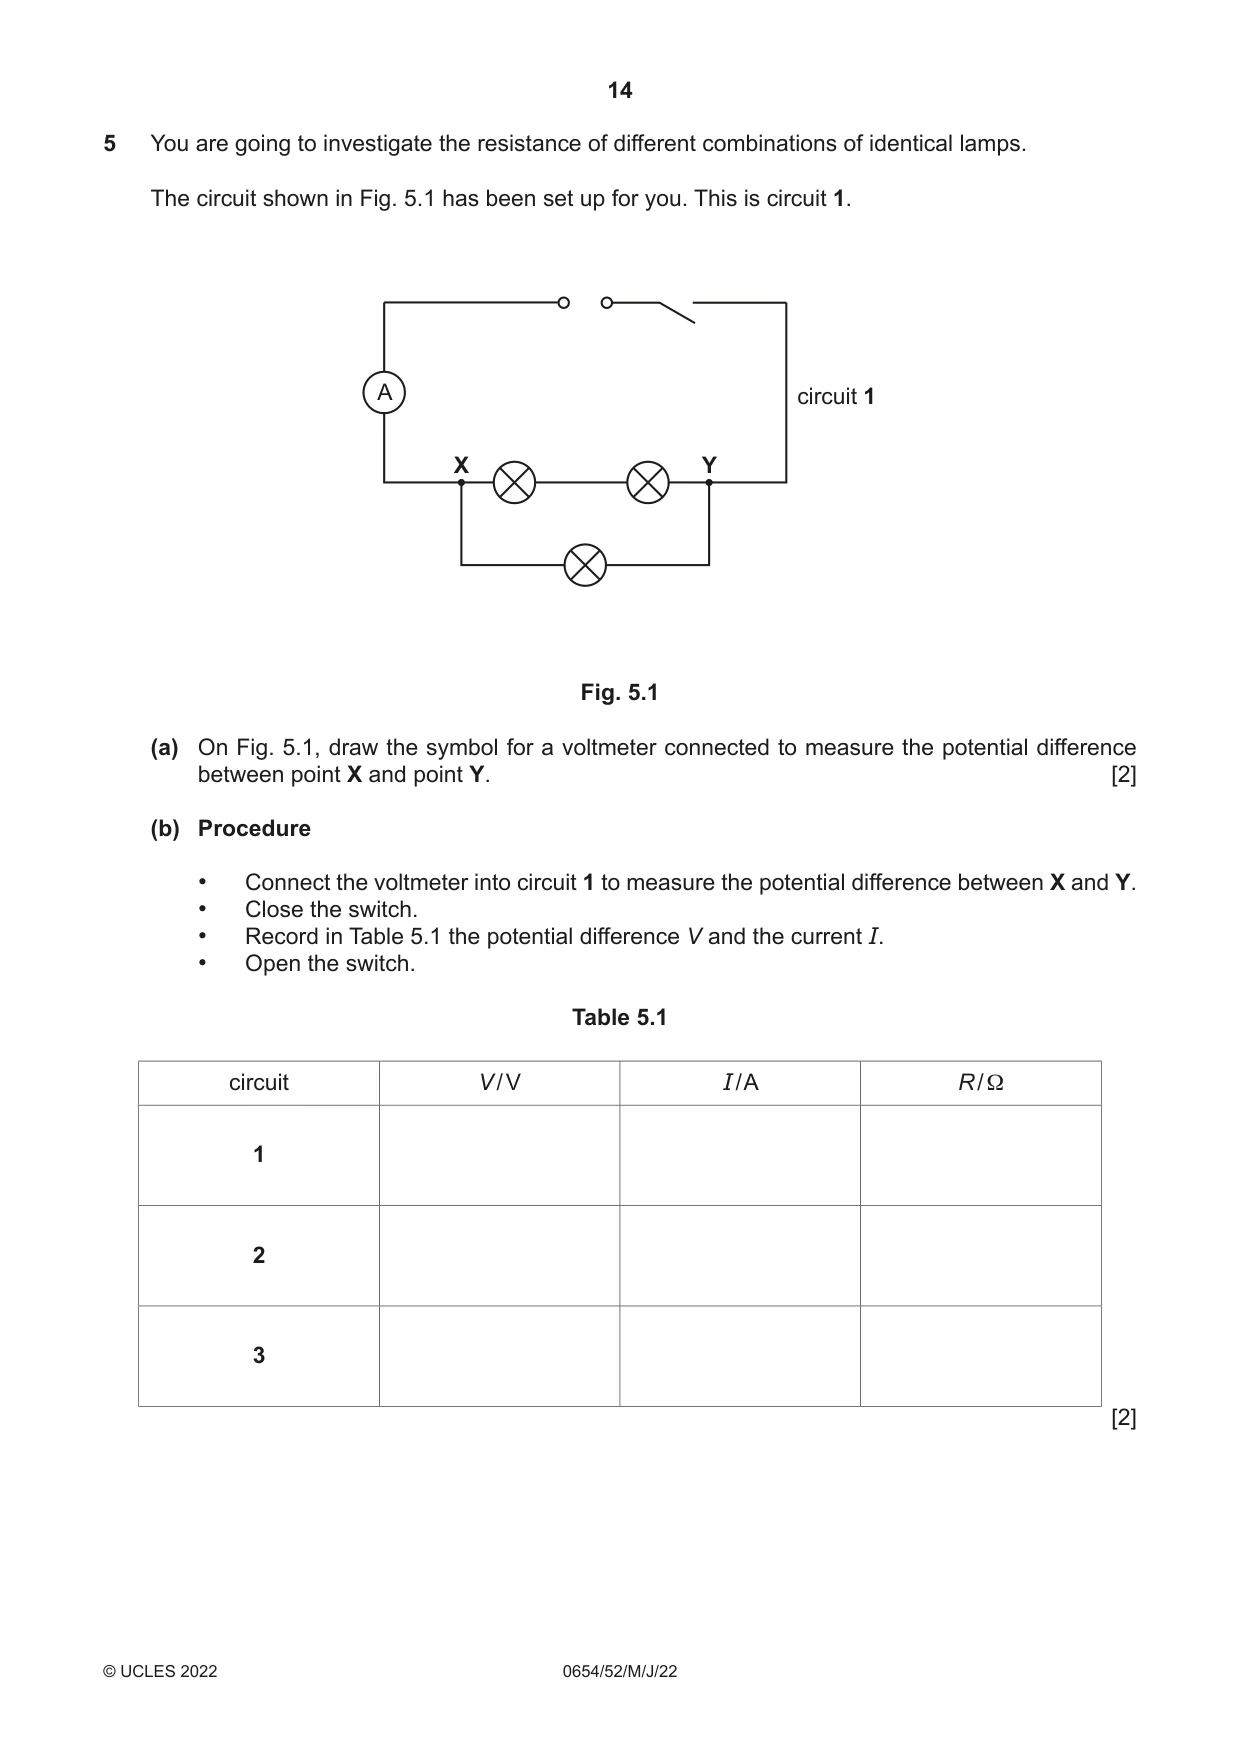
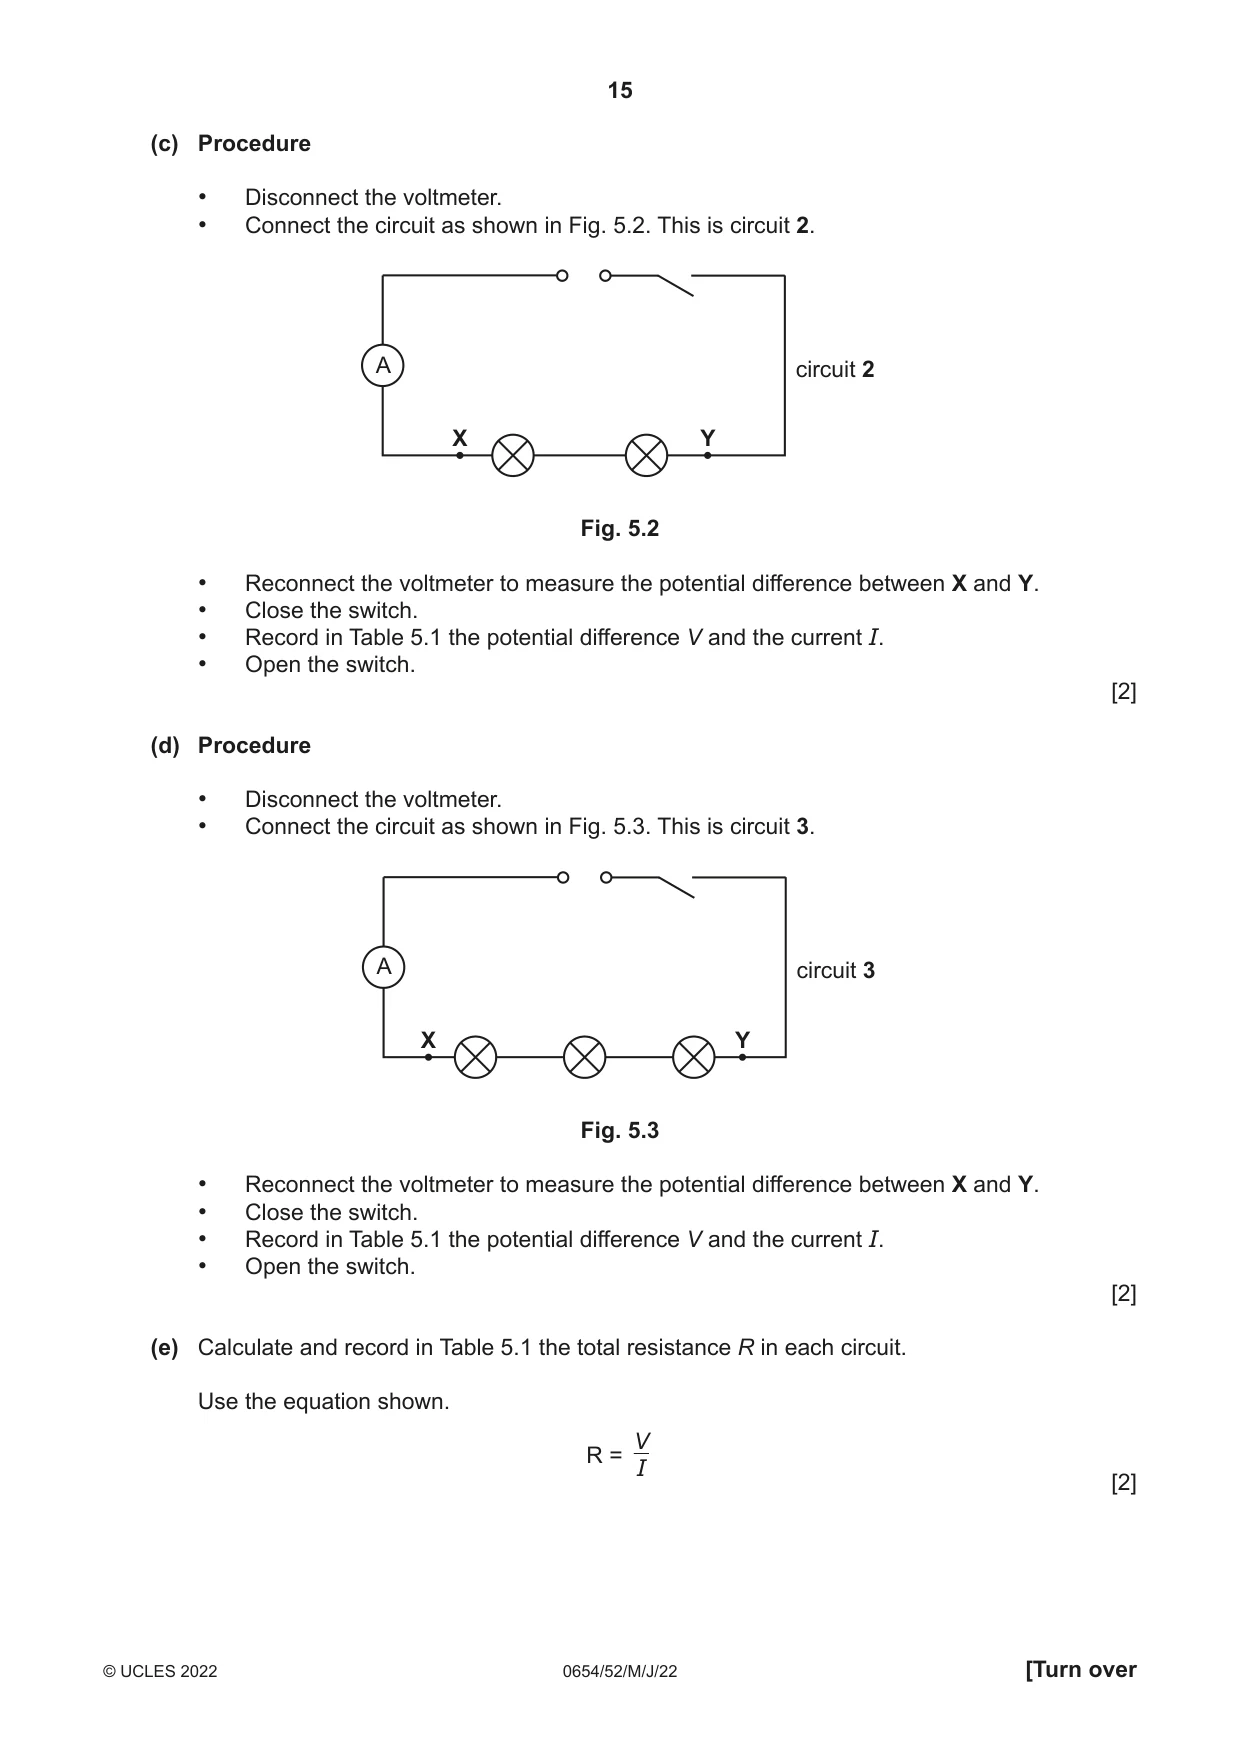
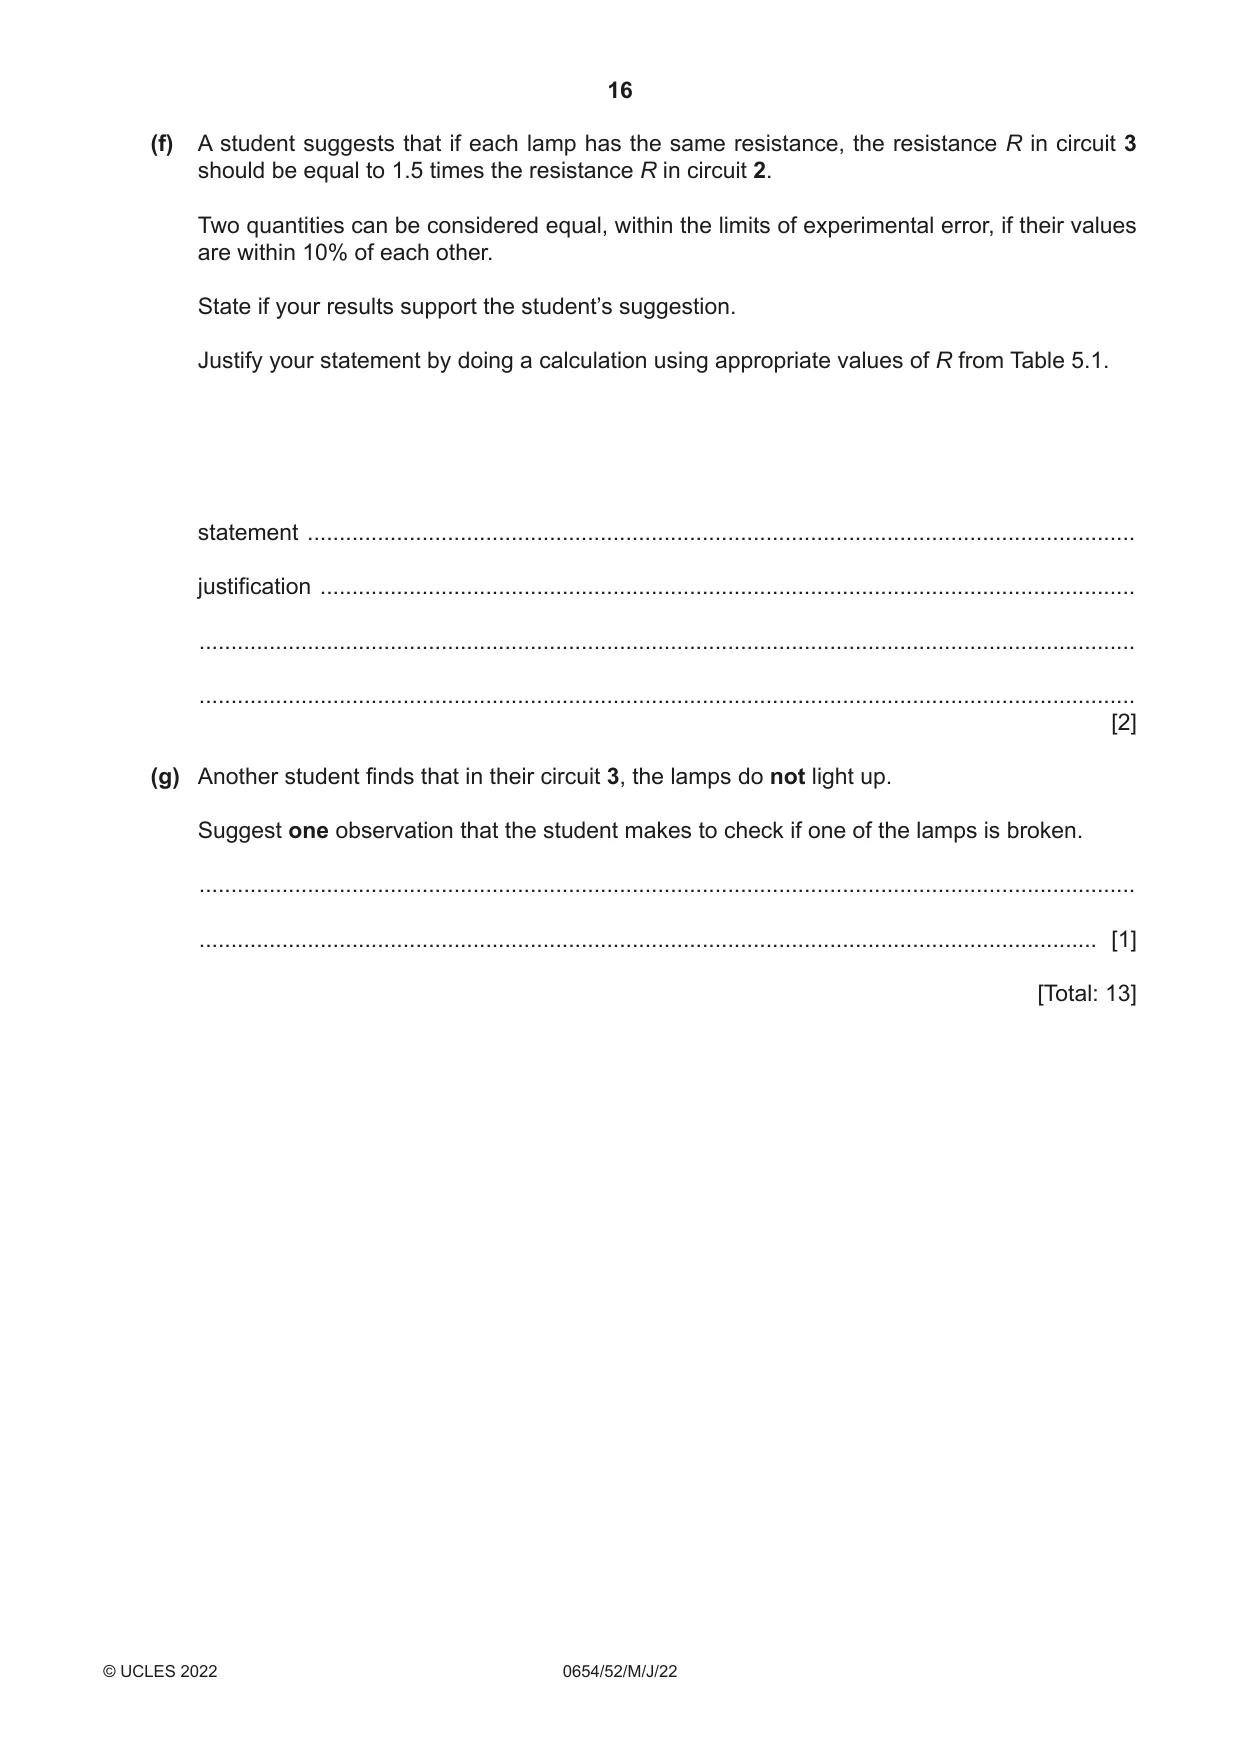
5 You are going to investigate the resistance of different combinations of identical lamps. The circuit shown in Fig. 5.1 has been set up for you. This is circuit 1. A circuit 1 X Y Fig. 5.1 (a) On Fig. 5.1, draw the symbol for a voltmeter connected to measure the potential difference between point X and point Y. [2] (b) Procedure • Connect the voltmeter into circuit 1 to measure the potential difference between X and Y. • Close the switch. • Record in Table 5.1 the potential difference V and the current I. • Open the switch. Table 5.1 circuit V / V I / A R / Ω 1 2 3 [2] (c) Procedure • Disconnect the voltmeter. • Connect the circuit as shown in Fig. 5.2. This is circuit 2. A circuit 2 X Y Fig. 5.2 • Reconnect the voltmeter to measure the potential difference between X and Y. • Close the switch. • Record in Table 5.1 the potential difference V and the current I. • Open the switch. [2] (d) Procedure • Disconnect the voltmeter. • Connect the circuit as shown in Fig. 5.3. This is circuit 3. A circuit 3 X Y Fig. 5.3 • Reconnect the voltmeter to measure the potential difference between X and Y. • Close the switch. • Record in Table 5.1 the potential difference V and the current I. • Open the switch. [2] (e) Calculate and record in Table 5.1 the total resistance R in each circuit. Use the equation shown. V R = I [2] (f) A student suggests that if each lamp has the same resistance, the resistance R in circuit 3 should be equal to 1.5 times the resistance R in circuit 2. Two quantities can be considered equal, within the limits of experimental error, if their values are within 10% of each other. State if your results support the student’s suggestion. Justify your statement by doing a calculation using appropriate values of R from Table 5.1. statement .................................................................................................................................. justification ................................................................................................................................ ................................................................................................................................................... ................................................................................................................................................... [2] (g) Another student finds that in their circuit 3, the lamps do not light up. Suggest one observation that the student makes to check if one of the lamps is broken. ................................................................................................................................................... ............................................................................................................................................. [1] [Total: 13]
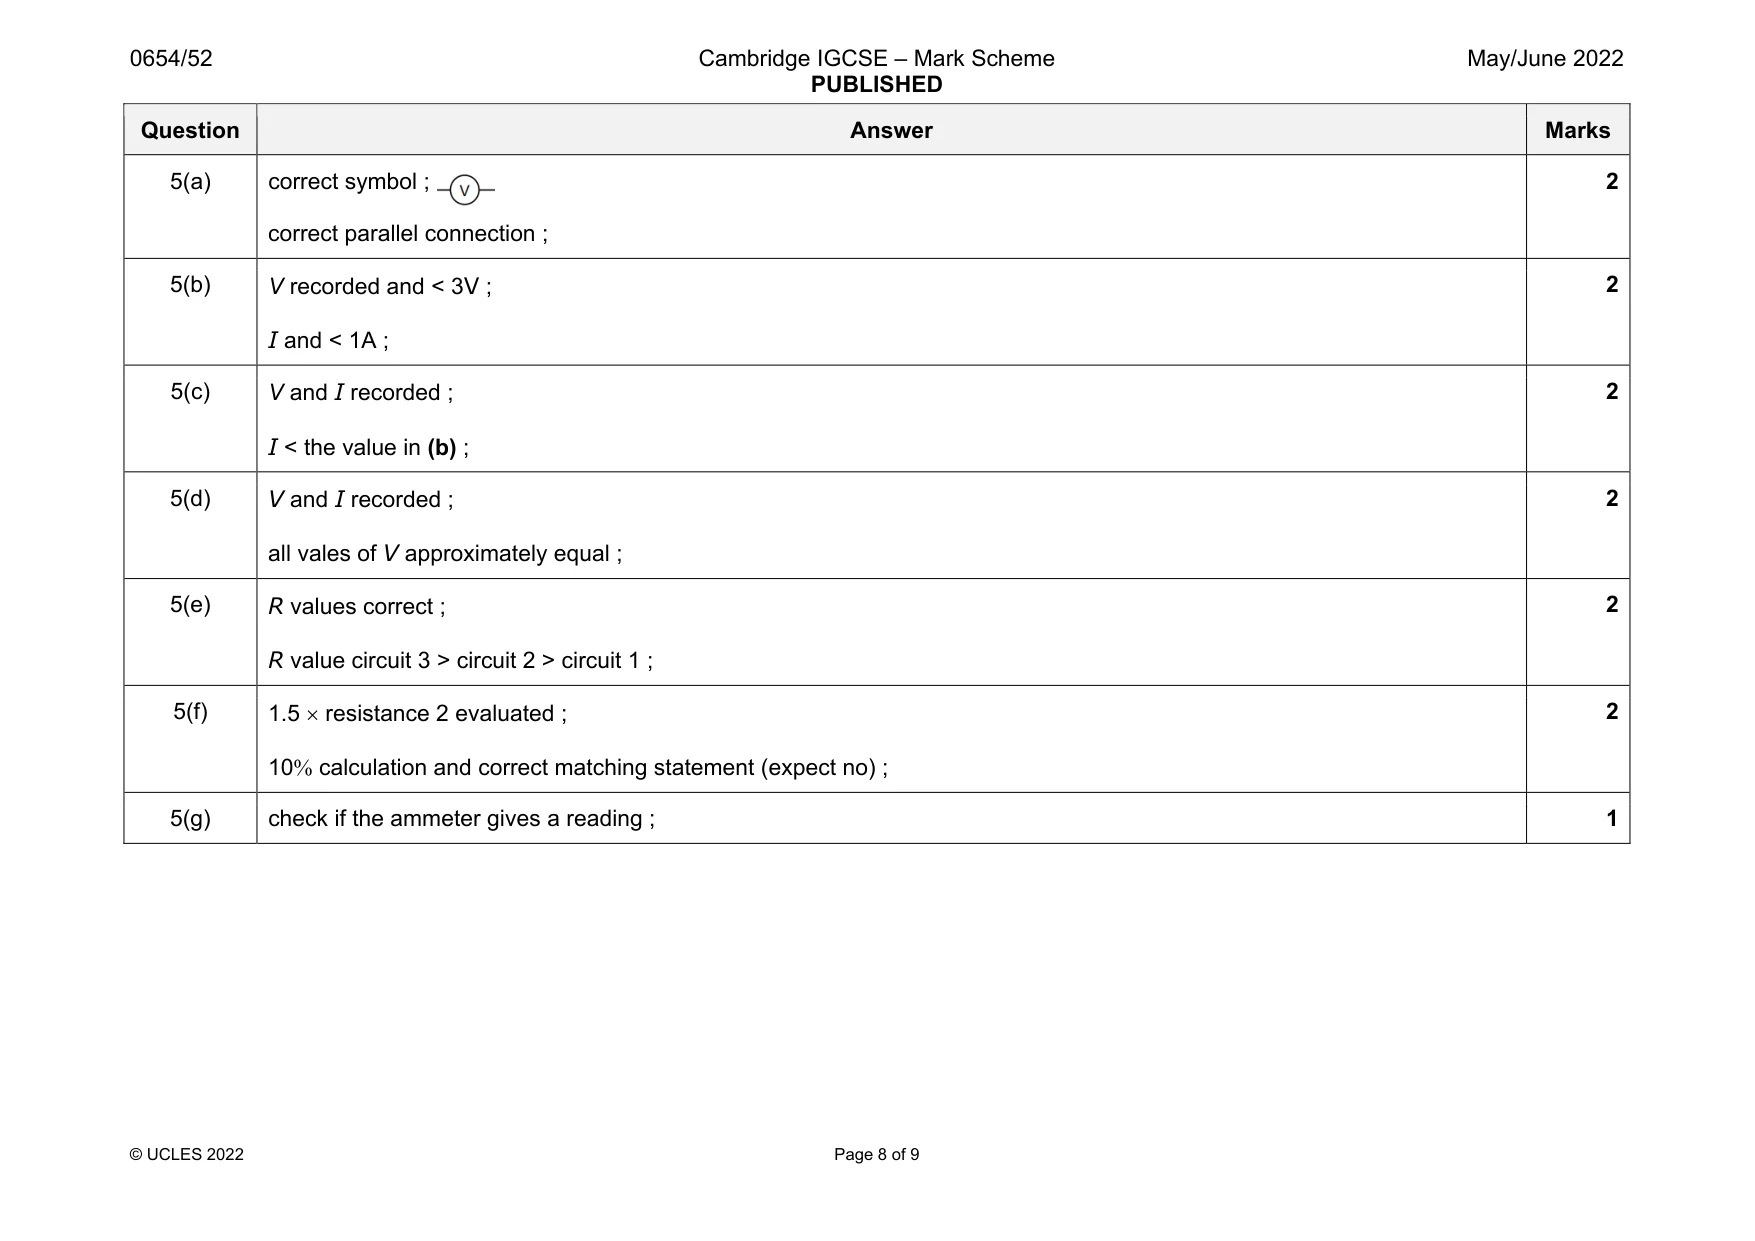
Mark scheme: 5(a) correct symbol ; correct parallel connection ; 2 5(b) V recorded and < 3V ; I and < 1A ; 2 5(c) V and I recorded ; I < the value in (b) ; 2 5(d) V and I recorded ; all vales of V approximately equal ; 2 5(e) R values correct ; R value circuit 3 > circuit 2 > circuit 1 ; 2 5(f) 1.5 resistance 2 evaluated ; 10 calculation and correct matching statement (expect no) ; 2 5(g) check if the ammeter gives a reading ; 1
Q6 · Plan an experiment to investigate how the area of the water surface in a beaker affects…
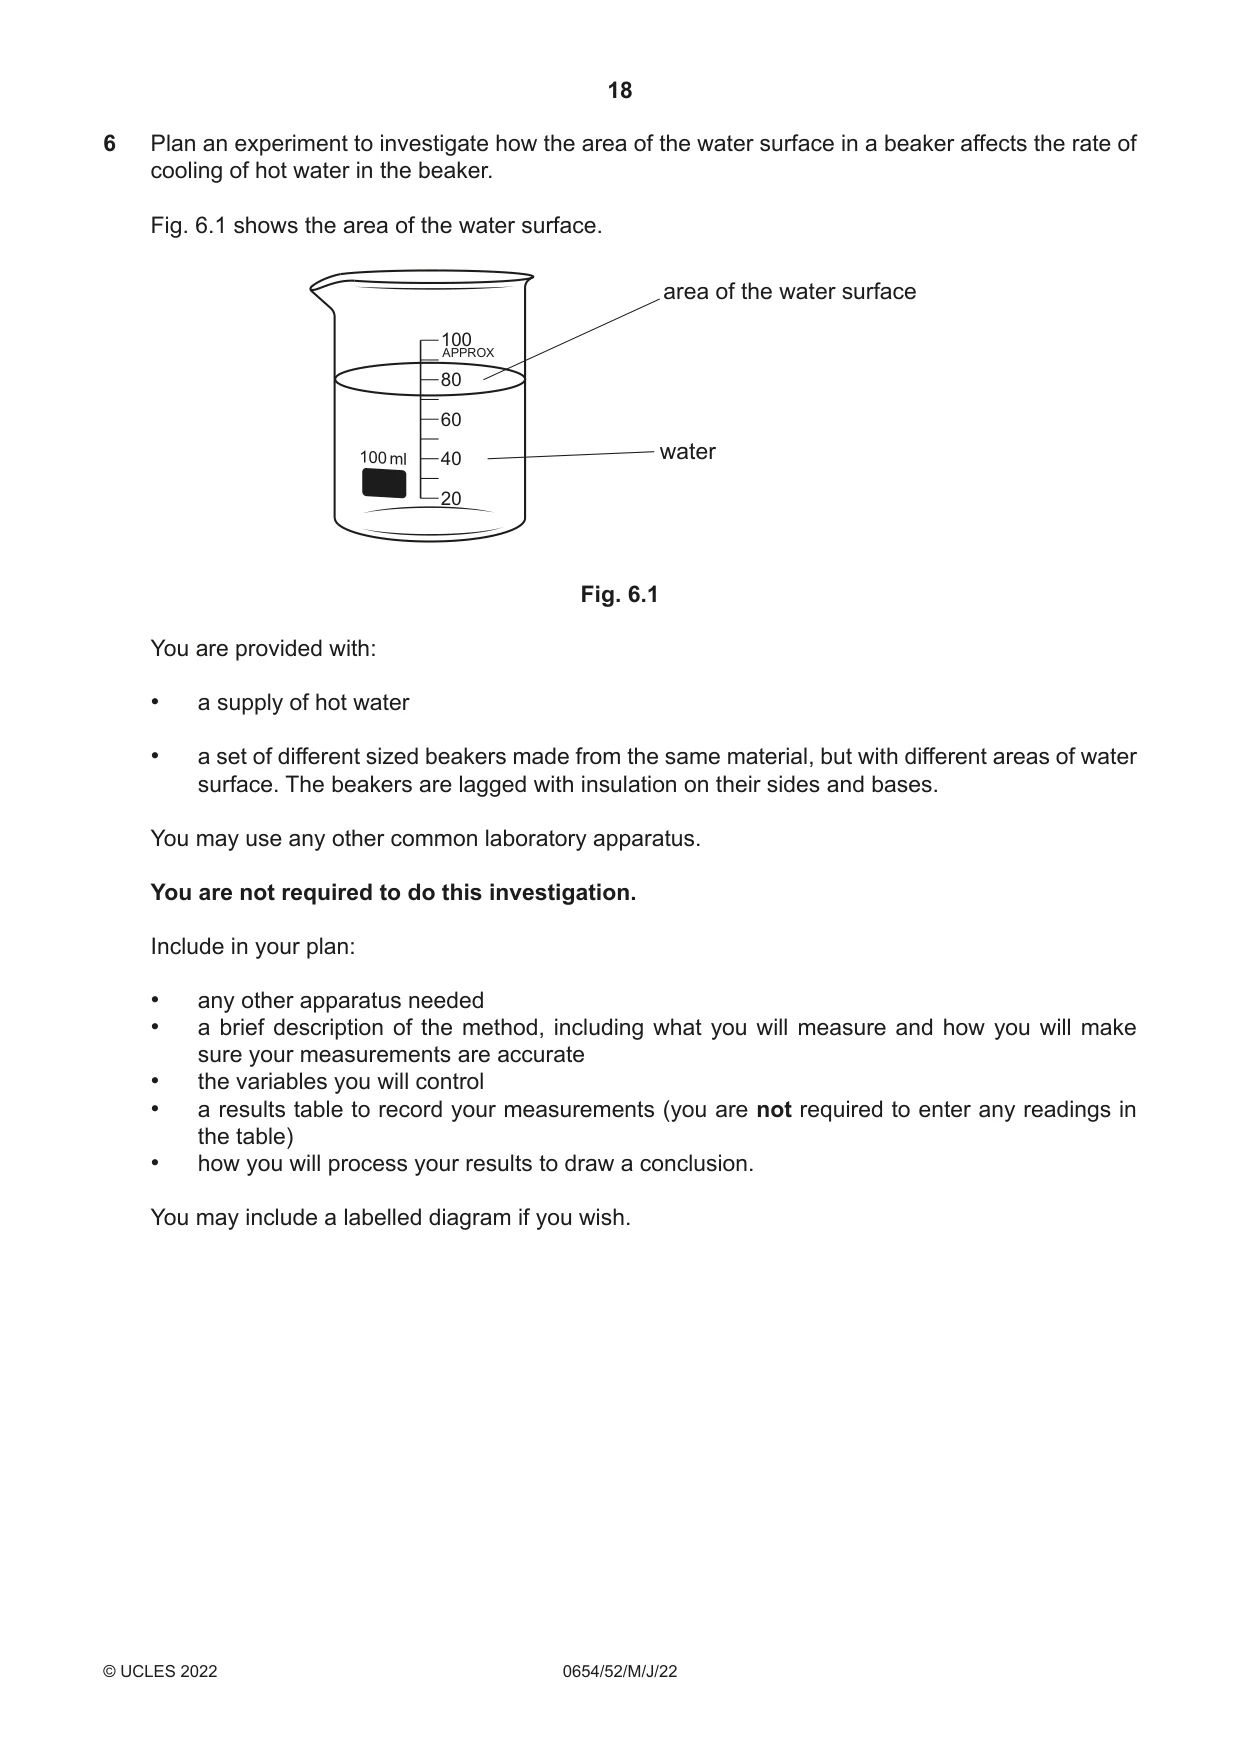
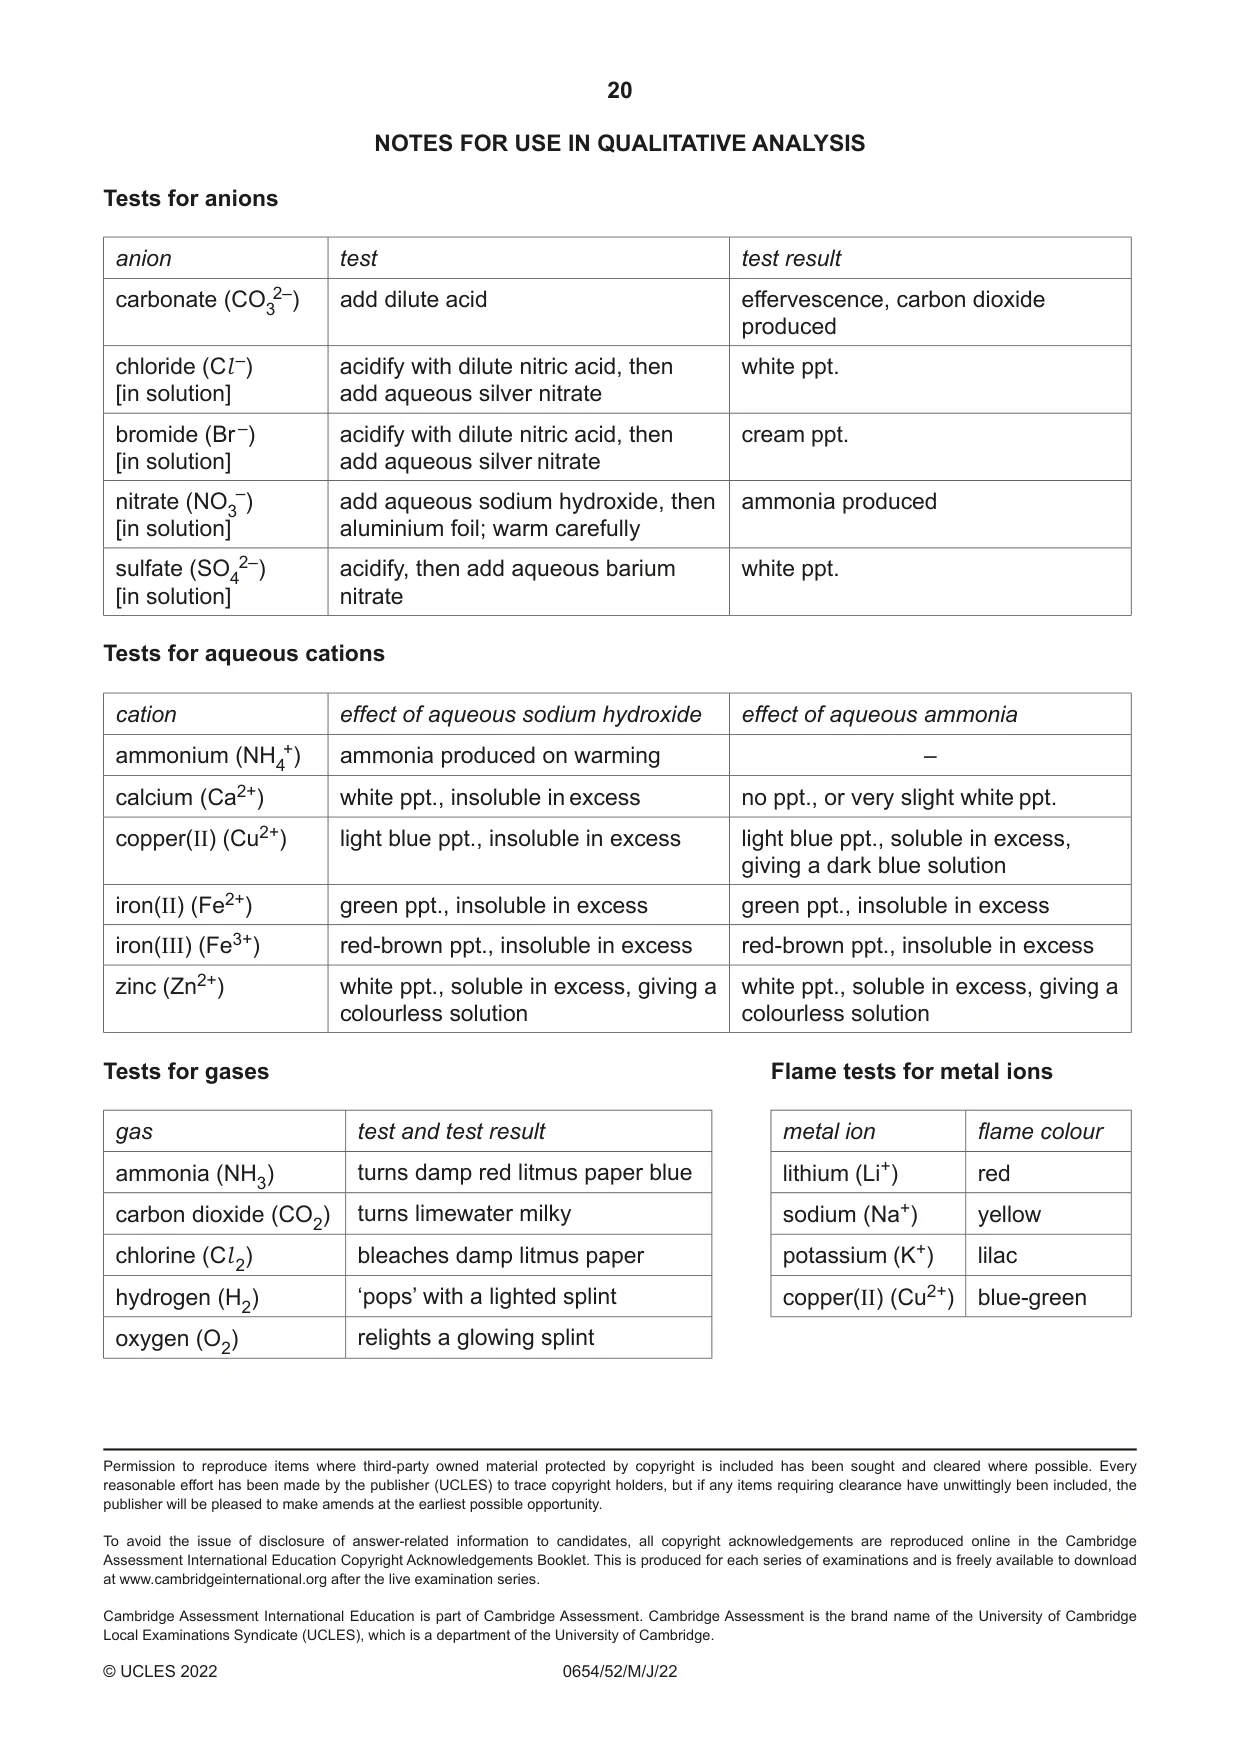
6 Plan an experiment to investigate how the area of the water surface in a beaker affects the rate of cooling of hot water in the beaker. Fig. 6.1 shows the area of the water surface. area of the water surface 100 APPROX 80 60 100 ml 40 water 20 Fig. 6.1 You are provided with: • a supply of hot water • a set of different sized beakers made from the same material, but with different areas of water surface. The beakers are lagged with insulation on their sides and bases. You may use any other common laboratory apparatus. You are not required to do this investigation. Include in your plan: • any other apparatus needed • a brief description of the method, including what you will measure and how you will make sure your measurements are accurate • the variables you will control • a results table to record your measurements (you are not required to enter any readings in the table) • how you will process your results to draw a conclusion. You may include a labelled diagram if you wish. .......................................................................................................................................................... .......................................................................................................................................................... .......................................................................................................................................................... .......................................................................................................................................................... .......................................................................................................................................................... .......................................................................................................................................................... .......................................................................................................................................................... .......................................................................................................................................................... .......................................................................................................................................................... .......................................................................................................................................................... .......................................................................................................................................................... .......................................................................................................................................................... .......................................................................................................................................................... .......................................................................................................................................................... .......................................................................................................................................................... .......................................................................................................................................................... .......................................................................................................................................................... .......................................................................................................................................................... .......................................................................................................................................................... .......................................................................................................................................................... .................................................................................................................................................... [7] NOTES FOR USE IN QUALITATIVE ANALYSIS Tests for anions anion test test result carbonate (CO32–) add dilute acid effervescence, carbon dioxide produced chloride (Cl –) acidify with dilute nitric acid, then white ppt. [in solution] add aqueous silver nitrate bromide (Br –) acidify with dilute nitric acid, then cream ppt. [in solution] add aqueous silver nitrate nitrate (NO3–) add aqueous sodium hydroxide, then ammonia produced [in solution] aluminium foil; warm carefully sulfate (SO42–) acidify, then add aqueous barium white ppt. [in solution] nitrate Tests for aqueous cations cation effect of aqueous sodium hydroxide effect of aqueous ammonia ammonium (NH4+) ammonia produced on warming – calcium (Ca2+) white ppt., insoluble in excess no ppt., or very slight white ppt. copper(II) (Cu2+) light blue ppt., insoluble in excess light blue ppt., soluble in excess, giving a dark blue solution iron(II) (Fe2+) green ppt., insoluble in excess green ppt., insoluble in excess iron(III) (Fe3+) red-brown ppt., insoluble in excess red-brown ppt., insoluble in excess zinc (Zn2+) white ppt., soluble in excess, giving a white ppt., soluble in excess, giving a colourless solution colourless solution Tests for gases Flame tests for metal ions gas test and test result metal ion flame colour ammonia (NH3) turns damp red litmus paper blue lithium (Li+) red carbon dioxide (CO2) turns limewater milky sodium (Na+) yellow chlorine (Cl 2) bleaches damp litmus paper potassium (K+) lilac hydrogen (H2) ‘pops’ with a lighted splint copper(II) (Cu2+) blue-green oxygen (O2) relights a glowing splint
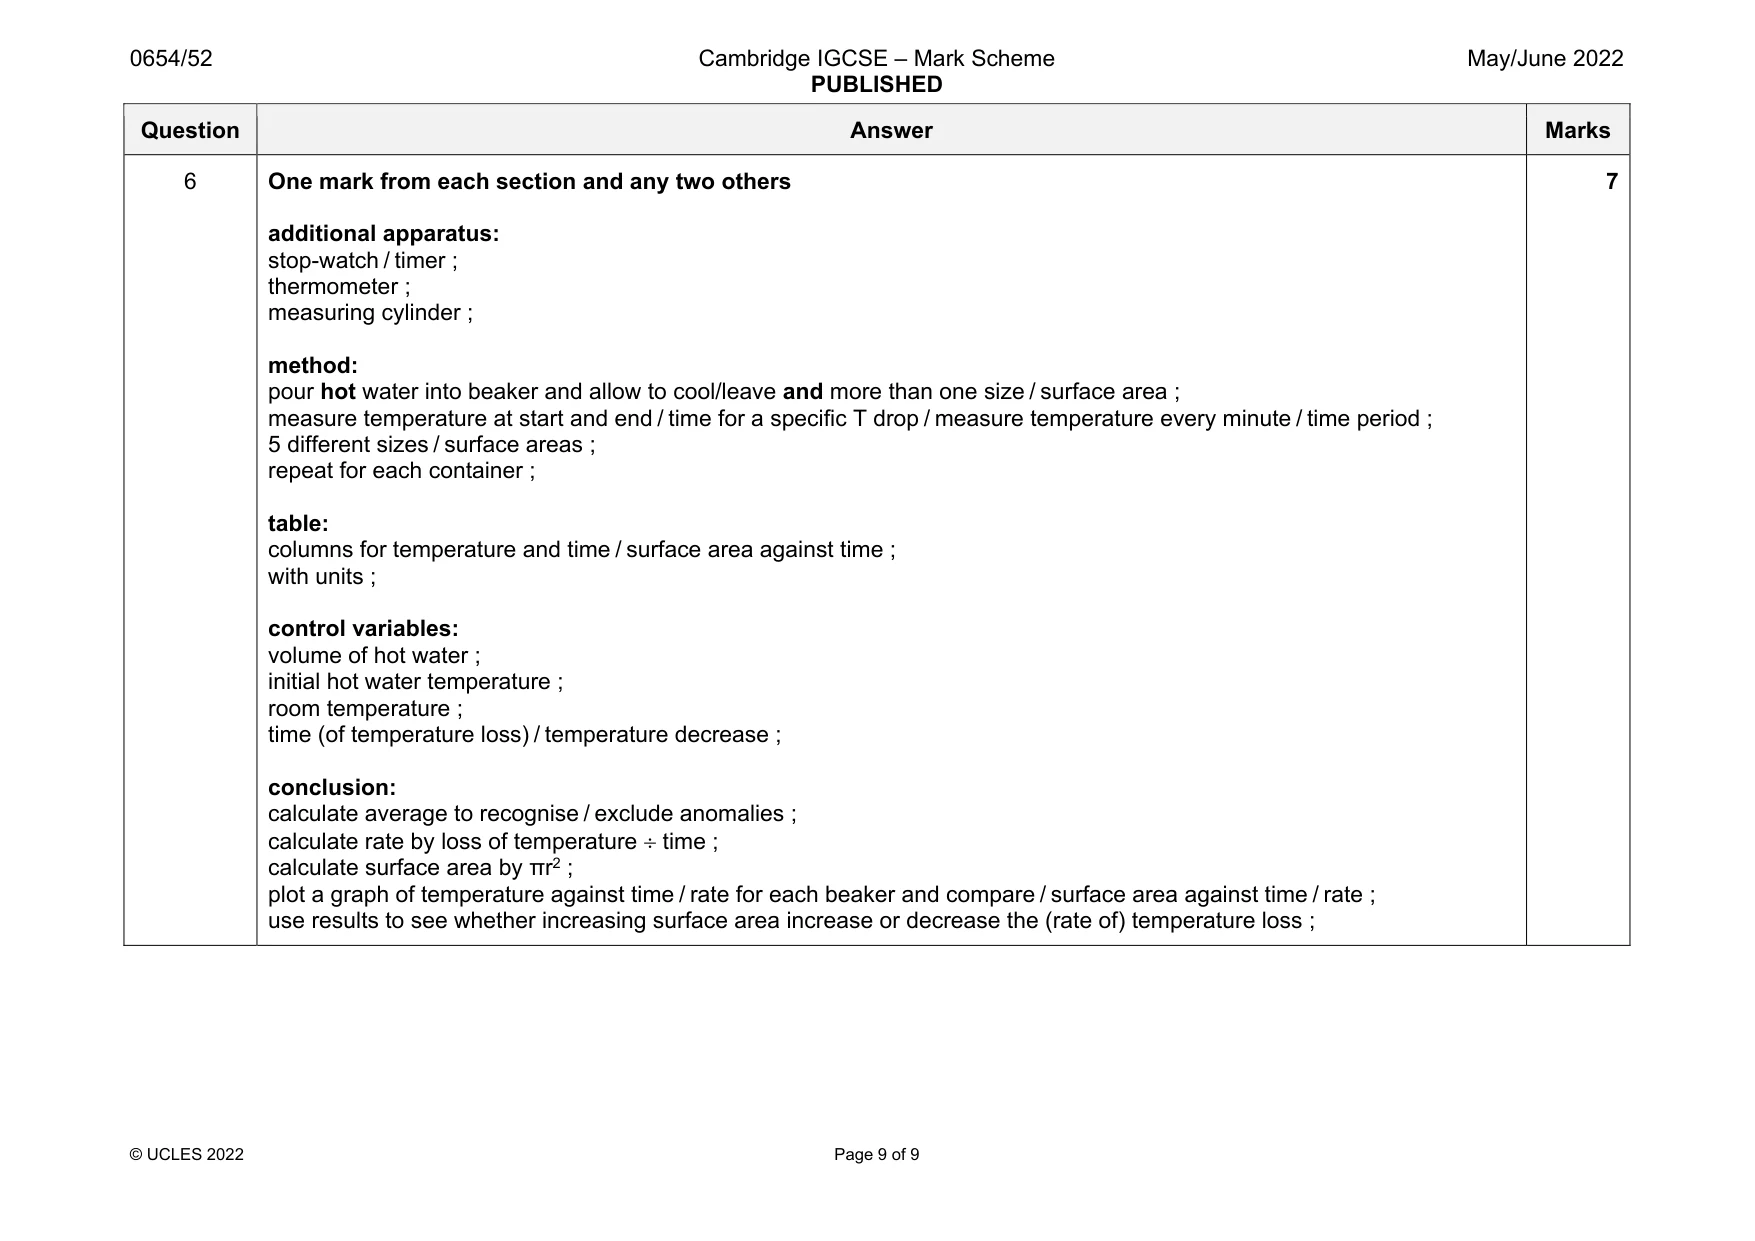
Mark scheme: 6 One mark from each section and any two others additional apparatus: stop-watch / timer ; thermometer ; measuring cylinder ; method: pour hot water into beaker and allow to cool/leave and more than one size / surface area ; measure temperature at start and end / time for a specific T drop / measure temperature every minute / time period ; 5 different sizes / surface areas ; repeat for each container ; table: columns for temperature and time / surface area against time ; with units ; control variables: volume of hot water ; initial hot water temperature ; room temperature ; time (of temperature loss) / temperature decrease ; conclusion: calculate average to recognise / exclude anomalies ; calculate rate by loss of temperature time ; calculate surface area by πr2 ; plot a graph of temperature against time / rate for each beaker and compare / surface area against time / rate ; use results to see whether increasing surface area increase or decrease the (rate of) temperature loss ; 7
What was in this paper
The subtopics covered by these 6 questions, and how many questions each got. Open one in a new tab to see every Cambridge question on it.
What you needed in this session
Cambridge’s own grade thresholds for 2022 May/June, Paper 5 · Variant 2. A higher threshold means an easier paper — the bar moves with how the cohort did.