Cambridge IGCSE Sciences - Co-ordinated (Double) 0654 — 2021 May/June Paper 5 · Variant 3
0654/53/M/J/21 · 5 questions · 60 marks · ≈68 min
The question paper and its mark scheme, free to read here and free to download. This is Cambridge’s own paper, exactly as it was sat.
Question paper16 pages


Mark scheme10 pages
Answers below. Sit the paper first if you are practising.
Questions as text
Q1 · You are provided with a slice of pepper
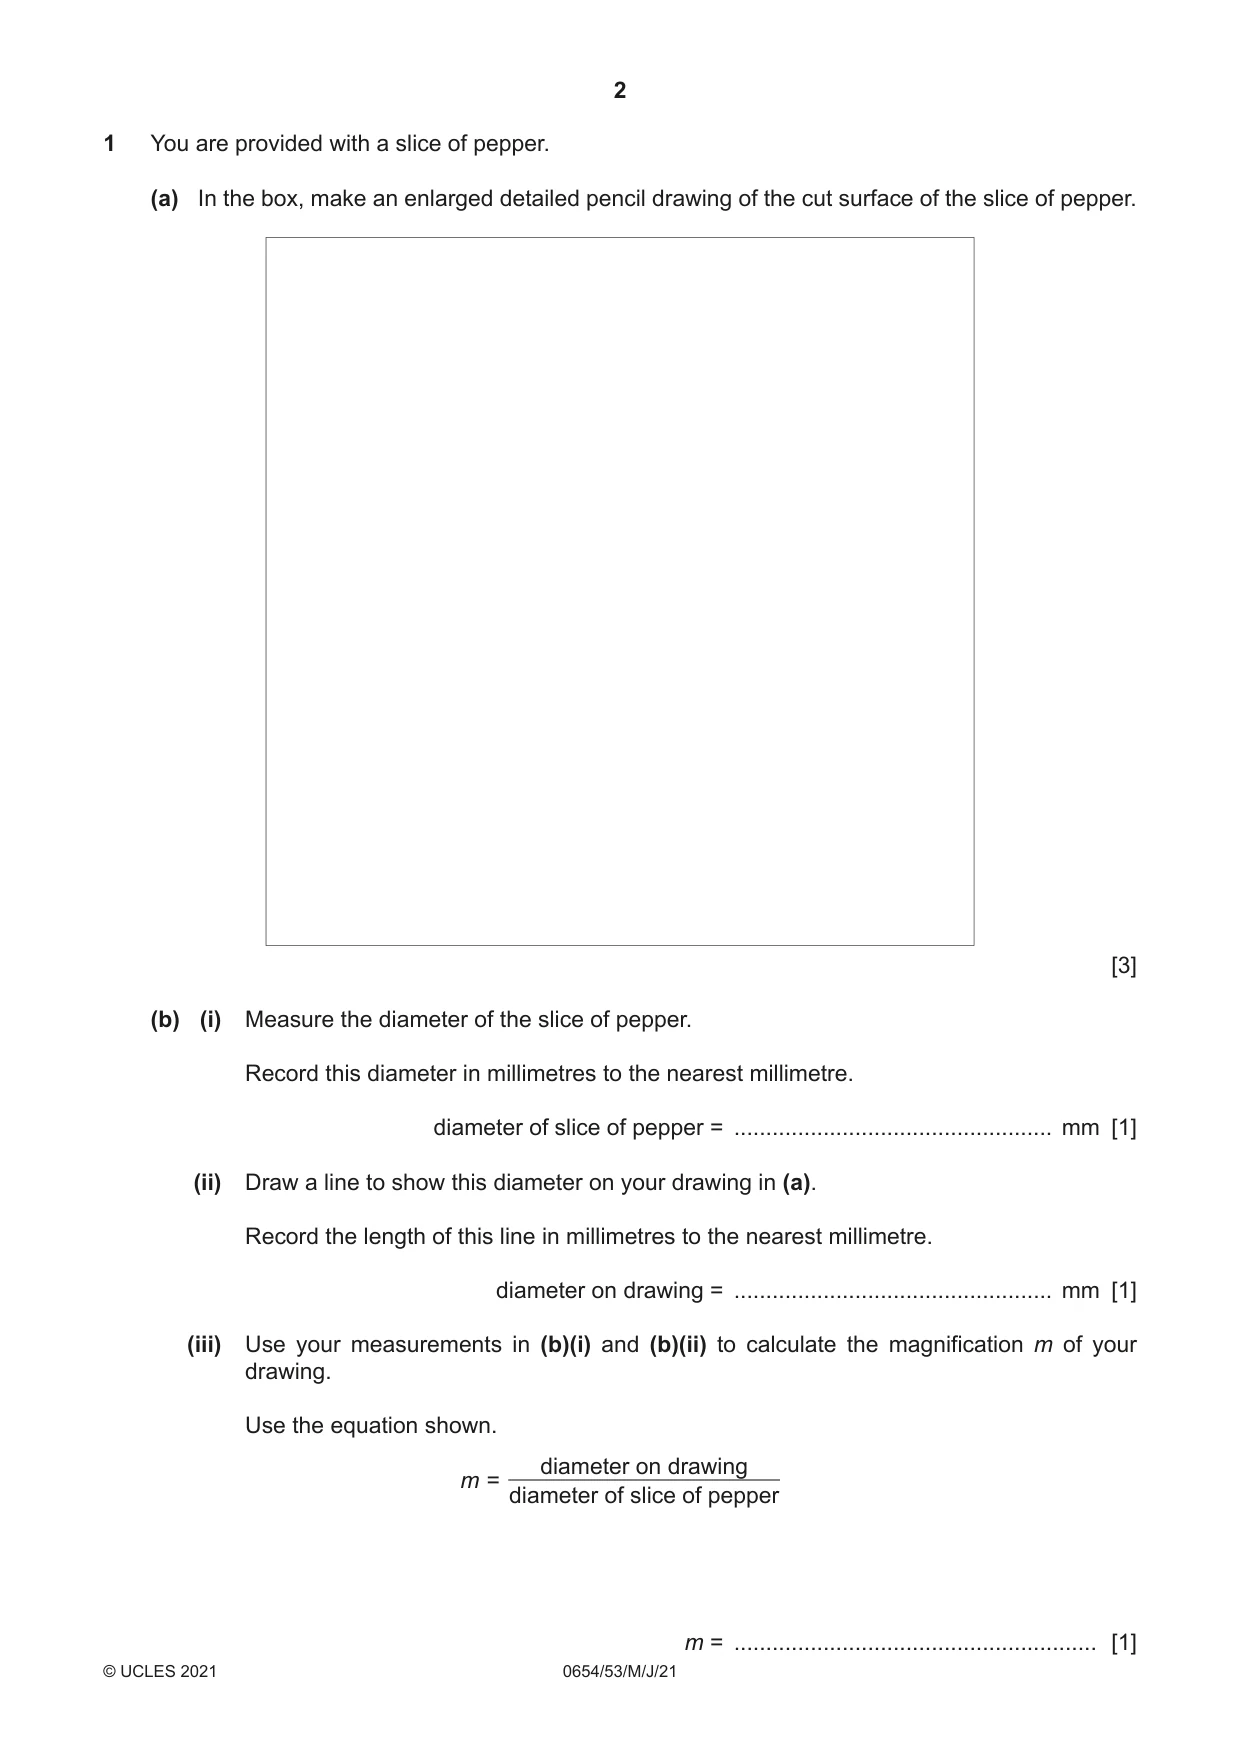
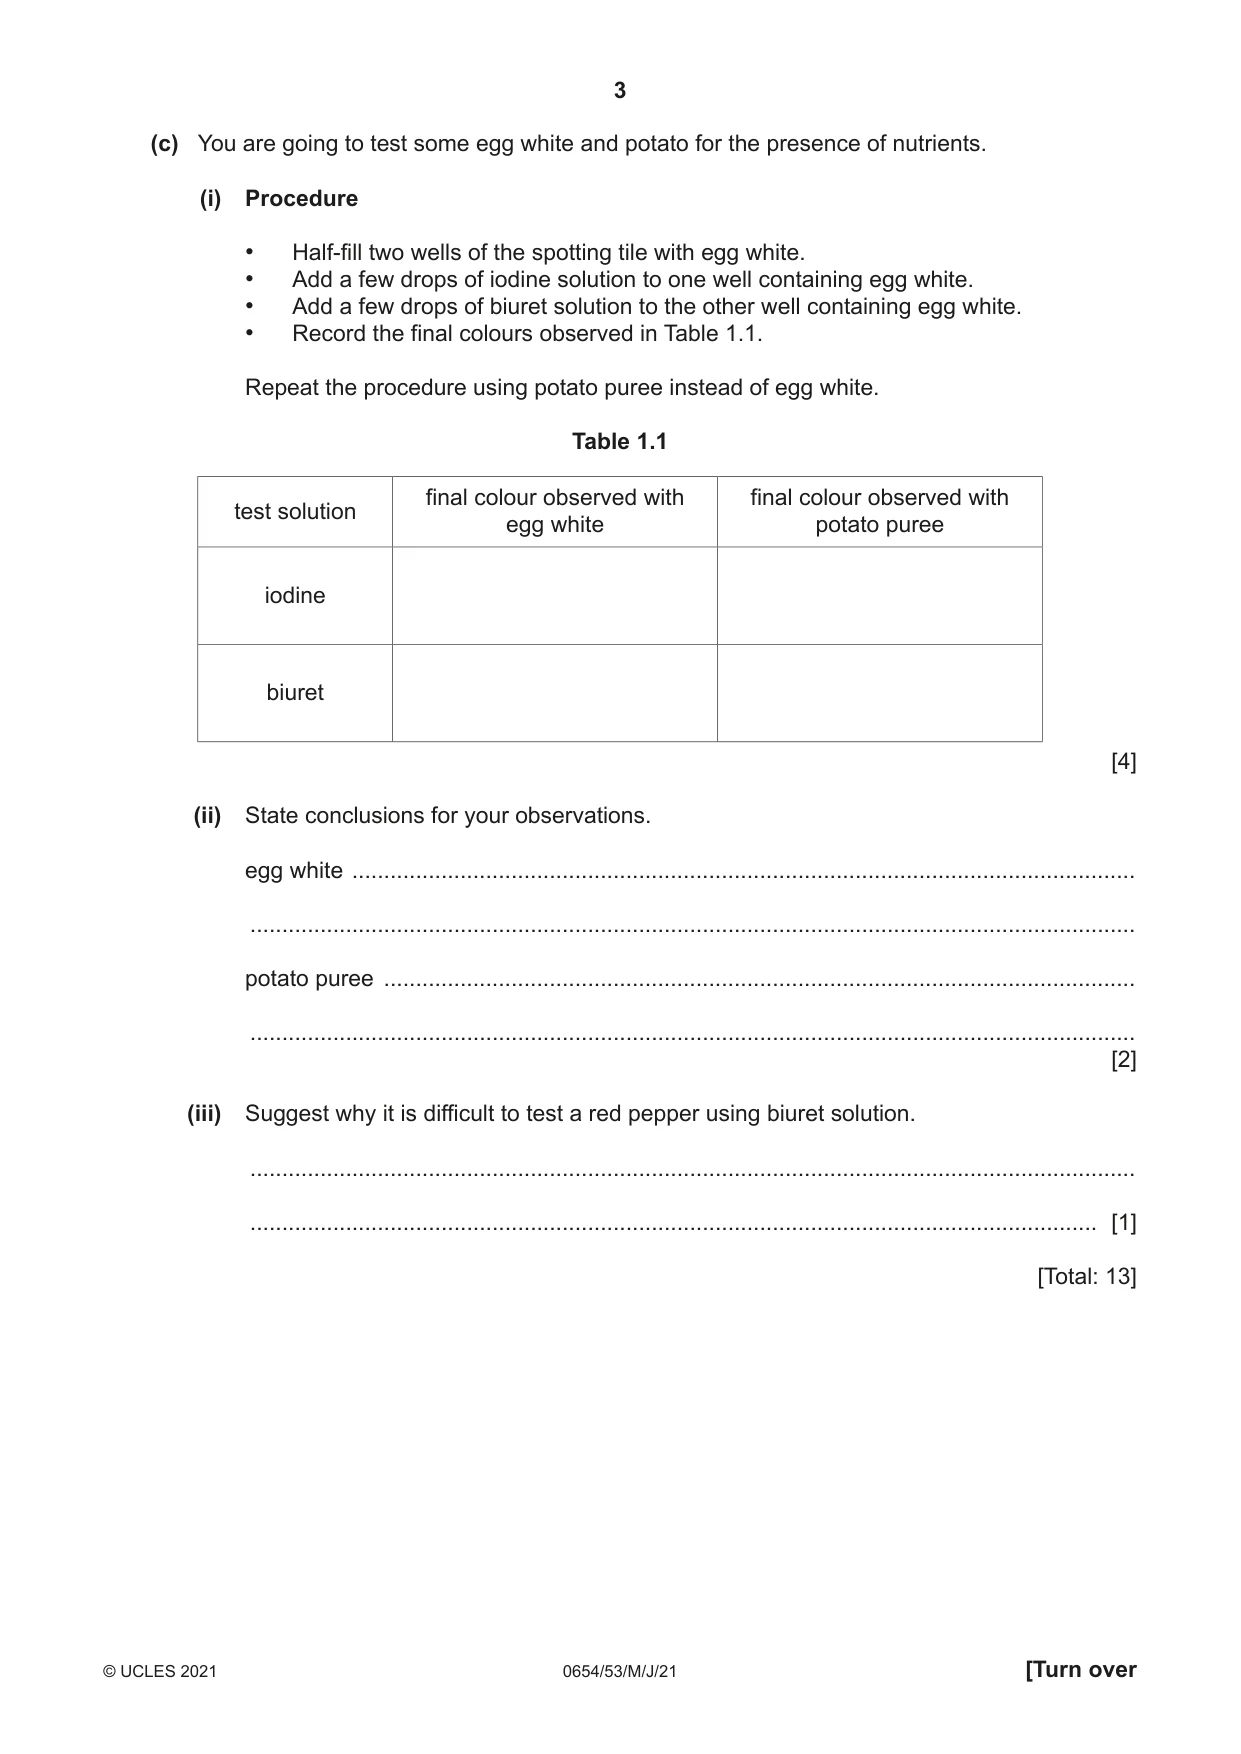
1 You are provided with a slice of pepper. (a) In the box, make an enlarged detailed pencil drawing of the cut surface of the slice of pepper. [3] (b) (i) Measure the diameter of the slice of pepper. Record this diameter in millimetres to the nearest millimetre. diameter of slice of pepper = .................................................. mm [1] (ii) Draw a line to show this diameter on your drawing in (a). Record the length of this line in millimetres to the nearest millimetre. diameter on drawing = .................................................. mm [1] (iii) Use your measurements in (b)(i) and (b)(ii) to calculate the magnification m of your drawing. Use the equation shown. diameter on drawing m = diameter of slice of pepper m = ......................................................... [1] (c) You are going to test some egg white and potato for the presence of nutrients. (i) Procedure • Half-fill two wells of the spotting tile with egg white. • Add a few drops of iodine solution to one well containing egg white. • Add a few drops of biuret solution to the other well containing egg white. • Record the final colours observed in Table 1.1. Repeat the procedure using potato puree instead of egg white. Table 1.1 final colour observed with final colour observed with test solution egg white potato puree iodine biuret [4] (ii) State conclusions for your observations. egg white ........................................................................................................................... ........................................................................................................................................... potato puree ...................................................................................................................... ........................................................................................................................................... [2] (iii) Suggest why it is difficult to test a red pepper using biuret solution. ........................................................................................................................................... ..................................................................................................................................... [1] [Total: 13]
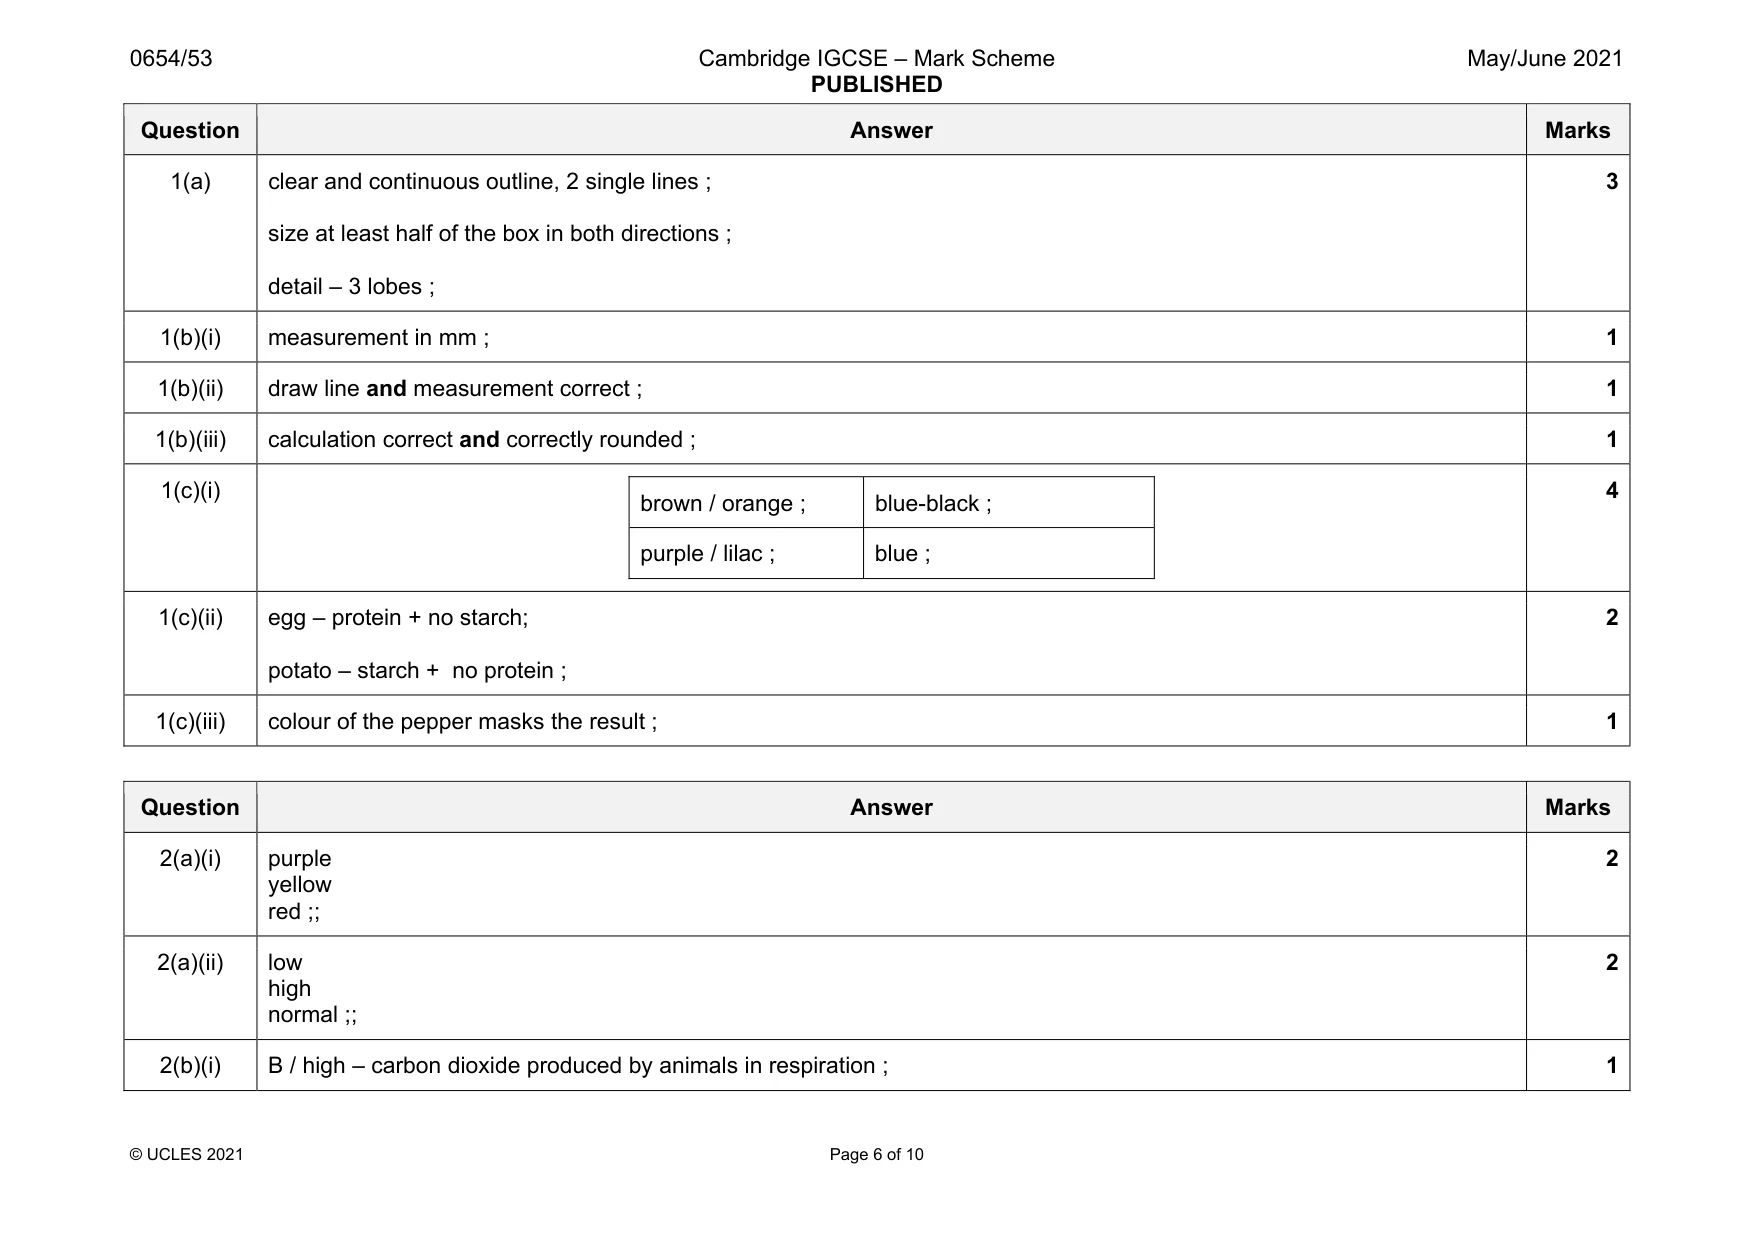
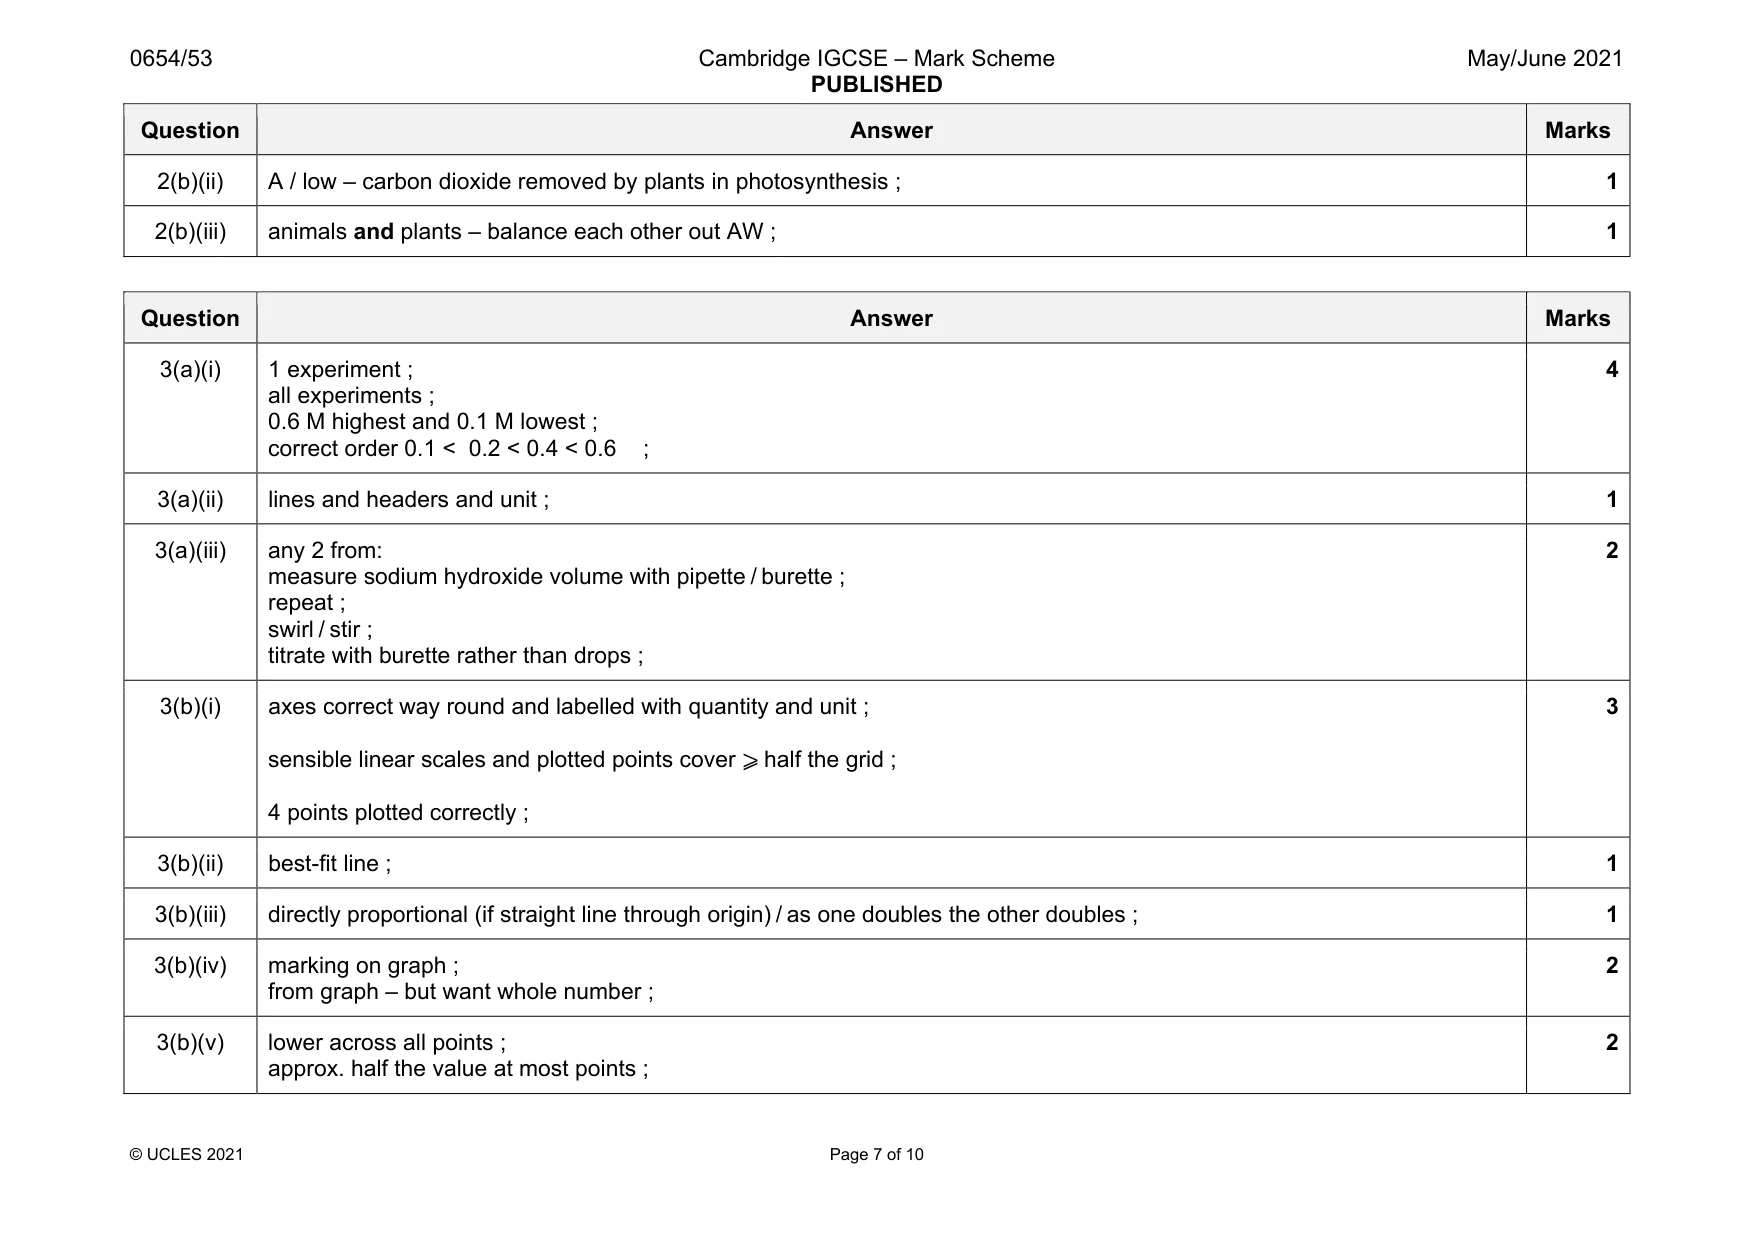
Mark scheme: 1(a) clear and continuous outline, 2 single lines ; size at least half of the box in both directions ; detail – 3 lobes ; 3 1(b)(i) measurement in mm ; 1 1(b)(ii) draw line and measurement correct ; 1 1(b)(iii) calculation correct and correctly rounded ; 1 1(c)(i) brown / orange ; blue-black ; purple / lilac ; blue ; 4 1(c)(ii) egg – protein + no starch; potato – starch + no protein ; 2 1(c)(iii) colour of the pepper masks the result ; 1
Q2 · You are going to investigate the concentration of carbon dioxide in some water samples
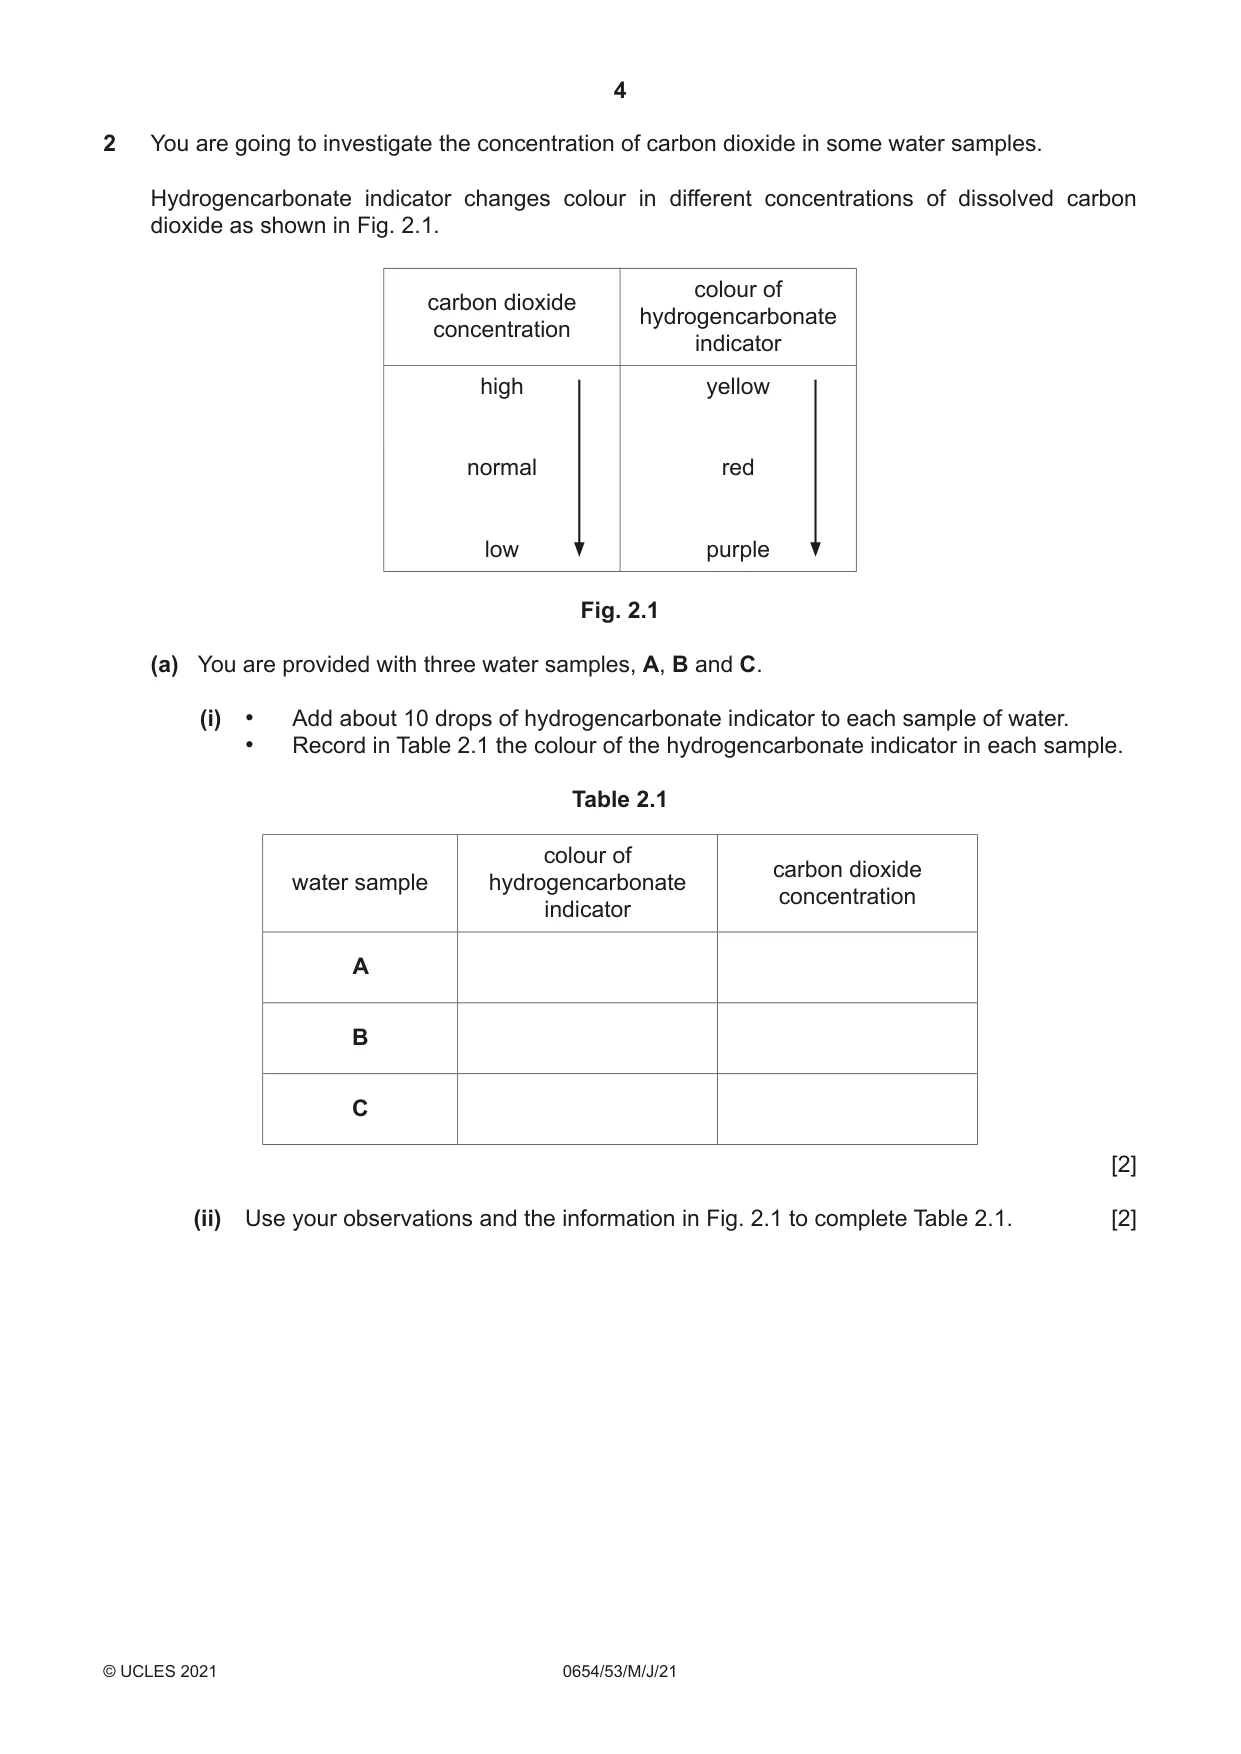
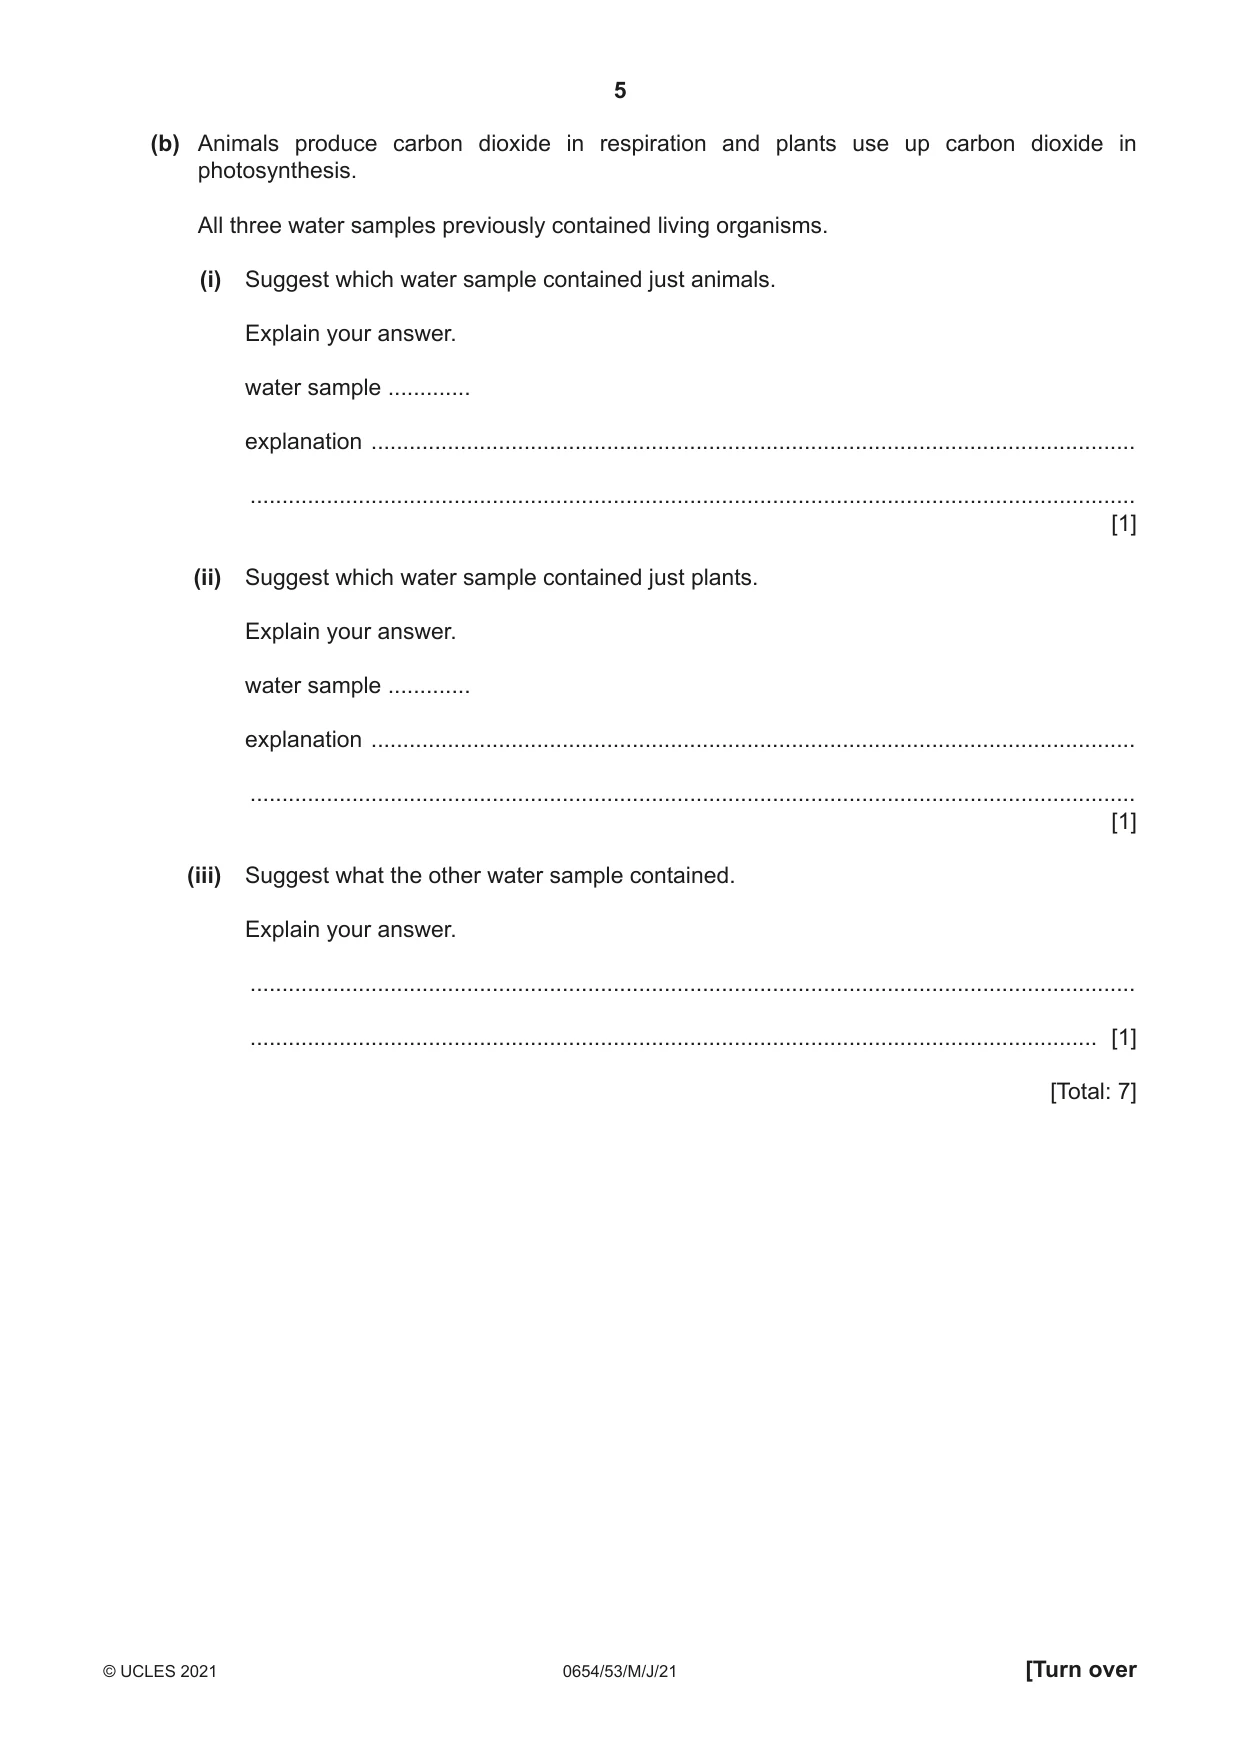
2 You are going to investigate the concentration of carbon dioxide in some water samples. Hydrogencarbonate indicator changes colour in different concentrations of dissolved carbon dioxide as shown in Fig. 2.1. colour of carbon dioxide hydrogencarbonate concentration indicator high yellow normal red low purple Fig. 2.1 (a) You are provided with three water samples, A, B and C. (i) • Add about 10 drops of hydrogencarbonate indicator to each sample of water. • Record in Table 2.1 the colour of the hydrogencarbonate indicator in each sample. Table 2.1 colour of carbon dioxide water sample hydrogencarbonate concentration indicator A B C [2] (ii) Use your observations and the information in Fig. 2.1 to complete Table 2.1. [2] (b) Animals produce carbon dioxide in respiration and plants use up carbon dioxide in photosynthesis. All three water samples previously contained living organisms. (i) Suggest which water sample contained just animals. Explain your answer. water sample ............. explanation ........................................................................................................................ ........................................................................................................................................... [1] (ii) Suggest which water sample contained just plants. Explain your answer. water sample ............. explanation ........................................................................................................................ ........................................................................................................................................... [1] (iii) Suggest what the other water sample contained. Explain your answer. ........................................................................................................................................... ..................................................................................................................................... [1] [Total: 7]
Mark scheme: 2(a)(i) purple yellow red ;; 2 2(a)(ii) low high normal ;; 2 2(b)(i) B / high – carbon dioxide produced by animals in respiration ; 1 Question Answer Marks 2(b)(ii) A / low – carbon dioxide removed by plants in photosynthesis ; 1 2(b)(iii) animals and plants – balance each other out AW ; 1
Q3 · You are going to investigate the neutralisation of aqueous sodium hydroxide by dilute…
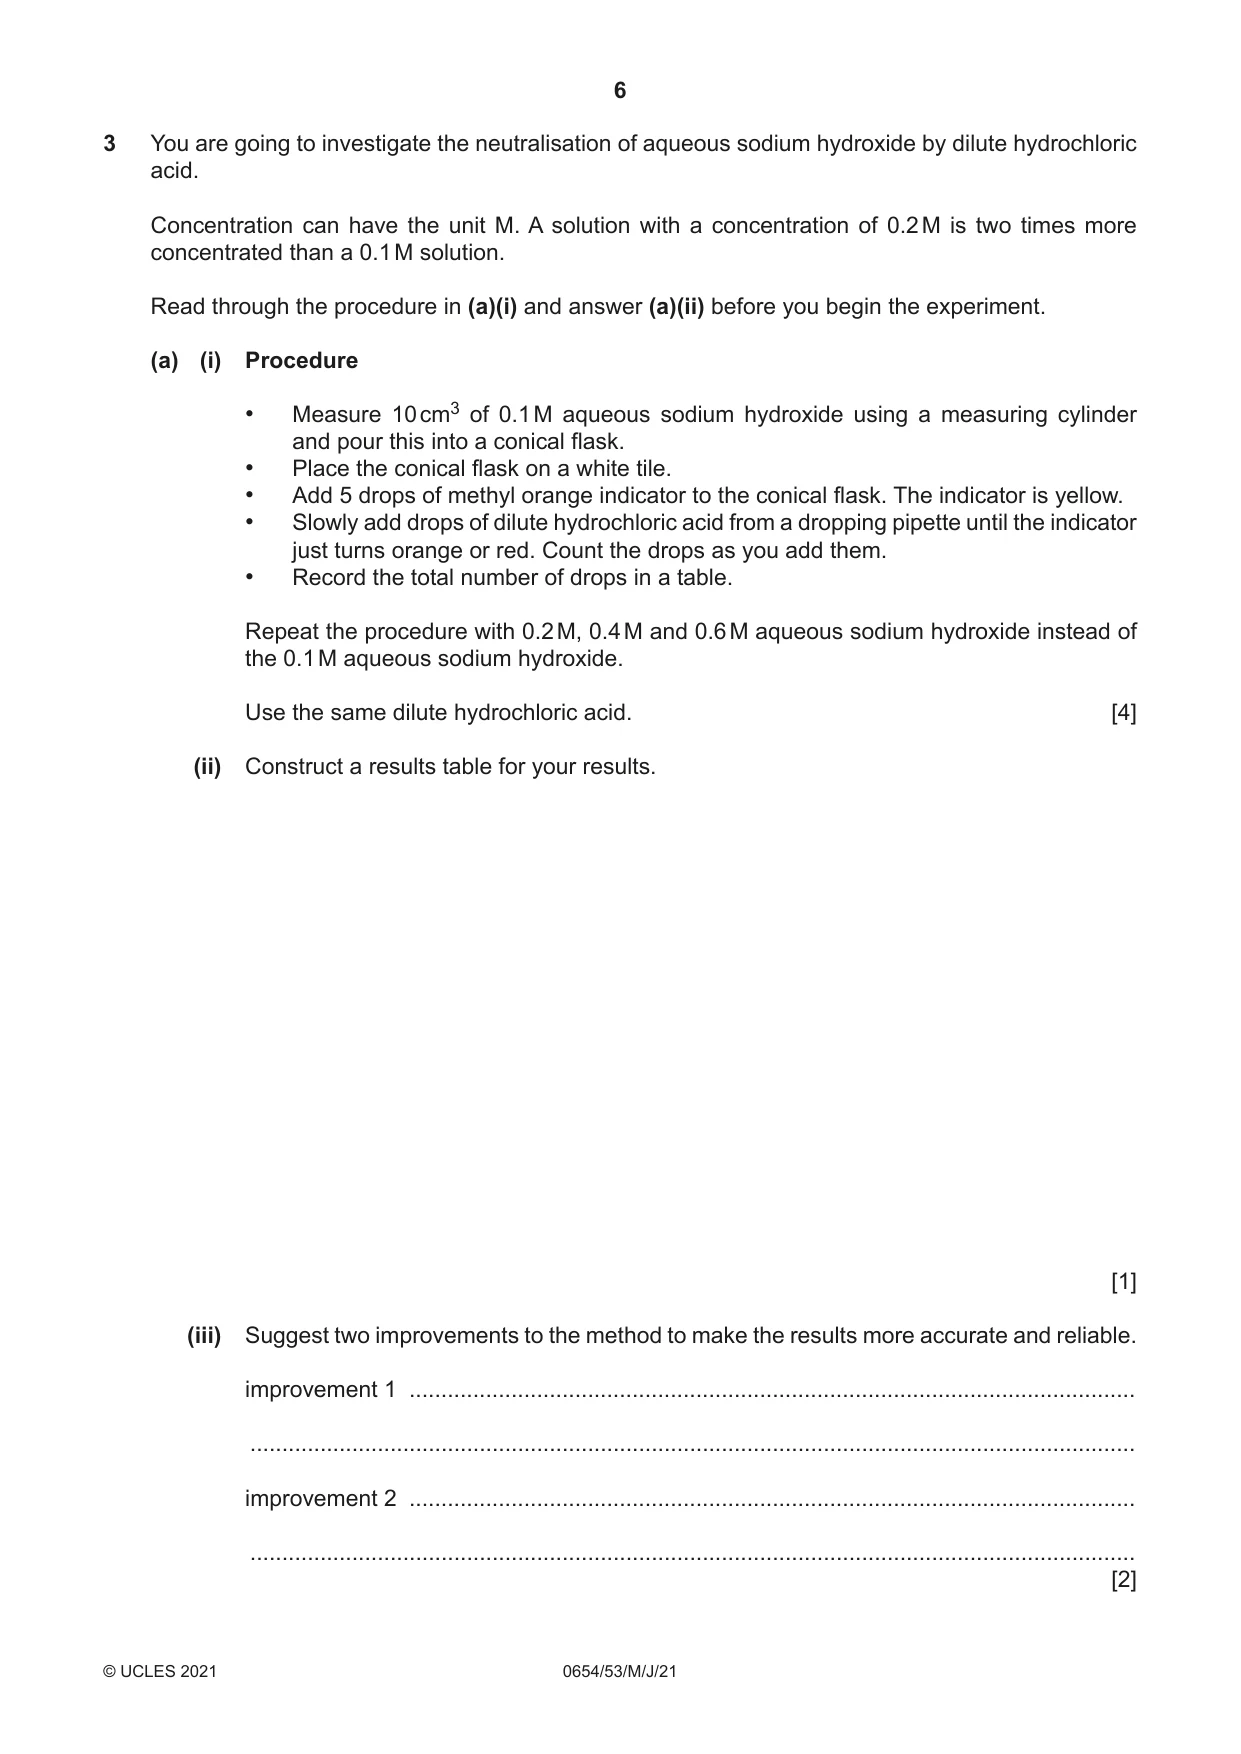
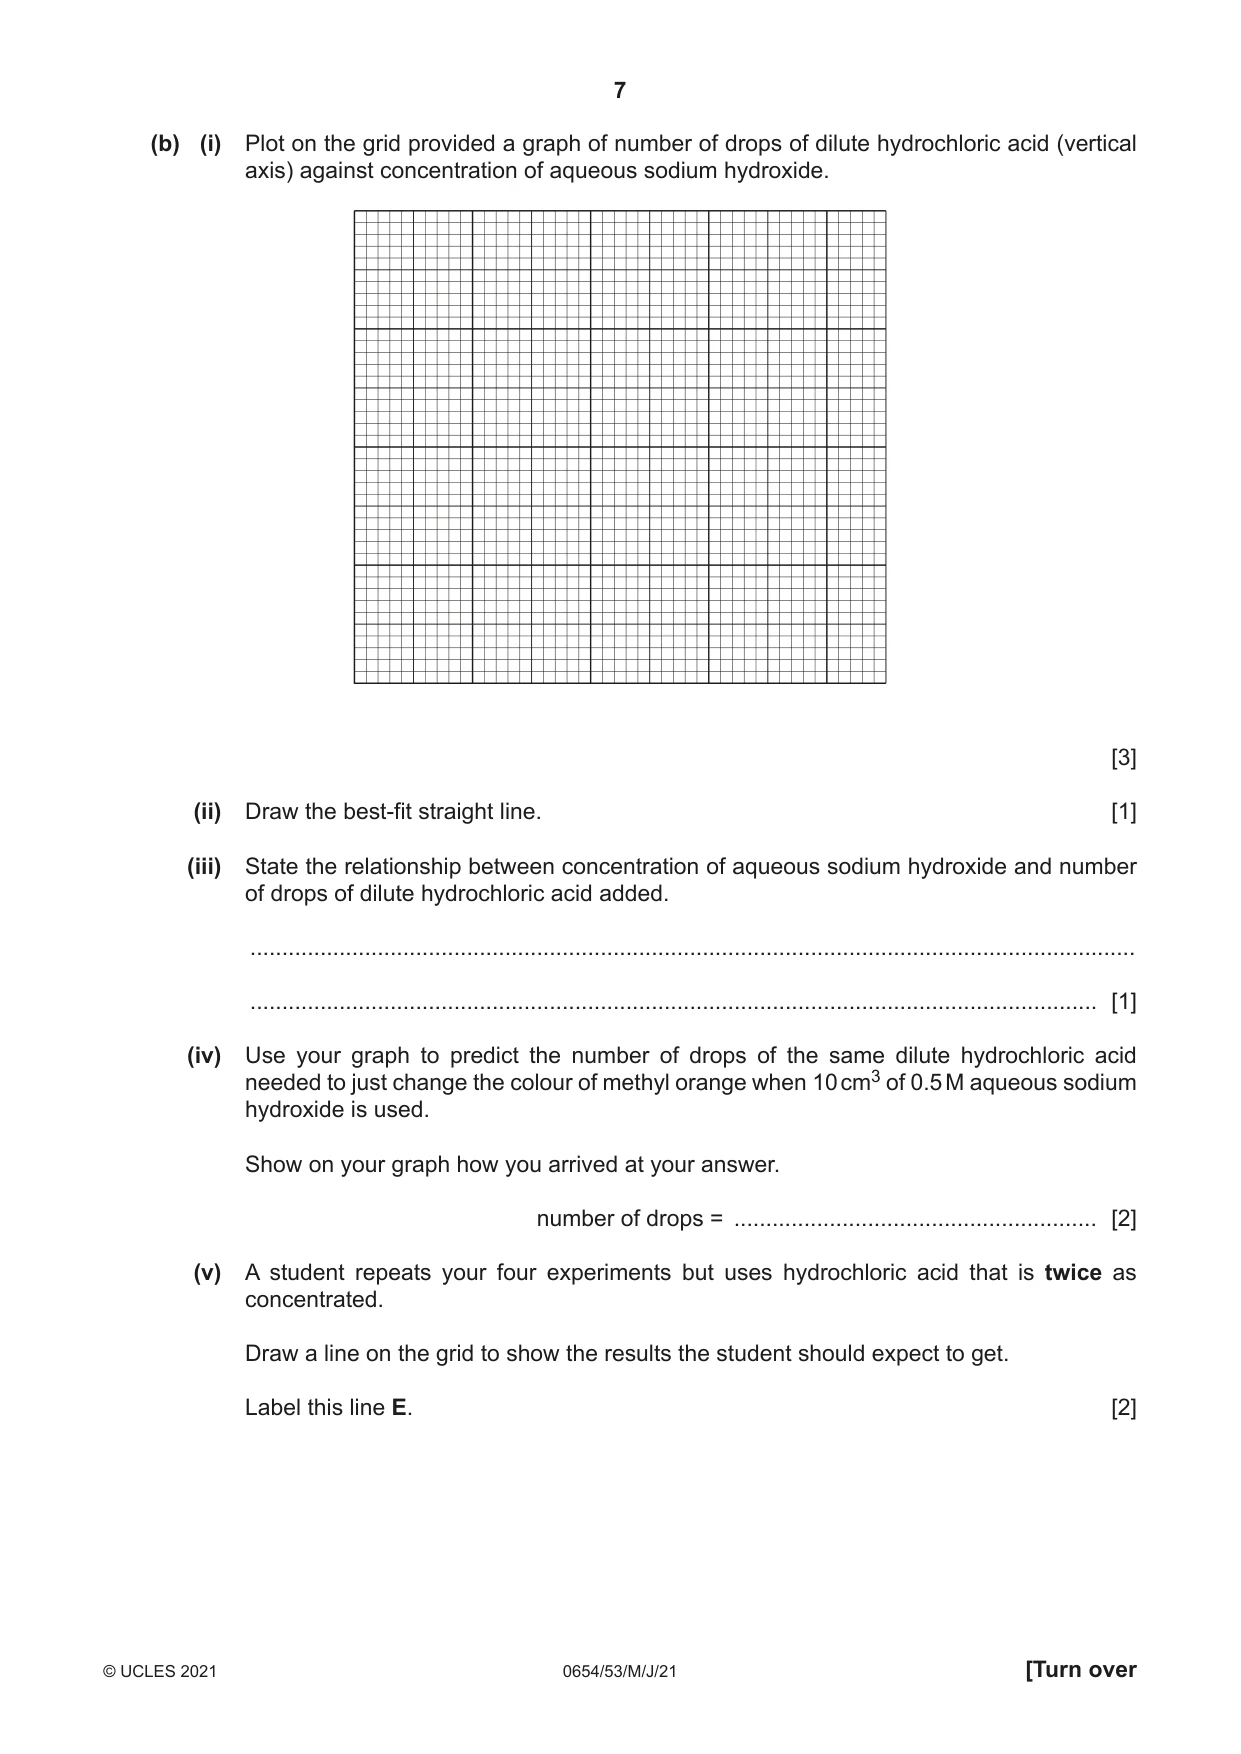
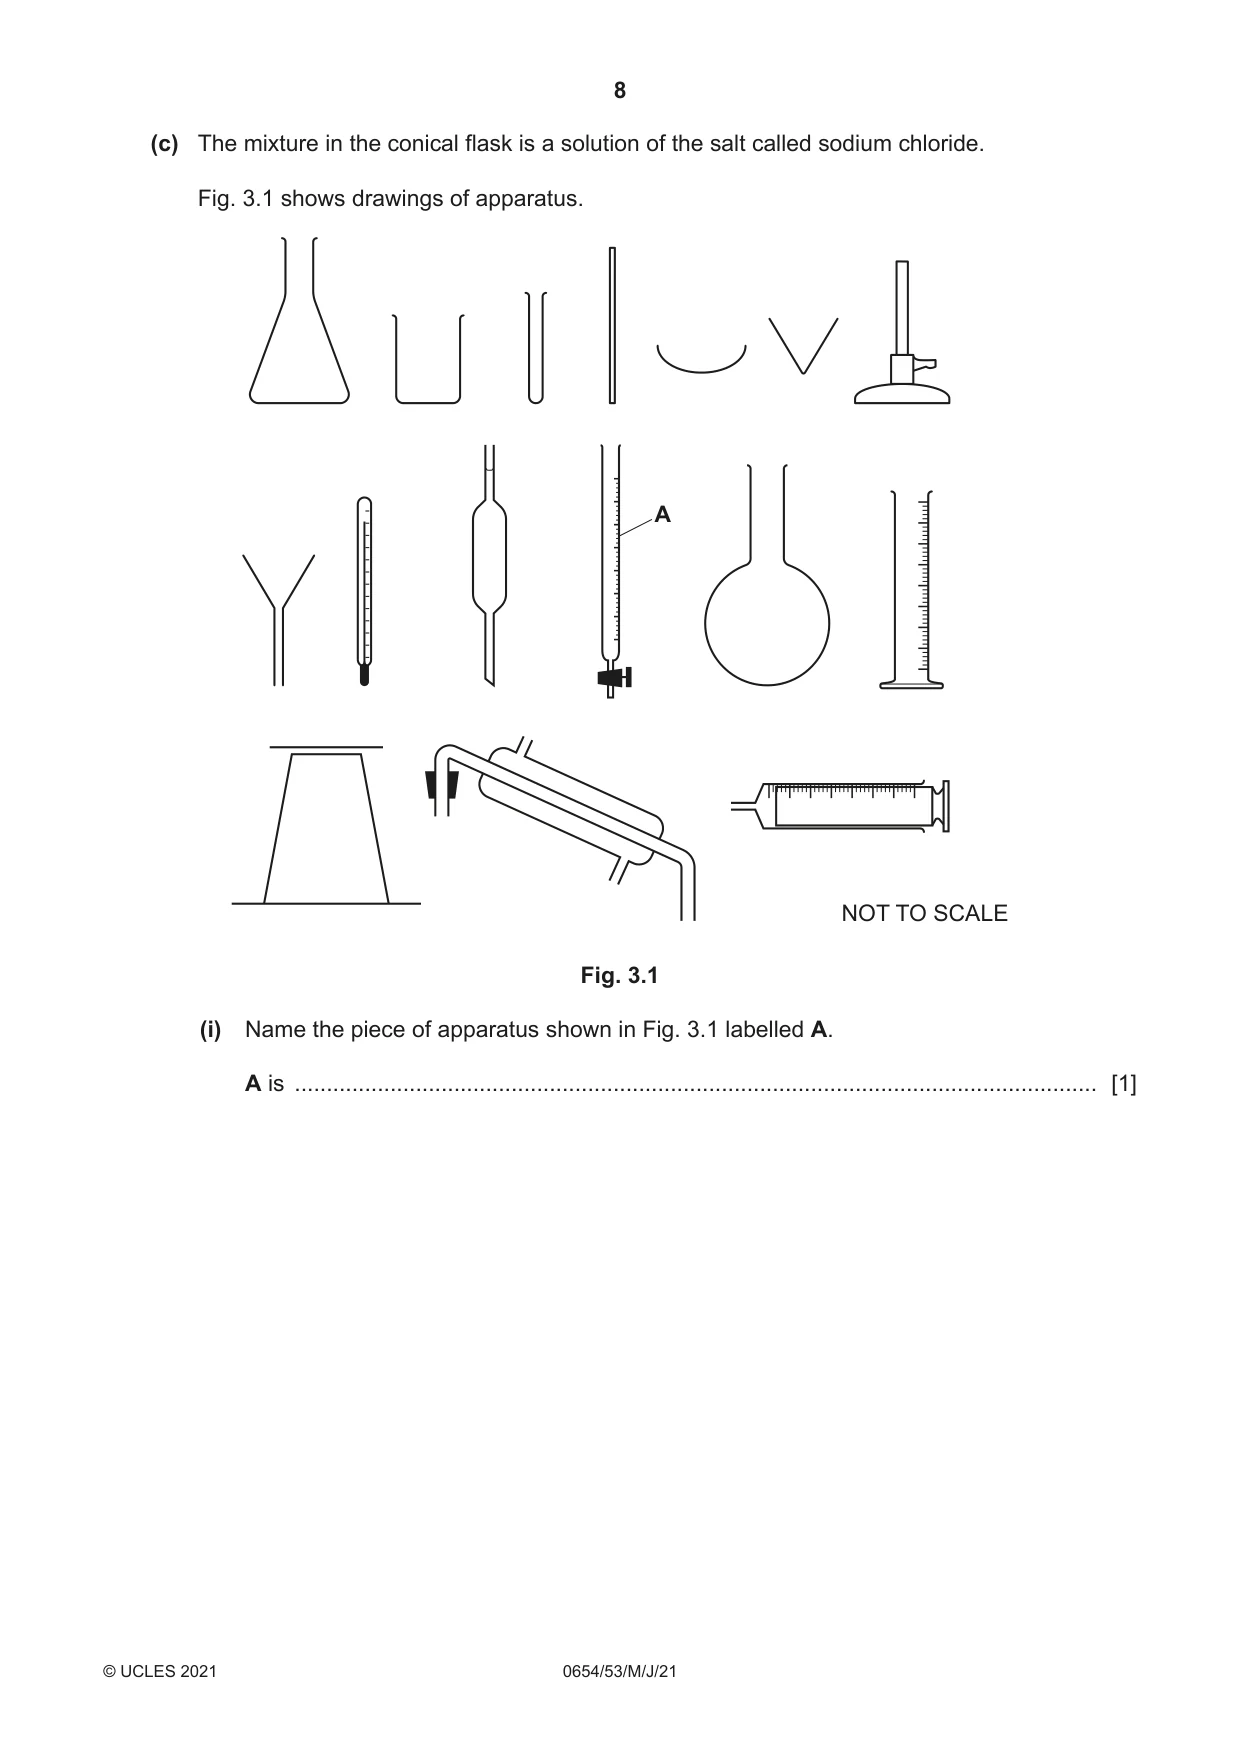
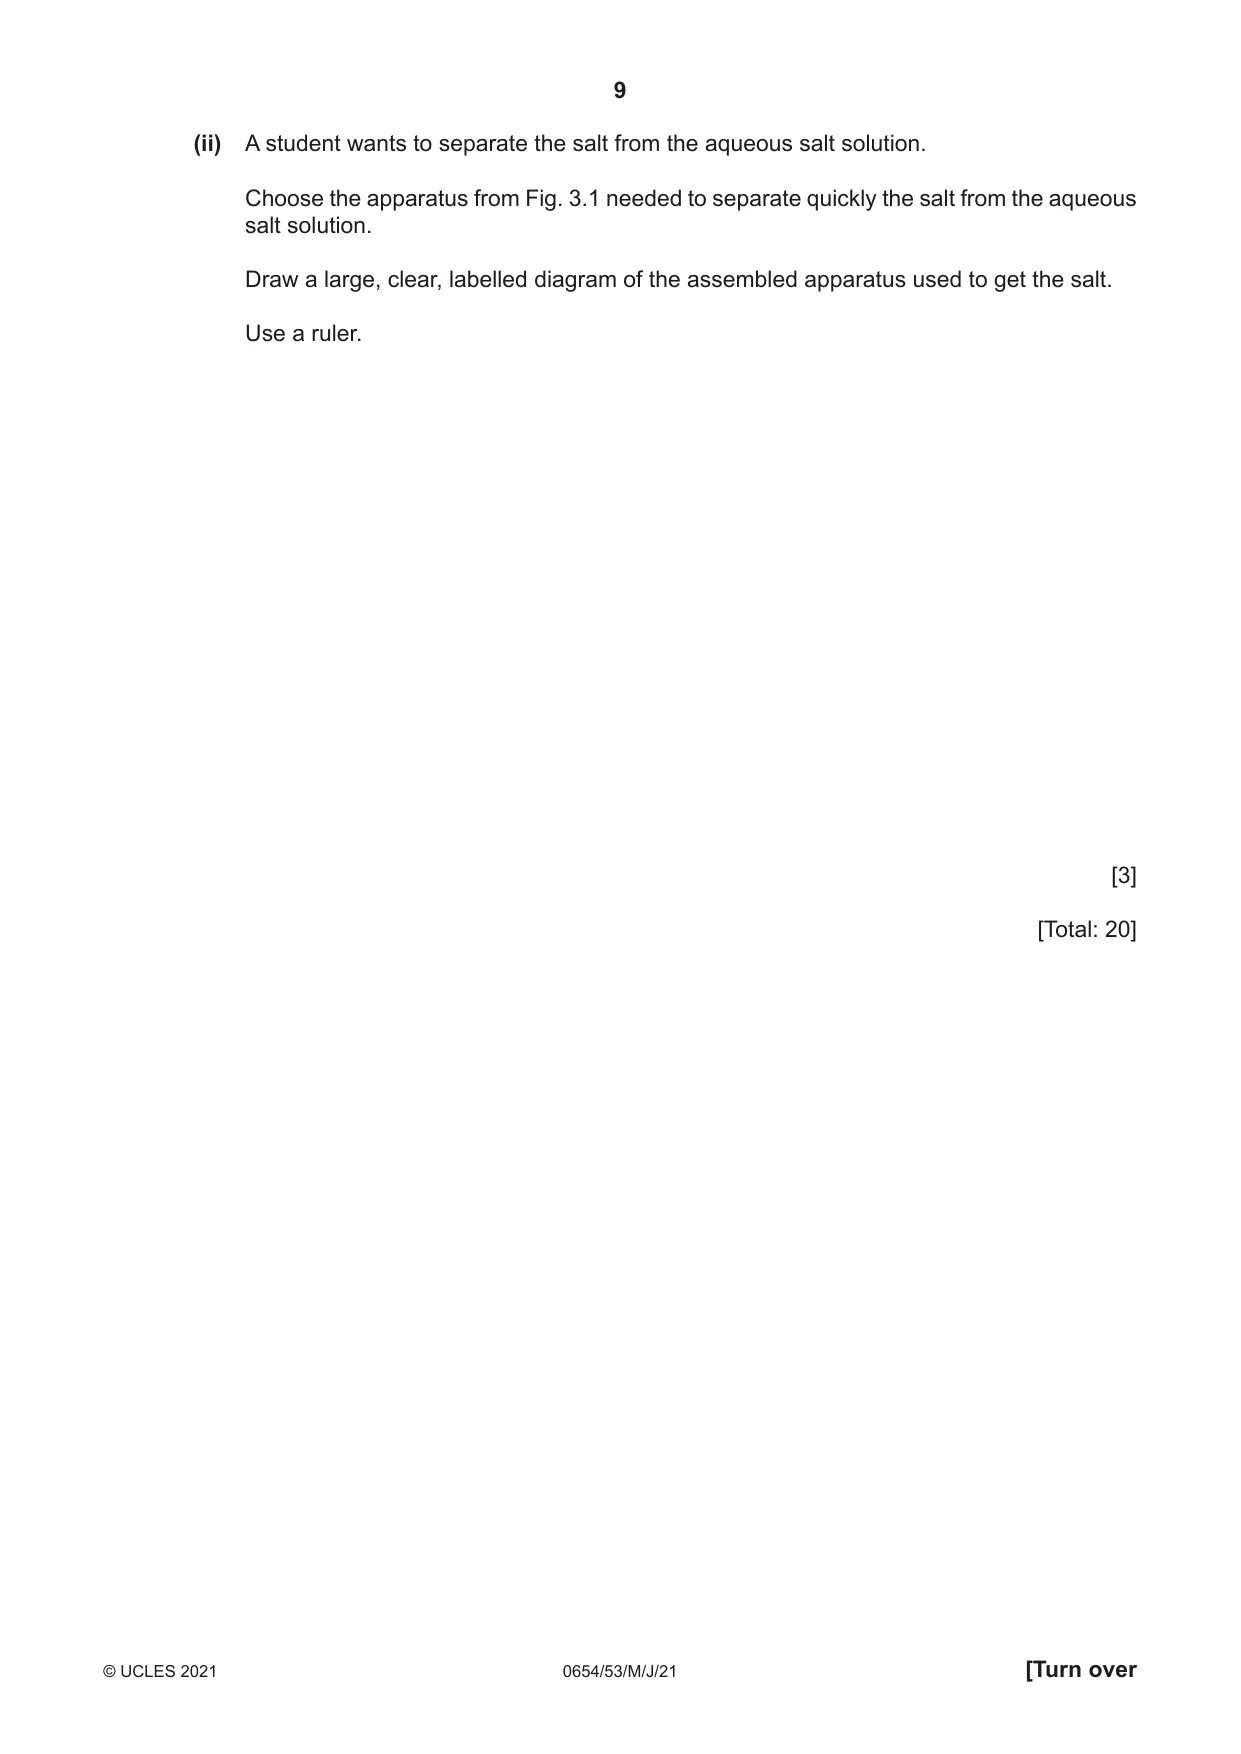
3 You are going to investigate the neutralisation of aqueous sodium hydroxide by dilute hydrochloric acid. Concentration can have the unit M. A solution with a concentration of 0.2 M is two times more concentrated than a 0.1 M solution. Read through the procedure in (a)(i) and answer (a)(ii) before you begin the experiment. (a) (i) Procedure • Measure 10 cm3 of 0.1 M aqueous sodium hydroxide using a measuring cylinder and pour this into a conical flask. • Place the conical flask on a white tile. • Add 5 drops of methyl orange indicator to the conical flask. The indicator is yellow. • Slowly add drops of dilute hydrochloric acid from a dropping pipette until the indicator just turns orange or red. Count the drops as you add them. • Record the total number of drops in a table. Repeat the procedure with 0.2 M, 0.4 M and 0.6 M aqueous sodium hydroxide instead of the 0.1 M aqueous sodium hydroxide. Use the same dilute hydrochloric acid. [4] (ii) Construct a results table for your results. [1] (iii) Suggest two improvements to the method to make the results more accurate and reliable. improvement 1 .................................................................................................................. ........................................................................................................................................... improvement 2 .................................................................................................................. ........................................................................................................................................... [2] (b) (i) Plot on the grid provided a graph of number of drops of dilute hydrochloric acid (vertical axis) against concentration of aqueous sodium hydroxide. [3] (ii) Draw the best-fit straight line. [1] (iii) State the relationship between concentration of aqueous sodium hydroxide and number of drops of dilute hydrochloric acid added. ........................................................................................................................................... ..................................................................................................................................... [1] (iv) Use your graph to predict the number of drops of the same dilute hydrochloric acid needed to just change the colour of methyl orange when 10 cm3 of 0.5 M aqueous sodium hydroxide is used. Show on your graph how you arrived at your answer. number of drops = ......................................................... [2] (v) A student repeats your four experiments but uses hydrochloric acid that is twice as concentrated. Draw a line on the grid to show the results the student should expect to get. Label this line E. [2] (c) The mixture in the conical flask is a solution of the salt called sodium chloride. Fig. 3.1 shows drawings of apparatus. A NOT TO SCALE Fig. 3.1 (i) Name the piece of apparatus shown in Fig. 3.1 labelled A. A is .............................................................................................................................. [1] (ii) A student wants to separate the salt from the aqueous salt solution. Choose the apparatus from Fig. 3.1 needed to separate quickly the salt from the aqueous salt solution. Draw a large, clear, labelled diagram of the assembled apparatus used to get the salt. Use a ruler. [3] [Total: 20]
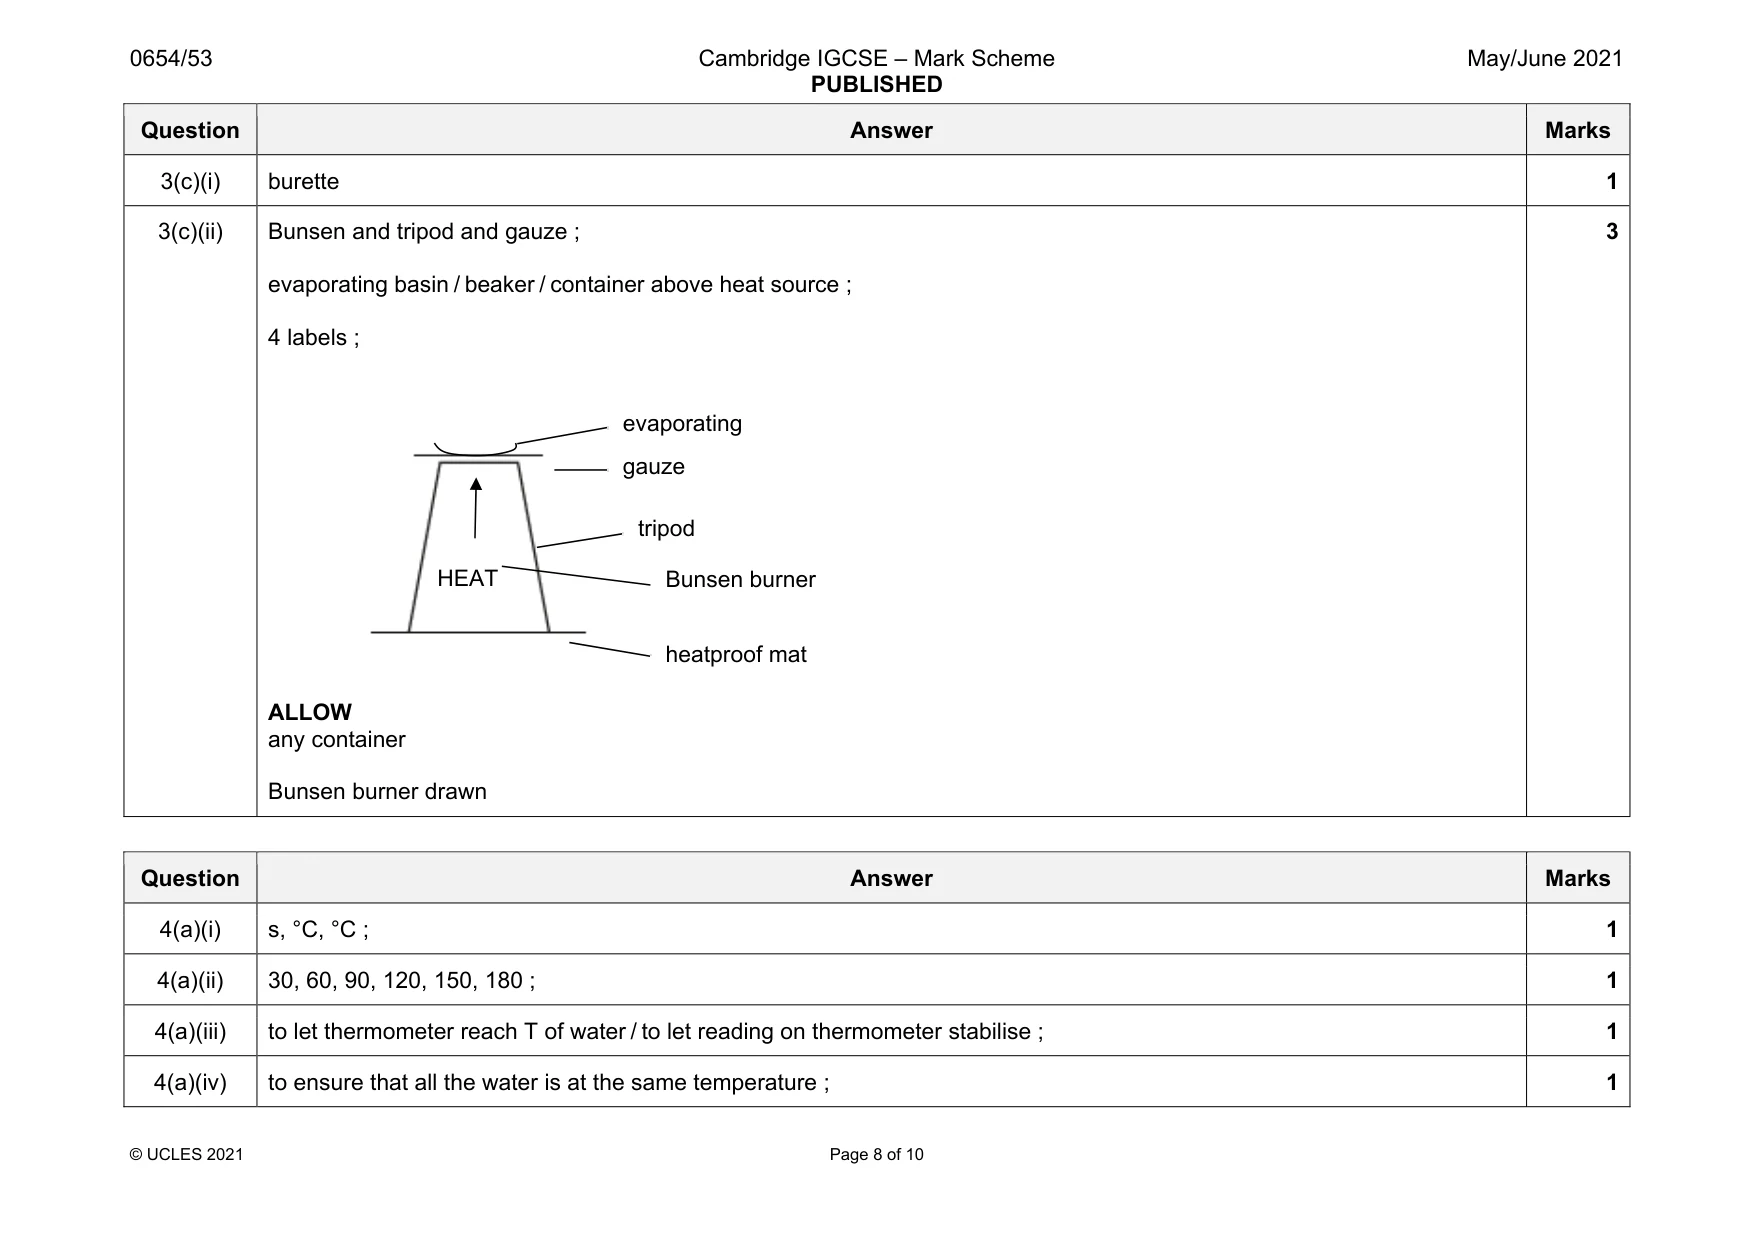
Mark scheme: 3(a)(i) 1 experiment ; all experiments ; 0.6 M highest and 0.1 M lowest ; correct order 0.1 < 0.2 < 0.4 < 0.6 ; 4 3(a)(ii) lines and headers and unit ; 1 3(a)(iii) any 2 from: measure sodium hydroxide volume with pipette / burette ; repeat ; swirl / stir ; titrate with burette rather than drops ; 2 3(b)(i) axes correct way round and labelled with quantity and unit ; sensible linear scales and plotted points cover ⩾ half the grid ; 4 points plotted correctly ; 3 3(b)(ii) best-fit line ; 1 3(b)(iii) directly proportional (if straight line through origin) / as one doubles the other doubles ; 1 3(b)(iv) marking on graph ; from graph – but want whole number ; 2 3(b)(v) lower across all points ; approx. half the value at most points ; 2 Question Answer Marks 3(c)(i) burette 1 3(c)(ii) Bunsen and tripod and gauze ; evaporating basin / beaker / container above heat source ; 4 labels ; ALLOW any container Bunsen burner drawn 3 HEAT evaporating gauze tripod heatproof mat Bunsen burner
Q4 · You are going to investigate the cooling rates of different volumes of hot water
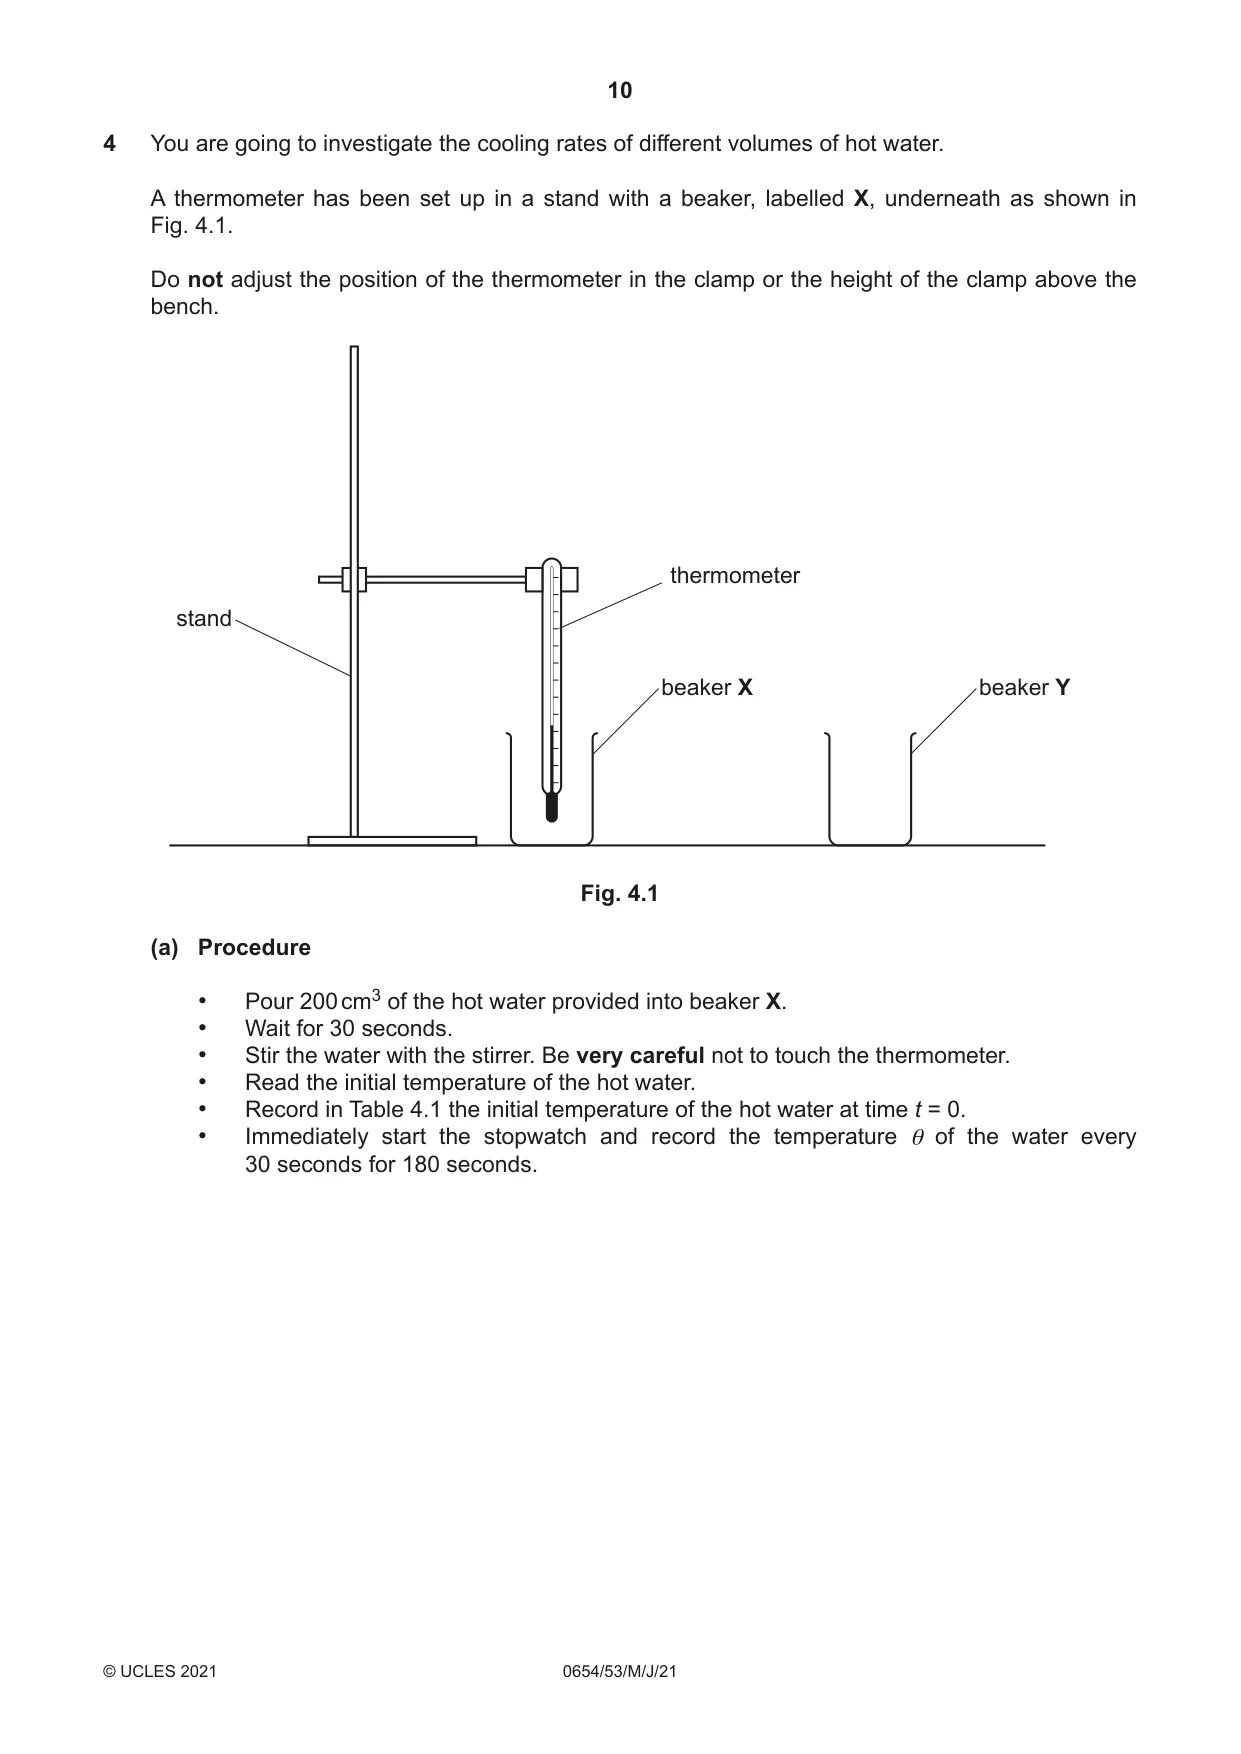
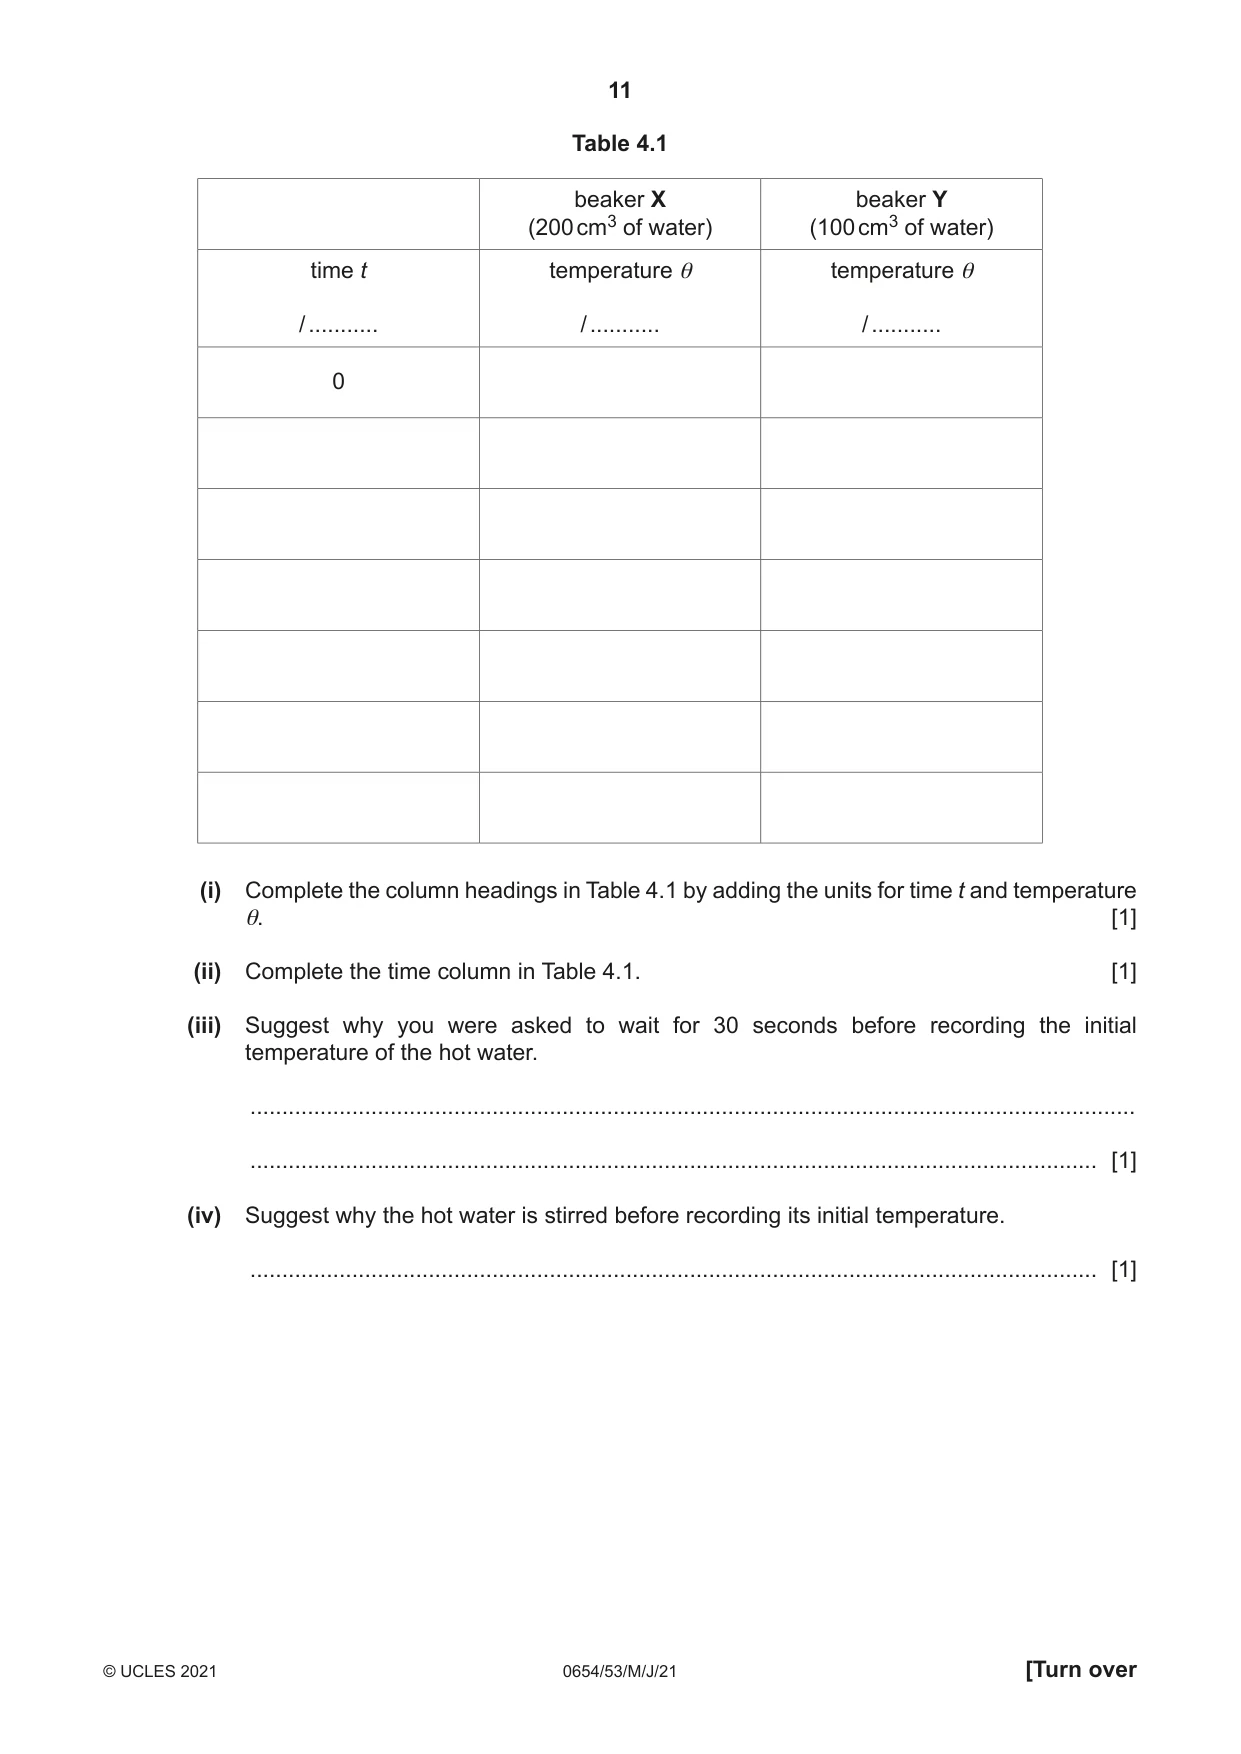
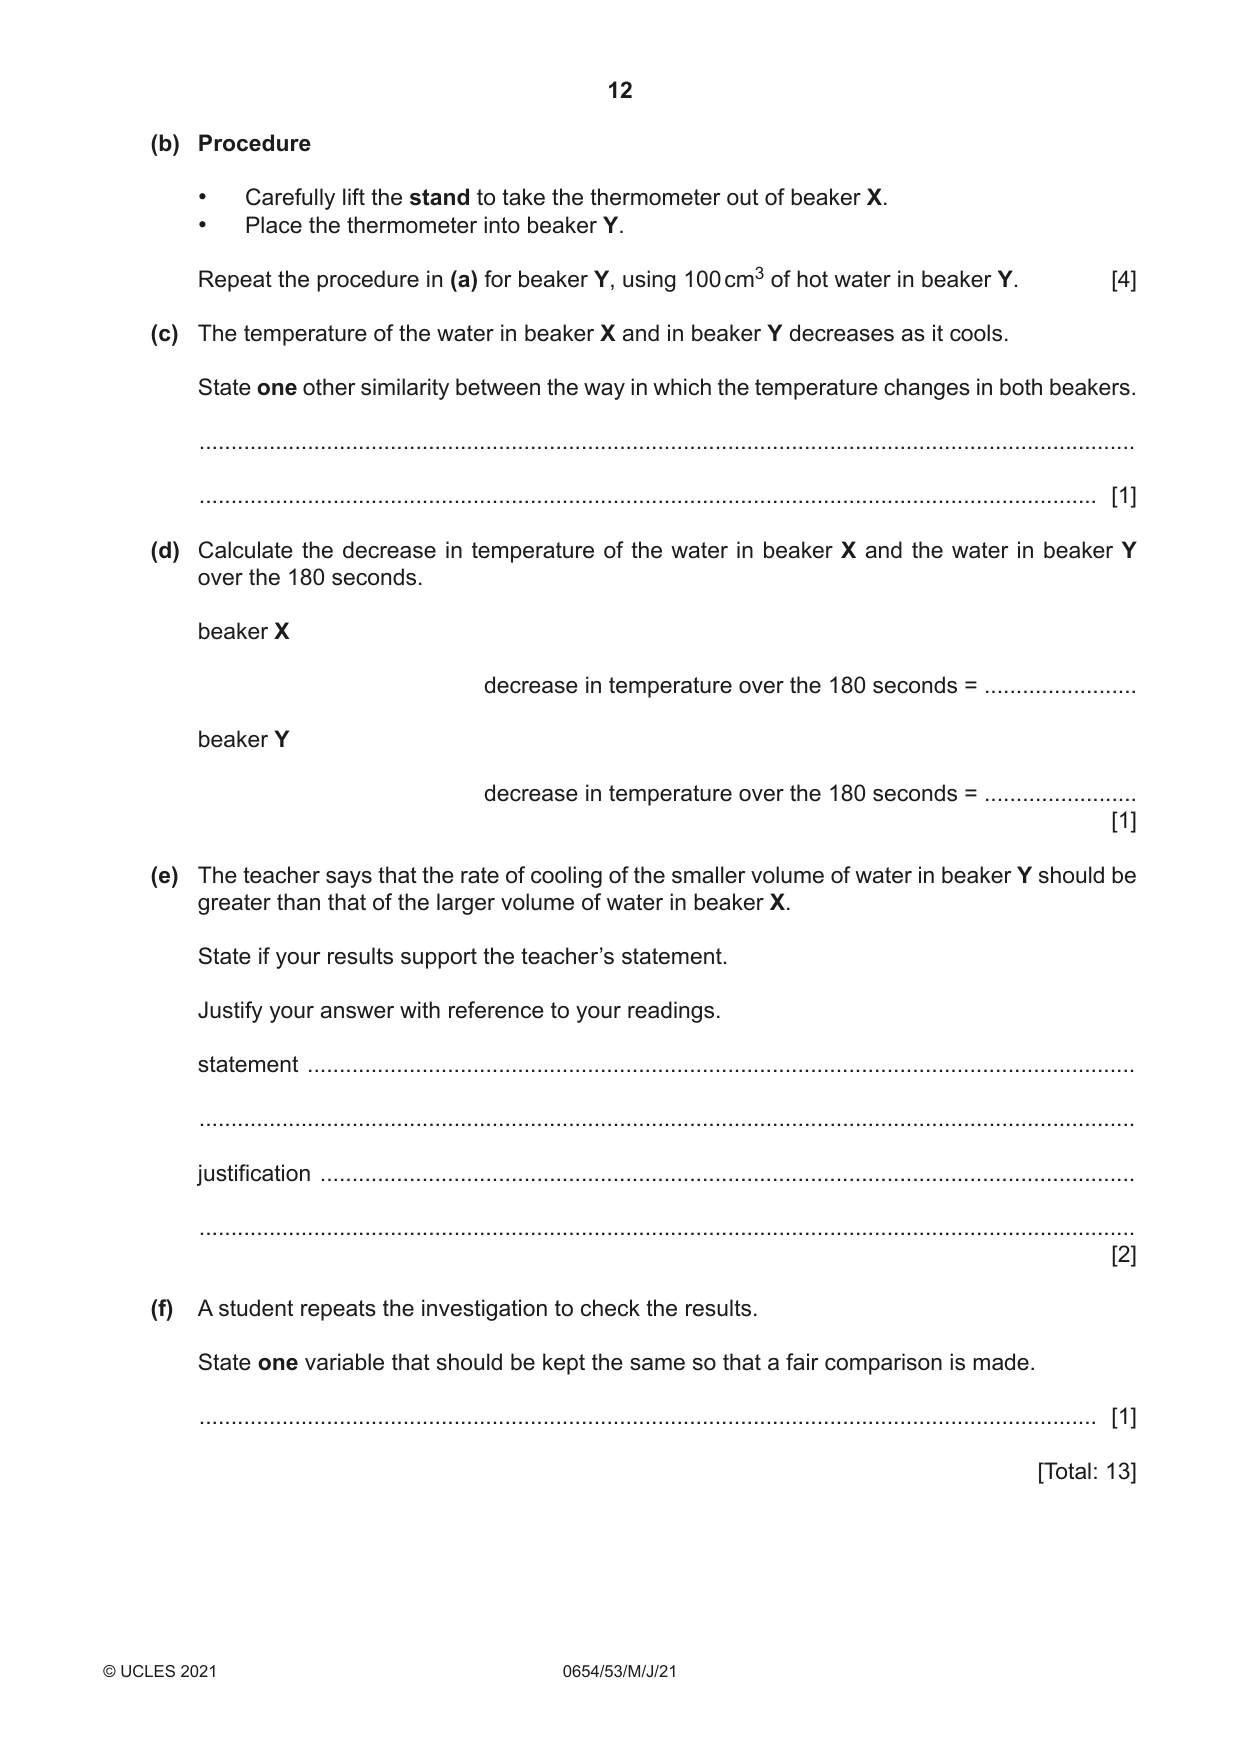
4 You are going to investigate the cooling rates of different volumes of hot water. A thermometer has been set up in a stand with a beaker, labelled X, underneath as shown in Fig. 4.1. Do not adjust the position of the thermometer in the clamp or the height of the clamp above the bench. thermometer stand beaker X beaker Y Fig. 4.1 (a) Procedure • Pour 200 cm3 of the hot water provided into beaker X. • Wait for 30 seconds. • Stir the water with the stirrer. Be very careful not to touch the thermometer. • Read the initial temperature of the hot water. • Record in Table 4.1 the initial temperature of the hot water at time t = 0. • Immediately start the stopwatch and record the temperature θ of the water every 30 seconds for 180 seconds. Table 4.1 beaker X beaker Y (200 cm3 of water) (100 cm3 of water) time t temperature θ temperature θ / ........... / ........... / ........... 0 (i) Complete the column headings in Table 4.1 by adding the units for time t and temperature θ. [1] (ii) Complete the time column in Table 4.1. [1] (iii) Suggest why you were asked to wait for 30 seconds before recording the initial temperature of the hot water. ........................................................................................................................................... ..................................................................................................................................... [1] (iv) Suggest why the hot water is stirred before recording its initial temperature. ..................................................................................................................................... [1] (b) Procedure • Carefully lift the stand to take the thermometer out of beaker X. • Place the thermometer into beaker Y. Repeat the procedure in (a) for beaker Y, using 100 cm3 of hot water in beaker Y. [4] (c) The temperature of the water in beaker X and in beaker Y decreases as it cools. State one other similarity between the way in which the temperature changes in both beakers. ................................................................................................................................................... ............................................................................................................................................. [1] (d) Calculate the decrease in temperature of the water in beaker X and the water in beaker Y over the 180 seconds. beaker X decrease in temperature over the 180 seconds = ........................ beaker Y decrease in temperature over the 180 seconds = ........................ [1] (e) The teacher says that the rate of cooling of the smaller volume of water in beaker Y should be greater than that of the larger volume of water in beaker X. State if your results support the teacher’s statement. Justify your answer with reference to your readings. statement .................................................................................................................................. ................................................................................................................................................... justification ................................................................................................................................ ................................................................................................................................................... [2] (f) A student repeats the investigation to check the results. State one variable that should be kept the same so that a fair comparison is made. ............................................................................................................................................. [1] [Total: 13]
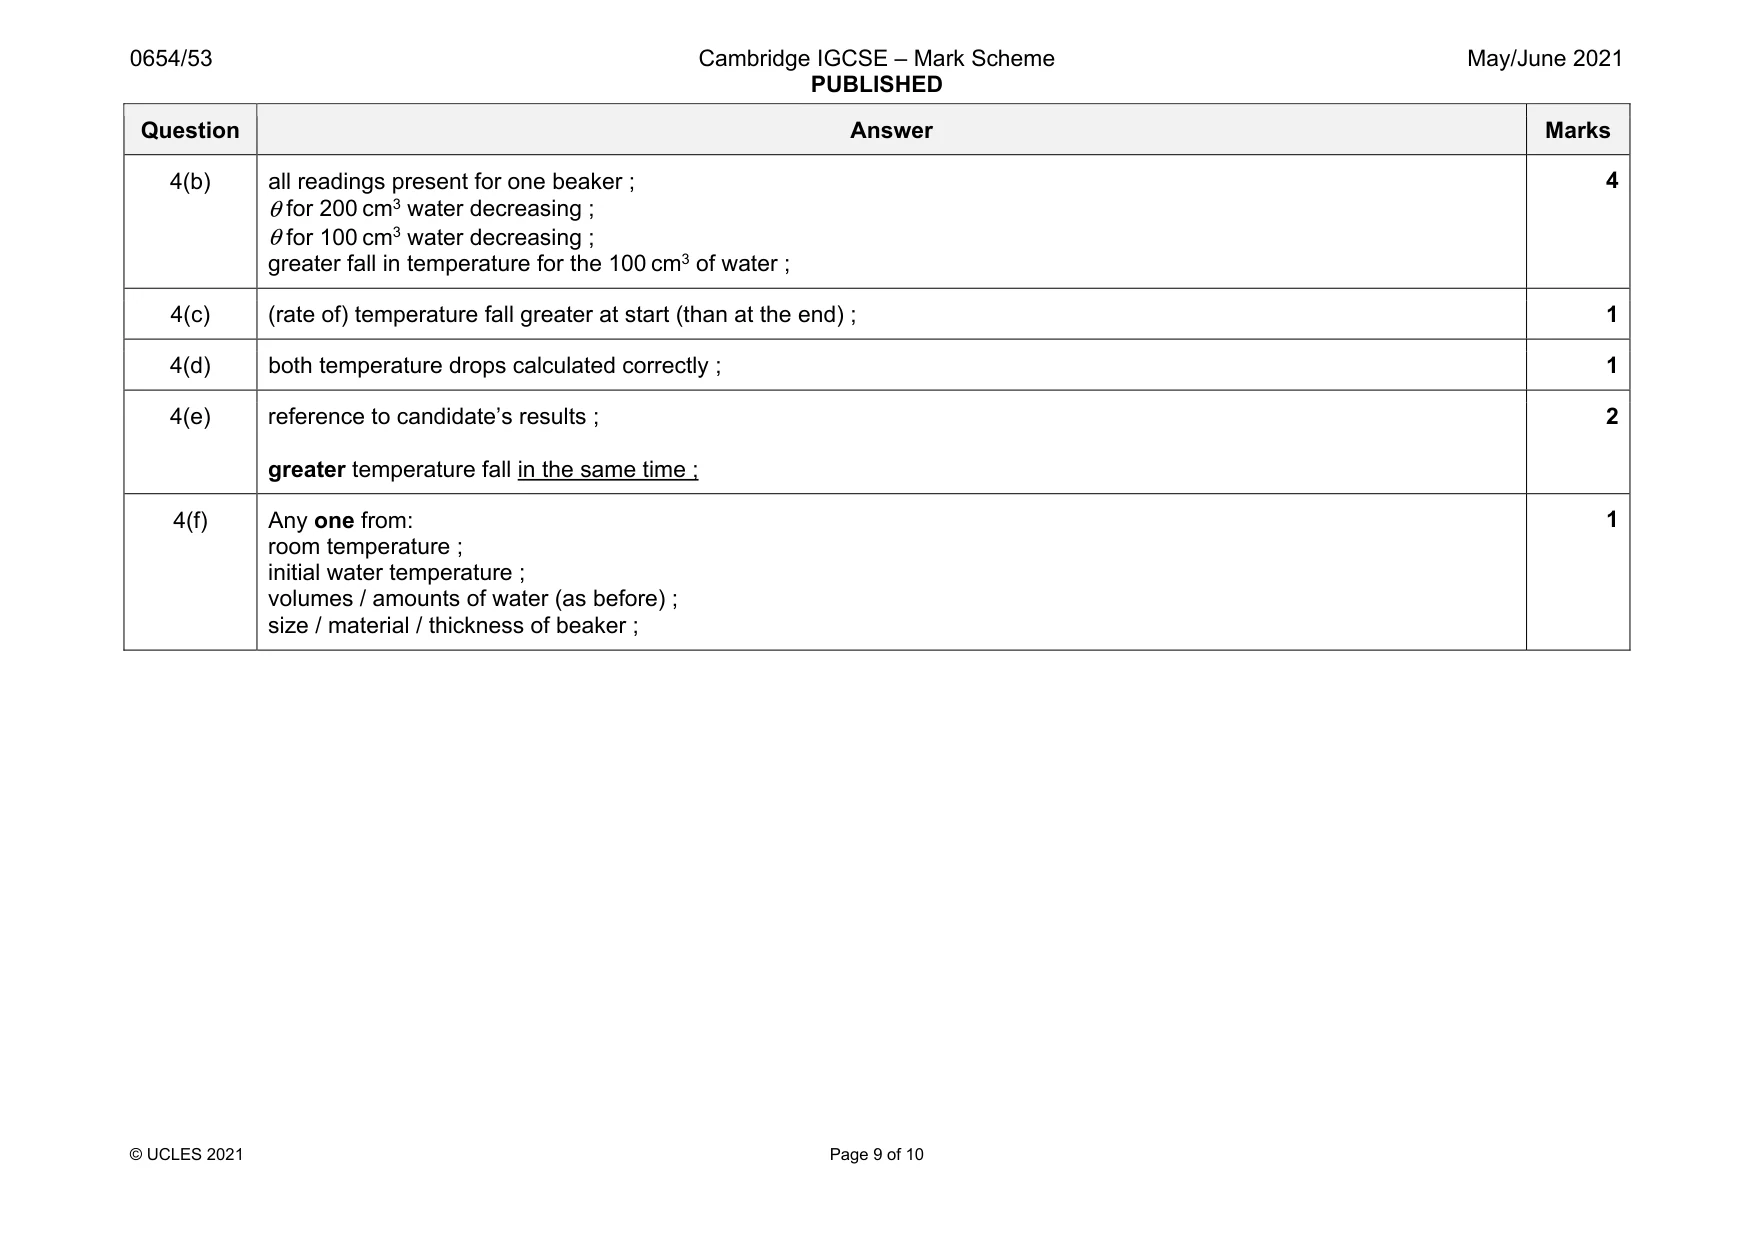
Mark scheme: 4(a)(i) s, °C, °C ; 1 4(a)(ii) 30, 60, 90, 120, 150, 180 ; 1 4(a)(iii) to let thermometer reach T of water / to let reading on thermometer stabilise ; 1 4(a)(iv) to ensure that all the water is at the same temperature ; 1 Question Answer Marks 4(b) all readings present for one beaker ; θ for 200 cm3 water decreasing ; θ for 100 cm3 water decreasing ; greater fall in temperature for the 100 cm3 of water ; 4 4(c) (rate of) temperature fall greater at start (than at the end) ; 1 4(d) both temperature drops calculated correctly ; 1 4(e) reference to candidate’s results ; greater temperature fall in the same time ; 2 4(f) Any one from: room temperature ; initial water temperature ; volumes / amounts of water (as before) ; size / material / thickness of beaker ; 1
Q5 · A student investigates if the time taken for a metal ball rolling along a horizontal…
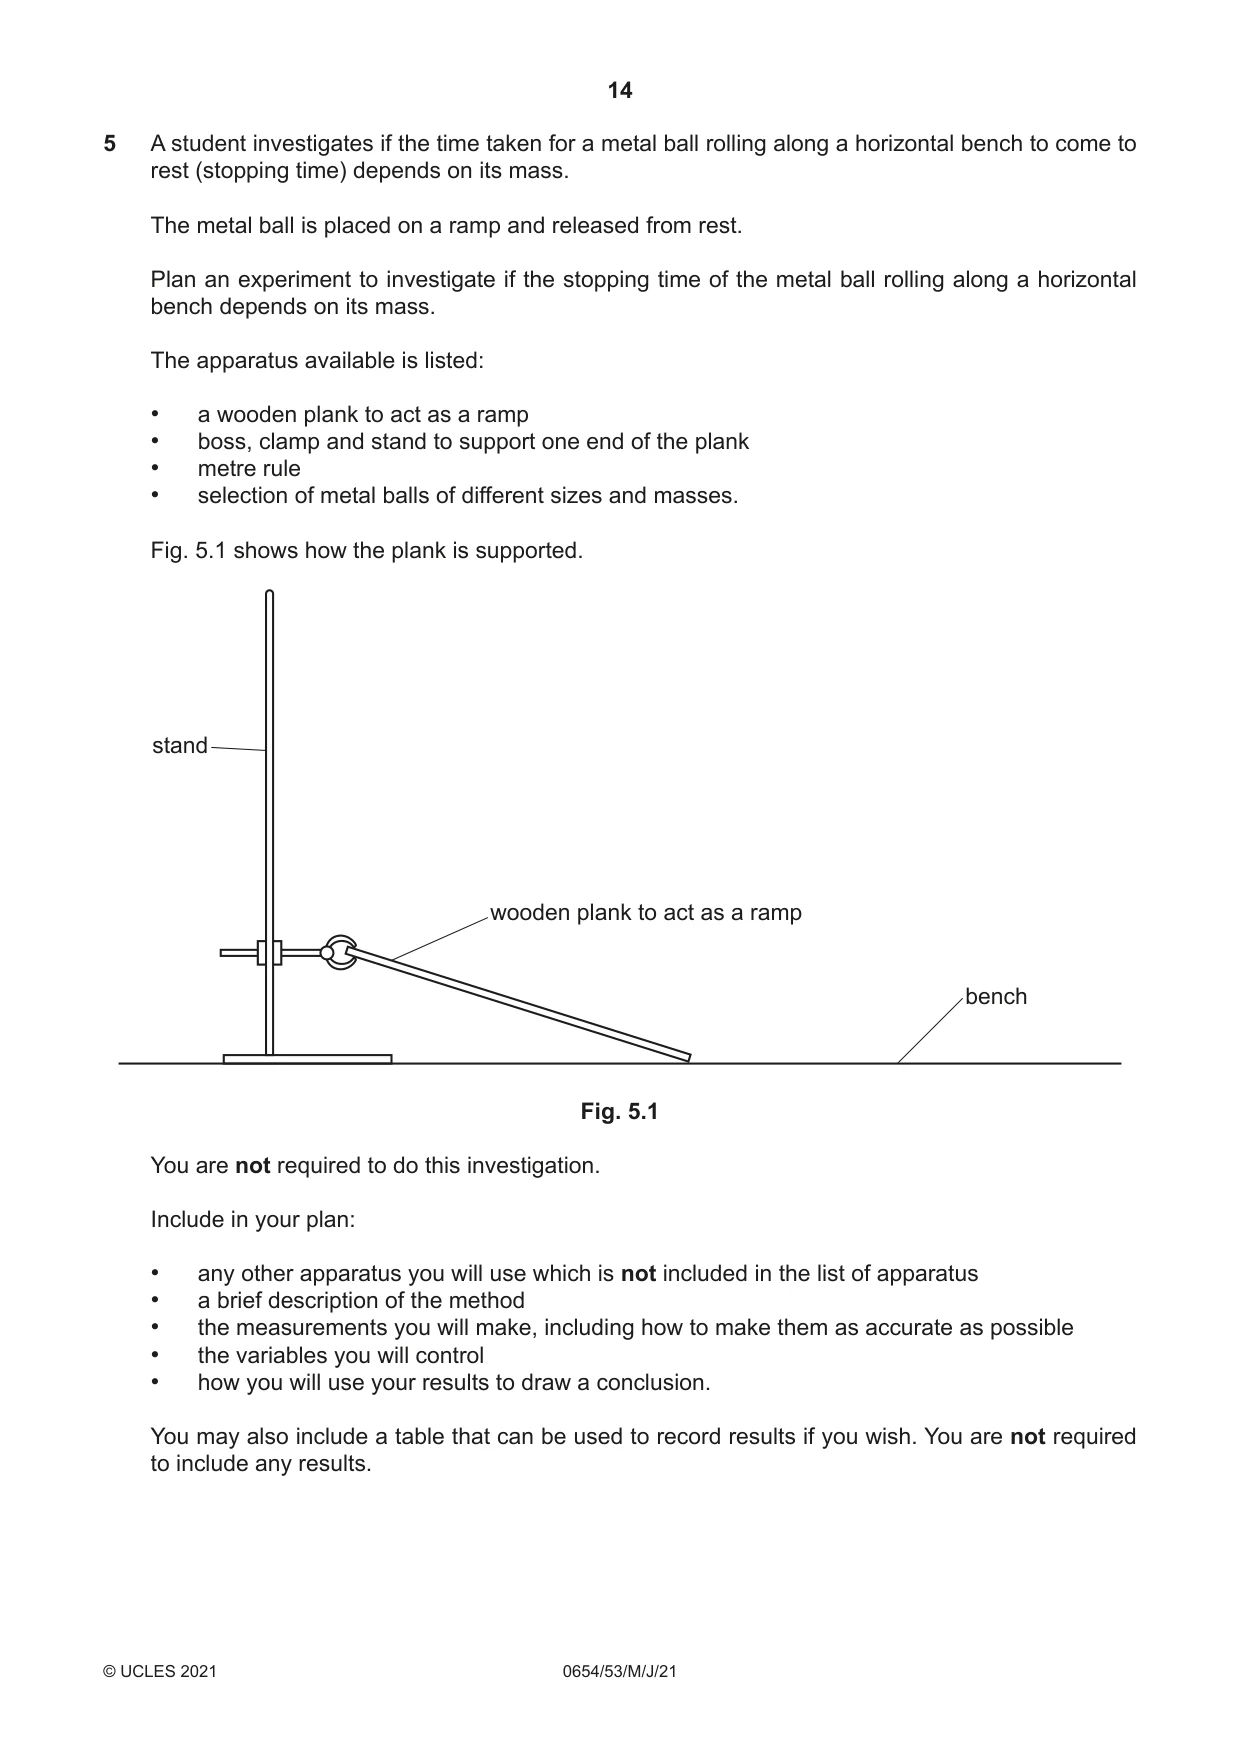
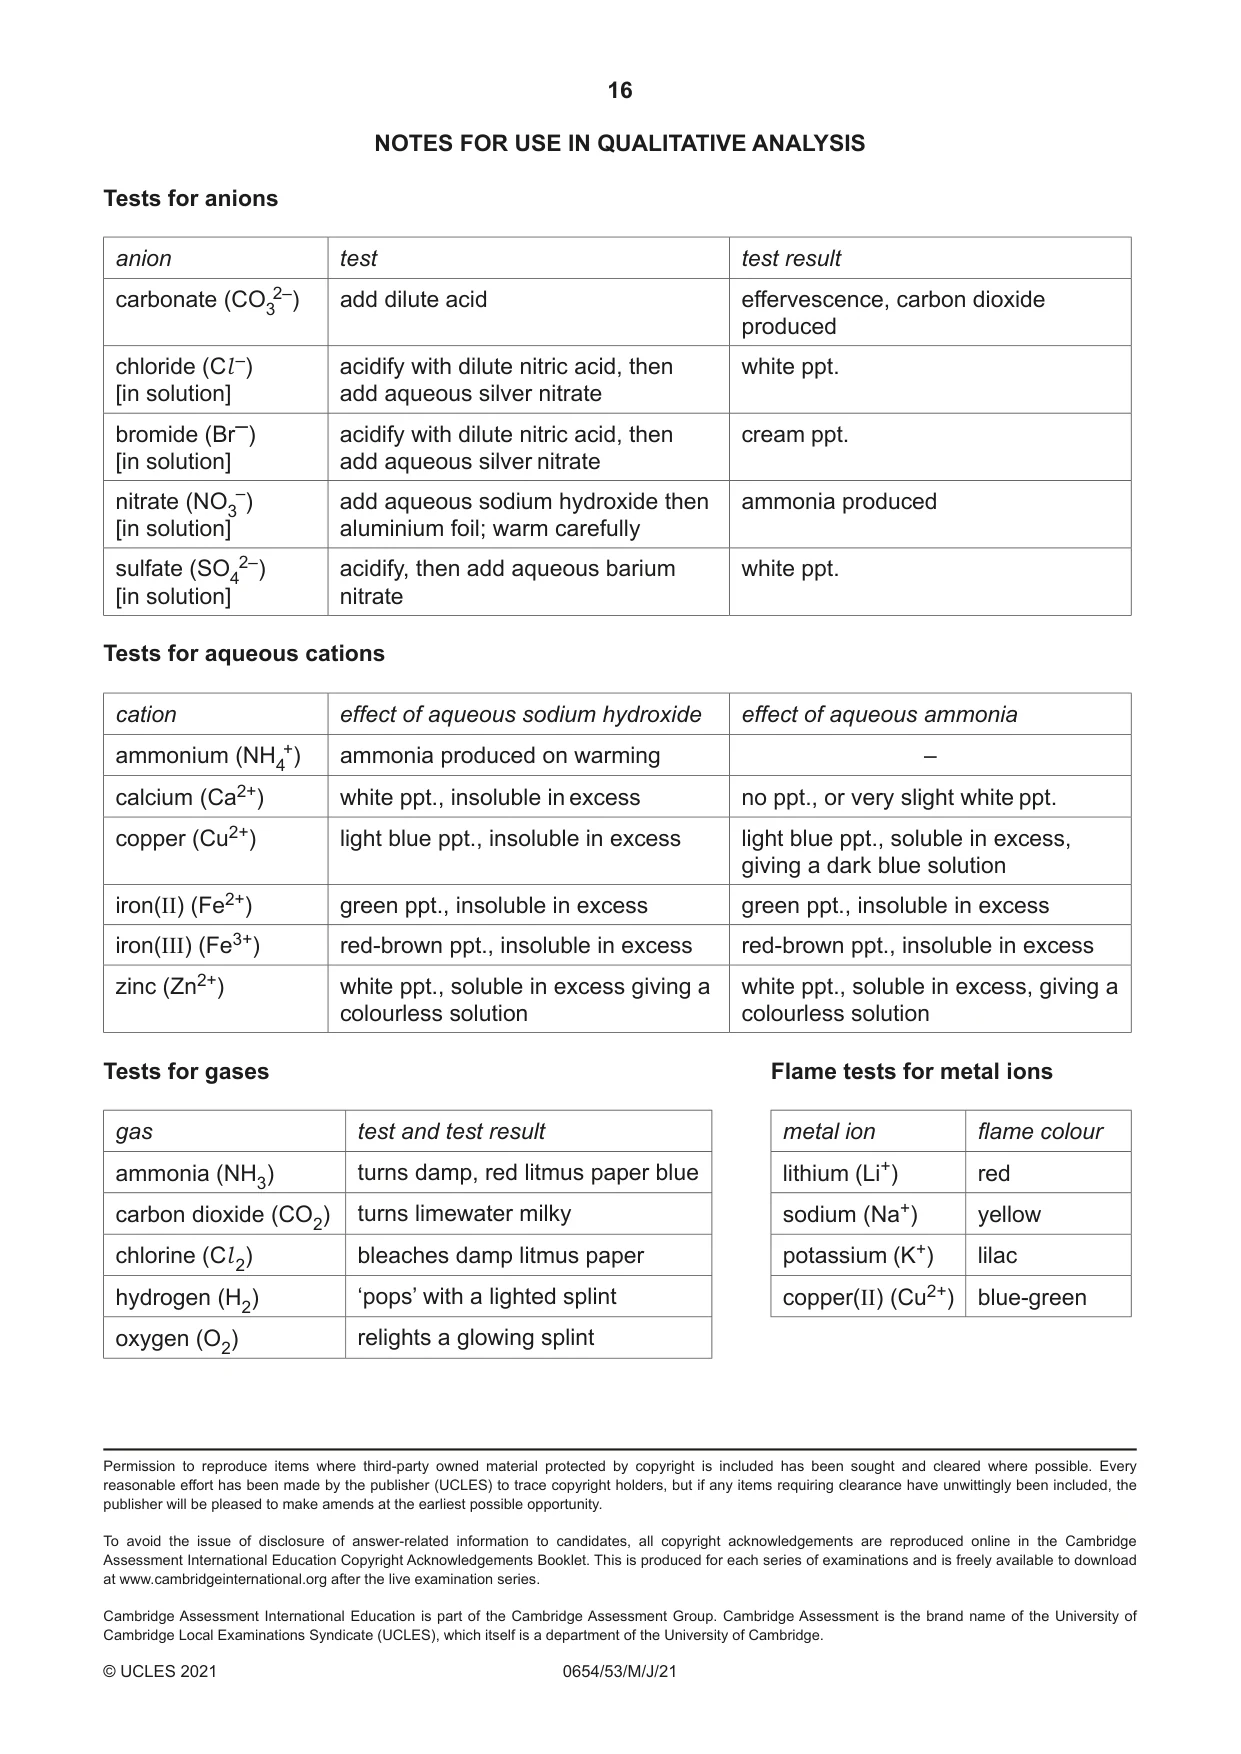
5 A student investigates if the time taken for a metal ball rolling along a horizontal bench to come to rest (stopping time) depends on its mass. The metal ball is placed on a ramp and released from rest. Plan an experiment to investigate if the stopping time of the metal ball rolling along a horizontal bench depends on its mass. The apparatus available is listed: • a wooden plank to act as a ramp • boss, clamp and stand to support one end of the plank • metre rule • selection of metal balls of different sizes and masses. Fig. 5.1 shows how the plank is supported. stand wooden plank to act as a ramp bench Fig. 5.1 You are not required to do this investigation. Include in your plan: • any other apparatus you will use which is not included in the list of apparatus • a brief description of the method • the measurements you will make, including how to make them as accurate as possible • the variables you will control • how you will use your results to draw a conclusion. You may also include a table that can be used to record results if you wish. You are not required to include any results. .......................................................................................................................................................... .......................................................................................................................................................... .......................................................................................................................................................... .......................................................................................................................................................... .......................................................................................................................................................... .......................................................................................................................................................... .......................................................................................................................................................... .......................................................................................................................................................... .......................................................................................................................................................... .......................................................................................................................................................... .......................................................................................................................................................... .......................................................................................................................................................... .......................................................................................................................................................... .......................................................................................................................................................... .......................................................................................................................................................... .......................................................................................................................................................... .......................................................................................................................................................... .......................................................................................................................................................... .......................................................................................................................................................... .................................................................................................................................................... [7] NOTES FOR USE IN QUALITATIVE ANALYSIS Tests for anions anion test test result carbonate (CO32–) add dilute acid effervescence, carbon dioxide produced chloride (Cl –) acidify with dilute nitric acid, then white ppt. [in solution] add aqueous silver nitrate bromide (Br–) acidify with dilute nitric acid, then cream ppt. [in solution] add aqueous silver nitrate nitrate (NO3–) add aqueous sodium hydroxide then ammonia produced [in solution] aluminium foil; warm carefully sulfate (SO42–) acidify, then add aqueous barium white ppt. [in solution] nitrate Tests for aqueous cations cation effect of aqueous sodium hydroxide effect of aqueous ammonia ammonium (NH4+) ammonia produced on warming – calcium (Ca2+) white ppt., insoluble in excess no ppt., or very slight white ppt. copper (Cu2+) light blue ppt., insoluble in excess light blue ppt., soluble in excess, giving a dark blue solution iron(II) (Fe2+) green ppt., insoluble in excess green ppt., insoluble in excess iron(III) (Fe3+) red-brown ppt., insoluble in excess red-brown ppt., insoluble in excess zinc (Zn2+) white ppt., soluble in excess giving a white ppt., soluble in excess, giving a colourless solution colourless solution Tests for gases Flame tests for metal ions gas test and test result metal ion flame colour ammonia (NH3) turns damp, red litmus paper blue lithium (Li+) red carbon dioxide (CO2) turns limewater milky sodium (Na+) yellow chlorine (Cl 2) bleaches damp litmus paper potassium (K+) lilac hydrogen (H2) ‘pops’ with a lighted splint copper(II) (Cu2+) blue-green oxygen (O2) relights a glowing splint
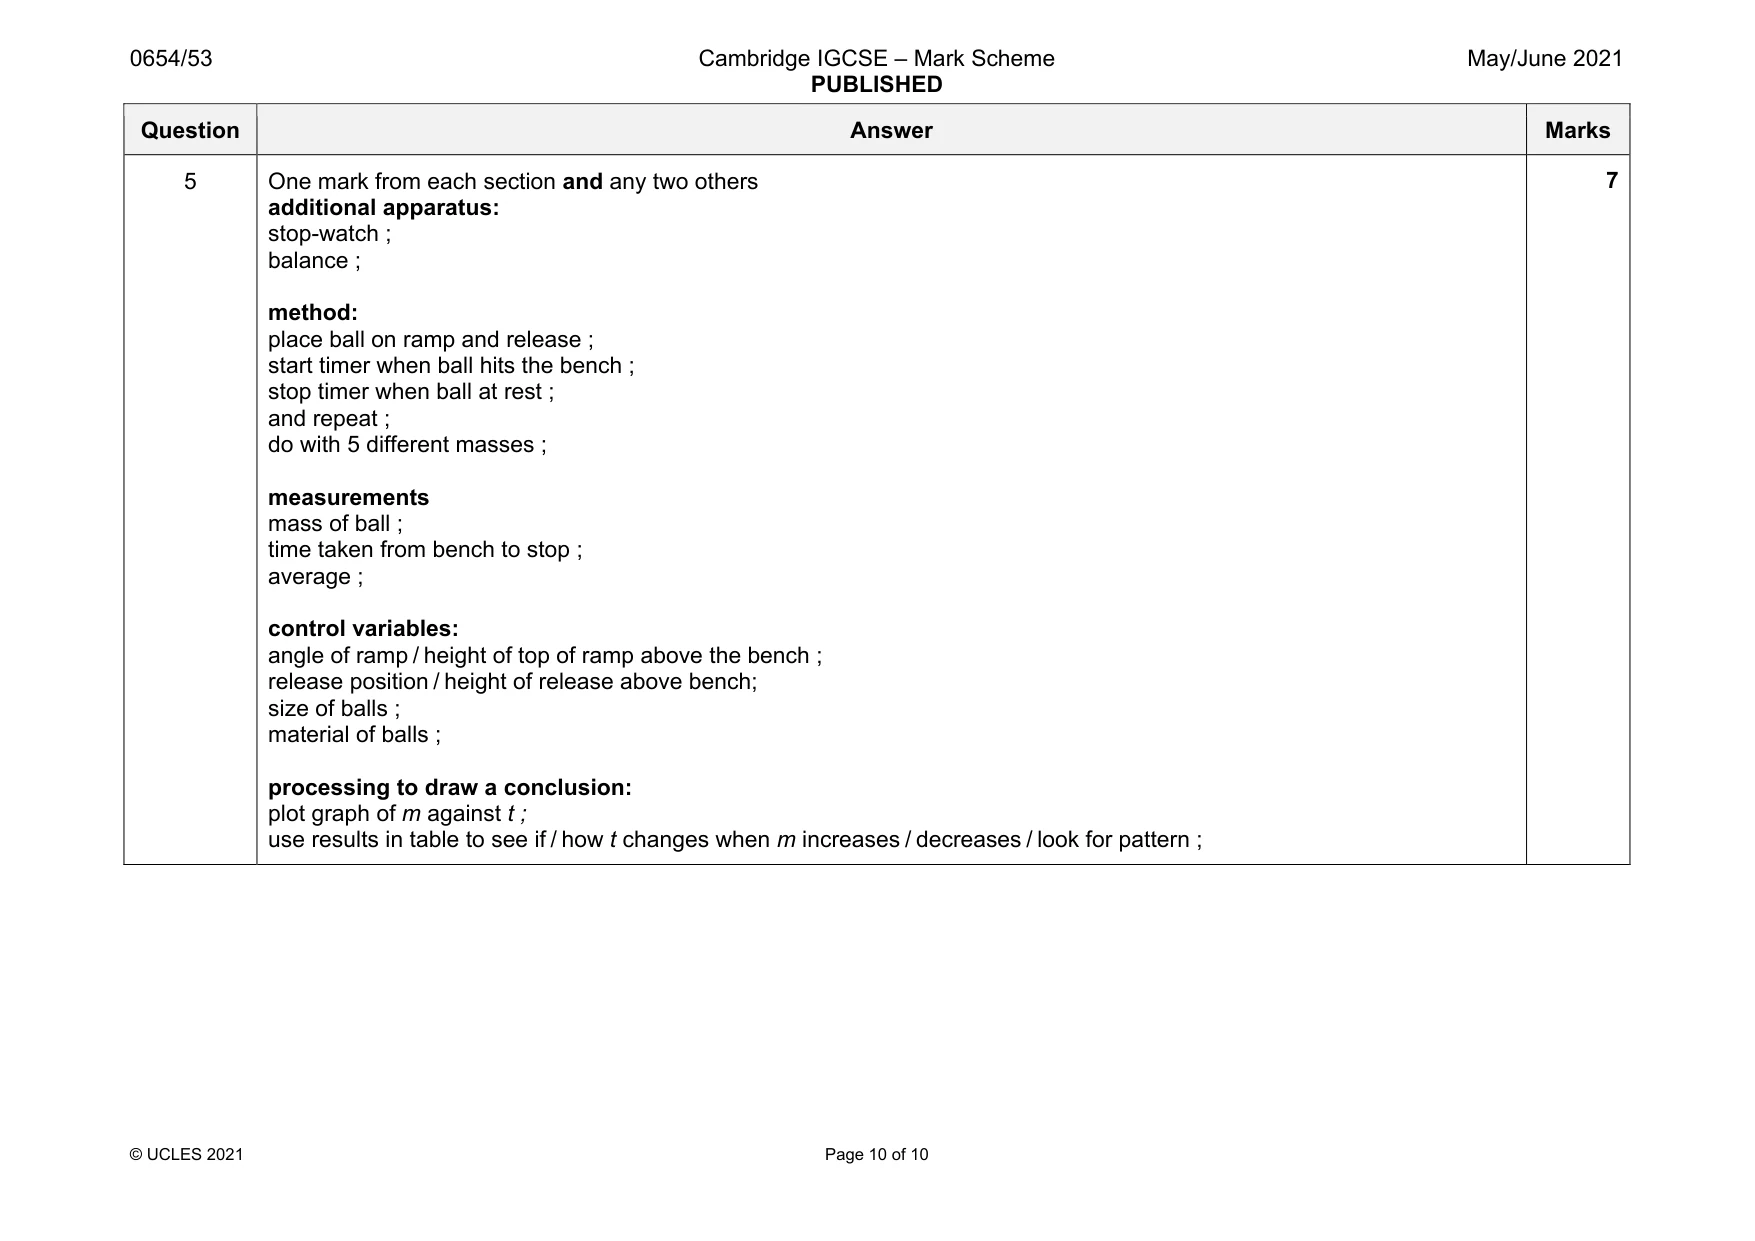
Mark scheme: 5 One mark from each section and any two others additional apparatus: stop-watch ; balance ; method: place ball on ramp and release ; start timer when ball hits the bench ; stop timer when ball at rest ; and repeat ; do with 5 different masses ; measurements mass of ball ; time taken from bench to stop ; average ; control variables: angle of ramp / height of top of ramp above the bench ; release position / height of release above bench; size of balls ; material of balls ; processing to draw a conclusion: plot graph of m against t ; use results in table to see if / how t changes when m increases / decreases / look for pattern ;
What was in this paper
The subtopics covered by these 5 questions, and how many questions each got. Open one in a new tab to see every Cambridge question on it.
What you needed in this session
Cambridge’s own grade thresholds for 2021 May/June, Paper 5 · Variant 3. A higher threshold means an easier paper — the bar moves with how the cohort did.