Cambridge IGCSE Sciences - Co-ordinated (Double) 0654 — 2021 May/June Paper 5 · Variant 2
0654/52/M/J/21 · 7 questions · 60 marks · ≈68 min
The question paper and its mark scheme, free to read here and free to download. This is Cambridge’s own paper, exactly as it was sat.
Question paper20 pages





Mark scheme13 pages
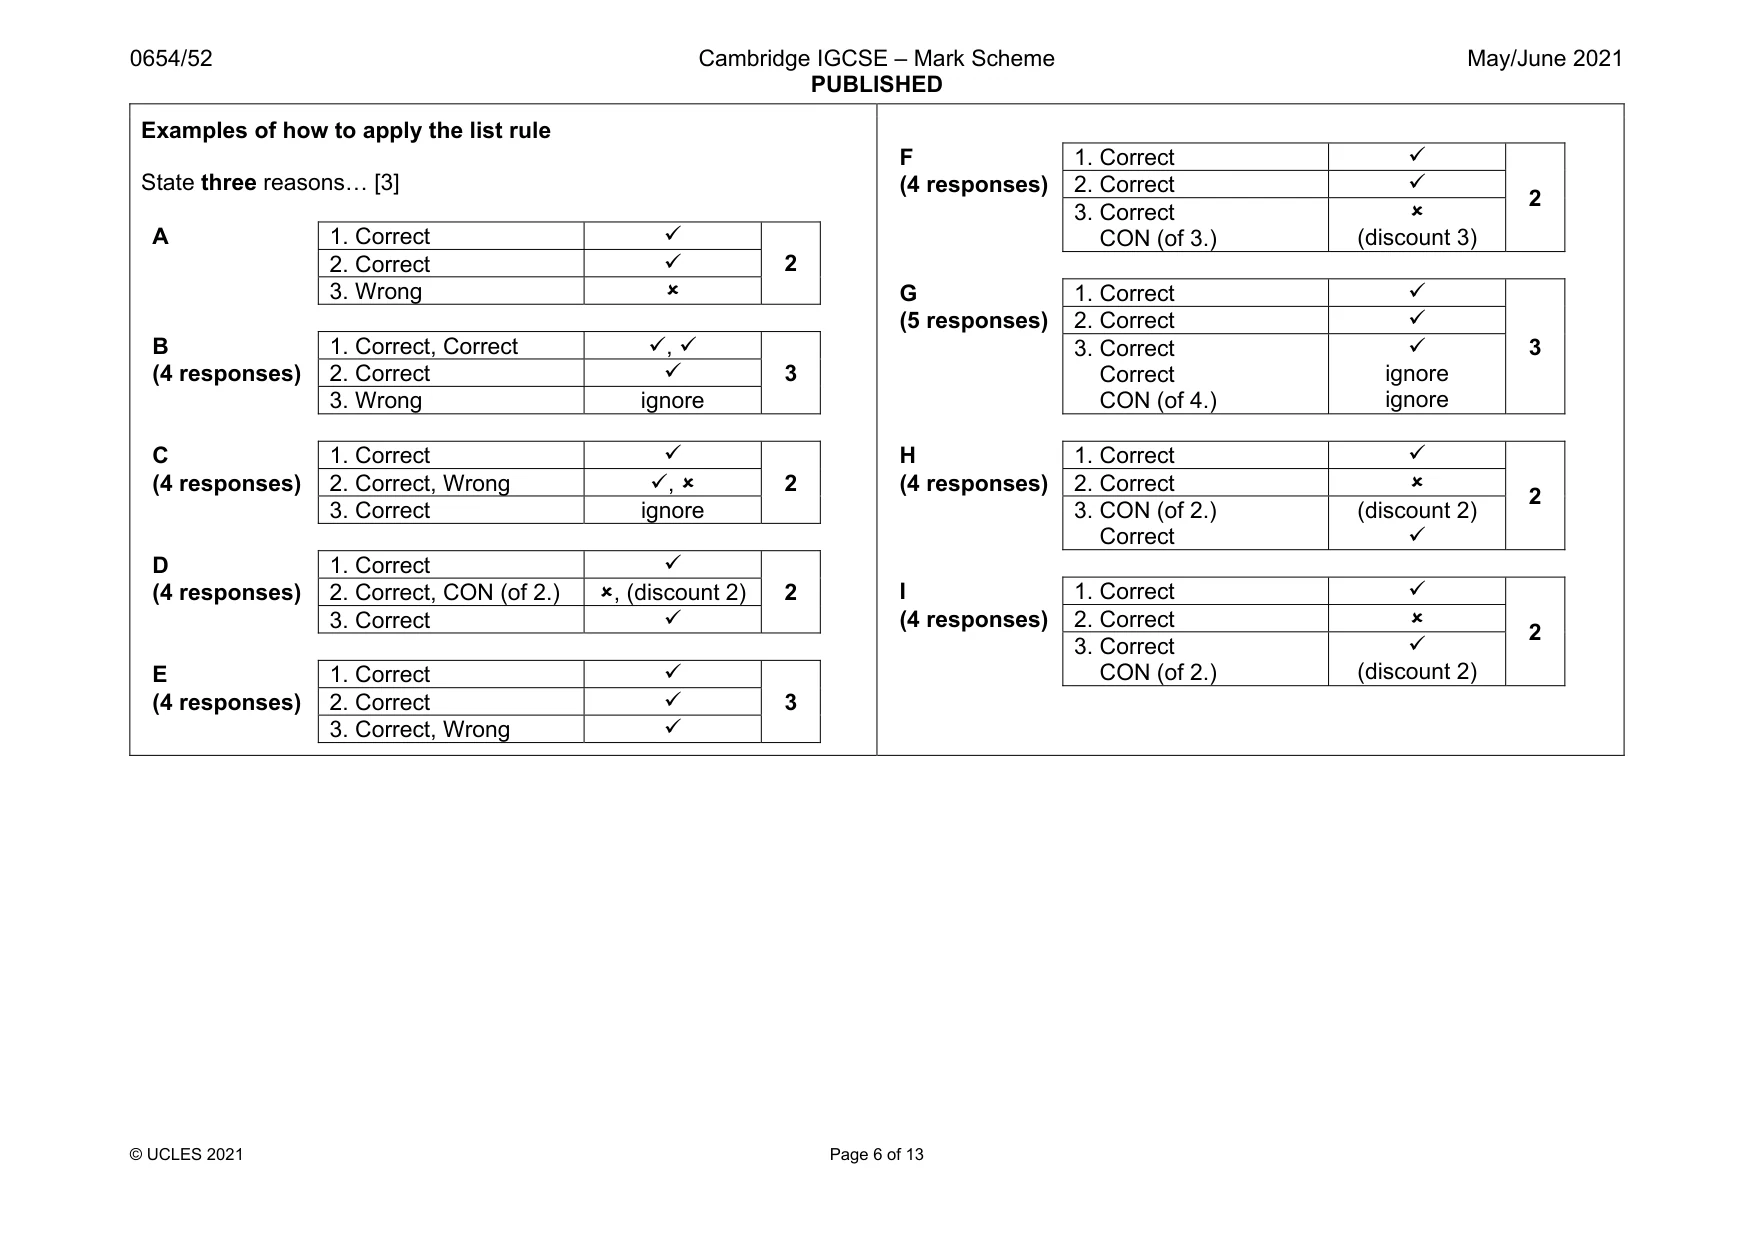
Answers below. Sit the paper first if you are practising.
Questions as text
Q1 · You are going to investigate the nutrient content of three solutions, A, B and C
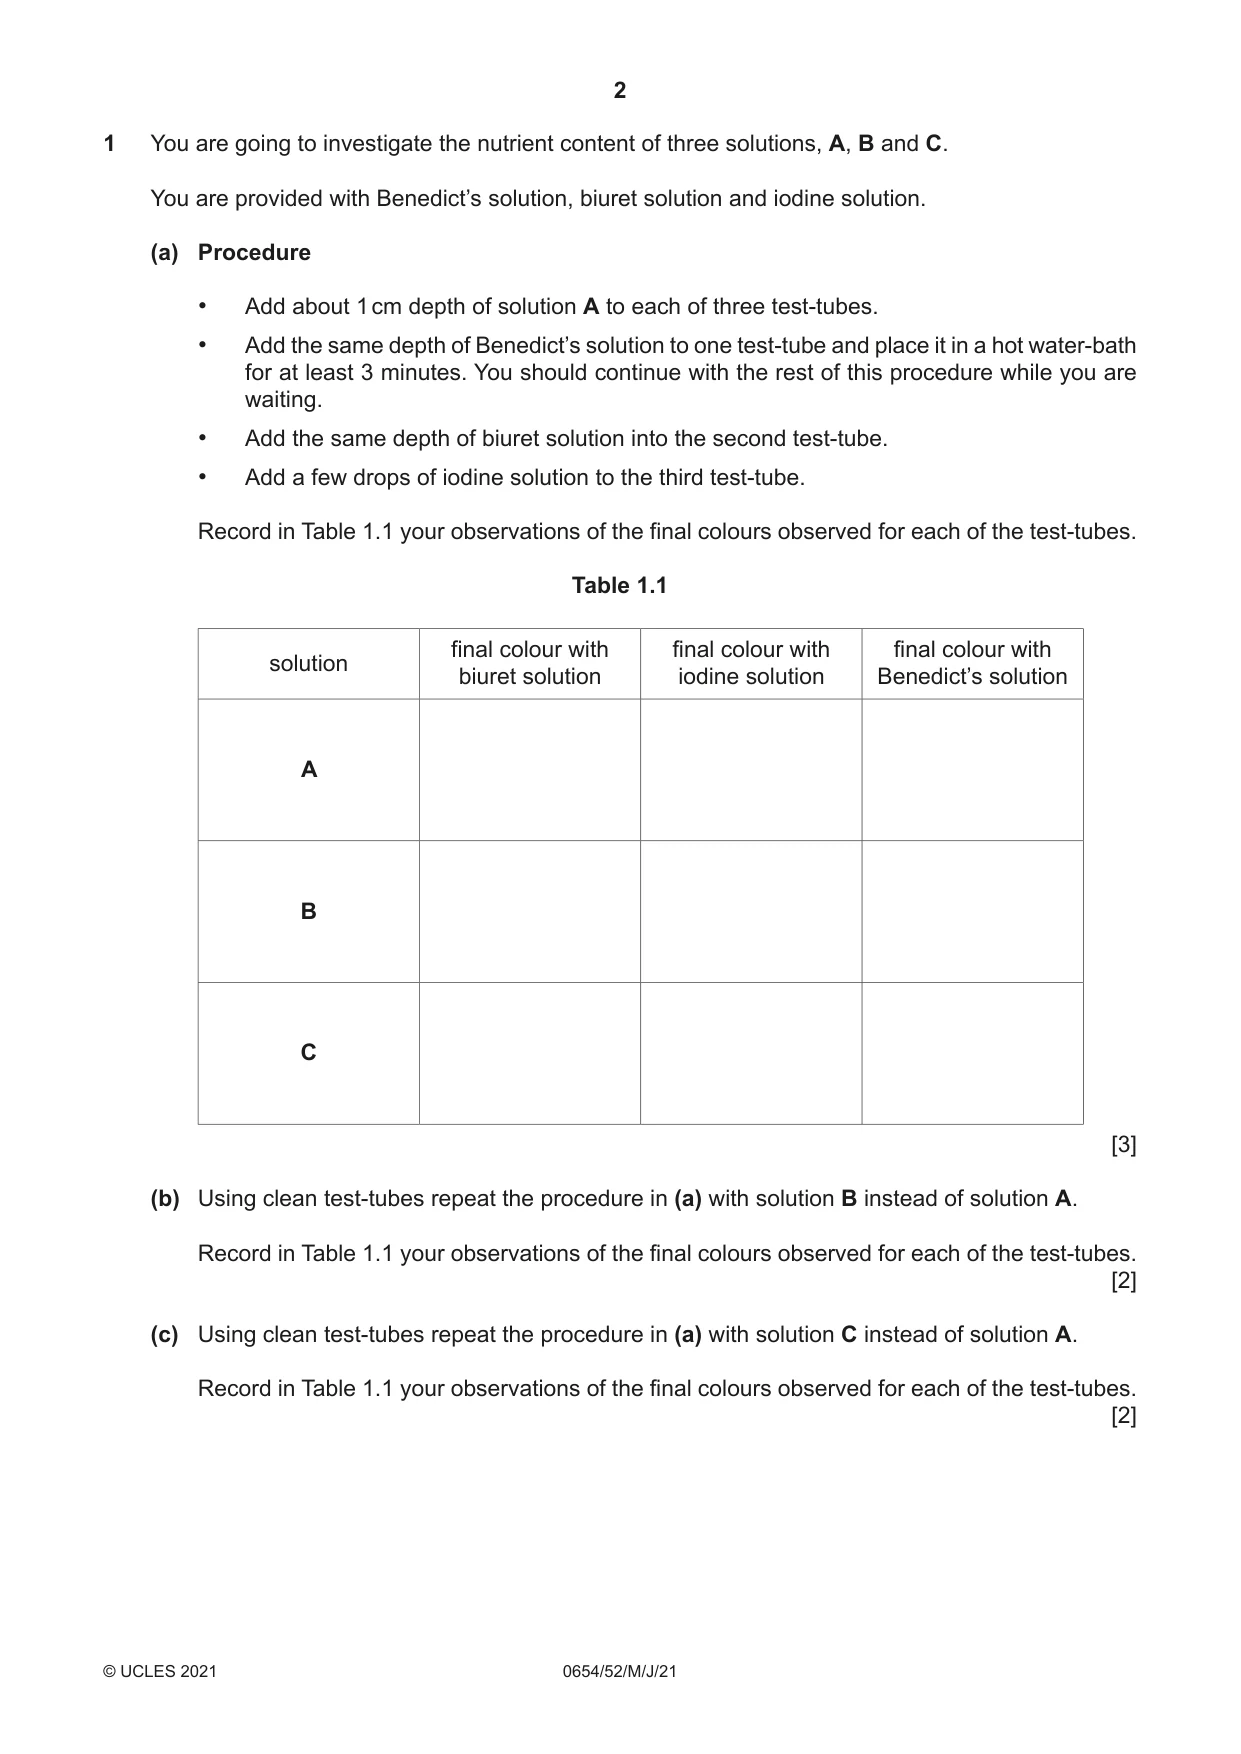
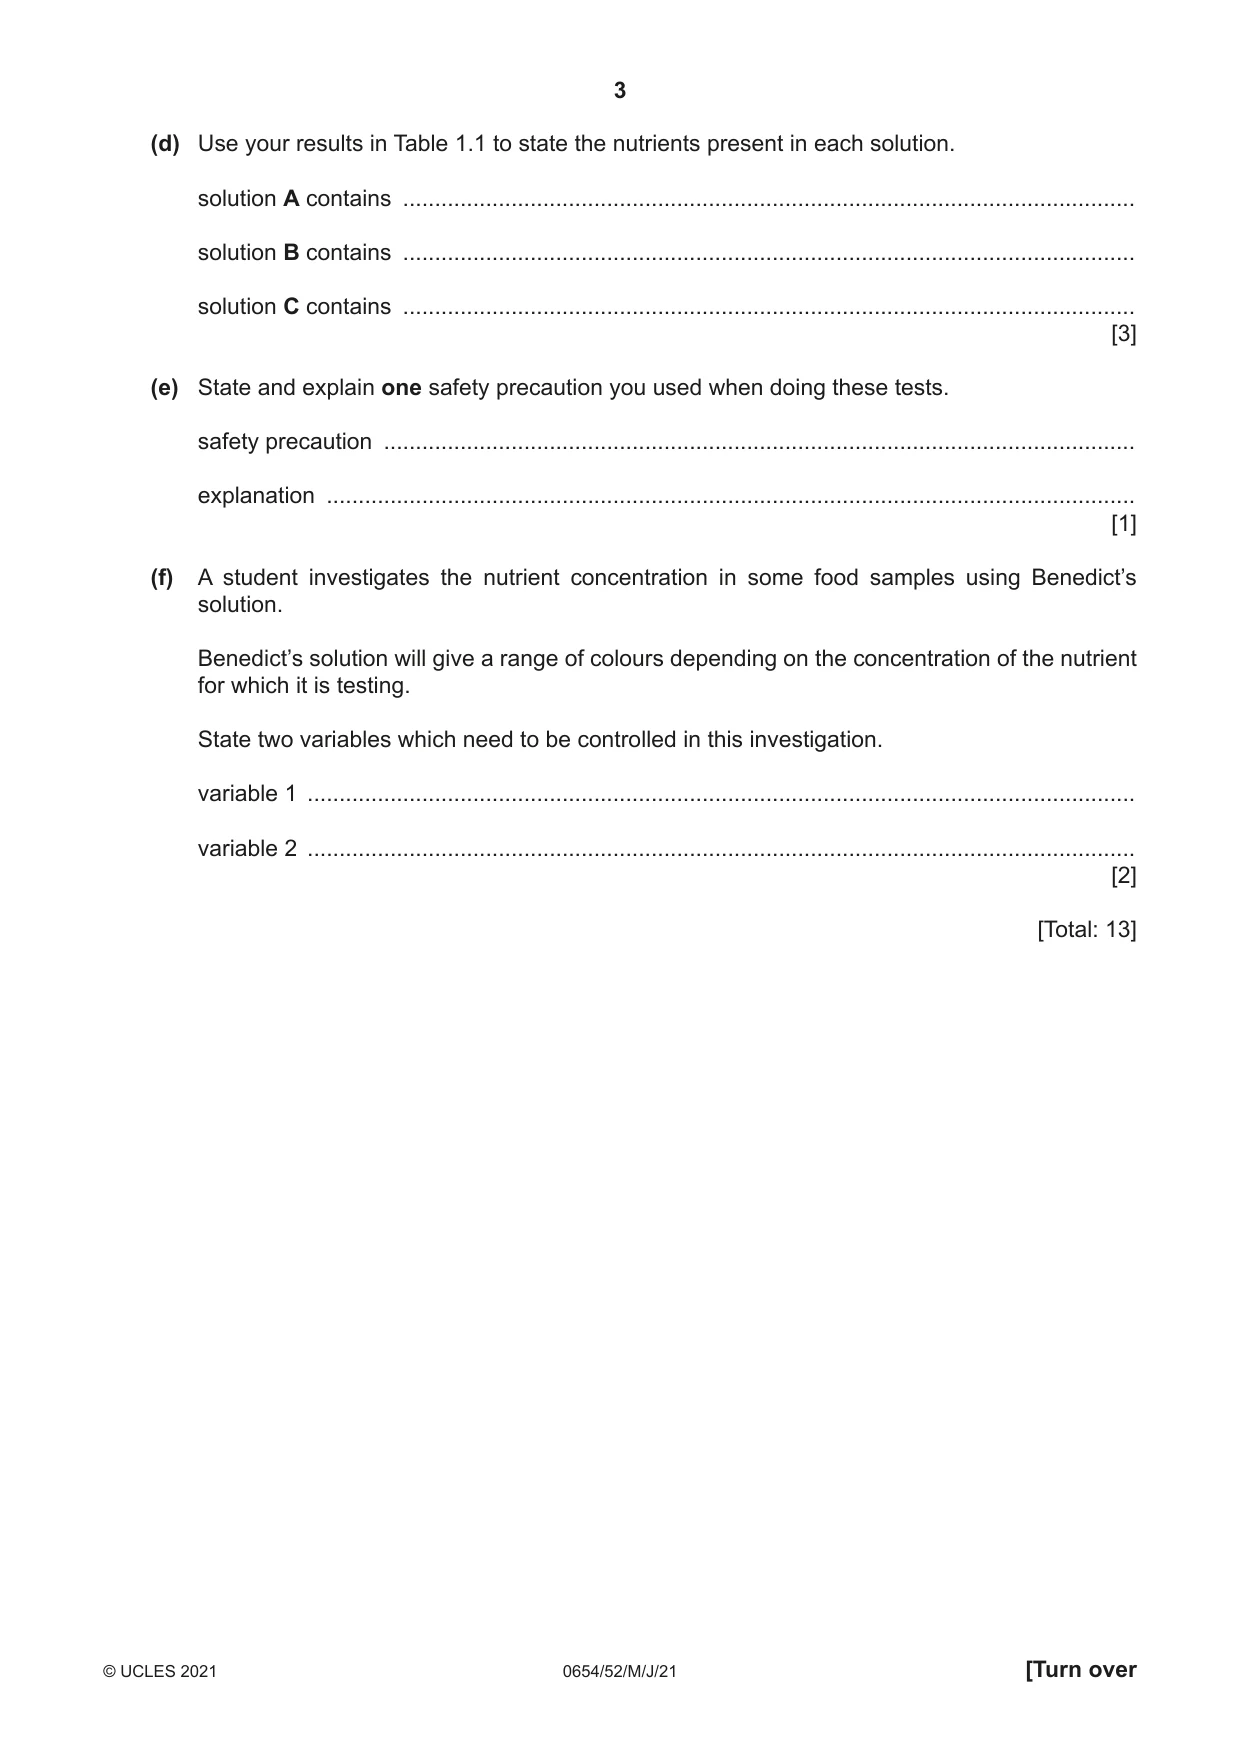
1 You are going to investigate the nutrient content of three solutions, A, B and C. You are provided with Benedict’s solution, biuret solution and iodine solution. (a) Procedure • Add about 1 cm depth of solution A to each of three test-tubes. • Add the same depth of Benedict’s solution to one test-tube and place it in a hot water-bath for at least 3 minutes. You should continue with the rest of this procedure while you are waiting. • Add the same depth of biuret solution into the second test-tube. • Add a few drops of iodine solution to the third test-tube. Record in Table 1.1 your observations of the final colours observed for each of the test-tubes. Table 1.1 final colour with final colour with final colour with solution biuret solution iodine solution Benedict’s solution A B C [3] (b) Using clean test-tubes repeat the procedure in (a) with solution B instead of solution A. Record in Table 1.1 your observations of the final colours observed for each of the test-tubes. [2] (c) Using clean test-tubes repeat the procedure in (a) with solution C instead of solution A. Record in Table 1.1 your observations of the final colours observed for each of the test-tubes. [2] (d) Use your results in Table 1.1 to state the nutrients present in each solution. solution A contains ................................................................................................................... solution B contains ................................................................................................................... solution C contains ................................................................................................................... [3] (e) State and explain one safety precaution you used when doing these tests. safety precaution ...................................................................................................................... explanation ............................................................................................................................... [1] (f) A student investigates the nutrient concentration in some food samples using Benedict’s solution. Benedict’s solution will give a range of colours depending on the concentration of the nutrient for which it is testing. State two variables which need to be controlled in this investigation. variable 1 .................................................................................................................................. variable 2 .................................................................................................................................. [2] [Total: 13]
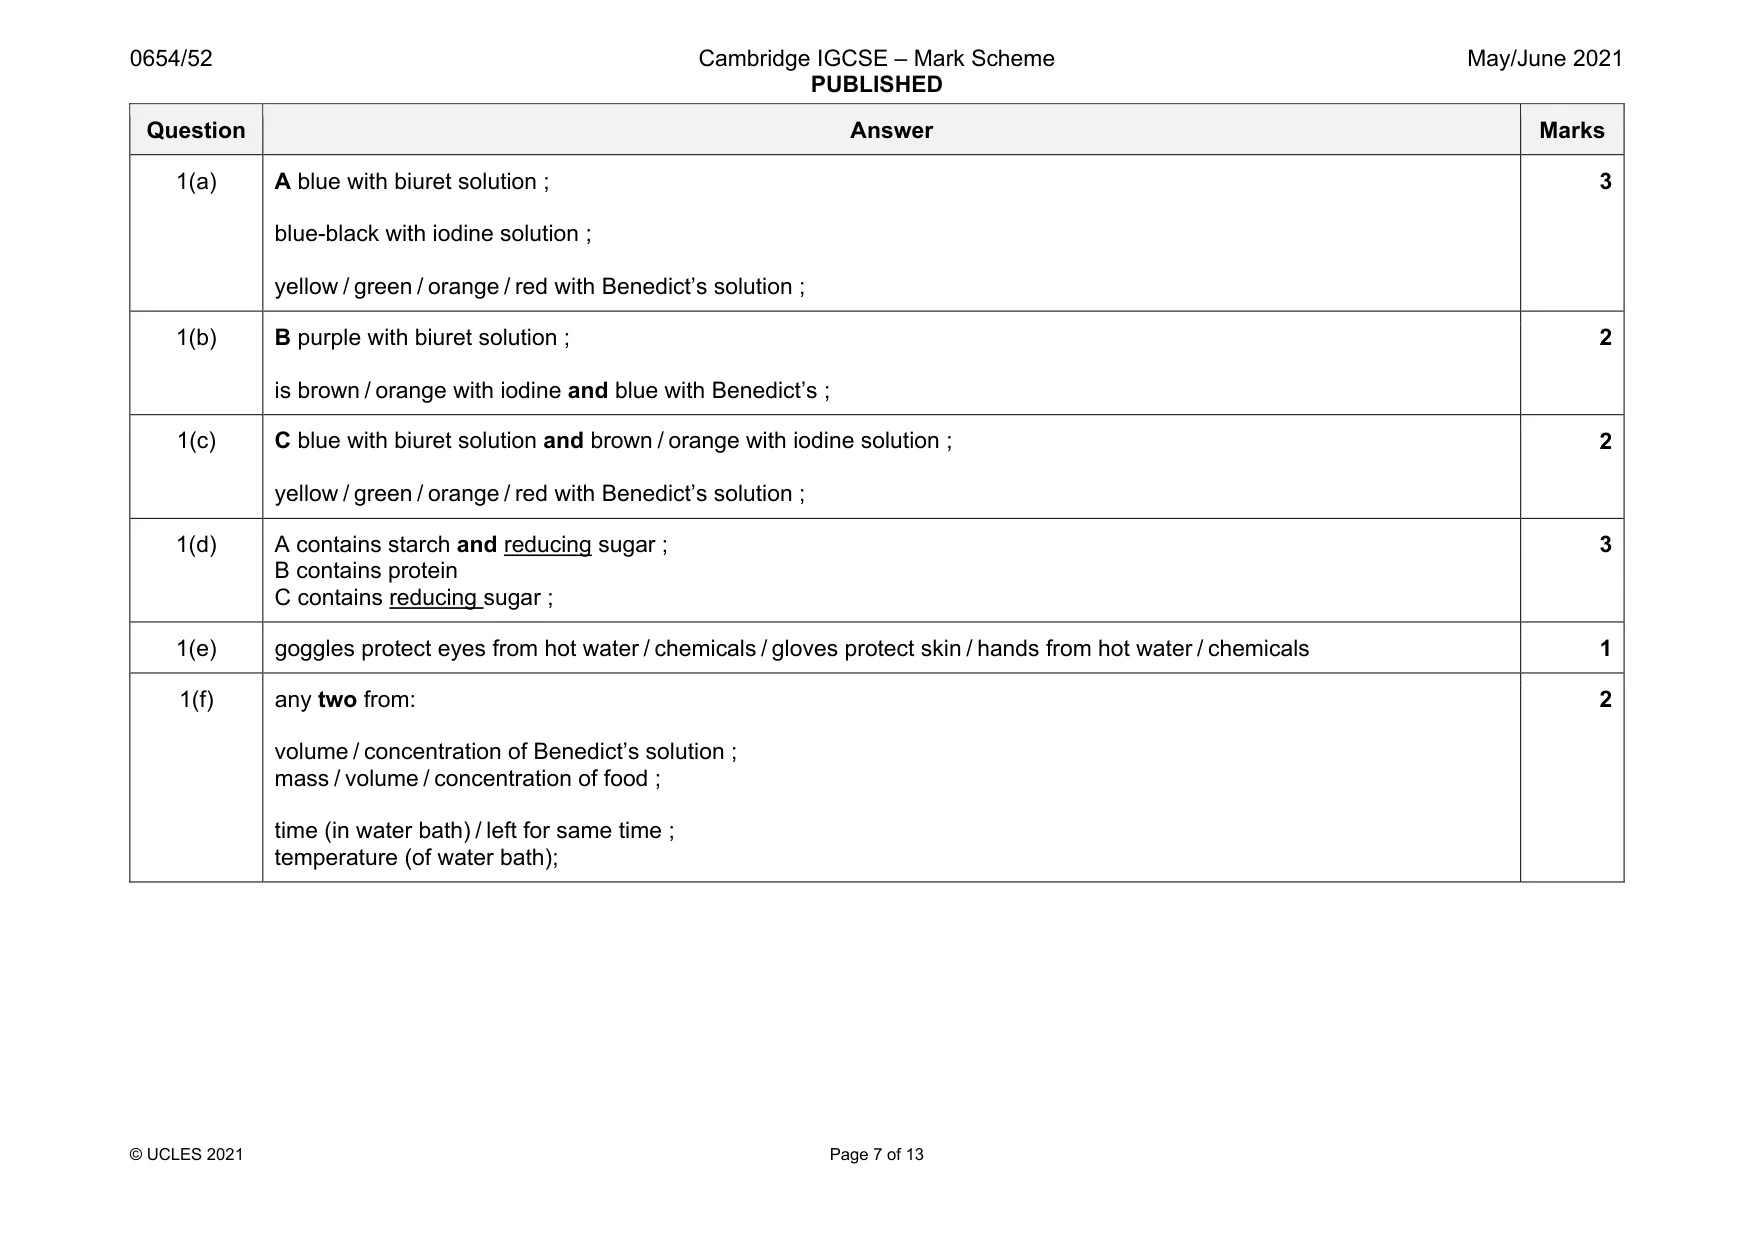
Mark scheme: 1(a) A blue with biuret solution ; blue-black with iodine solution ; yellow / green / orange / red with Benedict’s solution ; 3 1(b) B purple with biuret solution ; is brown / orange with iodine and blue with Benedict’s ; 2 1(c) C blue with biuret solution and brown / orange with iodine solution ; yellow / green / orange / red with Benedict’s solution ; 2 1(d) A contains starch and reducing sugar ; B contains protein C contains reducing sugar ; 3 1(e) goggles protect eyes from hot water / chemicals / gloves protect skin / hands from hot water / chemicals 1 1(f) any two from: volume / concentration of Benedict’s solution ; mass / volume / concentration of food ; time (in water bath) / left for same time ; temperature (of water bath); 2
Q2 · Small maggots (insect larvae), as shown in Fig
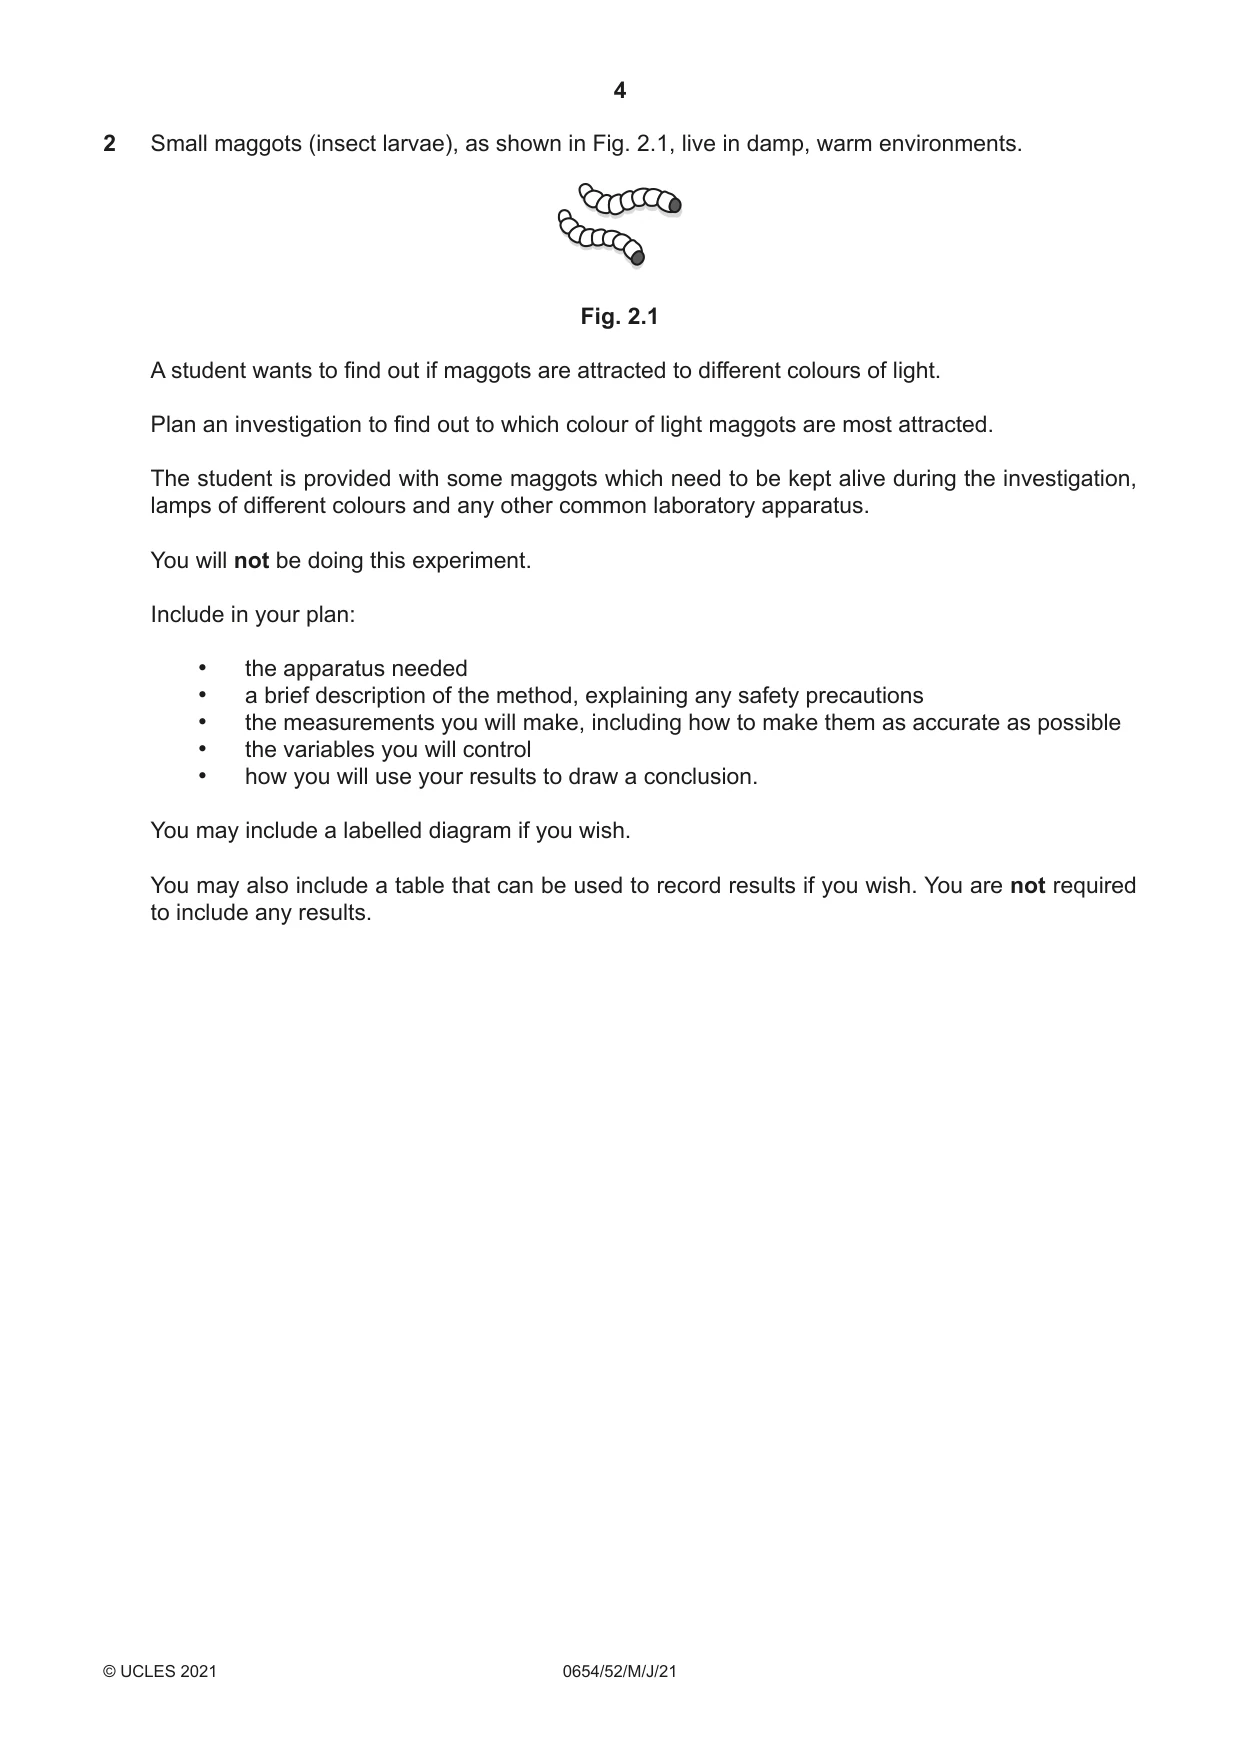
2 Small maggots (insect larvae), as shown in Fig. 2.1, live in damp, warm environments. Fig. 2.1 A student wants to find out if maggots are attracted to different colours of light. Plan an investigation to find out to which colour of light maggots are most attracted. The student is provided with some maggots which need to be kept alive during the investigation, lamps of different colours and any other common laboratory apparatus. You will not be doing this experiment. Include in your plan: • the apparatus needed • a brief description of the method, explaining any safety precautions • the measurements you will make, including how to make them as accurate as possible • the variables you will control • how you will use your results to draw a conclusion. You may include a labelled diagram if you wish. You may also include a table that can be used to record results if you wish. You are not required to include any results. .......................................................................................................................................................... .......................................................................................................................................................... .......................................................................................................................................................... .......................................................................................................................................................... .......................................................................................................................................................... .......................................................................................................................................................... .......................................................................................................................................................... .......................................................................................................................................................... .......................................................................................................................................................... .......................................................................................................................................................... .......................................................................................................................................................... .......................................................................................................................................................... .......................................................................................................................................................... .......................................................................................................................................................... .......................................................................................................................................................... .......................................................................................................................................................... .......................................................................................................................................................... .......................................................................................................................................................... .......................................................................................................................................................... .................................................................................................................................................... [7] [Total: 7]
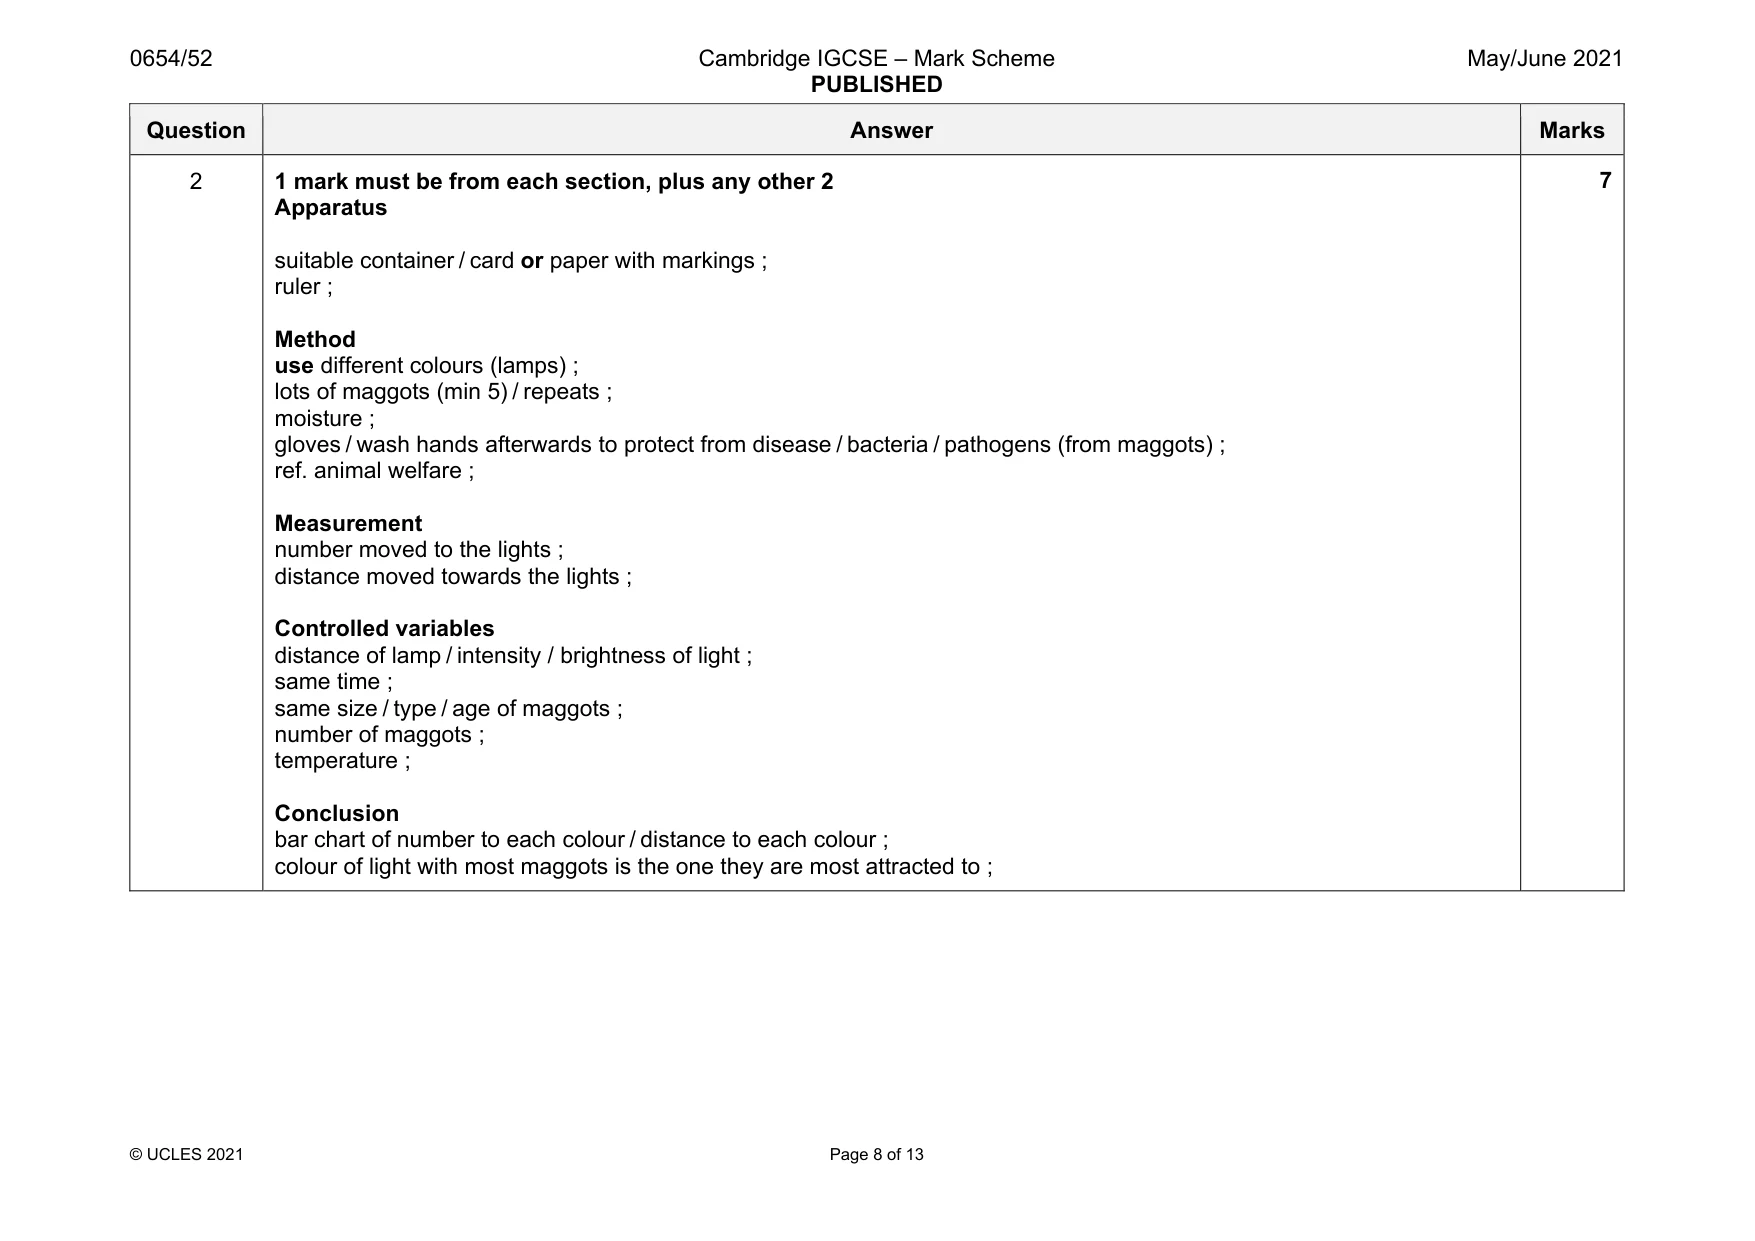
Mark scheme: 2 1 mark must be from each section, plus any other 2 Apparatus suitable container / card or paper with markings ; ruler ; Method use different colours (lamps) ; lots of maggots (min 5) / repeats ; moisture ; gloves / wash hands afterwards to protect from disease / bacteria / pathogens (from maggots) ; ref. animal welfare ; Measurement number moved to the lights ; distance moved towards the lights ; Controlled variables distance of lamp / intensity / brightness of light ; same time ; same size / type / age of maggots ; number of maggots ; temperature ; Conclusion bar chart of number to each colour / distance to each colour ; colour of light with most maggots is the one they are most attracted to ;
Q3 · In this investigation you are going to find the amount of heat energy released when…
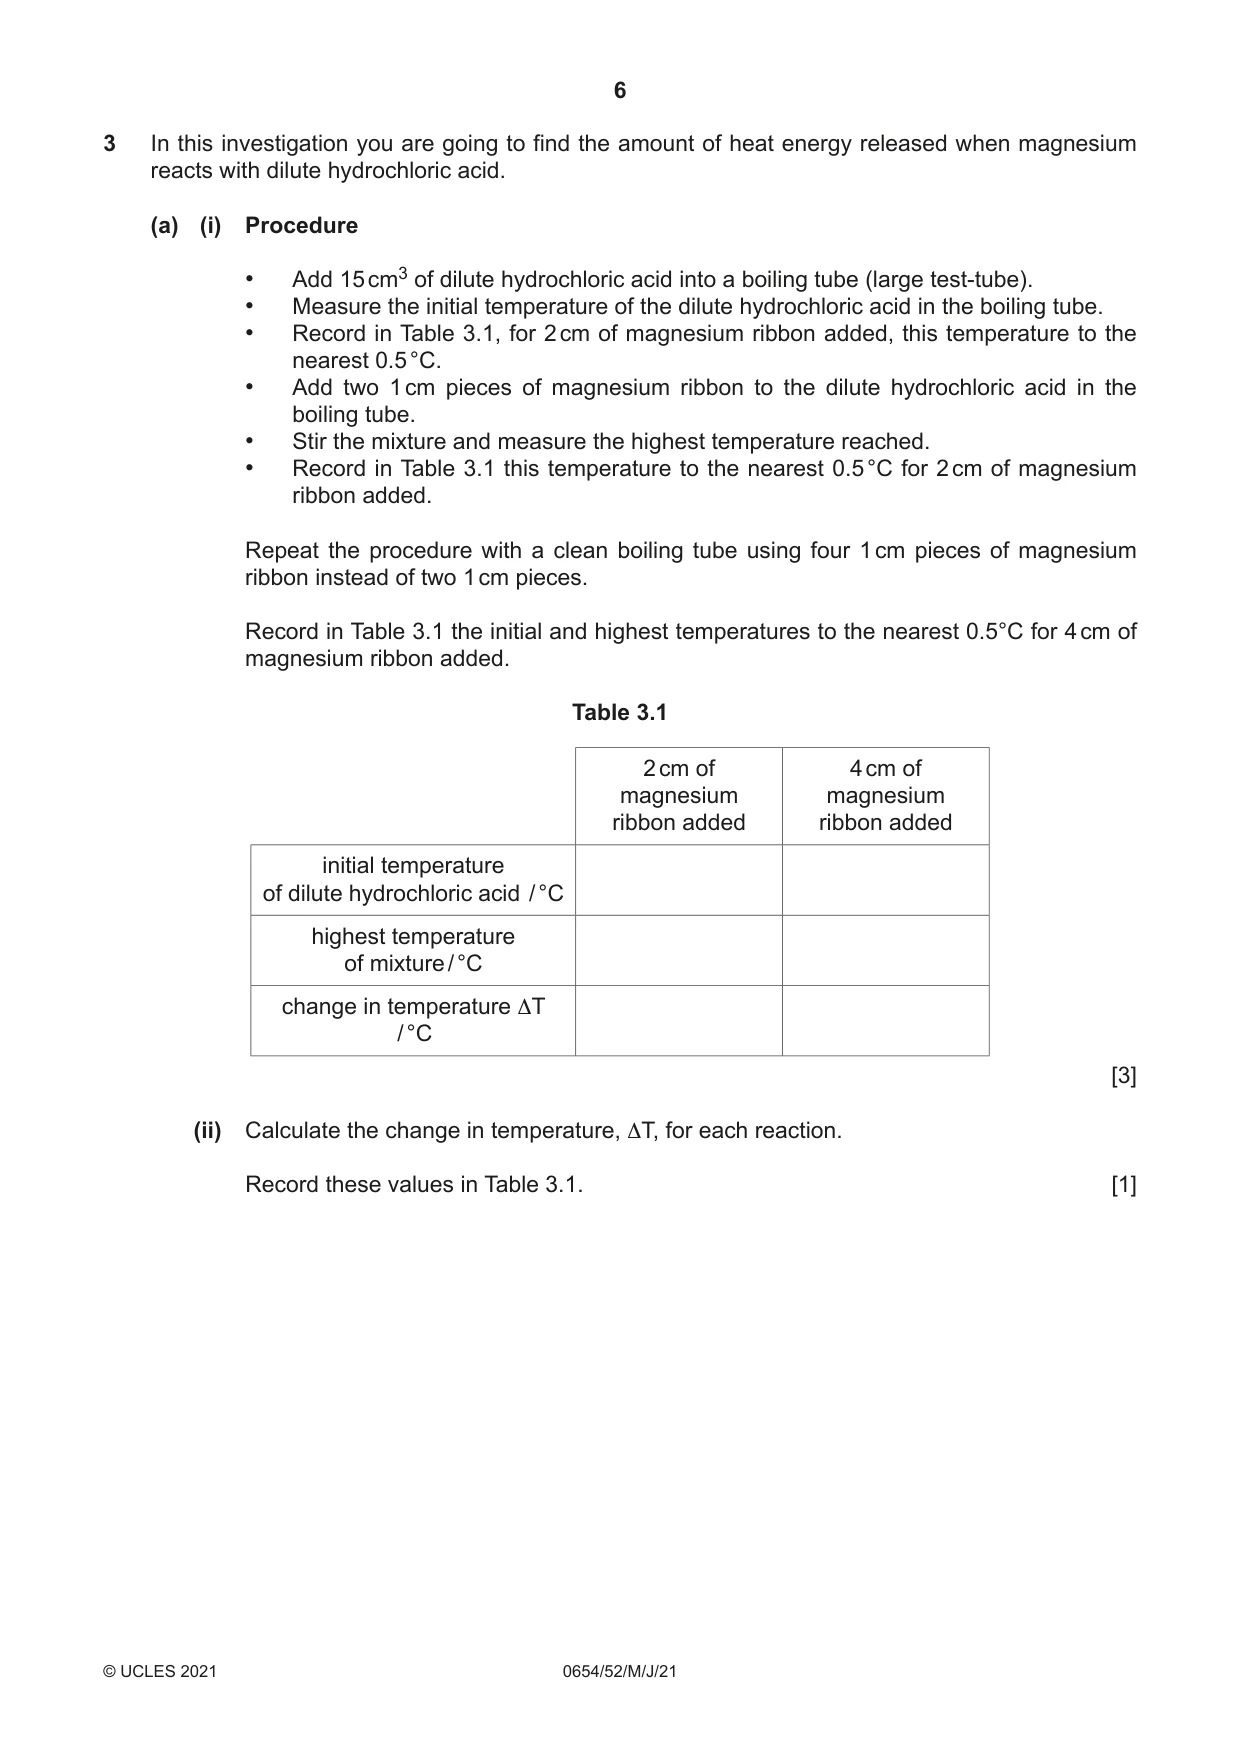
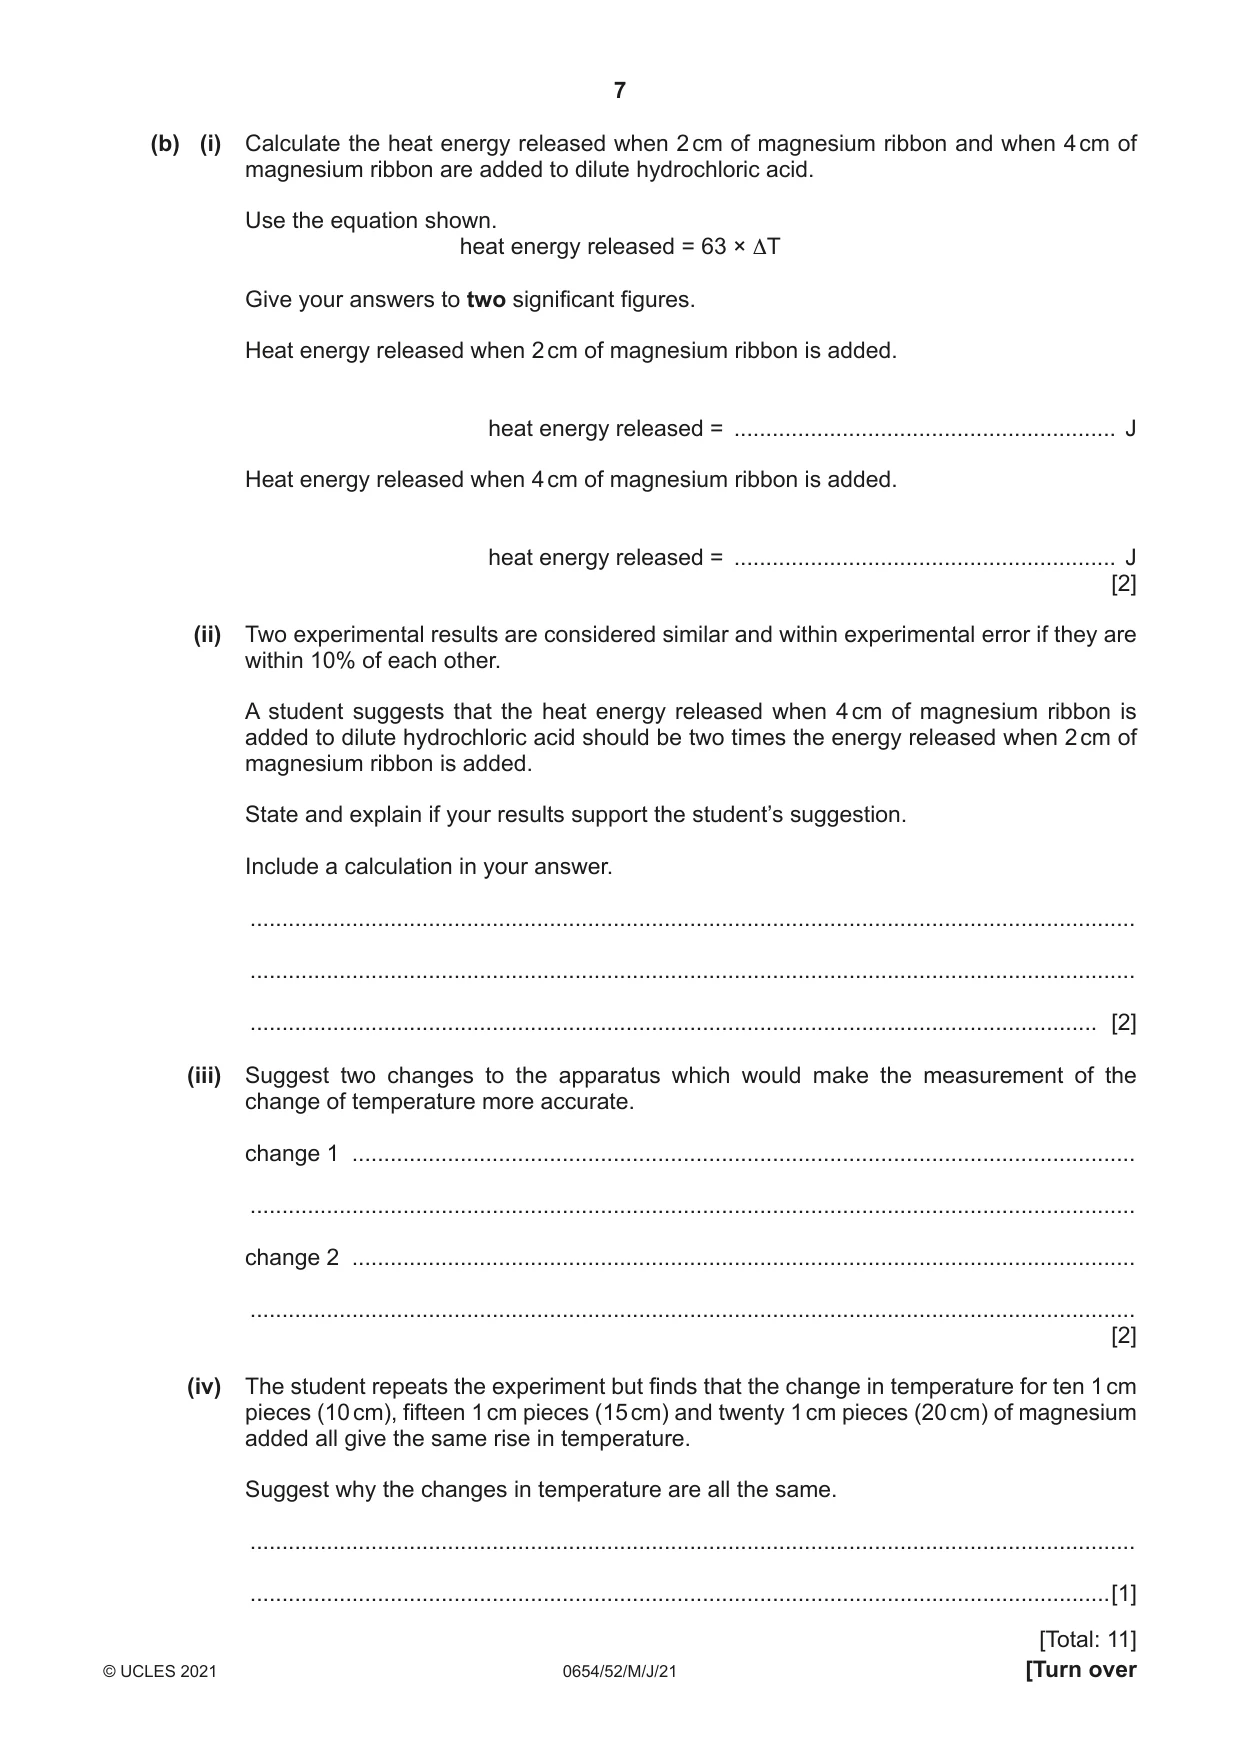
3 In this investigation you are going to find the amount of heat energy released when magnesium reacts with dilute hydrochloric acid. (a) (i) Procedure • Add 15 cm3 of dilute hydrochloric acid into a boiling tube (large test-tube). • Measure the initial temperature of the dilute hydrochloric acid in the boiling tube. • Record in Table 3.1, for 2 cm of magnesium ribbon added, this temperature to the nearest 0.5 °C. • Add two 1 cm pieces of magnesium ribbon to the dilute hydrochloric acid in the boiling tube. • Stir the mixture and measure the highest temperature reached. • Record in Table 3.1 this temperature to the nearest 0.5 °C for 2 cm of magnesium ribbon added. Repeat the procedure with a clean boiling tube using four 1 cm pieces of magnesium ribbon instead of two 1 cm pieces. Record in Table 3.1 the initial and highest temperatures to the nearest 0.5°C for 4 cm of magnesium ribbon added. Table 3.1 2 cm of 4 cm of magnesium magnesium ribbon added ribbon added initial temperature of dilute hydrochloric acid / °C highest temperature of mixture / °C change in temperature ΔT / °C [3] (ii) Calculate the change in temperature, ΔT, for each reaction. Record these values in Table 3.1. [1] (b) (i) Calculate the heat energy released when 2 cm of magnesium ribbon and when 4 cm of magnesium ribbon are added to dilute hydrochloric acid. Use the equation shown. heat energy released = 63 × ΔT Give your answers to two significant figures. Heat energy released when 2 cm of magnesium ribbon is added. heat energy released = ............................................................ J Heat energy released when 4 cm of magnesium ribbon is added. heat energy released = ............................................................ J [2] (ii) Two experimental results are considered similar and within experimental error if they are within 10% of each other. A student suggests that the heat energy released when 4 cm of magnesium ribbon is added to dilute hydrochloric acid should be two times the energy released when 2 cm of magnesium ribbon is added. State and explain if your results support the student’s suggestion. Include a calculation in your answer. ........................................................................................................................................... ........................................................................................................................................... ..................................................................................................................................... [2] (iii) Suggest two changes to the apparatus which would make the measurement of the change of temperature more accurate. change 1 ........................................................................................................................... ........................................................................................................................................... change 2 ........................................................................................................................... ........................................................................................................................................... [2] (iv) The student repeats the experiment but finds that the change in temperature for ten 1 cm pieces (10 cm), fifteen 1 cm pieces (15 cm) and twenty 1 cm pieces (20 cm) of magnesium added all give the same rise in temperature. Suggest why the changes in temperature are all the same. ........................................................................................................................................... .......................................................................................................................................[1] [Total: 11]
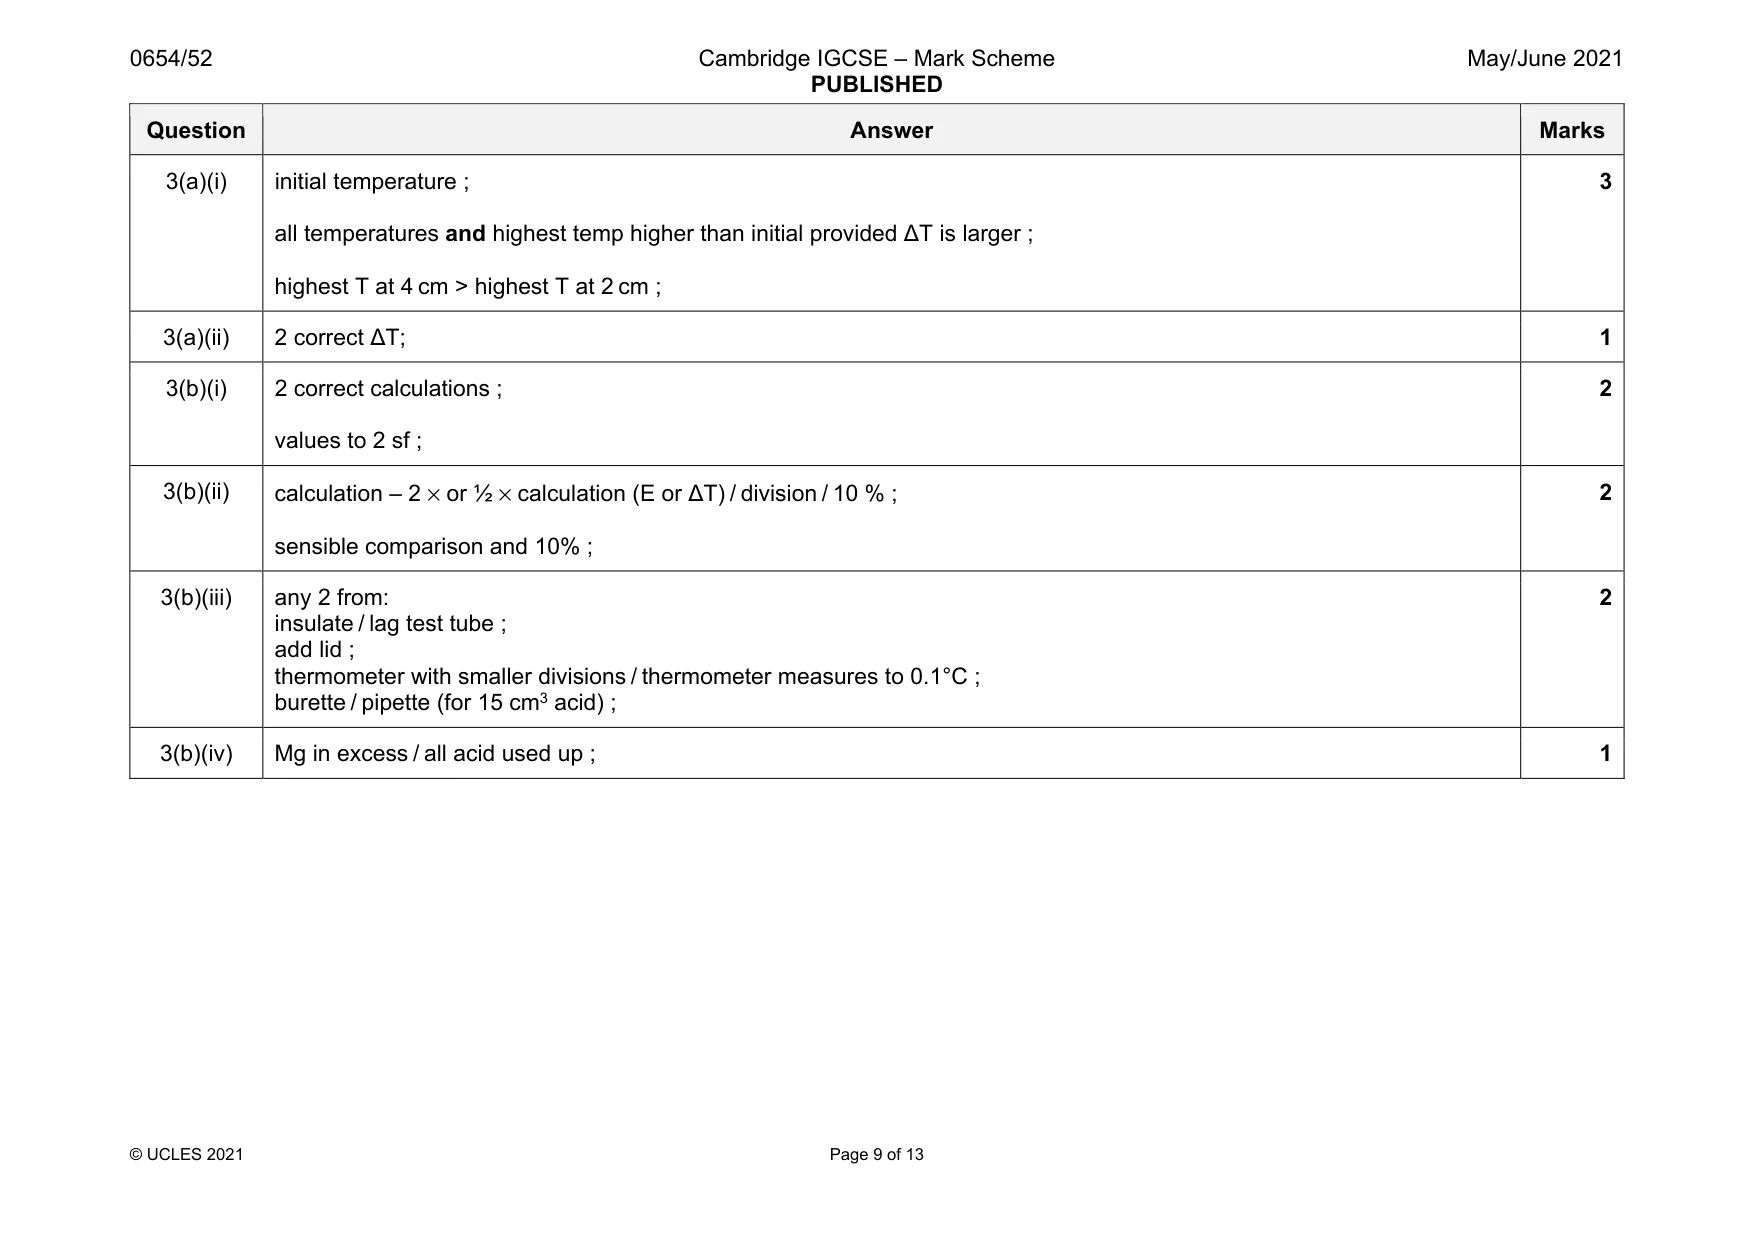
Mark scheme: 3(a)(i) initial temperature ; all temperatures and highest temp higher than initial provided ΔT is larger ; highest T at 4 cm > highest T at 2 cm ; 3 3(a)(ii) 2 correct ΔT; 1 3(b)(i) 2 correct calculations ; values to 2 sf ; 2 3(b)(ii) calculation – 2 × or ½ × calculation (E or ΔT) / division / 10 % ; sensible comparison and 10% ; 2 3(b)(iii) any 2 from: insulate / lag test tube ; add lid ; thermometer with smaller divisions / thermometer measures to 0.1°C ; burette / pipette (for 15 cm3 acid) ; 2 3(b)(iv) Mg in excess / all acid used up ; 1
Q4 · In this investigation you are going to identify an unknown white solid, X
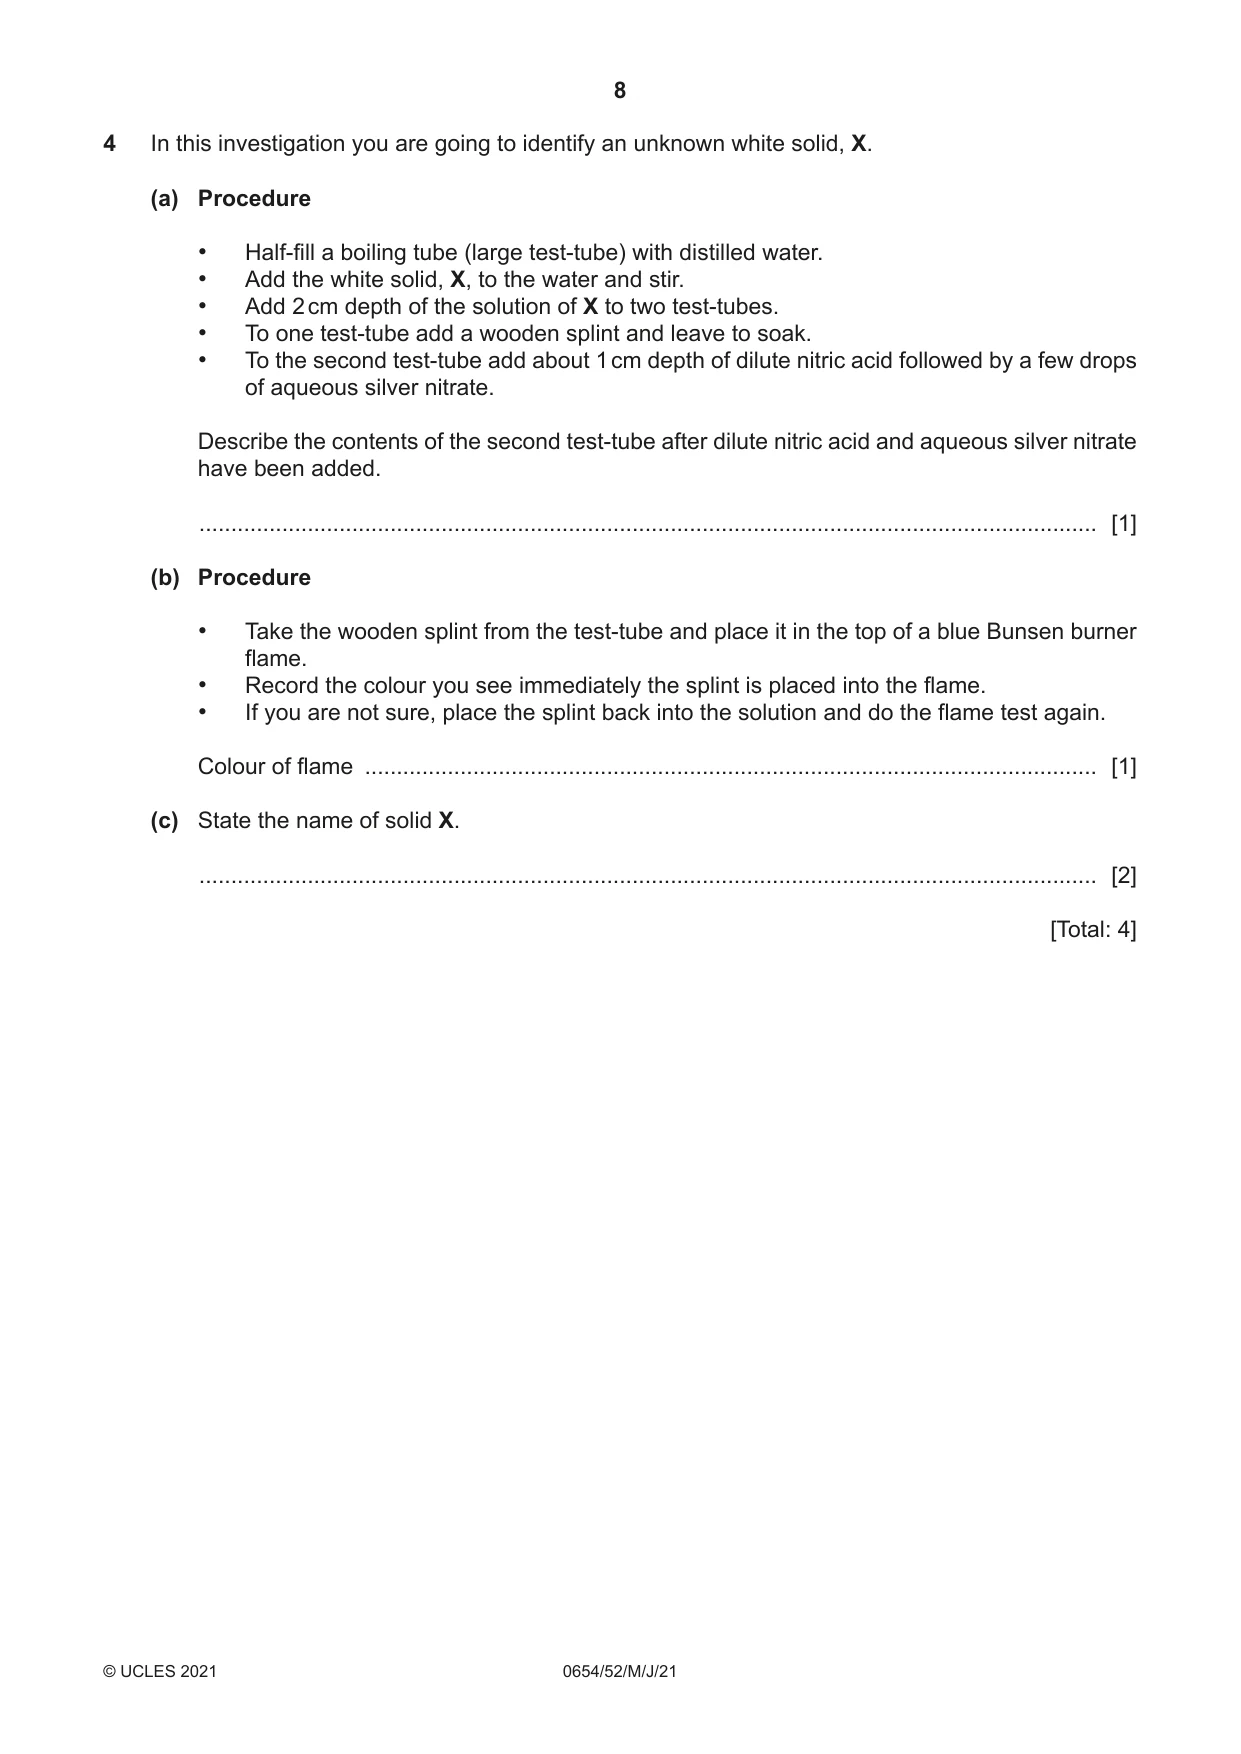
4 In this investigation you are going to identify an unknown white solid, X. (a) Procedure • Half-fill a boiling tube (large test-tube) with distilled water. • Add the white solid, X, to the water and stir. • Add 2 cm depth of the solution of X to two test-tubes. • To one test-tube add a wooden splint and leave to soak. • To the second test-tube add about 1 cm depth of dilute nitric acid followed by a few drops of aqueous silver nitrate. Describe the contents of the second test-tube after dilute nitric acid and aqueous silver nitrate have been added. ............................................................................................................................................. [1] (b) Procedure • Take the wooden splint from the test-tube and place it in the top of a blue Bunsen burner flame. • Record the colour you see immediately the splint is placed into the flame. • If you are not sure, place the splint back into the solution and do the flame test again. Colour of flame ................................................................................................................... [1] (c) State the name of solid X. ............................................................................................................................................. [2] [Total: 4]
Mark scheme: 4(a) cream / off white ppt ; 1 4(b) lilac / pale purple ; 1 4(c) potassium ; bromide ; 2
Q5 · In this question you will draw the apparatus required for separating a mixture
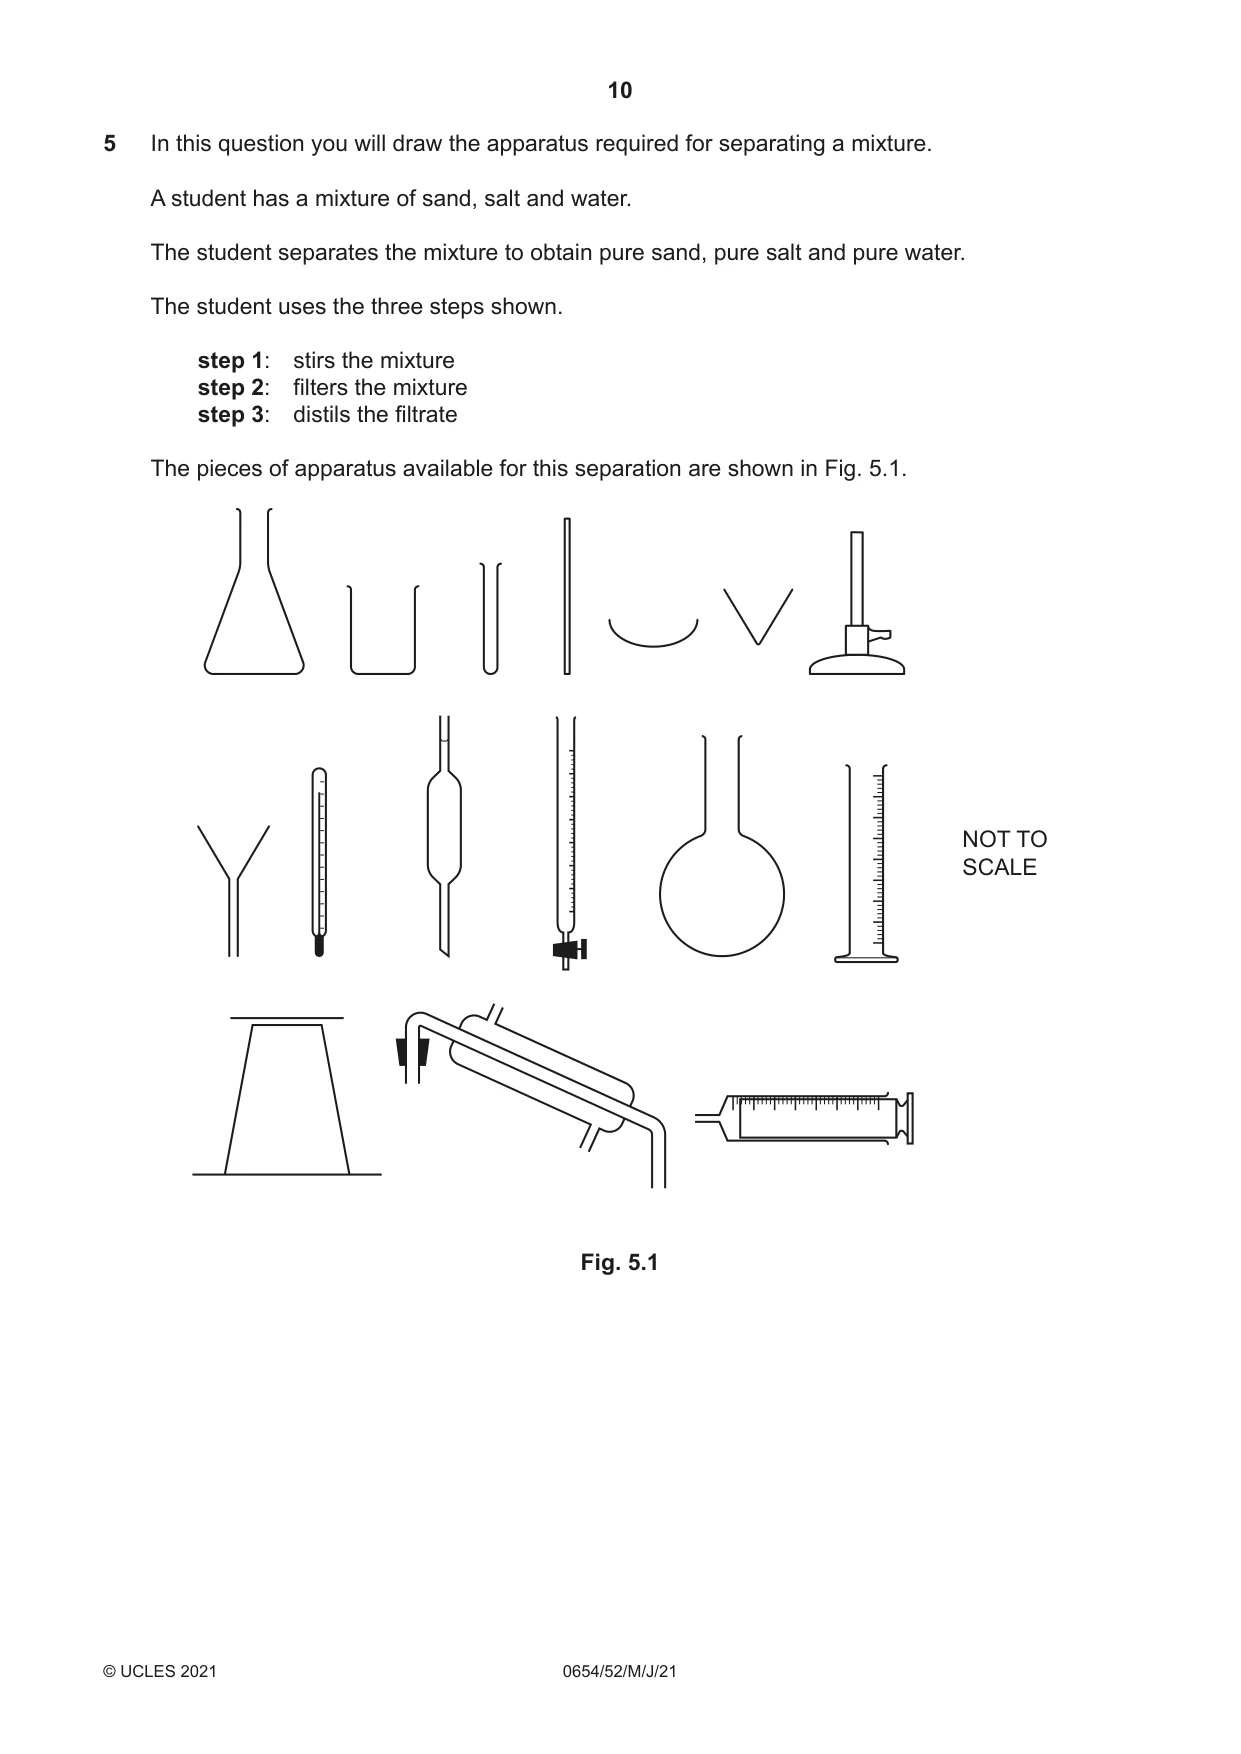
5 In this question you will draw the apparatus required for separating a mixture. A student has a mixture of sand, salt and water. The student separates the mixture to obtain pure sand, pure salt and pure water. The student uses the three steps shown. step 1: stirs the mixture step 2: filters the mixture step 3: distils the filtrate The pieces of apparatus available for this separation are shown in Fig. 5.1. NOT TO SCALE Fig. 5.1 (a) Choose the apparatus from Fig. 5.1 suitable for doing step 2. Draw a large, clear, labelled diagram of the assembled apparatus for step 2. Use a ruler. Label the substances separated. [2] (b) Choose the apparatus from Fig. 5.1 suitable for doing step 3. Draw a large, clear, labelled diagram of the assembled apparatus for step 3. Use a ruler. Label the substances separated. [3] [Total: 5]
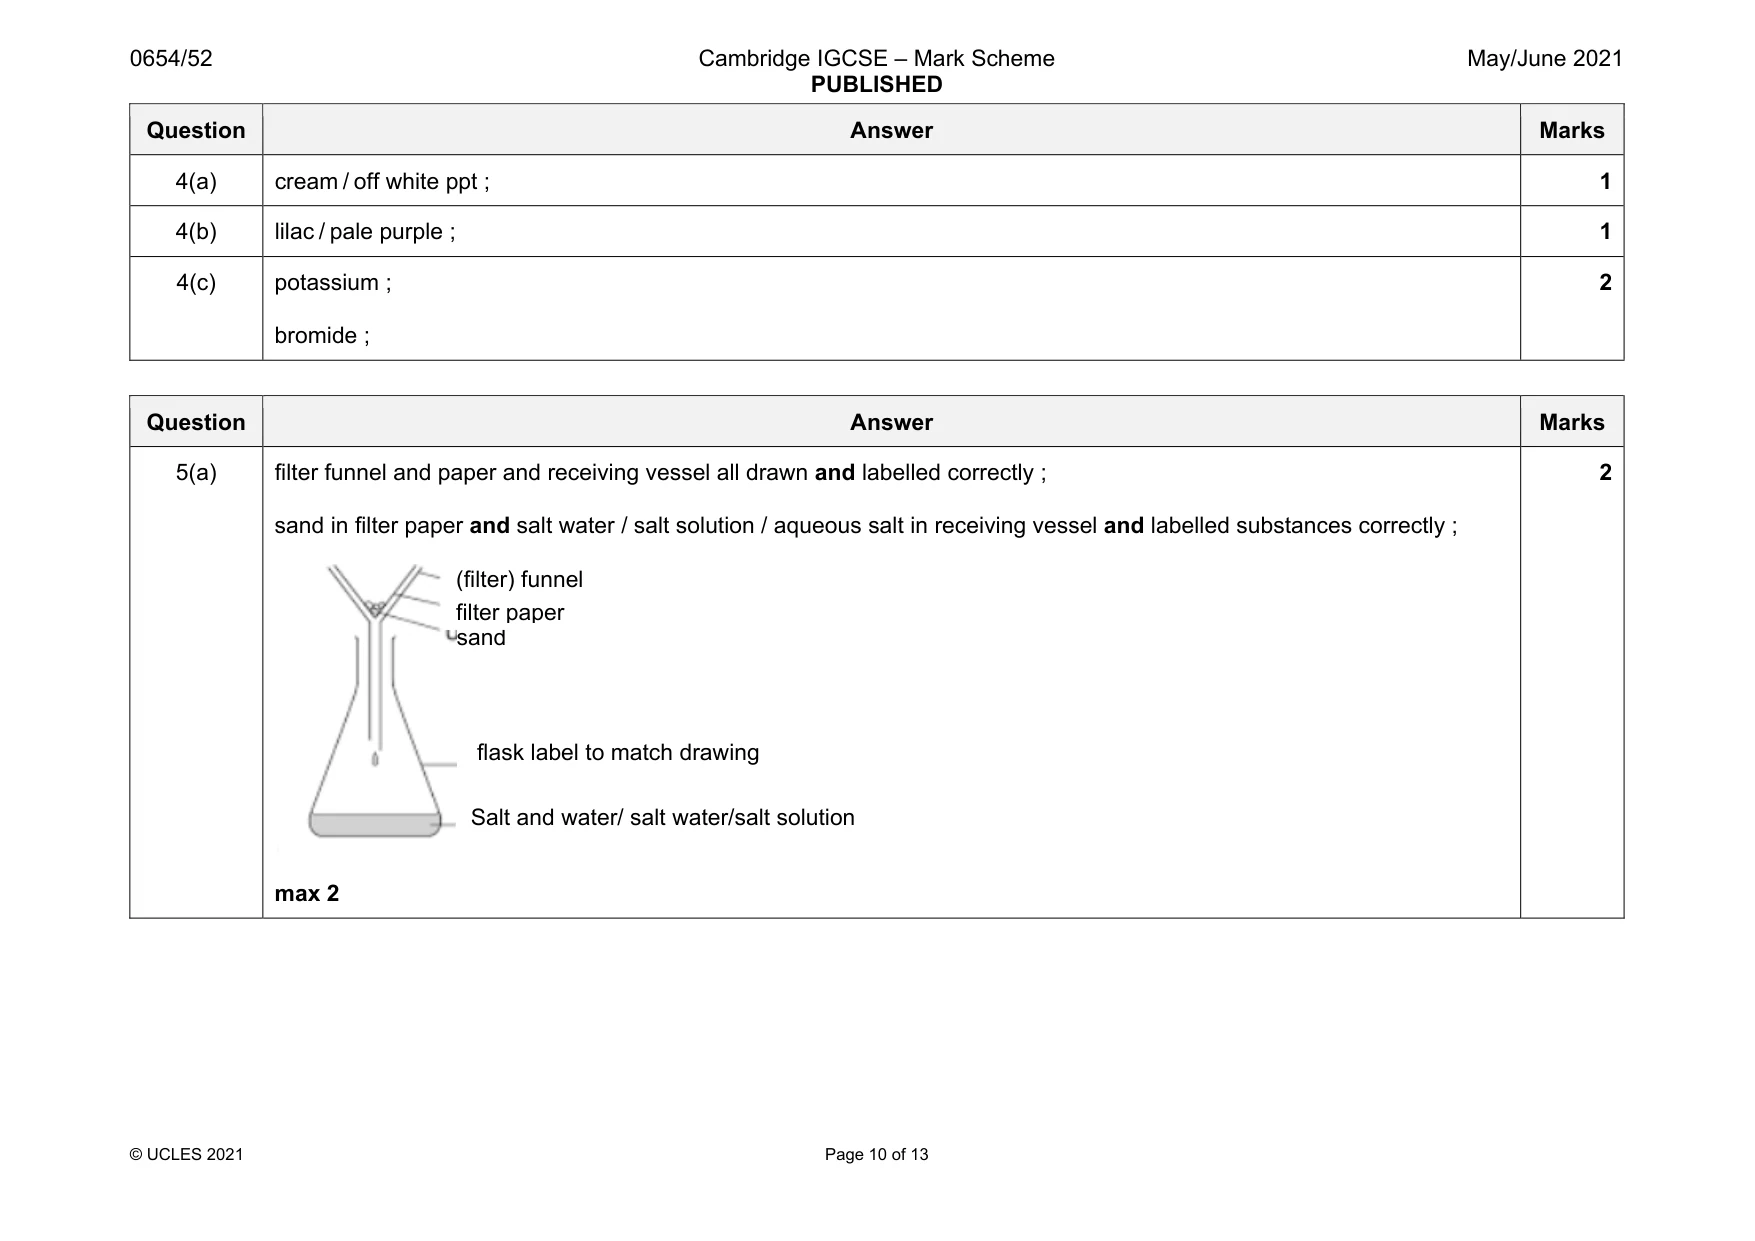
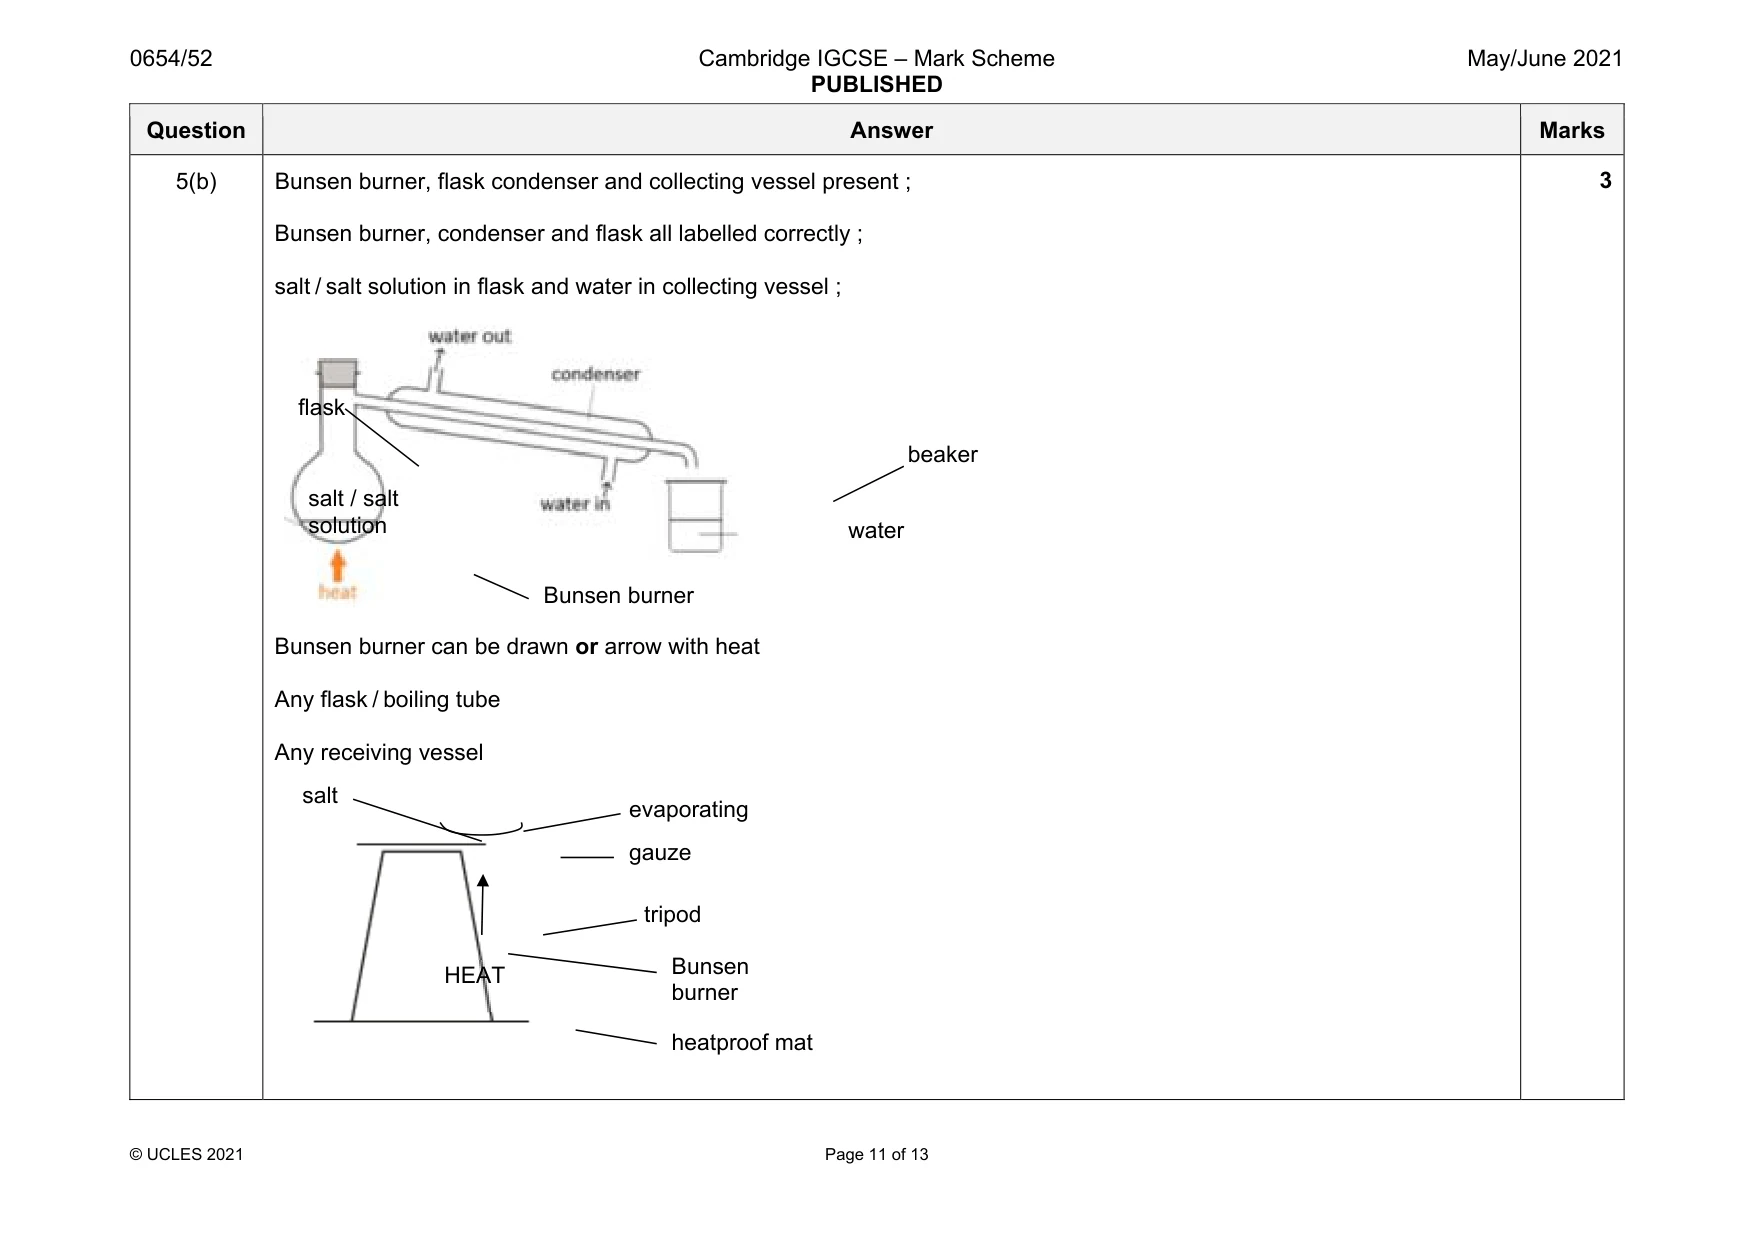
Mark scheme: 5(a) filter funnel and paper and receiving vessel all drawn and labelled correctly ; sand in filter paper and salt water / salt solution / aqueous salt in receiving vessel and labelled substances correctly ; max 2 (filter) funnel flask label to match drawing Salt and water/ salt water/salt solution sand filter paper Question Answer Marks 5(b) Bunsen burner, flask condenser and collecting vessel present ; Bunsen burner, condenser and flask all labelled correctly ; salt / salt solution in flask and water in collecting vessel ; Bunsen burner can be drawn or arrow with heat Any flask / boiling tube Any receiving vessel 3 salt / salt solution flask Bunsen burner water beaker HEAT evaporating gauze tripod heatproof mat Bunsen burner salt Question Answer Marks 5(b) diagram can have: any container Bunsen burner drawn
Q6 · You are going to find an approximate value for the internal diameter d of a boiling tube…
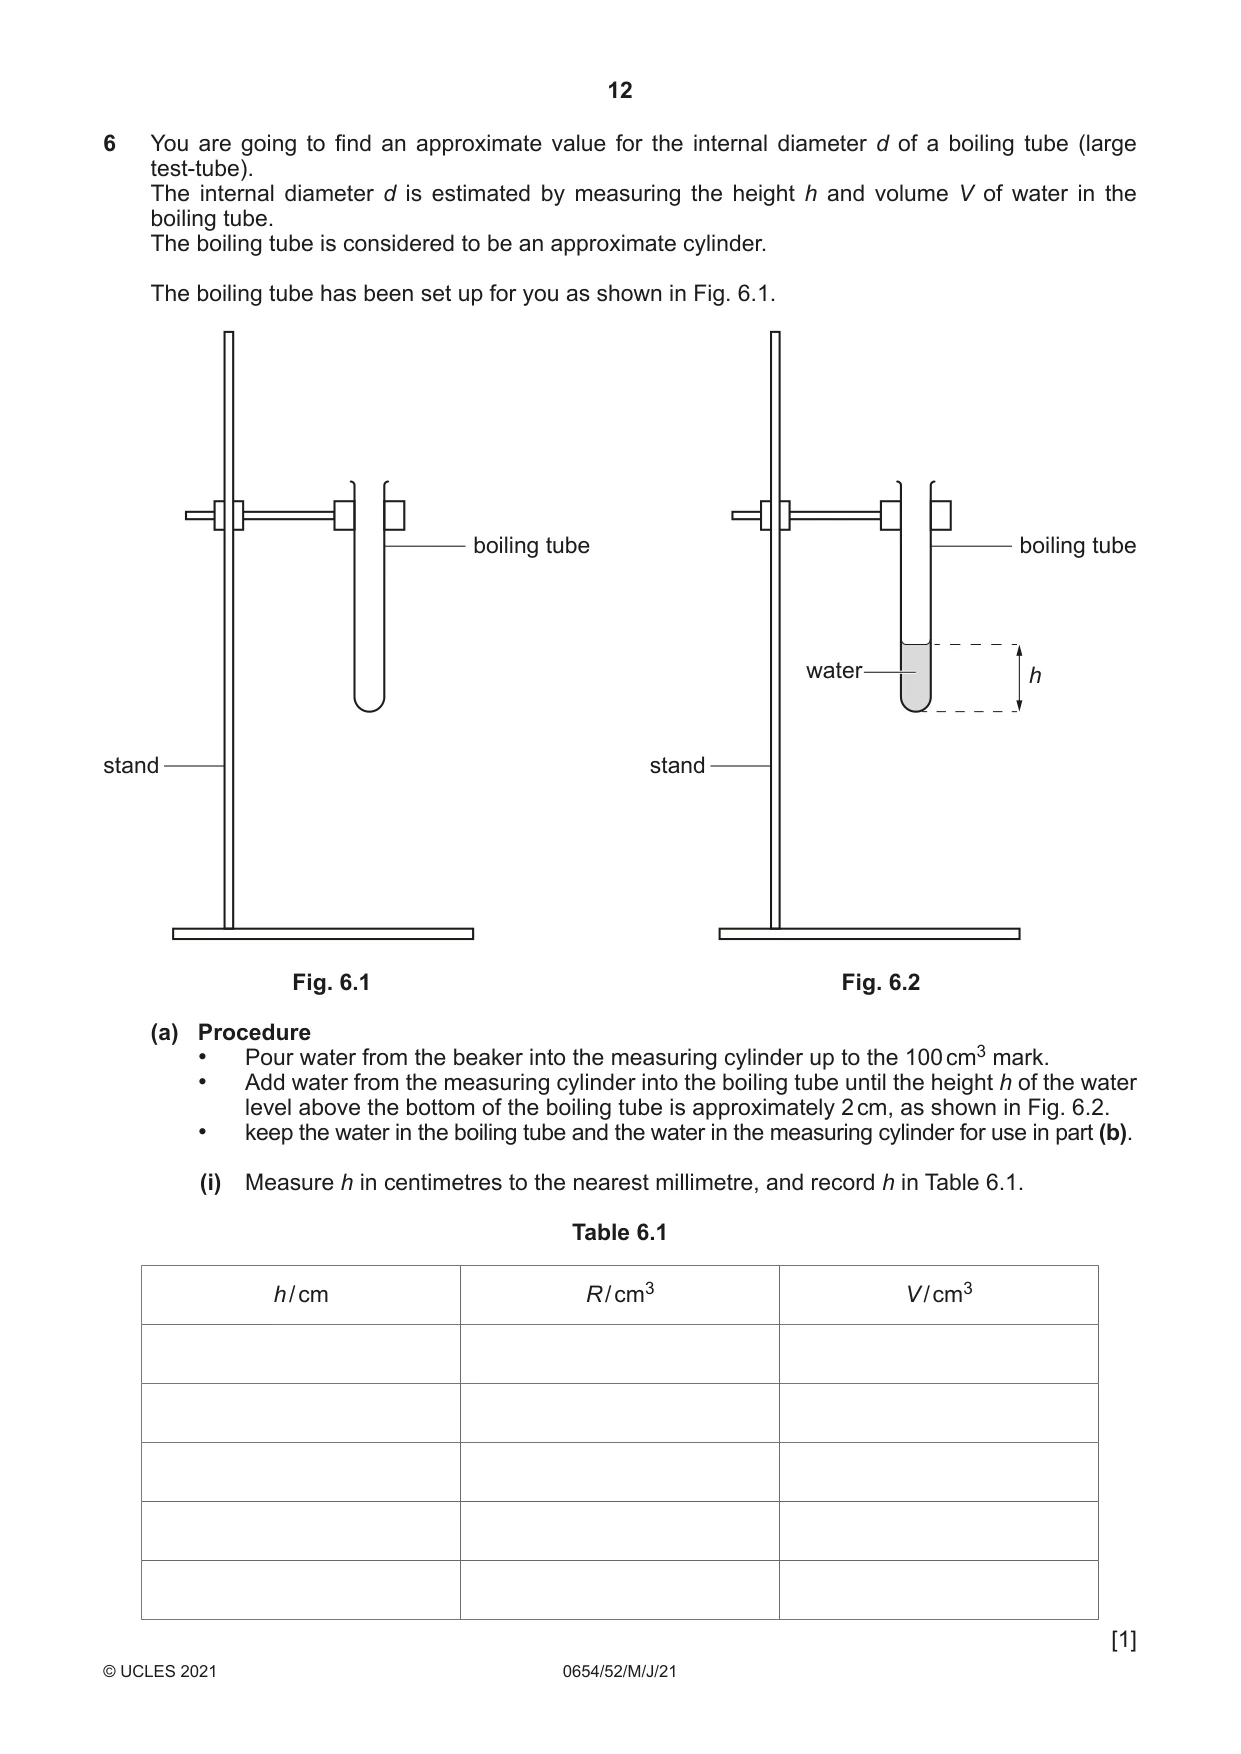
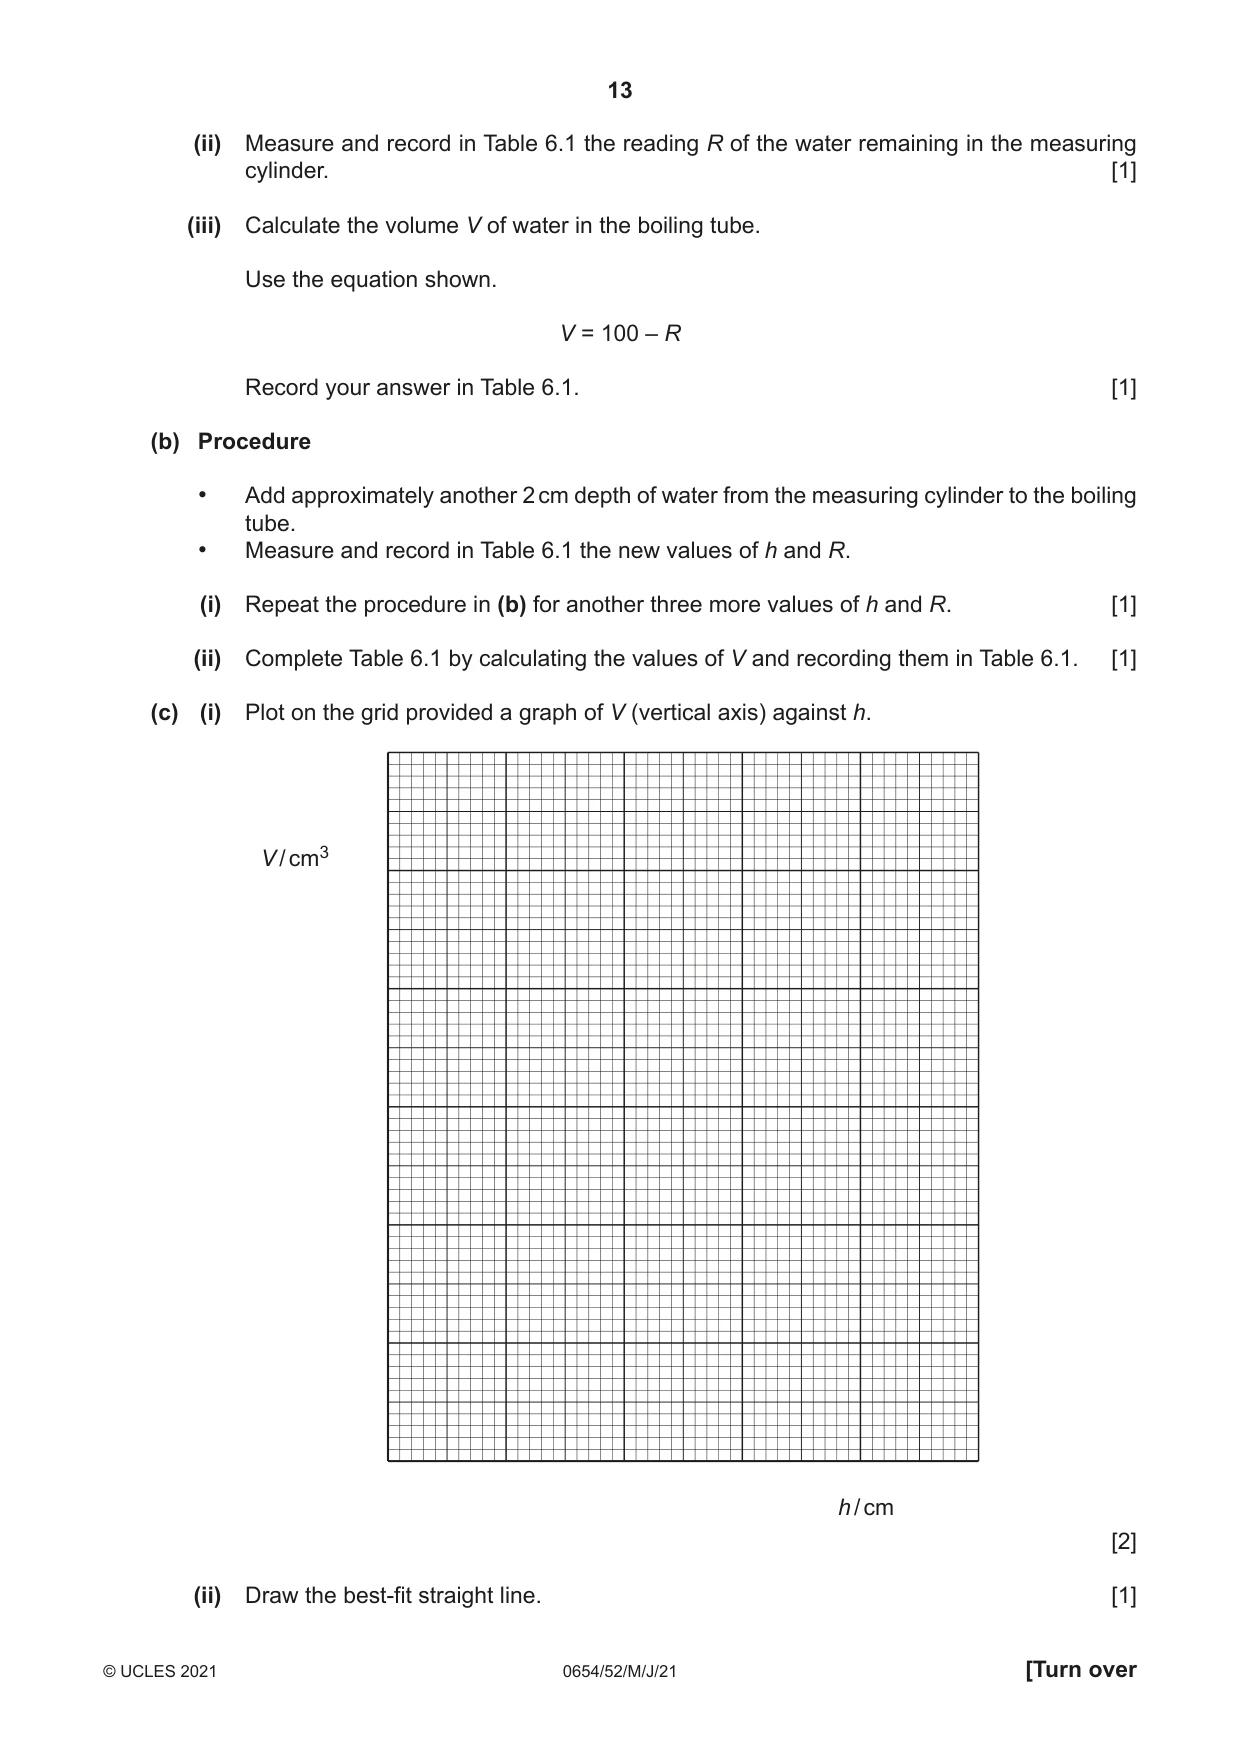
6 You are going to find an approximate value for the internal diameter d of a boiling tube (large test-tube). The internal diameter d is estimated by measuring the height h and volume V of water in the boiling tube. The boiling tube is considered to be an approximate cylinder. The boiling tube has been set up for you as shown in Fig. 6.1. boiling tube boiling tube water h stand stand Fig. 6.1 Fig. 6.2 (a) Procedure • Pour water from the beaker into the measuring cylinder up to the 100 cm3 mark. • Add water from the measuring cylinder into the boiling tube until the height h of the water level above the bottom of the boiling tube is approximately 2 cm, as shown in Fig. 6.2. • keep the water in the boiling tube and the water in the measuring cylinder for use in part (b). (i) Measure h in centimetres to the nearest millimetre, and record h in Table 6.1. Table 6.1 h / cm R / cm3 V / cm3 [1] (ii) Measure and record in Table 6.1 the reading R of the water remaining in the measuring cylinder. [1] (iii) Calculate the volume V of water in the boiling tube. Use the equation shown. V = 100 – R Record your answer in Table 6.1. [1] (b) Procedure • Add approximately another 2 cm depth of water from the measuring cylinder to the boiling tube. • Measure and record in Table 6.1 the new values of h and R. (i) Repeat the procedure in (b) for another three more values of h and R. [1] (ii) Complete Table 6.1 by calculating the values of V and recording them in Table 6.1. [1] (c) (i) Plot on the grid provided a graph of V (vertical axis) against h. V / cm3 h / cm [2] (ii) Draw the best-fit straight line. [1] (d) Calculate the gradient m of your line. Show all working and indicate on your graph the values you chose to enable the gradient to be calculated. m = ......................................................... [2] (e) Calculate the internal diameter d of the boiling tube. Use the equation shown. d = 0.59 × m d = ................................................... cm [1] (f) (i) State one practical problem which makes it difficult to get an accurate value of h in this experiment. ........................................................................................................................................... ..................................................................................................................................... [1] (ii) Suggest one other reason why your value for the internal diameter d of the boiling tube is only approximate. ........................................................................................................................................... ..................................................................................................................................... [1] [Total: 13]
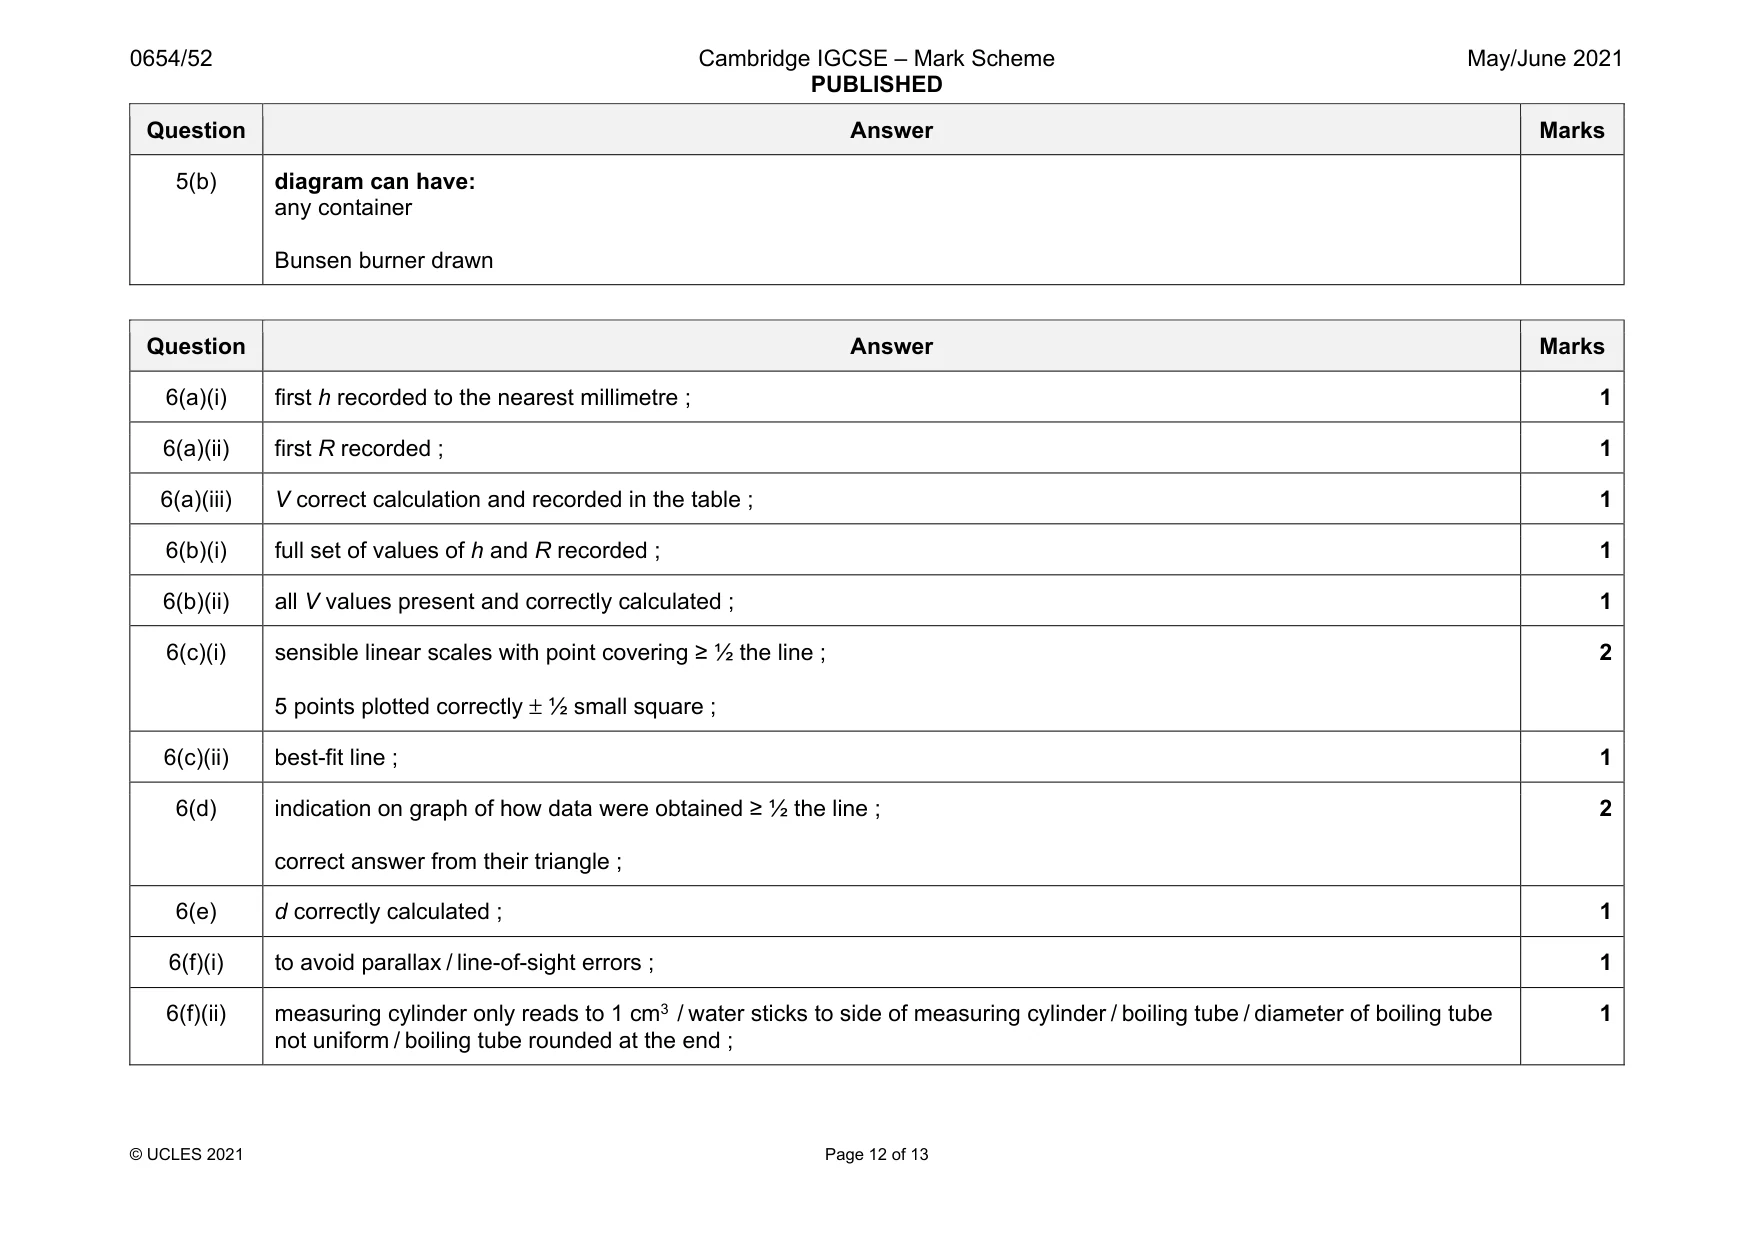
Mark scheme: 6(a)(i) first h recorded to the nearest millimetre ; 1 6(a)(ii) first R recorded ; 1 6(a)(iii) V correct calculation and recorded in the table ; 1 6(b)(i) full set of values of h and R recorded ; 1 6(b)(ii) all V values present and correctly calculated ; 1 6(c)(i) sensible linear scales with point covering ≥ ½ the line ; 5 points plotted correctly ± ½ small square ; 2 6(c)(ii) best-fit line ; 1 6(d) indication on graph of how data were obtained ≥ ½ the line ; correct answer from their triangle ; 2 6(e) d correctly calculated ; 1 6(f)(i) to avoid parallax / line-of-sight errors ; 1 6(f)(ii) measuring cylinder only reads to 1 cm3 / water sticks to side of measuring cylinder / boiling tube / diameter of boiling tube not uniform / boiling tube rounded at the end ; 1
More questions on Physical quantities and measurement techniques
Q7 · You are going to investigate how the resistance of a metal wire depends upon its length
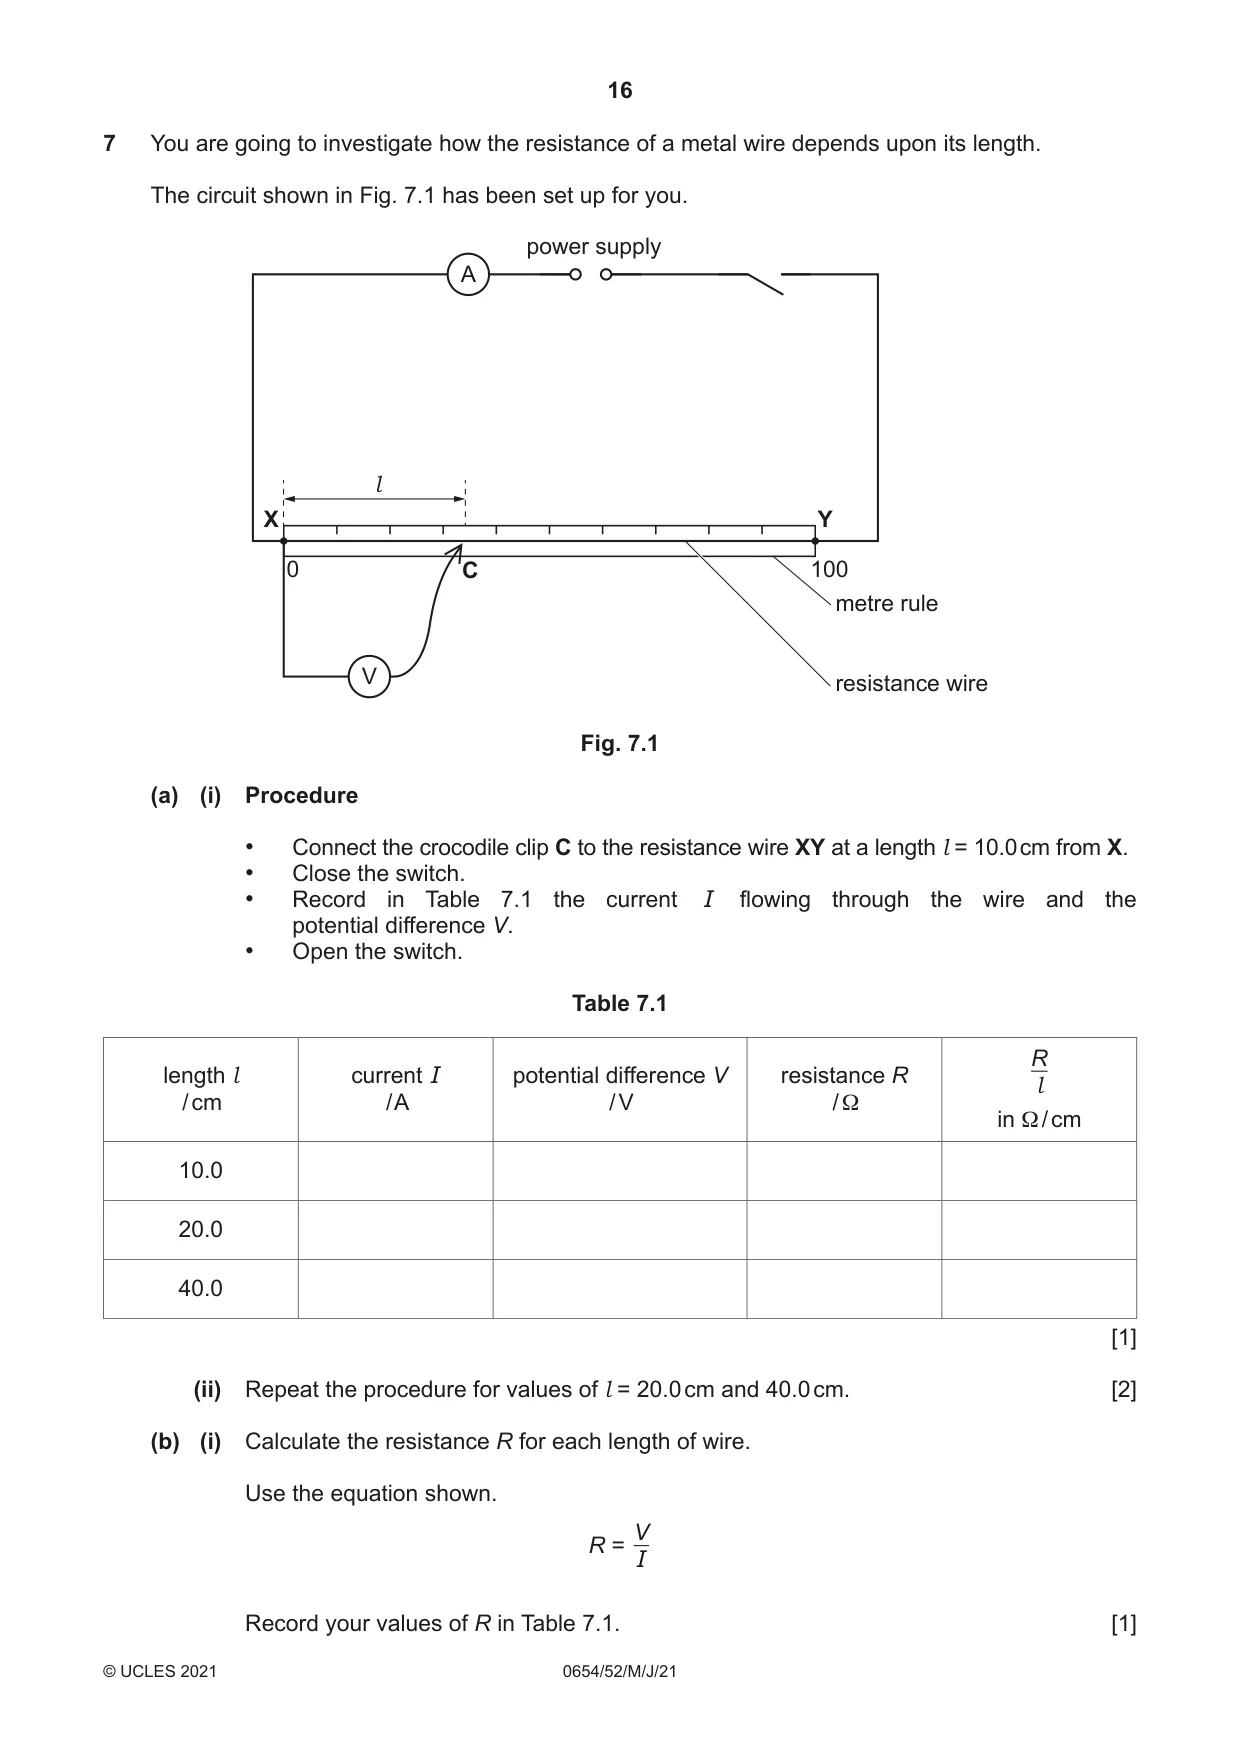
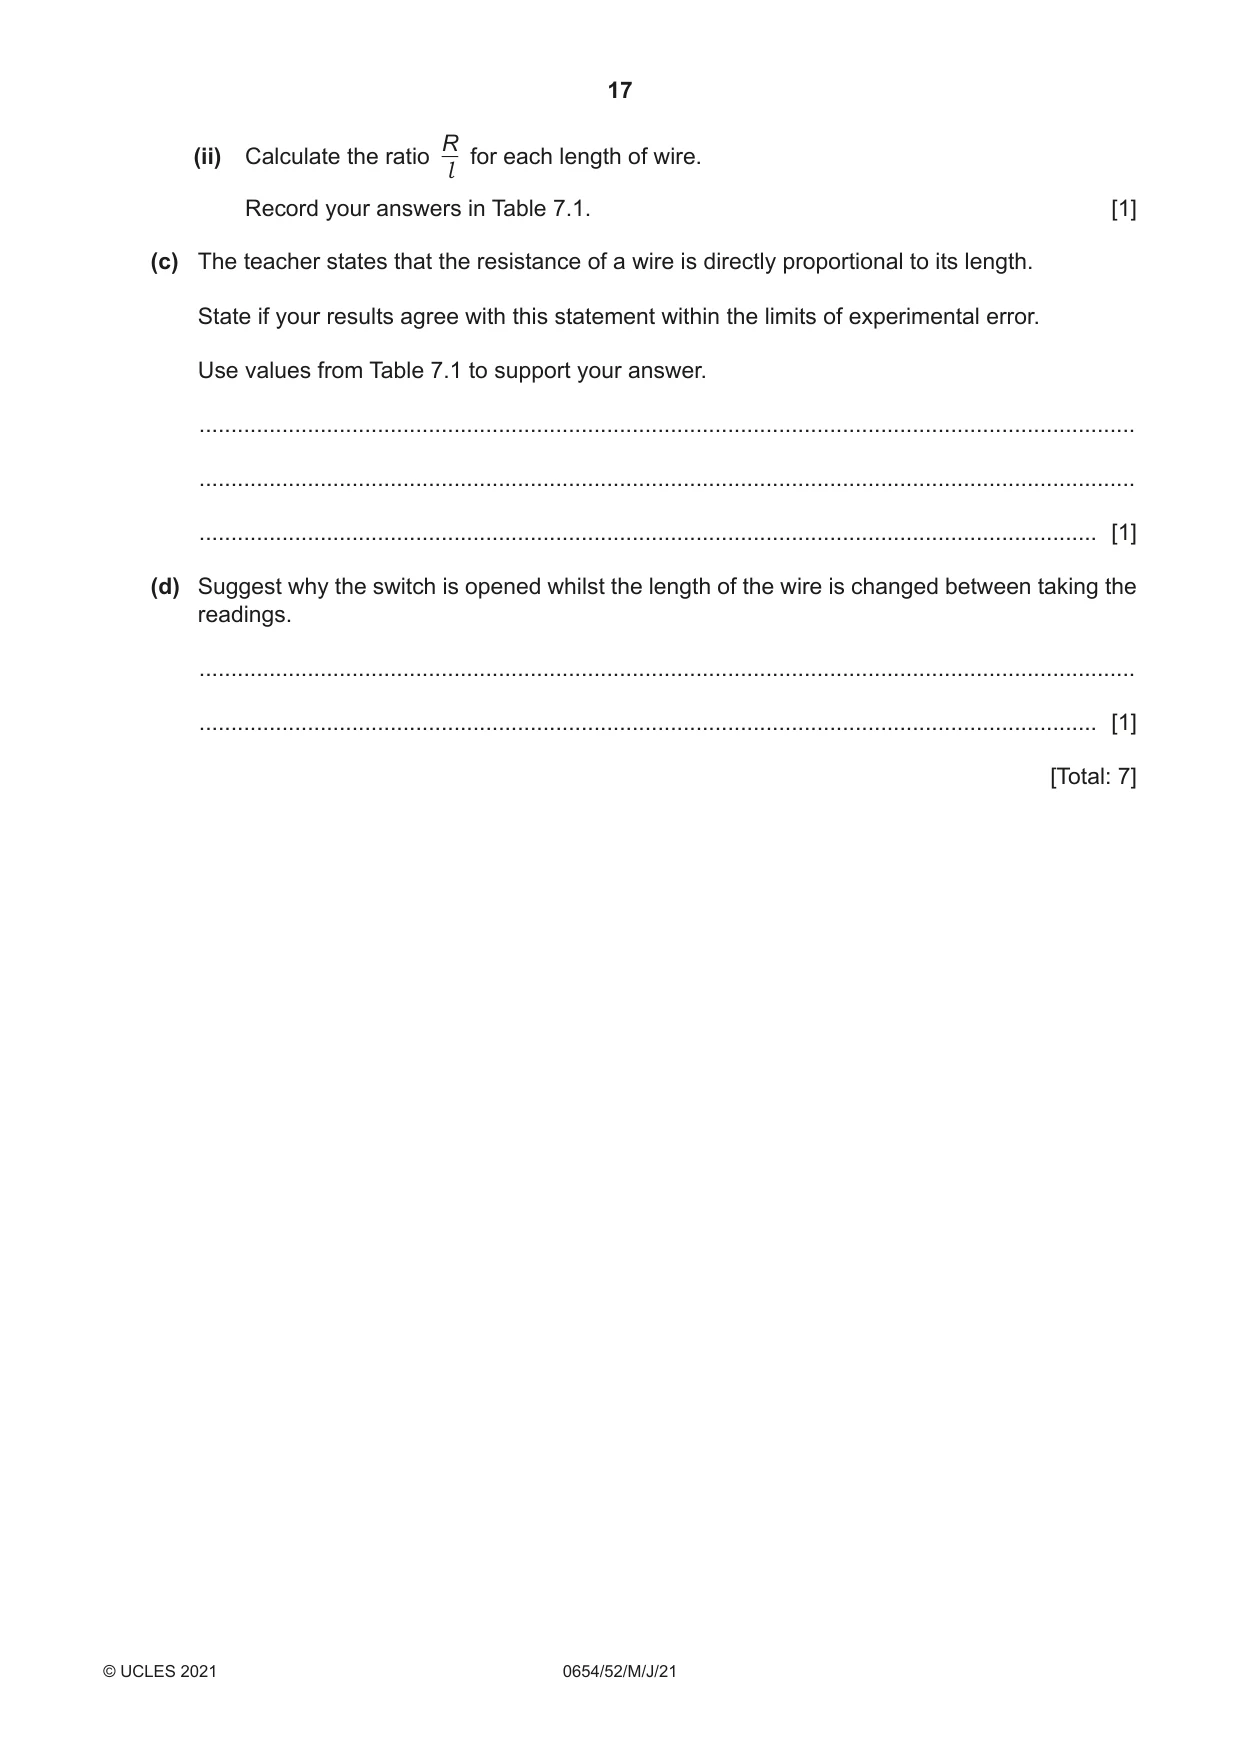
7 You are going to investigate how the resistance of a metal wire depends upon its length. The circuit shown in Fig. 7.1 has been set up for you. power supply A l X Y 0 C 100 metre rule V resistance wire Fig. 7.1 (a) (i) Procedure • Connect the crocodile clip C to the resistance wire XY at a length l = 10.0 cm from X. • Close the switch. • Record in Table 7.1 the current I flowing through the wire and the potential difference V. • Open the switch. Table 7.1 R length l current I potential difference V resistance R l / cm / A / V / Ω in Ω / cm 10.0 20.0 40.0 [1] (ii) Repeat the procedure for values of l = 20.0 cm and 40.0 cm. [2] (b) (i) Calculate the resistance R for each length of wire. Use the equation shown. V R = I Record your values of R in Table 7.1. [1] R (ii) Calculate the ratio for each length of wire. l Record your answers in Table 7.1. [1] (c) The teacher states that the resistance of a wire is directly proportional to its length. State if your results agree with this statement within the limits of experimental error. Use values from Table 7.1 to support your answer. ................................................................................................................................................... ................................................................................................................................................... ............................................................................................................................................. [1] (d) Suggest why the switch is opened whilst the length of the wire is changed between taking the readings. ................................................................................................................................................... ............................................................................................................................................. [1] [Total: 7]
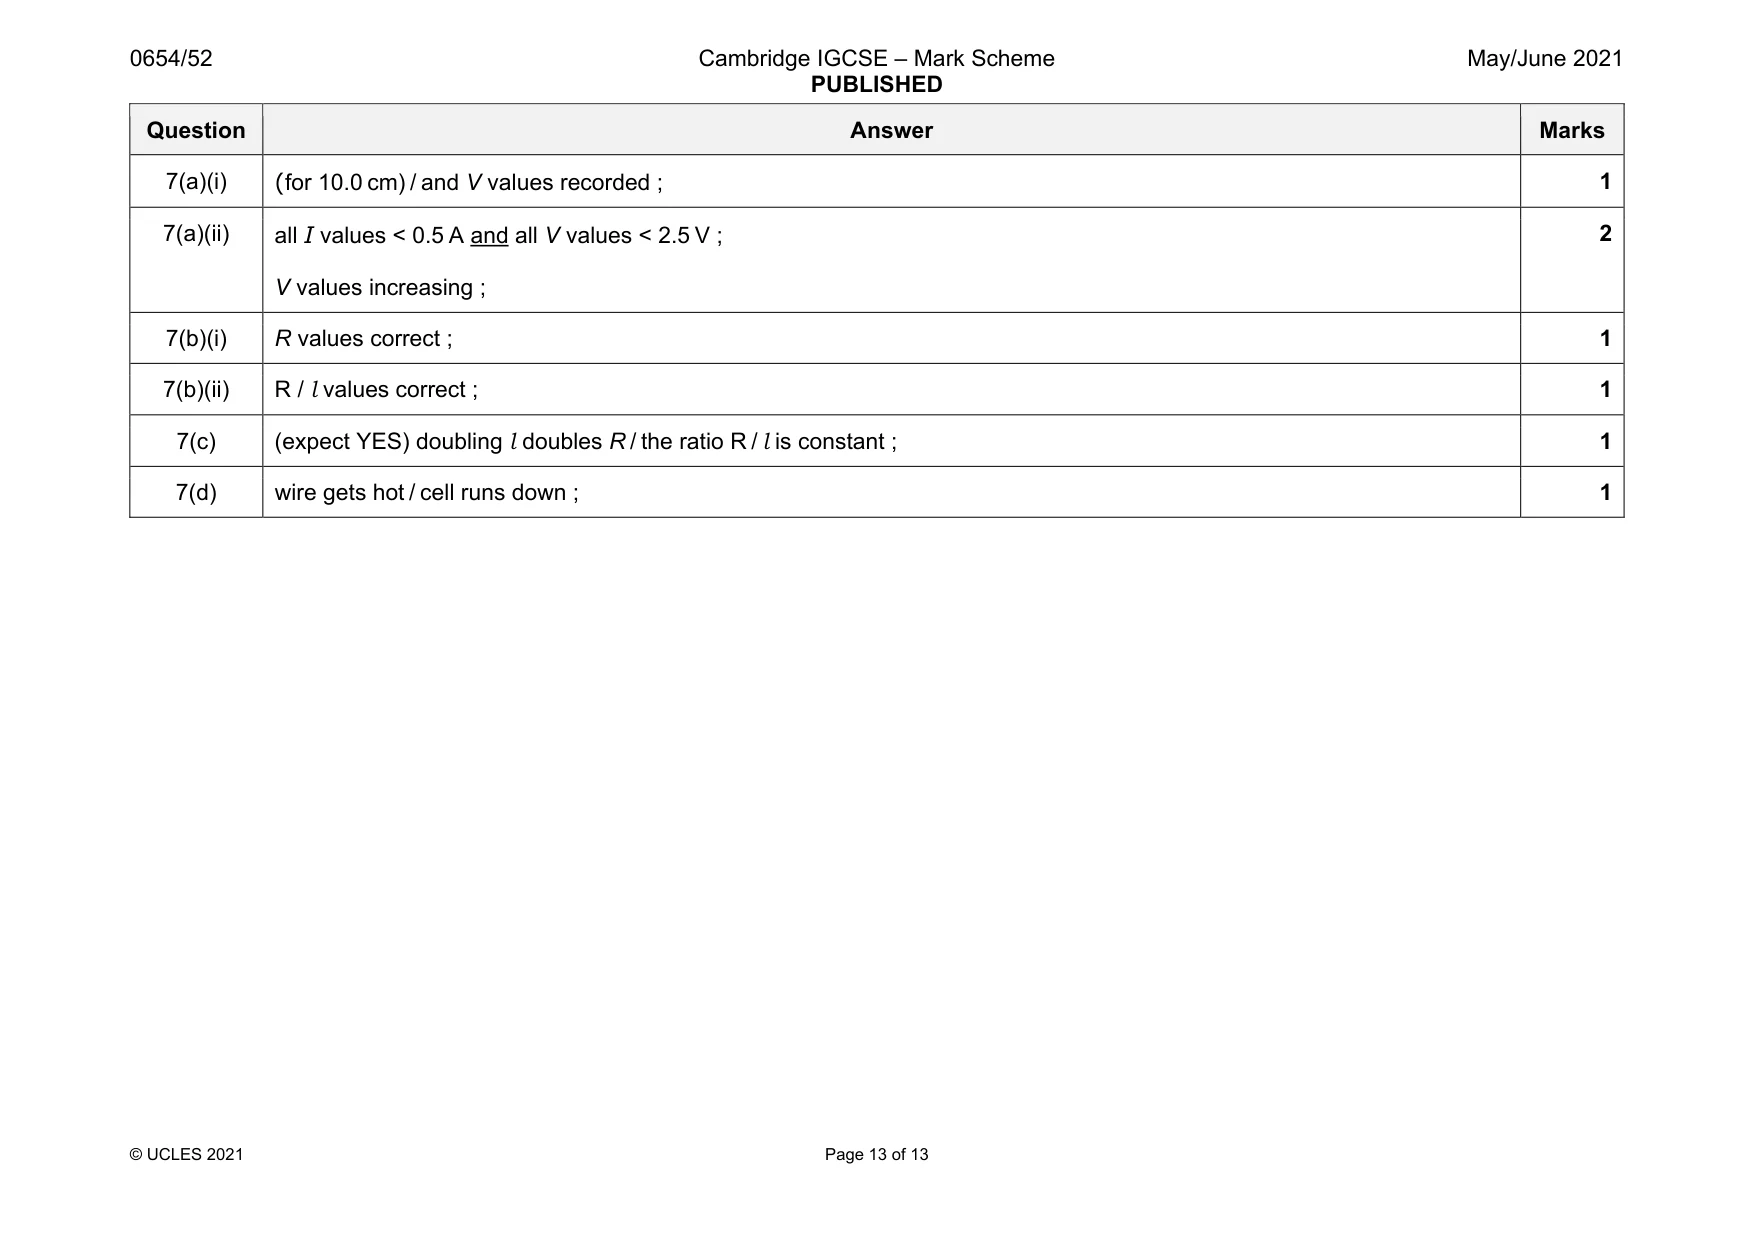
Mark scheme: 7(a)(i) 1 7(a)(ii) all I values < 0.5 A and all V values < 2.5 V ; V values increasing ; 2 7(b)(i) R values correct ; 1 7(b)(ii) R / l values correct ; 1 7(c) (expect YES) doubling l doubles R / the ratio R / l is constant ; 1 7(d) wire gets hot / cell runs down ; 1
What was in this paper
The subtopics covered by these 7 questions, and how many questions each got. Open one in a new tab to see every Cambridge question on it.
What you needed in this session
Cambridge’s own grade thresholds for 2021 May/June, Paper 5 · Variant 2. A higher threshold means an easier paper — the bar moves with how the cohort did.