Cambridge IGCSE Sciences - Co-ordinated (Double) 0654 — 2025 Feb/March Paper 5 · Variant 2
0654/52/F/M/25 · 6 questions · 60 marks · 120 min
The question paper and its mark scheme, free to read here and free to download. This is Cambridge’s own paper, exactly as it was sat.
Question paper16 pages

Mark scheme10 pages
Answers below. Sit the paper first if you are practising.
Questions as text
Q1 · You are going to investigate the loss of thermal energy from a large animal and from a…
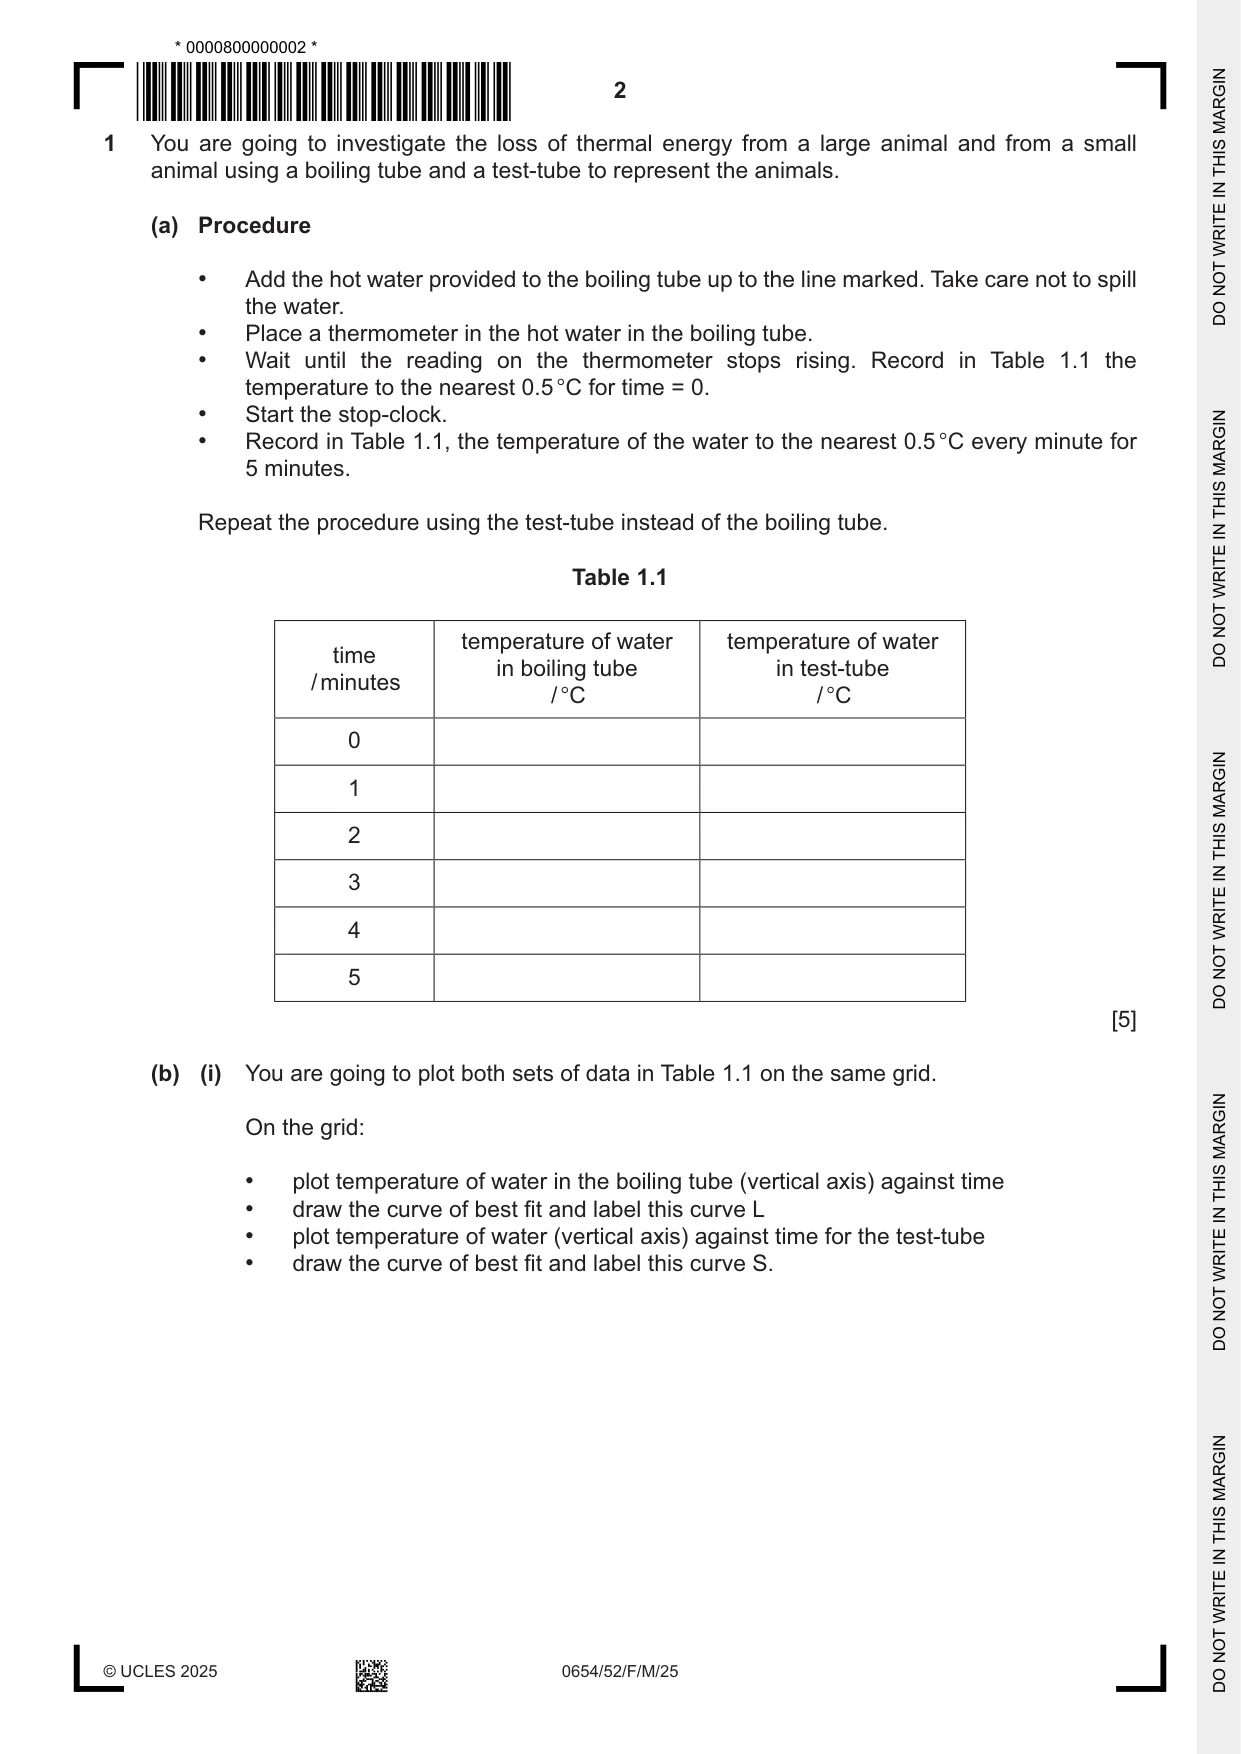
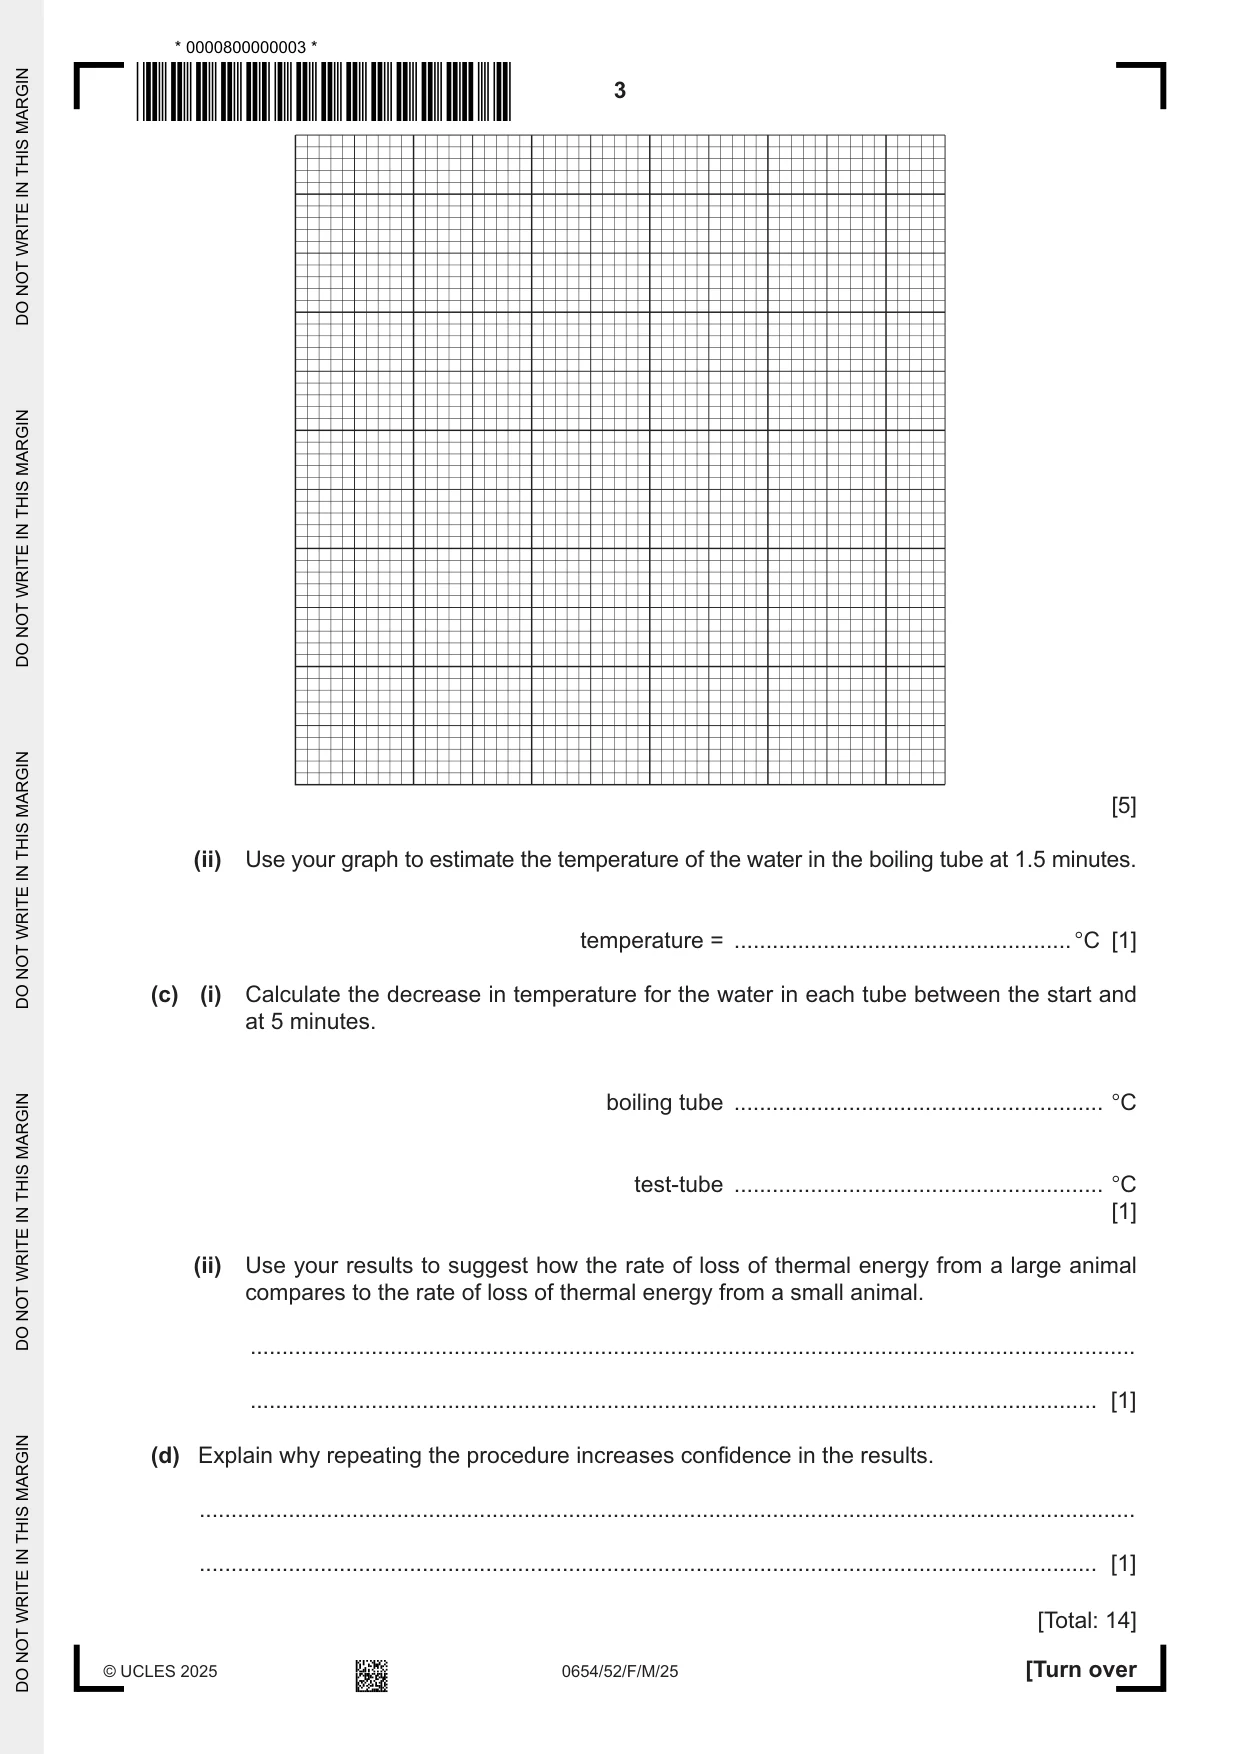
1 You are going to investigate the loss of thermal energy from a large animal and from a small animal using a boiling tube and a test-tube to represent the animals. (a) Procedure • Add the hot water provided to the boiling tube up to the line marked. Take care not to spill the water. • Place a thermometer in the hot water in the boiling tube. • Wait until the reading on the thermometer stops rising. Record in Table 1.1 the temperature to the nearest 0.5 °C for time = 0. • Start the stop-clock. • Record in Table 1.1, the temperature of the water to the nearest 0.5 °C every minute for 5 minutes. Repeat the procedure using the test-tube instead of the boiling tube. Table 1.1 temperature of water temperature of water time in boiling tube in test-tube / minutes / °C / °C 0 1 2 3 4 5 [5] (b) (i) You are going to plot both sets of data in Table 1.1 on the same grid. On the grid: • plot temperature of water in the boiling tube (vertical axis) against time • draw the curve of best fit and label this curve L • plot temperature of water (vertical axis) against time for the test-tube • draw the curve of best fit and label this curve S. [5] (ii) Use your graph to estimate the temperature of the water in the boiling tube at 1.5 minutes. temperature = ..................................................... °C [1] (c) (i) Calculate the decrease in temperature for the water in each tube between the start and at 5 minutes. boiling tube .......................................................... °C test-tube .......................................................... °C [1] (ii) Use your results to suggest how the rate of loss of thermal energy from a large animal compares to the rate of loss of thermal energy from a small animal. ........................................................................................................................................... ..................................................................................................................................... [1] (d) Explain why repeating the procedure increases confidence in the results. ................................................................................................................................................... ............................................................................................................................................. [1] [Total: 14]
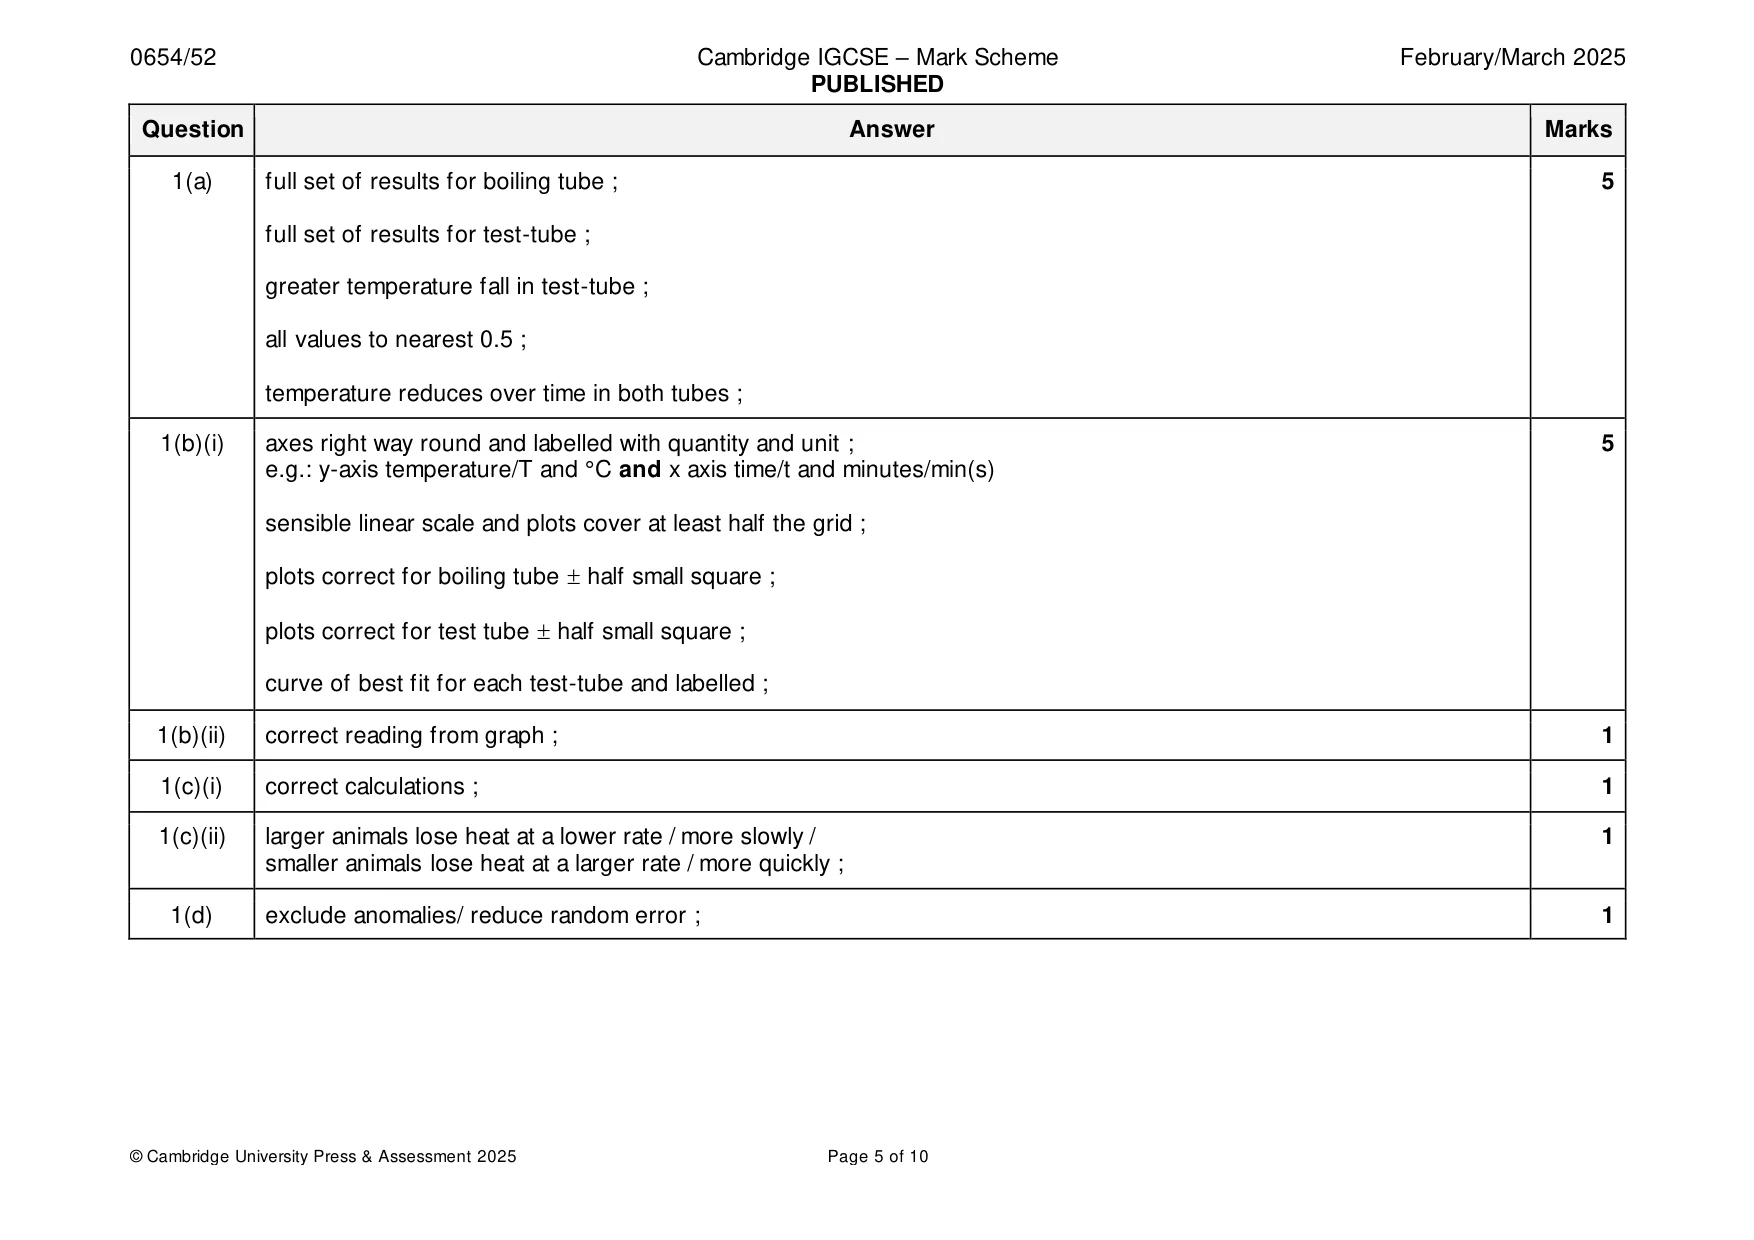
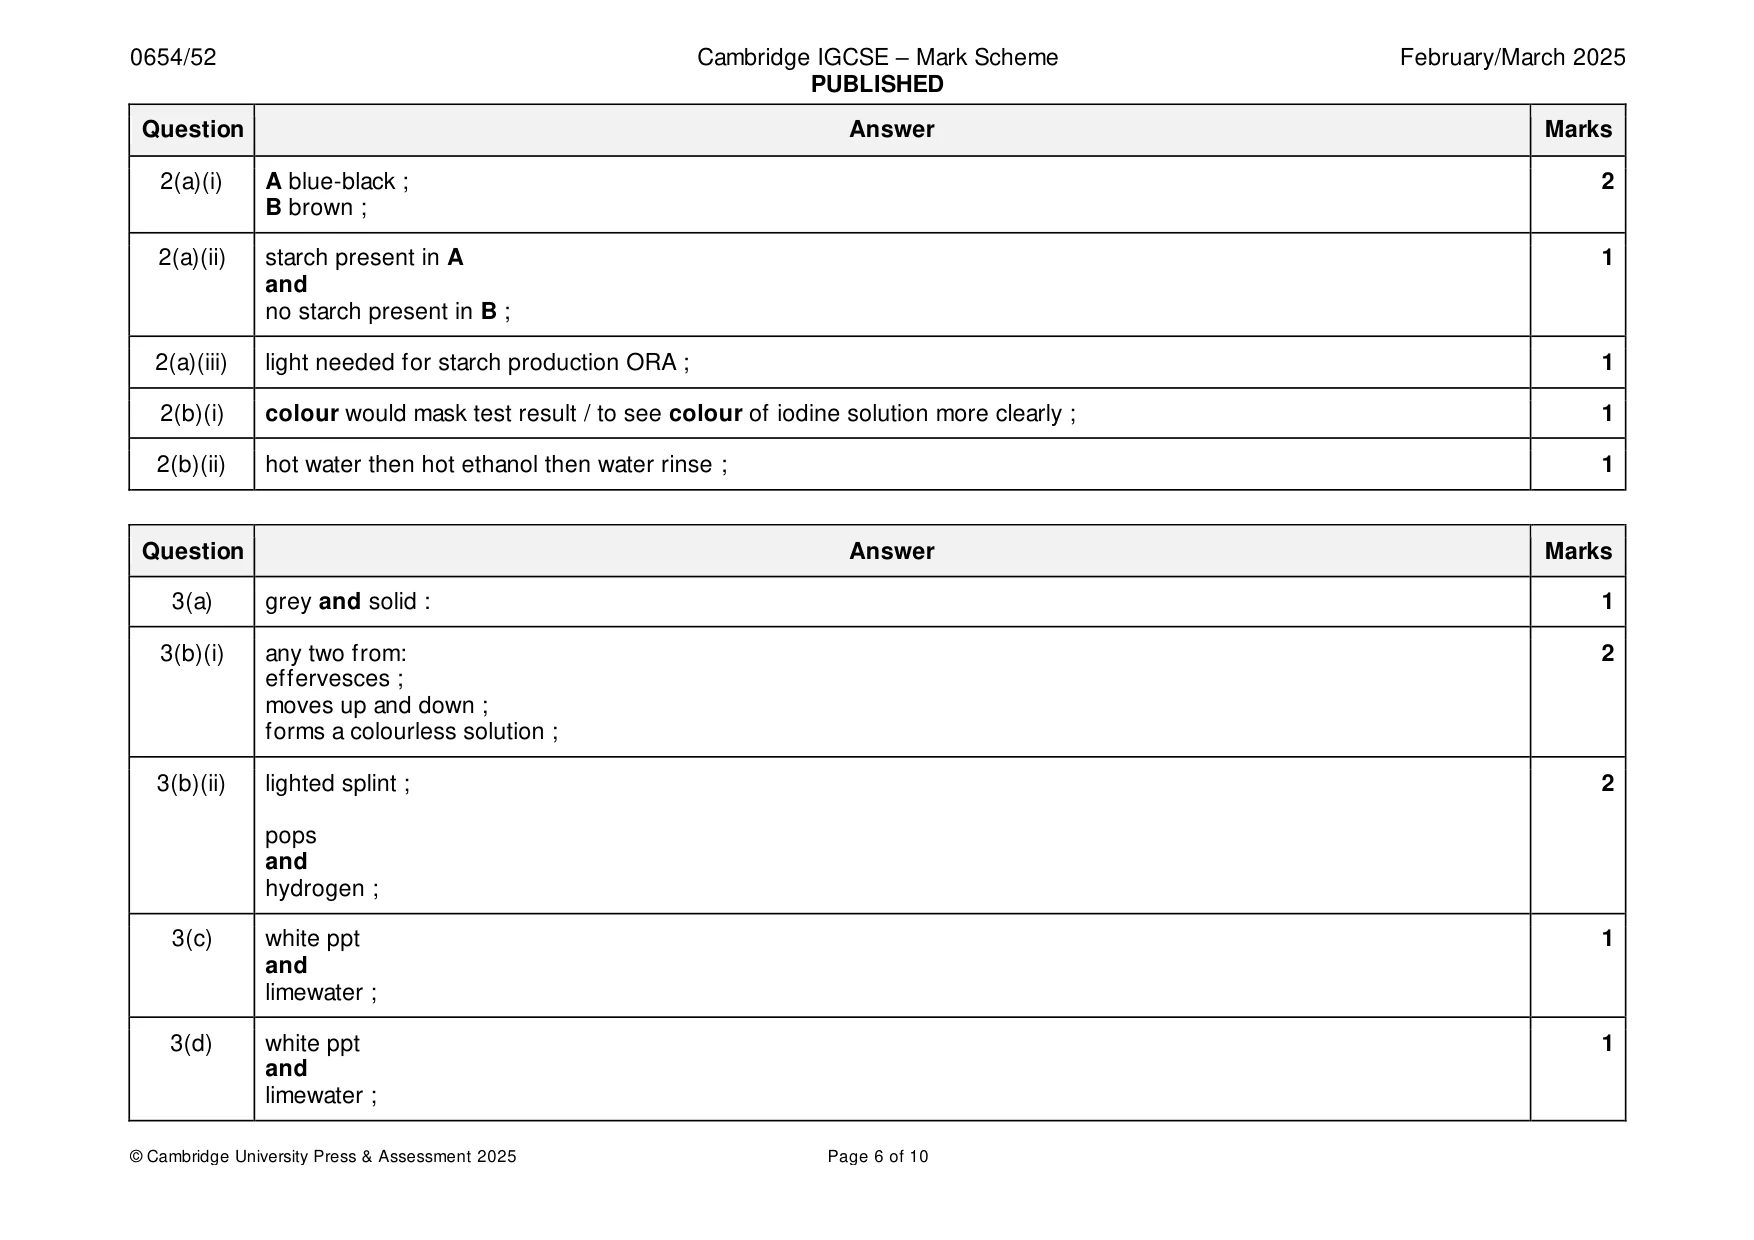
Mark scheme: Question Answer Marks 1(a) full set of results for boiling tube ; 5 full set of results for test-tube ; greater temperature fall in test-tube ; all values to nearest 0.5 ; temperature reduces over time in both tubes ; 1(b)(i) axes right way round and labelled with quantity and unit ; 5 e.g.: y-axis temperature/T and °C and x axis time/t and minutes/min(s) sensible linear scale and plots cover at least half the grid ; plots correct for boiling tube half small square ; plots correct for test tube half small square ; curve of best fit for each test-tube and labelled ; 1(b)(ii) correct reading from graph ; 1 1(c)(i) correct calculations ; 1 1(c)(ii) larger animals lose heat at a lower rate / more slowly / 1 smaller animals lose heat at a larger rate / more quickly ; 1(d) exclude anomalies/ reduce random error ; 1
Q2 · You are provided with two leaves, A and B, each on a white tile
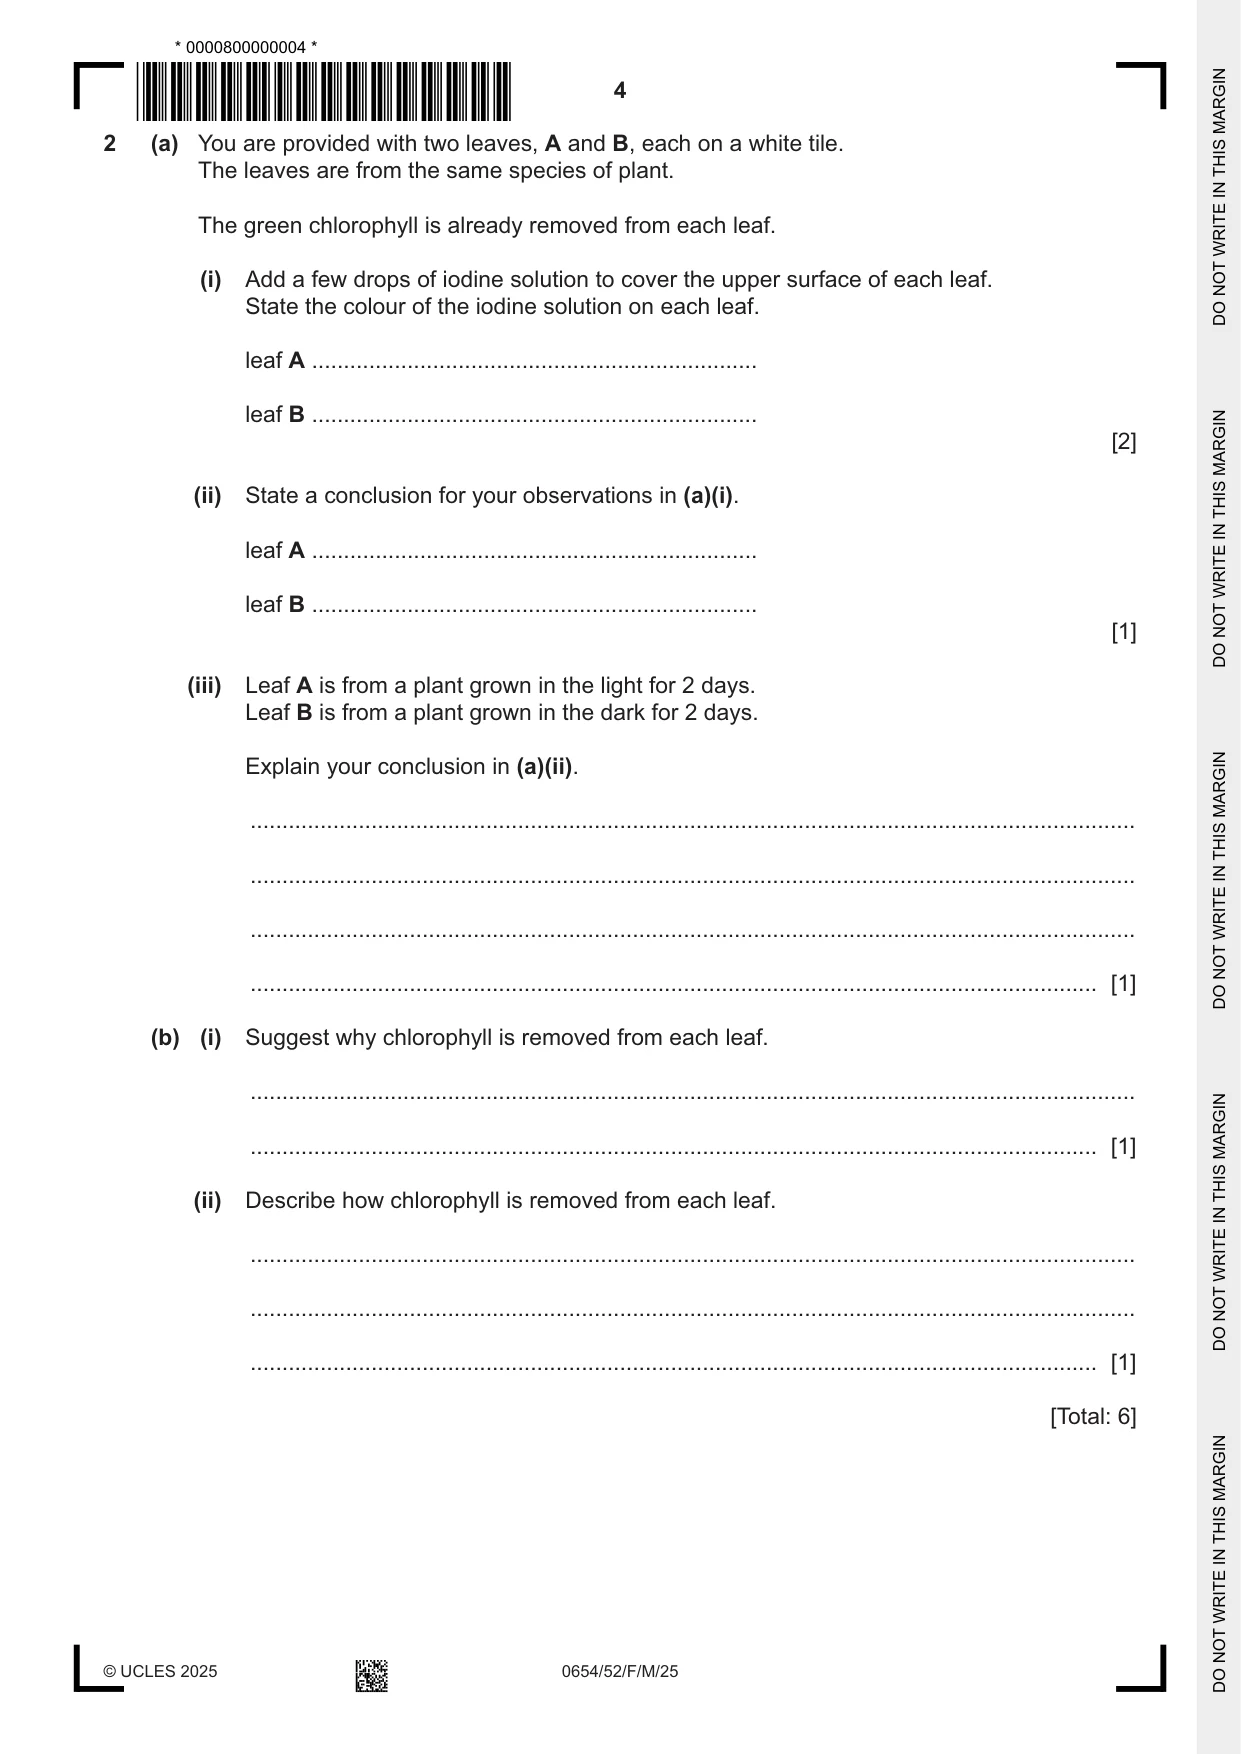
2 (a) You are provided with two leaves, A and B, each on a white tile. The leaves are from the same species of plant. The green chlorophyll is already removed from each leaf. (i) Add a few drops of iodine solution to cover the upper surface of each leaf. State the colour of the iodine solution on each leaf. leaf A ...................................................................... leaf B ...................................................................... [2] (ii) State a conclusion for your observations in (a)(i). leaf A ...................................................................... leaf B ...................................................................... [1] (iii) Leaf A is from a plant grown in the light for 2 days. Leaf B is from a plant grown in the dark for 2 days. Explain your conclusion in (a)(ii). ........................................................................................................................................... ........................................................................................................................................... ........................................................................................................................................... ..................................................................................................................................... [1] (b) (i) Suggest why chlorophyll is removed from each leaf. ........................................................................................................................................... ..................................................................................................................................... [1] (ii) Describe how chlorophyll is removed from each leaf. ........................................................................................................................................... ........................................................................................................................................... ..................................................................................................................................... [1] [Total: 6]
Mark scheme: 2(a)(i) A blue-black ; 2 B brown ; 2(a)(ii) starch present in A 1 and no starch present in B ; 2(a)(iii) light needed for starch production ORA ; 1 2(b)(i) colour would mask test result / to see colour of iodine solution more clearly ; 1 2(b)(ii) hot water then hot ethanol then water rinse ; 1
Q3 · You are going to identify solid J and the ions present in solid K and in aqueous L
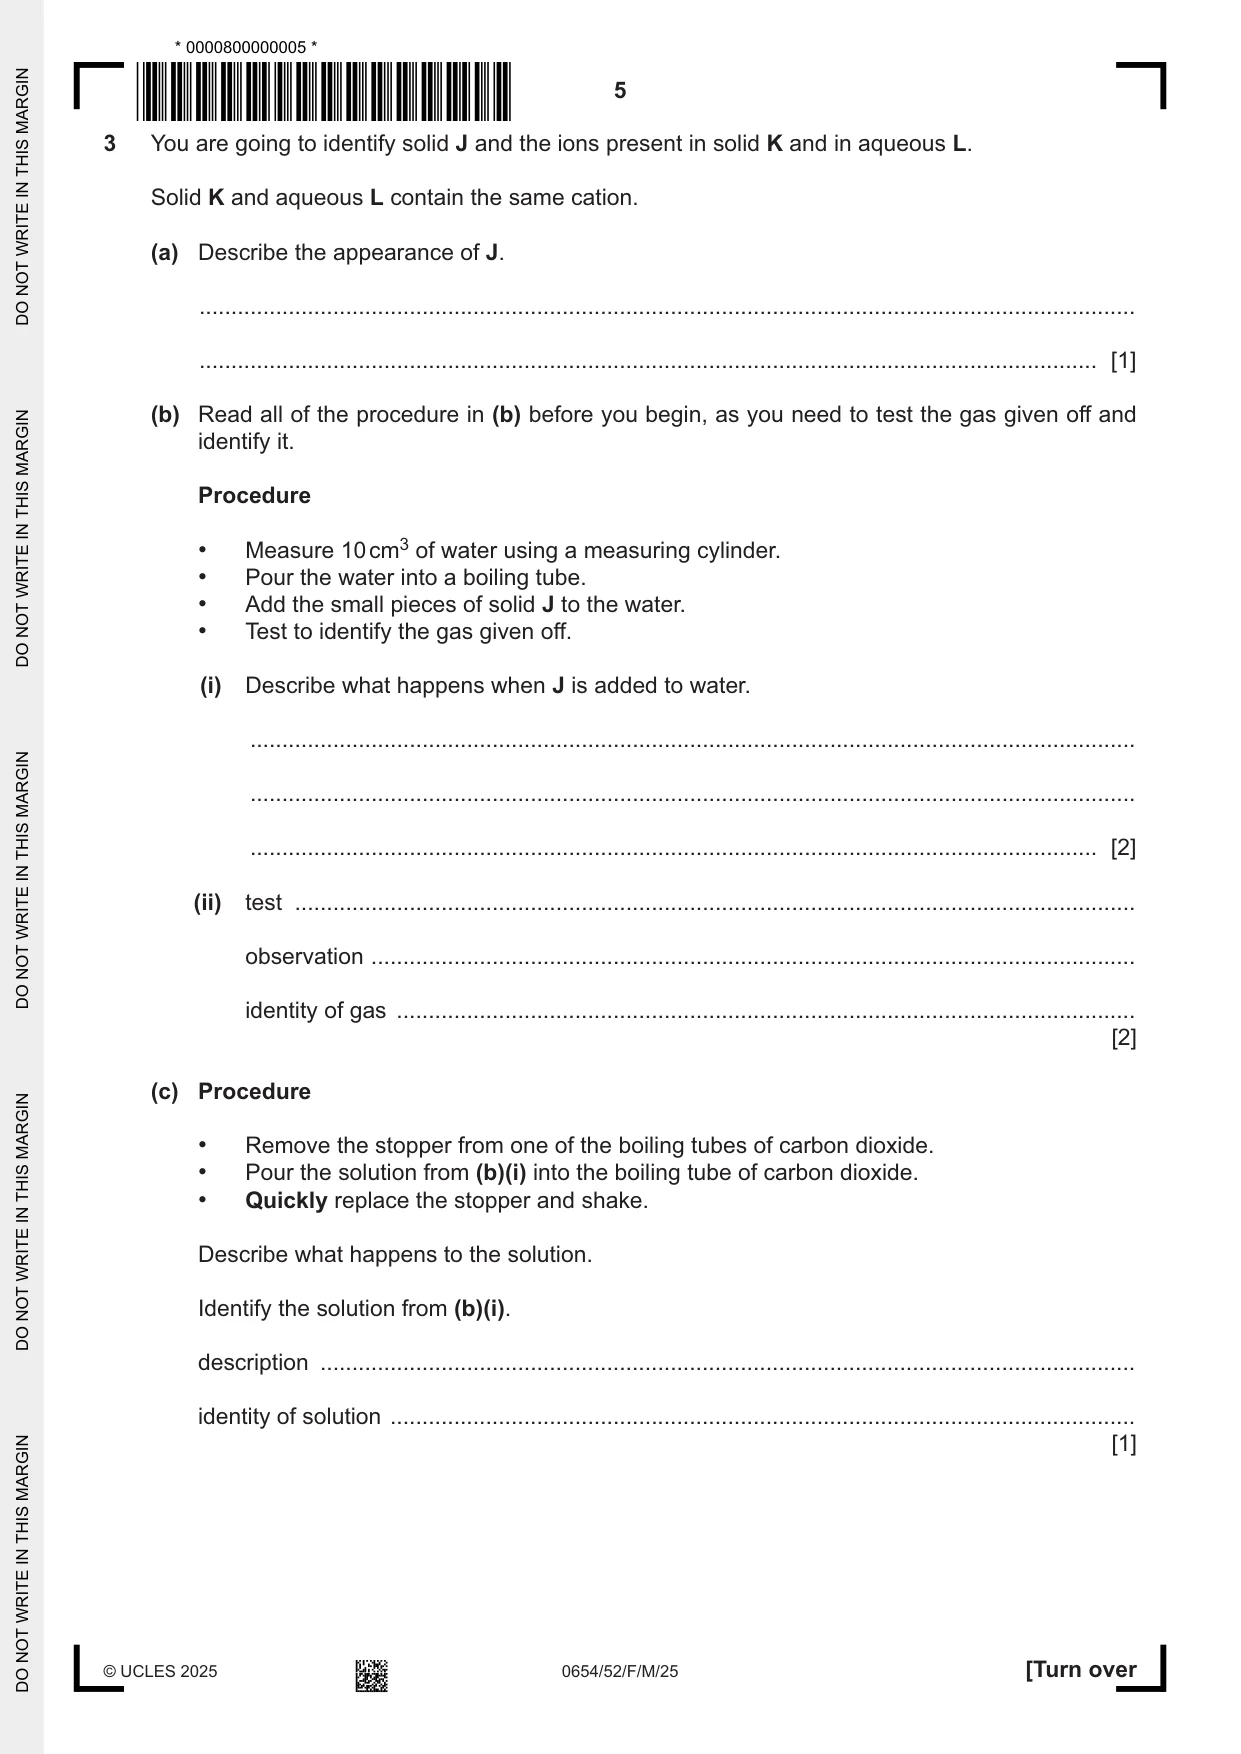
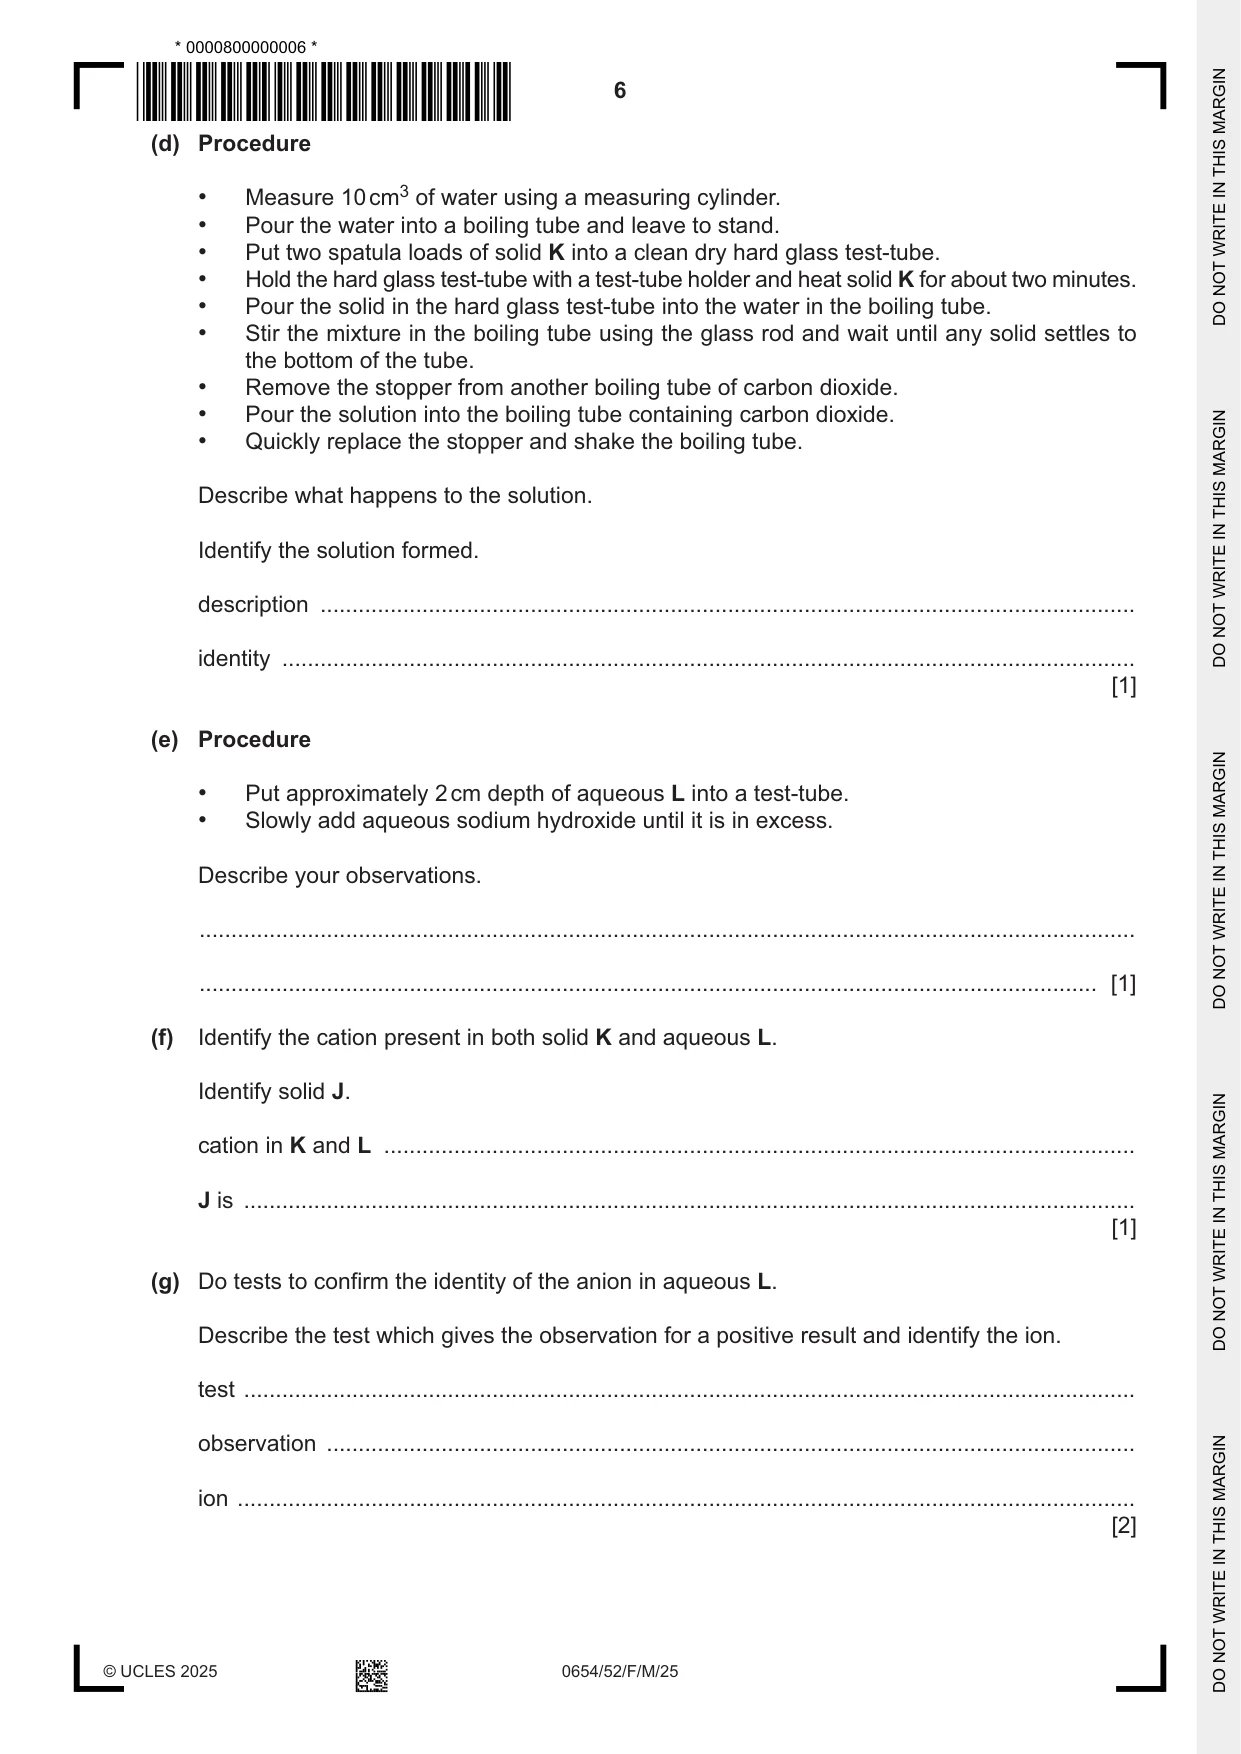
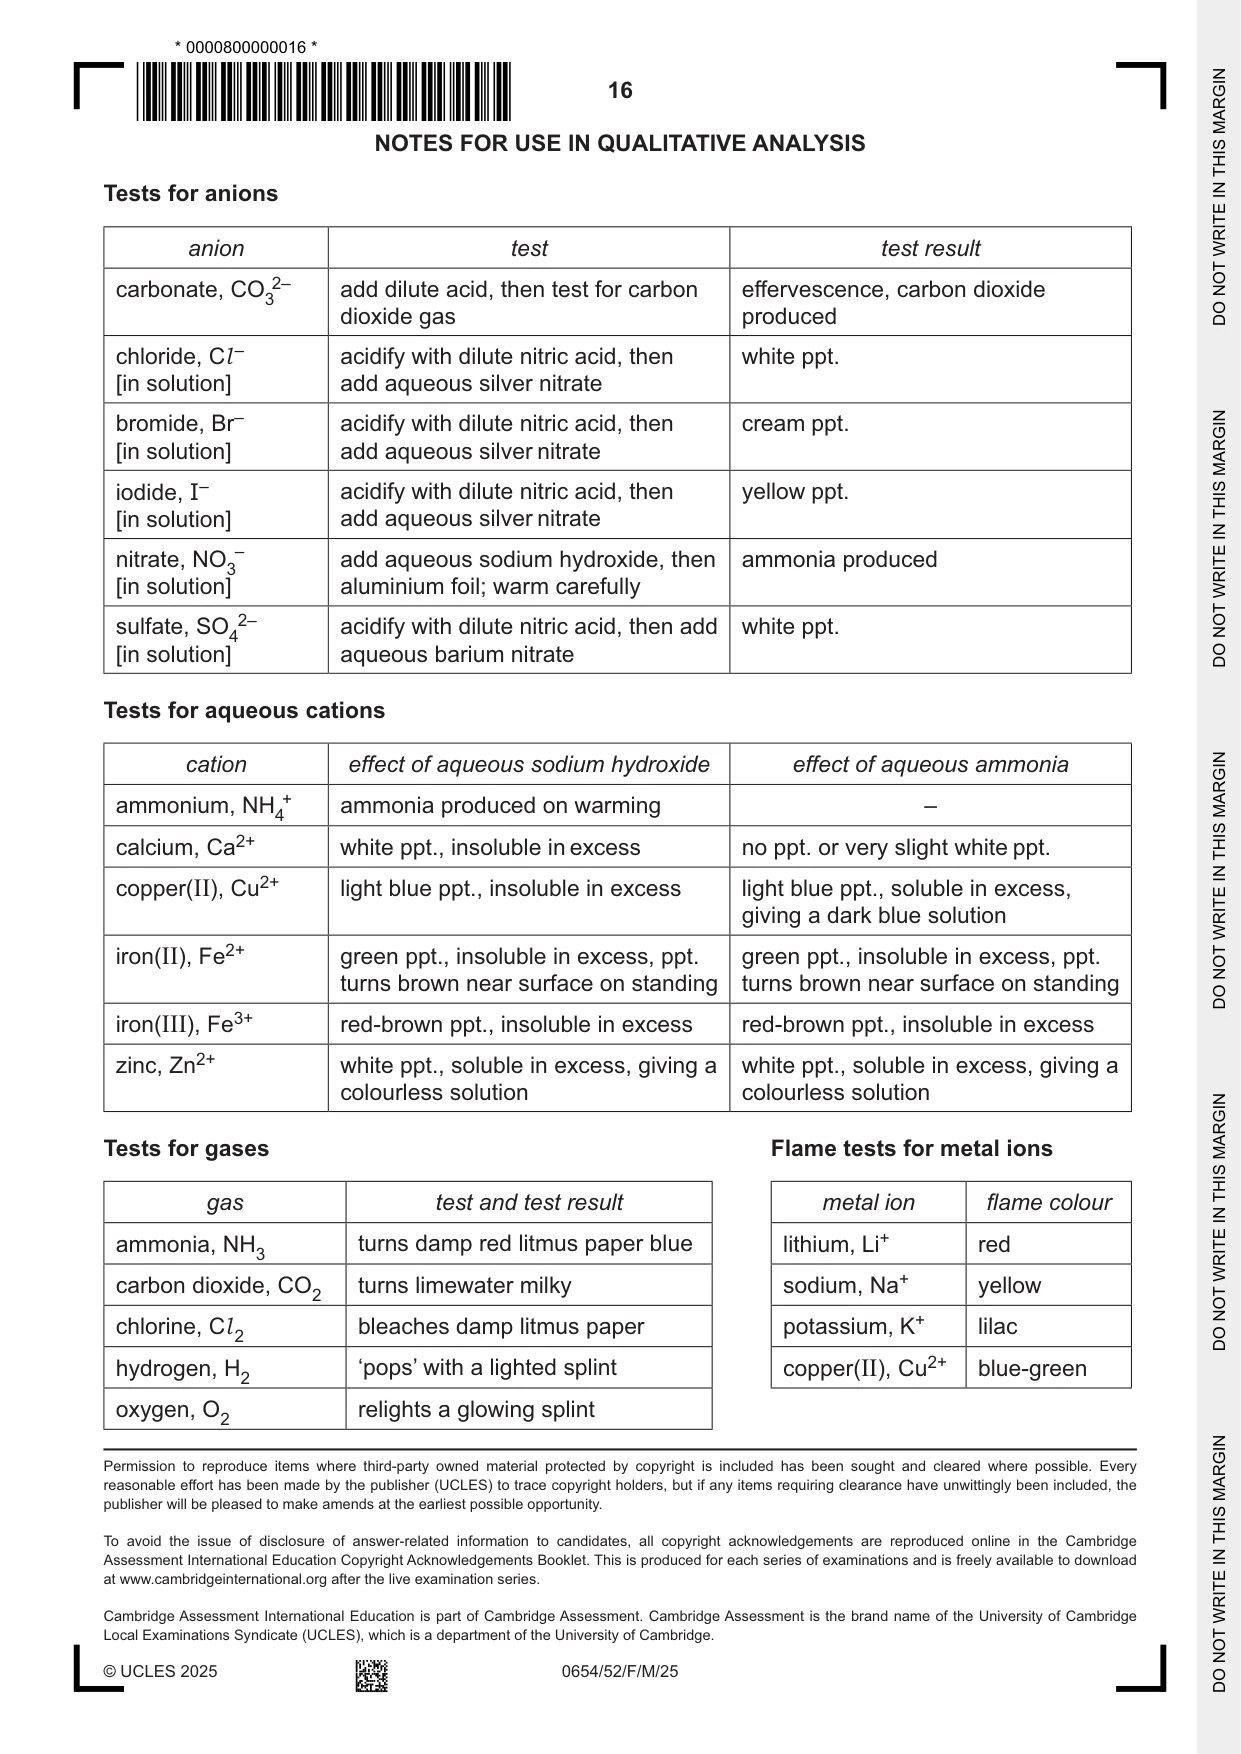
3 You are going to identify solid J and the ions present in solid K and in aqueous L. Solid K and aqueous L contain the same cation. (a) Describe the appearance of J. ................................................................................................................................................... ............................................................................................................................................. [1] (b) Read all of the procedure in (b) before you begin, as you need to test the gas given off and identify it. Procedure • Measure 10 cm3 of water using a measuring cylinder. • Pour the water into a boiling tube. • Add the small pieces of solid J to the water. • Test to identify the gas given off. (i) Describe what happens when J is added to water. ........................................................................................................................................... ........................................................................................................................................... ..................................................................................................................................... [2] (ii) test .................................................................................................................................... observation ........................................................................................................................ identity of gas .................................................................................................................... [2] (c) Procedure • Remove the stopper from one of the boiling tubes of carbon dioxide. • Pour the solution from (b)(i) into the boiling tube of carbon dioxide. • Quickly replace the stopper and shake. Describe what happens to the solution. Identify the solution from (b)(i). description ................................................................................................................................ identity of solution ..................................................................................................................... [1] (d) Procedure • Measure 10 cm3 of water using a measuring cylinder. • Pour the water into a boiling tube and leave to stand. • Put two spatula loads of solid K into a clean dry hard glass test-tube. • Hold the hard glass test-tube with a test-tube holder and heat solid K for about two minutes. • Pour the solid in the hard glass test-tube into the water in the boiling tube. • Stir the mixture in the boiling tube using the glass rod and wait until any solid settles to the bottom of the tube. • Remove the stopper from another boiling tube of carbon dioxide. • Pour the solution into the boiling tube containing carbon dioxide. • Quickly replace the stopper and shake the boiling tube. Describe what happens to the solution. Identify the solution formed. description ................................................................................................................................ identity ...................................................................................................................................... [1] (e) Procedure • Put approximately 2 cm depth of aqueous L into a test-tube. • Slowly add aqueous sodium hydroxide until it is in excess. Describe your observations. ................................................................................................................................................... ............................................................................................................................................. [1] (f) Identify the cation present in both solid K and aqueous L. Identify solid J. cation in K and L ...................................................................................................................... J is ............................................................................................................................................ [1] (g) Do tests to confirm the identity of the anion in aqueous L. Describe the test which gives the observation for a positive result and identify the ion. test ............................................................................................................................................ observation ............................................................................................................................... ion ............................................................................................................................................. [2] (h) Flame tests are often used to identify metal ions. State two reasons why a flame test is done using a blue flame rather than a yellow one. reason 1 .................................................................................................................................... ................................................................................................................................................... reason 2 .................................................................................................................................... ................................................................................................................................................... [2] [Total: 13]
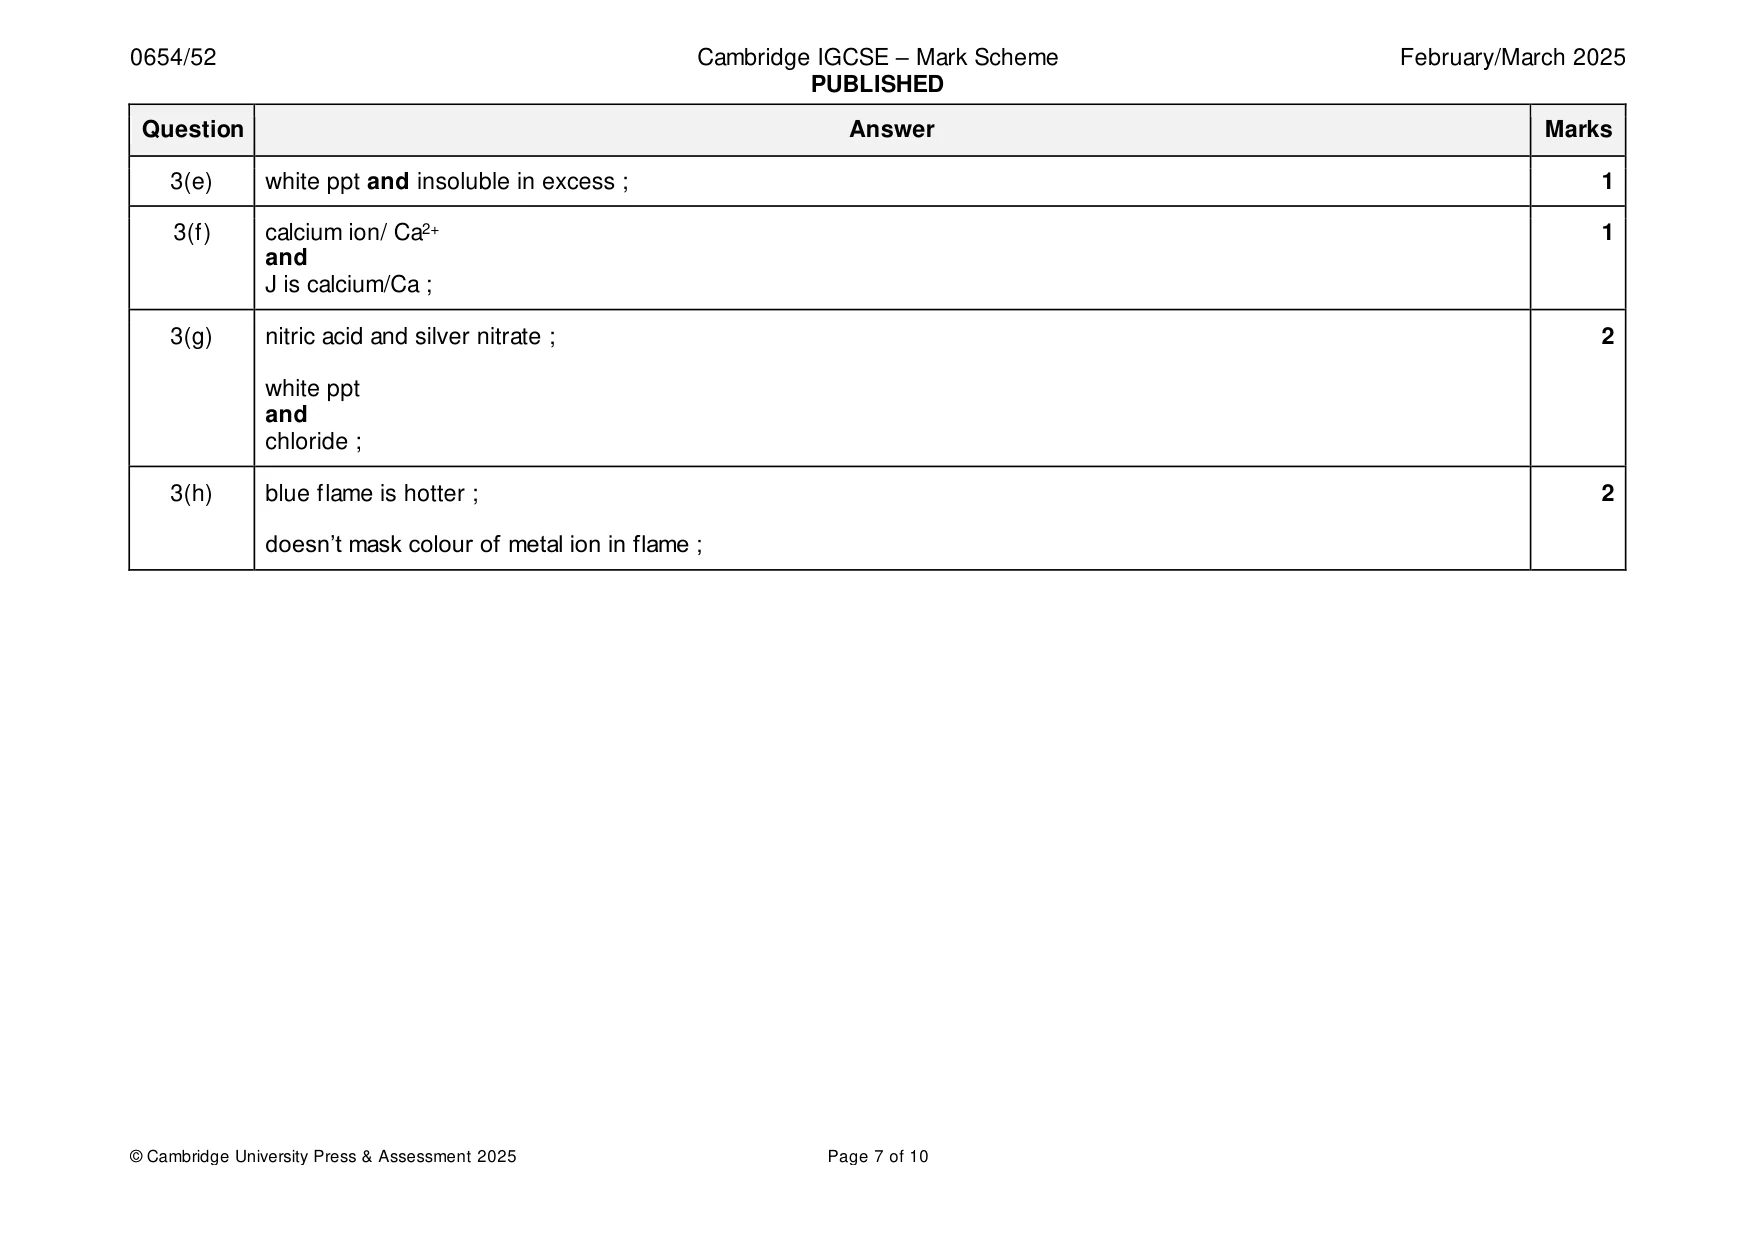
Mark scheme: 3(a) grey and solid : 1 3(b)(i) any two from: 2 effervesces ; moves up and down ; forms a colourless solution ; 3(b)(ii) lighted splint ; 2 pops and hydrogen ; 3(c) white ppt 1 and limewater ; 3(d) white ppt 1 and limewater ; 3(e) white ppt and insoluble in excess ; 1 3(f) calcium ion/ Ca2+ 1 and J is calcium/Ca ; 3(g) nitric acid and silver nitrate ; 2 white ppt and chloride ; 3(h) blue flame is hotter ; 2 doesn’t mask colour of metal ion in flame ;
Q4 · When ammonium sulfate is heated with sodium hydroxide, it reacts to form ammonia gas
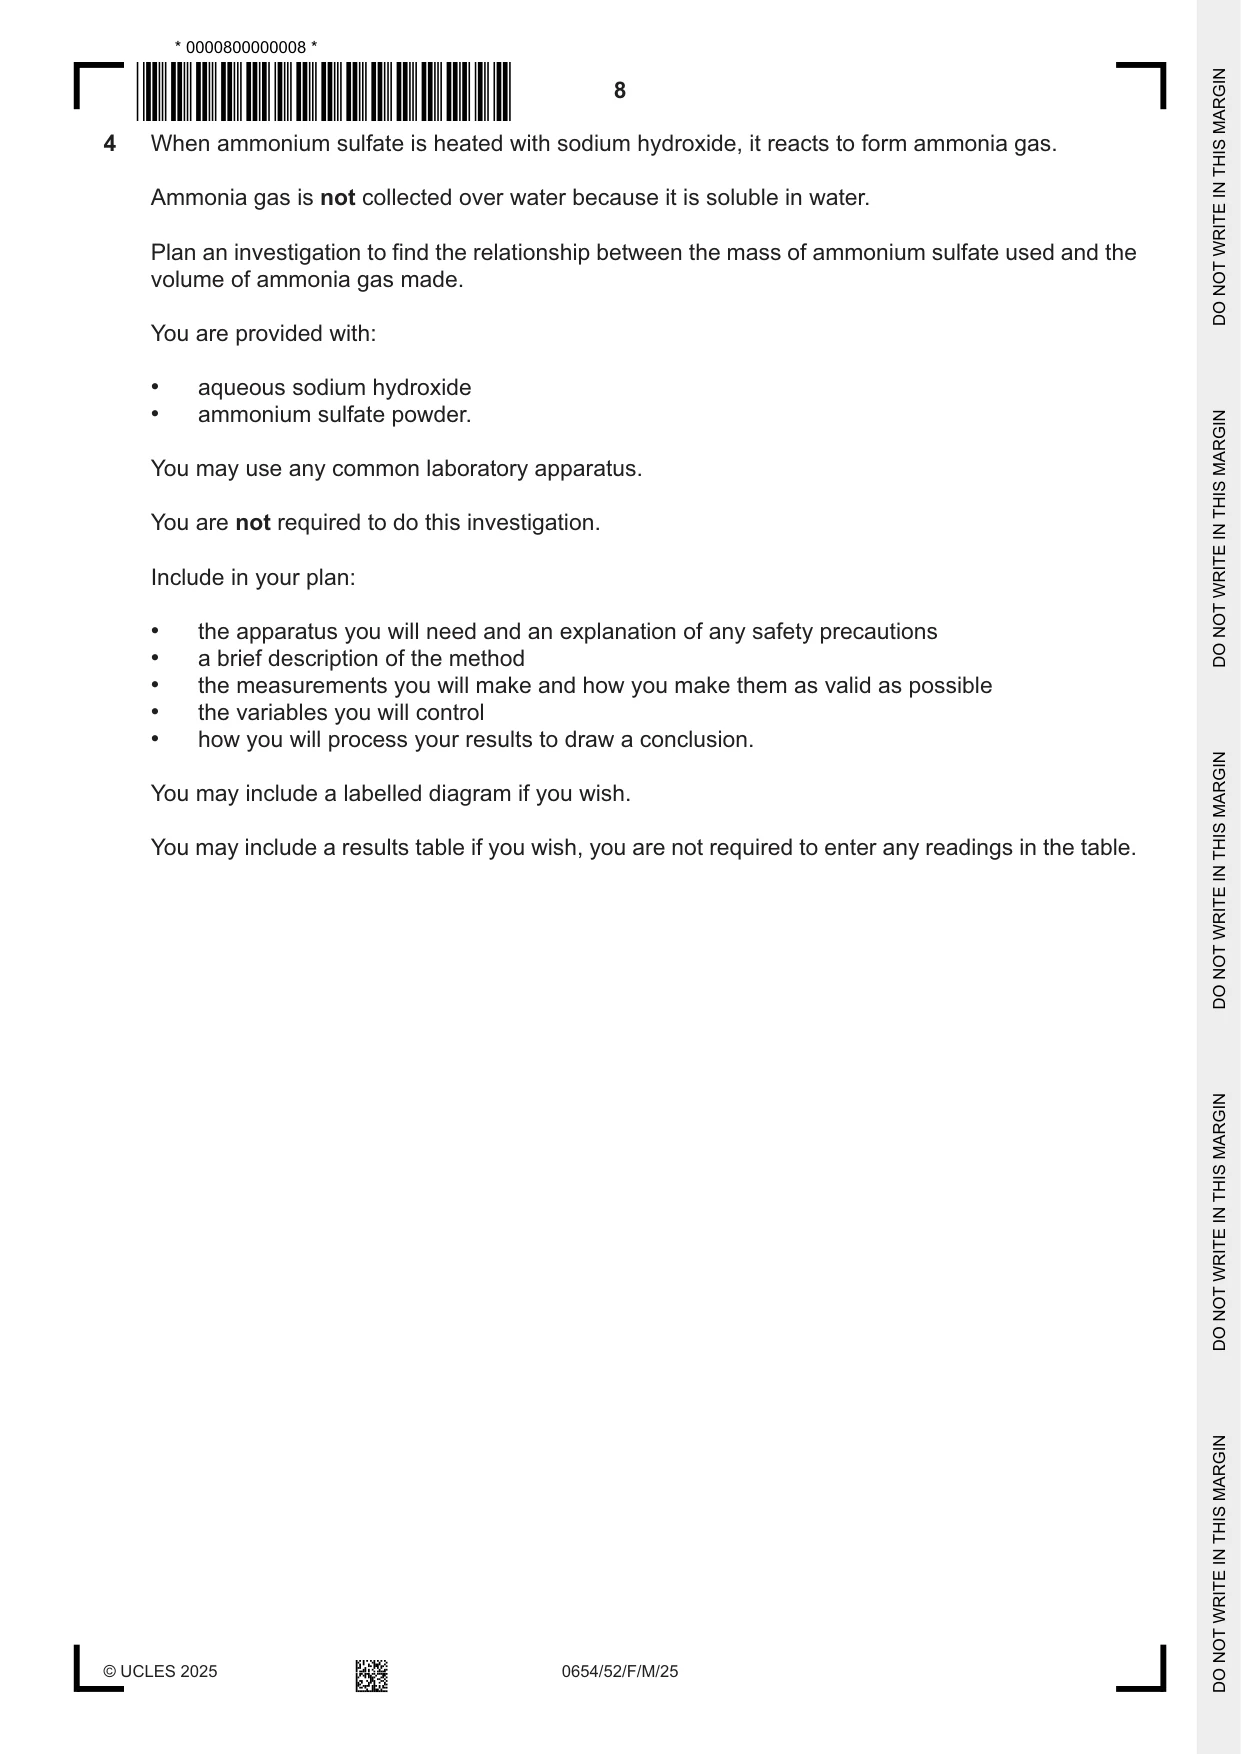
4 When ammonium sulfate is heated with sodium hydroxide, it reacts to form ammonia gas. Ammonia gas is not collected over water because it is soluble in water. Plan an investigation to find the relationship between the mass of ammonium sulfate used and the volume of ammonia gas made. You are provided with: • aqueous sodium hydroxide • ammonium sulfate powder. You may use any common laboratory apparatus. You are not required to do this investigation. Include in your plan: • the apparatus you will need and an explanation of any safety precautions • a brief description of the method • the measurements you will make and how you make them as valid as possible • the variables you will control • how you will process your results to draw a conclusion. You may include a labelled diagram if you wish. You may include a results table if you wish, you are not required to enter any readings in the table. .......................................................................................................................................................... .......................................................................................................................................................... .......................................................................................................................................................... .......................................................................................................................................................... .......................................................................................................................................................... .......................................................................................................................................................... .......................................................................................................................................................... .......................................................................................................................................................... .......................................................................................................................................................... .......................................................................................................................................................... .......................................................................................................................................................... .......................................................................................................................................................... .......................................................................................................................................................... .......................................................................................................................................................... .......................................................................................................................................................... .......................................................................................................................................................... .......................................................................................................................................................... .......................................................................................................................................................... .......................................................................................................................................................... .......................................................................................................................................................... .......................................................................................................................................................... .......................................................................................................................................................... .......................................................................................................................................................... .......................................................................................................................................................... .......................................................................................................................................................... .......................................................................................................................................................... .......................................................................................................................................................... .................................................................................................................................................... [7]
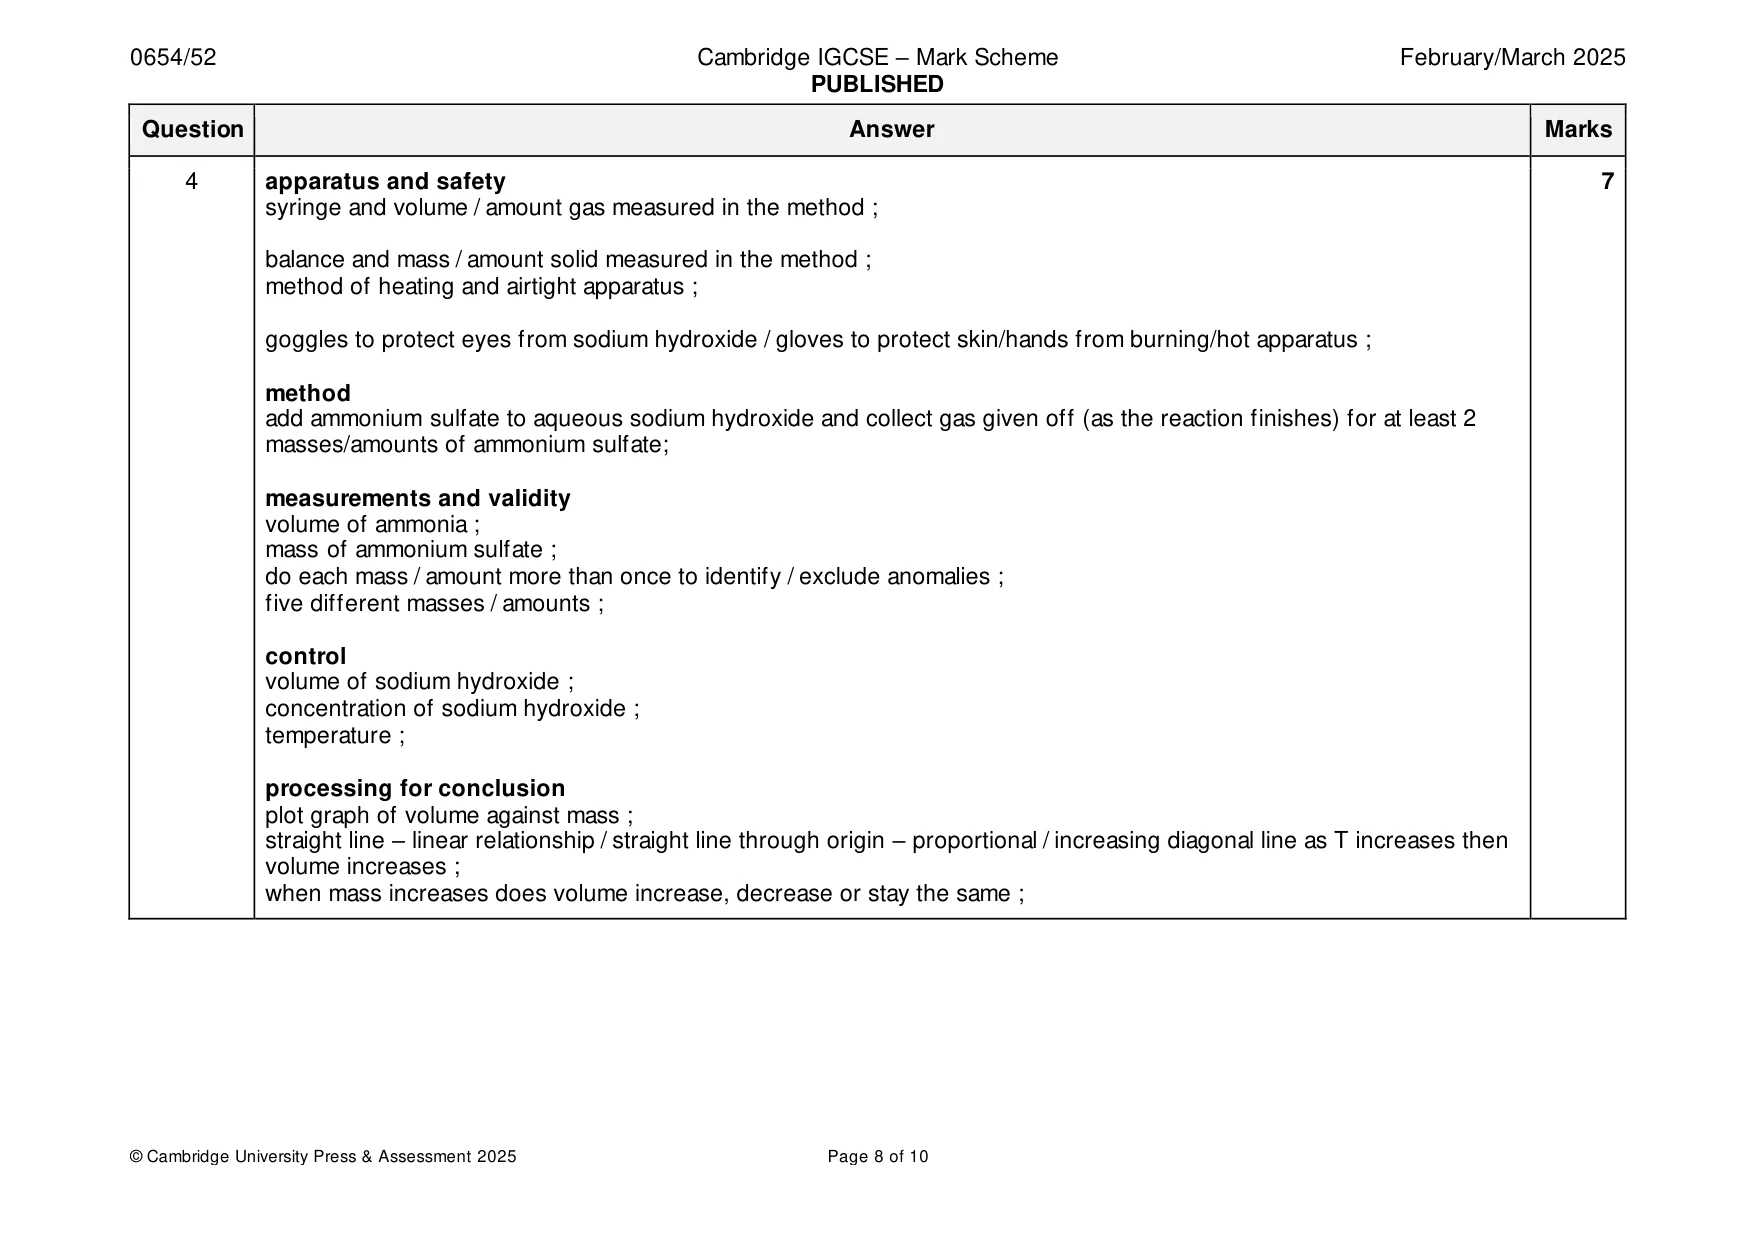
Mark scheme: 4 apparatus and safety 7 syringe and volume / amount gas measured in the method ; balance and mass / amount solid measured in the method ; method of heating and airtight apparatus ; goggles to protect eyes from sodium hydroxide / gloves to protect skin/hands from burning/hot apparatus ; method add ammonium sulfate to aqueous sodium hydroxide and collect gas given off (as the reaction finishes) for at least 2 masses/amounts of ammonium sulfate; measurements and validity volume of ammonia ; mass of ammonium sulfate ; do each mass / amount more than once to identify / exclude anomalies ; five different masses / amounts ; control volume of sodium hydroxide ; concentration of sodium hydroxide ; temperature ; processing for conclusion plot graph of volume against mass ; straight line – linear relationship / straight line through origin – proportional / increasing diagonal line as T increases then volume increases ; when mass increases does volume increase, decrease or stay the same ;
Q5 · You are going to investigate how the stability of a plastic bottle depends on the height…
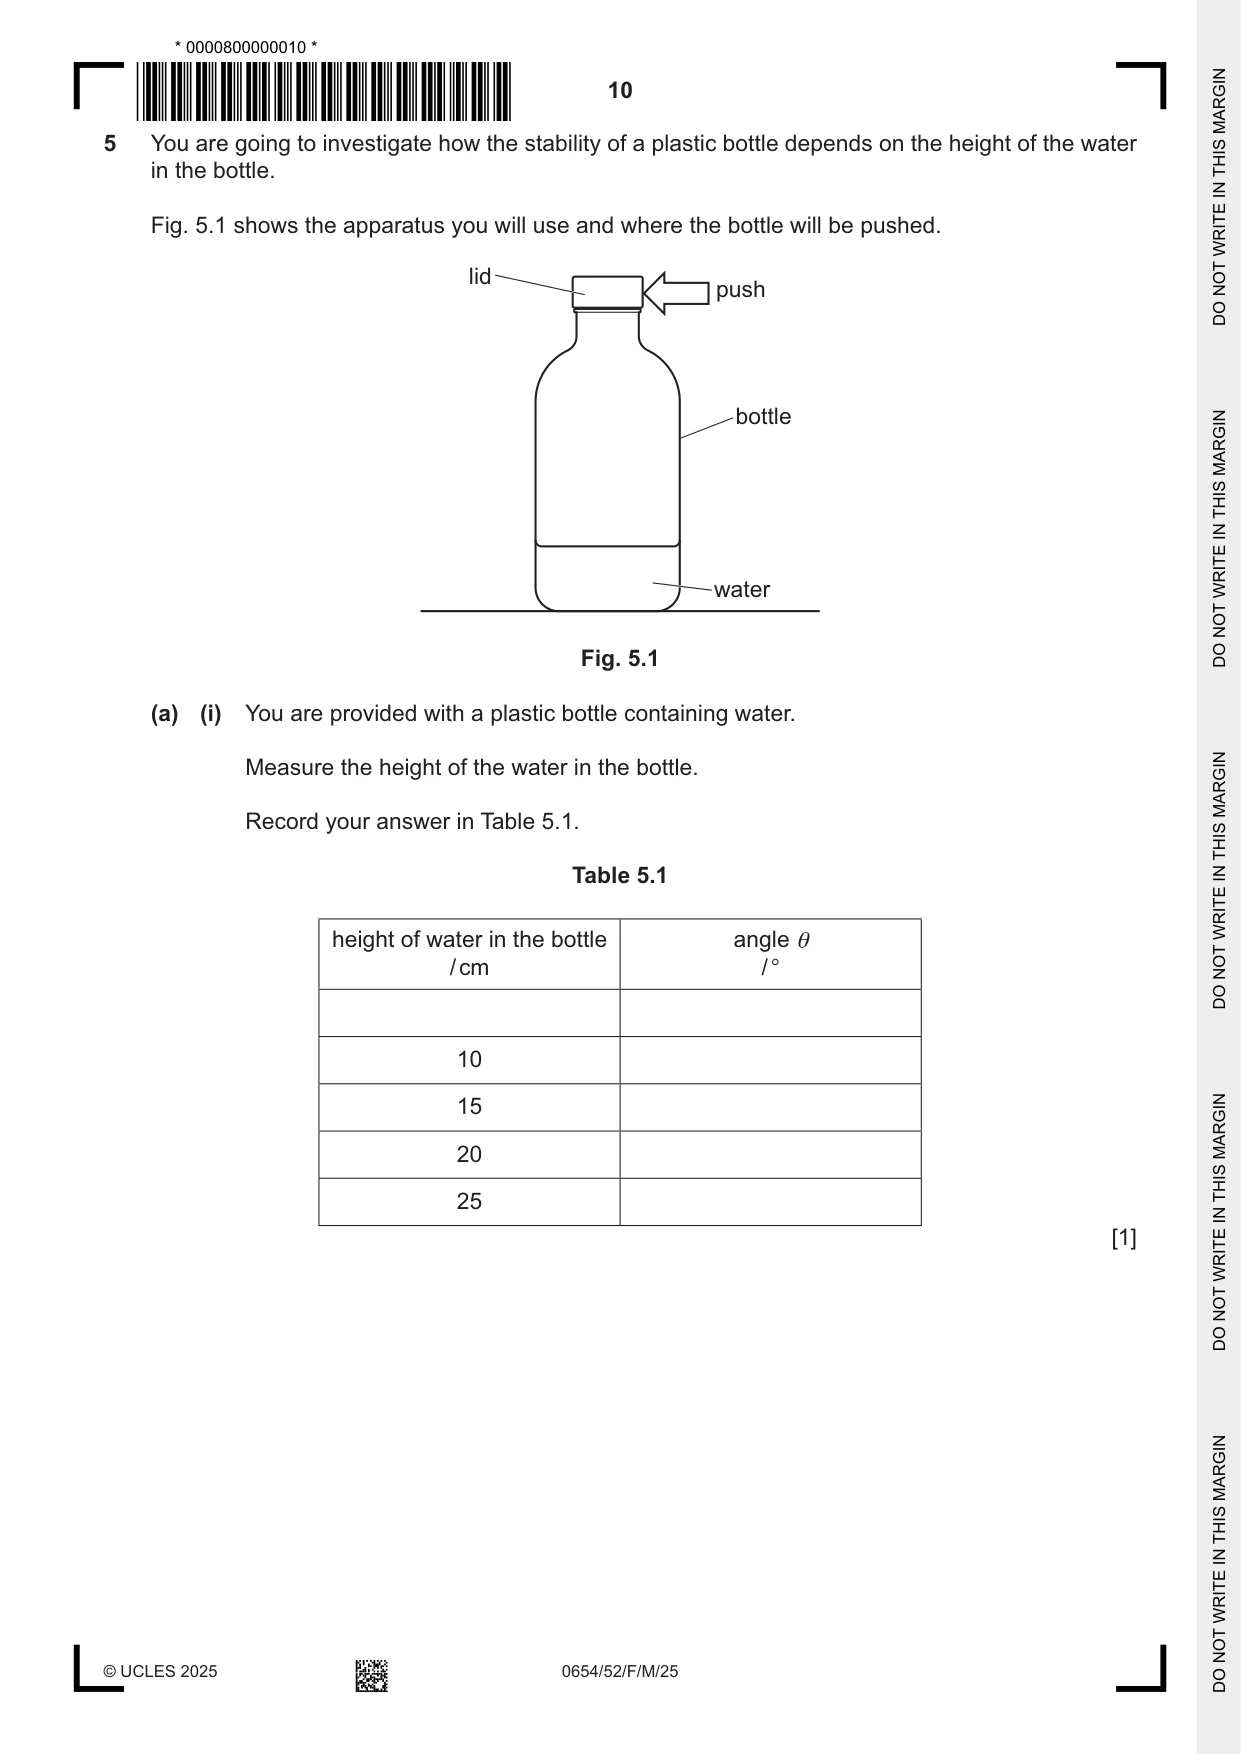
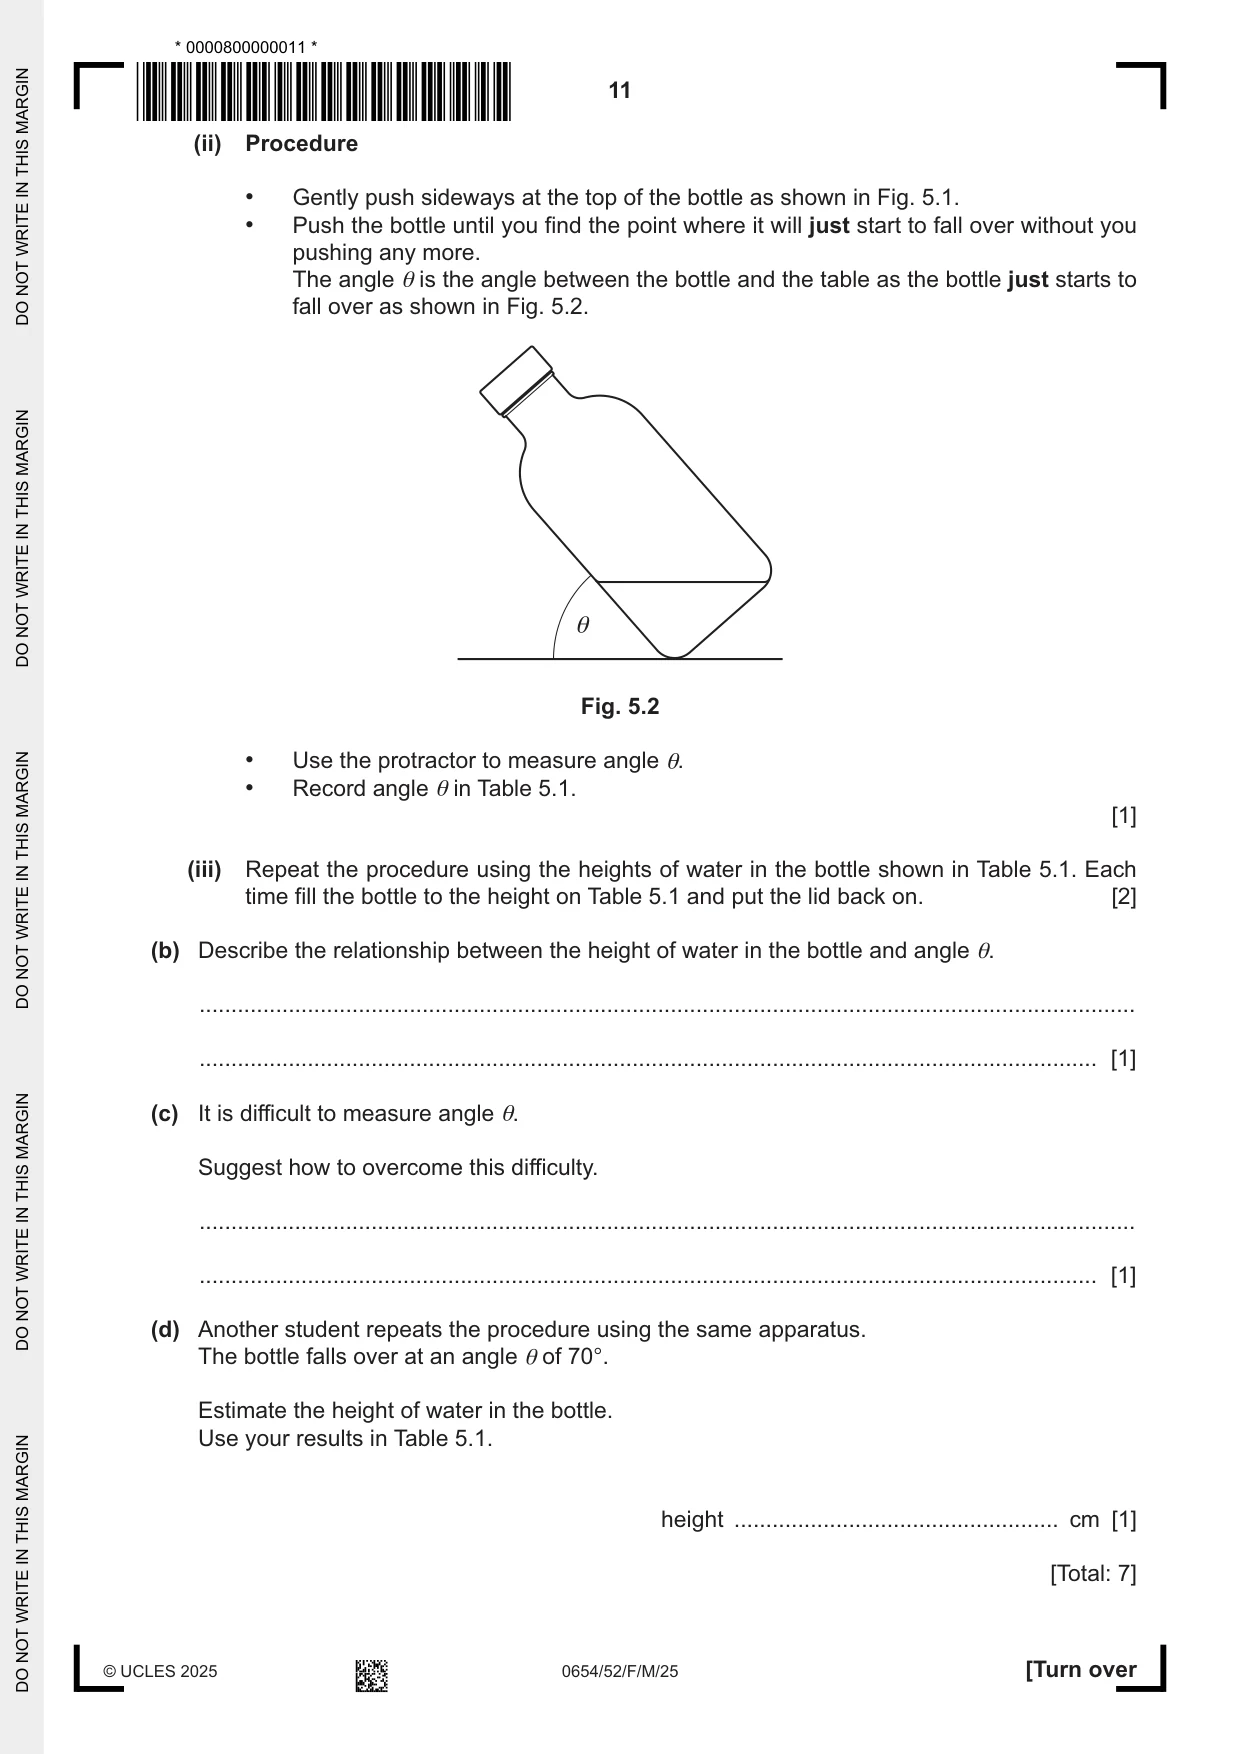
5 You are going to investigate how the stability of a plastic bottle depends on the height of the water in the bottle. Fig. 5.1 shows the apparatus you will use and where the bottle will be pushed. lid push bottle water Fig. 5.1 (a) (i) You are provided with a plastic bottle containing water. Measure the height of the water in the bottle. Record your answer in Table 5.1. Table 5.1 height of water in the bottle angle θ / cm / ° 10 15 20 25 [1] (ii) Procedure • Gently push sideways at the top of the bottle as shown in Fig. 5.1. • Push the bottle until you find the point where it will just start to fall over without you pushing any more. The angle θ is the angle between the bottle and the table as the bottle just starts to fall over as shown in Fig. 5.2. θ Fig. 5.2 • Use the protractor to measure angle θ. • Record angle θ in Table 5.1. [1] (iii) Repeat the procedure using the heights of water in the bottle shown in Table 5.1. Each time fill the bottle to the height on Table 5.1 and put the lid back on. [2] (b) Describe the relationship between the height of water in the bottle and angle θ. ................................................................................................................................................... ............................................................................................................................................. [1] (c) It is difficult to measure angle θ. Suggest how to overcome this difficulty. ................................................................................................................................................... ............................................................................................................................................. [1] (d) Another student repeats the procedure using the same apparatus. The bottle falls over at an angle θ of 70°. Estimate the height of water in the bottle. Use your results in Table 5.1. height ................................................... cm [1] [Total: 7]
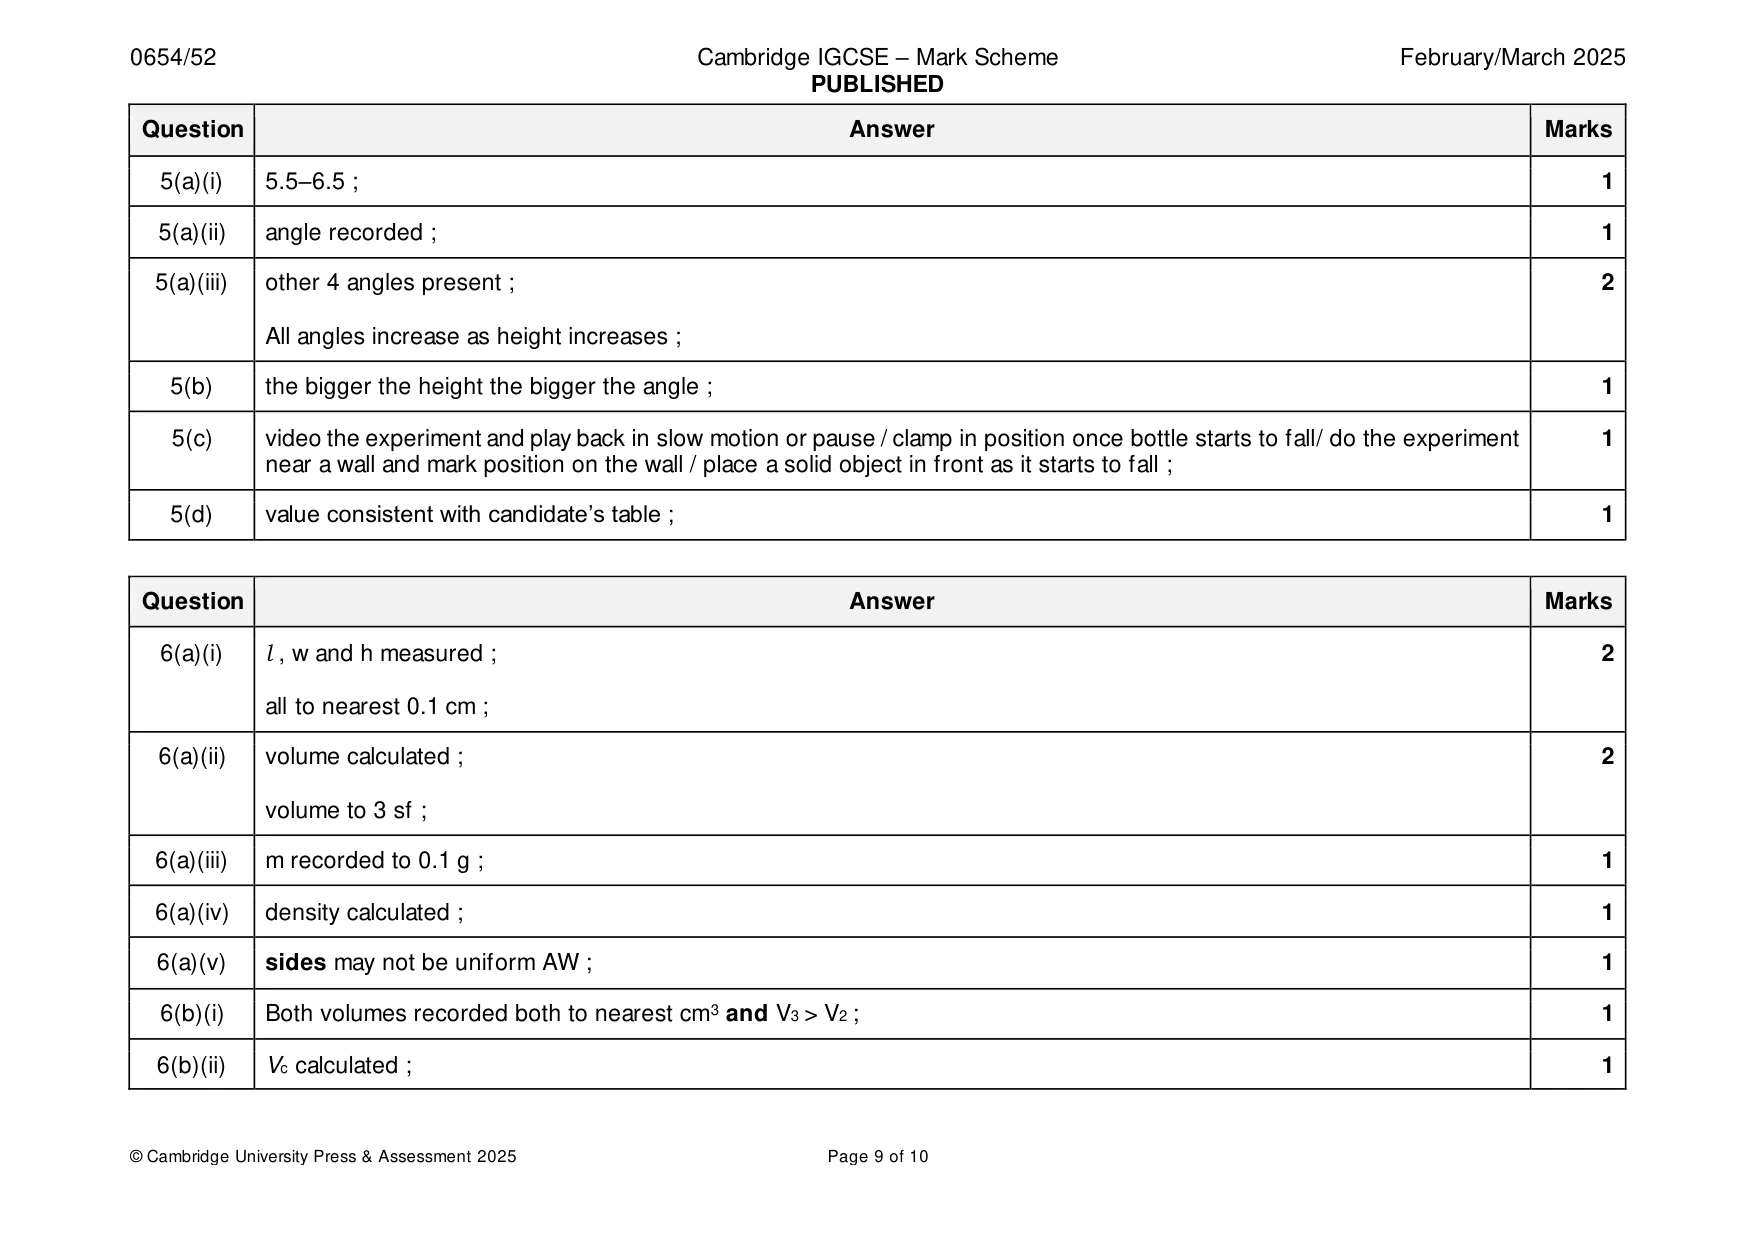
Mark scheme: 5(a)(i) 5.5–6.5 ; 1 5(a)(ii) angle recorded ; 1 5(a)(iii) other 4 angles present ; 2 All angles increase as height increases ; 5(b) the bigger the height the bigger the angle ; 1 5(c) video the experiment and play back in slow motion or pause / clamp in position once bottle starts to fall/ do the experiment 1 near a wall and mark position on the wall / place a solid object in front as it starts to fall ; 5(d) value consistent with candidate’s table ; 1
More questions on Physical quantities and measurement techniques
Q6 · You are going to determine the density of modelling clay using two different methods
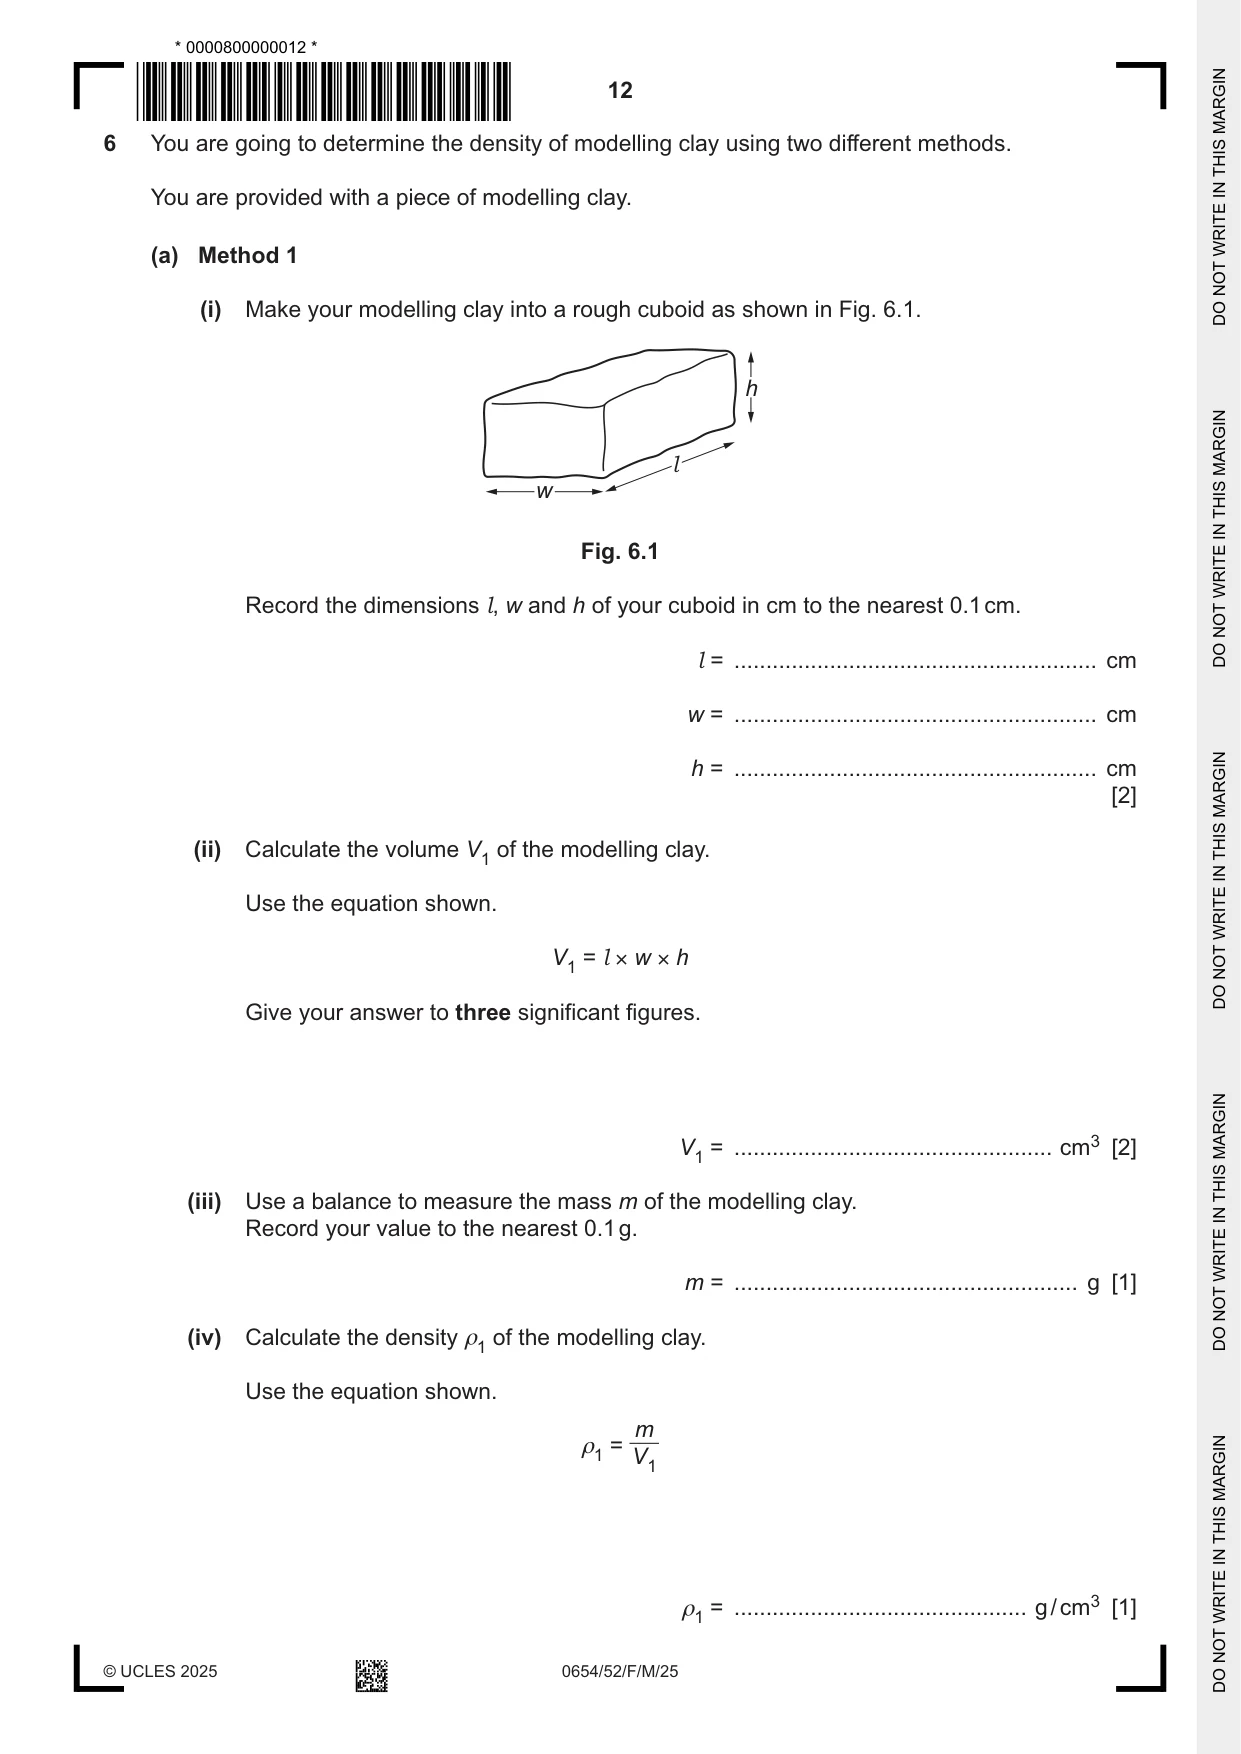
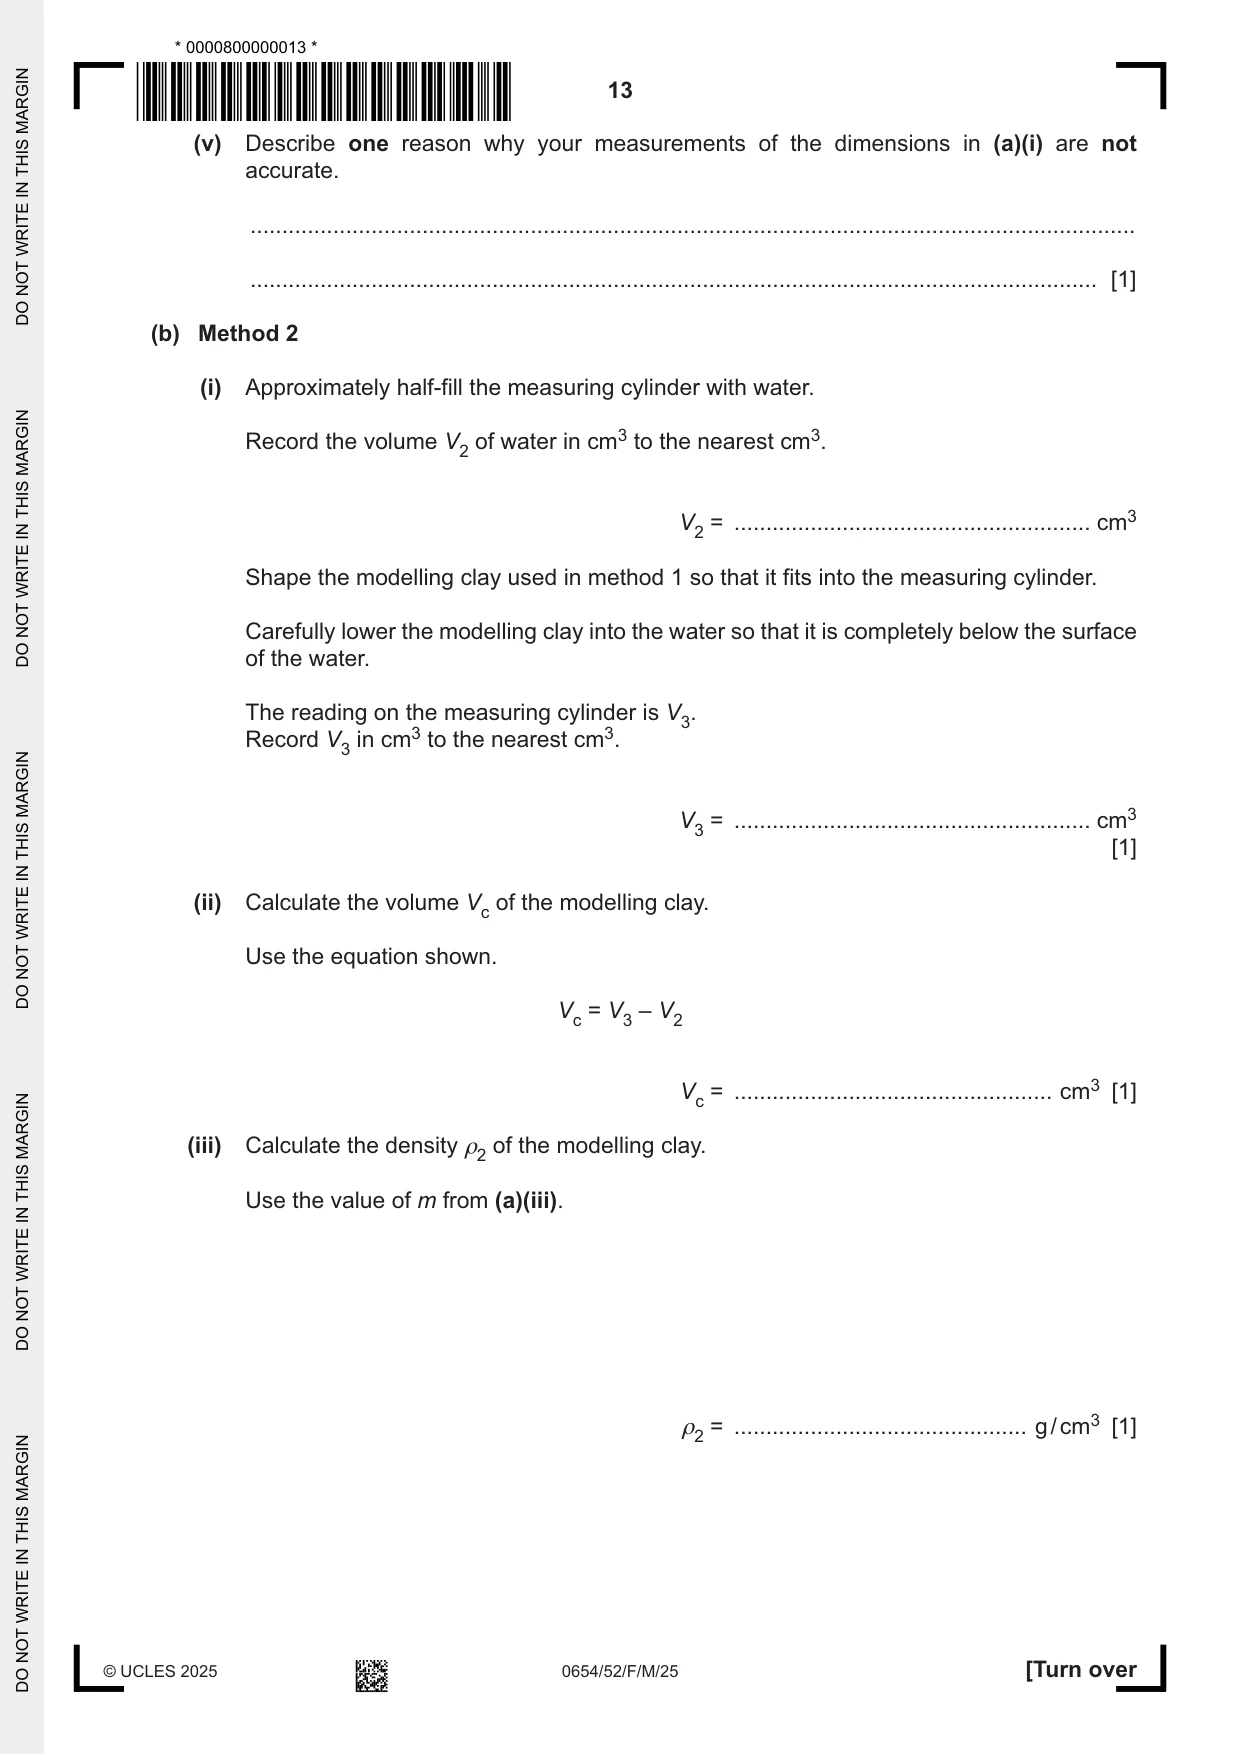
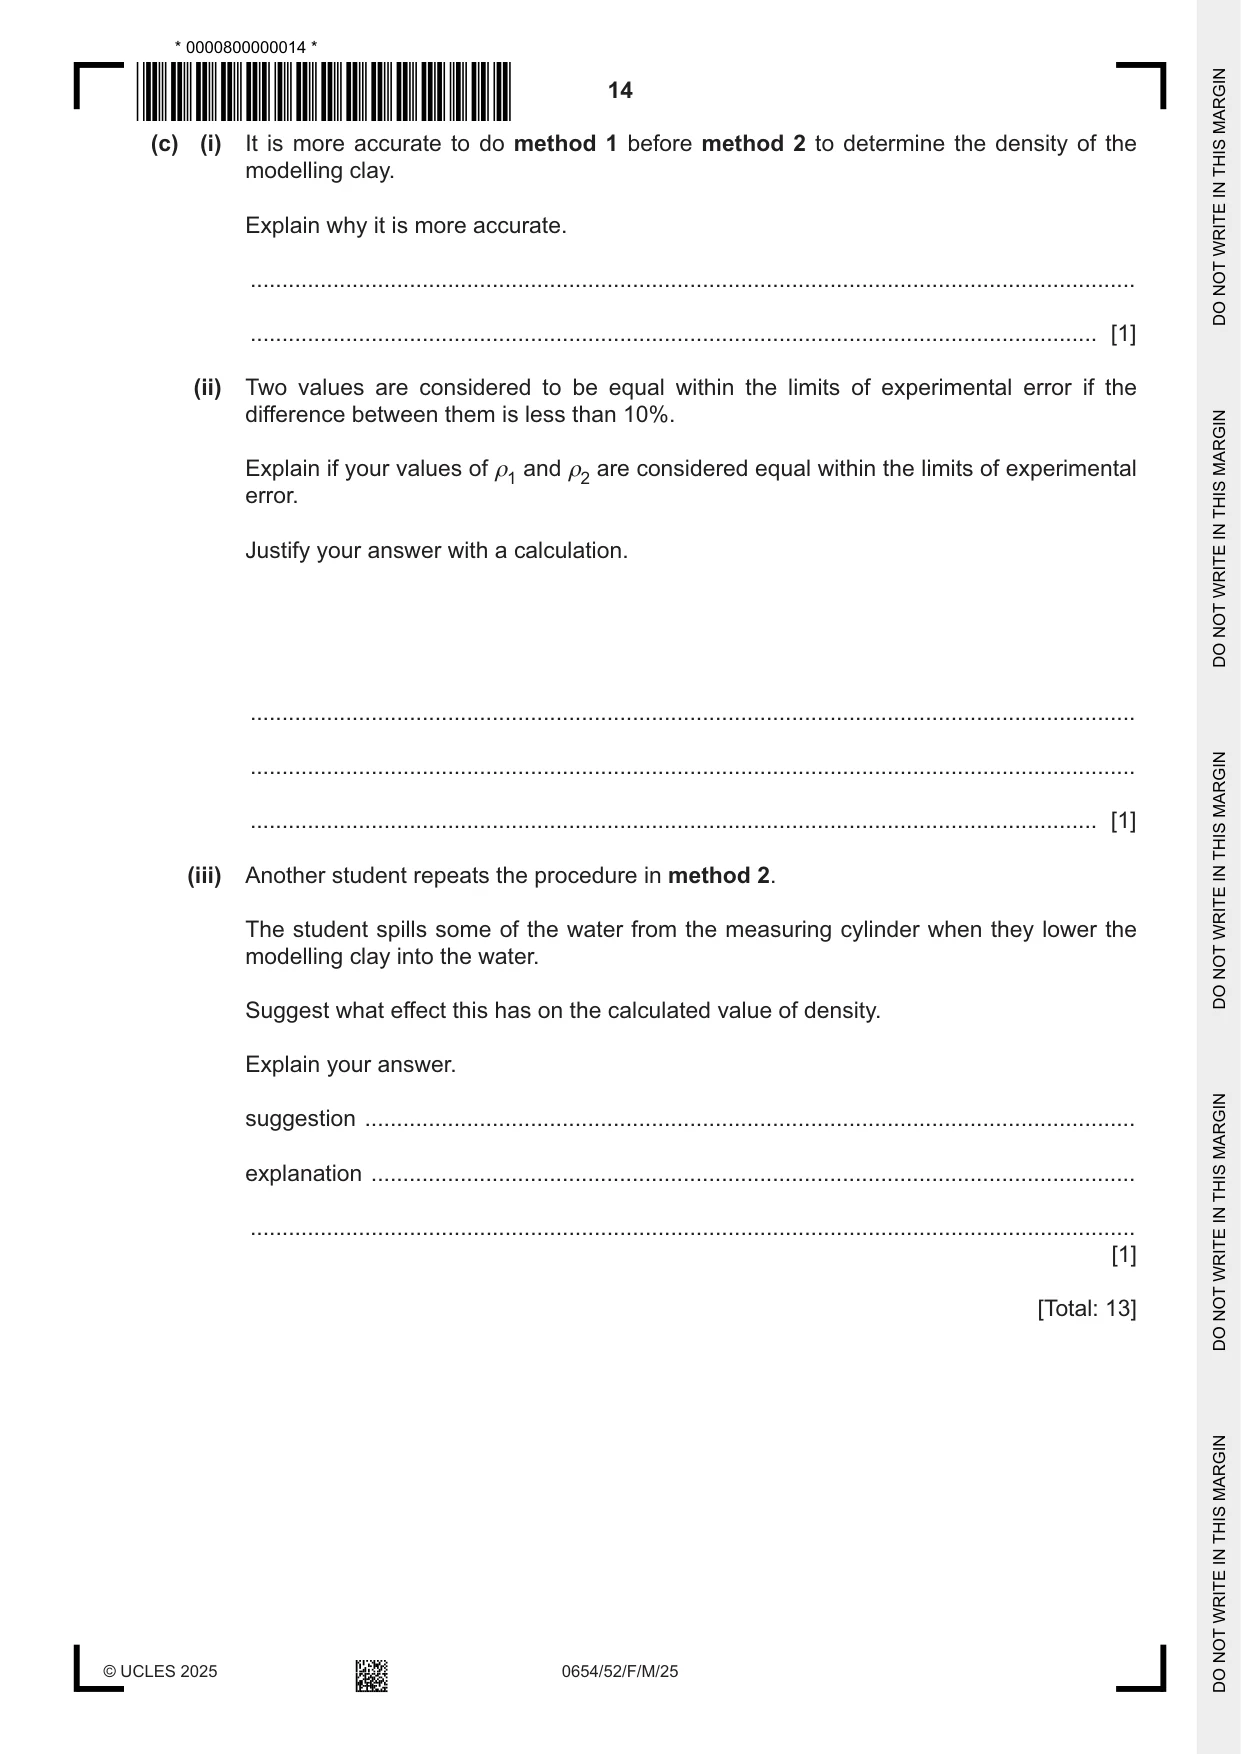
6 You are going to determine the density of modelling clay using two different methods. You are provided with a piece of modelling clay. (a) Method 1 (i) Make your modelling clay into a rough cuboid as shown in Fig. 6.1. h l w Fig. 6.1 Record the dimensions l, w and h of your cuboid in cm to the nearest 0.1 cm. l = ......................................................... cm w = ......................................................... cm h = ......................................................... cm [2] (ii) Calculate the volume V1 of the modelling clay. Use the equation shown. V1 = l × w × h Give your answer to three significant figures. V1 = .................................................. cm3 [2] (iii) Use a balance to measure the mass m of the modelling clay. Record your value to the nearest 0.1 g. m = ...................................................... g [1] (iv) Calculate the density ρ1 of the modelling clay. Use the equation shown. m ρ1 = V1 ρ1 = .............................................. g / cm3 [1] (v) Describe one reason why your measurements of the dimensions in (a)(i) are not accurate. ........................................................................................................................................... ..................................................................................................................................... [1] (b) Method 2 (i) Approximately half-fill the measuring cylinder with water. Record the volume V2 of water in cm3 to the nearest cm3. V2 = ........................................................ cm3 Shape the modelling clay used in method 1 so that it fits into the measuring cylinder. Carefully lower the modelling clay into the water so that it is completely below the surface of the water. The reading on the measuring cylinder is V3. Record V3 in cm3 to the nearest cm3. V3 = ........................................................ cm3 [1] (ii) Calculate the volume Vc of the modelling clay. Use the equation shown. Vc = V3 – V2 Vc = .................................................. cm3 [1] (iii) Calculate the density ρ2 of the modelling clay. Use the value of m from (a)(iii). ρ2 = .............................................. g / cm3 [1] (c) (i) It is more accurate to do method 1 before method 2 to determine the density of the modelling clay. Explain why it is more accurate. ........................................................................................................................................... ..................................................................................................................................... [1] (ii) Two values are considered to be equal within the limits of experimental error if the difference between them is less than 10%. Explain if your values of ρ1 and ρ2 are considered equal within the limits of experimental error. Justify your answer with a calculation. ........................................................................................................................................... ........................................................................................................................................... ..................................................................................................................................... [1] (iii) Another student repeats the procedure in method 2. The student spills some of the water from the measuring cylinder when they lower the modelling clay into the water. Suggest what effect this has on the calculated value of density. Explain your answer. suggestion ......................................................................................................................... explanation ........................................................................................................................ ........................................................................................................................................... [1] [Total: 13]
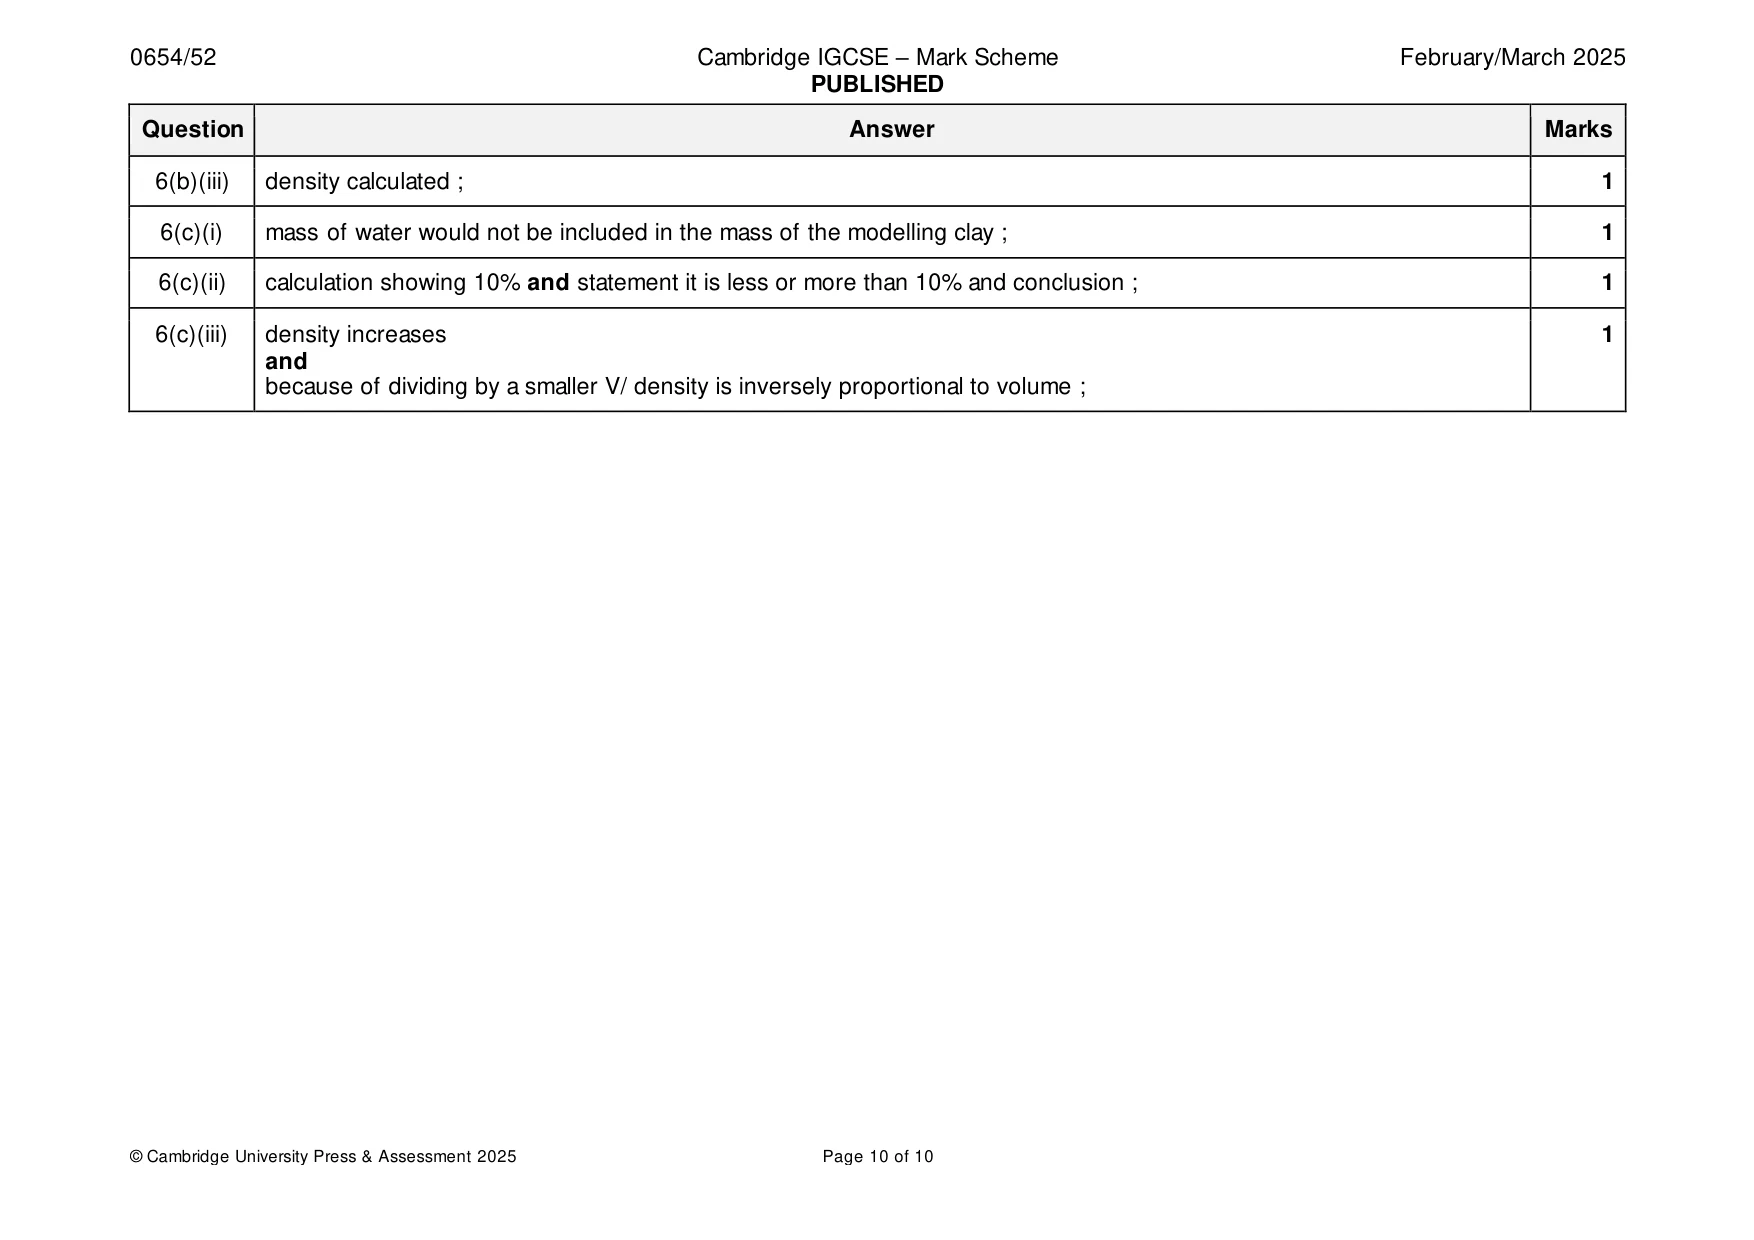
Mark scheme: 6(a)(i) l , w and h measured ; 2 all to nearest 0.1 cm ; 6(a)(ii) volume calculated ; 2 volume to 3 sf ; 6(a)(iii) m recorded to 0.1 g ; 1 6(a)(iv) density calculated ; 1 6(a)(v) sides may not be uniform AW ; 1 6(b)(i) Both volumes recorded both to nearest cm3 and V3 > V2 ; 1 6(b)(ii) Vc calculated ; 1 6(b)(iii) density calculated ; 1 6(c)(i) mass of water would not be included in the mass of the modelling clay ; 1 6(c)(ii) calculation showing 10% and statement it is less or more than 10% and conclusion ; 1 6(c)(iii) density increases 1 and because of dividing by a smaller V/ density is inversely proportional to volume ;
What was in this paper
The subtopics covered by these 6 questions, and how many questions each got. Open one in a new tab to see every Cambridge question on it.
What you needed in this session
Cambridge’s own grade thresholds for 2025 Feb/March, Paper 5 · Variant 2. A higher threshold means an easier paper — the bar moves with how the cohort did.