Cambridge IGCSE Sciences - Co-ordinated (Double) 0654 — 2025 May/June Paper 5 · Variant 1
0654/51/M/J/25 · 6 questions · 60 marks · 120 min
The question paper and its mark scheme, free to read here and free to download. This is Cambridge’s own paper, exactly as it was sat.
Question paper24 pages





Mark scheme11 pages
Answers below. Sit the paper first if you are practising.
Questions as text
Q1 · You are going to investigate diffusion in animals
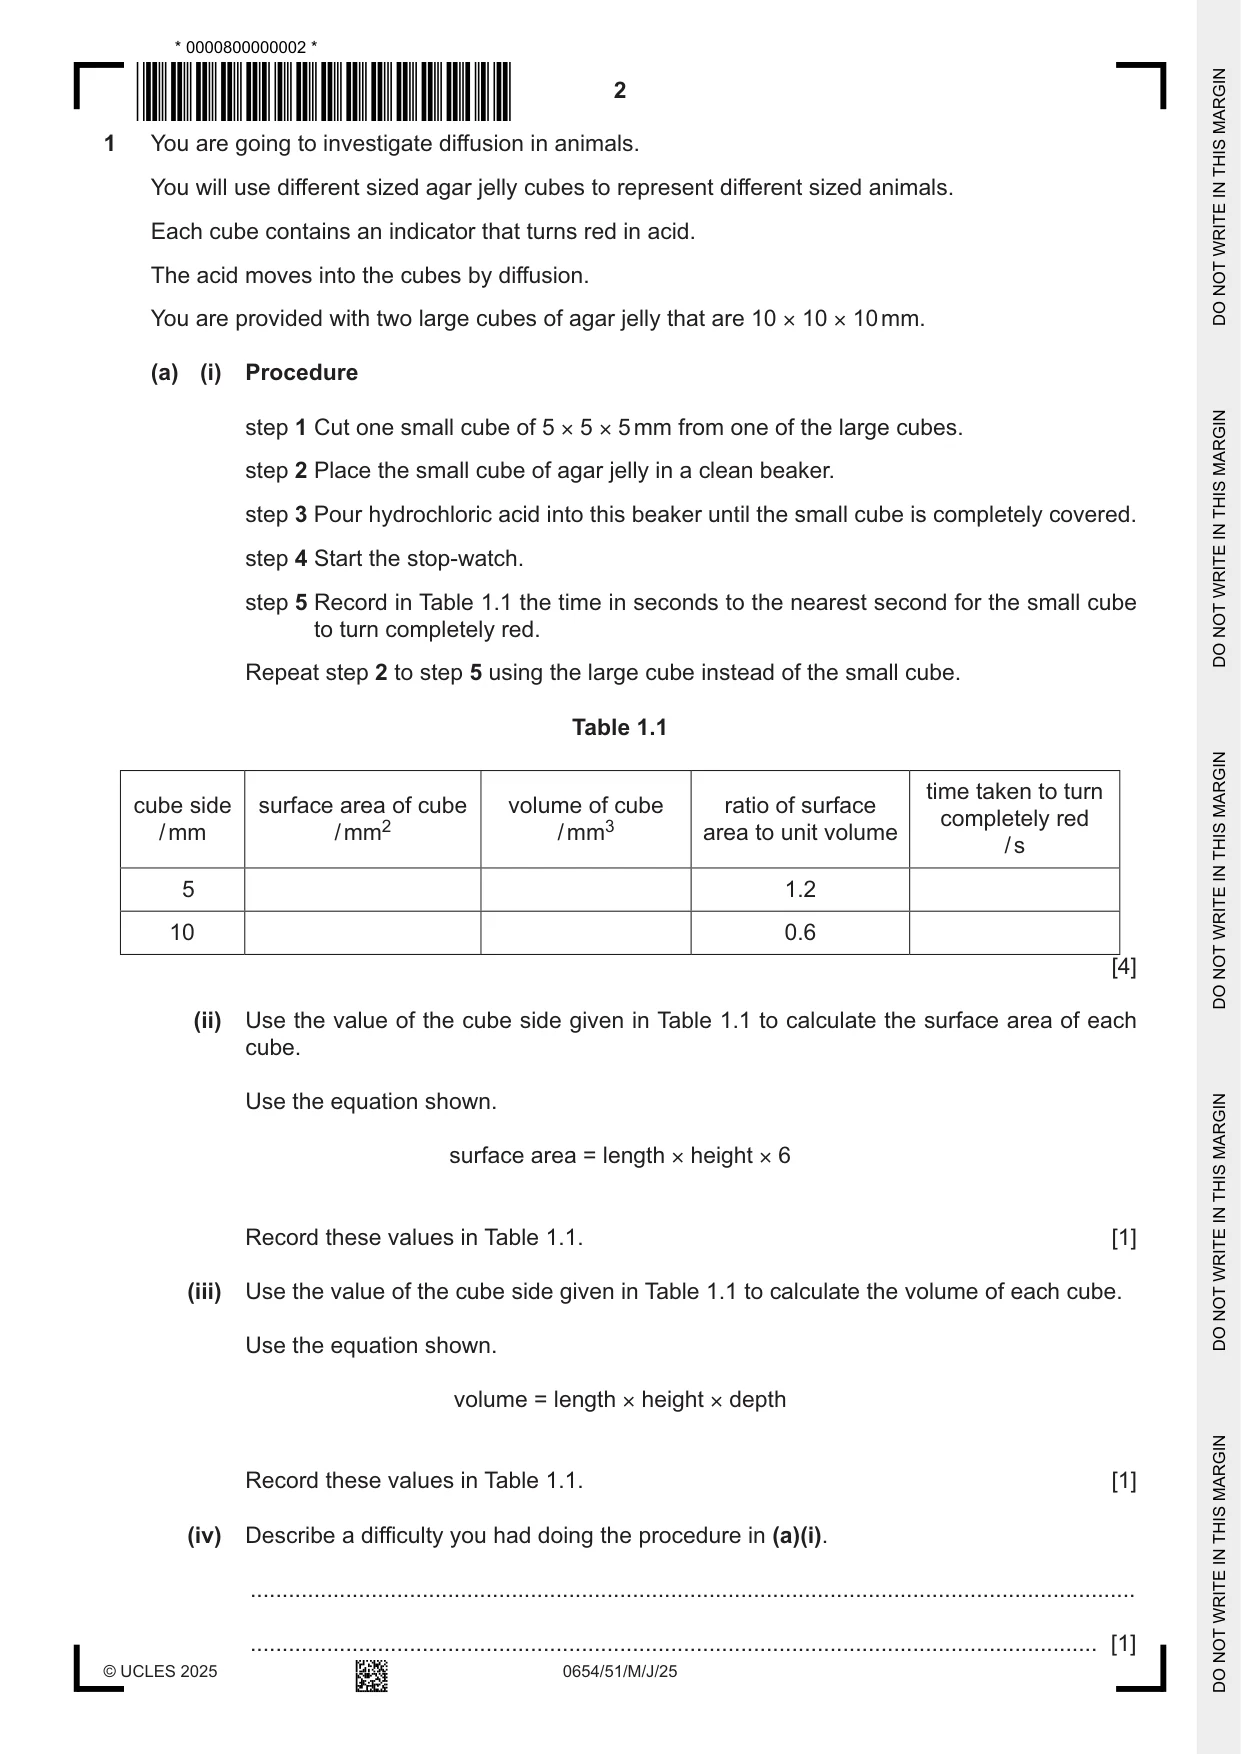
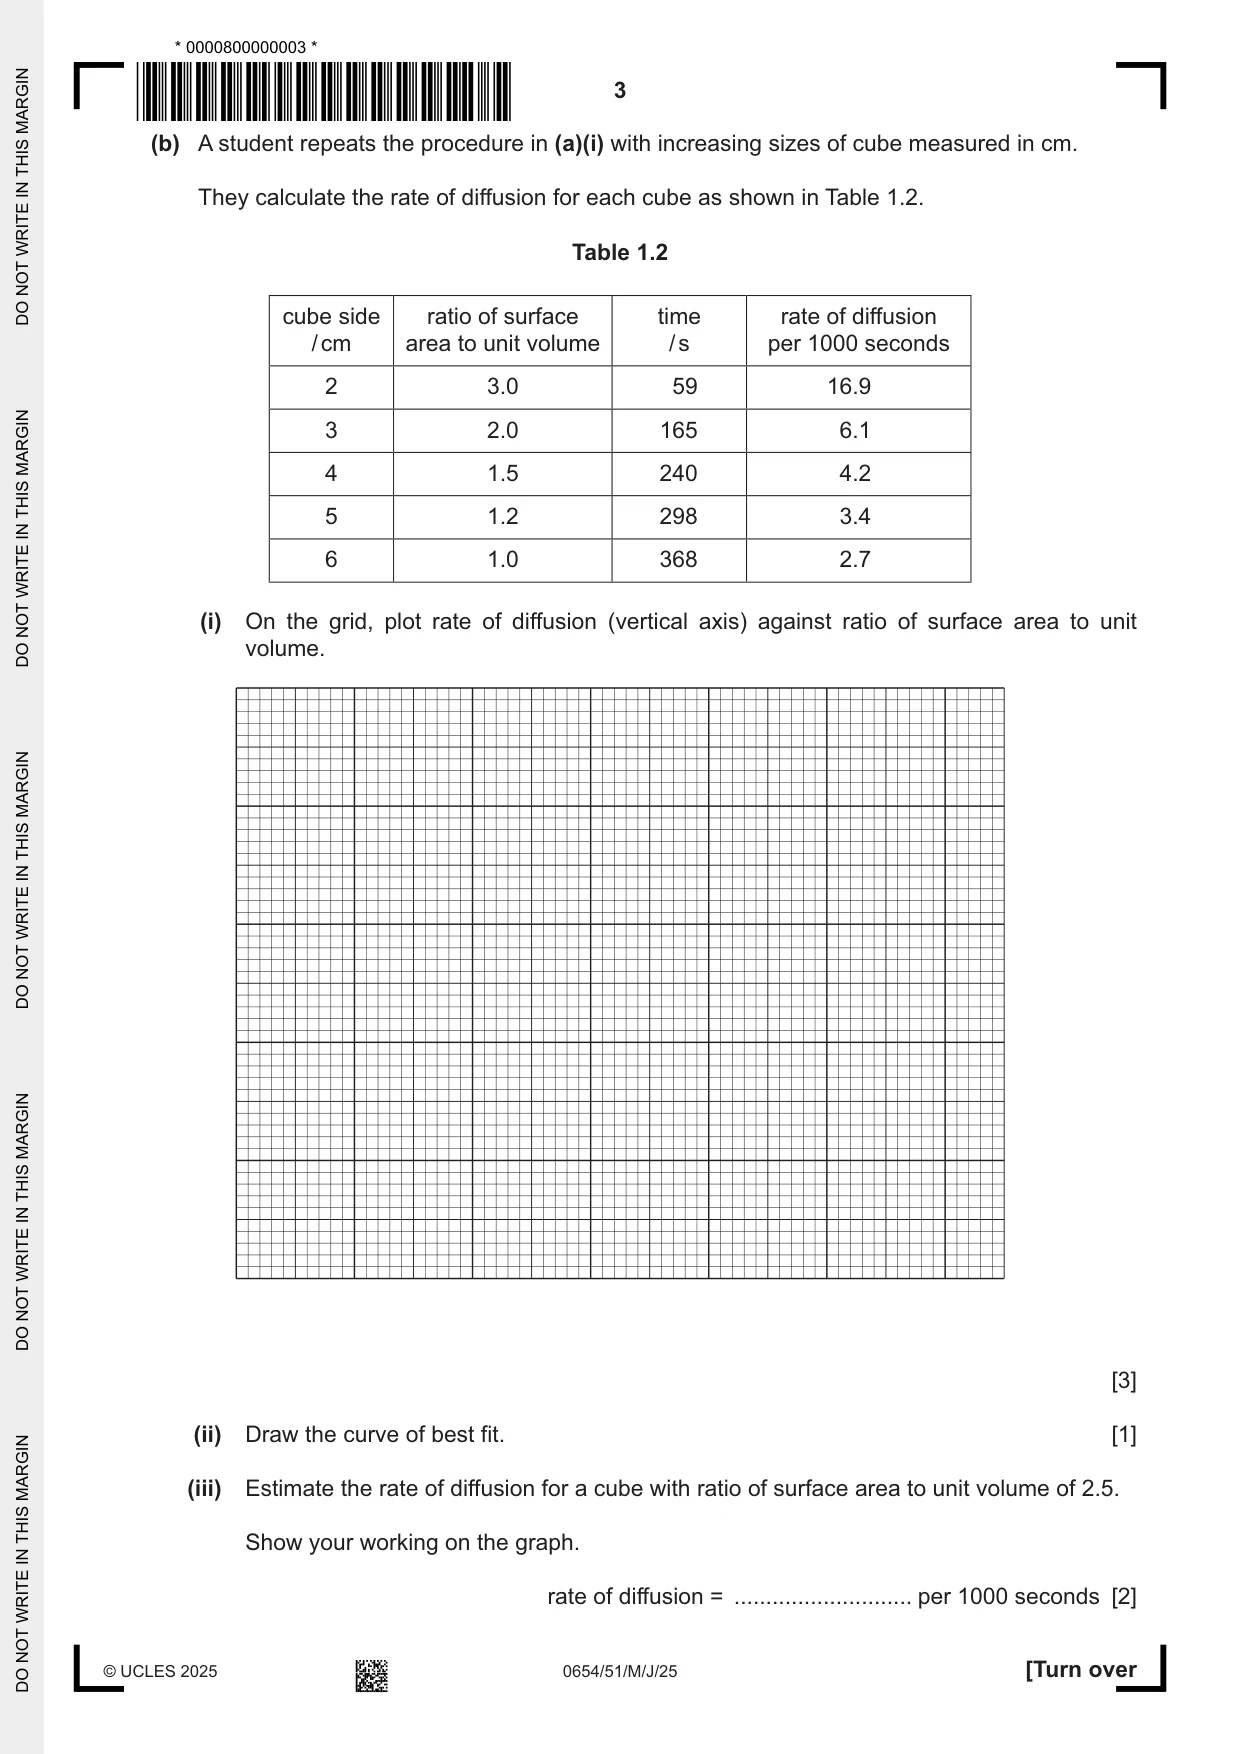
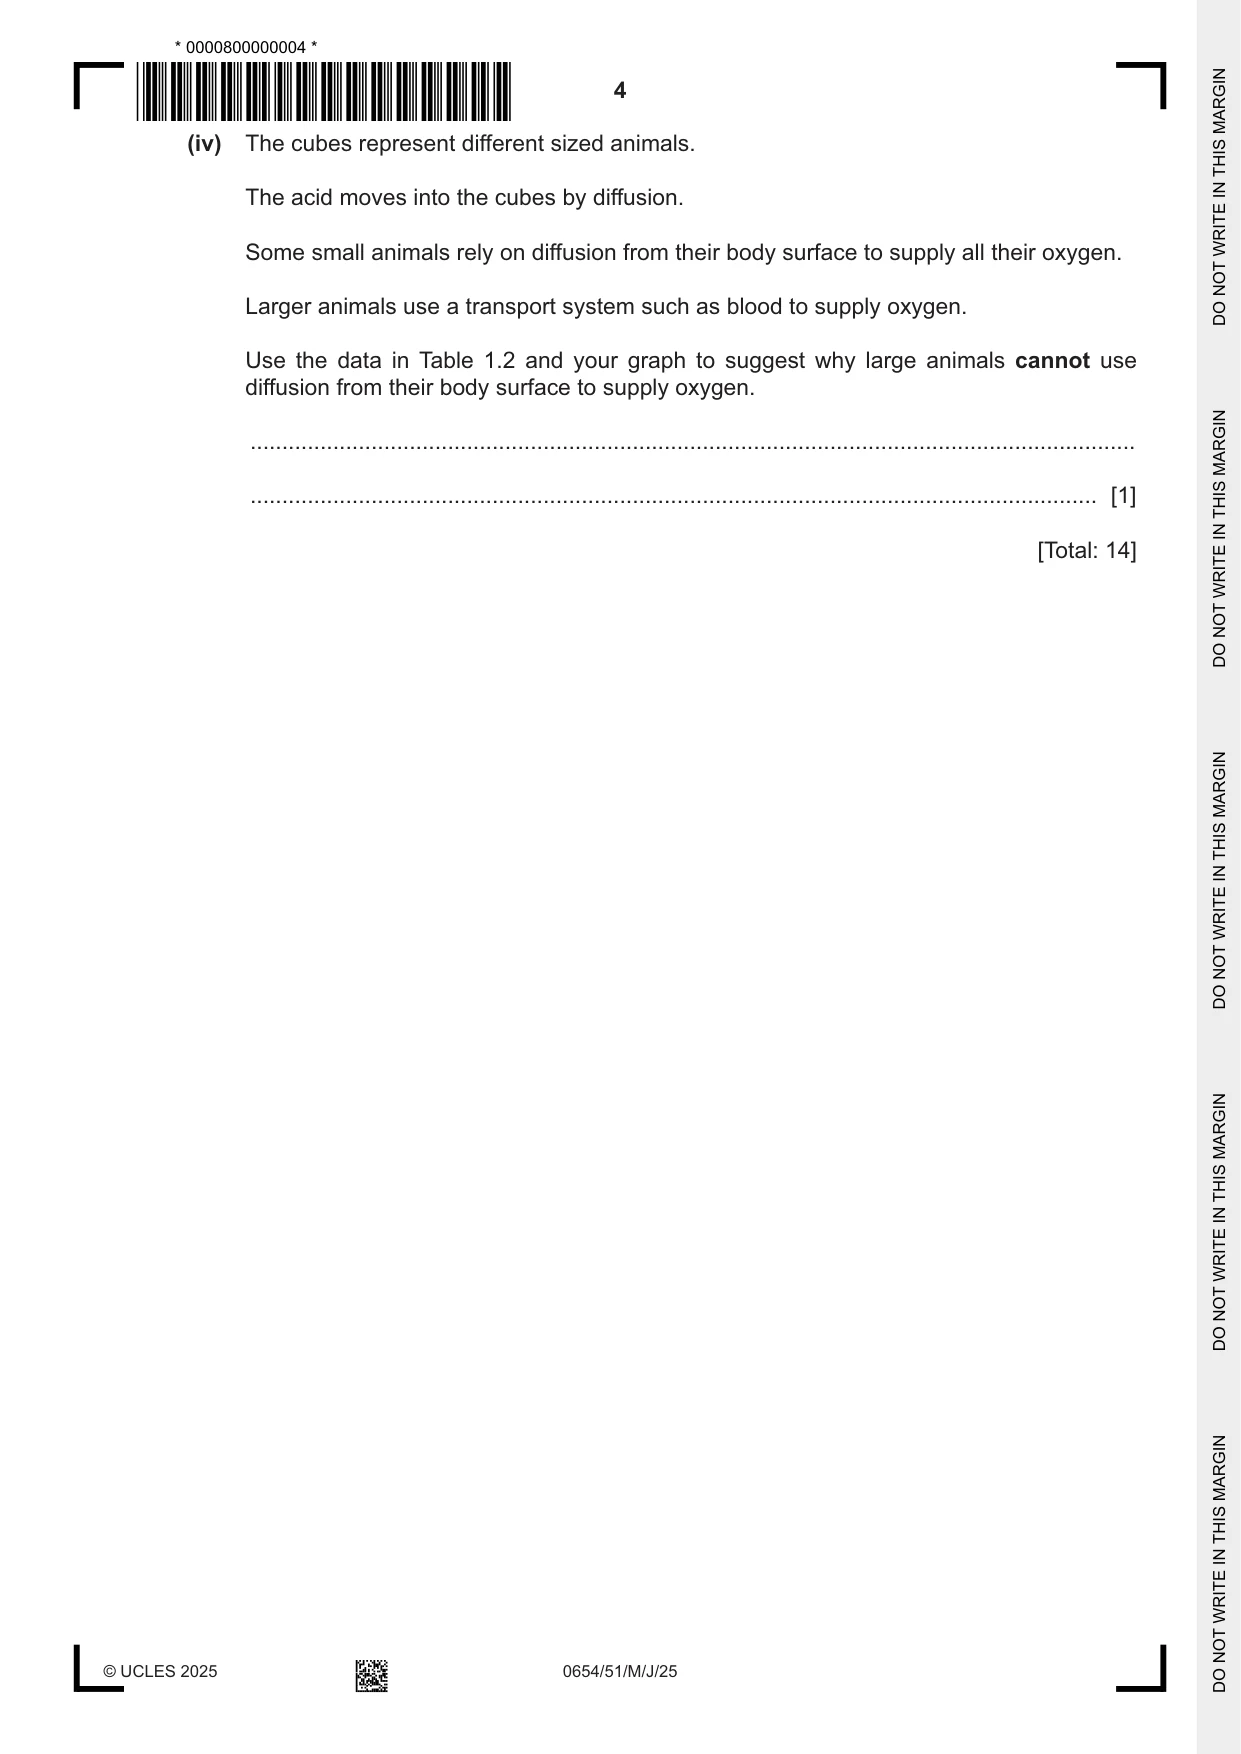
1 You are going to investigate diffusion in animals. You will use different sized agar jelly cubes to represent different sized animals. Each cube contains an indicator that turns red in acid. The acid moves into the cubes by diffusion. You are provided with two large cubes of agar jelly that are 10 × 10 × 10 mm. (a) (i) Procedure step 1 Cut one small cube of 5 × 5 × 5 mm from one of the large cubes. step 2 Place the small cube of agar jelly in a clean beaker. step 3 Pour hydrochloric acid into this beaker until the small cube is completely covered. step 4 Start the stop-watch. step 5 Record in Table 1.1 the time in seconds to the nearest second for the small cube to turn completely red. Repeat step 2 to step 5 using the large cube instead of the small cube. Table 1.1 time taken to turn cube side surface area of cube volume of cube ratio of surface completely red / mm / mm2 / mm3 area to unit volume / s 5 1.2 10 0.6 [4] (ii) Use the value of the cube side given in Table 1.1 to calculate the surface area of each cube. Use the equation shown. surface area = length × height × 6 Record these values in Table 1.1. [1] (iii) Use the value of the cube side given in Table 1.1 to calculate the volume of each cube. Use the equation shown. volume = length × height × depth Record these values in Table 1.1. [1] (iv) Describe a difficulty you had doing the procedure in (a)(i). ........................................................................................................................................... ................ ............................................................................................................... [1] (b) A student repeats the procedure in (a)(i) with increasing sizes of cube measured in cm. They calculate the rate of diffusion for each cube as shown in Table 1.2. Table 1.2 cube side ratio of surface time rate of diffusion / cm area to unit volume / s per 1000 seconds 2 3.0 59 16.9 3 2.0 165 6.1 4 1.5 240 4.2 5 1.2 298 3.4 6 1.0 368 2.7 (i) On the grid, plot rate of diffusion (vertical axis) against ratio of surface area to unit volume. [3] (ii) Draw the curve of best fit. [1] (iii) Estimate the rate of diffusion for a cube with ratio of surface area to unit volume of 2.5. Show your working on the graph. rate of diffusion = ............................ per 1000 seconds [2] (iv) The cubes represent different sized animals. The acid moves into the cubes by diffusion. Some small animals rely on diffusion from their body surface to supply all their oxygen. Larger animals use a transport system such as blood to supply oxygen. Use the data in Table 1.2 and your graph to suggest why large animals cannot use diffusion from their body surface to supply oxygen. ........................................................................................................................................... ..................................................................................................................................... [1] [Total: 14]
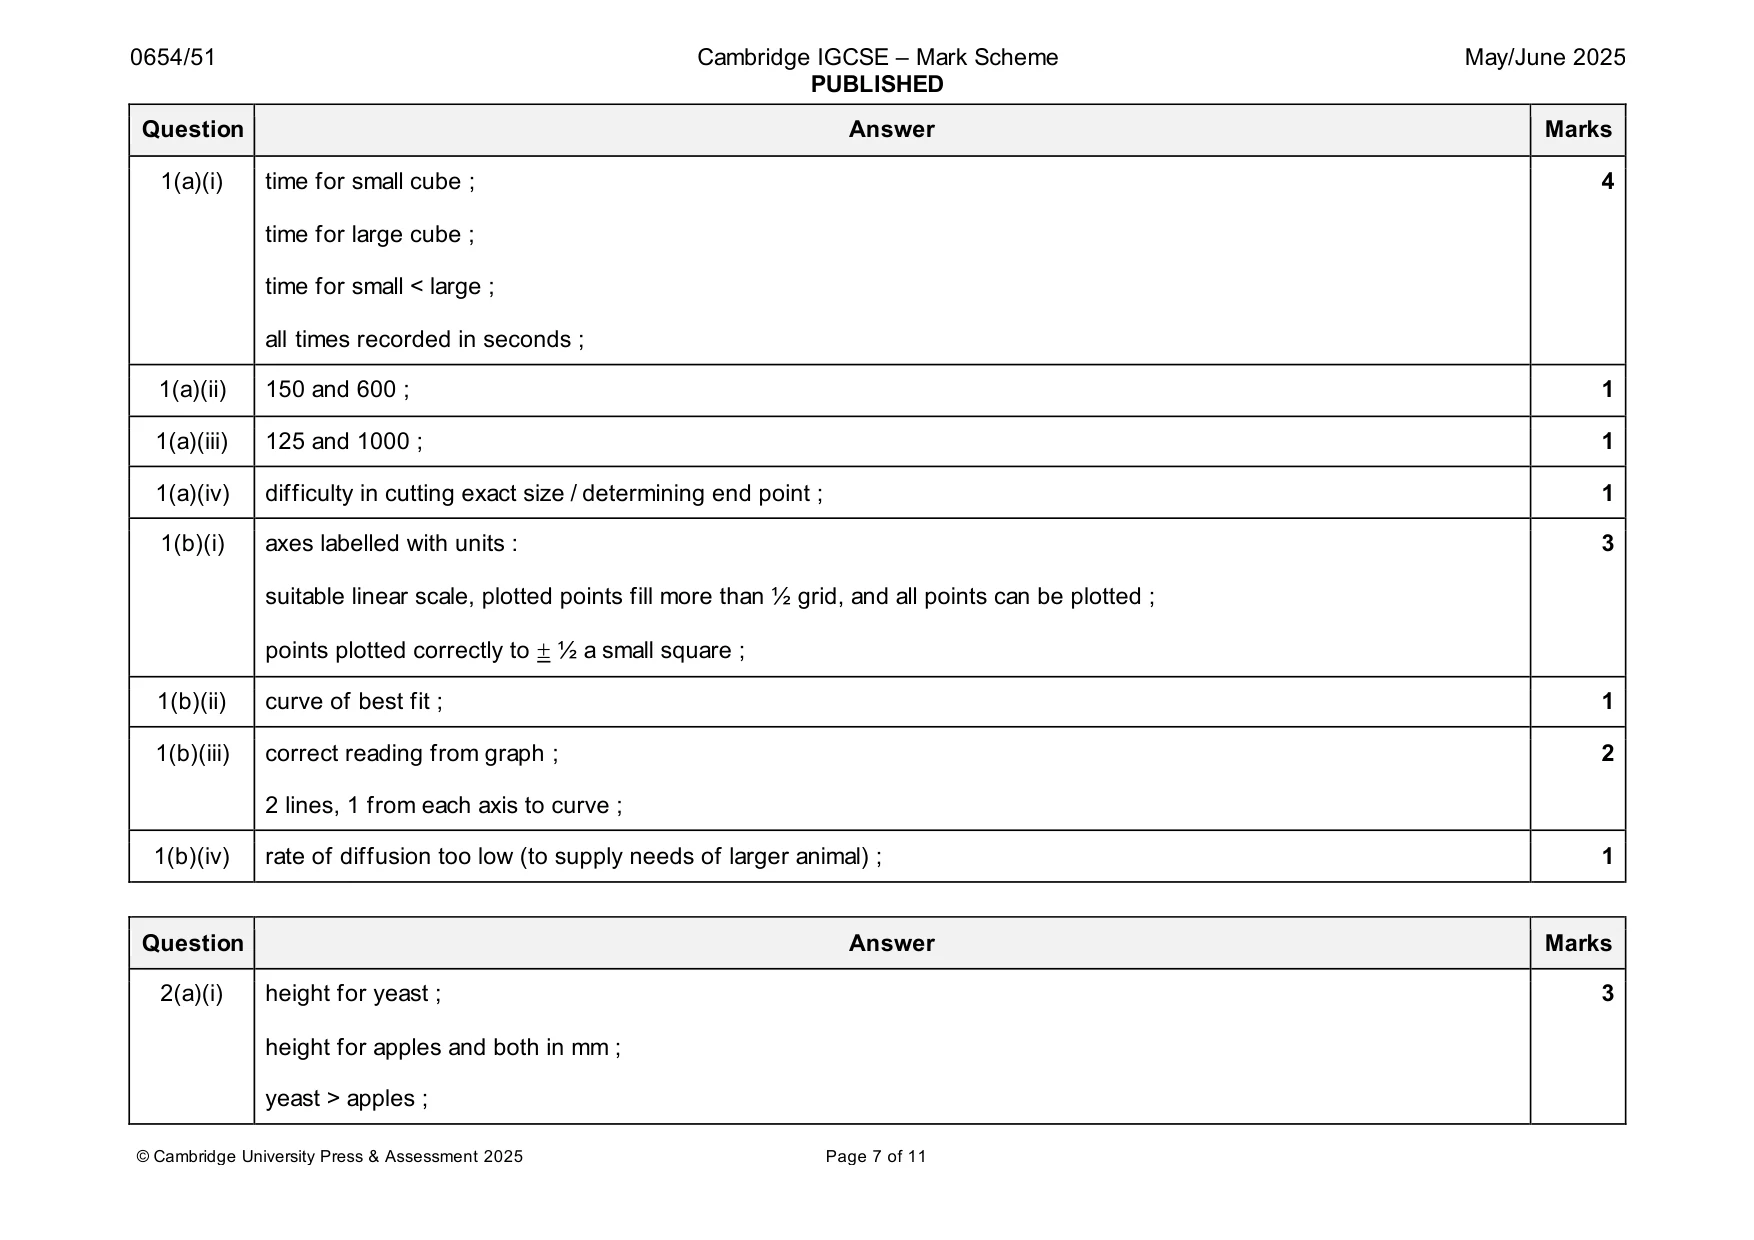
Mark scheme: Question Answer Marks 1(a)(i) time for small cube ; 4 time for large cube ; time for small < large ; all times recorded in seconds ; 1(a)(ii) 150 and 600 ; 1 1(a)(iii) 125 and 1000 ; 1 1(a)(iv) difficulty in cutting exact size / determining end point ; 1 1(b)(i) axes labelled with units : 3 suitable linear scale, plotted points fill more than ½ grid, and all points can be plotted ; points plotted correctly to ½ a small square ; 1(b)(ii) curve of best fit ; 1 1(b)(iii) correct reading from graph ; 2 2 lines, 1 from each axis to curve ; 1(b)(iv) rate of diffusion too low (to supply needs of larger animal) ; 1
Q2 · You are going to investigate an enzyme-controlled reaction
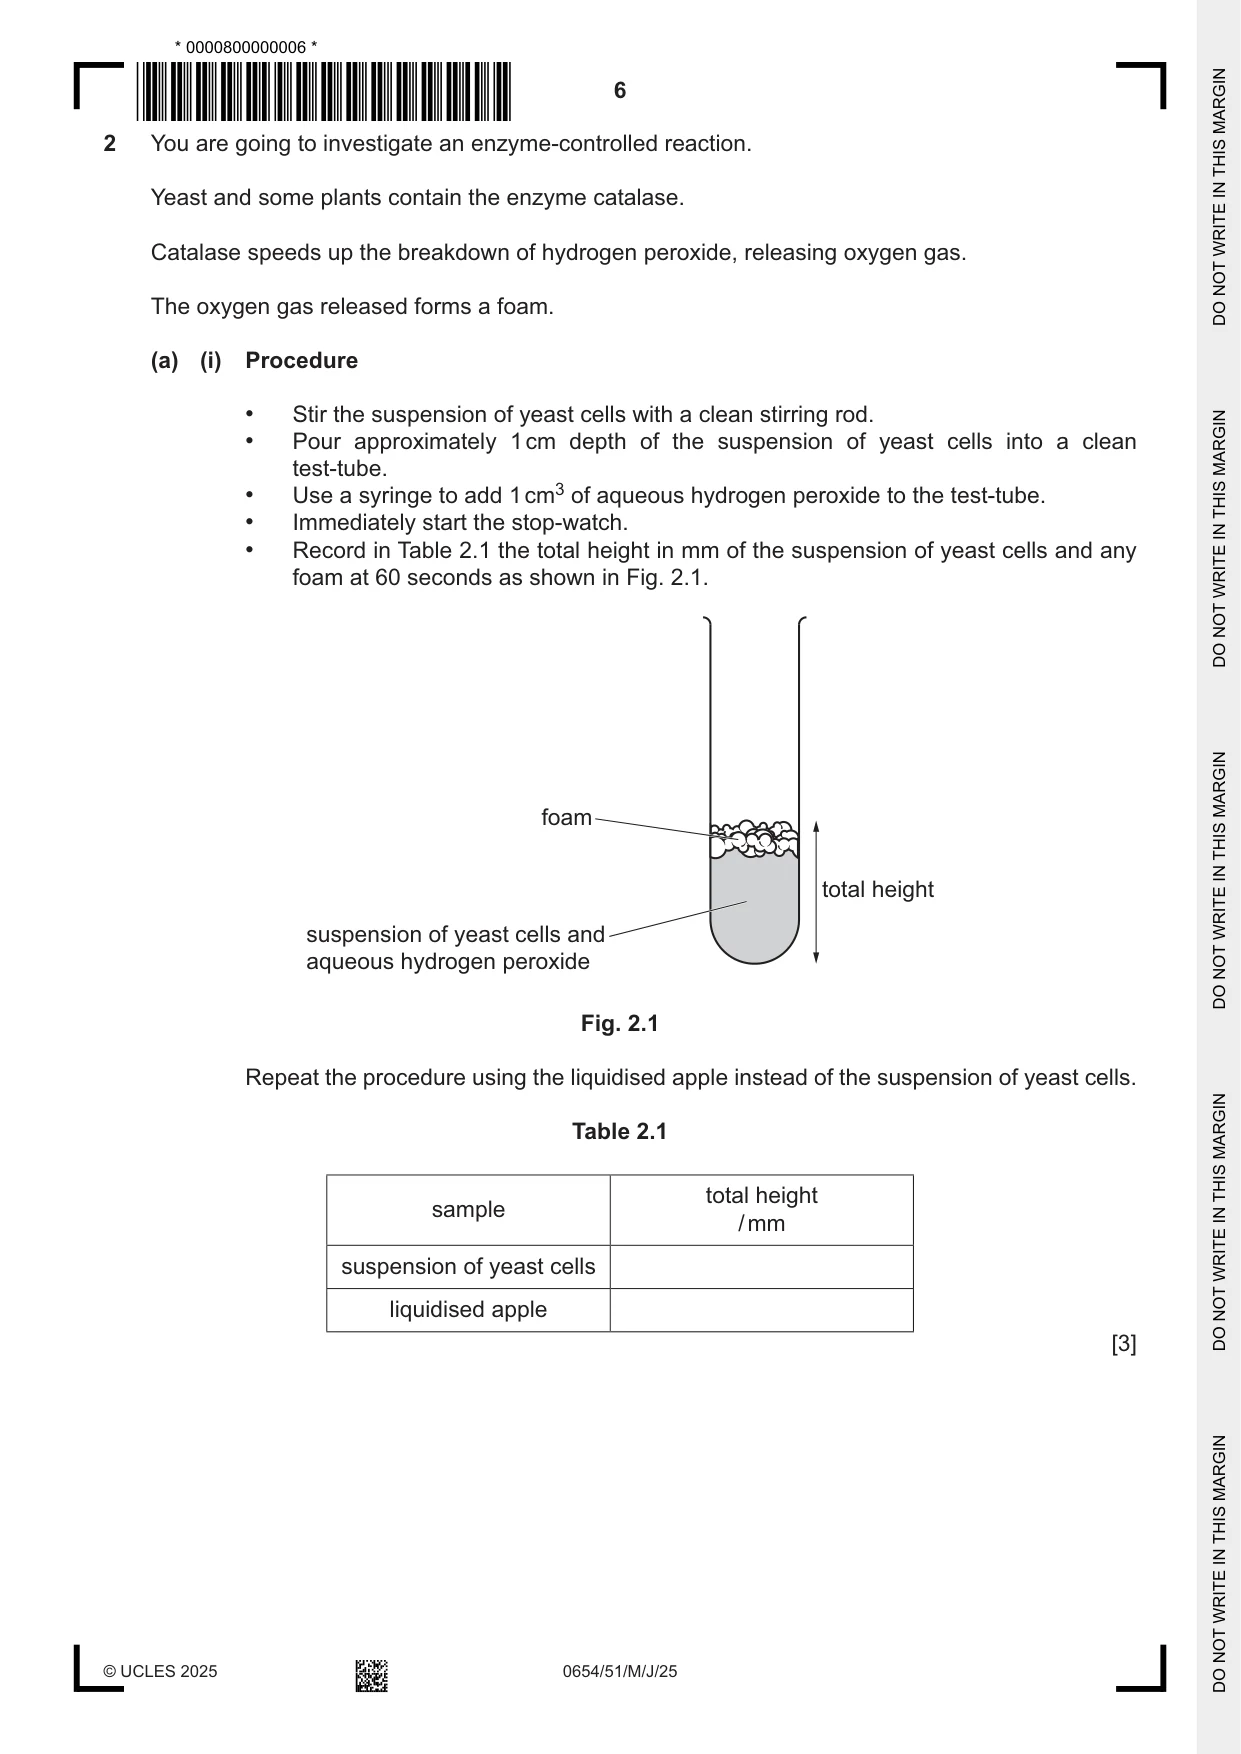
2 You are going to investigate an enzyme-controlled reaction. Yeast and some plants contain the enzyme catalase. Catalase speeds up the breakdown of hydrogen peroxide, releasing oxygen gas. The oxygen gas released forms a foam. (a) (i) Procedure • Stir the suspension of yeast cells with a clean stirring rod. • Pour approximately 1 cm depth of the suspension of yeast cells into a clean test-tube. • Use a syringe to add 1 cm3 of aqueous hydrogen peroxide to the test-tube. • Immediately start the stop-watch. • Record in Table 2.1 the total height in mm of the suspension of yeast cells and any foam at 60 seconds as shown in Fig. 2.1. foam total height suspension of yeast cells and aqueous hydrogen peroxide Fig. 2.1 Repeat the procedure using the liquidised apple instead of the suspension of yeast cells. Table 2.1 total height sample / mm suspension of yeast cells liquidised apple [3] (ii) Use Table 2.1 to compare how much catalase is present in the samples of yeast cells and liquidised apple. Explain your answer. ........................................................................................................................................... ..................................................................................................................................... [1] (b) (i) Liquidising the apple breaks open the cells. Suggest why the cells need to be broken open. ........................................................................................................................................... ..................................................................................................................................... [1] (ii) Suggest why it is important to stir to mix the suspension of yeast cells in the procedure. ........................................................................................................................................... ..................................................................................................................................... [1] [Total: 6]
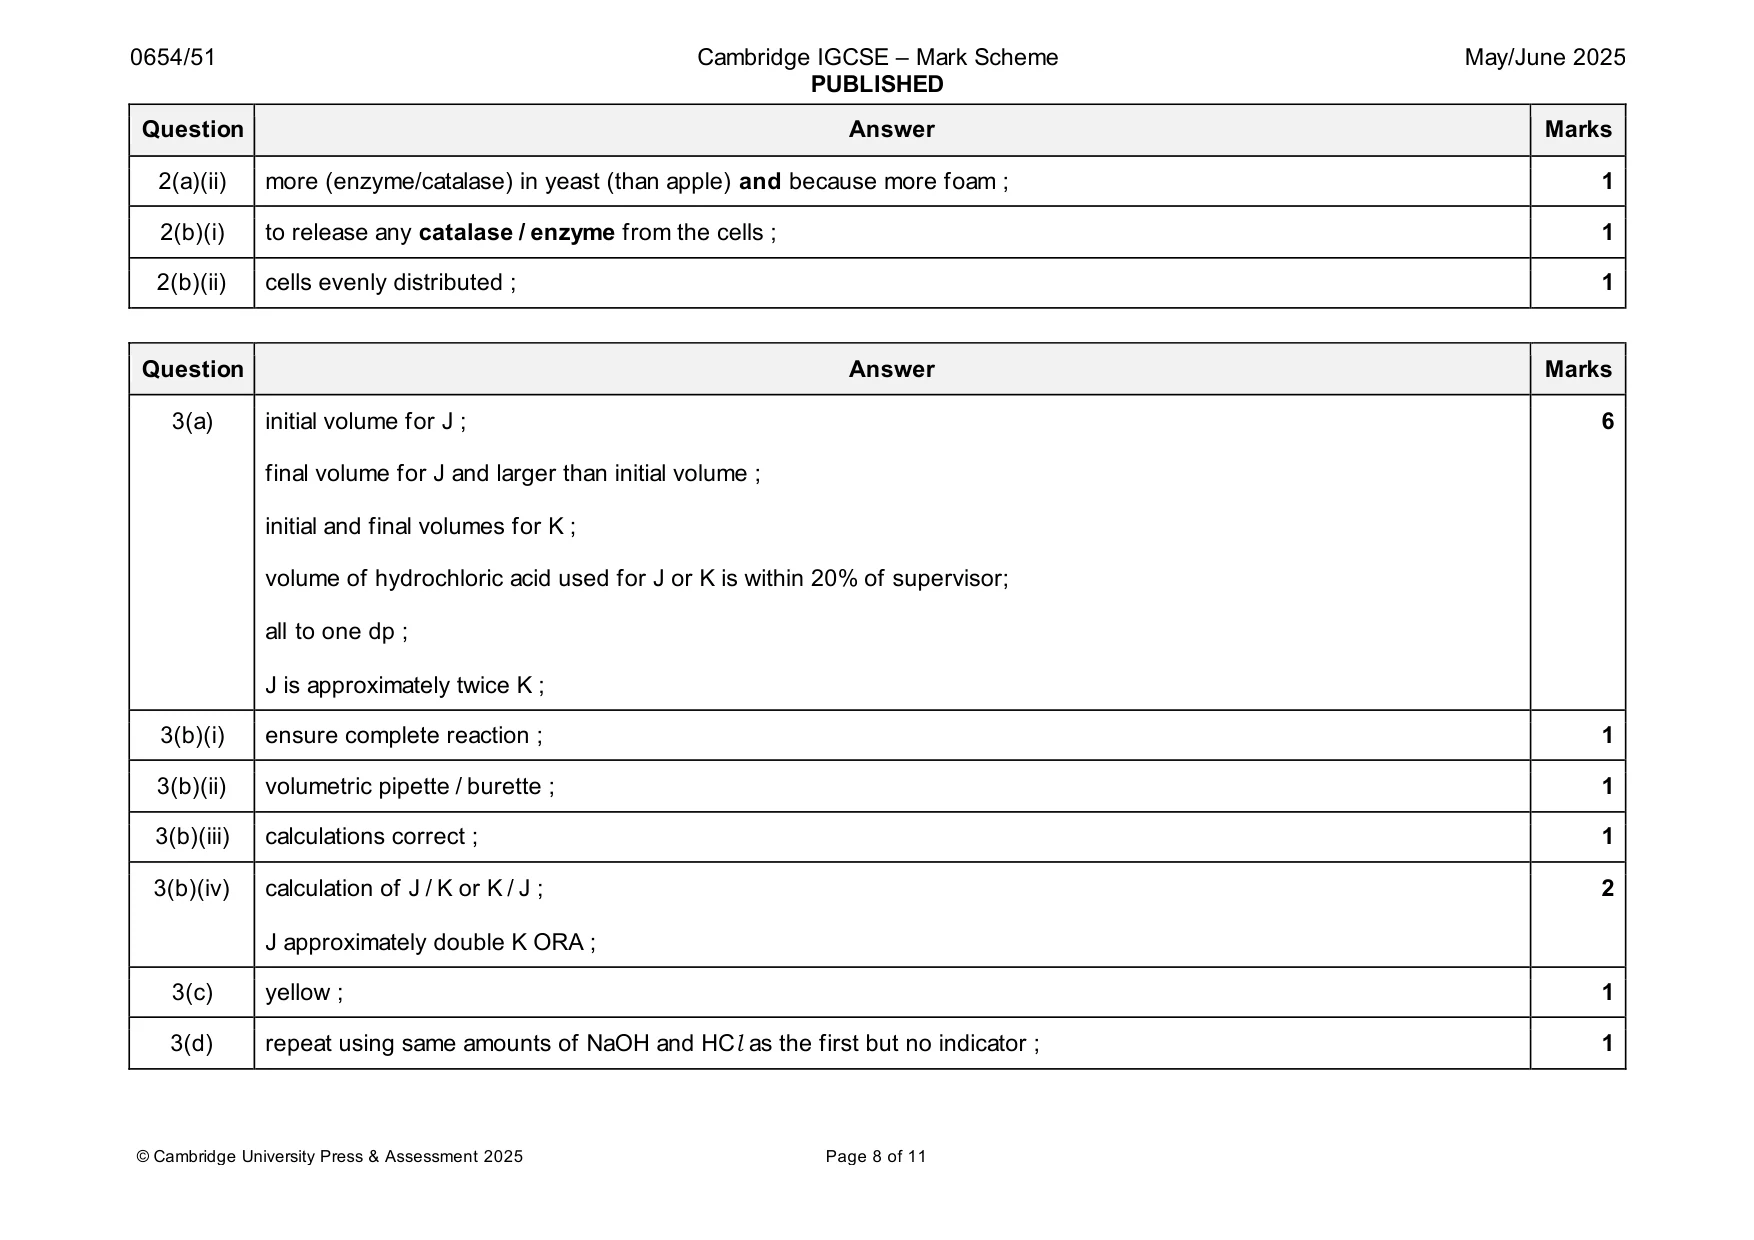
Mark scheme: 2(a)(i) height for yeast ; 3 height for apples and both in mm ; yeast > apples ; 2(a)(ii) more (enzyme/catalase) in yeast (than apple) and because more foam ; 1 2(b)(i) to release any catalase / enzyme from the cells ; 1 2(b)(ii) cells evenly distributed ; 1
Q3 · You are going to investigate the neutralisation of dilute hydrochloric acid by aqueous…
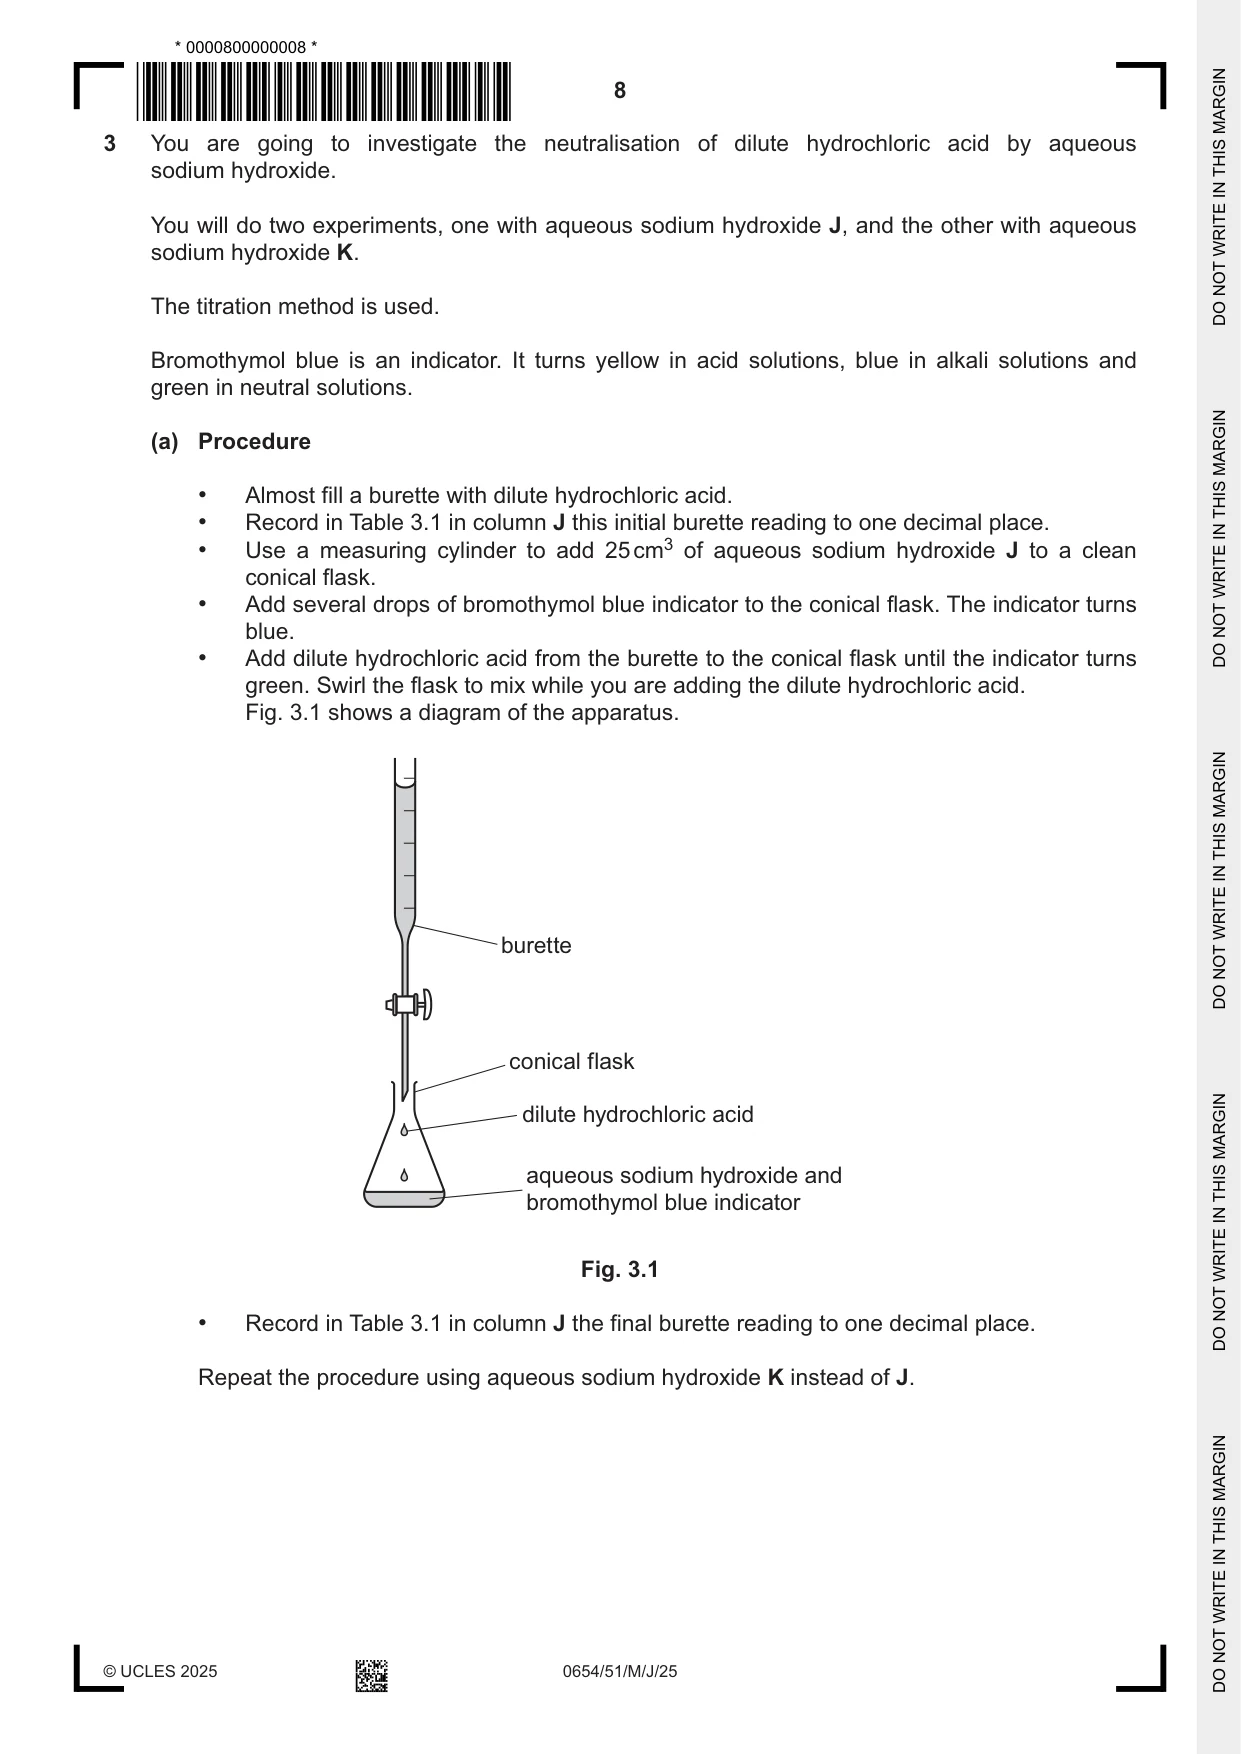
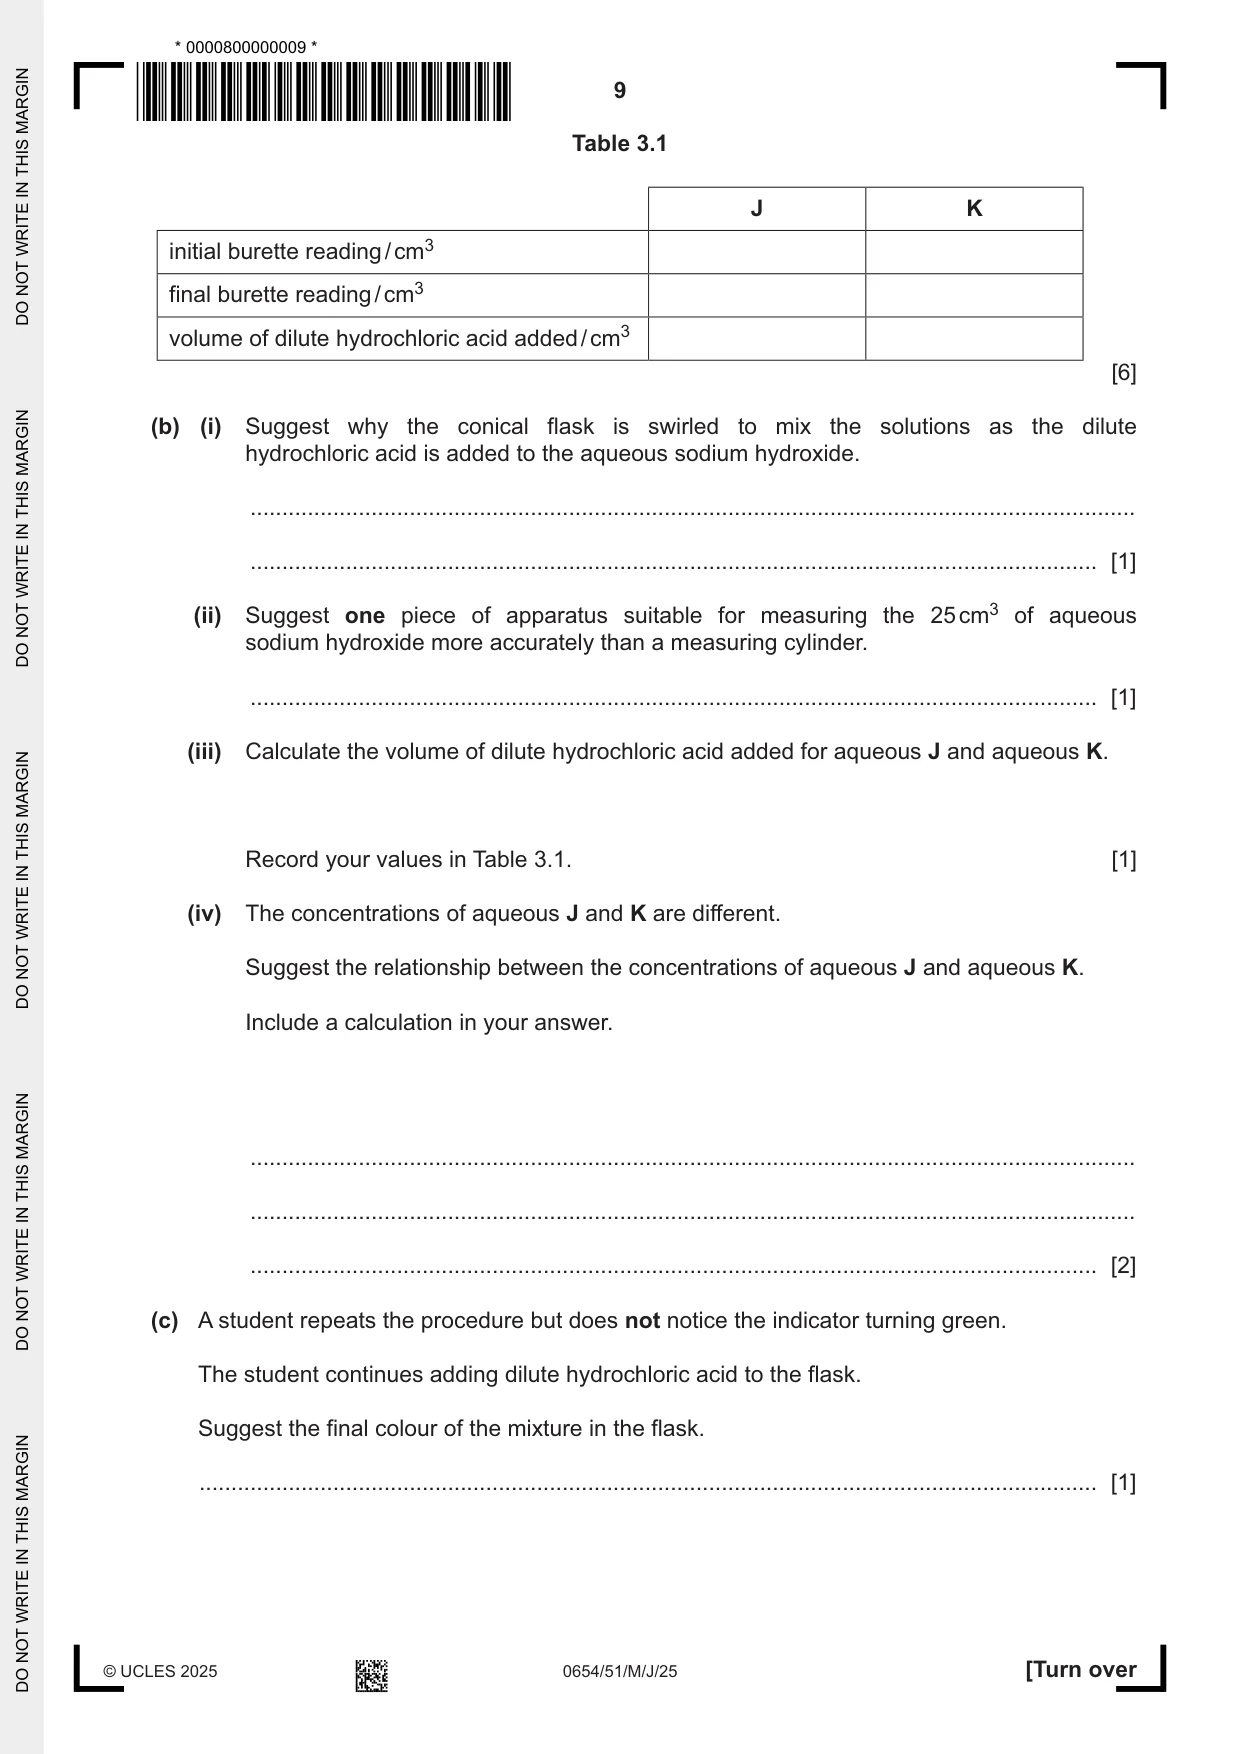
3 You are going to investigate the neutralisation of dilute hydrochloric acid by aqueous sodium hydroxide. You will do two experiments, one with aqueous sodium hydroxide J, and the other with aqueous sodium hydroxide K. The titration method is used. Bromothymol blue is an indicator. It turns yellow in acid solutions, blue in alkali solutions and green in neutral solutions. (a) Procedure • Almost fill a burette with dilute hydrochloric acid. • Record in Table 3.1 in column J this initial burette reading to one decimal place. • Use a measuring cylinder to add 25 cm3 of aqueous sodium hydroxide J to a clean conical flask. • Add several drops of bromothymol blue indicator to the conical flask. The indicator turns blue. • Add dilute hydrochloric acid from the burette to the conical flask until the indicator turns green. Swirl the flask to mix while you are adding the dilute hydrochloric acid. Fig. 3.1 shows a diagram of the apparatus. burette conical flask dilute hydrochloric acid aqueous sodium hydroxide and bromothymol blue indicator Fig. 3.1 • Record in Table 3.1 in column J the final burette reading to one decimal place. Repeat the procedure using aqueous sodium hydroxide K instead of J. Table 3.1 J K initial burette reading / cm3 final burette reading / cm3 volume of dilute hydrochloric acid added / cm3 [6] (b) (i) Suggest why the conical flask is swirled to mix the solutions as the dilute hydrochloric acid is added to the aqueous sodium hydroxide. ........................................................................................................................................... ..................................................................................................................................... [1] (ii) Suggest one piece of apparatus suitable for measuring the 25 cm3 of aqueous sodium hydroxide more accurately than a measuring cylinder. ..................................................................................................................................... [1] (iii) Calculate the volume of dilute hydrochloric acid added for aqueous J and aqueous K. Record your values in Table 3.1. [1] (iv) The concentrations of aqueous J and K are different. Suggest the relationship between the concentrations of aqueous J and aqueous K. Include a calculation in your answer. ........................................................................................................................................... ........................................................................................................................................... ..................................................................................................................................... [2] (c) A student repeats the procedure but does not notice the indicator turning green. The student continues adding dilute hydrochloric acid to the flask. Suggest the final colour of the mixture in the flask. ............................................................................................................................................. [1] (d) Aqueous sodium chloride is the product in the conical flask. The aqueous sodium chloride is coloured green with the indicator. Suggest how the procedure in (a) is changed to make colourless aqueous sodium chloride. ................................................................................................................................................... ............................................................................................................................................. [1] [Total: 13]
Mark scheme: 3(a) initial volume for J ; 6 final volume for J and larger than initial volume ; initial and final volumes for K ; volume of hydrochloric acid used for J or K is within 20% of supervisor; all to one dp ; J is approximately twice K ; 3(b)(i) ensure complete reaction ; 1 3(b)(ii) volumetric pipette / burette ; 1 3(b)(iii) calculations correct ; 1 3(b)(iv) calculation of J / K or K / J ; 2 J approximately double K ORA ; 3(c) yellow ; 1 3(d) repeat using same amounts of NaOH and HCl as the first but no indicator ; 1
Q4 · An iron key is electroplated with copper metal using the apparatus shown in Fig
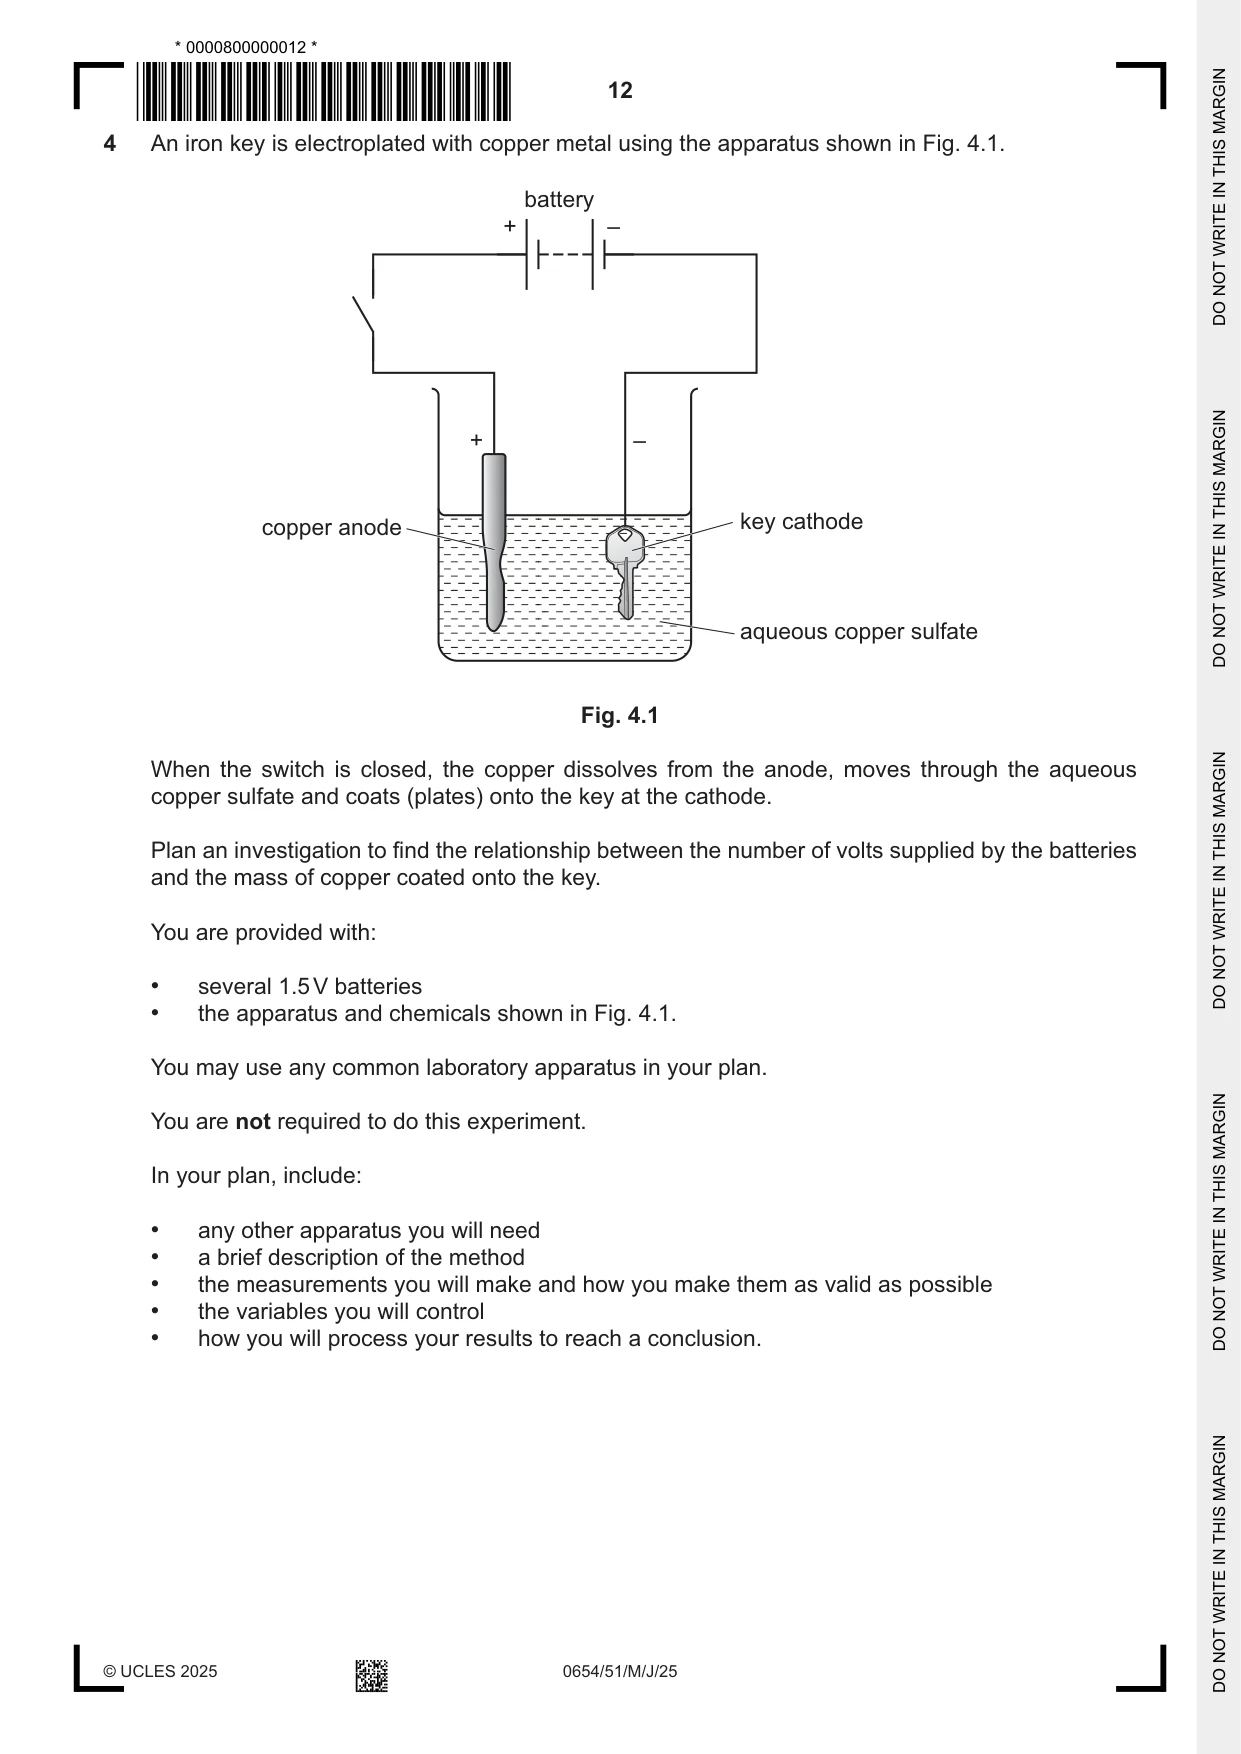
4 An iron key is electroplated with copper metal using the apparatus shown in Fig. 4.1. battery + – + – copper anode key cathode aqueous copper sulfate Fig. 4.1 When the switch is closed, the copper dissolves from the anode, moves through the aqueous copper sulfate and coats (plates) onto the key at the cathode. Plan an investigation to find the relationship between the number of volts supplied by the batteries and the mass of copper coated onto the key. You are provided with: • several 1.5 V batteries • the apparatus and chemicals shown in Fig. 4.1. You may use any common laboratory apparatus in your plan. You are not required to do this experiment. In your plan, include: • any other apparatus you will need • a brief description of the method • the measurements you will make and how you make them as valid as possible • the variables you will control • how you will process your results to reach a conclusion. .......................................................................................................................................................... .......................................................................................................................................................... .......................................................................................................................................................... .......................................................................................................................................................... .......................................................................................................................................................... .......................................................................................................................................................... .......................................................................................................................................................... .......................................................................................................................................................... .......................................................................................................................................................... .......................................................................................................................................................... .......................................................................................................................................................... .......................................................................................................................................................... .......................................................................................................................................................... .......................................................................................................................................................... .......................................................................................................................................................... .......................................................................................................................................................... .......................................................................................................................................................... .......................................................................................................................................................... .......................................................................................................................................................... .......................................................................................................................................................... .......................................................................................................................................................... .......................................................................................................................................................... .......................................................................................................................................................... .......................................................................................................................................................... .......................................................................................................................................................... .......................................................................................................................................................... .......................................................................................................................................................... .................................................................................................................................................... [7]
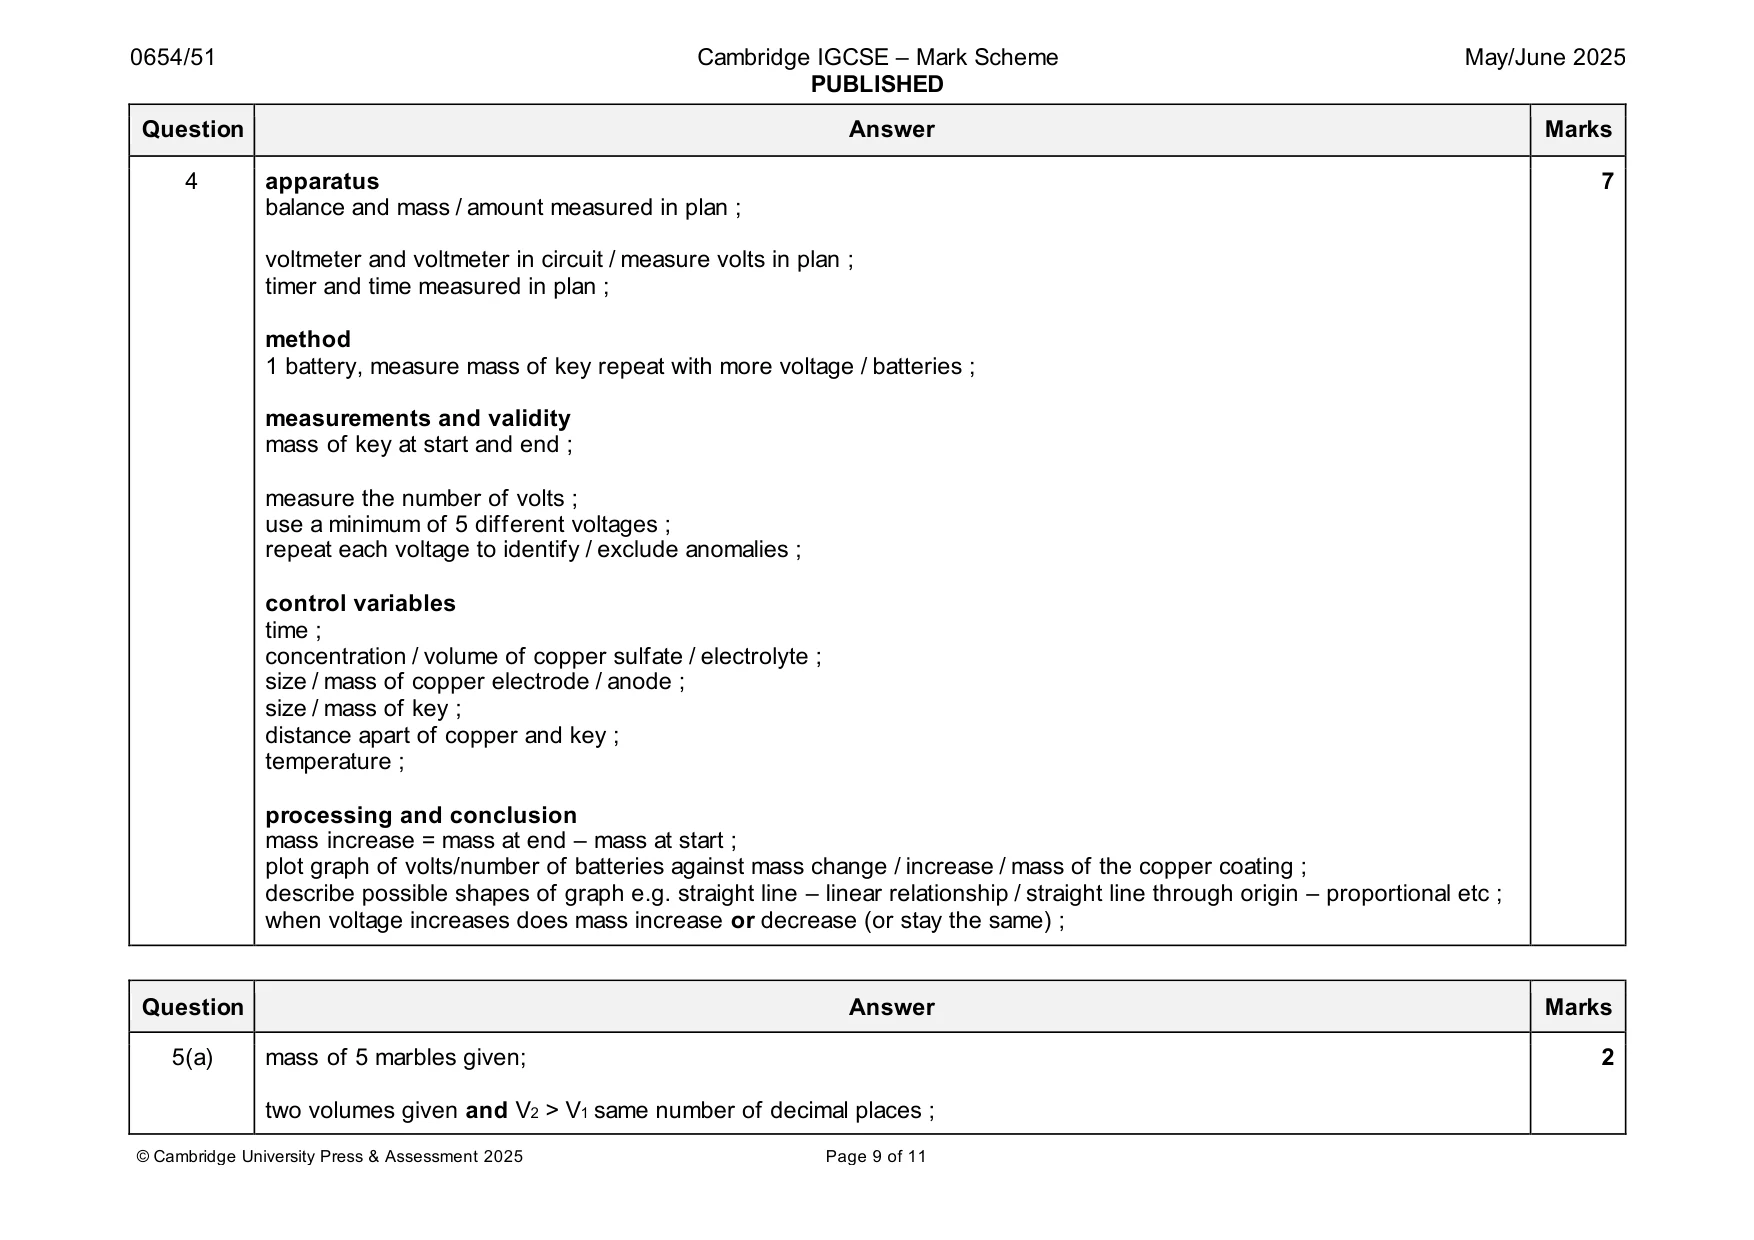
Mark scheme: 4 apparatus 7 balance and mass / amount measured in plan ; voltmeter and voltmeter in circuit / measure volts in plan ; timer and time measured in plan ; method 1 battery, measure mass of key repeat with more voltage / batteries ; measurements and validity mass of key at start and end ; measure the number of volts ; use a minimum of 5 different voltages ; repeat each voltage to identify / exclude anomalies ; control variables time ; concentration / volume of copper sulfate / electrolyte ; size / mass of copper electrode / anode ; size / mass of key ; distance apart of copper and key ; temperature ; processing and conclusion mass increase = mass at end – mass at start ; plot graph of volts/number of batteries against mass change / increase / mass of the copper coating ; describe possible shapes of graph e.g. straight line – linear relationship / straight line through origin – proportional etc ; when voltage increases does mass increase or decrease (or stay the same) ;
Q5 · You are going to do an experiment to find the density of glass using solid glass marbles
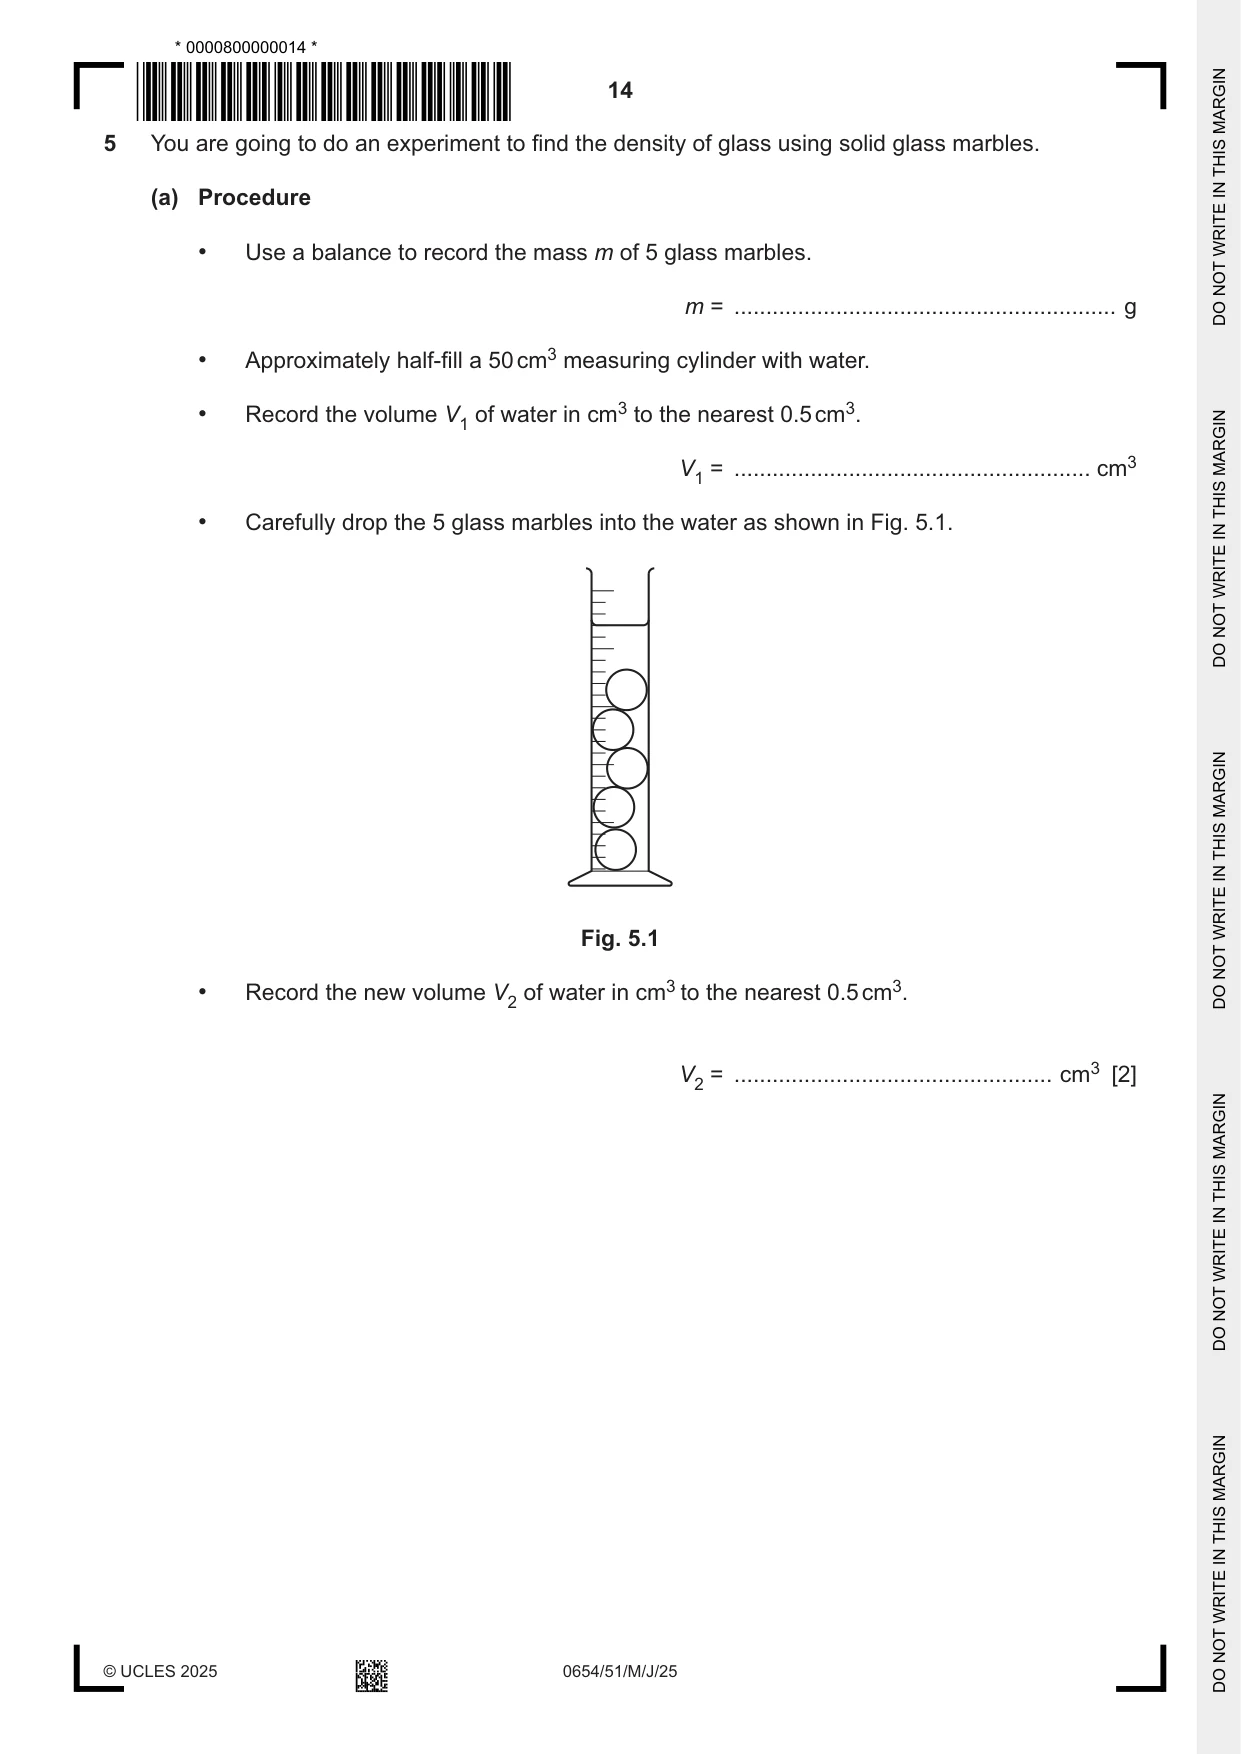
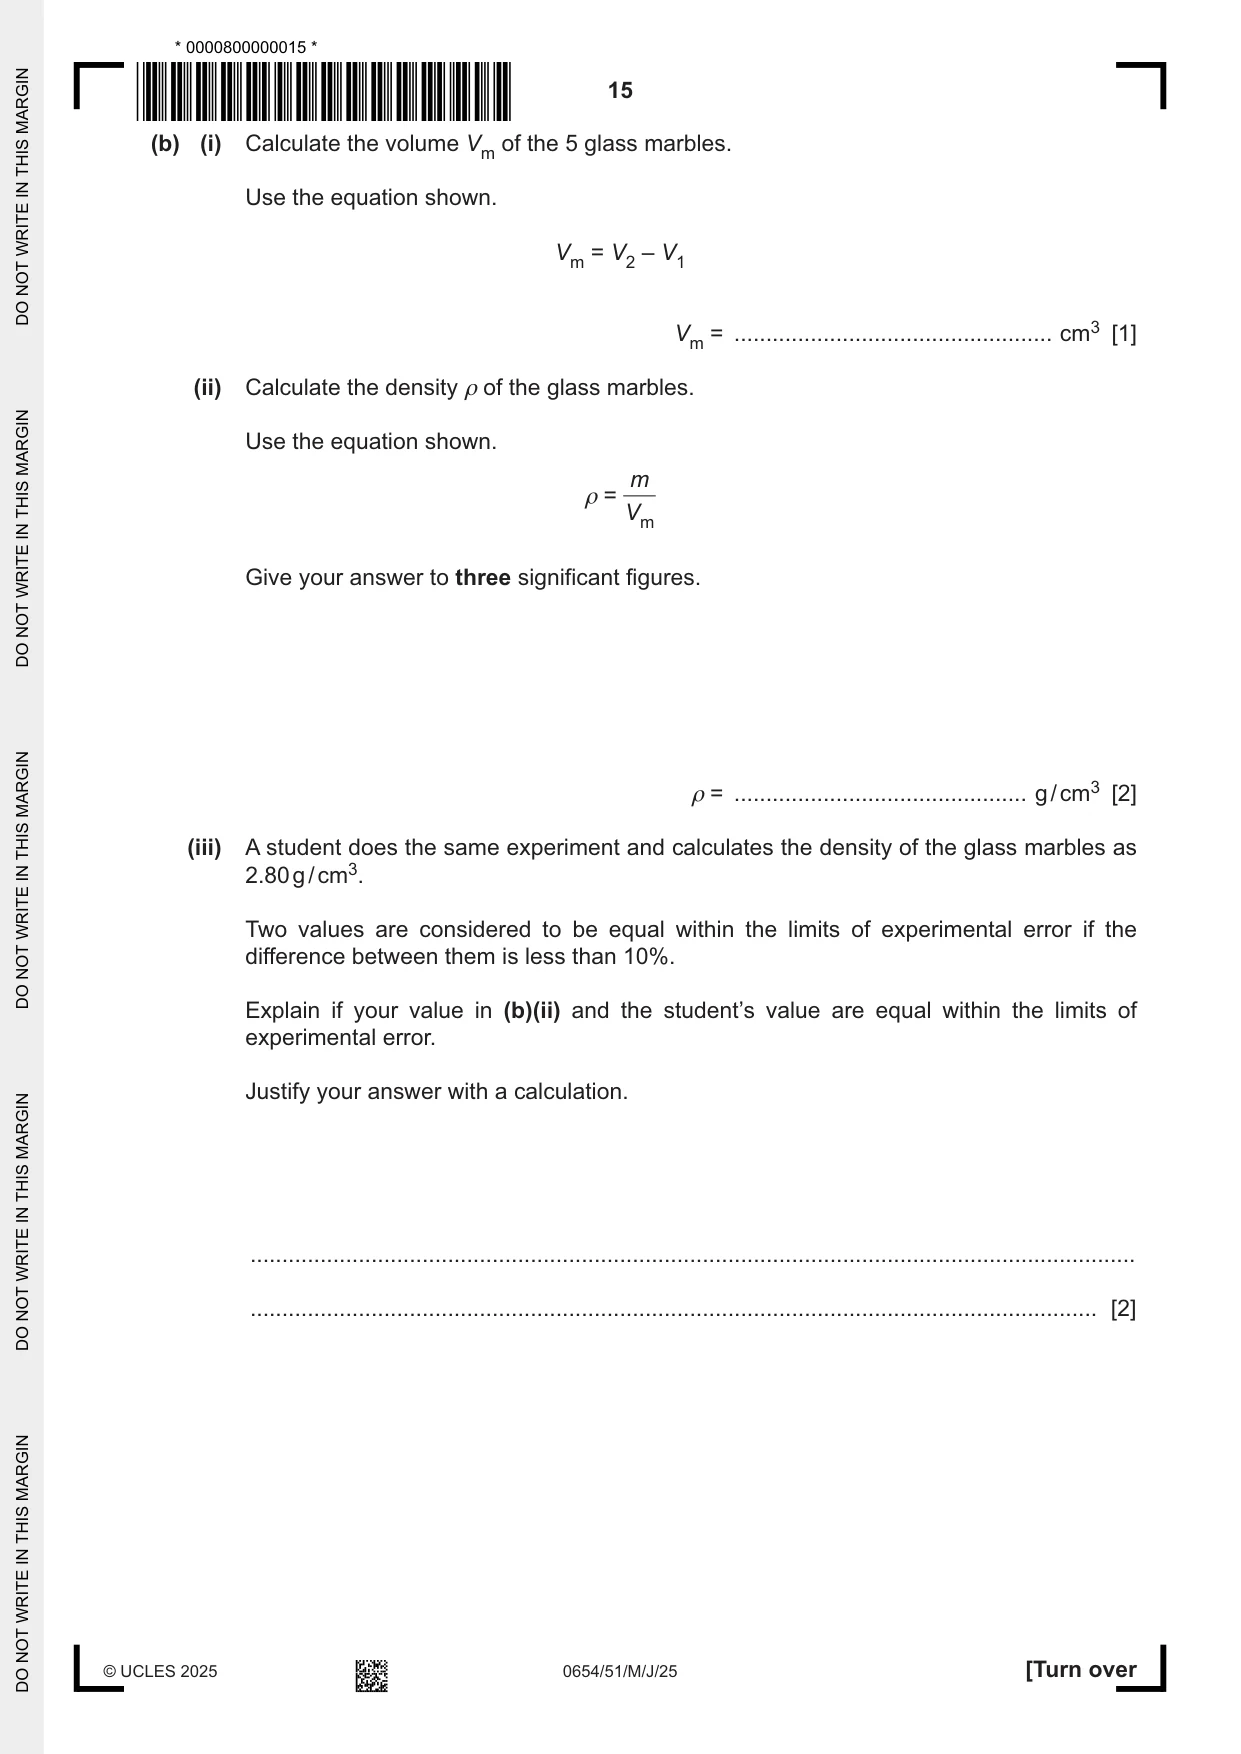
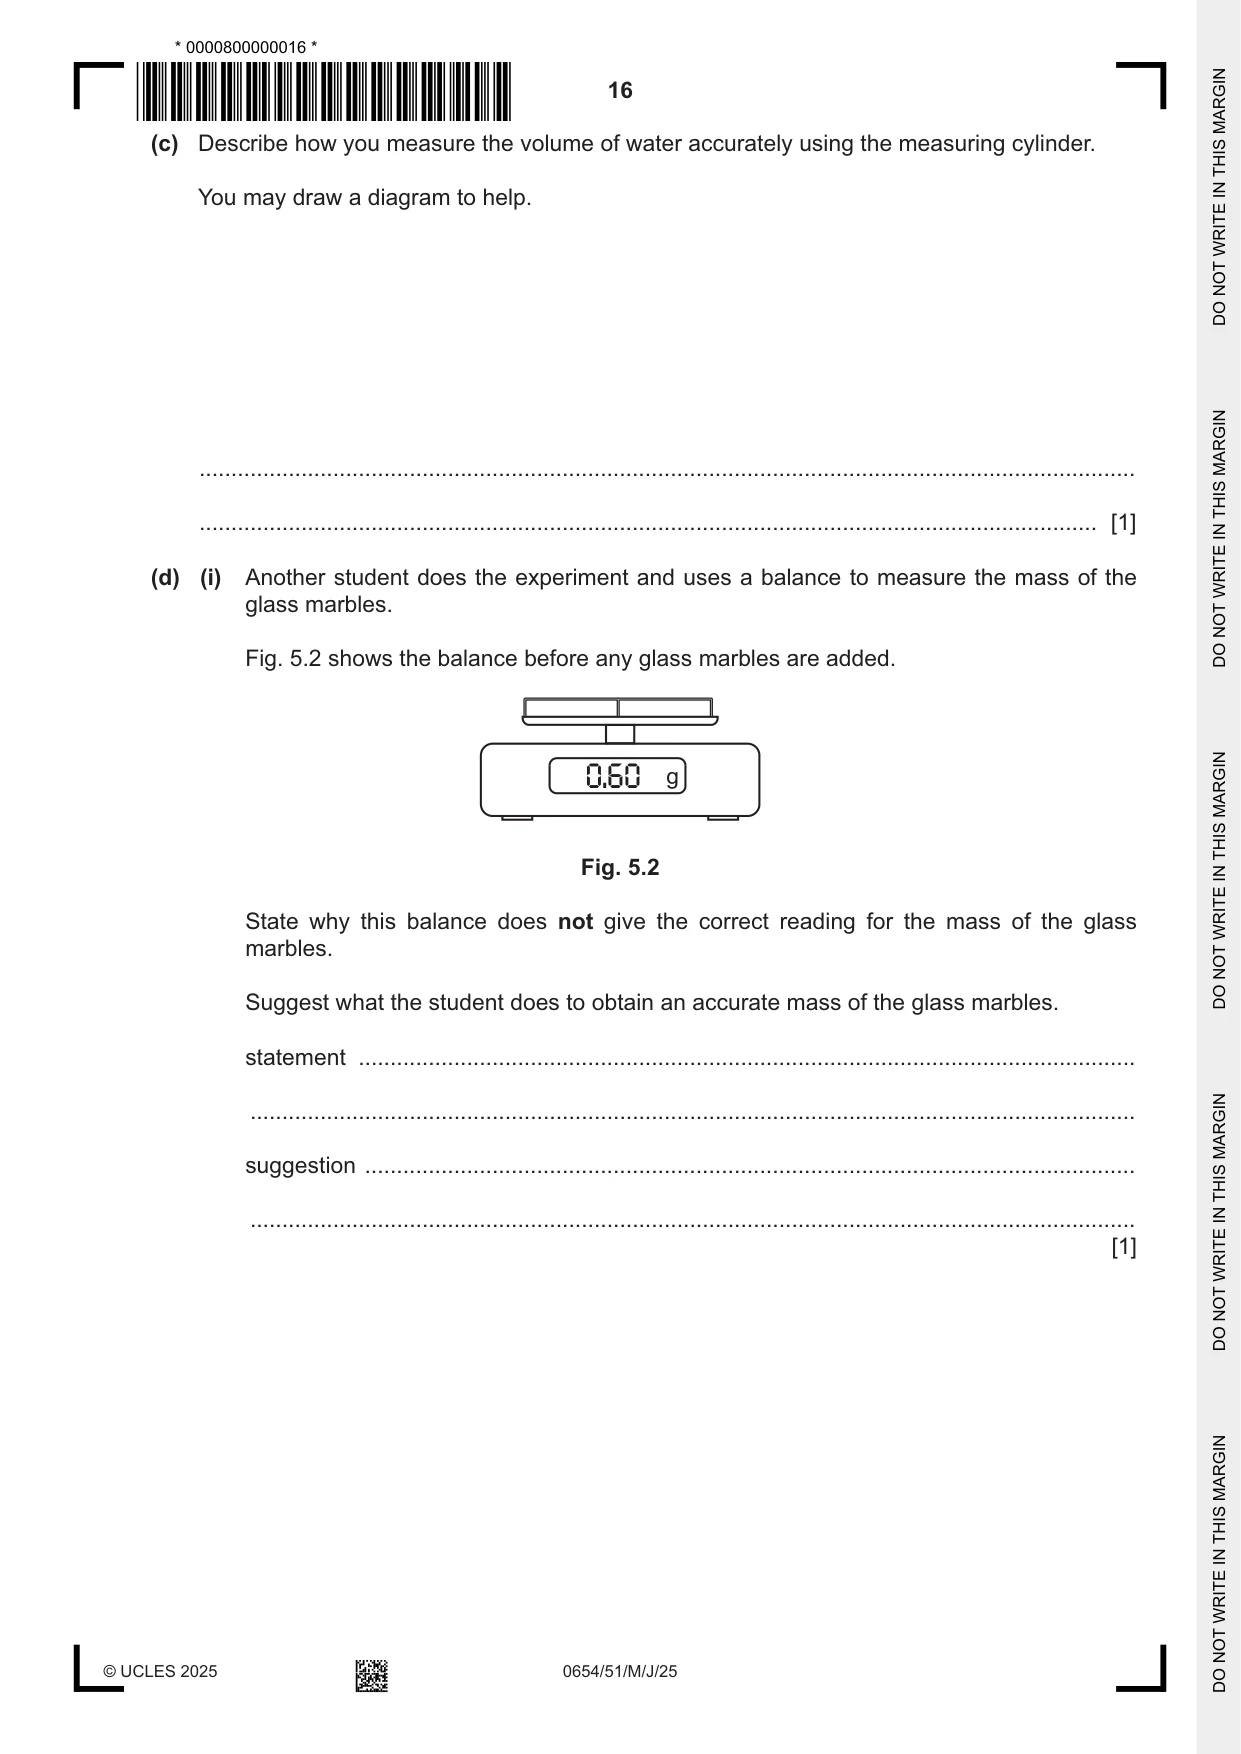
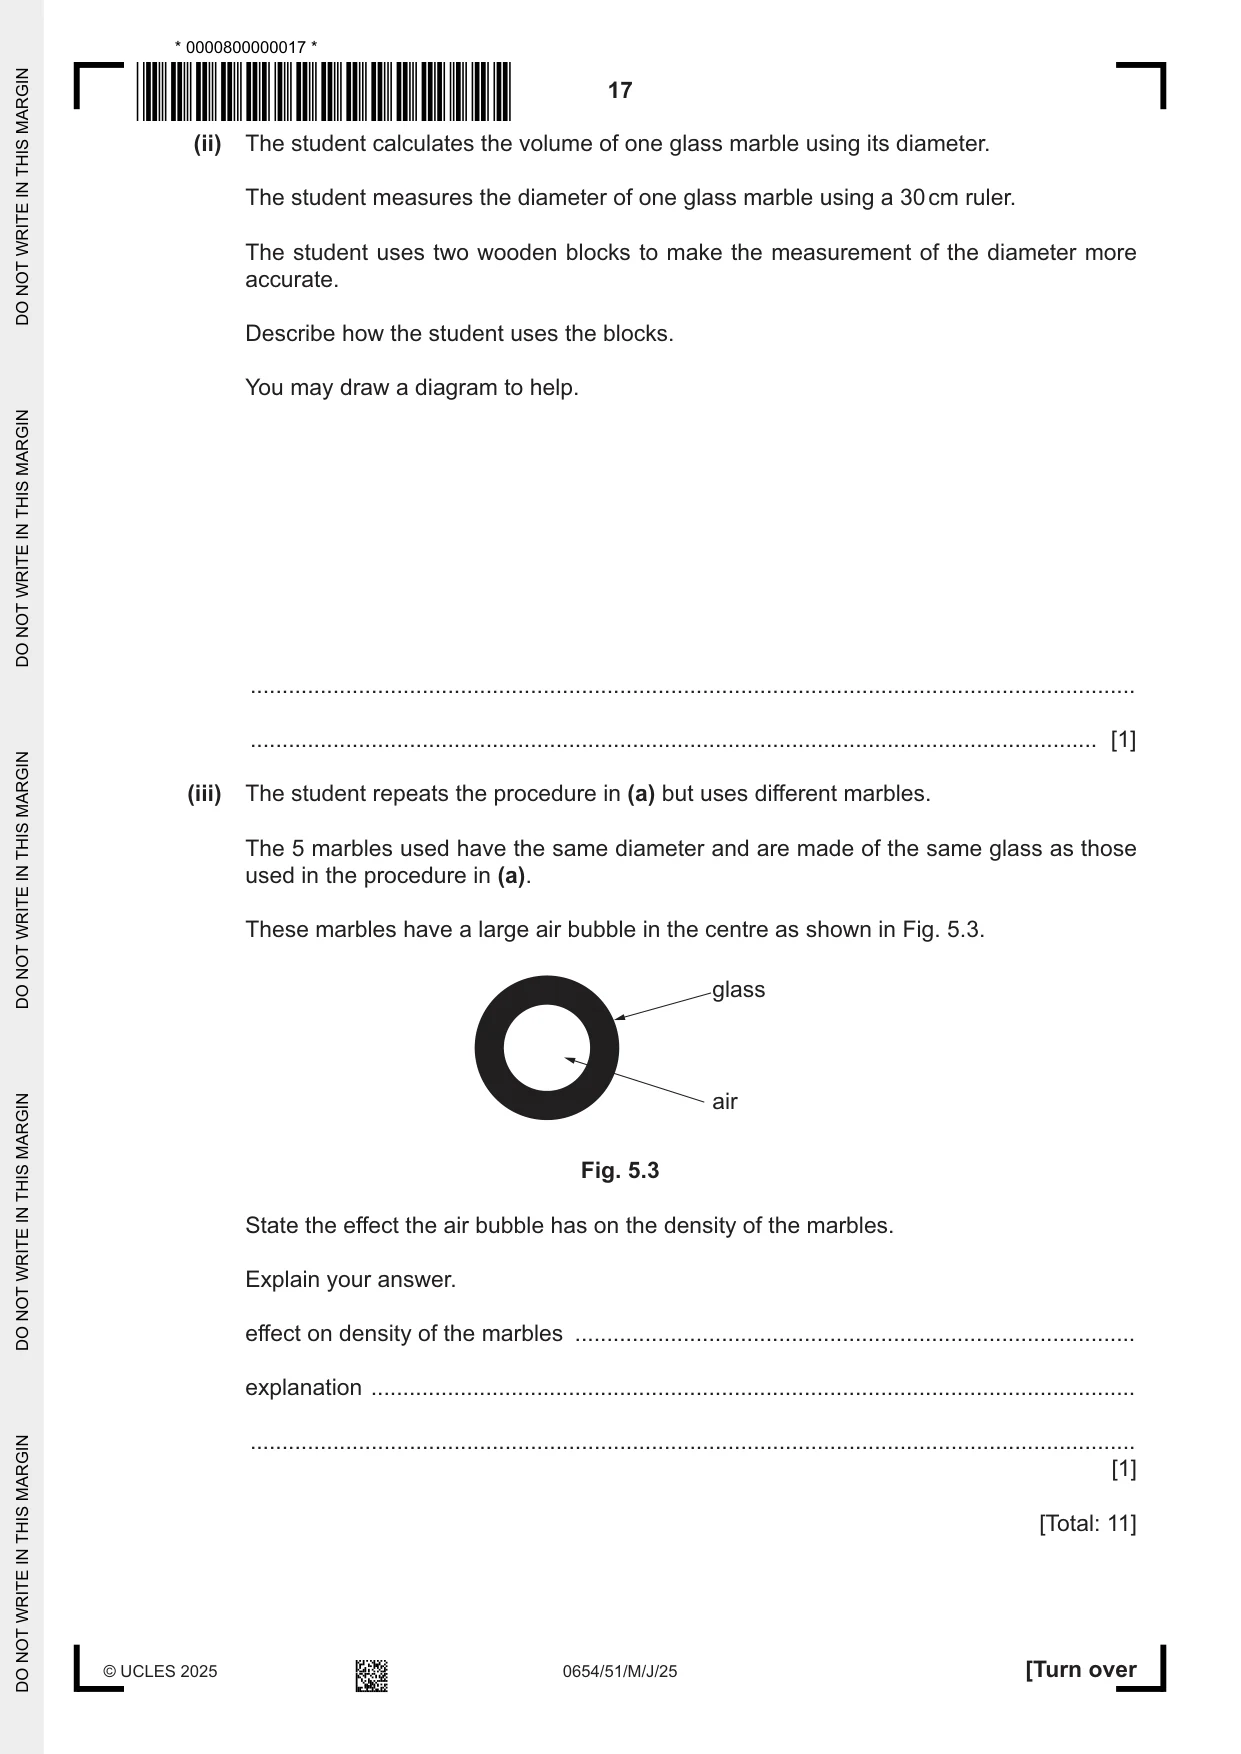
5 You are going to do an experiment to find the density of glass using solid glass marbles. (a) Procedure • Use a balance to record the mass m of 5 glass marbles. m = ............................................................ g • Approximately half-fill a 50 cm3 measuring cylinder with water. • Record the volume V1 of water in cm3 to the nearest 0.5 cm3. V1 = ........................................................ cm3 • Carefully drop the 5 glass marbles into the water as shown in Fig. 5.1. Fig. 5.1 • Record the new volume V2 of water in cm3 to the nearest 0.5 cm3. V2 = .................................................. cm3 [2] (b) (i) Calculate the volume Vm of the 5 glass marbles. Use the equation shown. Vm = V2 – V1 Vm = .................................................. cm3 [1] (ii) Calculate the density ρ of the glass marbles. Use the equation shown. m ρ = Vm Give your answer to three significant figures. ρ = .............................................. g / cm3 [2] (iii) A student does the same experiment and calculates the density of the glass marbles as 2.80 g / cm3. Two values are considered to be equal within the limits of experimental error if the difference between them is less than 10%. Explain if your value in (b)(ii) and the student’s value are equal within the limits of experimental error. Justify your answer with a calculation. ........................................................................................................................................... ..................................................................................................................................... [2] (c) Describe how you measure the volume of water accurately using the measuring cylinder. You may draw a diagram to help. ................................................................................................................................................... ............................................................................................................................................. [1] (d) (i) Another student does the experiment and uses a balance to measure the mass of the glass marbles. Fig. 5.2 shows the balance before any glass marbles are added. 0.60 g Fig. 5.2 State why this balance does not give the correct reading for the mass of the glass marbles. Suggest what the student does to obtain an accurate mass of the glass marbles. statement .......................................................................................................................... ........................................................................................................................................... suggestion ......................................................................................................................... ........................................................................................................................................... [1] (ii) The student calculates the volume of one glass marble using its diameter. The student measures the diameter of one glass marble using a 30 cm ruler. The student uses two wooden blocks to make the measurement of the diameter more accurate. Describe how the student uses the blocks. You may draw a diagram to help. ........................................................................................................................................... ..................................................................................................................................... [1] (iii) The student repeats the procedure in (a) but uses different marbles. The 5 marbles used have the same diameter and are made of the same glass as those used in the procedure in (a). These marbles have a large air bubble in the centre as shown in Fig. 5.3. glass air Fig. 5.3 State the effect the air bubble has on the density of the marbles. Explain your answer. effect on density of the marbles ........................................................................................ explanation ........................................................................................................................ ........................................................................................................................................... [1] [Total: 11]
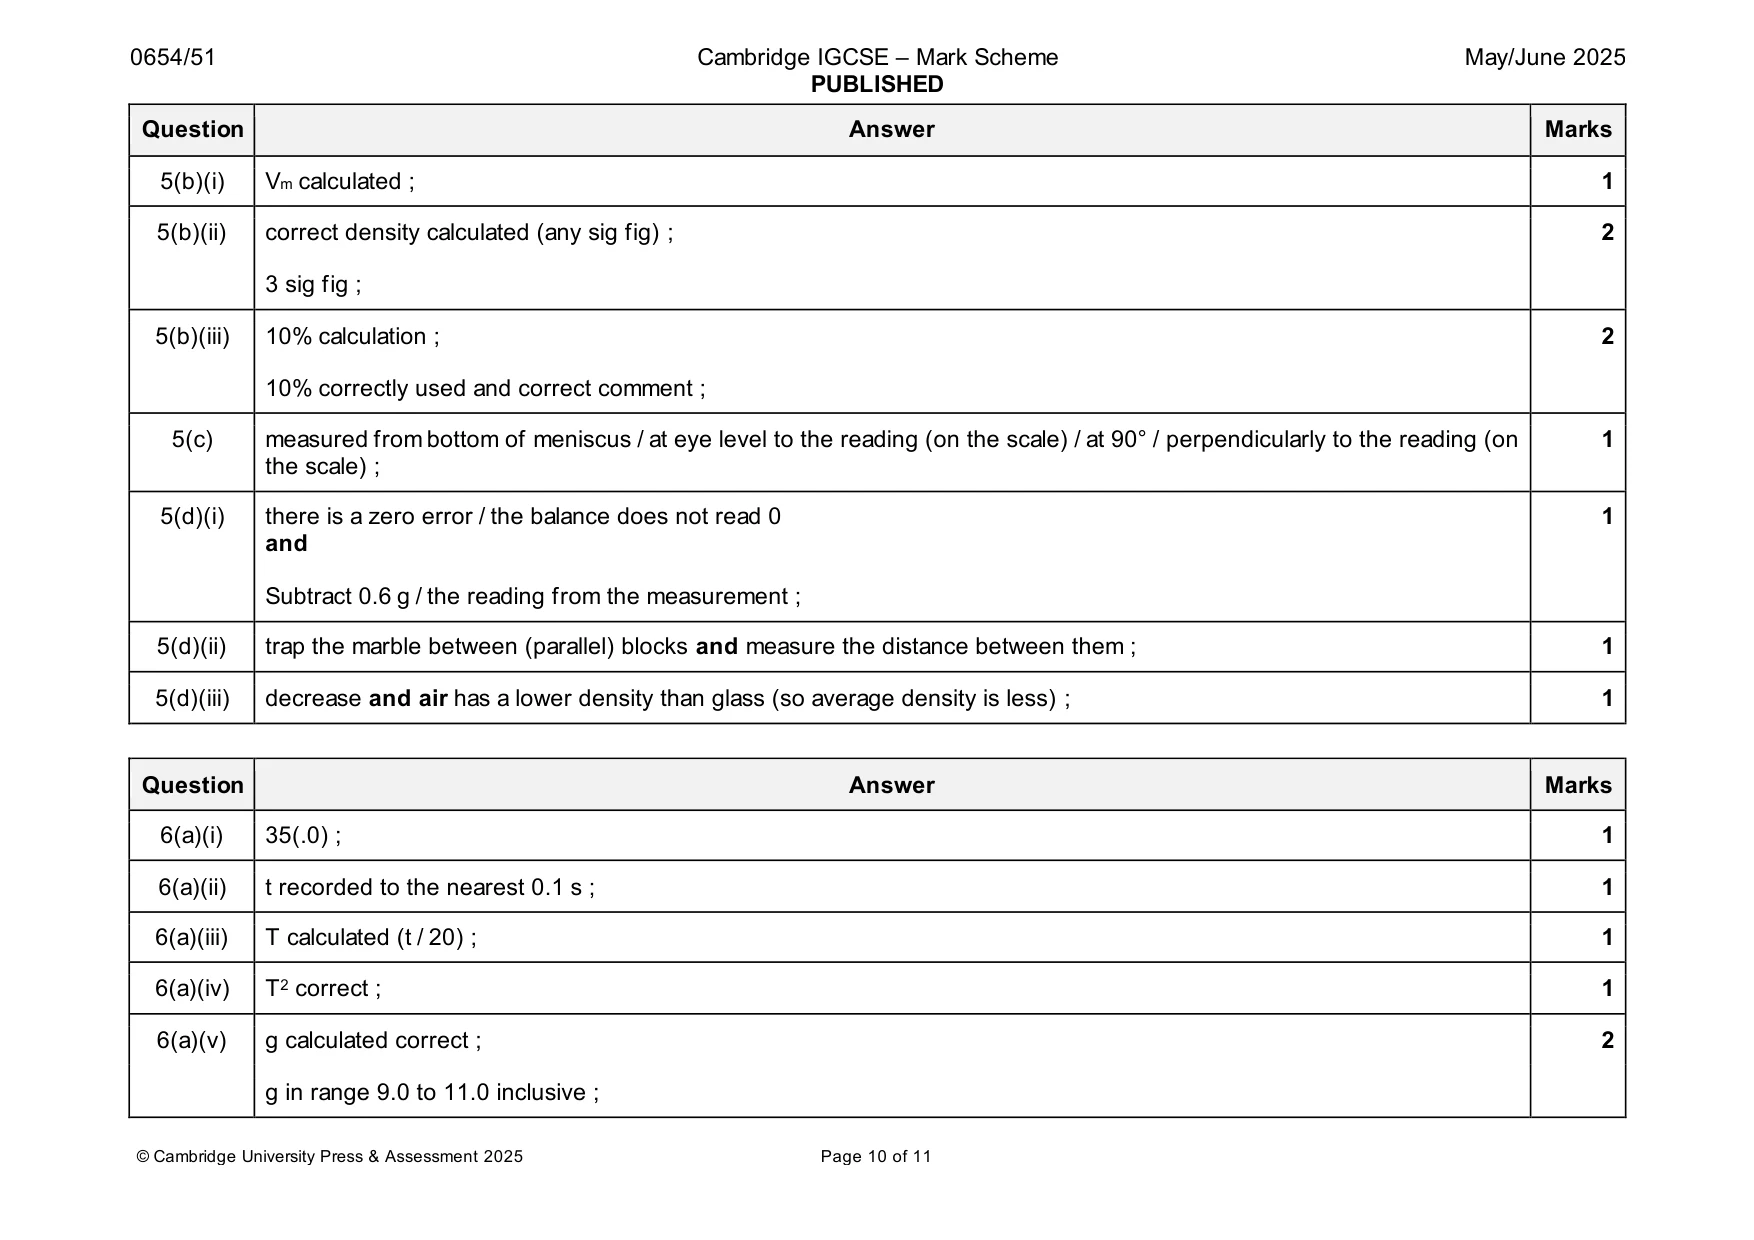
Mark scheme: 5(a) mass of 5 marbles given; 2 two volumes given and V2 > V1 same number of decimal places ; 5(b)(i) Vm calculated ; 1 5(b)(ii) correct density calculated (any sig fig) ; 2 3 sig fig ; 5(b)(iii) 10% calculation ; 2 10% correctly used and correct comment ; 5(c) measured from bottom of meniscus / at eye level to the reading (on the scale) / at 90° / perpendicularly to the reading (on 1 the scale) ; 5(d)(i) there is a zero error / the balance does not read 0 1 and Subtract 0.6 g / the reading from the measurement ; 5(d)(ii) trap the marble between (parallel) blocks and measure the distance between them ; 1 5(d)(iii) decrease and air has a lower density than glass (so average density is less) ; 1
Q6 · You are going to do an experiment to find a value for the acceleration of free fall g…
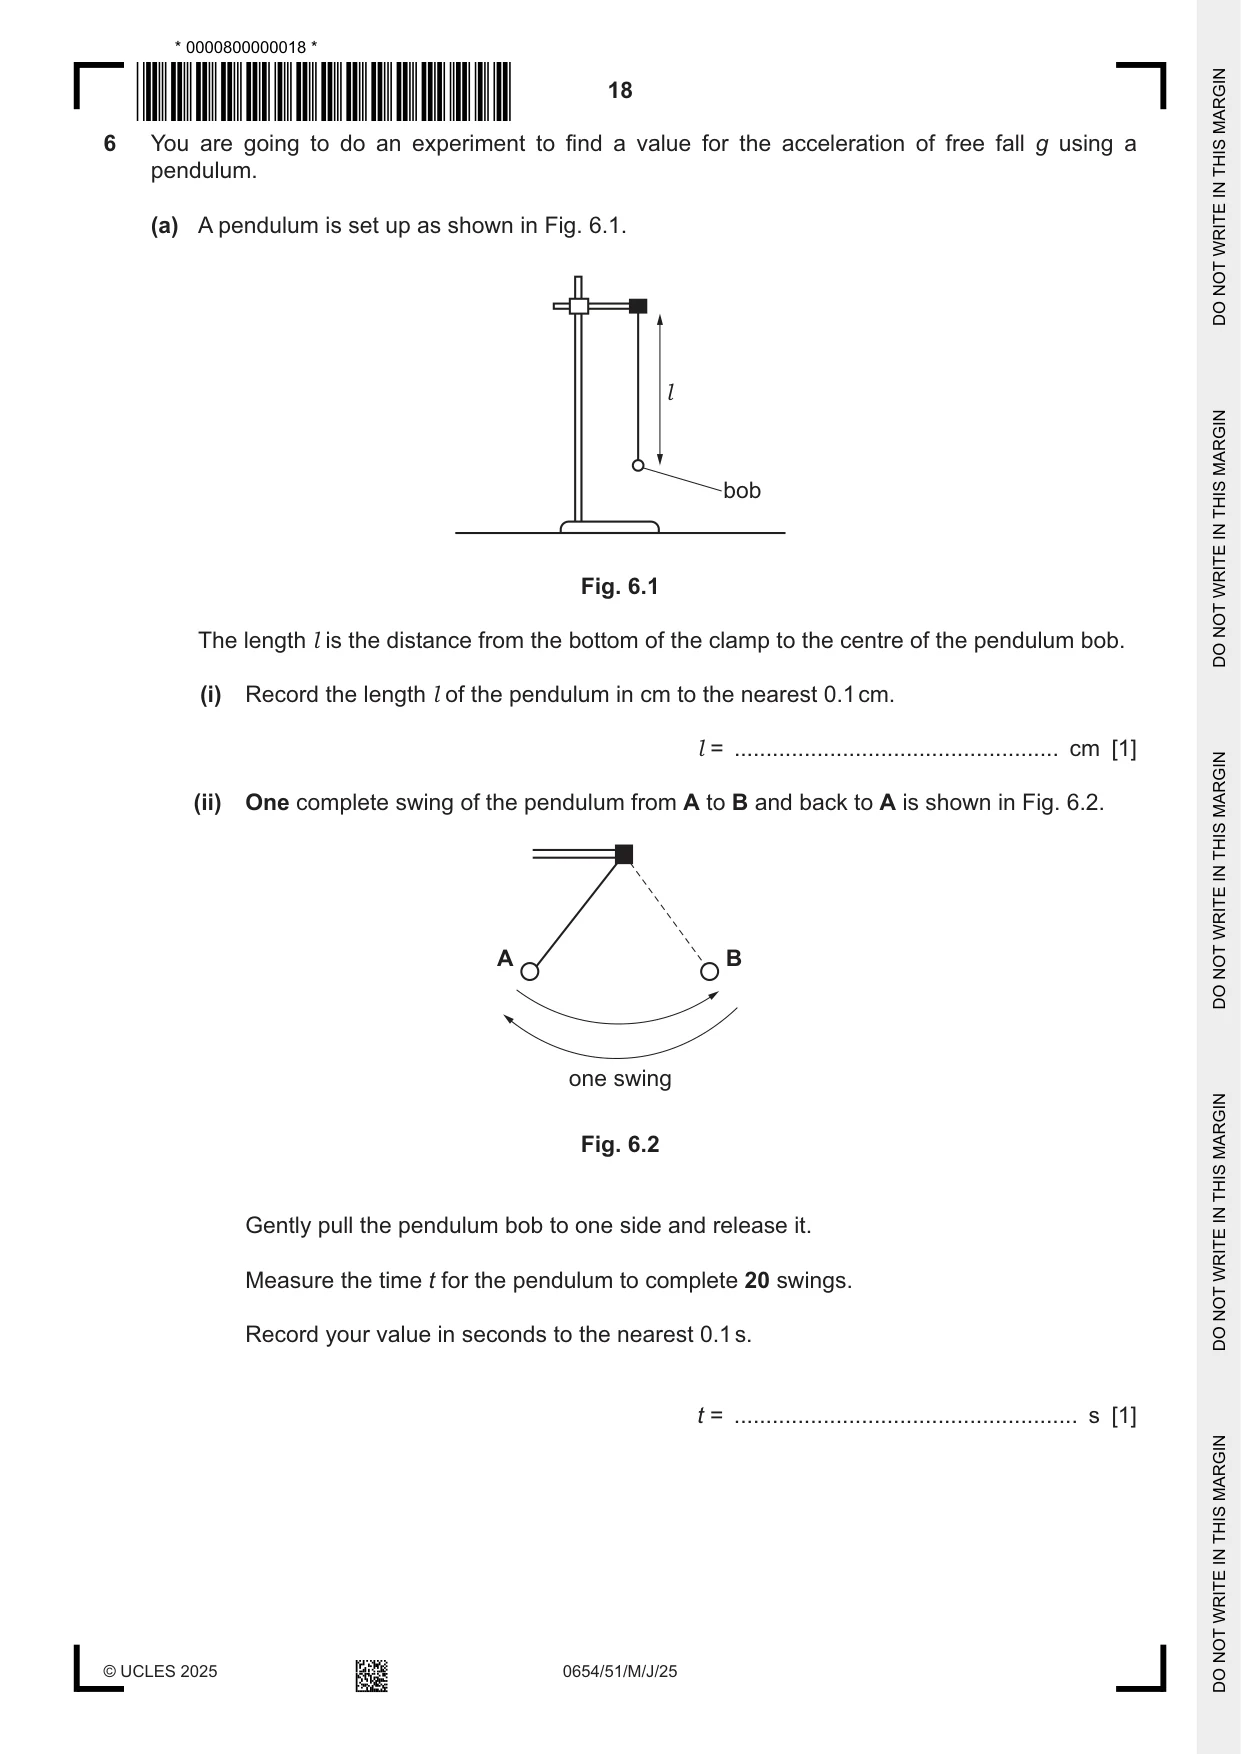
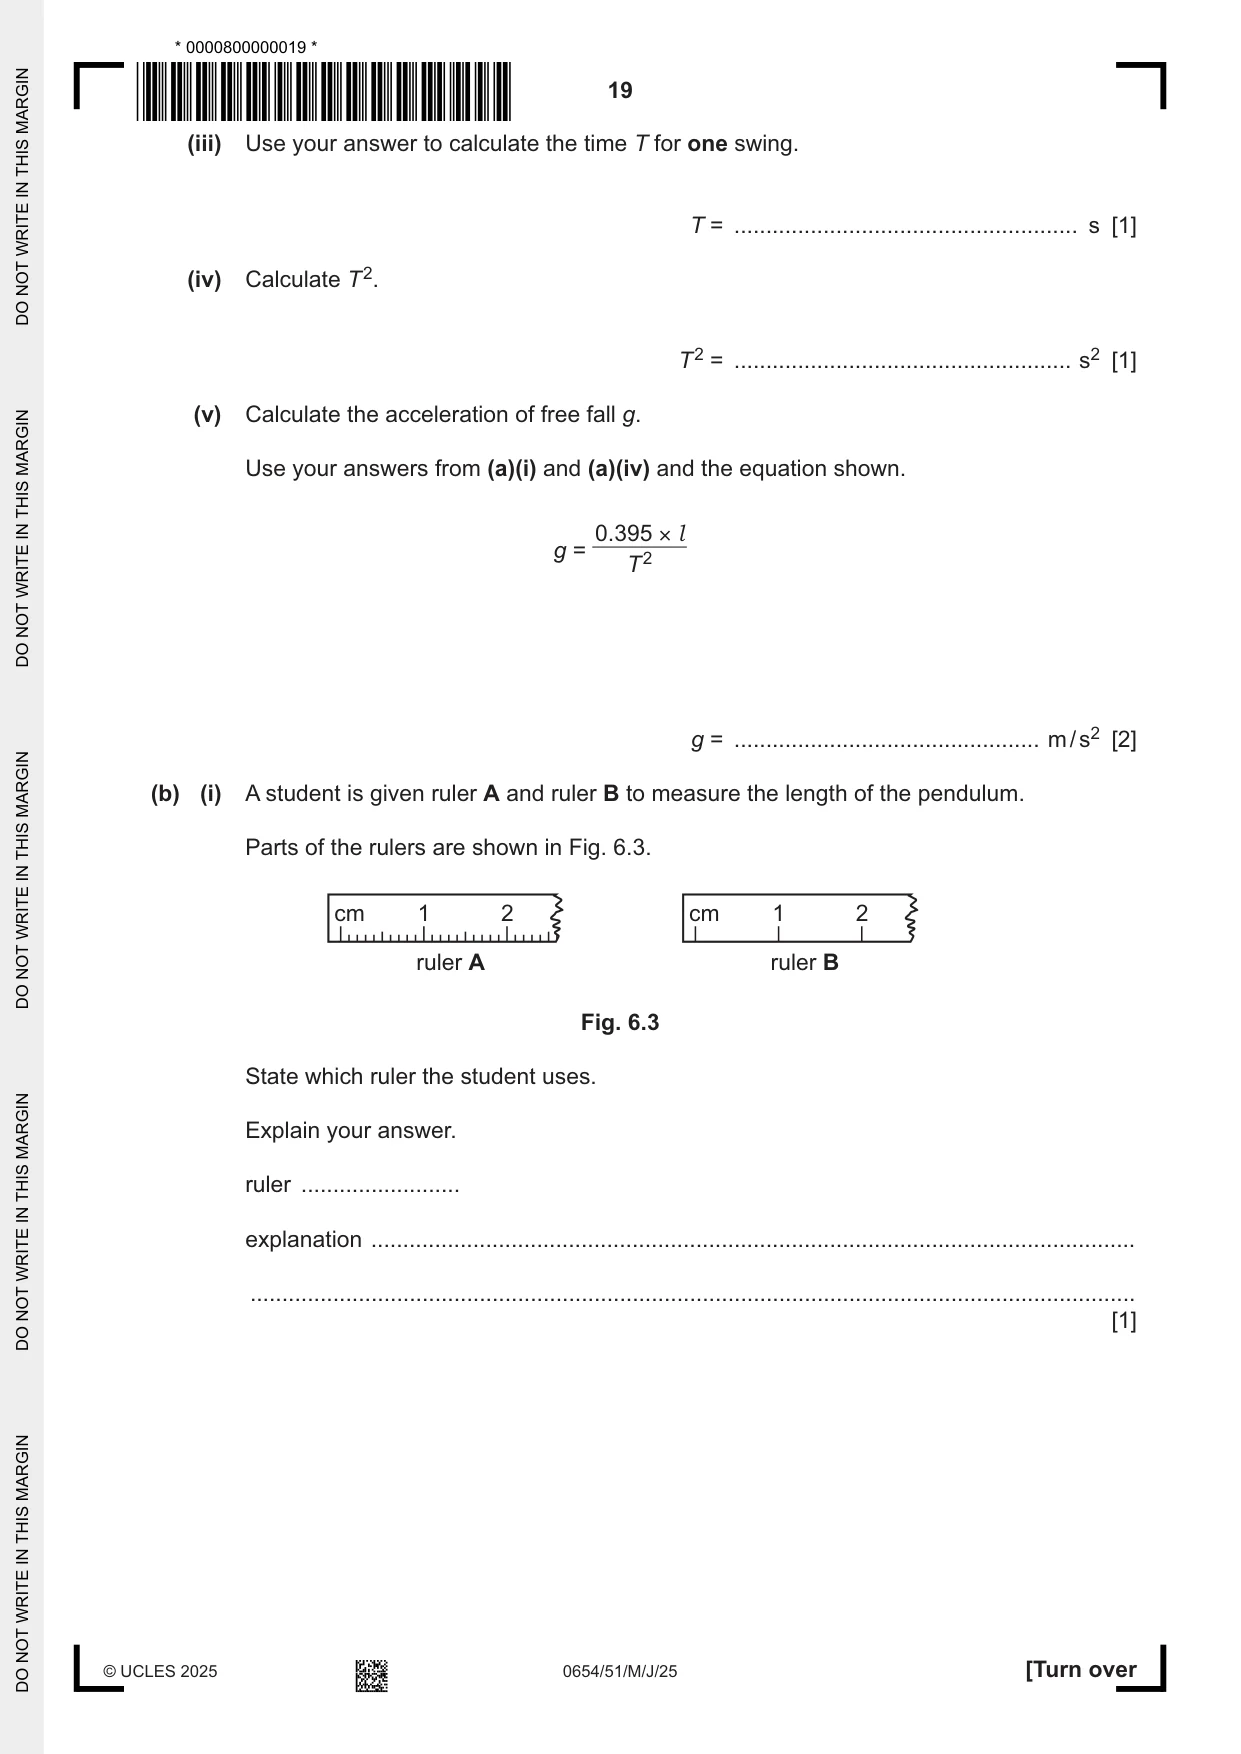
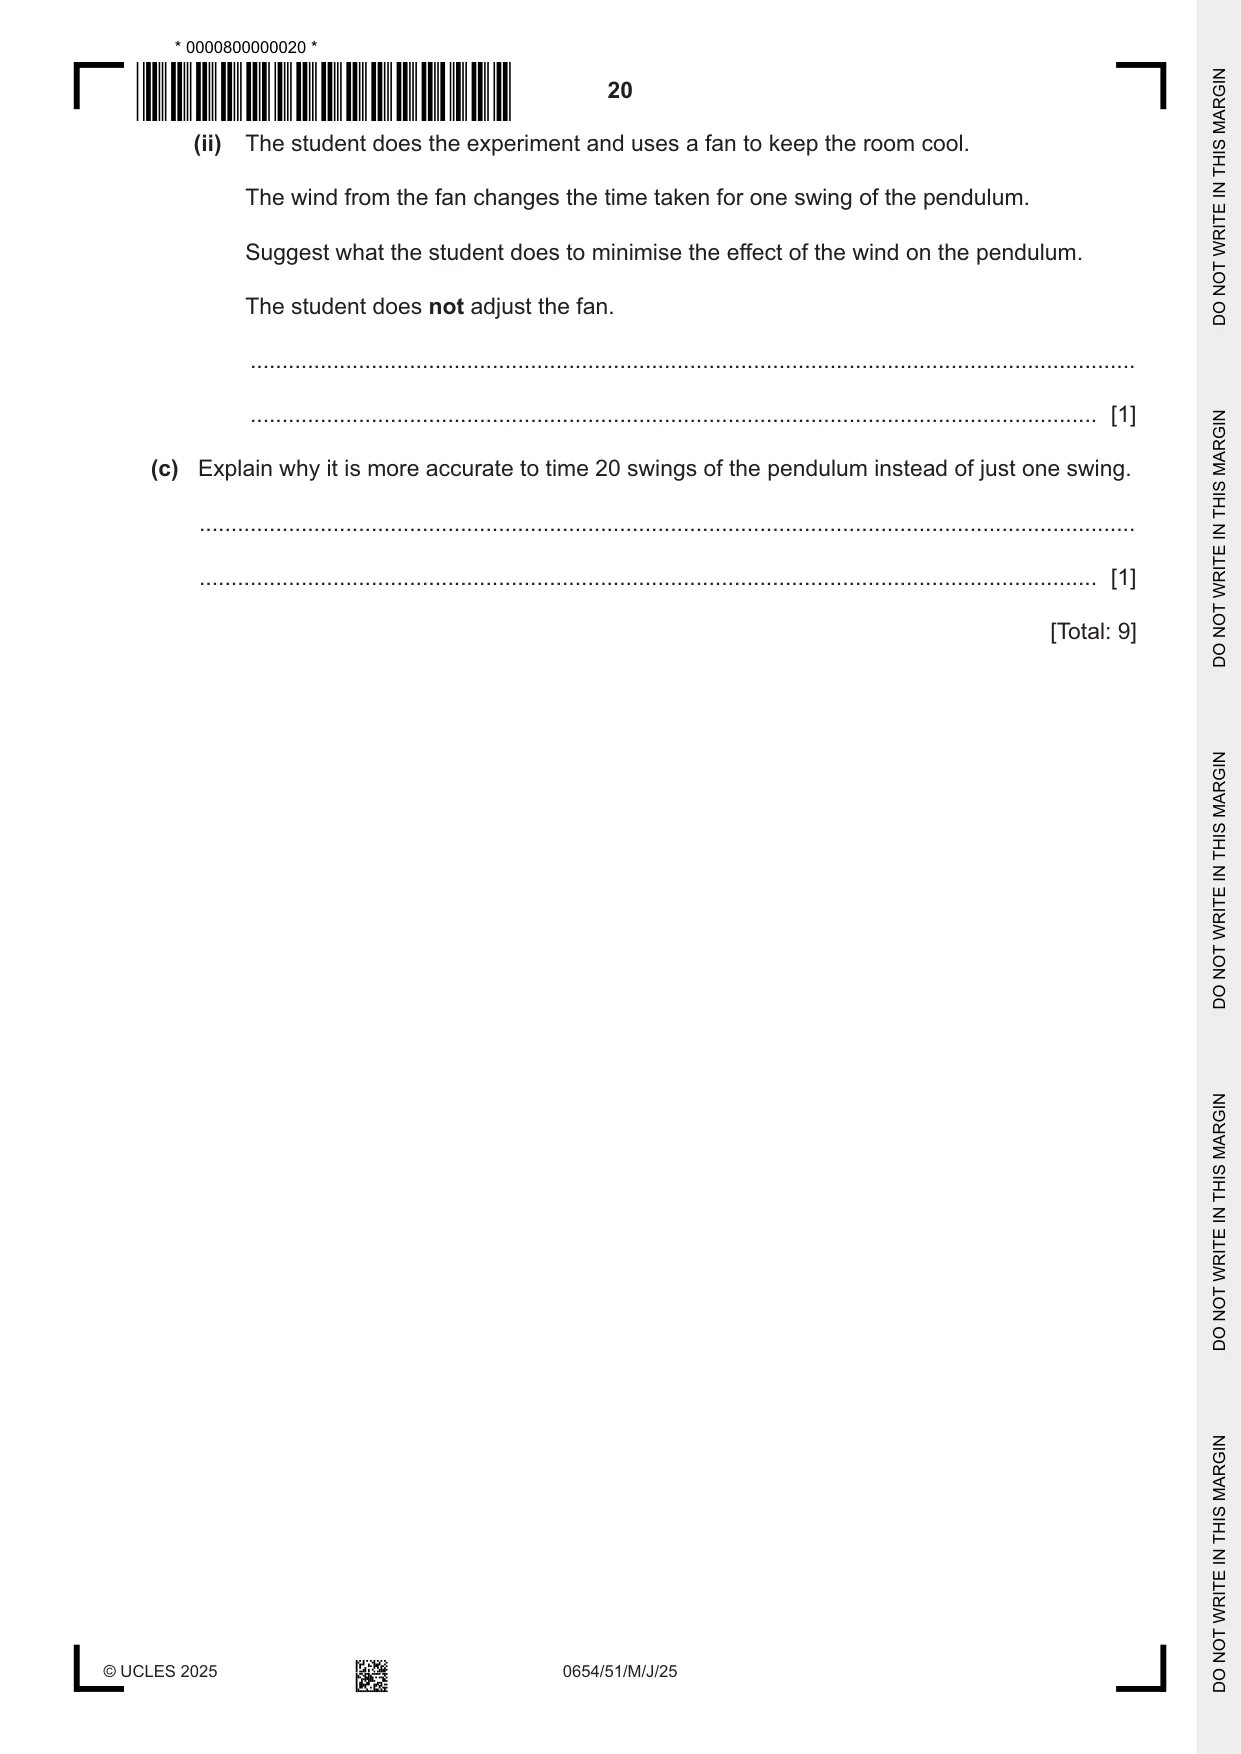
6 You are going to do an experiment to find a value for the acceleration of free fall g using a pendulum. (a) A pendulum is set up as shown in Fig. 6.1. l bob Fig. 6.1 The length l is the distance from the bottom of the clamp to the centre of the pendulum bob. (i) Record the length l of the pendulum in cm to the nearest 0.1 cm. l = ................................................... cm [1] (ii) One complete swing of the pendulum from A to B and back to A is shown in Fig. 6.2. A B one swing Fig. 6.2 Gently pull the pendulum bob to one side and release it. Measure the time t for the pendulum to complete 20 swings. Record your value in seconds to the nearest 0.1 s. t = ...................................................... s [1] (iii) Use your answer to calculate the time T for one swing. T = ...................................................... s [1] (iv) Calculate T 2. T 2 = ..................................................... s2 [1] (v) Calculate the acceleration of free fall g. Use your answers from (a)(i) and (a)(iv) and the equation shown. 0.395 × l g = T 2 g = ................................................ m / s2 [2] (b) (i) A student is given ruler A and ruler B to measure the length of the pendulum. Parts of the rulers are shown in Fig. 6.3. cm 1 2 cm 1 2 ruler A ruler B Fig. 6.3 State which ruler the student uses. Explain your answer. ruler ......................... explanation ........................................................................................................................ ........................................................................................................................................... [1] (ii) The student does the experiment and uses a fan to keep the room cool. The wind from the fan changes the time taken for one swing of the pendulum. Suggest what the student does to minimise the effect of the wind on the pendulum. The student does not adjust the fan. ........................................................................................................................................... ..................................................................................................................................... [1] (c) Explain why it is more accurate to time 20 swings of the pendulum instead of just one swing. ................................................................................................................................................... ............................................................................................................................................. [1] [Total: 9]
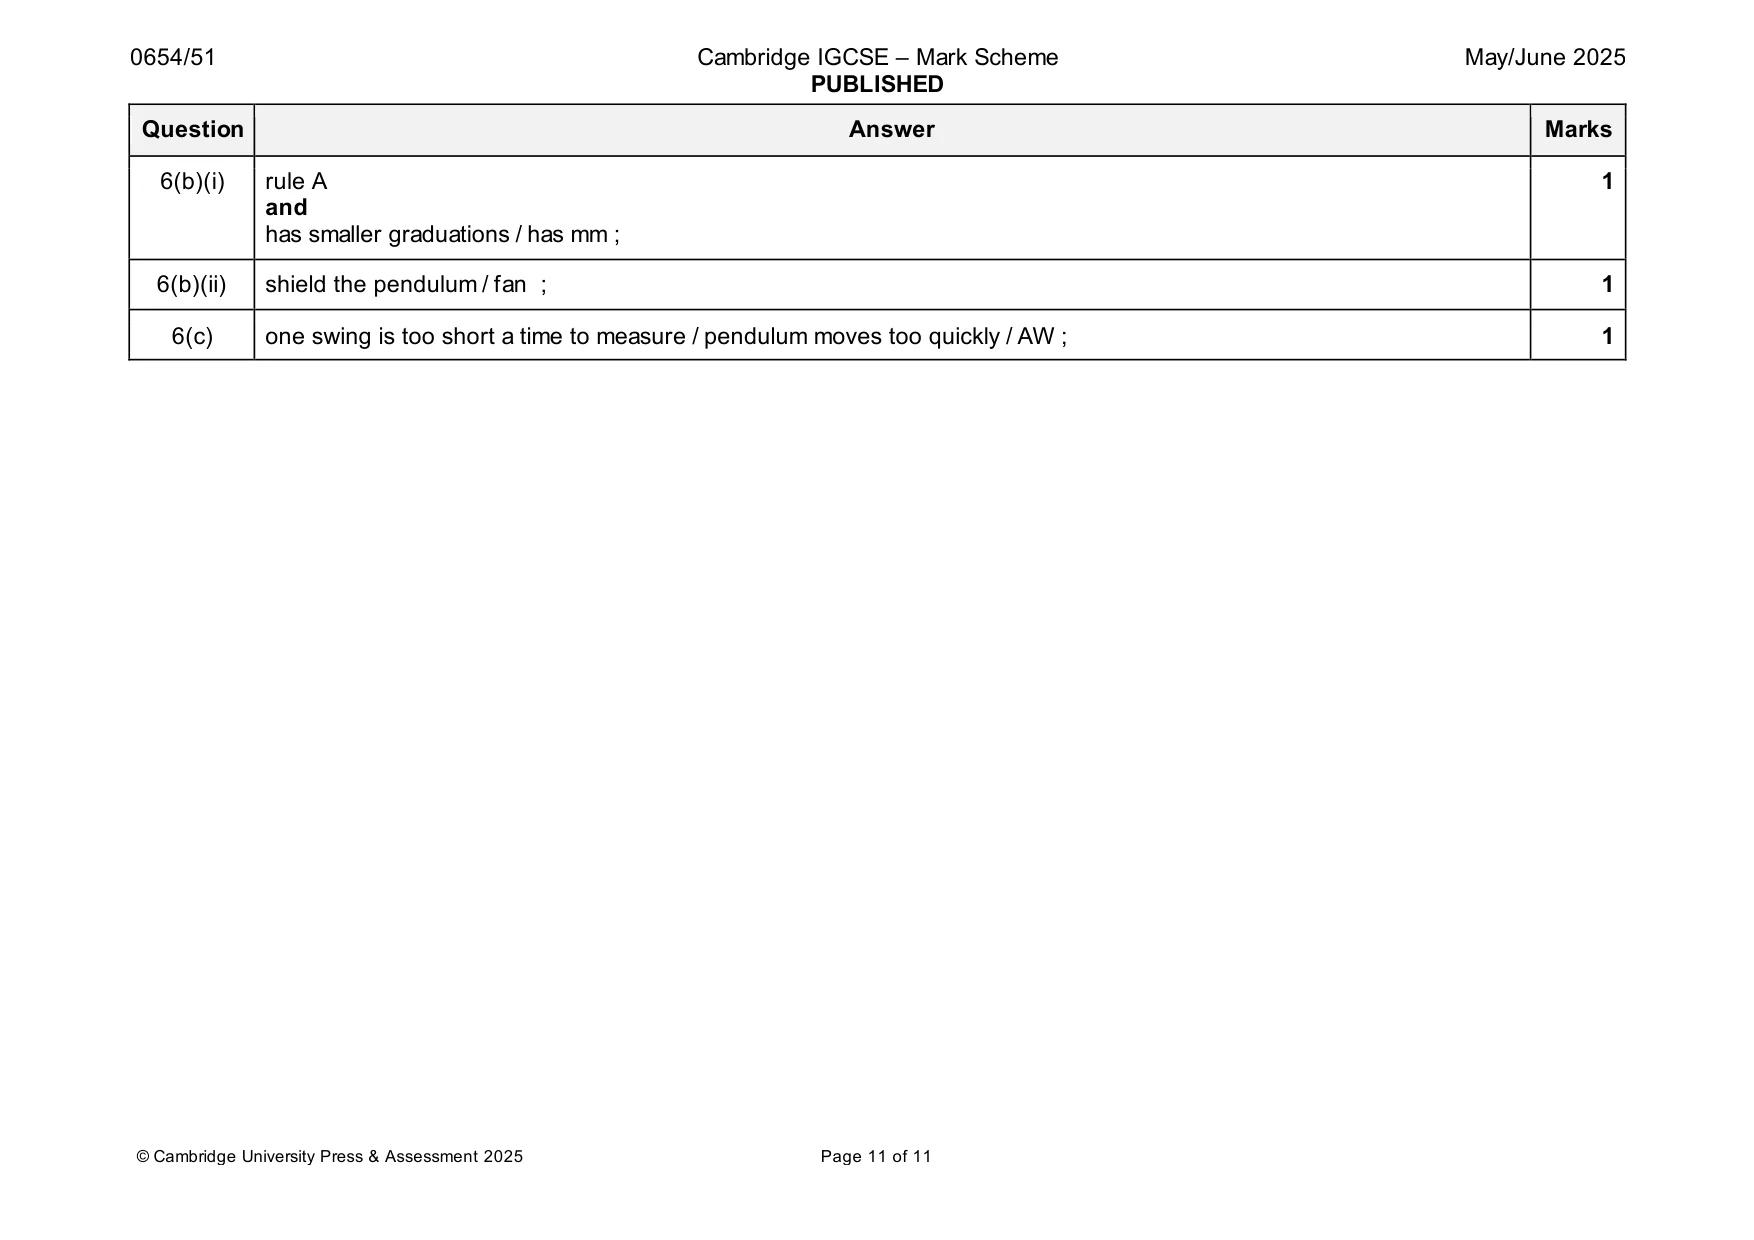
Mark scheme: 6(a)(i) 35(.0) ; 1 6(a)(ii) t recorded to the nearest 0.1 s ; 1 6(a)(iii) T calculated (t / 20) ; 1 6(a)(iv) T2 correct ; 1 6(a)(v) g calculated correct ; 2 g in range 9.0 to 11.0 inclusive ; 6(b)(i) rule A 1 and has smaller graduations / has mm ; 6(b)(ii) shield the pendulum / fan ; 1 6(c) one swing is too short a time to measure / pendulum moves too quickly / AW ; 1
What was in this paper
The subtopics covered by these 6 questions, and how many questions each got. Open one in a new tab to see every Cambridge question on it.
What you needed in this session
Cambridge’s own grade thresholds for 2025 May/June, Paper 5 · Variant 1. A higher threshold means an easier paper — the bar moves with how the cohort did.