Cambridge IGCSE Sciences - Co-ordinated (Double) 0654 — 2010 May/June Paper 6 · Variant 1
0654/61/M/J/10 · 60 marks · ≈68 min
The question paper and its mark scheme, free to read here and free to download. This is Cambridge’s own paper, exactly as it was sat.
Question paper20 pages
Mark scheme4 pages
Answers below. Sit the paper first if you are practising.
Paper as text
Question paper, page 1
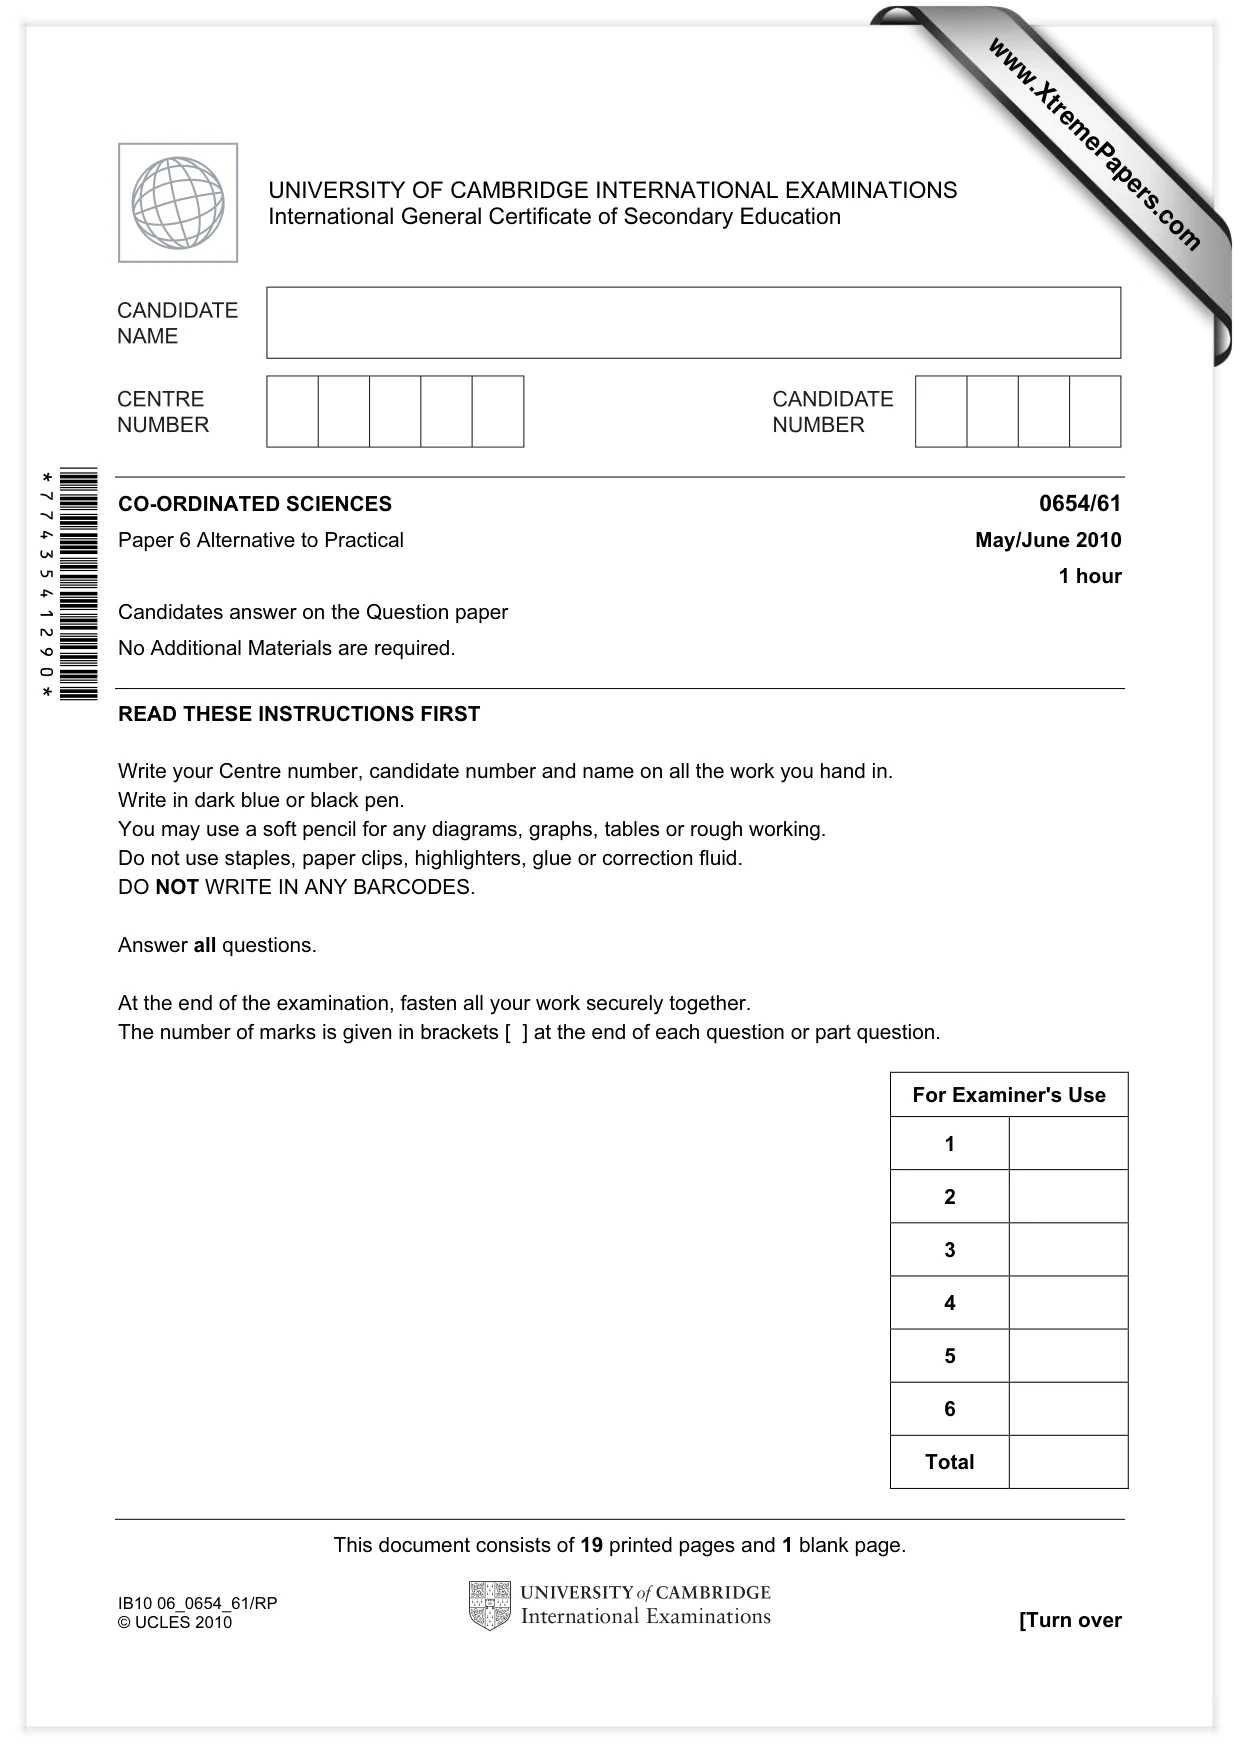
This document consists of 19 printed pages and 1 blank page. IB10 06_0654_61/RP © UCLES 2010 [Turn over *7743541290* For Examiner's Use 1 2 3 4 5 6 Total UNIVERSITY OF CAMBRIDGE INTERNATIONAL EXAMINATIONS International General Certificate of Secondary Education CO-ORDINATED SCIENCES 0654/61 Paper 6 Alternative to Practical May/June 2010 1 hour Candidates answer on the Question paper No Additional Materials are required. READ THESE INSTRUCTIONS FIRST Write your Centre number, candidate number and name on all the work you hand in. Write in dark blue or black pen. You may use a soft pencil for any diagrams, graphs, tables or rough working. Do not use staples, paper clips, highlighters, glue or correction fluid. DO NOT WRITE IN ANY BARCODES. Answer all questions. At the end of the examination, fasten all your work securely together. The number of marks is given in brackets [ ] at the end of each question or part question. www.XtremePapers.com
Question paper, page 2
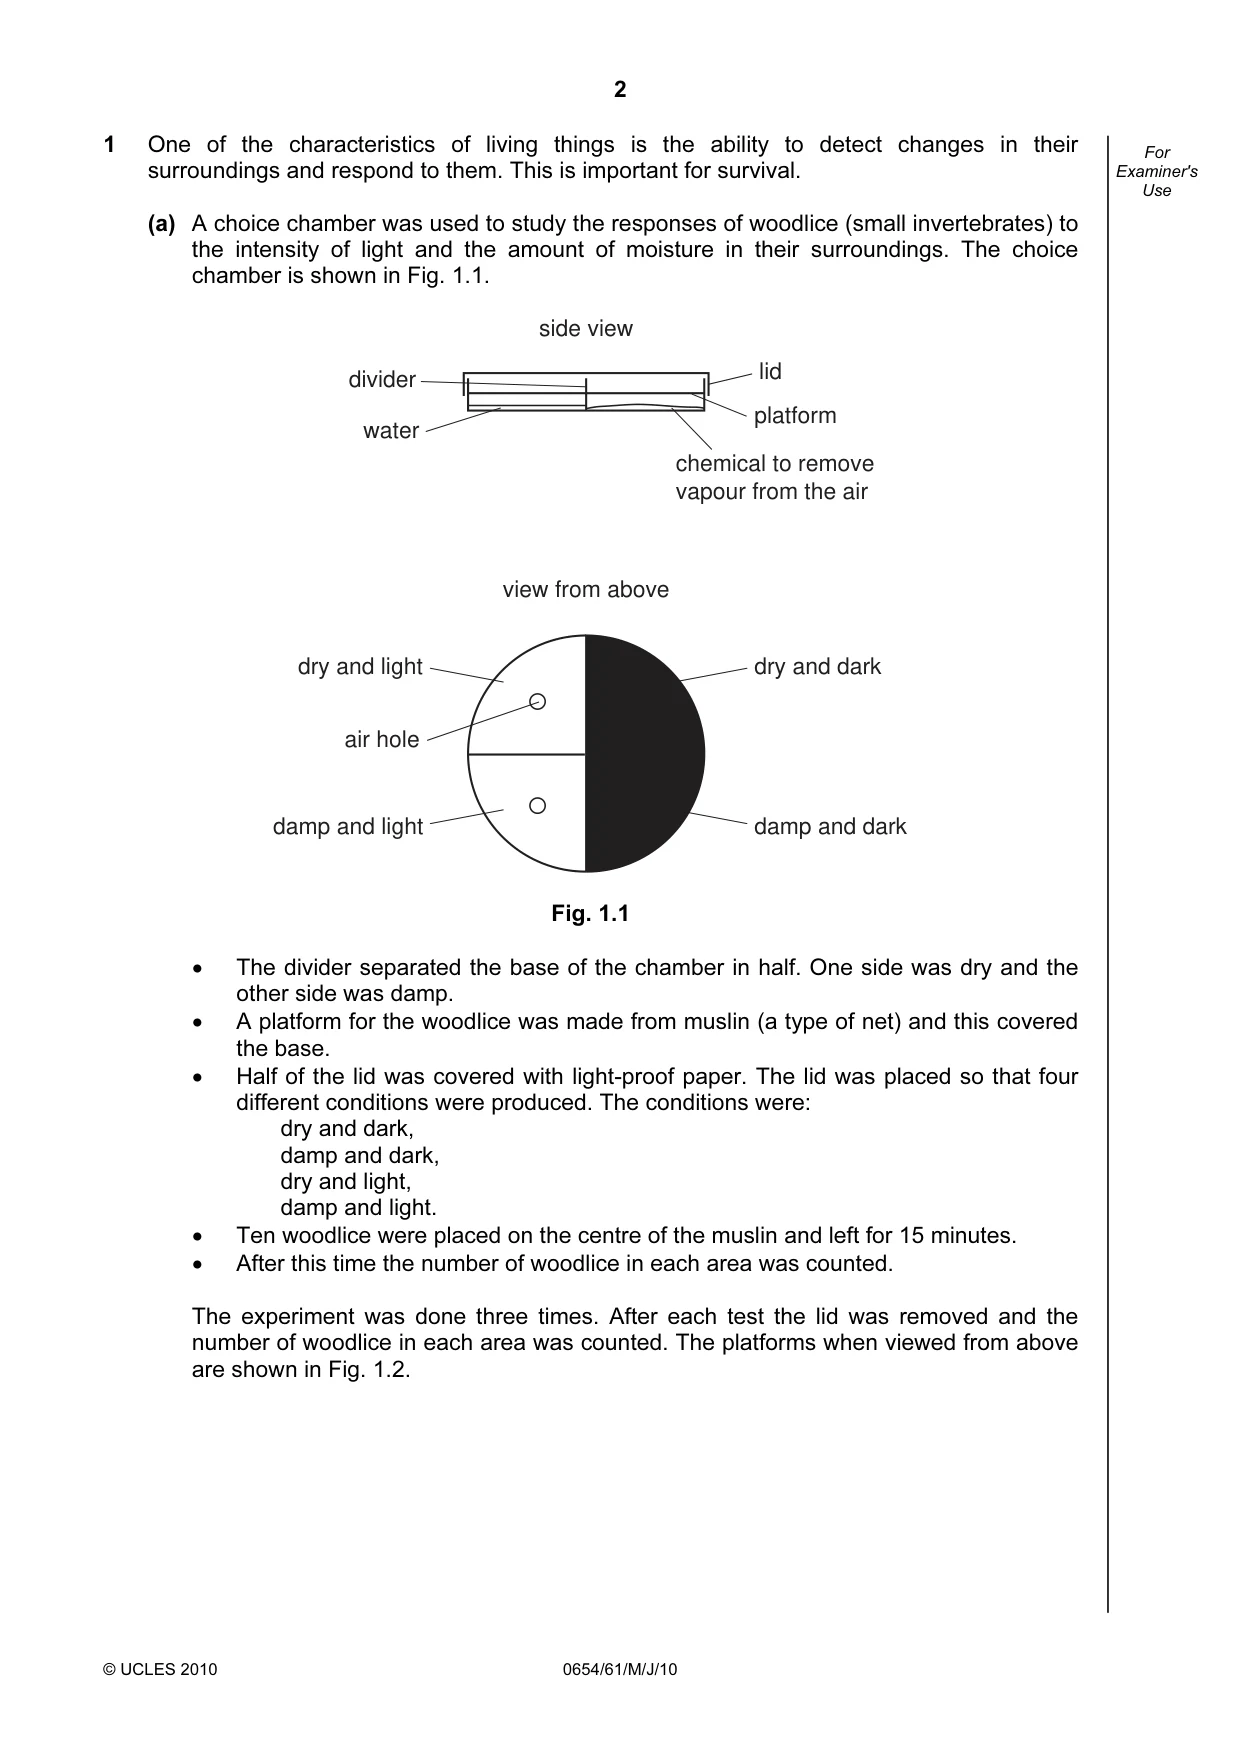
2 © UCLES 2010 0654/61/M/J/10 For Examiner's Use 1 One of the characteristics of living things is the ability to detect changes in their surroundings and respond to them. This is important for survival. (a) A choice chamber was used to study the responses of woodlice (small invertebrates) to the intensity of light and the amount of moisture in their surroundings. The choice chamber is shown in Fig. 1.1. side view view from above water chemical to remove vapour from the air divider platform lid dry and light dry and dark damp and light damp and dark air hole Fig. 1.1 • The divider separated the base of the chamber in half. One side was dry and the other side was damp. • A platform for the woodlice was made from muslin (a type of net) and this covered the base. • Half of the lid was covered with light-proof paper. The lid was placed so that four different conditions were produced. The conditions were: dry and dark, damp and dark, dry and light, damp and light. • Ten woodlice were placed on the centre of the muslin and left for 15 minutes. • After this time the number of woodlice in each area was counted. The experiment was done three times. After each test the lid was removed and the number of woodlice in each area was counted. The platforms when viewed from above are shown in Fig. 1.2.
Question paper, page 3
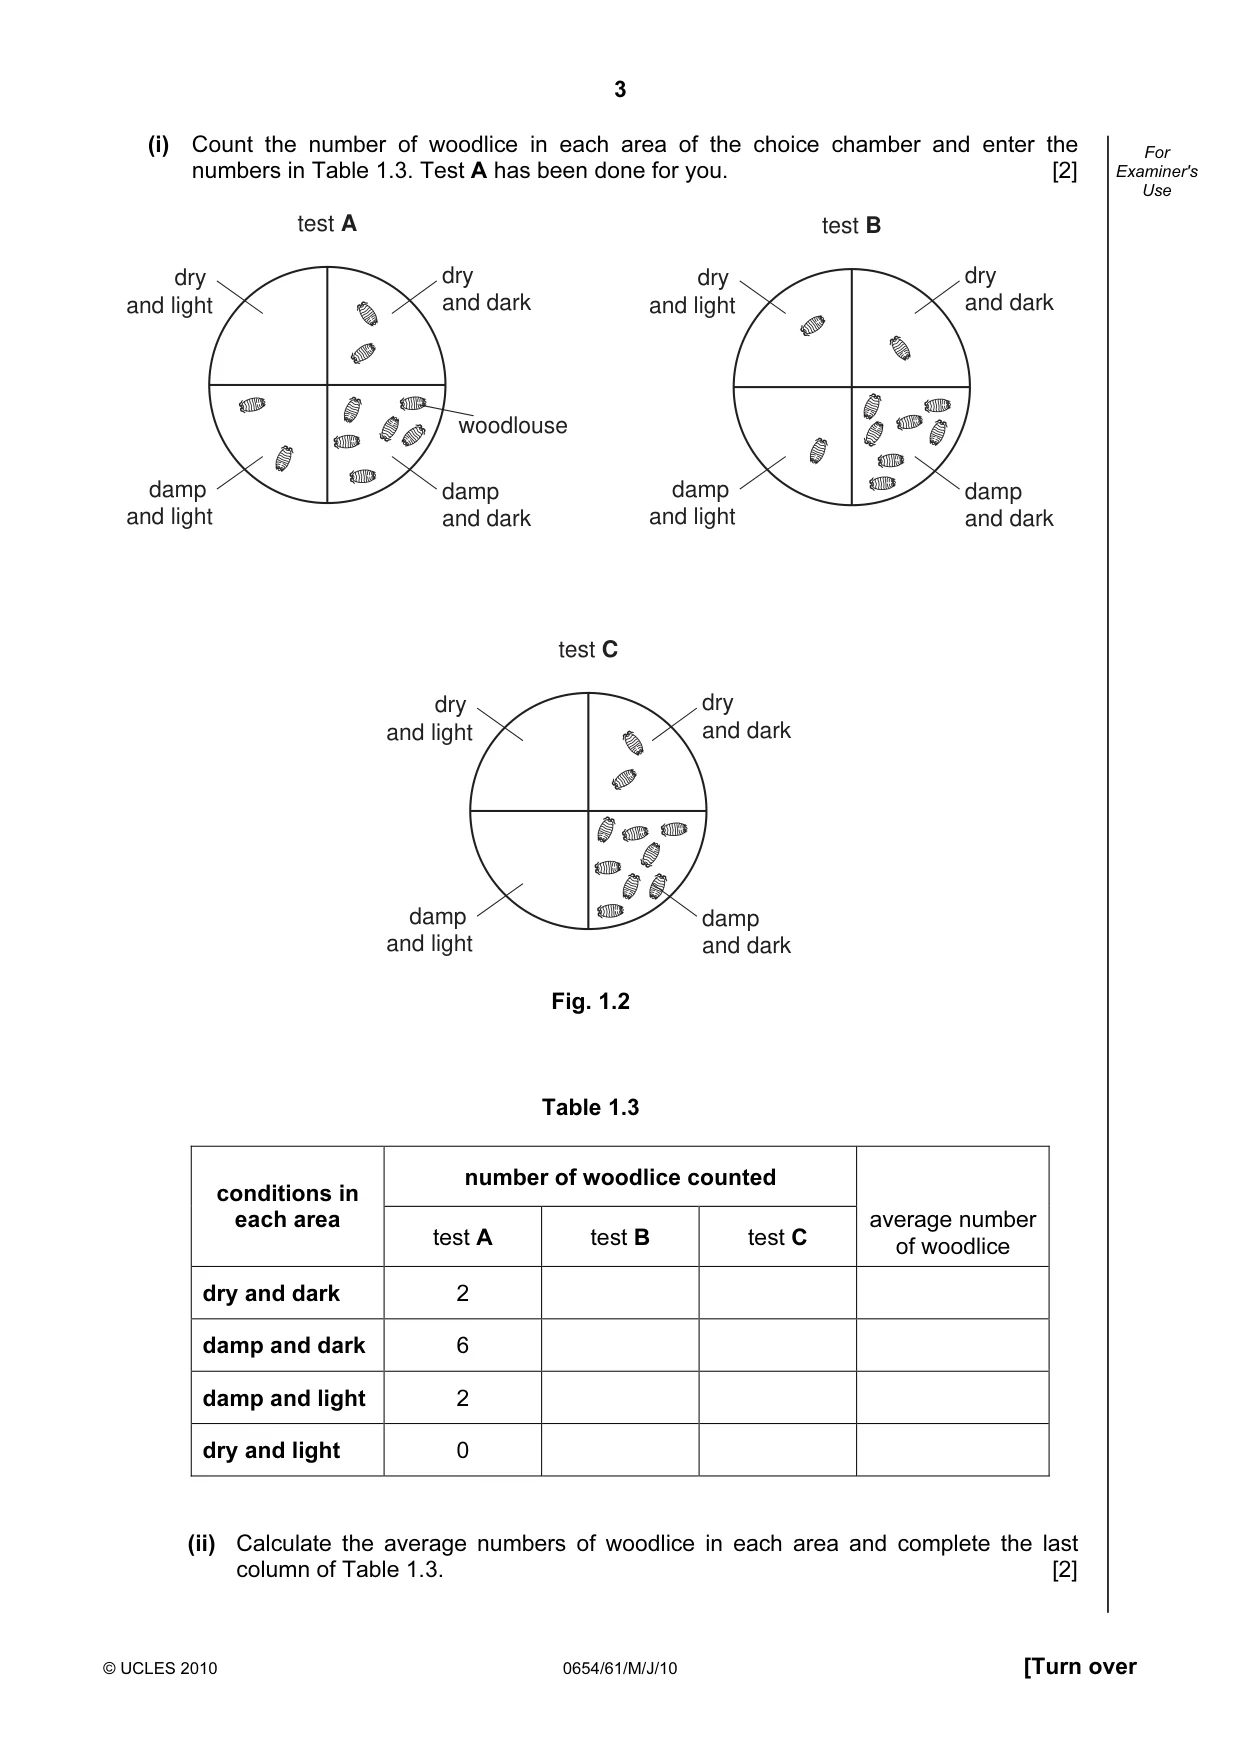
3 © UCLES 2010 0654/61/M/J/10 [Turn over For Examiner's Use (i) Count the number of woodlice in each area of the choice chamber and enter the numbers in Table 1.3. Test A has been done for you. [2] dry and light damp and light dry and dark woodlouse damp and dark dry and light damp and light dry and dark damp and dark test A test B test C dry and light damp and light dry and dark damp and dark Fig. 1.2 Table 1.3 number of woodlice counted conditions in each area test A test B test C average number of woodlice dry and dark 2 damp and dark 6 damp and light 2 dry and light 0 (ii) Calculate the average numbers of woodlice in each area and complete the last column of Table 1.3. [2]
Question paper, page 4
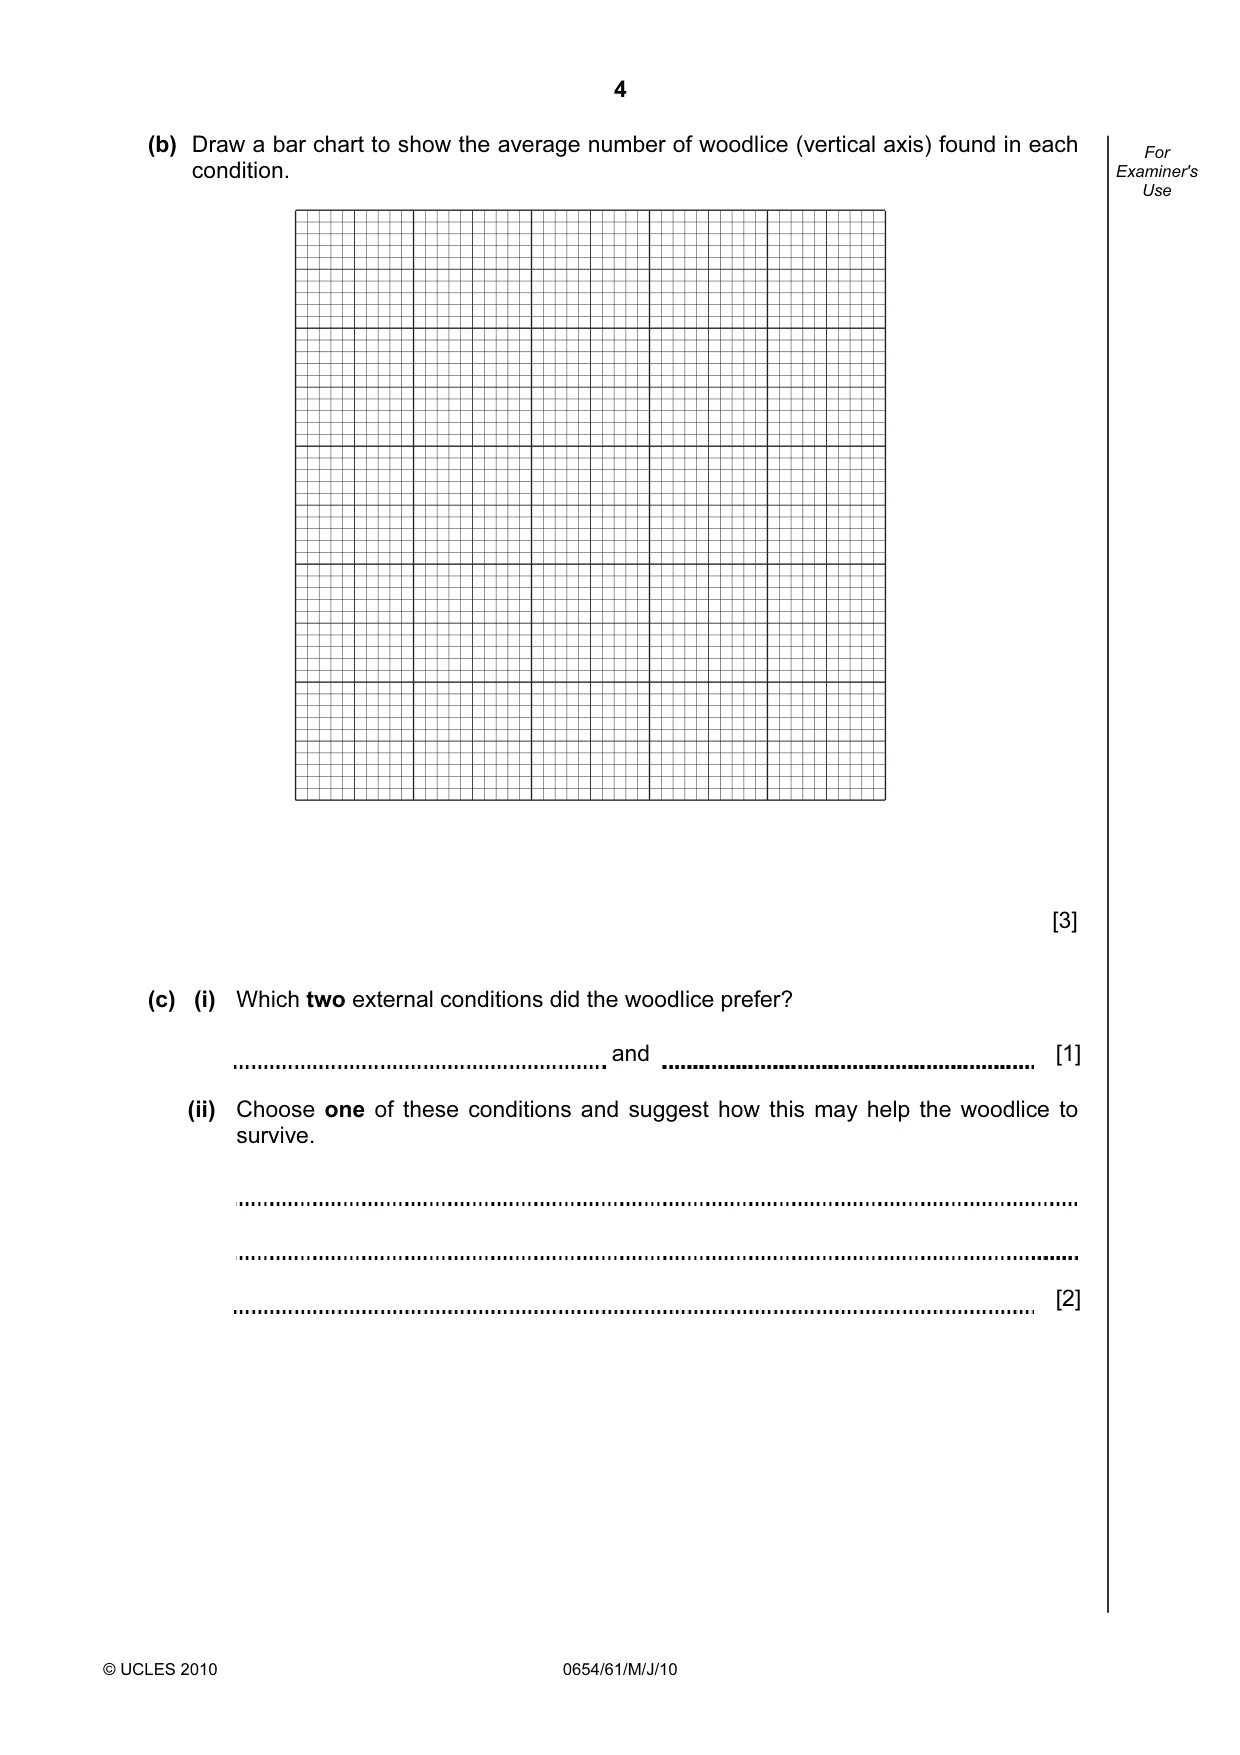
4 © UCLES 2010 0654/61/M/J/10 For Examiner's Use (b) Draw a bar chart to show the average number of woodlice (vertical axis) found in each condition. [3] (c) (i) Which two external conditions did the woodlice prefer? and [1] (ii) Choose one of these conditions and suggest how this may help the woodlice to survive. [2]
Question paper, page 5
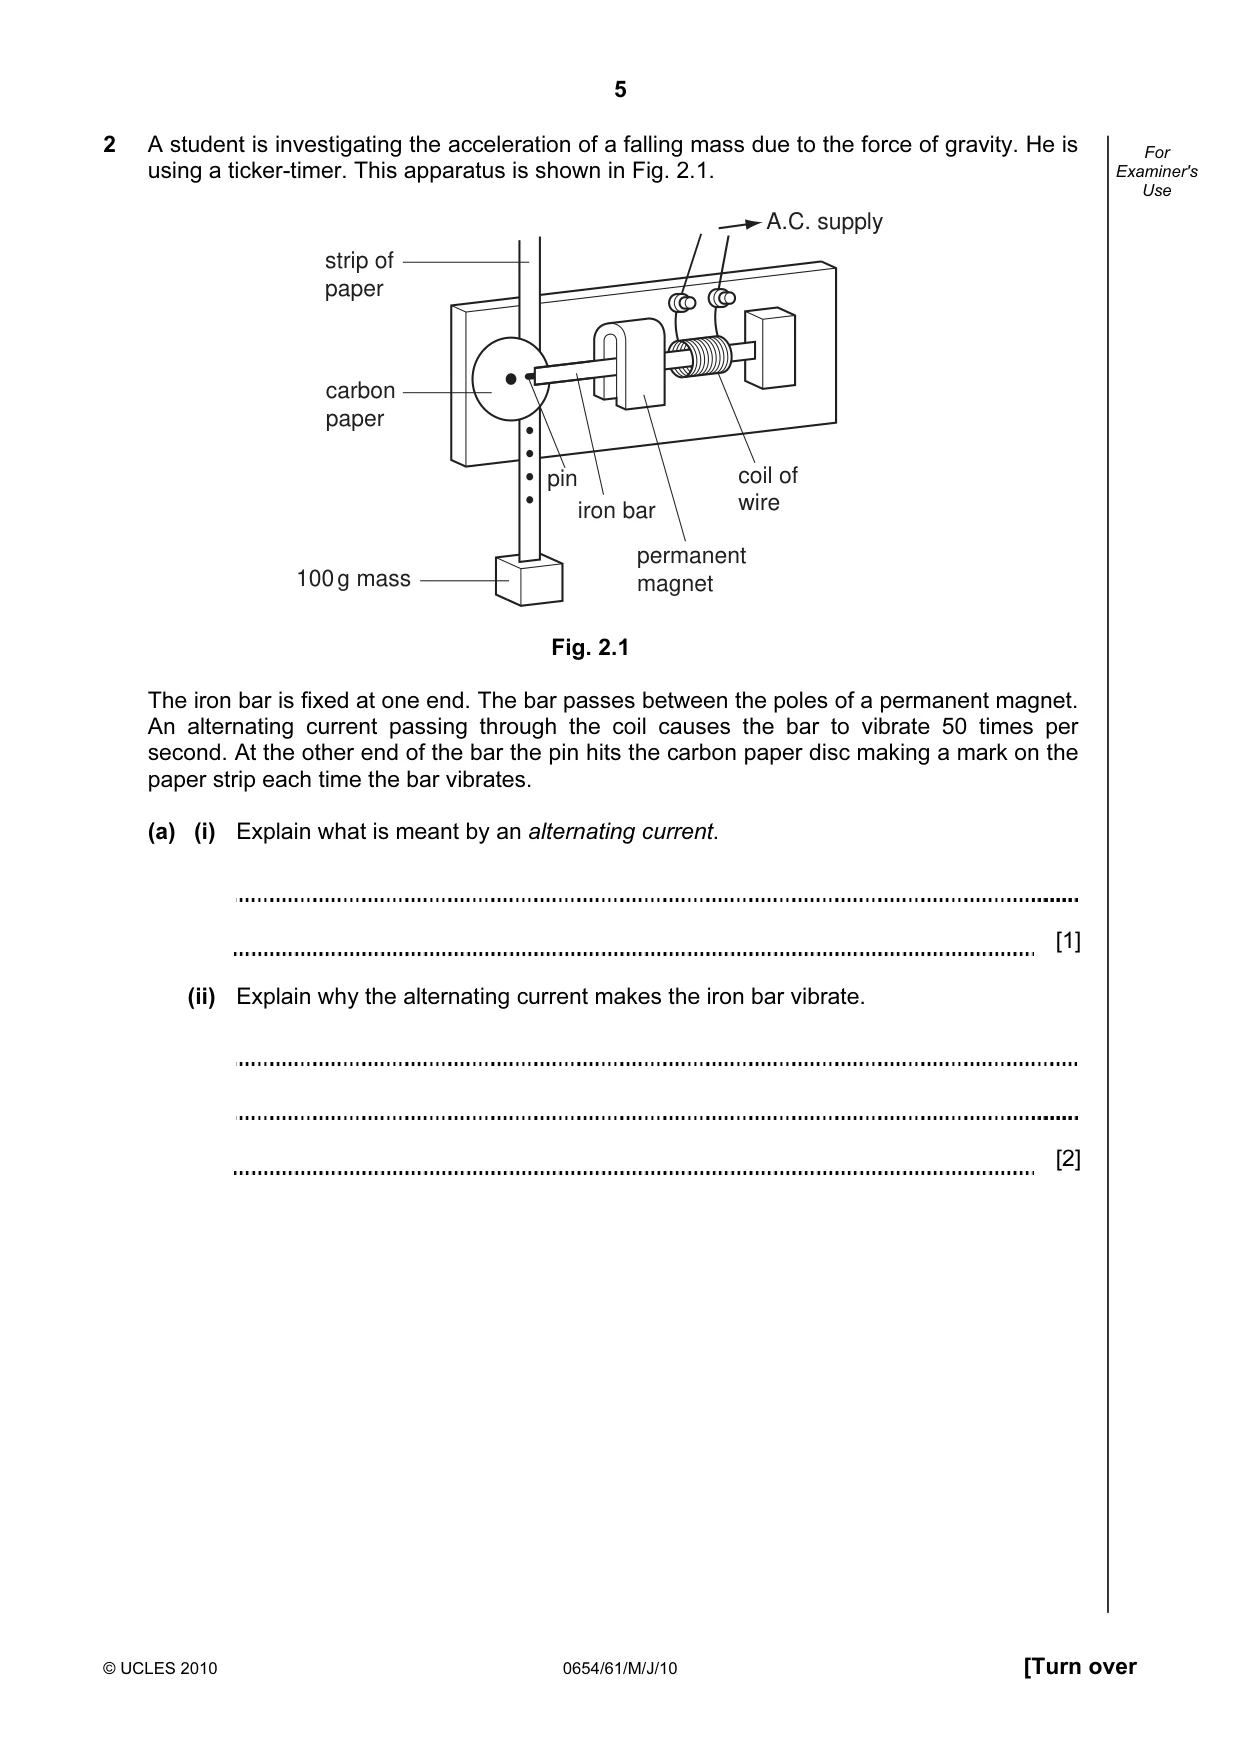
5 © UCLES 2010 0654/61/M/J/10 [Turn over For Examiner's Use 2 A student is investigating the acceleration of a falling mass due to the force of gravity. He is using a ticker-timer. This apparatus is shown in Fig. 2.1. 100 g mass carbon paper strip of paper iron bar permanent magnet coil of wire A.C. supply pin Fig. 2.1 The iron bar is fixed at one end. The bar passes between the poles of a permanent magnet. An alternating current passing through the coil causes the bar to vibrate 50 times per second. At the other end of the bar the pin hits the carbon paper disc making a mark on the paper strip each time the bar vibrates. (a) (i) Explain what is meant by an alternating current. [1] (ii) Explain why the alternating current makes the iron bar vibrate. [2]
Question paper, page 6
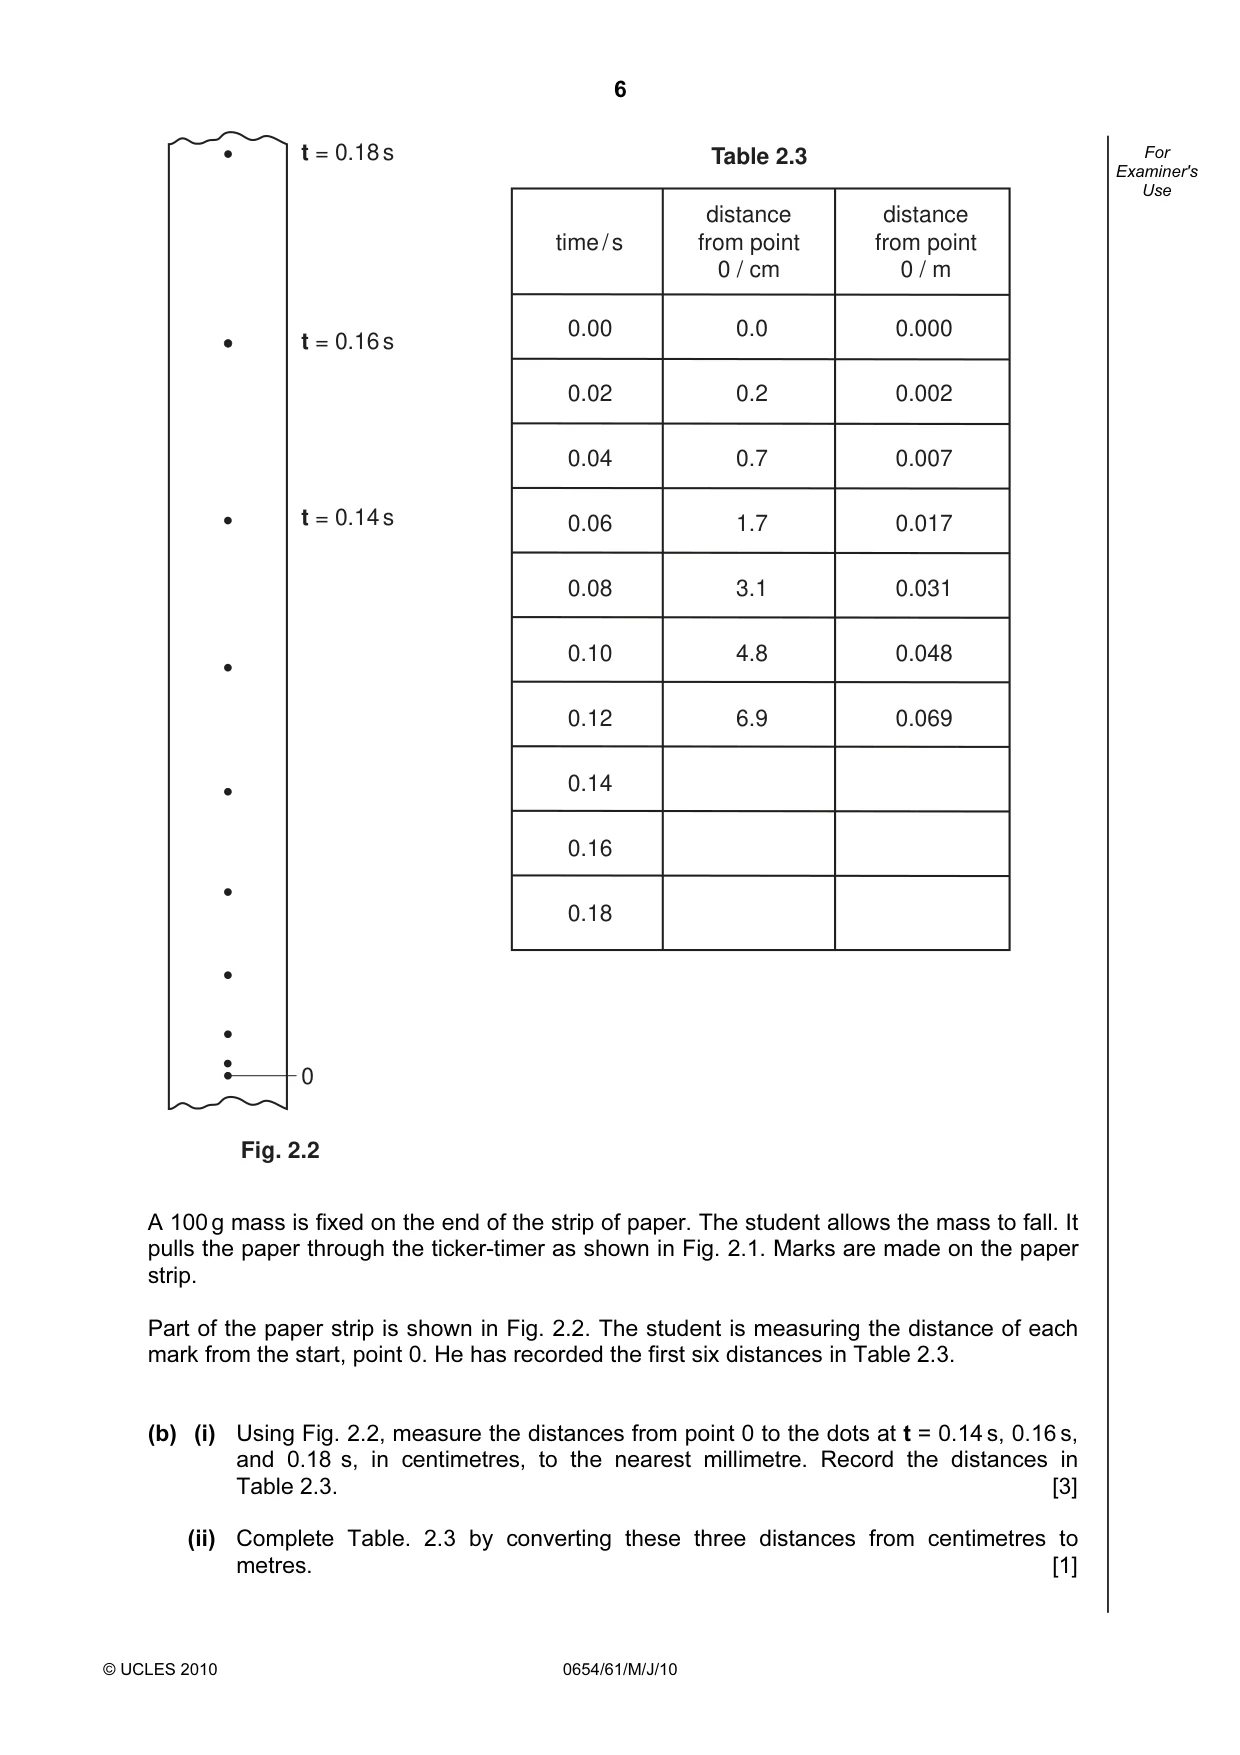
6 © UCLES 2010 0654/61/M/J/10 For Examiner's Use t = 0.18 s t = 0.16 s t = 0.14 s 0 distance distance time / s from point from point 0 / cm 0 / m 0.00 0.0 0.000 0.02 0.2 0.002 0.04 0.7 0.007 0.06 1.7 0.017 0.08 3.1 0.031 0.10 4.8 0.048 0.12 6.9 0.069 0.14 0.16 0.18 Table 2.3 Fig. 2.2 A 100 g mass is fixed on the end of the strip of paper. The student allows the mass to fall. It pulls the paper through the ticker-timer as shown in Fig. 2.1. Marks are made on the paper strip. Part of the paper strip is shown in Fig. 2.2. The student is measuring the distance of each mark from the start, point 0. He has recorded the first six distances in Table 2.3. (b) (i) Using Fig. 2.2, measure the distances from point 0 to the dots at t = 0.14 s, 0.16 s, and 0.18 s, in centimetres, to the nearest millimetre. Record the distances in Table 2.3. [3] (ii) Complete Table. 2.3 by converting these three distances from centimetres to metres. [1]
Question paper, page 7
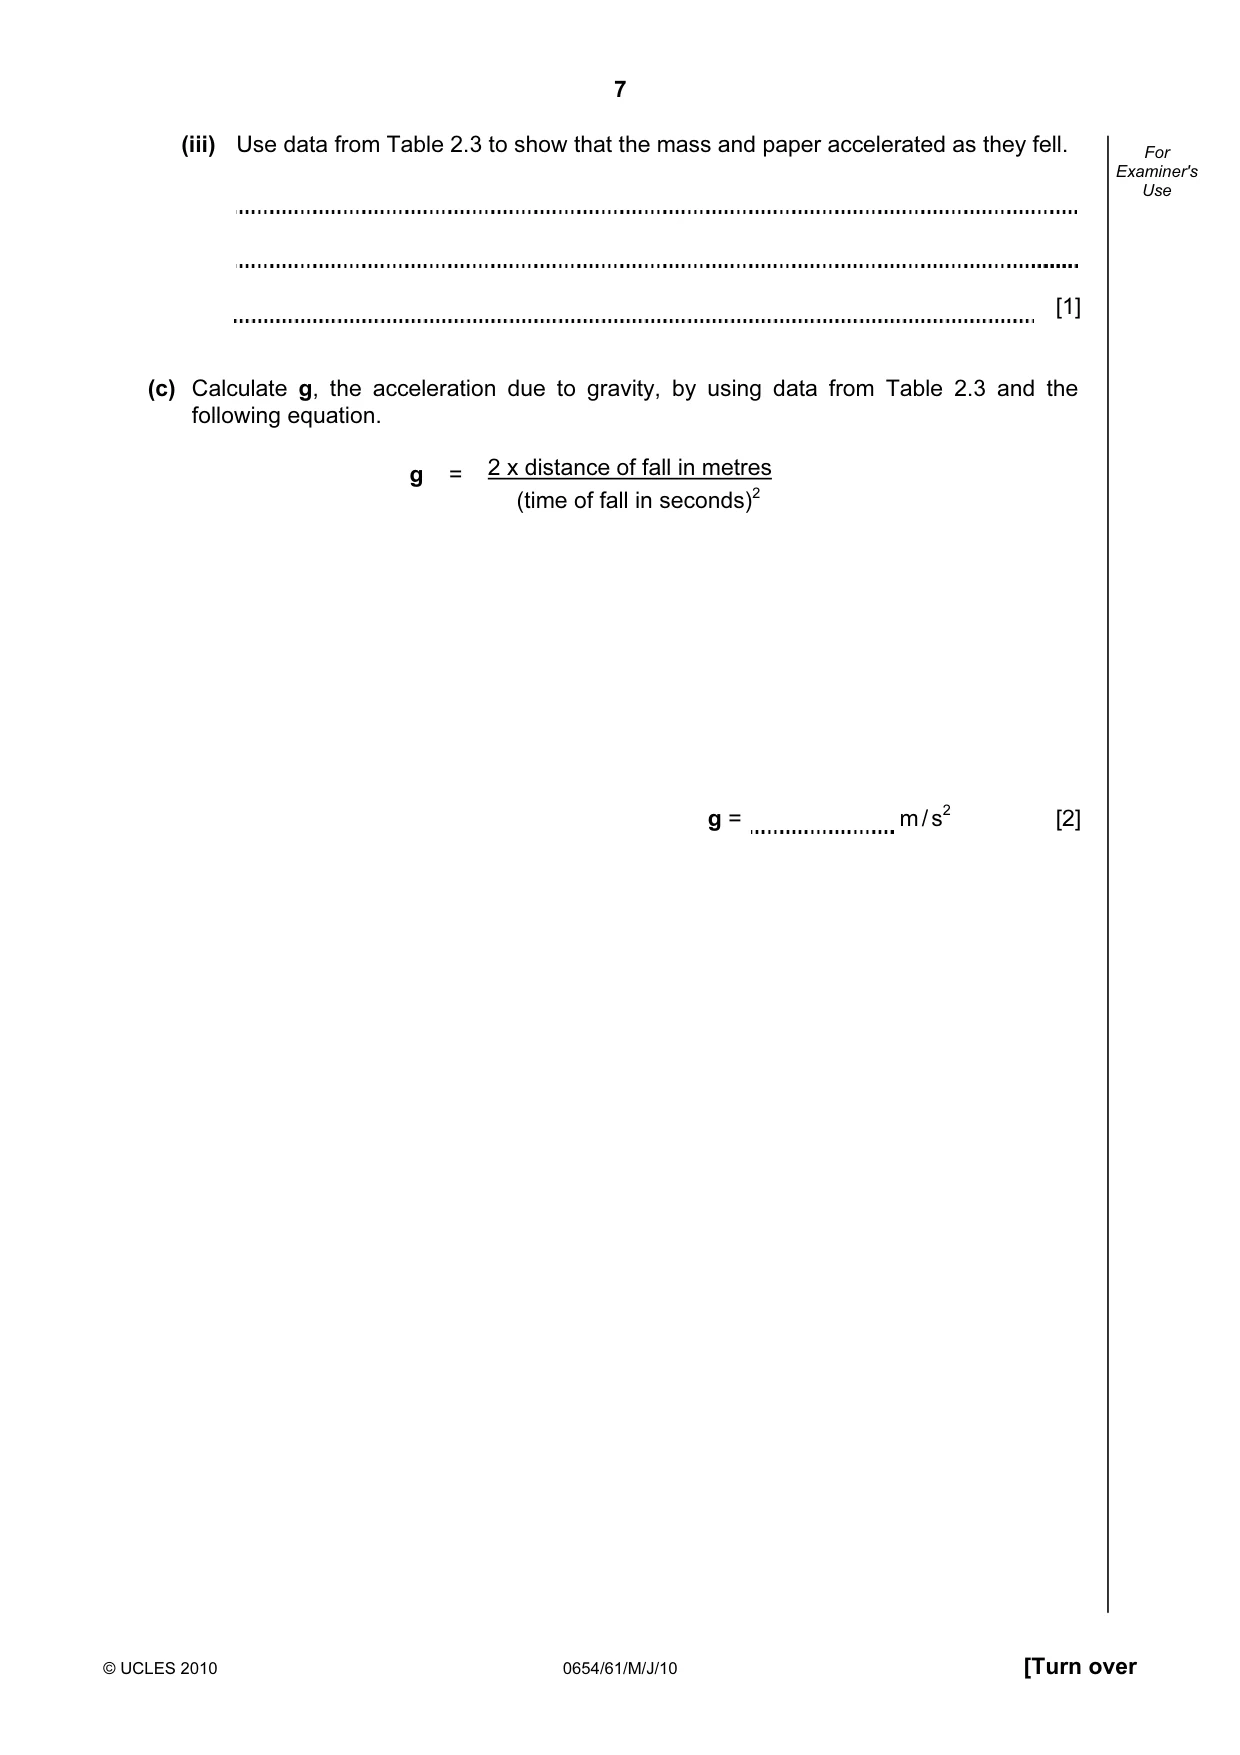
7 © UCLES 2010 0654/61/M/J/10 [Turn over For Examiner's Use (iii) Use data from Table 2.3 to show that the mass and paper accelerated as they fell. [1] (c) Calculate g, the acceleration due to gravity, by using data from Table 2.3 and the following equation. g = 2 x distance of fall in metres (time of fall in seconds)2 g = m / s2 [2]
Question paper, page 8
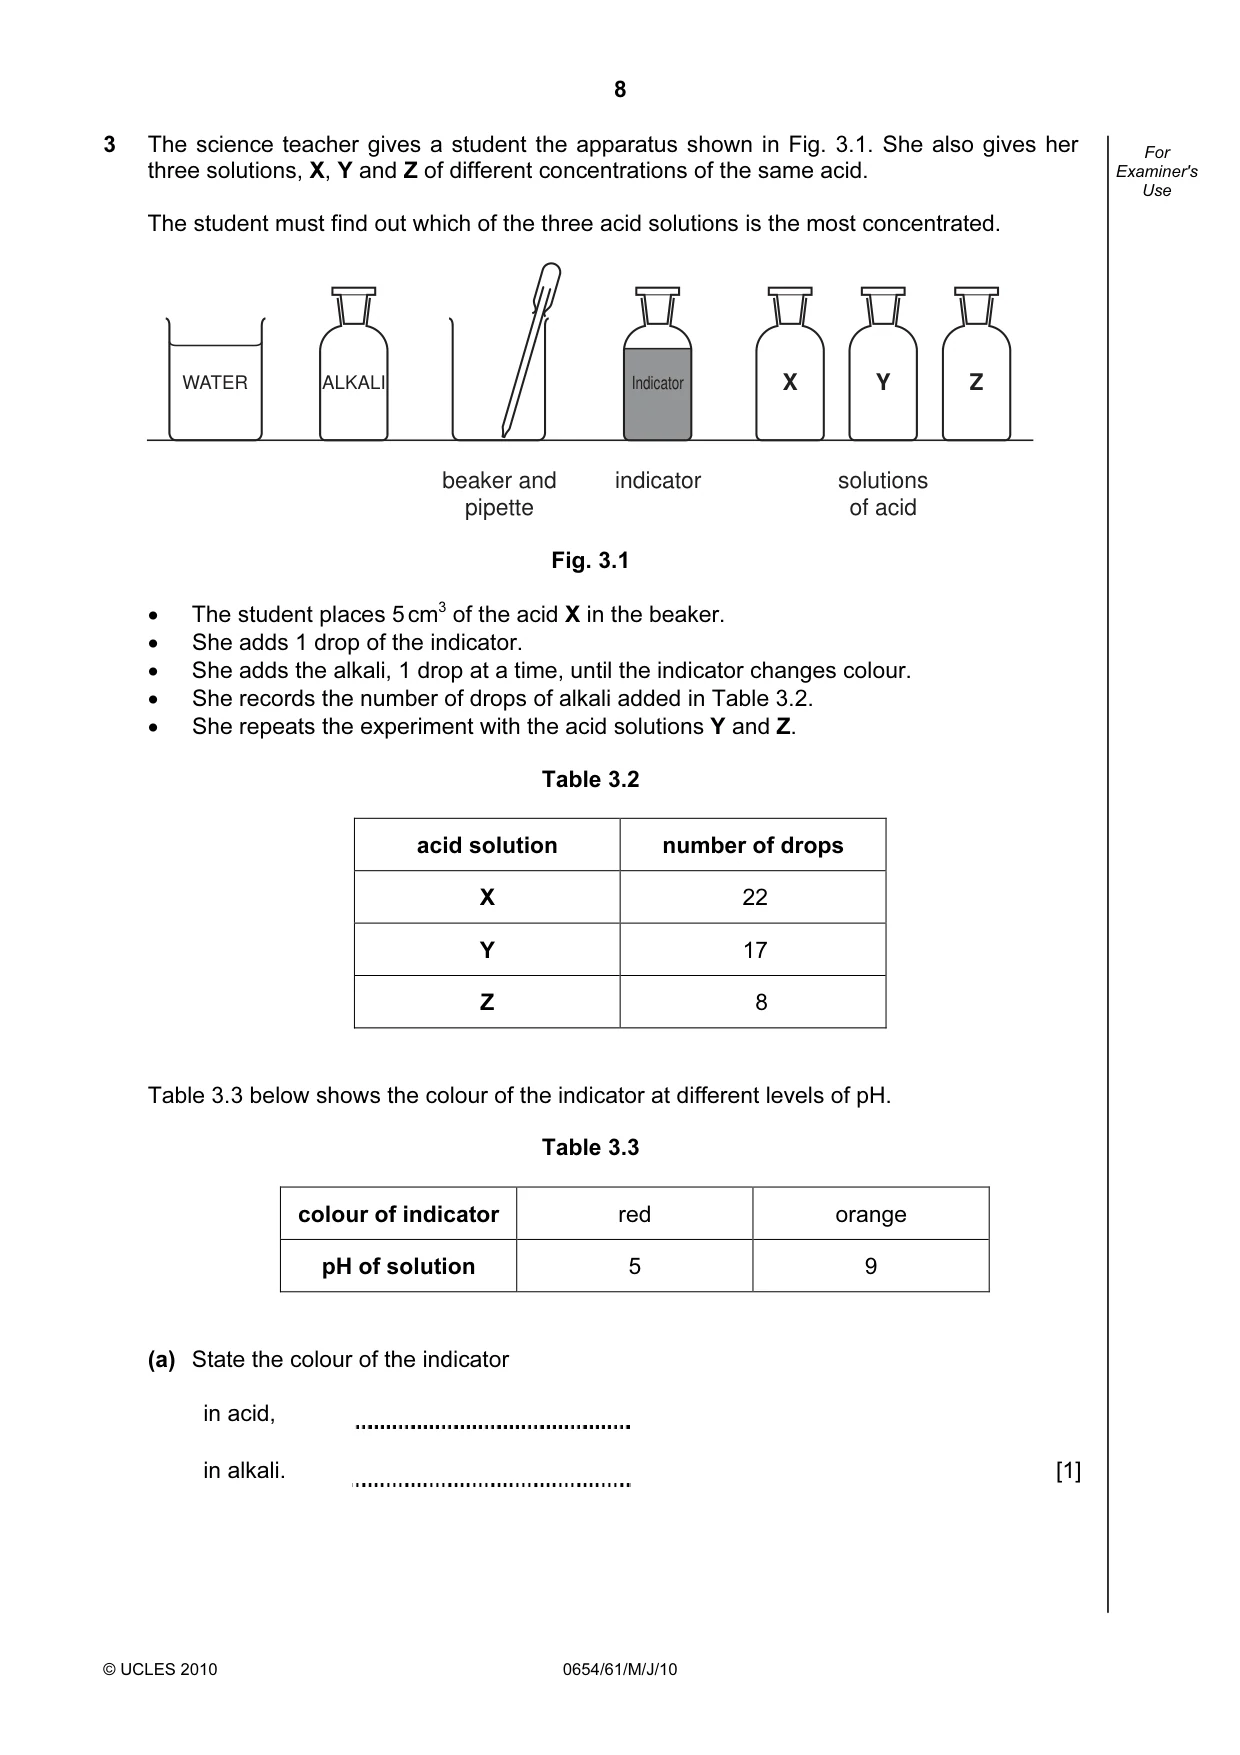
8 © UCLES 2010 0654/61/M/J/10 For Examiner's Use 3 The science teacher gives a student the apparatus shown in Fig. 3.1. She also gives her three solutions, X, Y and Z of different concentrations of the same acid. The student must find out which of the three acid solutions is the most concentrated. ALKALI WATER Z Y X solutions of acid Indicator indicator beaker and pipette Fig. 3.1 • The student places 5 cm3 of the acid X in the beaker. • She adds 1 drop of the indicator. • She adds the alkali, 1 drop at a time, until the indicator changes colour. • She records the number of drops of alkali added in Table 3.2. • She repeats the experiment with the acid solutions Y and Z. Table 3.2 acid solution number of drops X 22 Y 17 Z 8 Table 3.3 below shows the colour of the indicator at different levels of pH. Table 3.3 colour of indicator red orange pH of solution 5 9 (a) State the colour of the indicator in acid, in alkali. [1]
Question paper, page 9
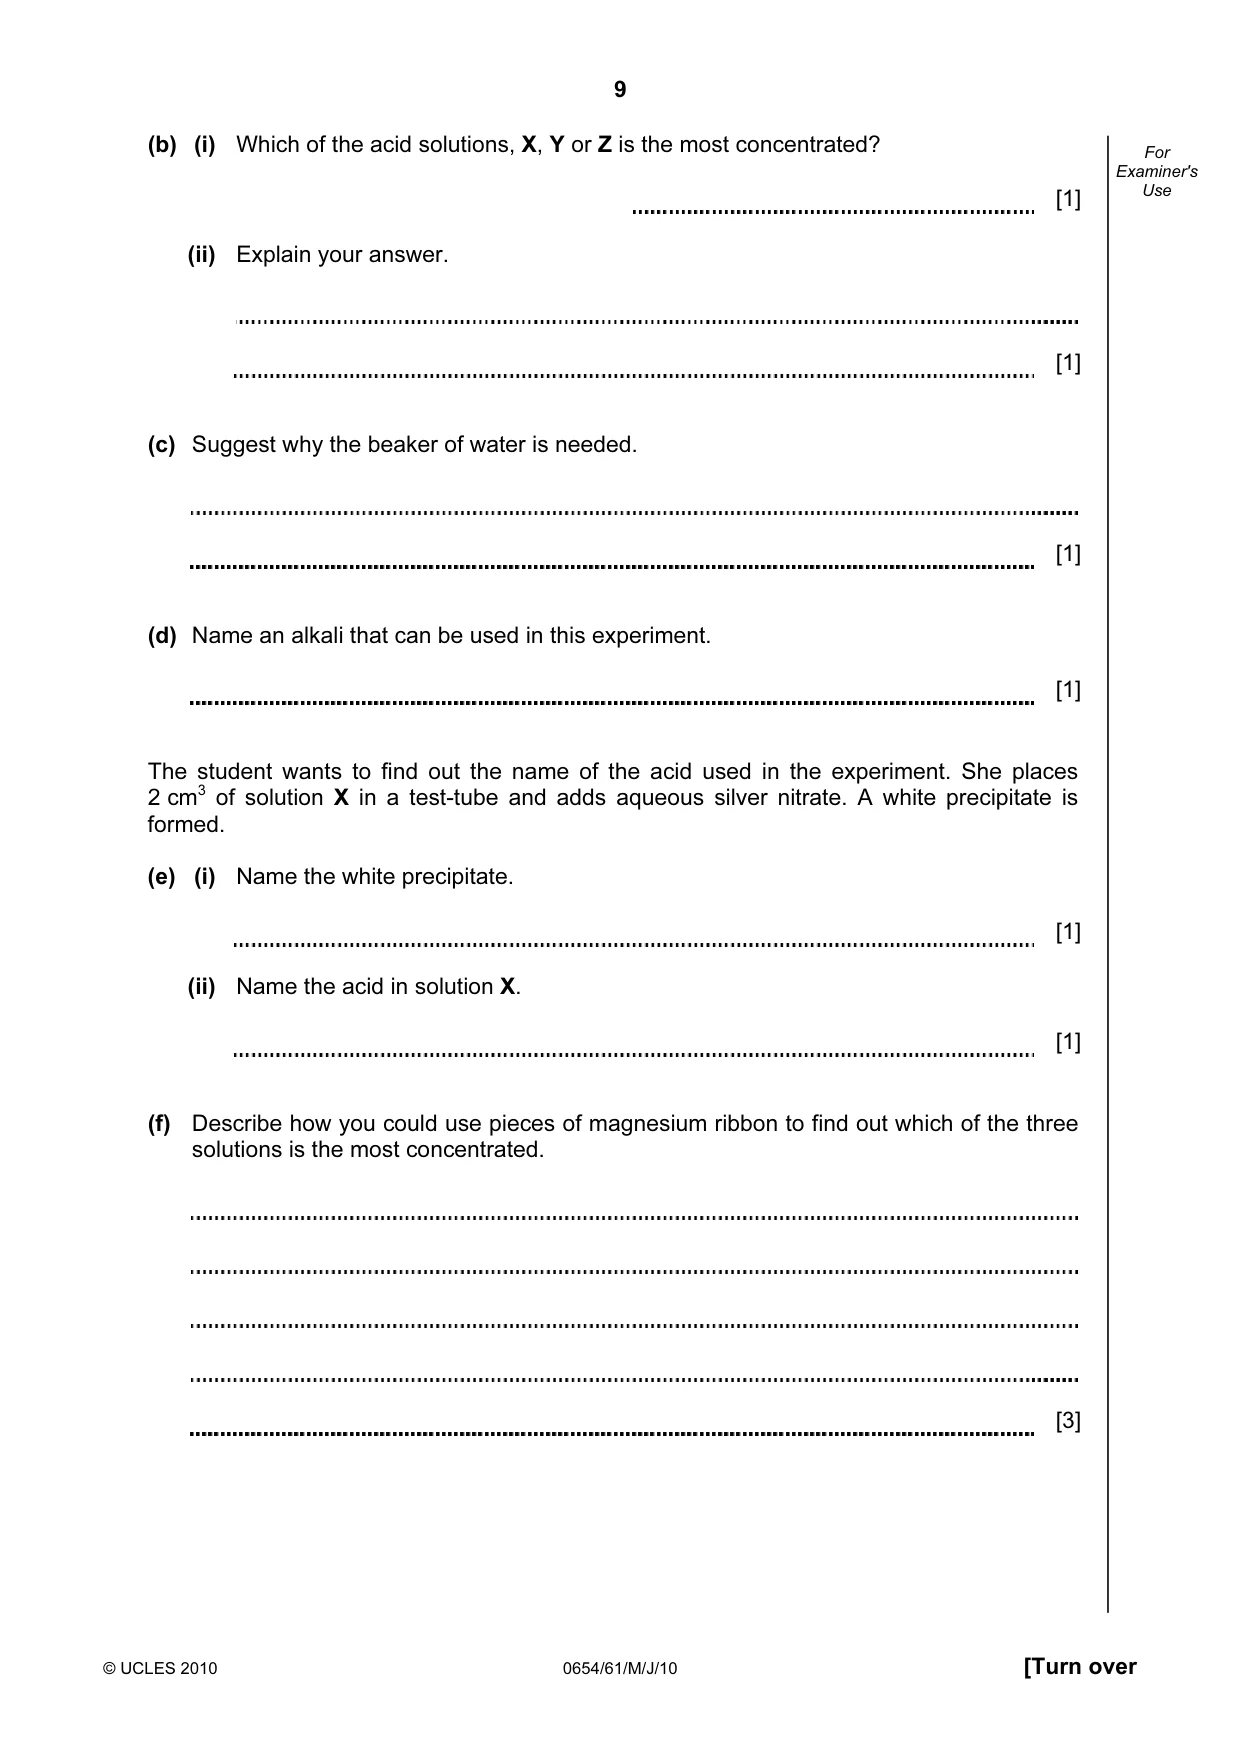
9 © UCLES 2010 0654/61/M/J/10 [Turn over For Examiner's Use (b) (i) Which of the acid solutions, X, Y or Z is the most concentrated? [1] (ii) Explain your answer. [1] (c) Suggest why the beaker of water is needed. [1] (d) Name an alkali that can be used in this experiment. [1] The student wants to find out the name of the acid used in the experiment. She places 2 cm3 of solution X in a test-tube and adds aqueous silver nitrate. A white precipitate is formed. (e) (i) Name the white precipitate. [1] (ii) Name the acid in solution X. [1] (f) Describe how you could use pieces of magnesium ribbon to find out which of the three solutions is the most concentrated. [3]
Question paper, page 10
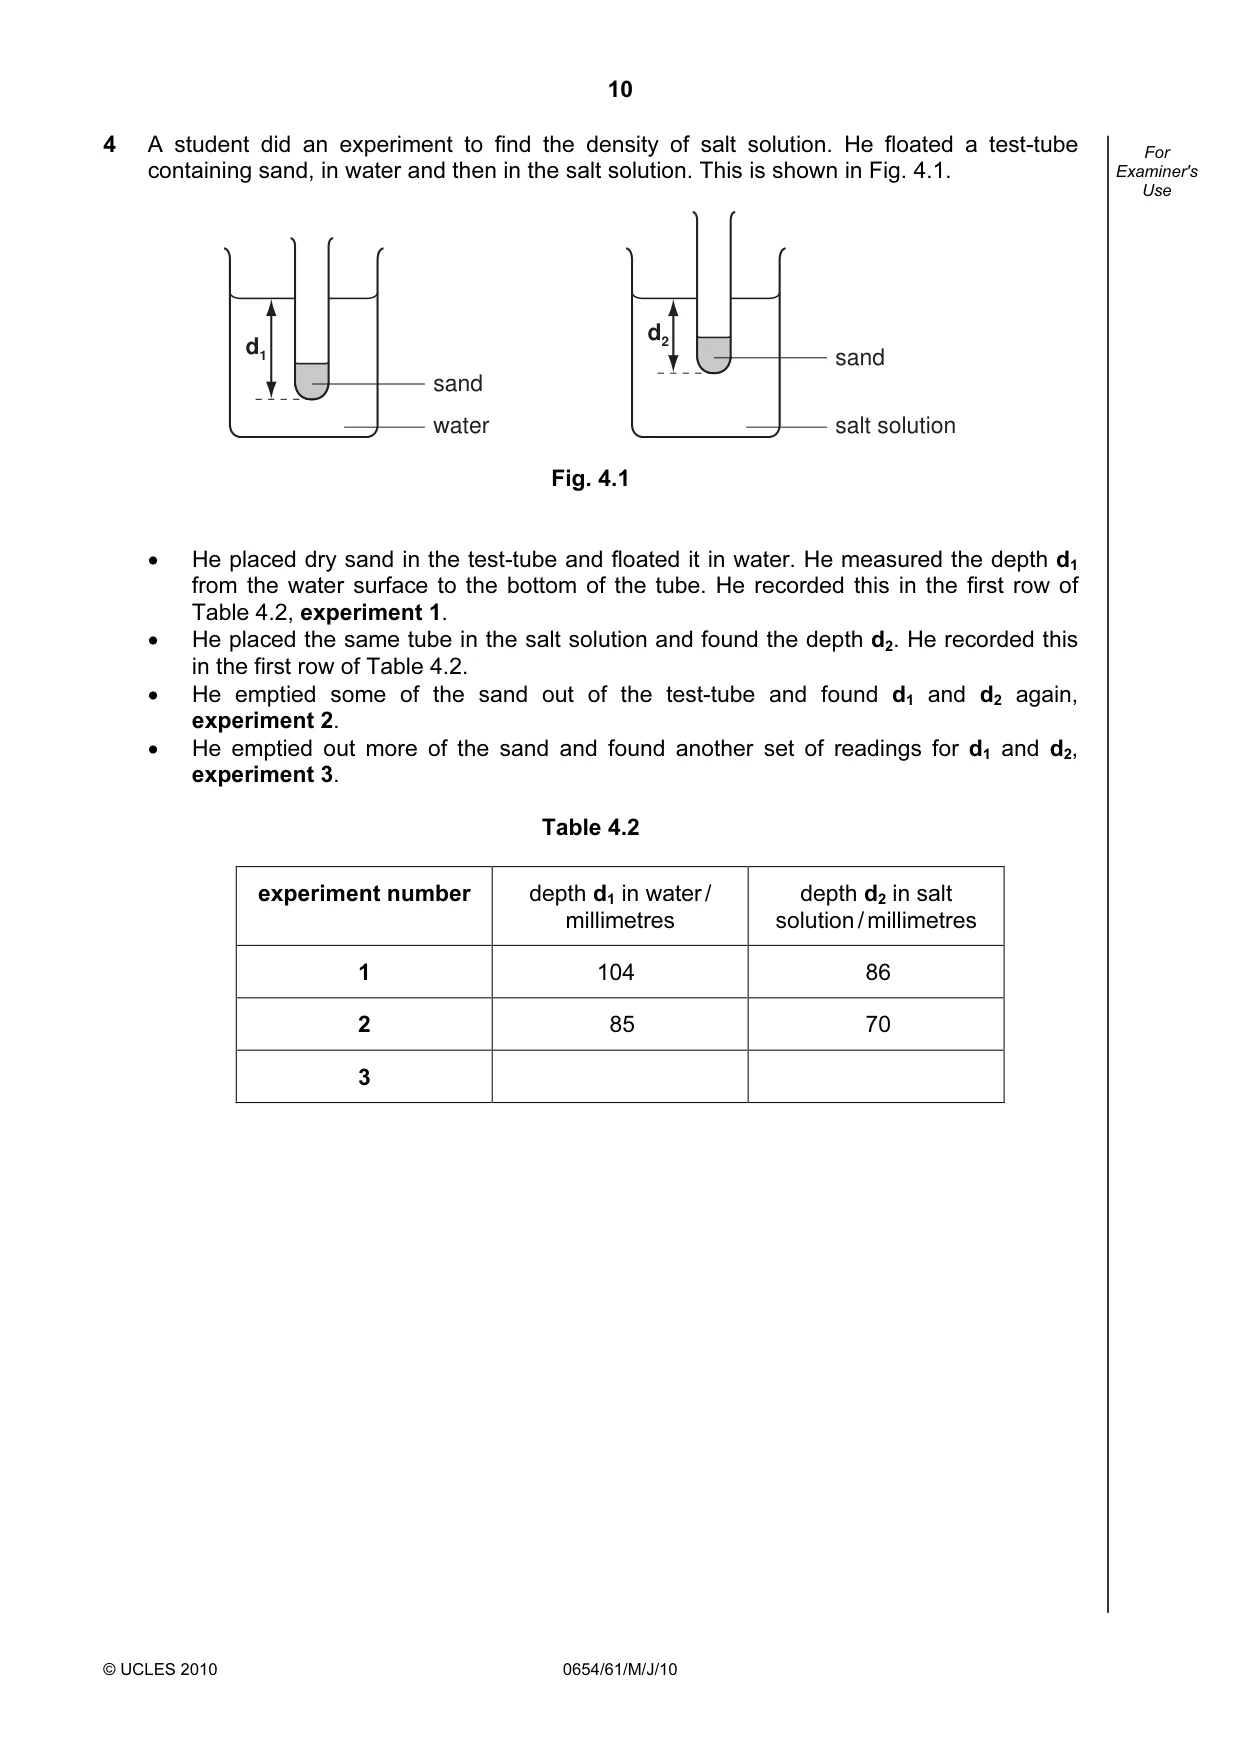
10 © UCLES 2010 0654/61/M/J/10 For Examiner's Use 4 A student did an experiment to find the density of salt solution. He floated a test-tube containing sand, in water and then in the salt solution. This is shown in Fig. 4.1. sand water d1 sand salt solution d2 Fig. 4.1 • He placed dry sand in the test-tube and floated it in water. He measured the depth d1 from the water surface to the bottom of the tube. He recorded this in the first row of Table 4.2, experiment 1. • He placed the same tube in the salt solution and found the depth d2. He recorded this in the first row of Table 4.2. • He emptied some of the sand out of the test-tube and found d1 and d2 again, experiment 2. • He emptied out more of the sand and found another set of readings for d1 and d2, experiment 3. Table 4.2 experiment number depth d1 in water / millimetres depth d2 in salt solution / millimetres 1 104 86 2 85 70 3
Question paper, page 11
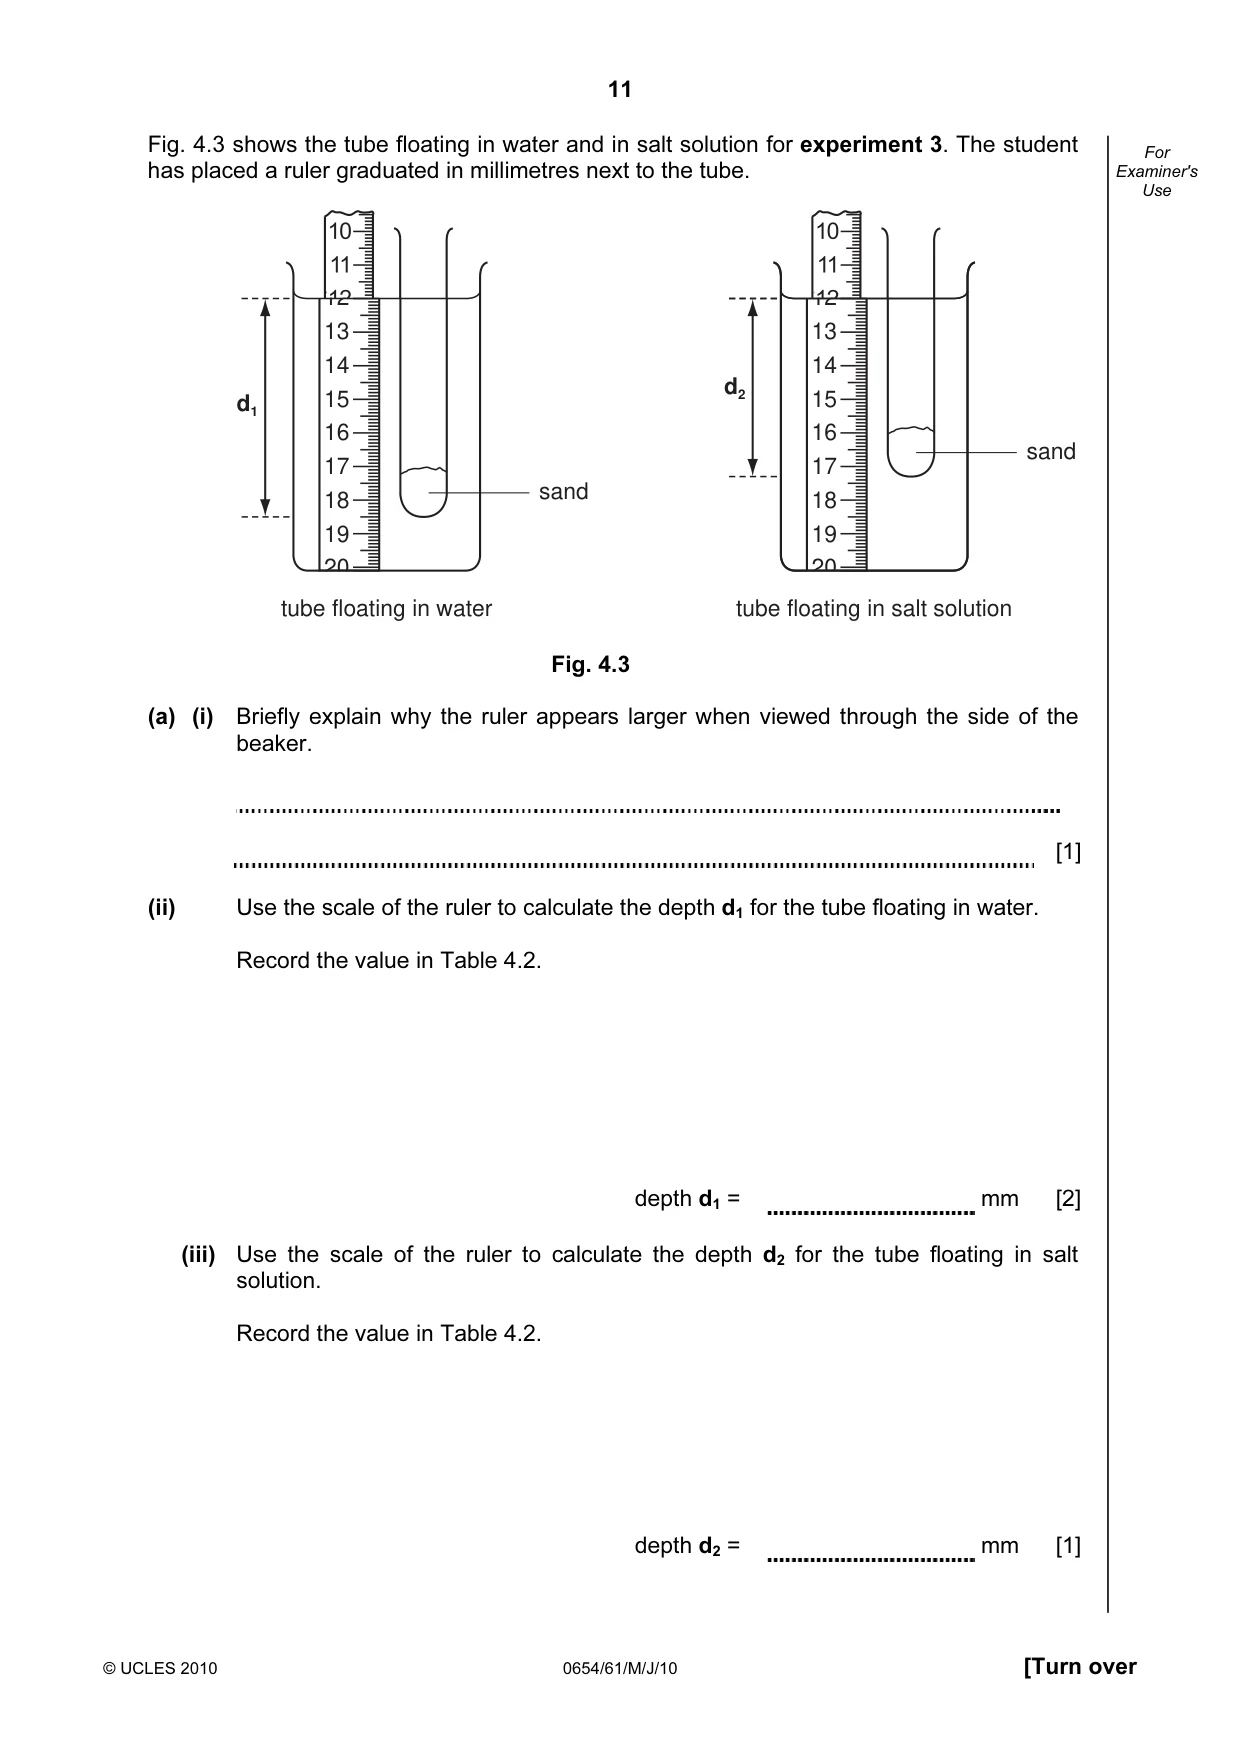
11 © UCLES 2010 0654/61/M/J/10 [Turn over For Examiner's Use Fig. 4.3 shows the tube floating in water and in salt solution for experiment 3. The student has placed a ruler graduated in millimetres next to the tube. 12 13 14 15 16 17 18 19 20 tube floating in salt solution tube floating in water sand 12 13 14 15 16 17 18 19 20 d1 sand d2 Fig. 4.3 (a) (i) Briefly explain why the ruler appears larger when viewed through the side of the beaker. [1] (ii) Use the scale of the ruler to calculate the depth d1 for the tube floating in water. Record the value in Table 4.2. depth d1 = mm [2] (iii) Use the scale of the ruler to calculate the depth d2 for the tube floating in salt solution. Record the value in Table 4.2. depth d2 = mm [1]
Question paper, page 12
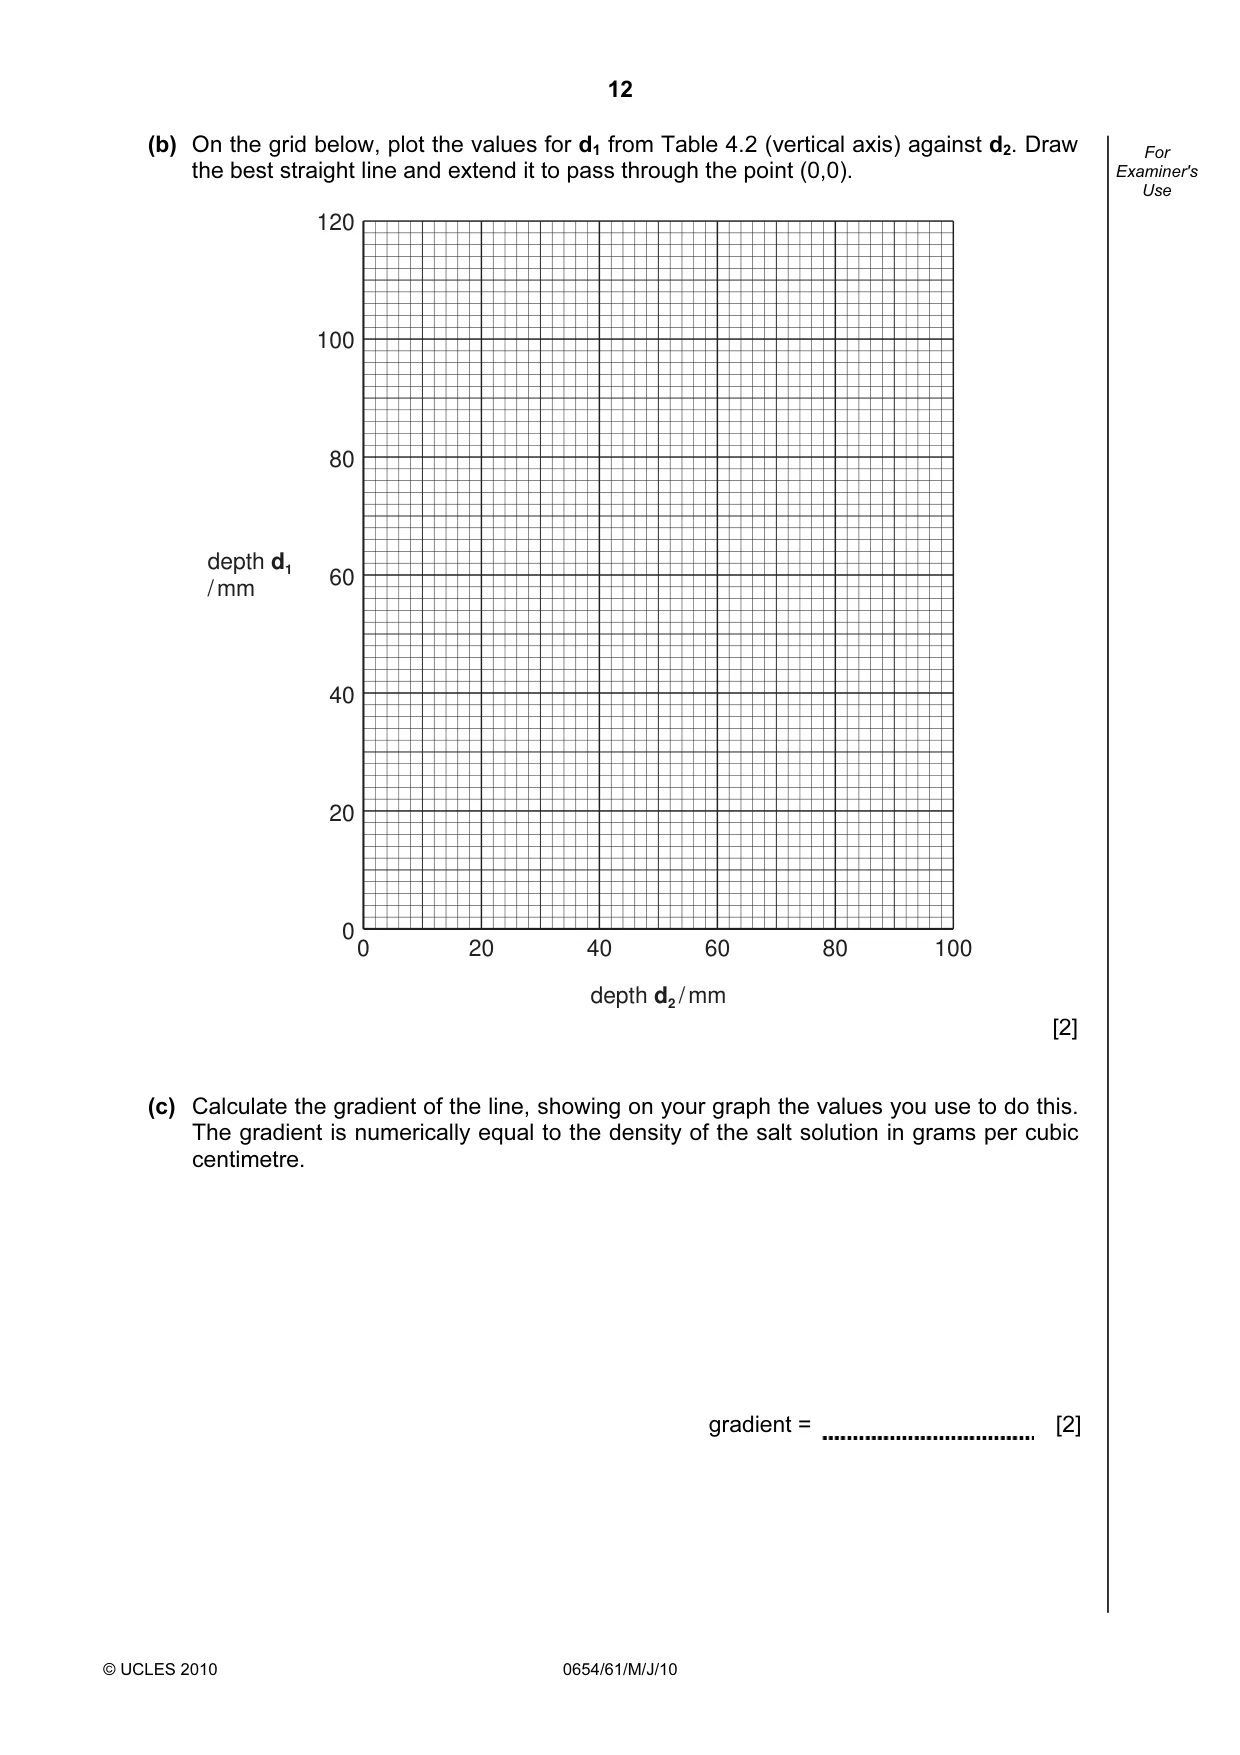
12 © UCLES 2010 0654/61/M/J/10 For Examiner's Use (b) On the grid below, plot the values for d1 from Table 4.2 (vertical axis) against d2. Draw the best straight line and extend it to pass through the point (0,0). 0 20 40 depth d2 / mm depth d1 / mm 60 80 100 120 100 80 60 40 20 0 [2] (c) Calculate the gradient of the line, showing on your graph the values you use to do this. The gradient is numerically equal to the density of the salt solution in grams per cubic centimetre. gradient = [2]
Question paper, page 13
13 © UCLES 2010 0654/61/M/J/10 [Turn over For Examiner's Use (d) Describe another method for finding the density of a liquid using a pipette or burette, a beaker and a balance. [2]
Question paper, page 14
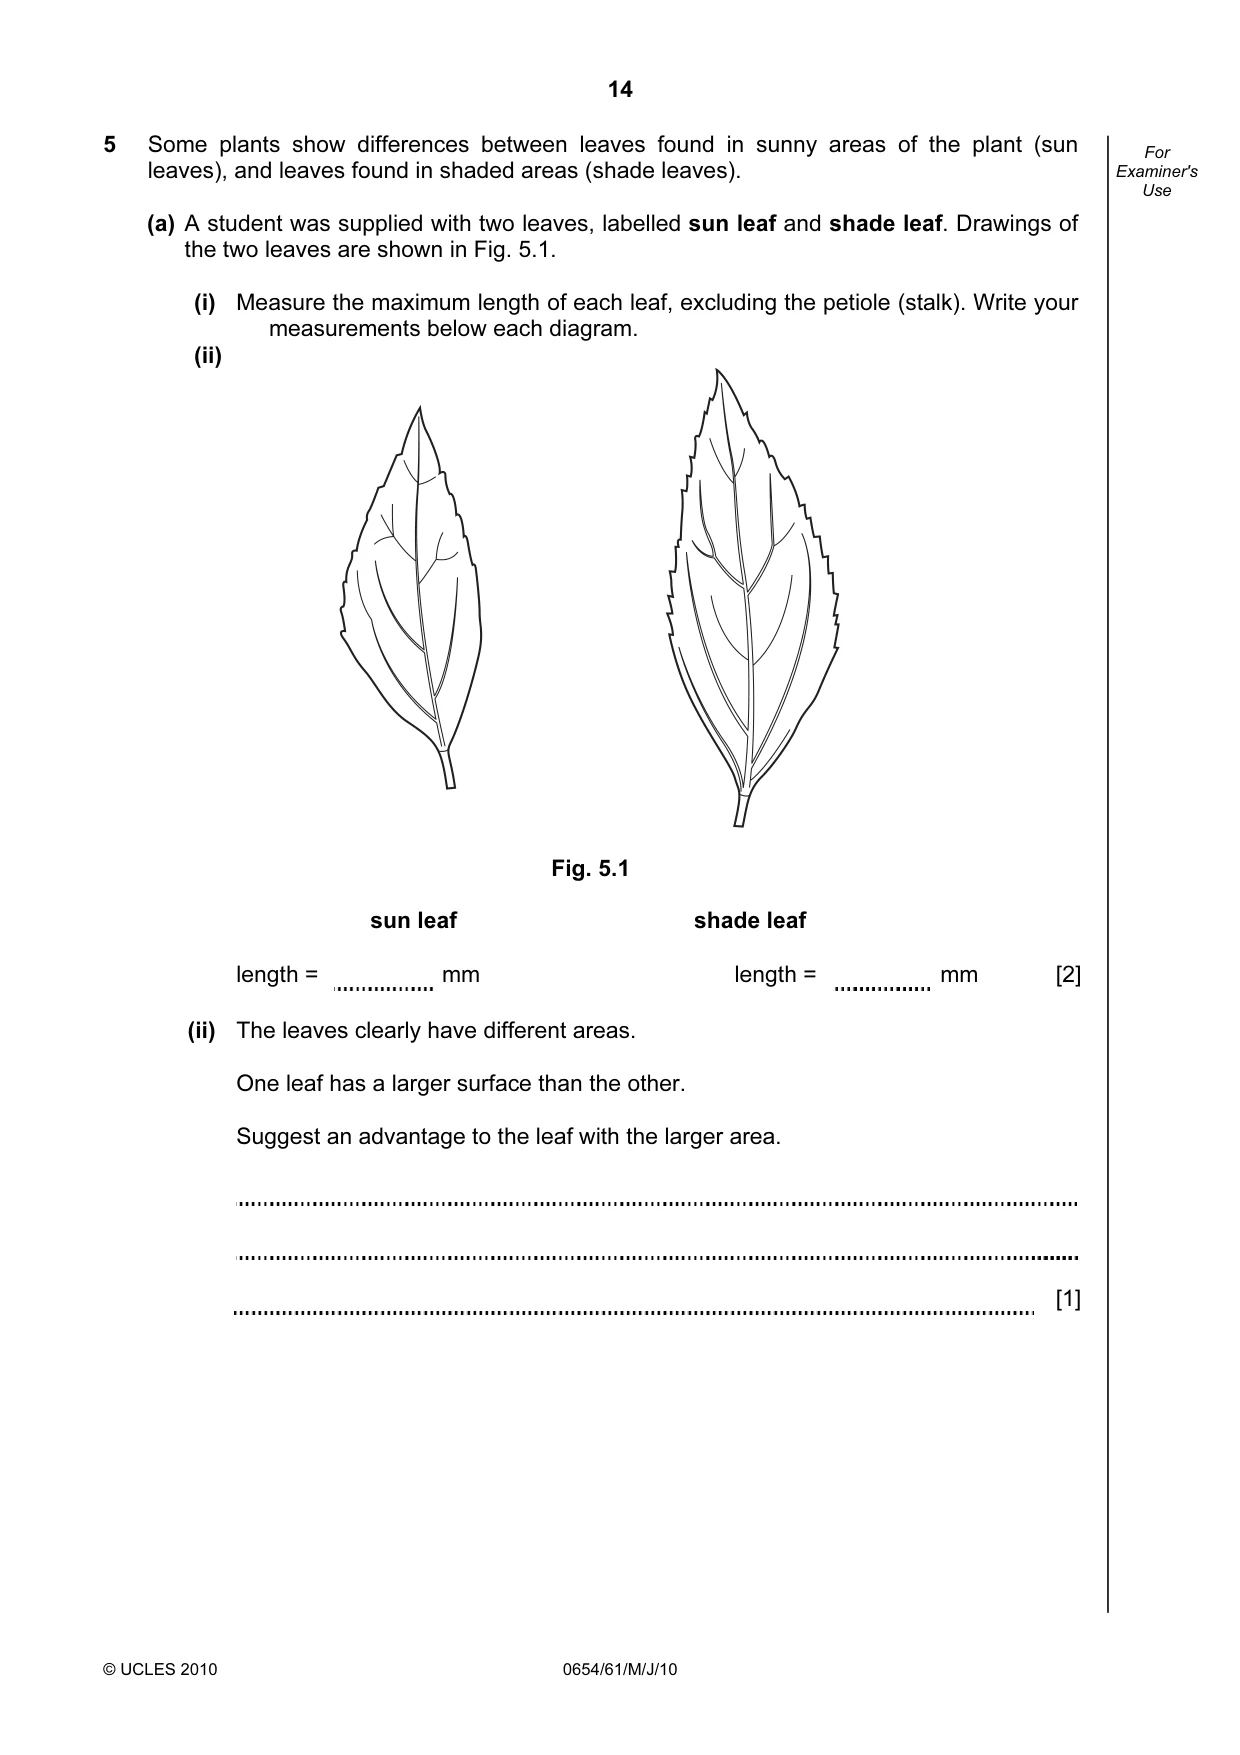
14 © UCLES 2010 0654/61/M/J/10 For Examiner's Use 5 Some plants show differences between leaves found in sunny areas of the plant (sun leaves), and leaves found in shaded areas (shade leaves). (a) A student was supplied with two leaves, labelled sun leaf and shade leaf. Drawings of the two leaves are shown in Fig. 5.1. (i) Measure the maximum length of each leaf, excluding the petiole (stalk). Write your measurements below each diagram. (ii) Fig. 5.1 sun leaf shade leaf length = mm length = mm [2] (ii) The leaves clearly have different areas. One leaf has a larger surface than the other. Suggest an advantage to the leaf with the larger area. [1]
Question paper, page 15
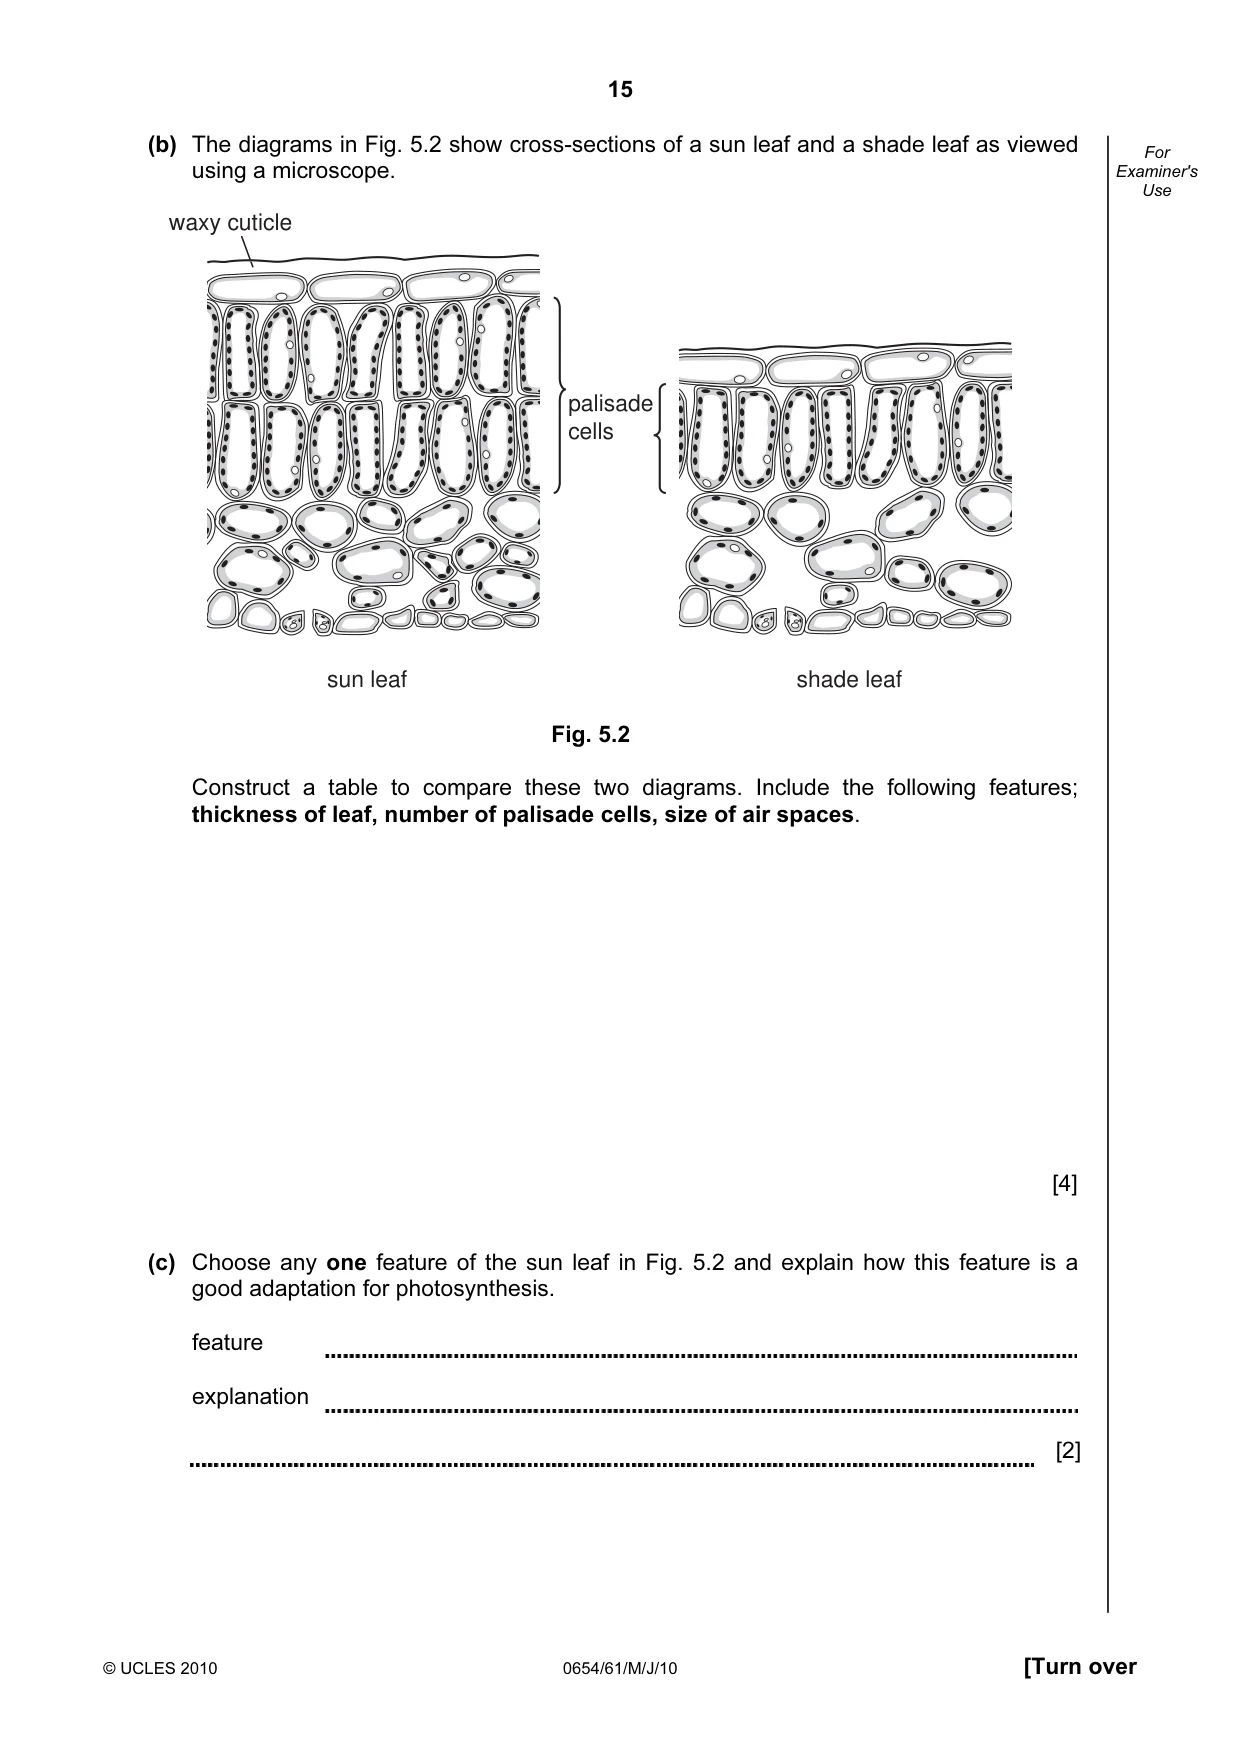
15 © UCLES 2010 0654/61/M/J/10 [Turn over For Examiner's Use (b) The diagrams in Fig. 5.2 show cross-sections of a sun leaf and a shade leaf as viewed using a microscope. sun leaf shade leaf waxy cuticle palisade cells Fig. 5.2 Construct a table to compare these two diagrams. Include the following features; thickness of leaf, number of palisade cells, size of air spaces. [4] (c) Choose any one feature of the sun leaf in Fig. 5.2 and explain how this feature is a good adaptation for photosynthesis. feature explanation [2]
Question paper, page 16
16 © UCLES 2010 0654/61/M/J/10 For Examiner's Use (d) The sun leaf usually has a thicker cuticle than the shade leaf. The cuticle is a waxy layer covering the leaf. Suggest an advantage that this thicker cuticle gives to the sun leaf. [1]
Question paper, page 17
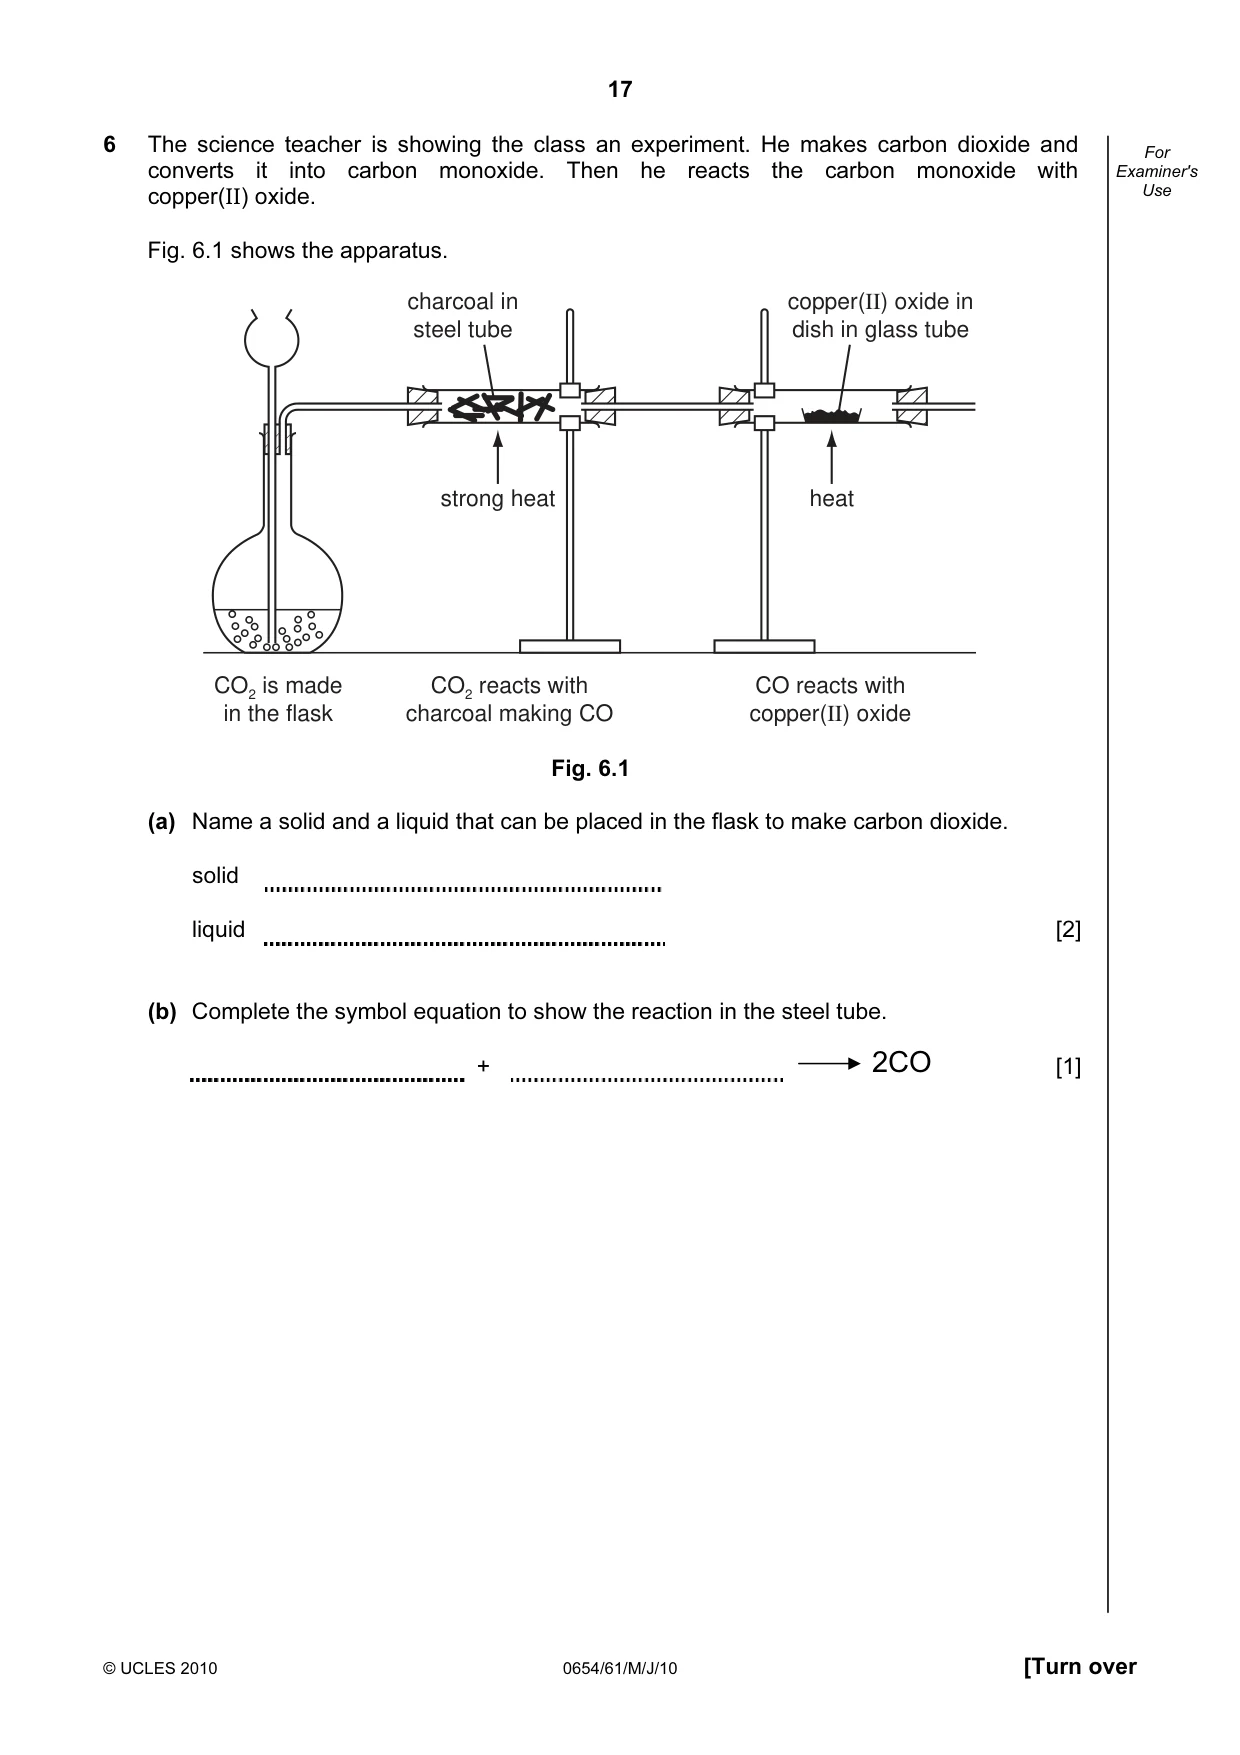
17 © UCLES 2010 0654/61/M/J/10 [Turn over For Examiner's Use 6 The science teacher is showing the class an experiment. He makes carbon dioxide and converts it into carbon monoxide. Then he reacts the carbon monoxide with copper(II) oxide. Fig. 6.1 shows the apparatus. CO2 is made in the flask CO2 reacts with charcoal making CO CO reacts with copper(II) oxide strong heat heat charcoal in steel tube copper(II) oxide in dish in glass tube Fig. 6.1 (a) Name a solid and a liquid that can be placed in the flask to make carbon dioxide. solid liquid [2] (b) Complete the symbol equation to show the reaction in the steel tube. + 2CO [1]
Question paper, page 18
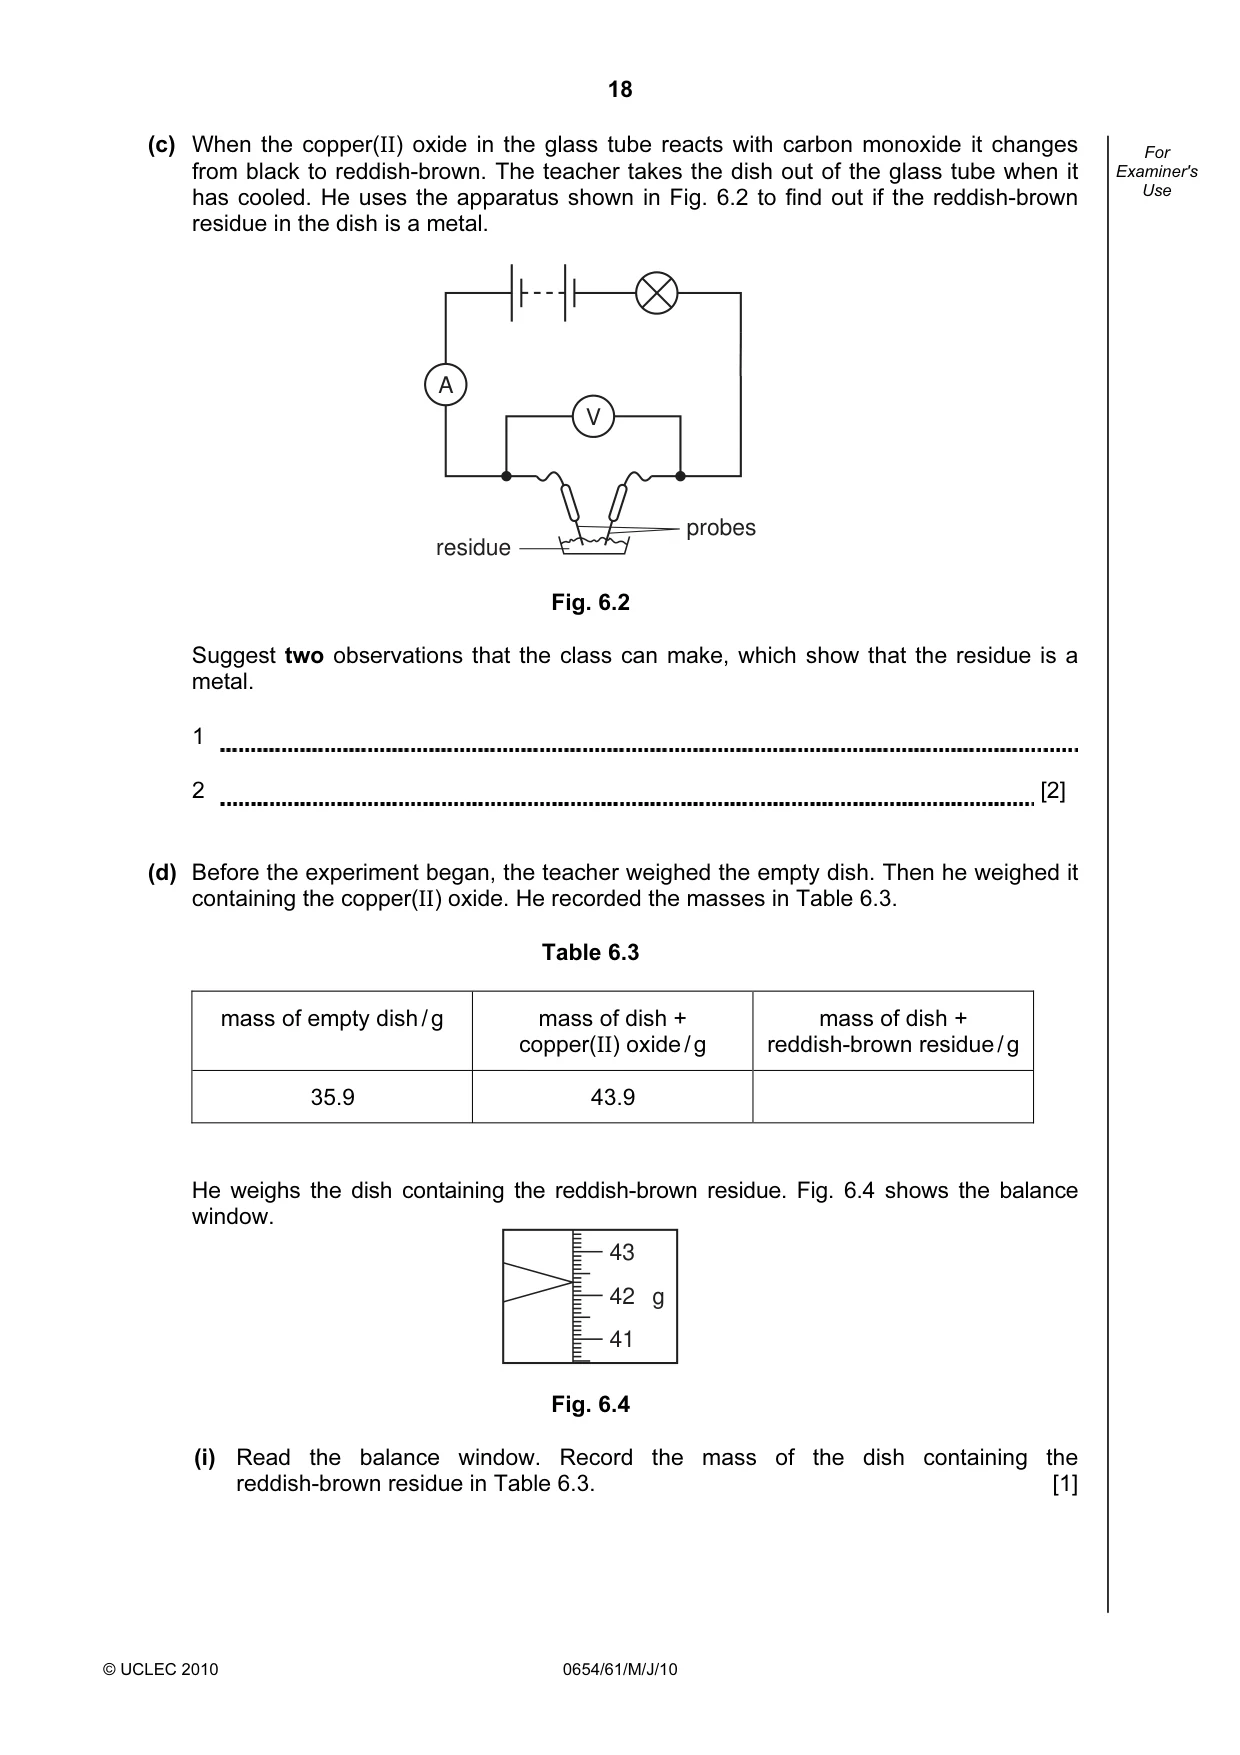
18 © UCLEC 2010 0654/61/M/J/10 For Examiner's Use (c) When the copper(II) oxide in the glass tube reacts with carbon monoxide it changes from black to reddish-brown. The teacher takes the dish out of the glass tube when it has cooled. He uses the apparatus shown in Fig. 6.2 to find out if the reddish-brown residue in the dish is a metal. V A probes residue Fig. 6.2 Suggest two observations that the class can make, which show that the residue is a metal. 1 2 [2] (d) Before the experiment began, the teacher weighed the empty dish. Then he weighed it containing the copper(II) oxide. He recorded the masses in Table 6.3. Table 6.3 mass of empty dish / g mass of dish + copper(II) oxide / g mass of dish + reddish-brown residue / g 35.9 43.9 He weighs the dish containing the reddish-brown residue. Fig. 6.4 shows the balance window. 43 42 41 g Fig. 6.4 (i) Read the balance window. Record the mass of the dish containing the reddish-brown residue in Table 6.3. [1]
Question paper, page 19
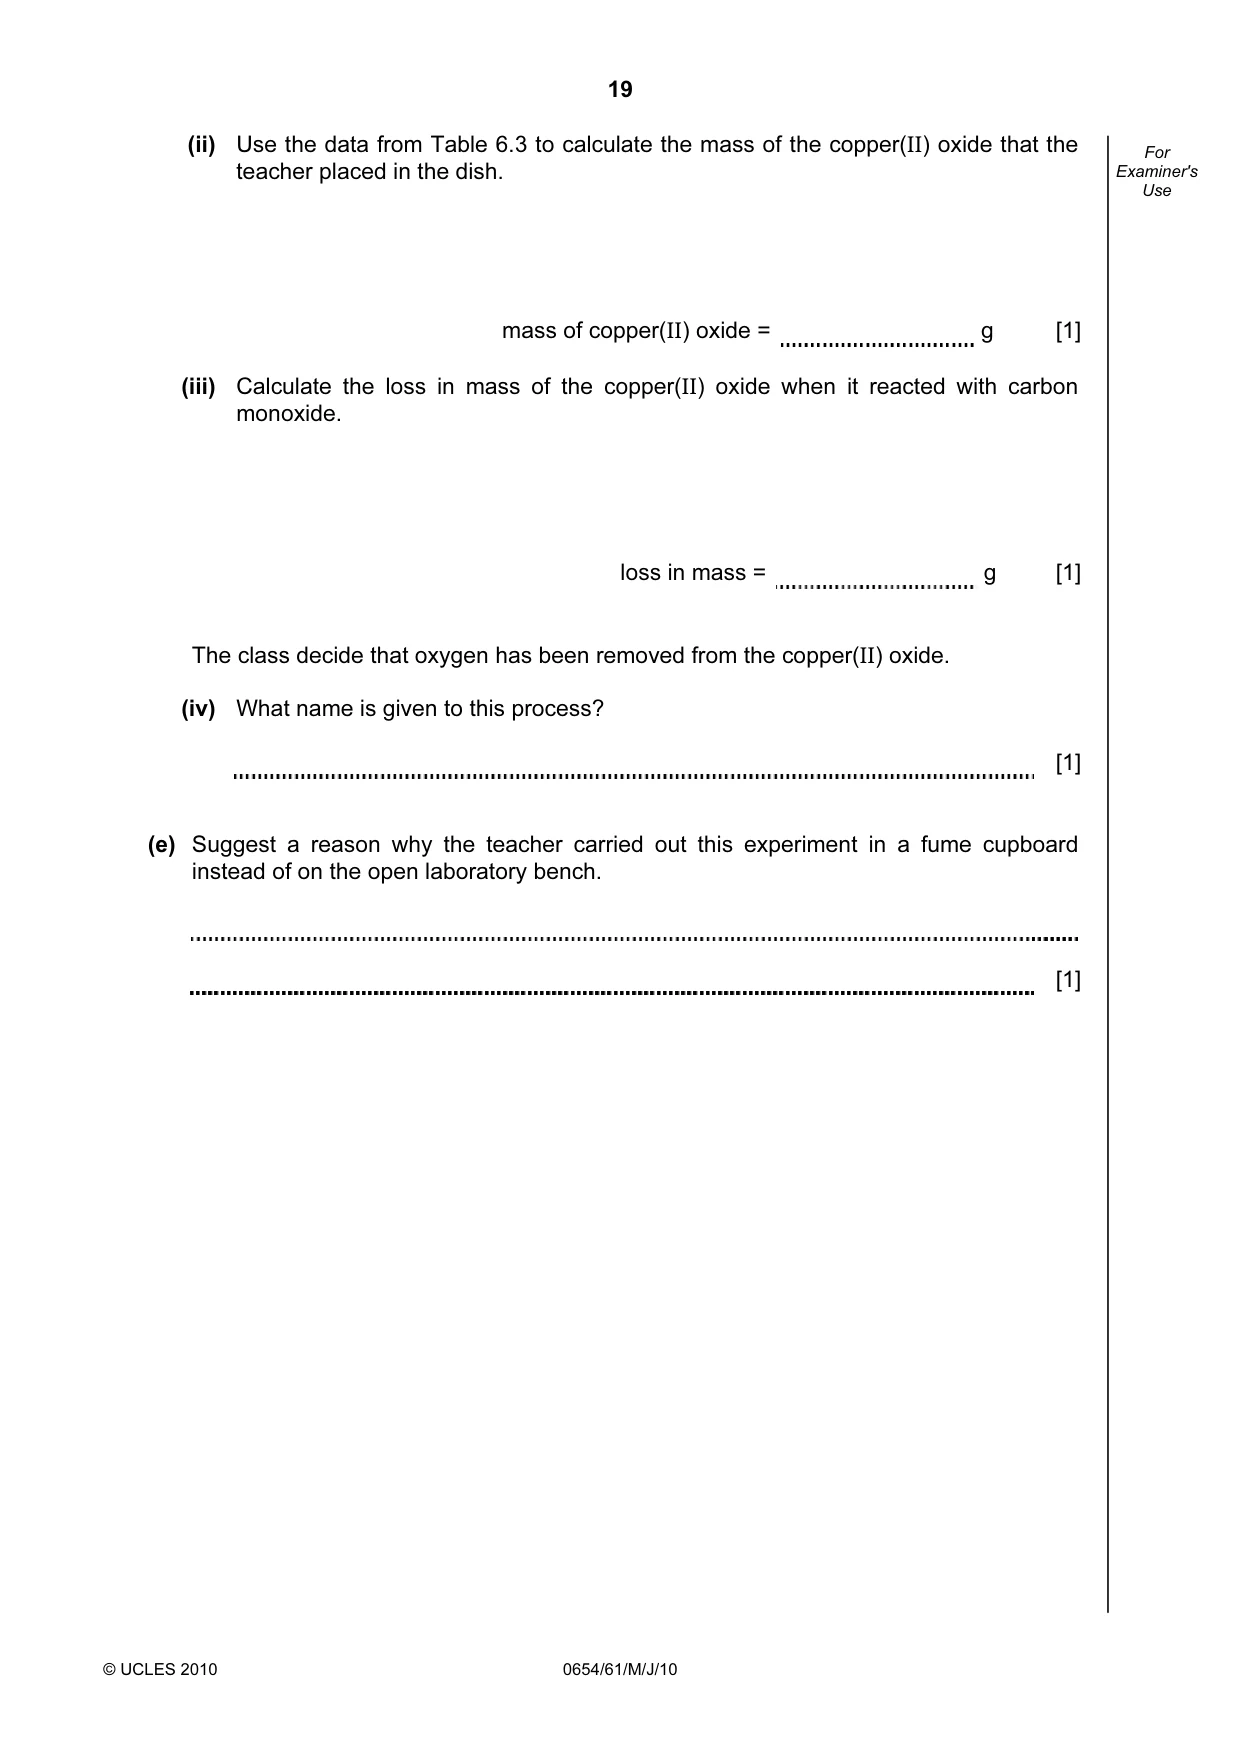
19 © UCLES 2010 0654/61/M/J/10 For Examiner's Use (ii) Use the data from Table 6.3 to calculate the mass of the copper(II) oxide that the teacher placed in the dish. mass of copper(II) oxide = g [1] (iii) Calculate the loss in mass of the copper(II) oxide when it reacted with carbon monoxide. loss in mass = g [1] The class decide that oxygen has been removed from the copper(II) oxide. (iv) What name is given to this process? [1] (e) Suggest a reason why the teacher carried out this experiment in a fume cupboard instead of on the open laboratory bench. [1]
Question paper, page 20
20 Permission to reproduce items where third-party owned material protected by copyright is included has been sought and cleared where possible. Every reasonable effort has been made by the publisher (UCLES) to trace copyright holders, but if any items requiring clearance have unwittingly been included, the publisher will be pleased to make amends at the earliest possible opportunity. University of Cambridge International Examinations is part of the Cambridge Assessment Group. Cambridge Assessment is the brand name of University of Cambridge Local Examinations Syndicate (UCLES), which is itself a department of the University of Cambridge. © UCLES 2010 0654/61/M/J/10 BLANK PAGE
Mark scheme, page 1
UNIVERSITY OF CAMBRIDGE INTERNATIONAL EXAMINATIONS International General Certificate of Secondary Education MARK SCHEME for the May/June 2010 question paper for the guidance of teachers 0654 CO-ORDINATED SCIENCES 0654/61 Paper 61 (Alternative to Practical), maximum raw mark 60 This mark scheme is published as an aid to teachers and candidates, to indicate the requirements of the examination. It shows the basis on which Examiners were instructed to award marks. It does not indicate the details of the discussions that took place at an Examiners’ meeting before marking began, which would have considered the acceptability of alternative answers. Mark schemes must be read in conjunction with the question papers and the report on the examination. • CIE will not enter into discussions or correspondence in connection with these mark schemes. CIE is publishing the mark schemes for the May/June 2010 question papers for most IGCSE, GCE Advanced Level and Advanced Subsidiary Level syllabuses and some Ordinary Level syllabuses. www.XtremePapers.com
Mark scheme, page 2
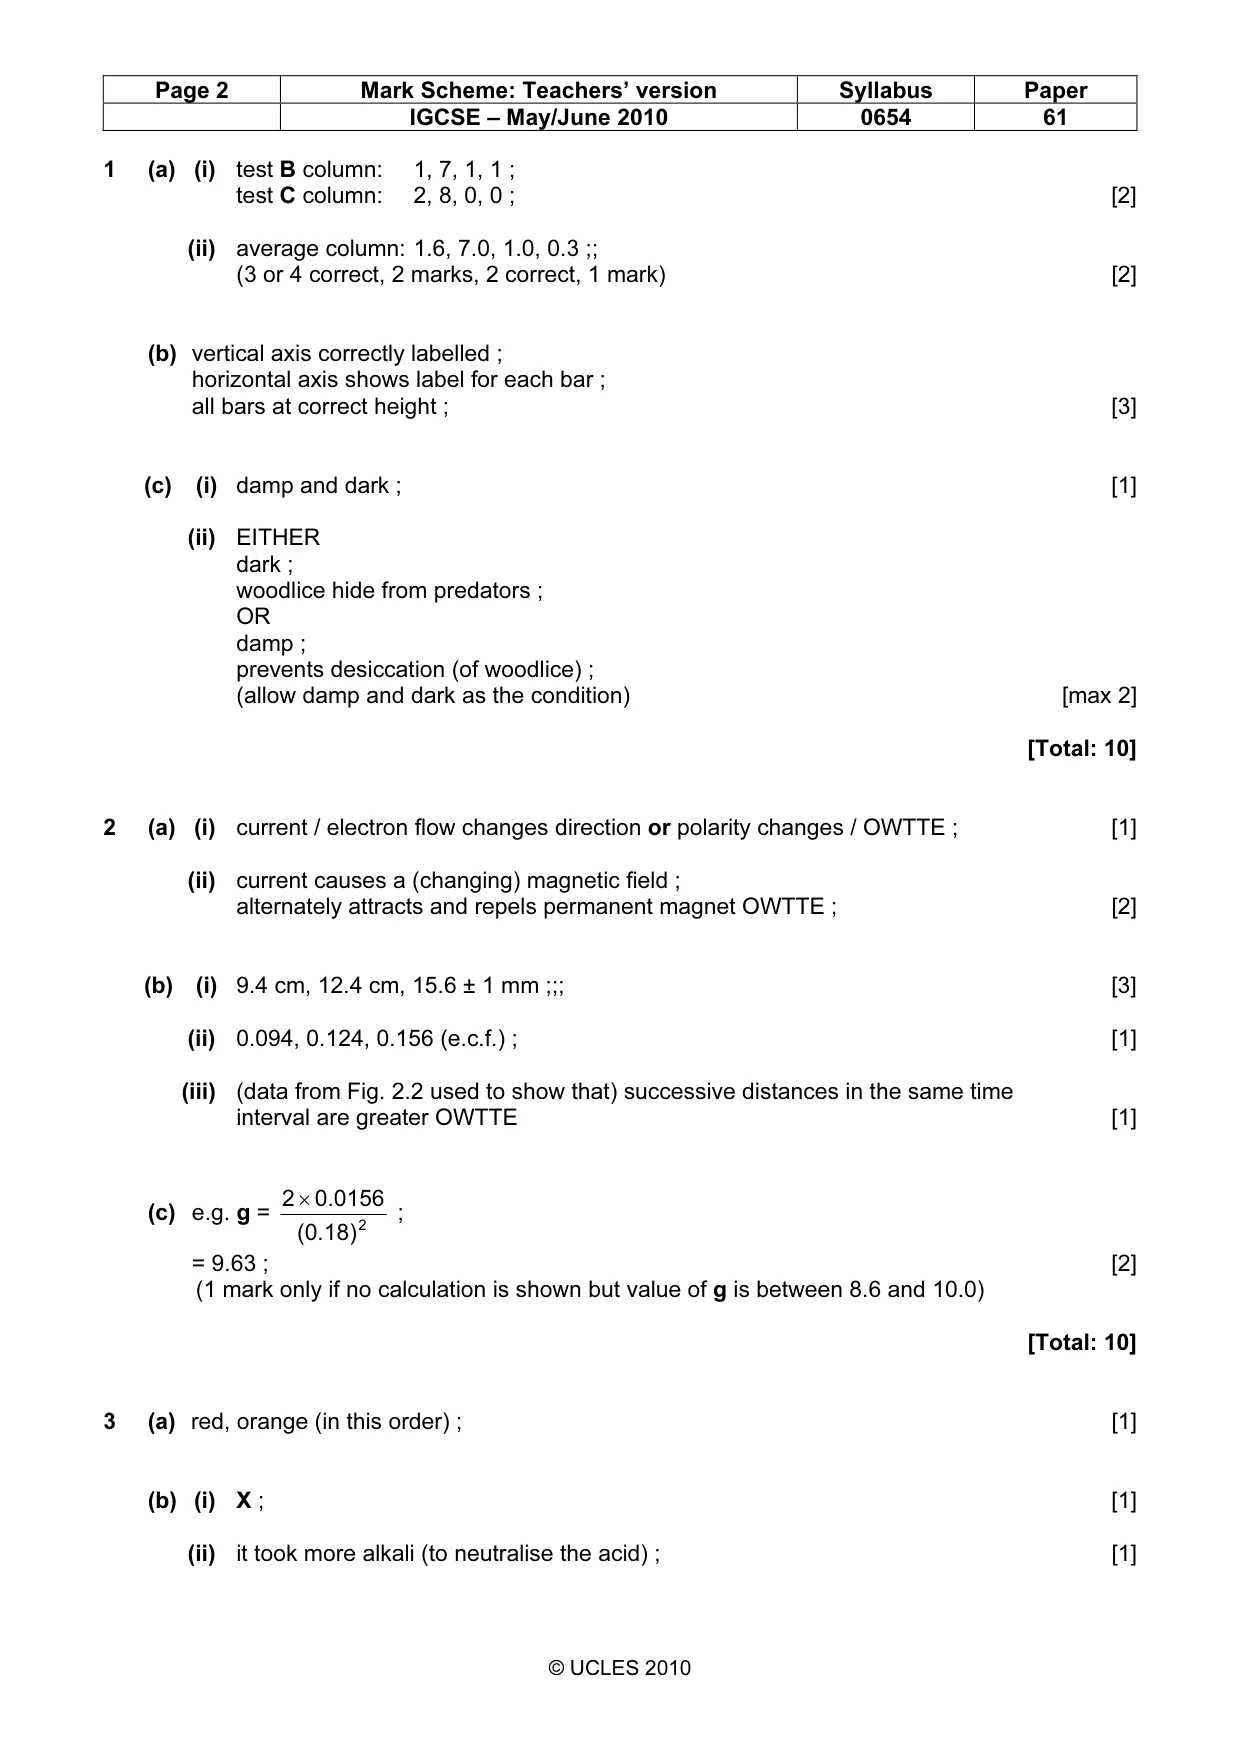
Page 2 Mark Scheme: Teachers’ version Syllabus Paper IGCSE – May/June 2010 0654 61 © UCLES 2010 1 (a) (i) test B column: 1, 7, 1, 1 ; test C column: 2, 8, 0, 0 ; [2] (ii) average column: 1.6, 7.0, 1.0, 0.3 ;; (3 or 4 correct, 2 marks, 2 correct, 1 mark) [2] (b) vertical axis correctly labelled ; horizontal axis shows label for each bar ; all bars at correct height ; [3] (c) (i) damp and dark ; [1] (ii) EITHER dark ; woodlice hide from predators ; OR damp ; prevents desiccation (of woodlice) ; (allow damp and dark as the condition) [max 2] [Total: 10] 2 (a) (i) current / electron flow changes direction or polarity changes / OWTTE ; [1] (ii) current causes a (changing) magnetic field ; alternately attracts and repels permanent magnet OWTTE ; [2] (b) (i) 9.4 cm, 12.4 cm, 15.6 ± 1 mm ;;; [3] (ii) 0.094, 0.124, 0.156 (e.c.f.) ; [1] (iii) (data from Fig. 2.2 used to show that) successive distances in the same time interval are greater OWTTE [1] (c) e.g. g = 2 (0.18) 0.0156 2× ; = 9.63 ; [2] (1 mark only if no calculation is shown but value of g is between 8.6 and 10.0) [Total: 10] 3 (a) red, orange (in this order) ; [1] (b) (i) X ; [1] (ii) it took more alkali (to neutralise the acid) ; [1]
Mark scheme, page 3
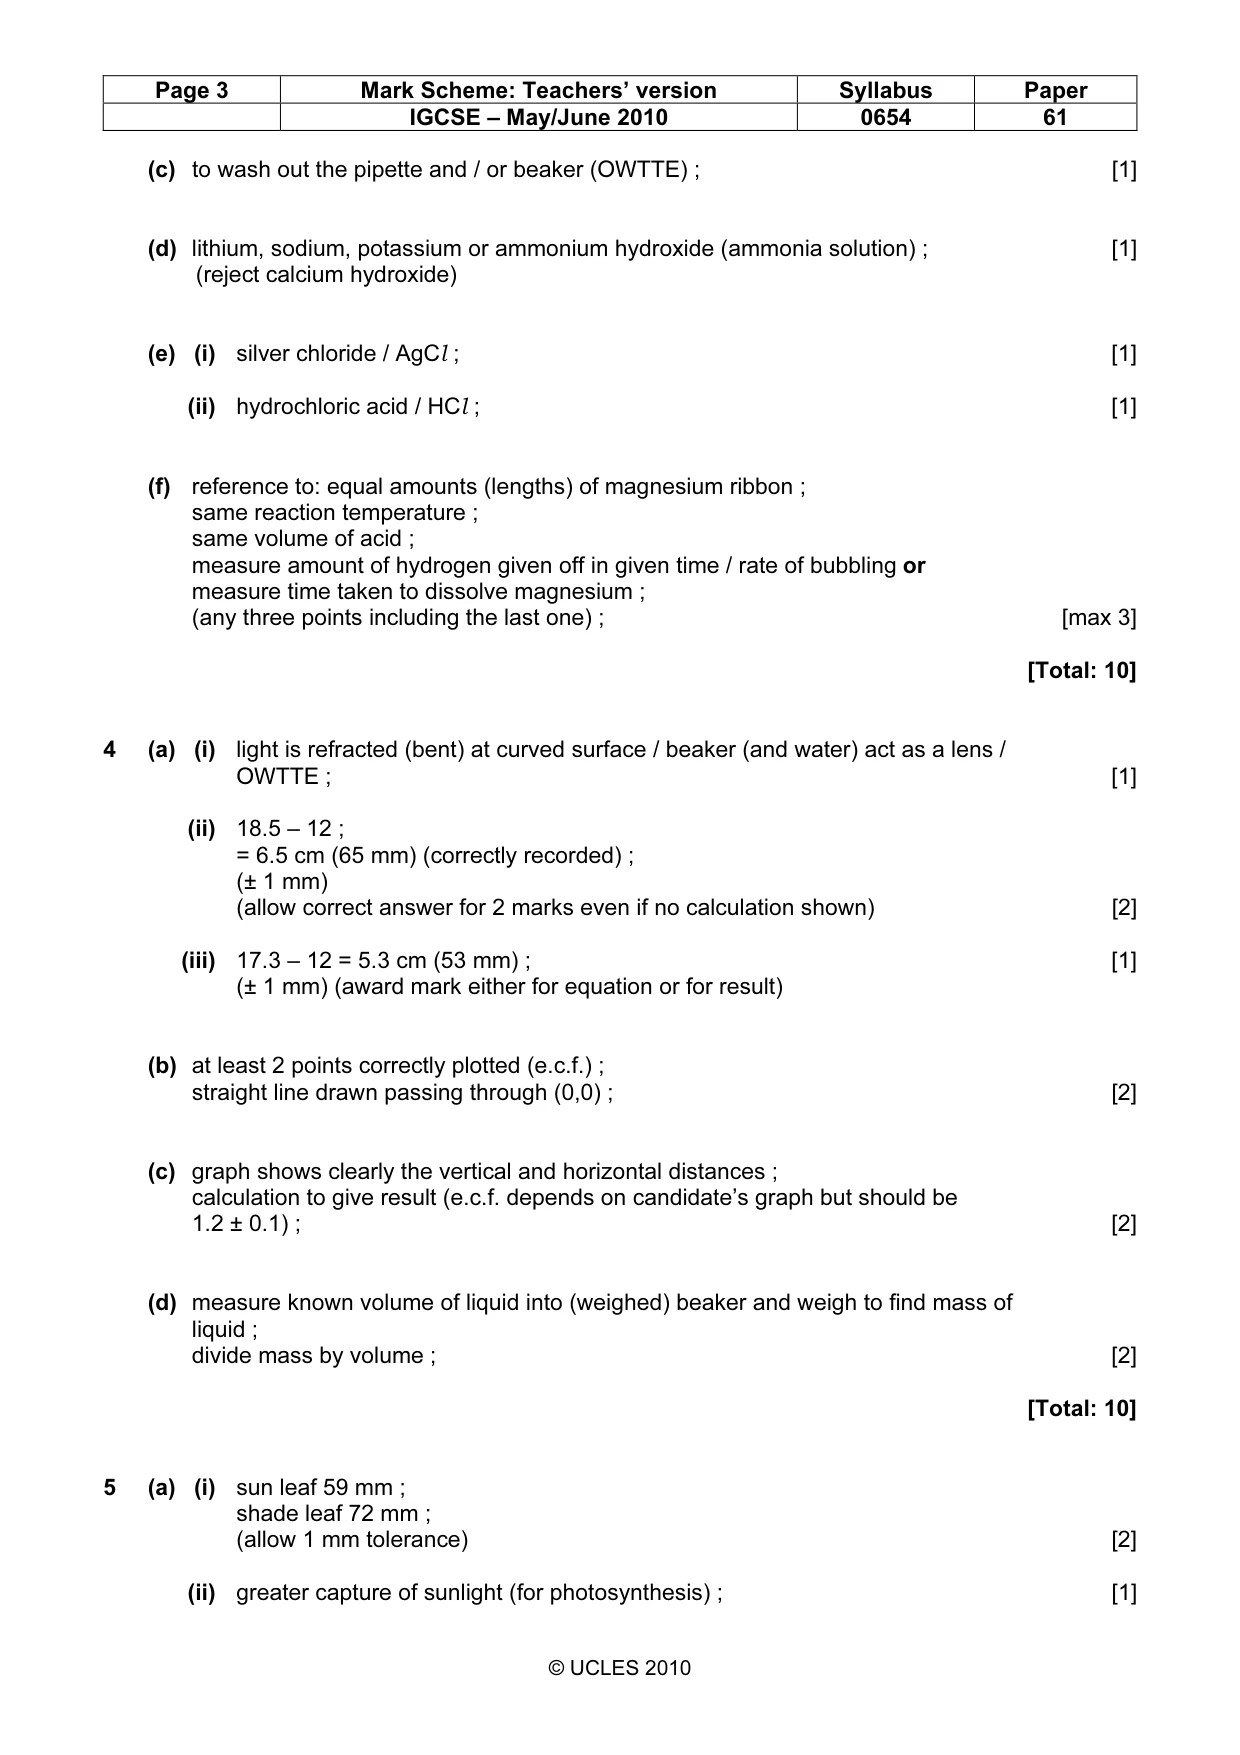
Page 3 Mark Scheme: Teachers’ version Syllabus Paper IGCSE – May/June 2010 0654 61 © UCLES 2010 (c) to wash out the pipette and / or beaker (OWTTE) ; [1] (d) lithium, sodium, potassium or ammonium hydroxide (ammonia solution) ; [1] (reject calcium hydroxide) (e) (i) silver chloride / AgCl ; [1] (ii) hydrochloric acid / HCl ; [1] (f) reference to: equal amounts (lengths) of magnesium ribbon ; same reaction temperature ; same volume of acid ; measure amount of hydrogen given off in given time / rate of bubbling or measure time taken to dissolve magnesium ; (any three points including the last one) ; [max 3] [Total: 10] 4 (a) (i) light is refracted (bent) at curved surface / beaker (and water) act as a lens / OWTTE ; [1] (ii) 18.5 – 12 ; = 6.5 cm (65 mm) (correctly recorded) ; (± 1 mm) (allow correct answer for 2 marks even if no calculation shown) [2] (iii) 17.3 – 12 = 5.3 cm (53 mm) ; [1] (± 1 mm) (award mark either for equation or for result) (b) at least 2 points correctly plotted (e.c.f.) ; straight line drawn passing through (0,0) ; [2] (c) graph shows clearly the vertical and horizontal distances ; calculation to give result (e.c.f. depends on candidate’s graph but should be 1.2 ± 0.1) ; [2] (d) measure known volume of liquid into (weighed) beaker and weigh to find mass of liquid ; divide mass by volume ; [2] [Total: 10] 5 (a) (i) sun leaf 59 mm ; shade leaf 72 mm ; (allow 1 mm tolerance) [2] (ii) greater capture of sunlight (for photosynthesis) ; [1]
Mark scheme, page 4
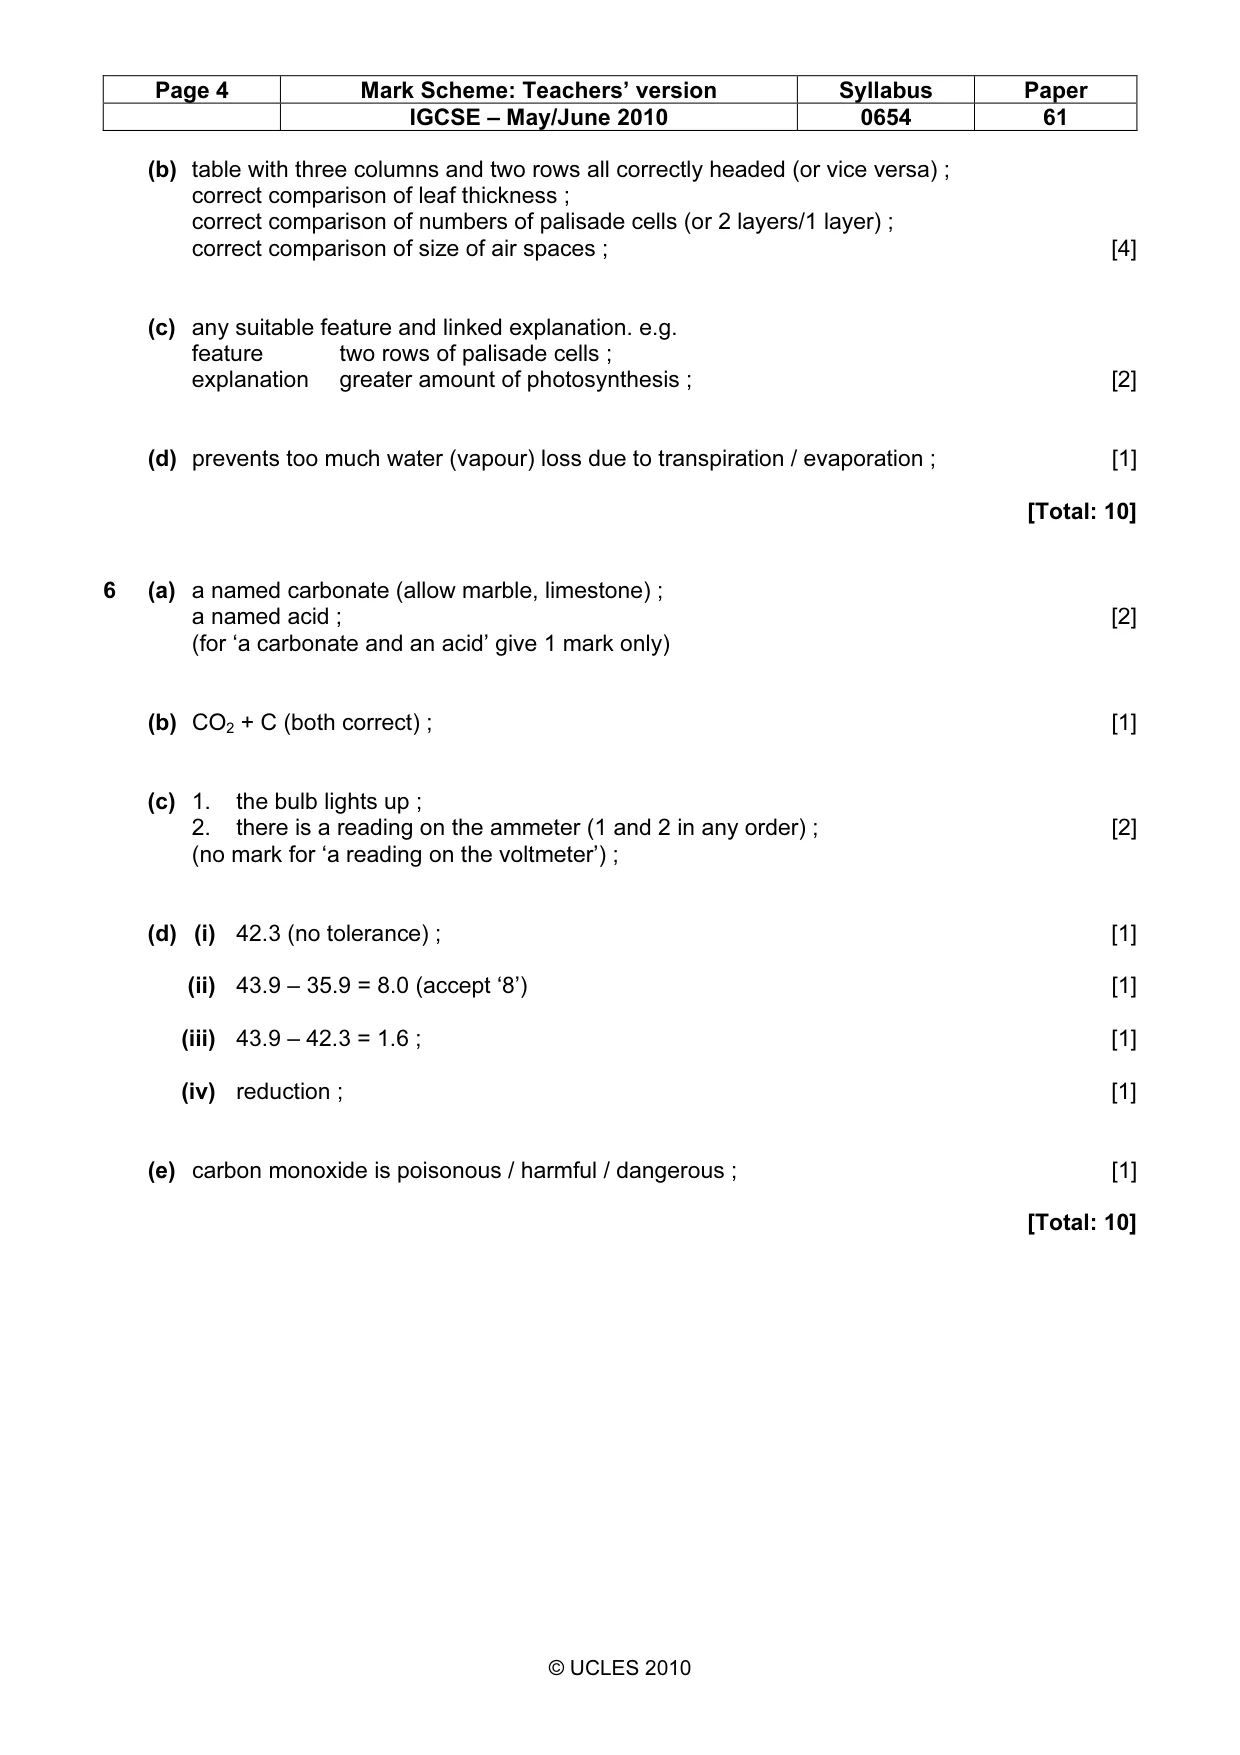
Page 4 Mark Scheme: Teachers’ version Syllabus Paper IGCSE – May/June 2010 0654 61 © UCLES 2010 (b) table with three columns and two rows all correctly headed (or vice versa) ; correct comparison of leaf thickness ; correct comparison of numbers of palisade cells (or 2 layers/1 layer) ; correct comparison of size of air spaces ; [4] (c) any suitable feature and linked explanation. e.g. feature two rows of palisade cells ; explanation greater amount of photosynthesis ; [2] (d) prevents too much water (vapour) loss due to transpiration / evaporation ; [1] [Total: 10] 6 (a) a named carbonate (allow marble, limestone) ; a named acid ; [2] (for ‘a carbonate and an acid’ give 1 mark only) (b) CO2 + C (both correct) ; [1] (c) 1. the bulb lights up ; 2. there is a reading on the ammeter (1 and 2 in any order) ; [2] (no mark for ‘a reading on the voltmeter’) ; (d) (i) 42.3 (no tolerance) ; [1] (ii) 43.9 – 35.9 = 8.0 (accept ‘8’) [1] (iii) 43.9 – 42.3 = 1.6 ; [1] (iv) reduction ; [1] (e) carbon monoxide is poisonous / harmful / dangerous ; [1] [Total: 10]
What you needed in this session
Cambridge’s own grade thresholds for 2010 May/June, Paper 6 · Variant 1. A higher threshold means an easier paper — the bar moves with how the cohort did.