Cambridge IGCSE Science - Combined 0653 — 2023 Feb/March Paper 5 · Variant 2
0653/52/F/M/23 · 4 questions · 40 marks · ≈45 min
The question paper and its mark scheme, free to read here and free to download. This is Cambridge’s own paper, exactly as it was sat.
Question paper16 pages




Mark scheme7 pages
Answers below. Sit the paper first if you are practising.
Questions as text
Q1 · When acid is added to milk, the milk clots, forming lumps
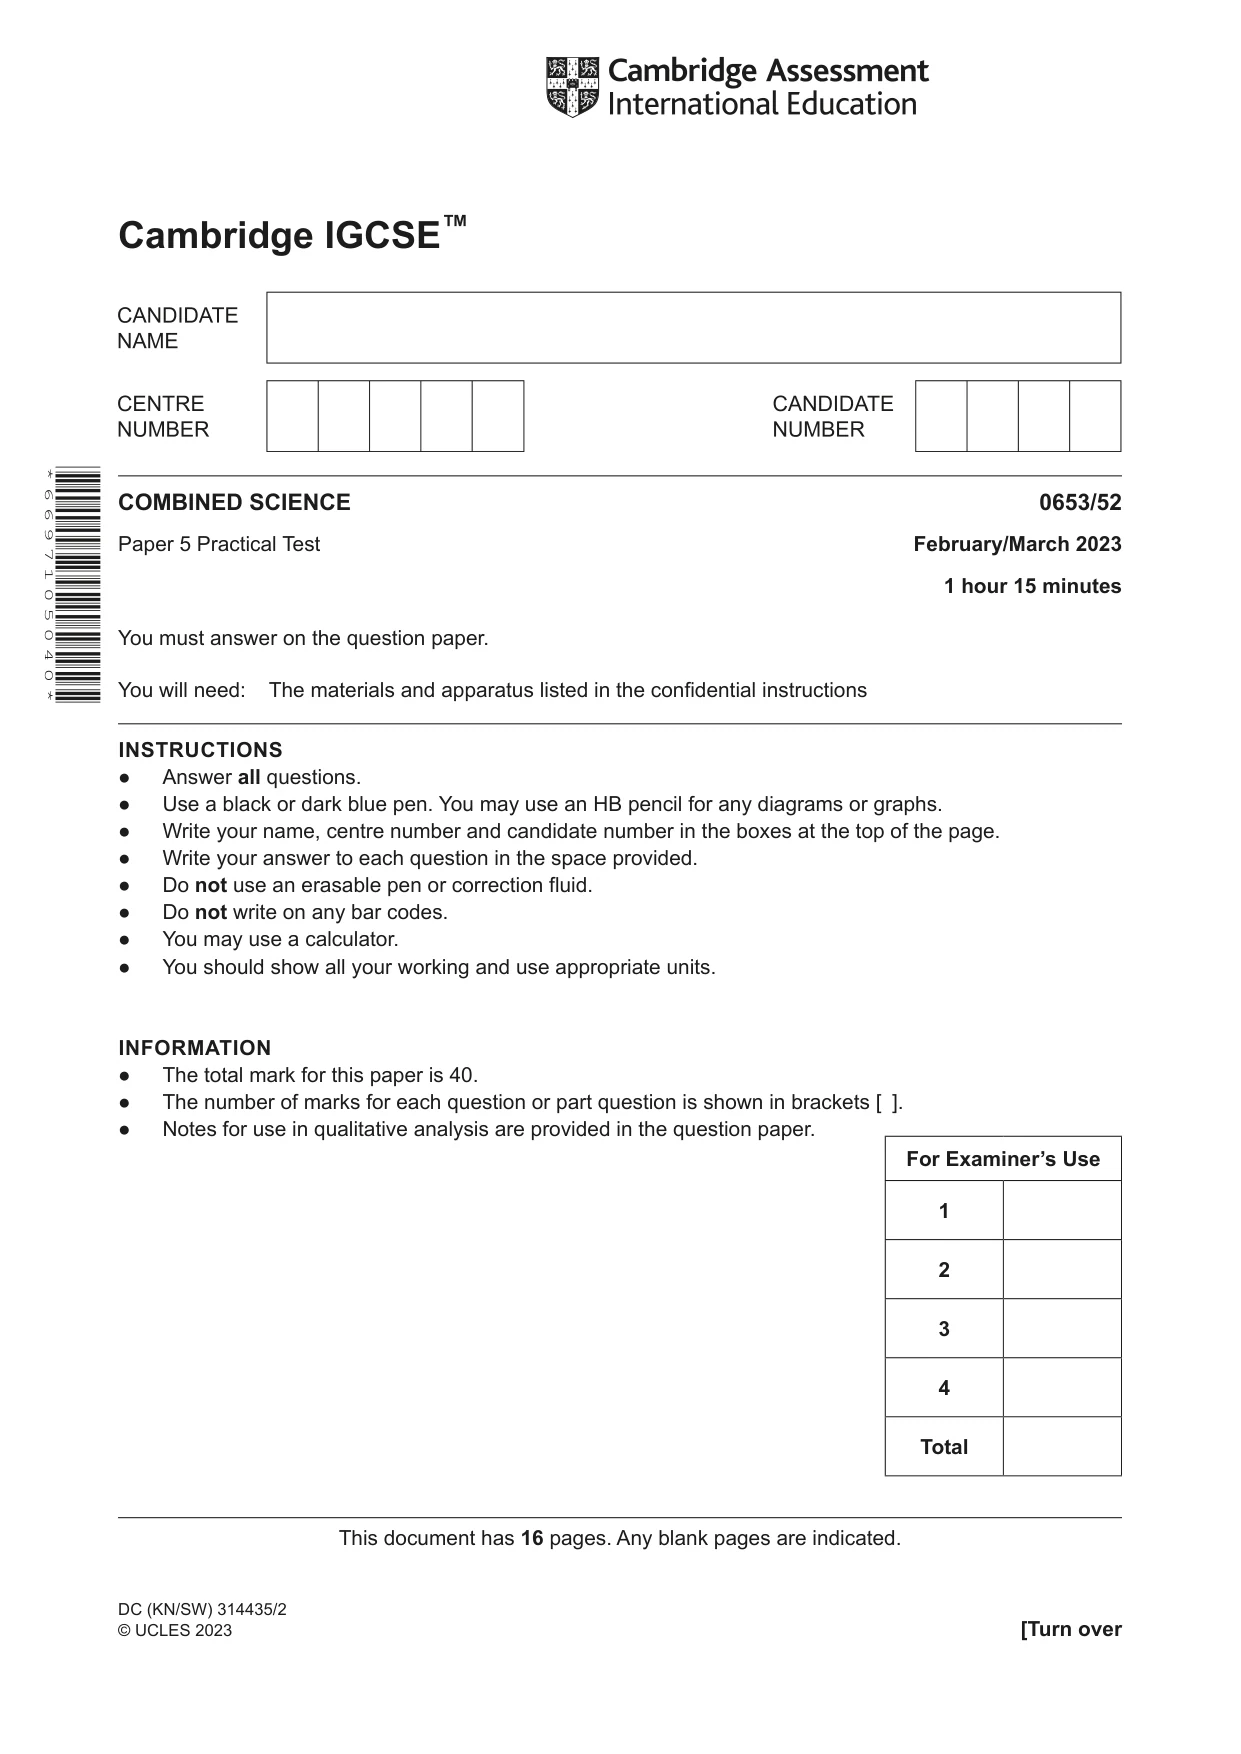
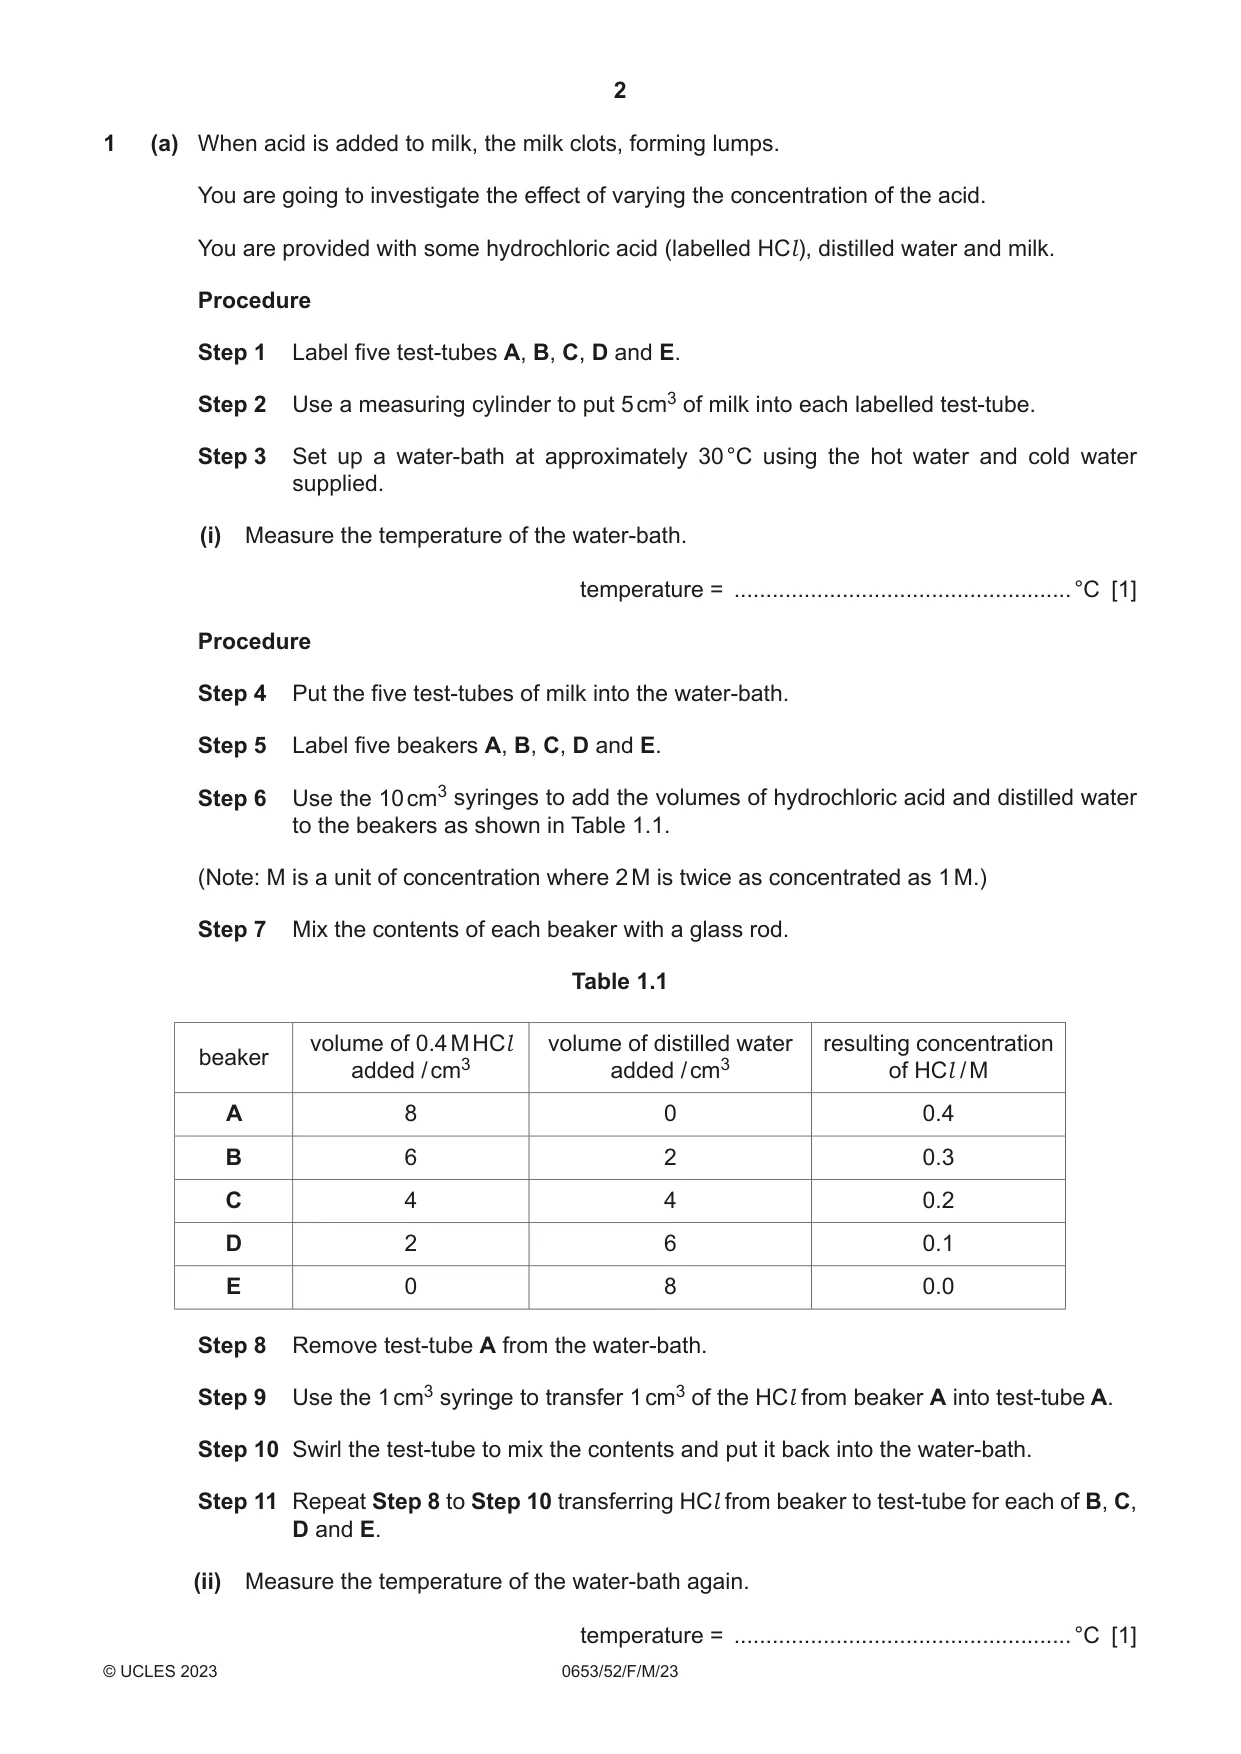
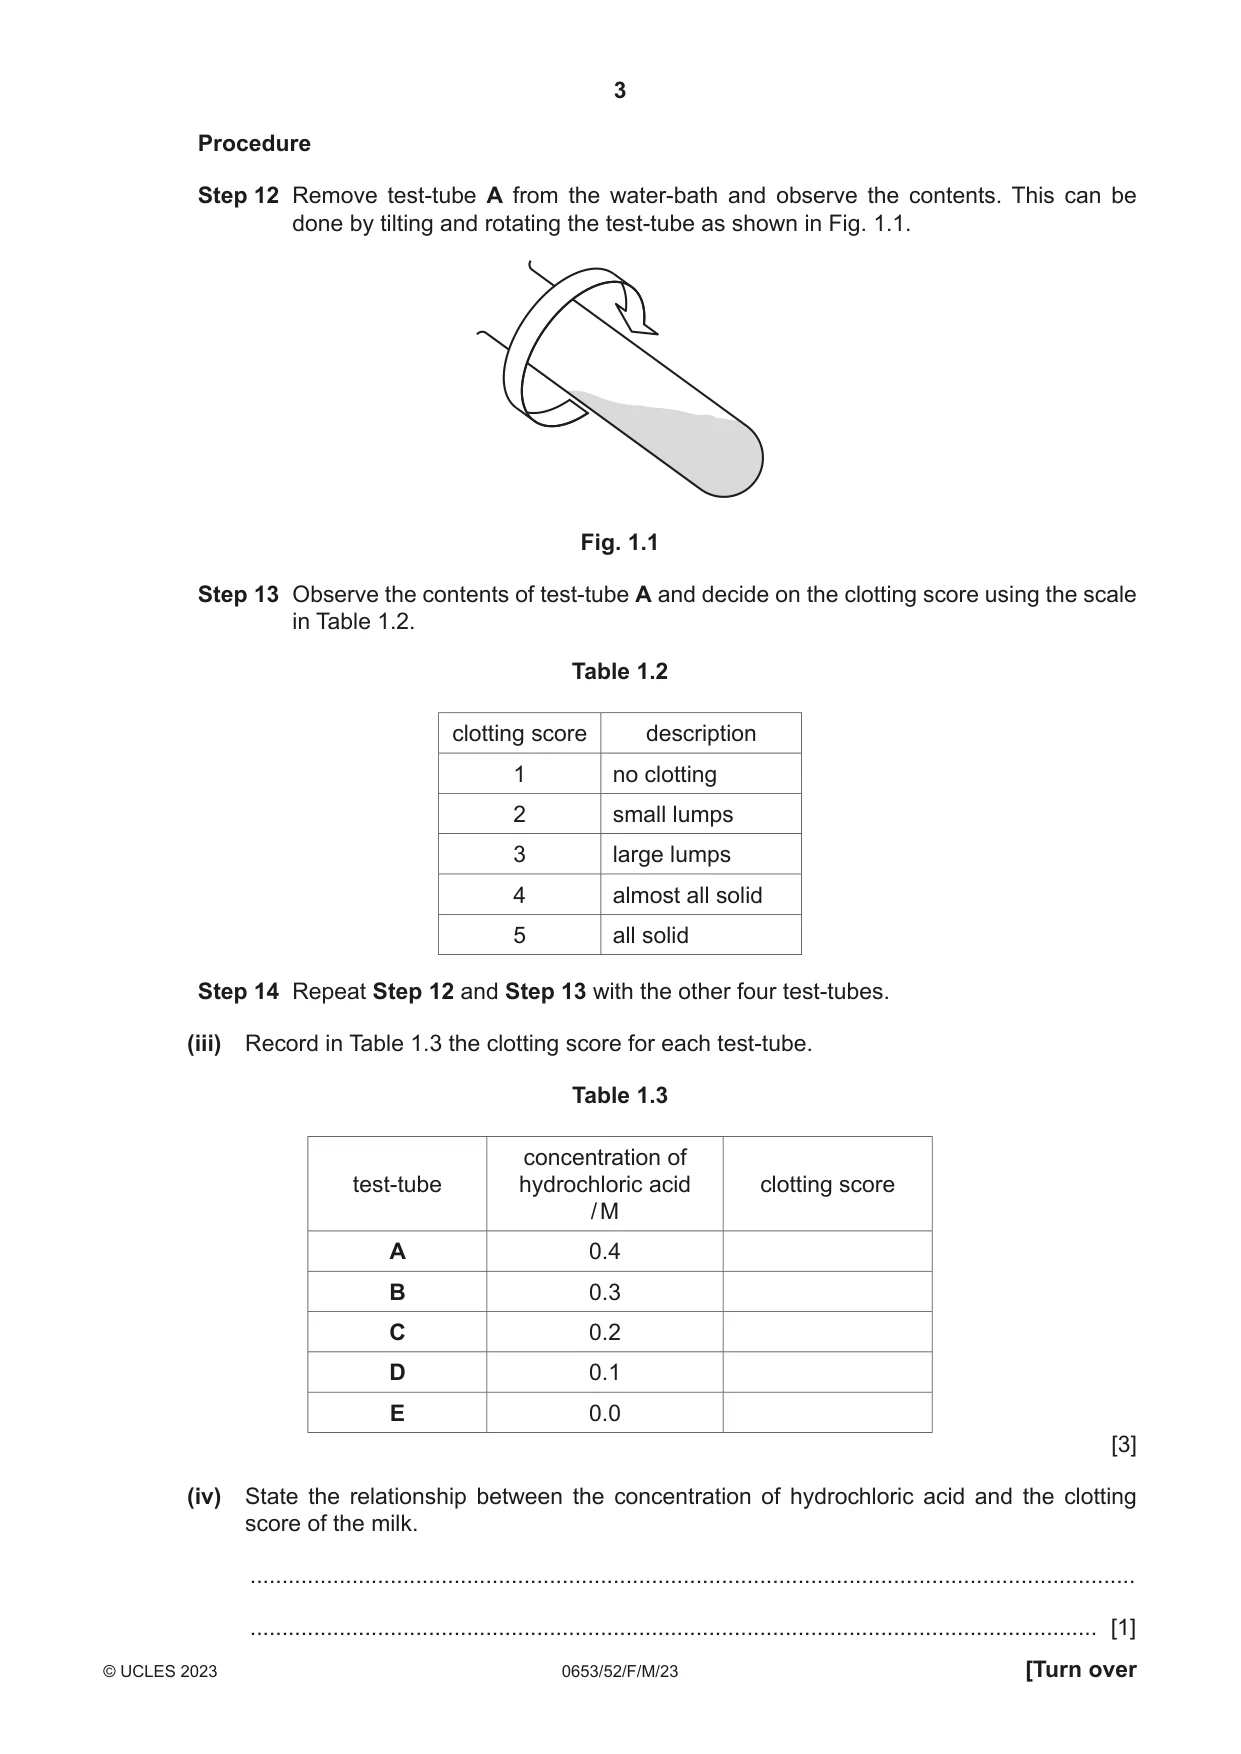
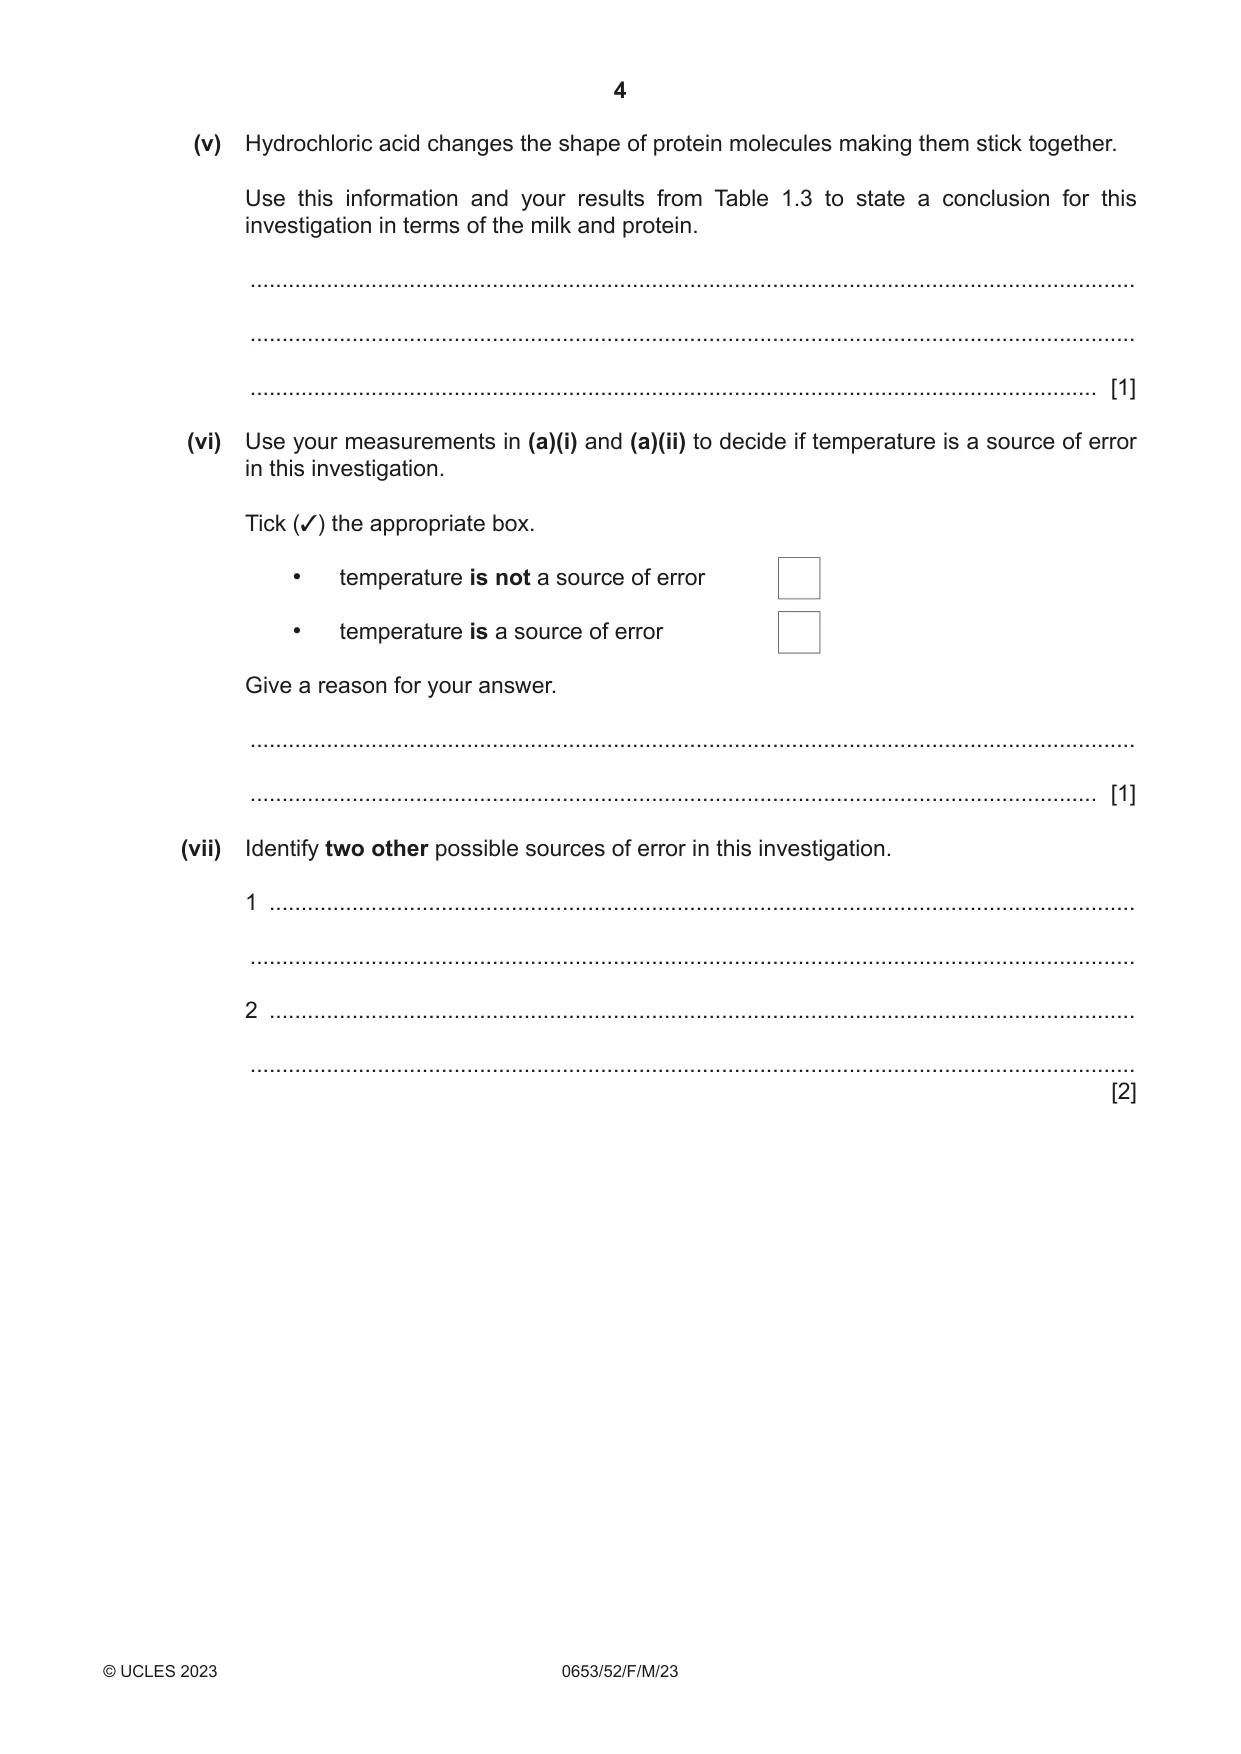
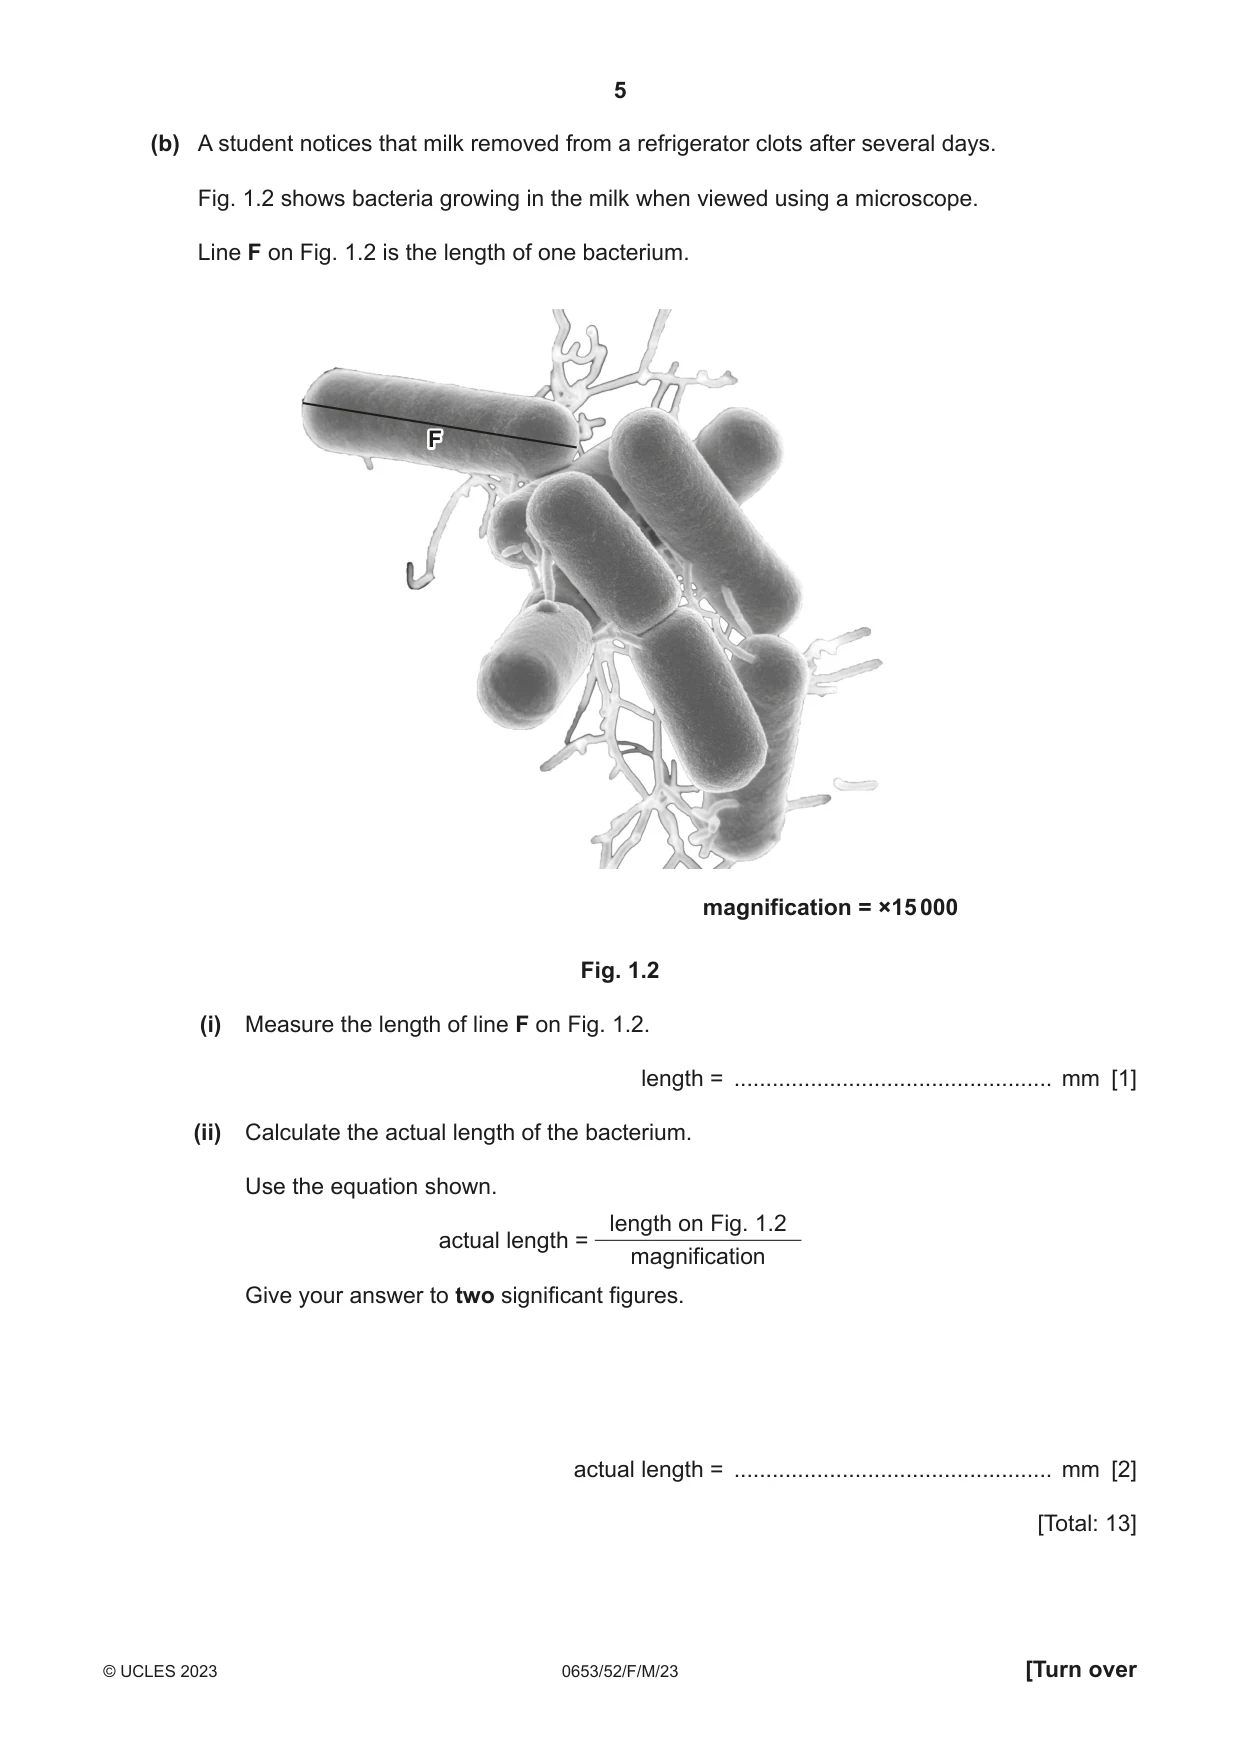
1 (a) When acid is added to milk, the milk clots, forming lumps. You are going to investigate the effect of varying the concentration of the acid. You are provided with some hydrochloric acid (labelled HCl ), distilled water and milk. Procedure Step 1 Label five test-tubes A, B, C, D and E. Step 2 Use a measuring cylinder to put 5 cm3 of milk into each labelled test-tube. Step 3 Set up a water-bath at approximately 30 °C using the hot water and cold water supplied. (i) Measure the temperature of the water-bath. temperature = .....................................................°C [1] Procedure Step 4 Put the five test-tubes of milk into the water-bath. Step 5 Label five beakers A, B, C, D and E. Step 6 Use the 10 cm3 syringes to add the volumes of hydrochloric acid and distilled water to the beakers as shown in Table 1.1. (Note: M is a unit of concentration where 2 M is twice as concentrated as 1 M.) Step 7 Mix the contents of each beaker with a glass rod. Table 1.1 volume of 0.4 M HCl volume of distilled water resulting concentration beaker added / cm3 added / cm3 of HCl / M A 8 0 0.4 B 6 2 0.3 C 4 4 0.2 D 2 6 0.1 E 0 8 0.0 Step 8 Remove test-tube A from the water-bath. Step 9 Use the 1 cm3 syringe to transfer 1 cm3 of the HCl from beaker A into test-tube A. Step 10 Swirl the test-tube to mix the contents and put it back into the water-bath. Step 11 Repeat Step 8 to Step 10 transferring HCl from beaker to test-tube for each of B, C, D and E. (ii) Measure the temperature of the water-bath again. temperature = .....................................................°C [1] Procedure Step 12 Remove test-tube A from the water-bath and observe the contents. This can be done by tilting and rotating the test-tube as shown in Fig. 1.1. Fig. 1.1 Step 13 Observe the contents of test-tube A and decide on the clotting score using the scale in Table 1.2. Table 1.2 clotting score description 1 no clotting 2 small lumps 3 large lumps 4 almost all solid 5 all solid Step 14 Repeat Step 12 and Step 13 with the other four test-tubes. (iii) Record in Table 1.3 the clotting score for each test-tube. Table 1.3 concentration of test-tube hydrochloric acid clotting score / M A 0.4 B 0.3 C 0.2 D 0.1 E 0.0 [3] (iv) State the relationship between the concentration of hydrochloric acid and the clotting score of the milk. ........................................................................................................................................... ..................................................................................................................................... [1] (v) Hydrochloric acid changes the shape of protein molecules making them stick together. Use this information and your results from Table 1.3 to state a conclusion for this investigation in terms of the milk and protein. ........................................................................................................................................... ........................................................................................................................................... ..................................................................................................................................... [1] (vi) Use your measurements in (a)(i) and (a)(ii) to decide if temperature is a source of error in this investigation. Tick (3) the appropriate box. • temperature is not a source of error • temperature is a source of error Give a reason for your answer. ........................................................................................................................................... ..................................................................................................................................... [1] (vii) Identify two other possible sources of error in this investigation. 1 ........................................................................................................................................ ........................................................................................................................................... 2 ........................................................................................................................................ ........................................................................................................................................... [2] (b) A student notices that milk removed from a refrigerator clots after several days. Fig. 1.2 shows bacteria growing in the milk when viewed using a microscope. Line F on Fig. 1.2 is the length of one bacterium. F magnification = ×15 000 Fig. 1.2 (i) Measure the length of line F on Fig. 1.2. length = .................................................. mm [1] (ii) Calculate the actual length of the bacterium. Use the equation shown. length on Fig. 1.2 actual length = magnification Give your answer to two significant figures. actual length = .................................................. mm [2] [Total: 13]
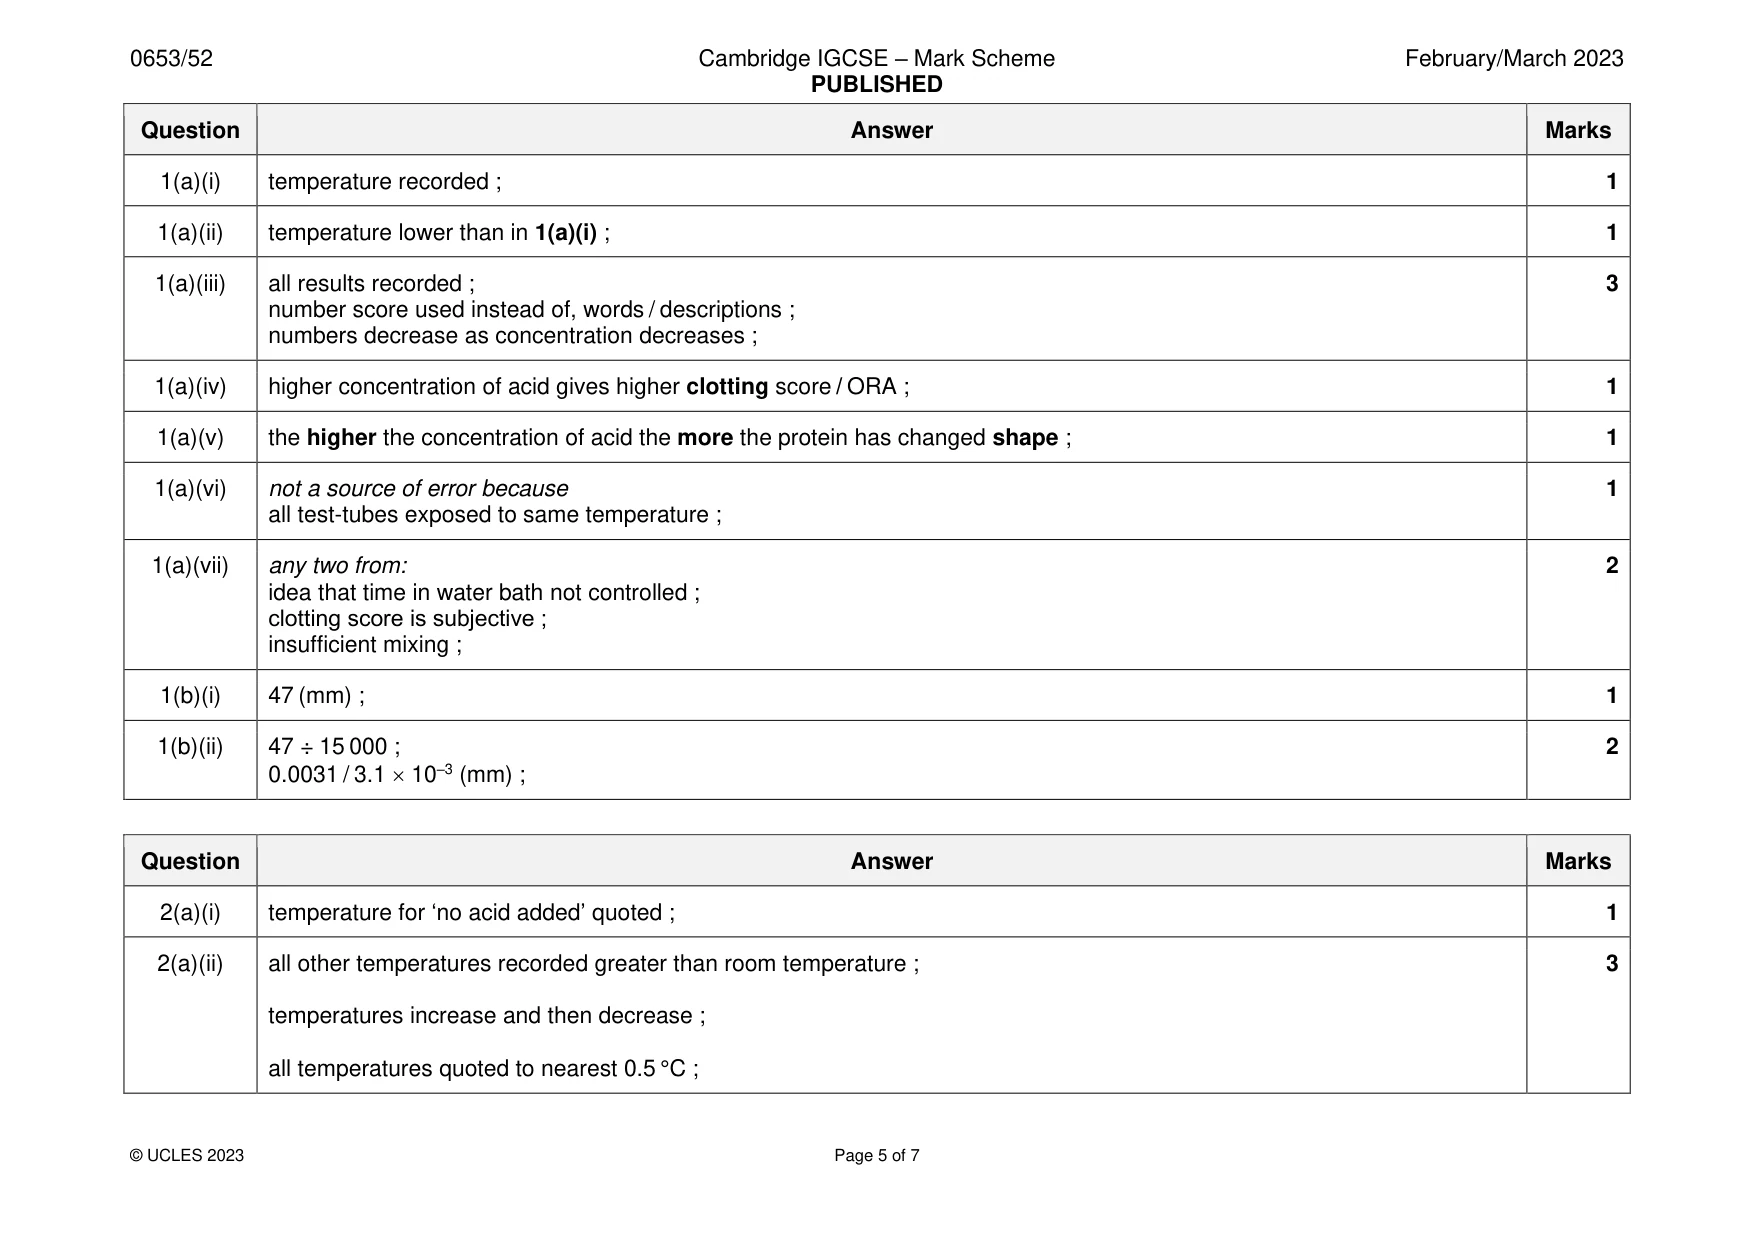
Mark scheme: Question Answer Marks 1(a)(i) temperature recorded ; 1 1(a)(ii) temperature lower than in 1(a)(i) ; 1 1(a)(iii) all results recorded ; 3 number score used instead of, words / descriptions ; numbers decrease as concentration decreases ; 1(a)(iv) higher concentration of acid gives higher clotting score / ORA ; 1 1(a)(v) the higher the concentration of acid the more the protein has changed shape ; 1 1(a)(vi) not a source of error because 1 all test-tubes exposed to same temperature ; 1(a)(vii) any two from: 2 idea that time in water bath not controlled ; clotting score is subjective ; insufficient mixing ; 1(b)(i) 47 (mm) ; 1 1(b)(ii) 47 ÷ 15 000 ; 2 0.0031 / 3.1 10–3 (mm) ;
Q2 · You are going to investigate the properties of aqueous sodium hydroxide
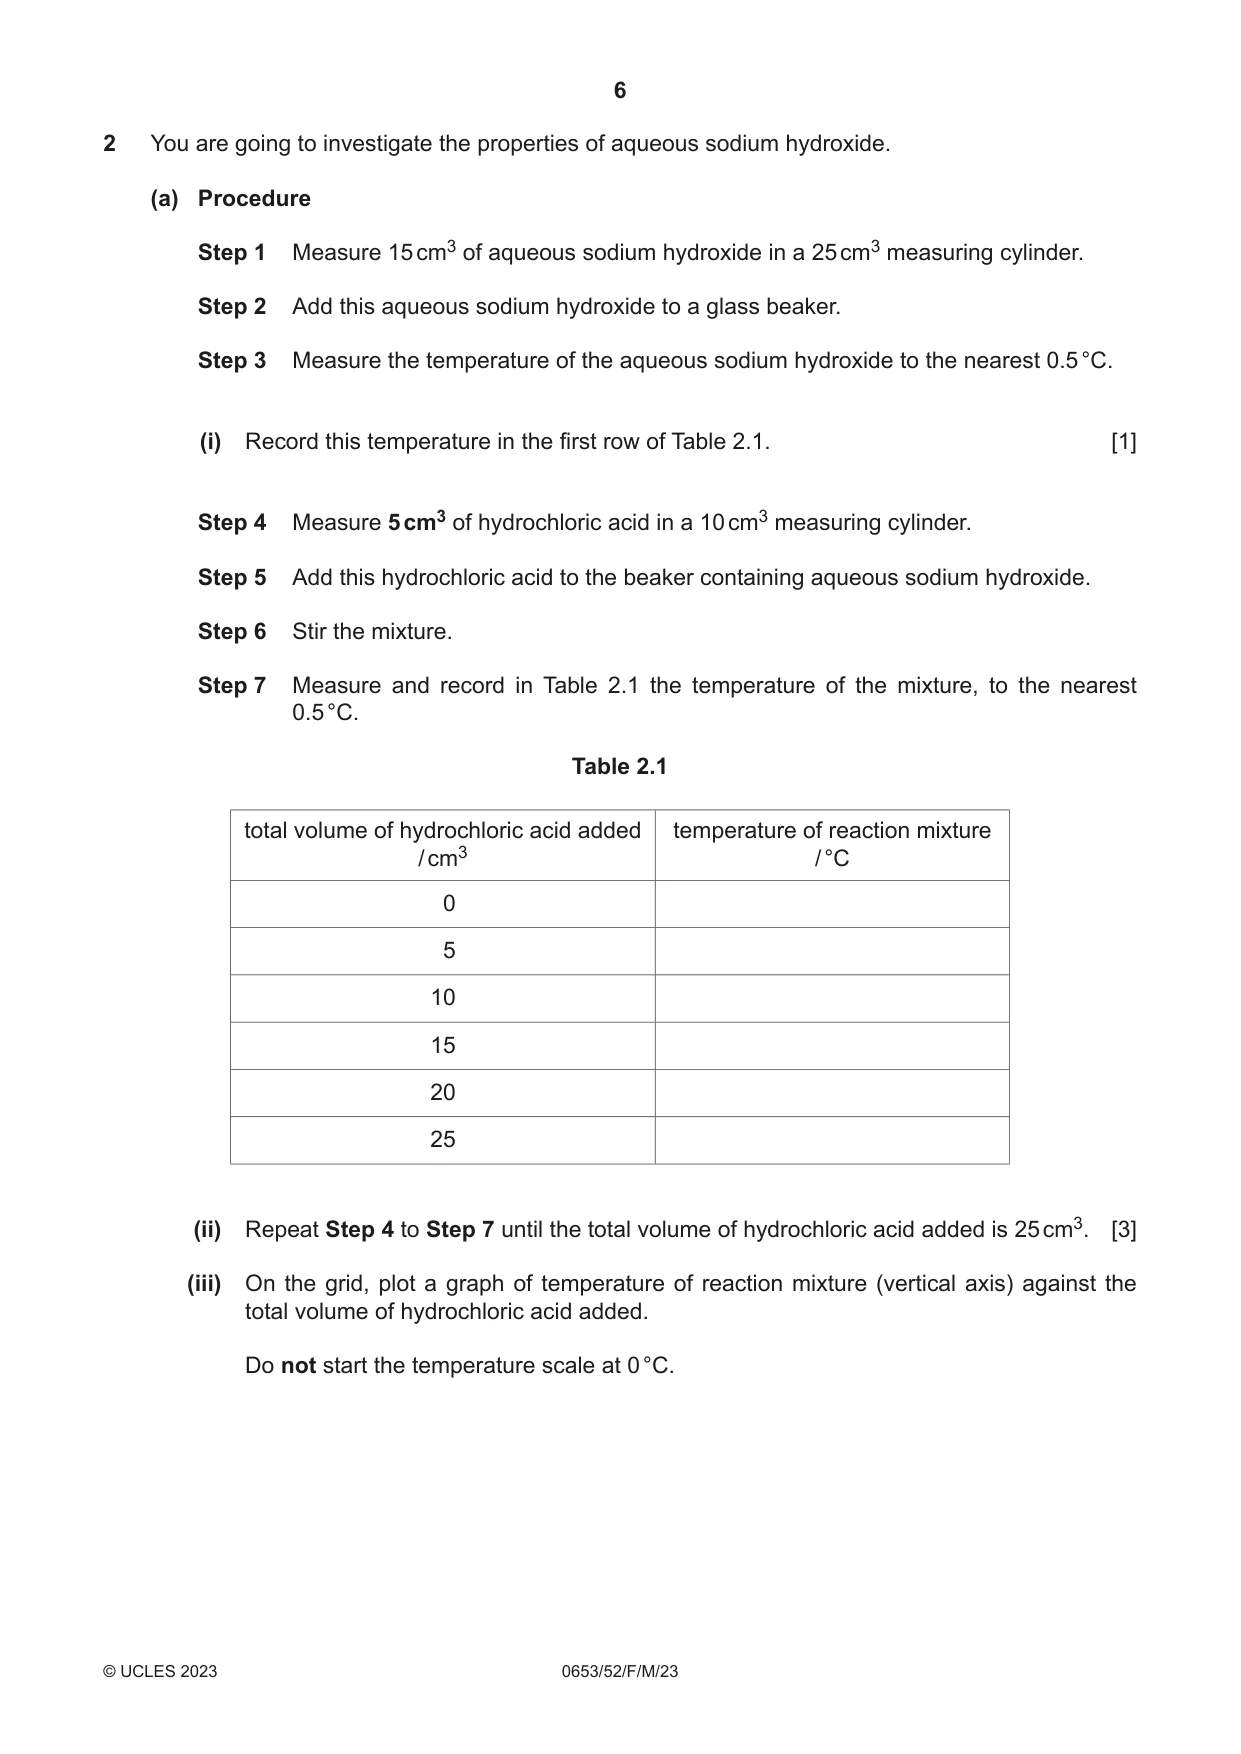
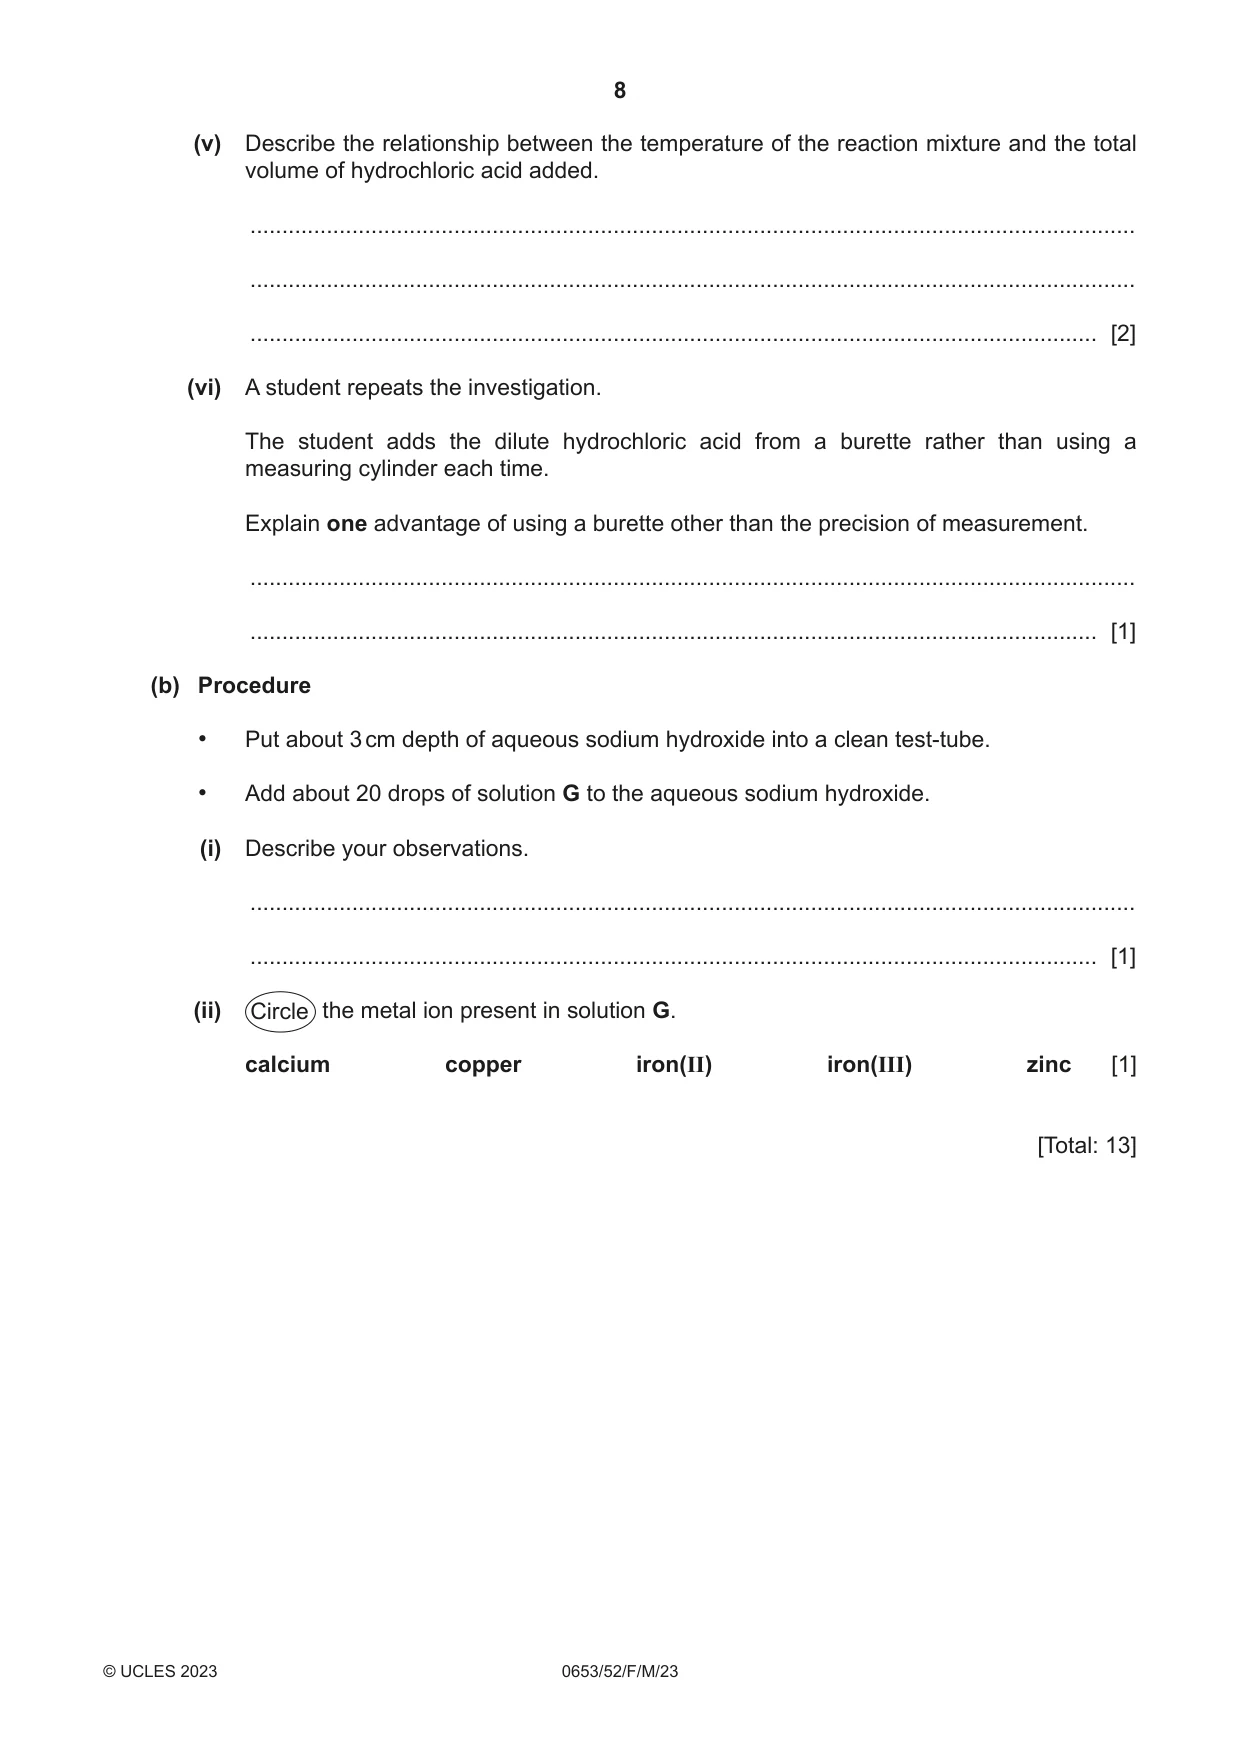
2 You are going to investigate the properties of aqueous sodium hydroxide. (a) Procedure Step 1 Measure 15 cm3 of aqueous sodium hydroxide in a 25 cm3 measuring cylinder. Step 2 Add this aqueous sodium hydroxide to a glass beaker. Step 3 Measure the temperature of the aqueous sodium hydroxide to the nearest 0.5 °C. (i) Record this temperature in the first row of Table 2.1. [1] Step 4 Measure 5 cm3 of hydrochloric acid in a 10 cm3 measuring cylinder. Step 5 Add this hydrochloric acid to the beaker containing aqueous sodium hydroxide. Step 6 Stir the mixture. Step 7 Measure and record in Table 2.1 the temperature of the mixture, to the nearest 0.5 °C. Table 2.1 total volume of hydrochloric acid added temperature of reaction mixture / cm3 / °C 0 5 10 15 20 25 (ii) Repeat Step 4 to Step 7 until the total volume of hydrochloric acid added is 25 cm3. [3] (iii) On the grid, plot a graph of temperature of reaction mixture (vertical axis) against the total volume of hydrochloric acid added. Do not start the temperature scale at 0 °C. (v) Describe the relationship between the temperature of the reaction mixture and the total volume of hydrochloric acid added. ........................................................................................................................................... ........................................................................................................................................... ..................................................................................................................................... [2] (vi) A student repeats the investigation. The student adds the dilute hydrochloric acid from a burette rather than using a measuring cylinder each time. Explain one advantage of using a burette other than the precision of measurement. ........................................................................................................................................... ..................................................................................................................................... [1] (b) Procedure • Put about 3 cm depth of aqueous sodium hydroxide into a clean test-tube. • Add about 20 drops of solution G to the aqueous sodium hydroxide. (i) Describe your observations. ........................................................................................................................................... ..................................................................................................................................... [1] (ii) Circle the metal ion present in solution G. calcium copper iron(II) iron(III) zinc [1] [Total: 13]
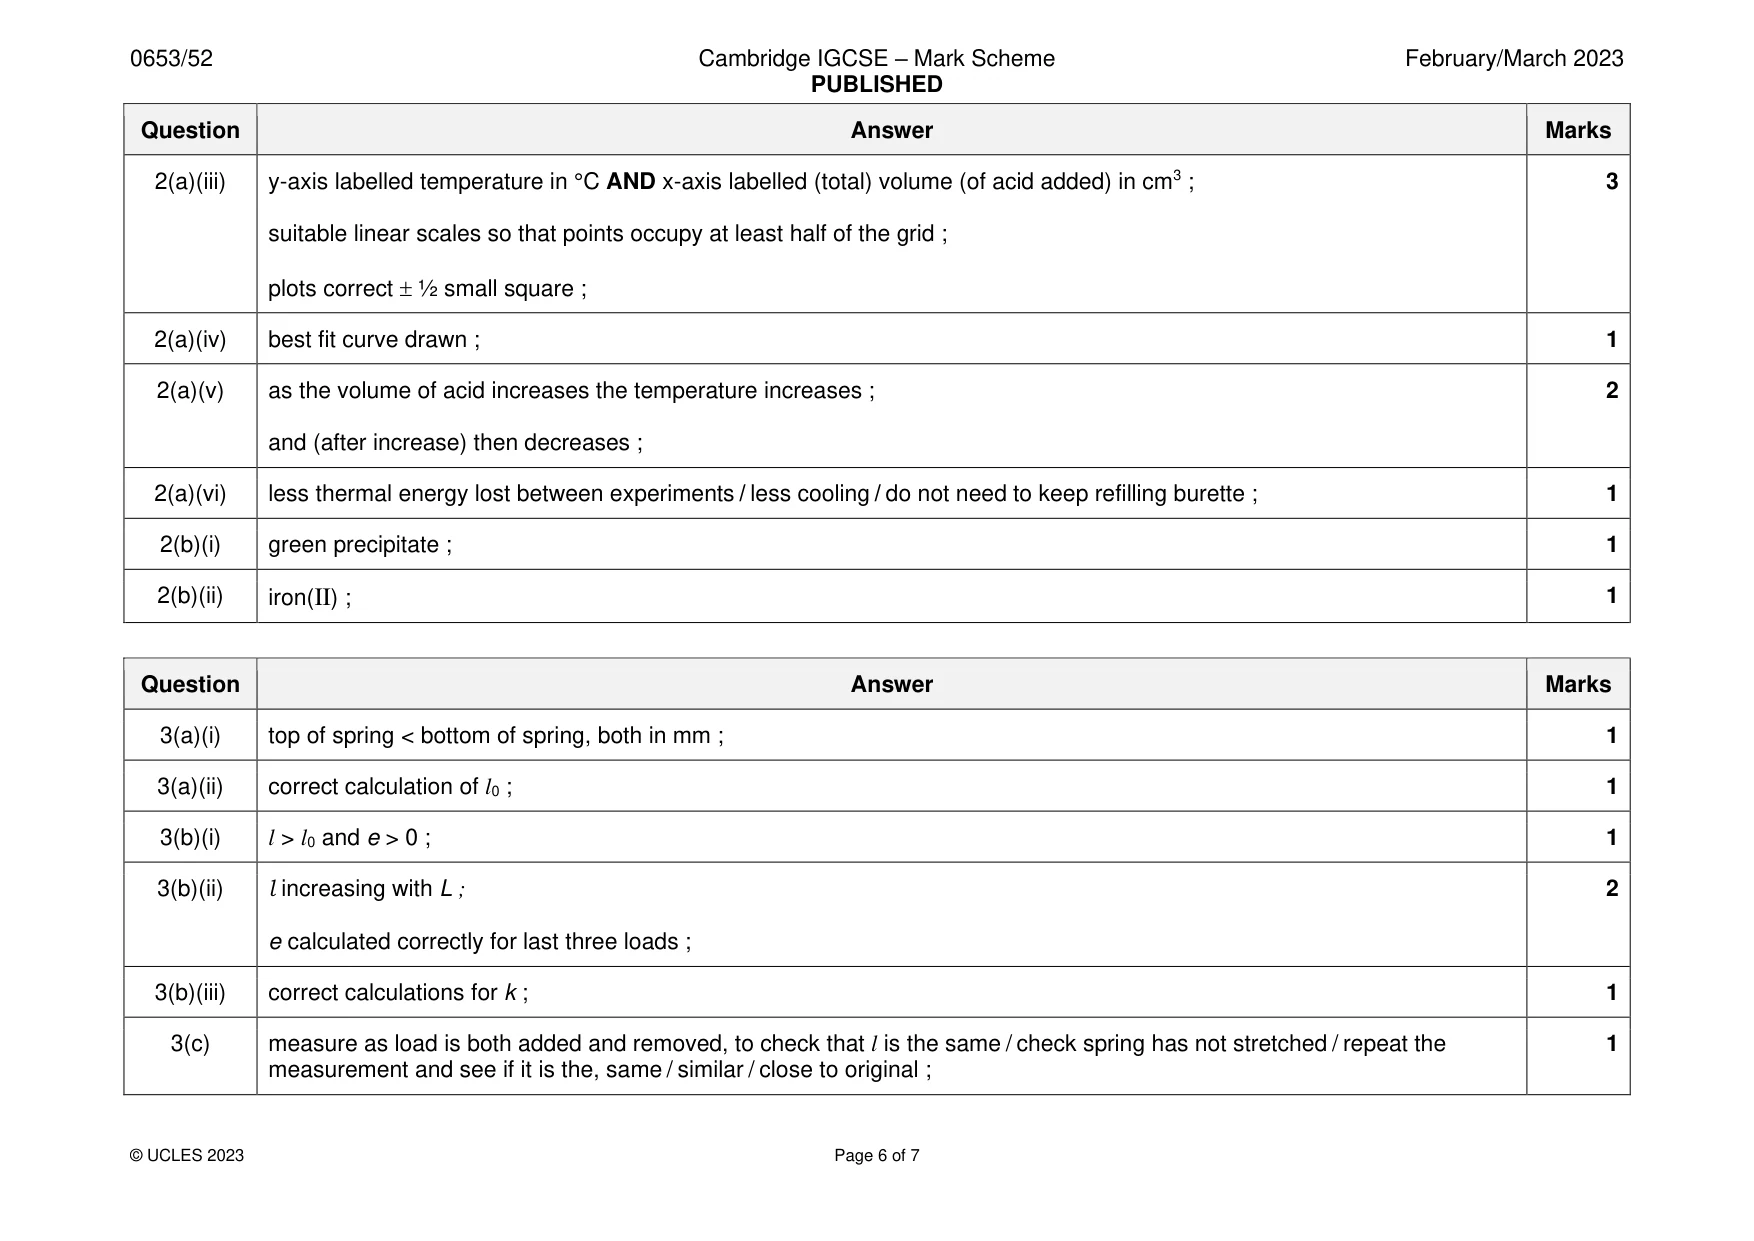
Mark scheme: 2(a)(i) temperature for ‘no acid added’ quoted ; 1 2(a)(ii) all other temperatures recorded greater than room temperature ; 3 temperatures increase and then decrease ; all temperatures quoted to nearest 0.5 °C ; 2(a)(iii) y-axis labelled temperature in °C AND x-axis labelled (total) volume (of acid added) in cm3 ; 3 suitable linear scales so that points occupy at least half of the grid ; plots correct ½ small square ; 2(a)(iv) best fit curve drawn ; 1 2(a)(v) as the volume of acid increases the temperature increases ; 2 and (after increase) then decreases ; 2(a)(vi) less thermal energy lost between experiments / less cooling / do not need to keep refilling burette ; 1 2(b)(i) green precipitate ; 1 2(b)(ii) iron(II) ; 1
Q3 · In this experiment you will measure the extension of a spring as different loads are…
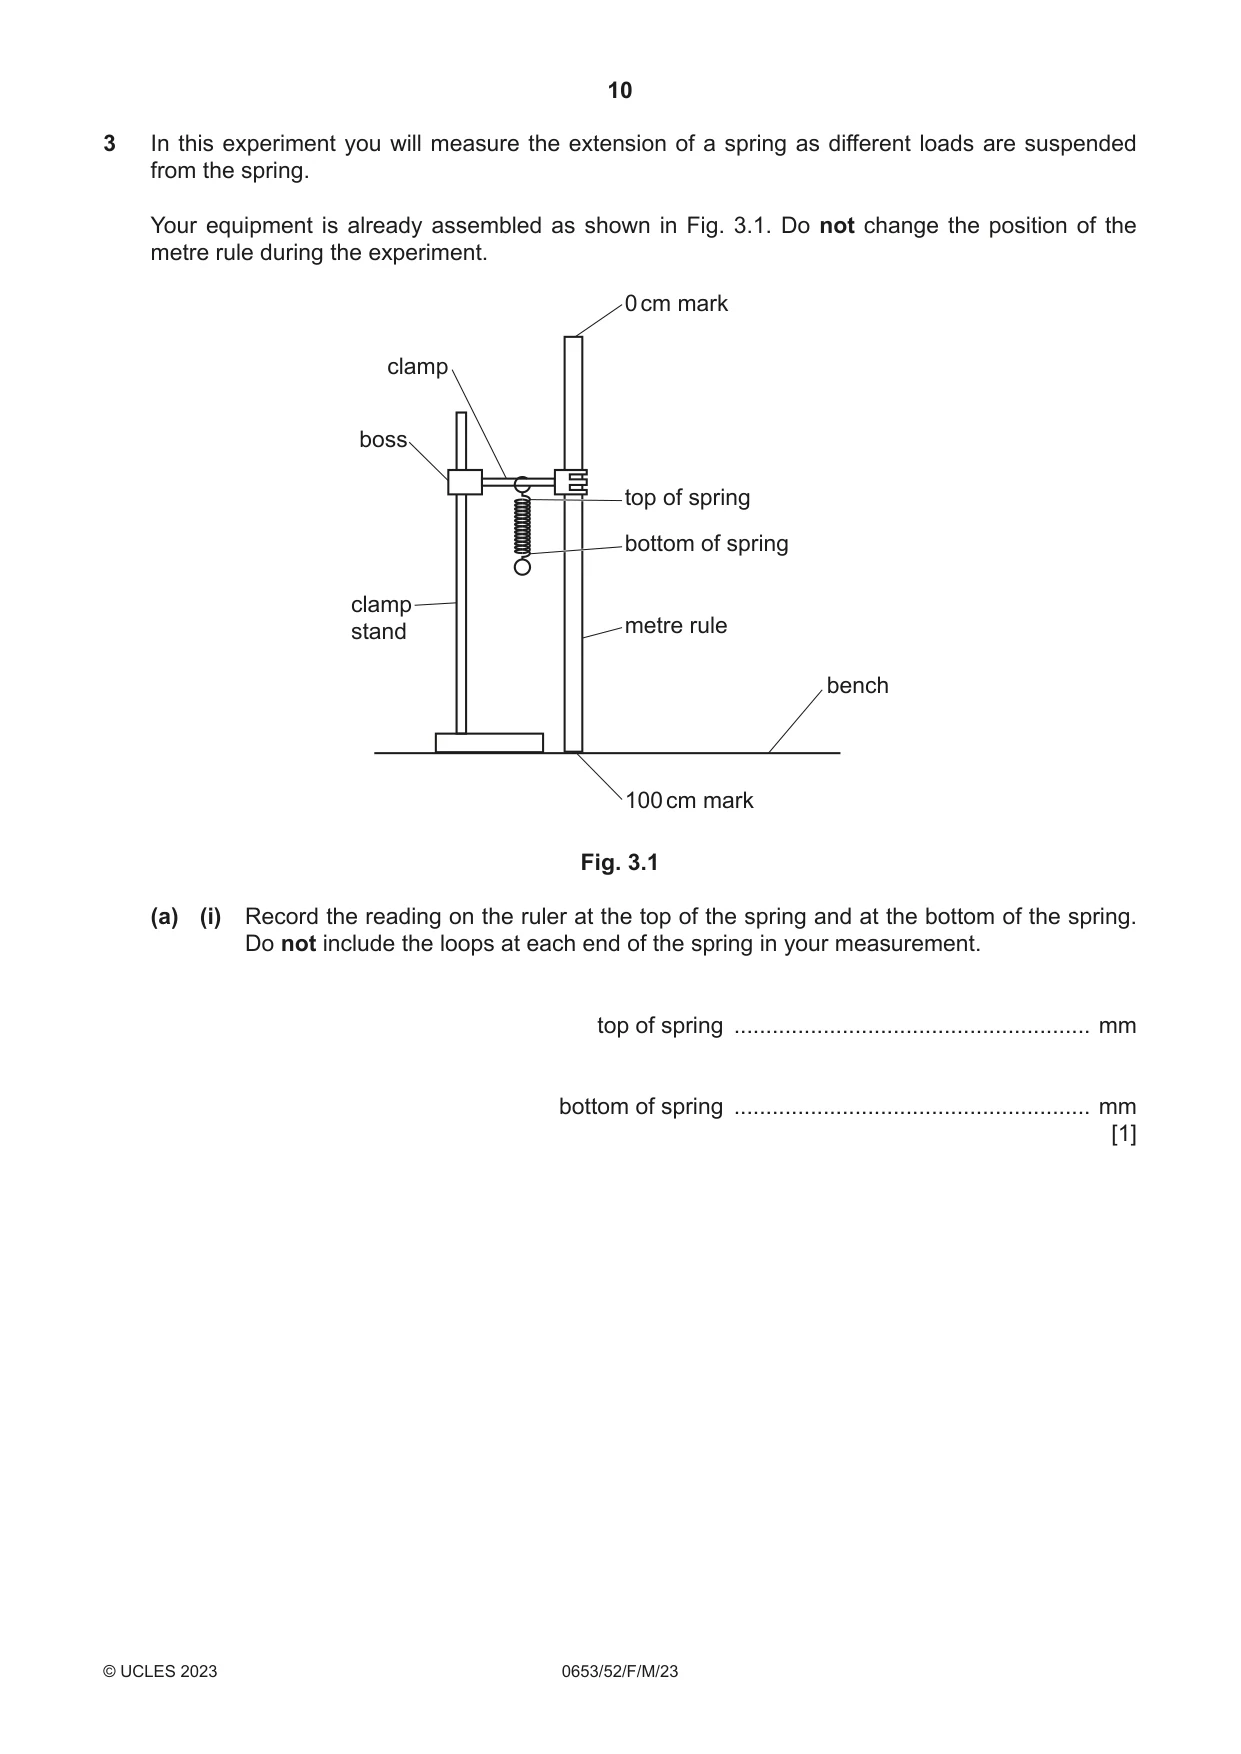
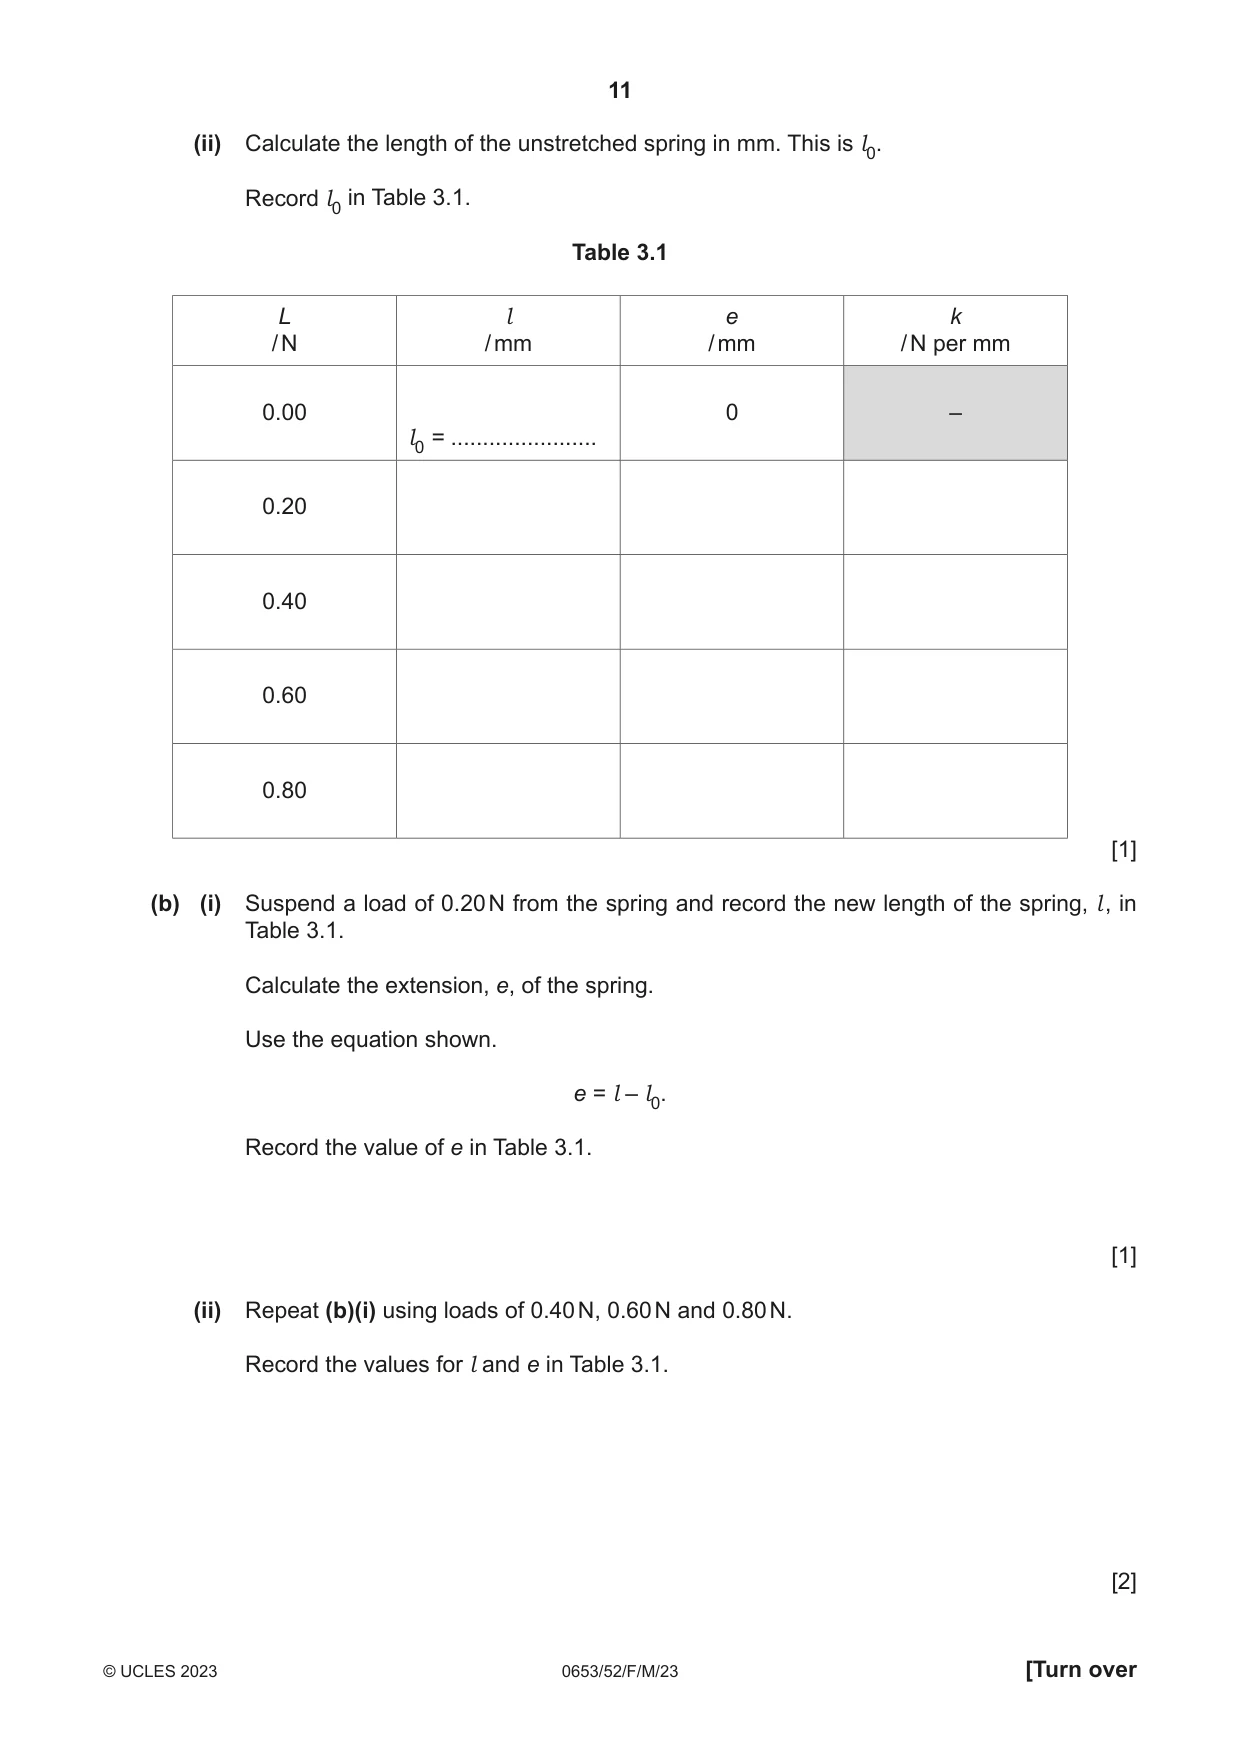
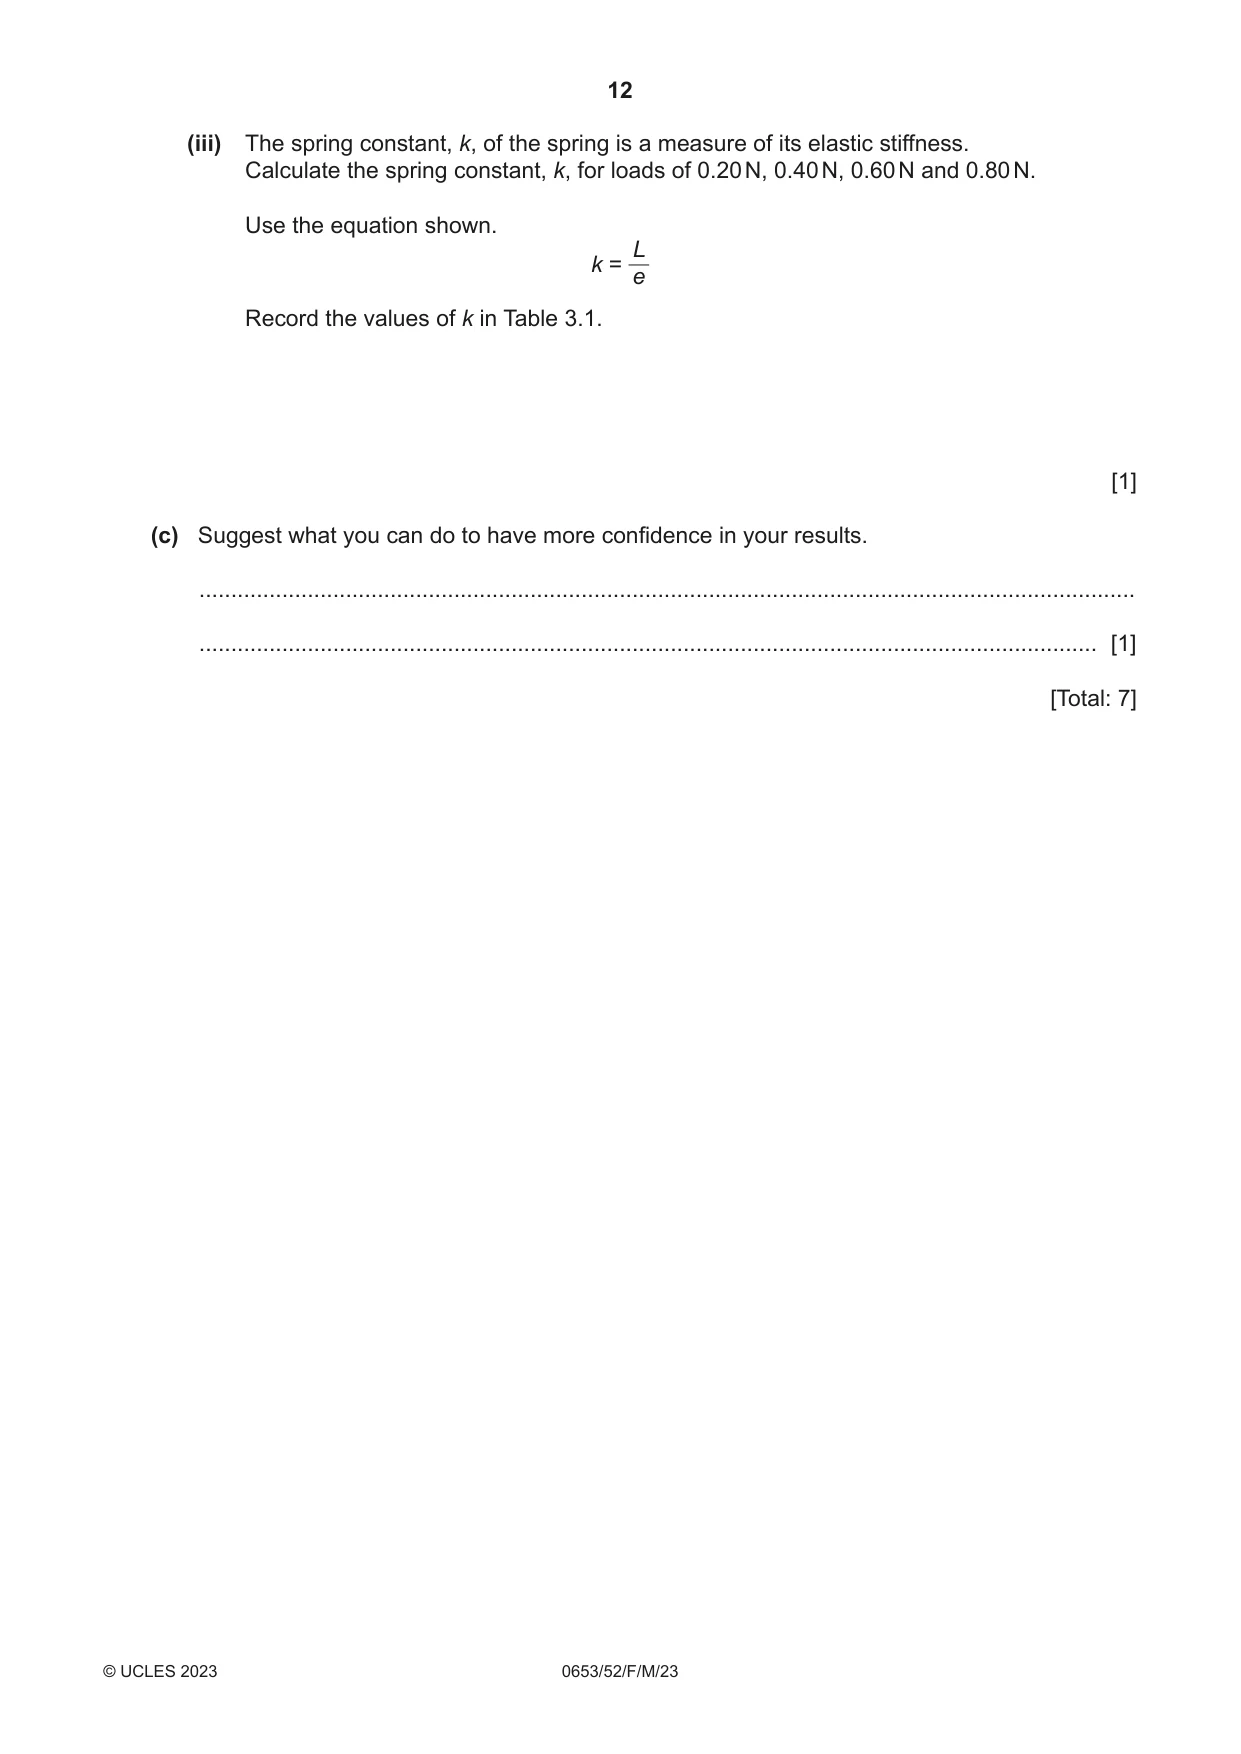
3 In this experiment you will measure the extension of a spring as different loads are suspended from the spring. Your equipment is already assembled as shown in Fig. 3.1. Do not change the position of the metre rule during the experiment. 0 cm mark clamp boss top of spring bottom of spring clamp metre rule stand bench 100 cm mark Fig. 3.1 (a) (i) Record the reading on the ruler at the top of the spring and at the bottom of the spring. Do not include the loops at each end of the spring in your measurement. top of spring ........................................................ mm bottom of spring ........................................................ mm [1] (ii) Calculate the length of the unstretched spring in mm. This is l0. Record l0 in Table 3.1. Table 3.1 L l e k / N / mm / mm / N per mm 0.00 0 – l0 = ....................... 0.20 0.40 0.60 0.80 [1] (b) (i) Suspend a load of 0.20 N from the spring and record the new length of the spring, l , in Table 3.1. Calculate the extension, e, of the spring. Use the equation shown. e = l – l0. Record the value of e in Table 3.1. [1] (ii) Repeat (b)(i) using loads of 0.40 N, 0.60 N and 0.80 N. Record the values for l and e in Table 3.1. [2] (iii) The spring constant, k, of the spring is a measure of its elastic stiffness. Calculate the spring constant, k, for loads of 0.20 N, 0.40 N, 0.60 N and 0.80 N. Use the equation shown. L k = e Record the values of k in Table 3.1. [1] (c) Suggest what you can do to have more confidence in your results. ................................................................................................................................................... ............................................................................................................................................. [1] [Total: 7]
Mark scheme: 3(a)(i) top of spring < bottom of spring, both in mm ; 1 3(a)(ii) correct calculation of l0 ; 1 3(b)(i) l > l0 and e > 0 ; 1 3(b)(ii) l increasing with L ; 2 e calculated correctly for last three loads ; 3(b)(iii) correct calculations for k ; 1 3(c) measure as load is both added and removed, to check that l is the same / check spring has not stretched / repeat the 1 measurement and see if it is the, same / similar / close to original ;
Q4 · Plan an investigation to find out how much electrical energy is required to increase the…
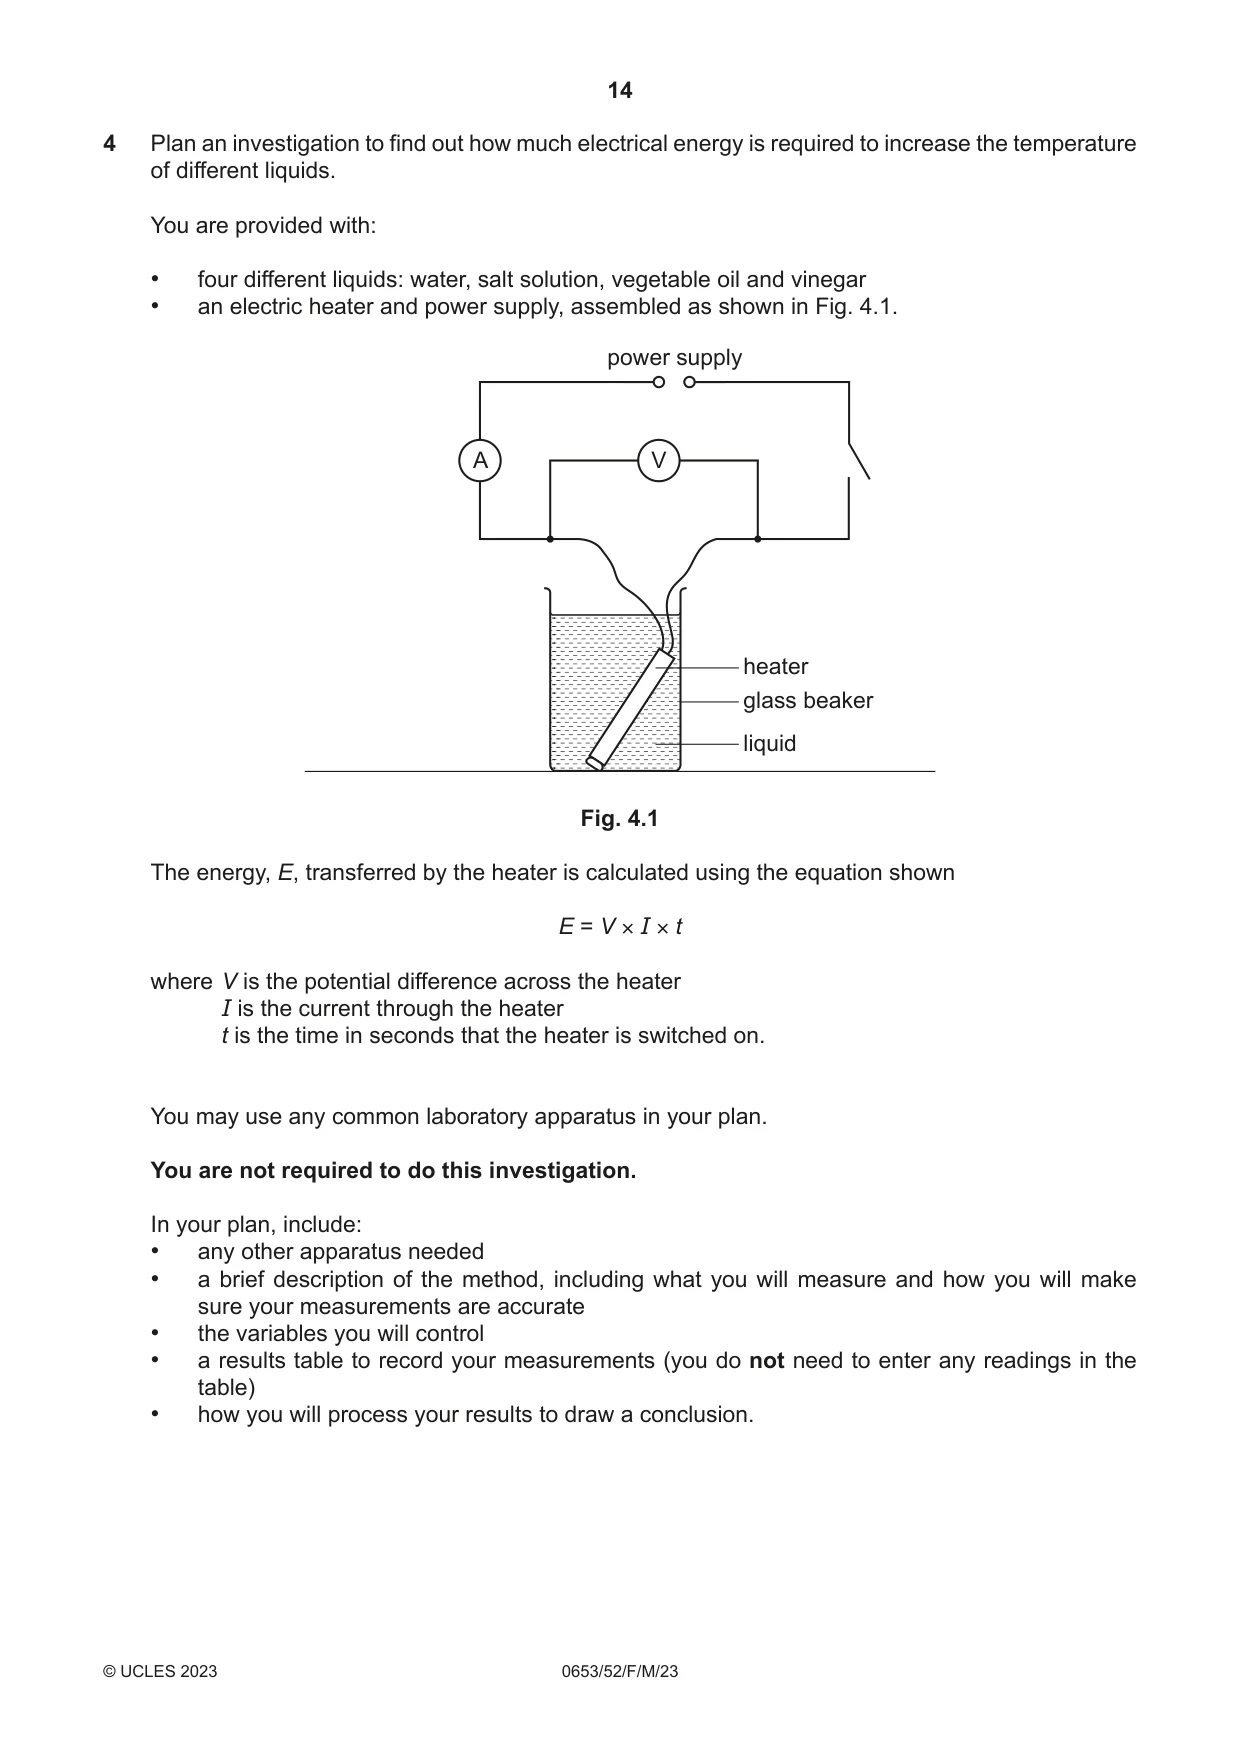
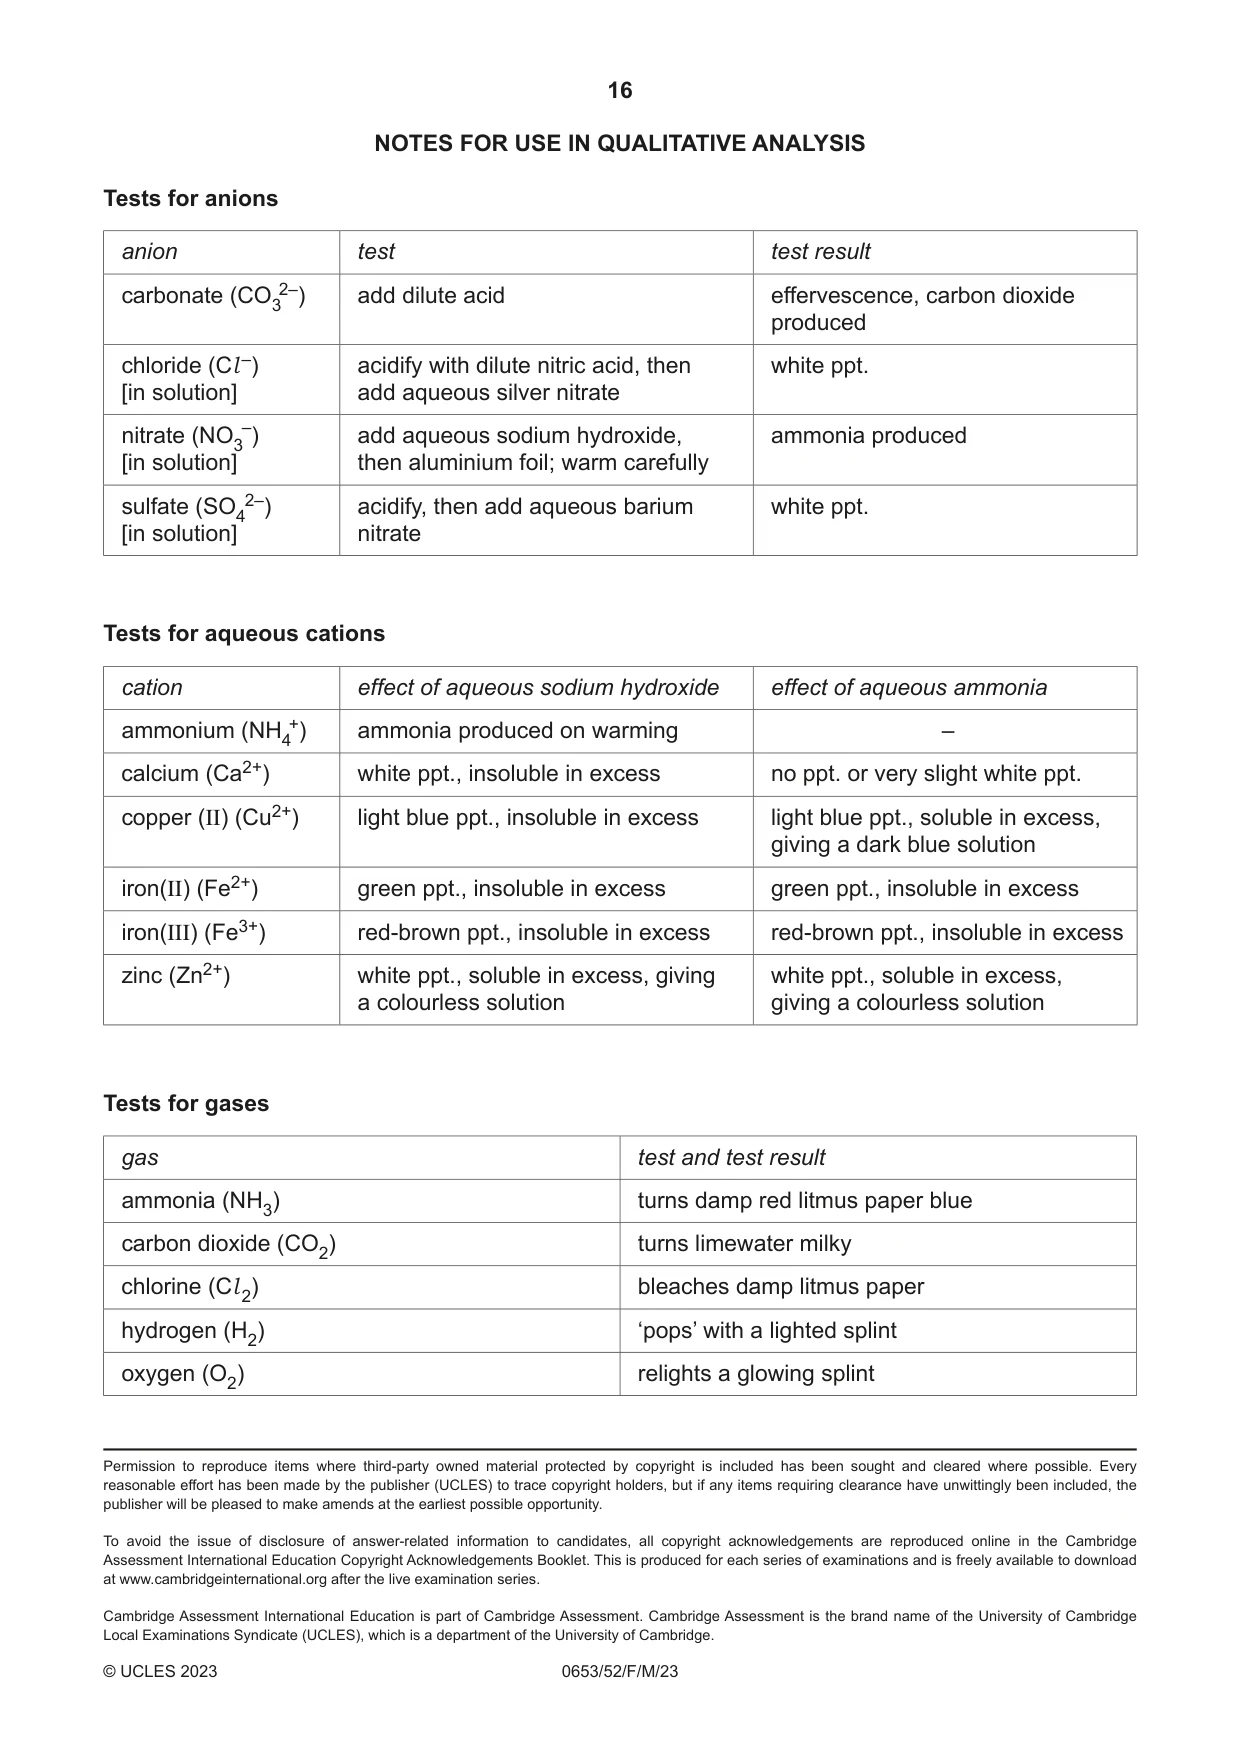
4 Plan an investigation to find out how much electrical energy is required to increase the temperature of different liquids. You are provided with: • four different liquids: water, salt solution, vegetable oil and vinegar • an electric heater and power supply, assembled as shown in Fig. 4.1. power supply A V heater glass beaker liquid Fig. 4.1 The energy, E, transferred by the heater is calculated using the equation shown E = V × I × t where V is the potential difference across the heater I is the current through the heater t is the time in seconds that the heater is switched on. You may use any common laboratory apparatus in your plan. You are not required to do this investigation. In your plan, include: • any other apparatus needed • a brief description of the method, including what you will measure and how you will make sure your measurements are accurate • the variables you will control • a results table to record your measurements (you do not need to enter any readings in the table) • how you will process your results to draw a conclusion. .......................................................................................................................................................... .......................................................................................................................................................... .......................................................................................................................................................... .......................................................................................................................................................... .......................................................................................................................................................... .......................................................................................................................................................... .......................................................................................................................................................... .......................................................................................................................................................... .......................................................................................................................................................... .......................................................................................................................................................... .......................................................................................................................................................... .......................................................................................................................................................... .......................................................................................................................................................... .................................................................................................................................................... [7] NOTES FOR USE IN QUALITATIVE ANALYSIS Tests for anions anion test test result carbonate (CO32–) add dilute acid effervescence, carbon dioxide produced chloride (Cl –) acidify with dilute nitric acid, then white ppt. [in solution] add aqueous silver nitrate nitrate (NO3–) add aqueous sodium hydroxide, ammonia produced [in solution] then aluminium foil; warm carefully sulfate (SO42–) acidify, then add aqueous barium white ppt. [in solution] nitrate Tests for aqueous cations cation effect of aqueous sodium hydroxide effect of aqueous ammonia ammonium (NH4+) ammonia produced on warming – calcium (Ca2+) white ppt., insoluble in excess no ppt. or very slight white ppt. copper (II) (Cu2+) light blue ppt., insoluble in excess light blue ppt., soluble in excess, giving a dark blue solution iron(II) (Fe2+) green ppt., insoluble in excess green ppt., insoluble in excess iron(III) (Fe3+) red-brown ppt., insoluble in excess red-brown ppt., insoluble in excess zinc (Zn2+) white ppt., soluble in excess, giving white ppt., soluble in excess, a colourless solution giving a colourless solution Tests for gases gas test and test result ammonia (NH3) turns damp red litmus paper blue carbon dioxide (CO2) turns limewater milky chlorine (Cl 2) bleaches damp litmus paper hydrogen (H2) ‘pops’ with a lighted splint oxygen (O2) relights a glowing splint
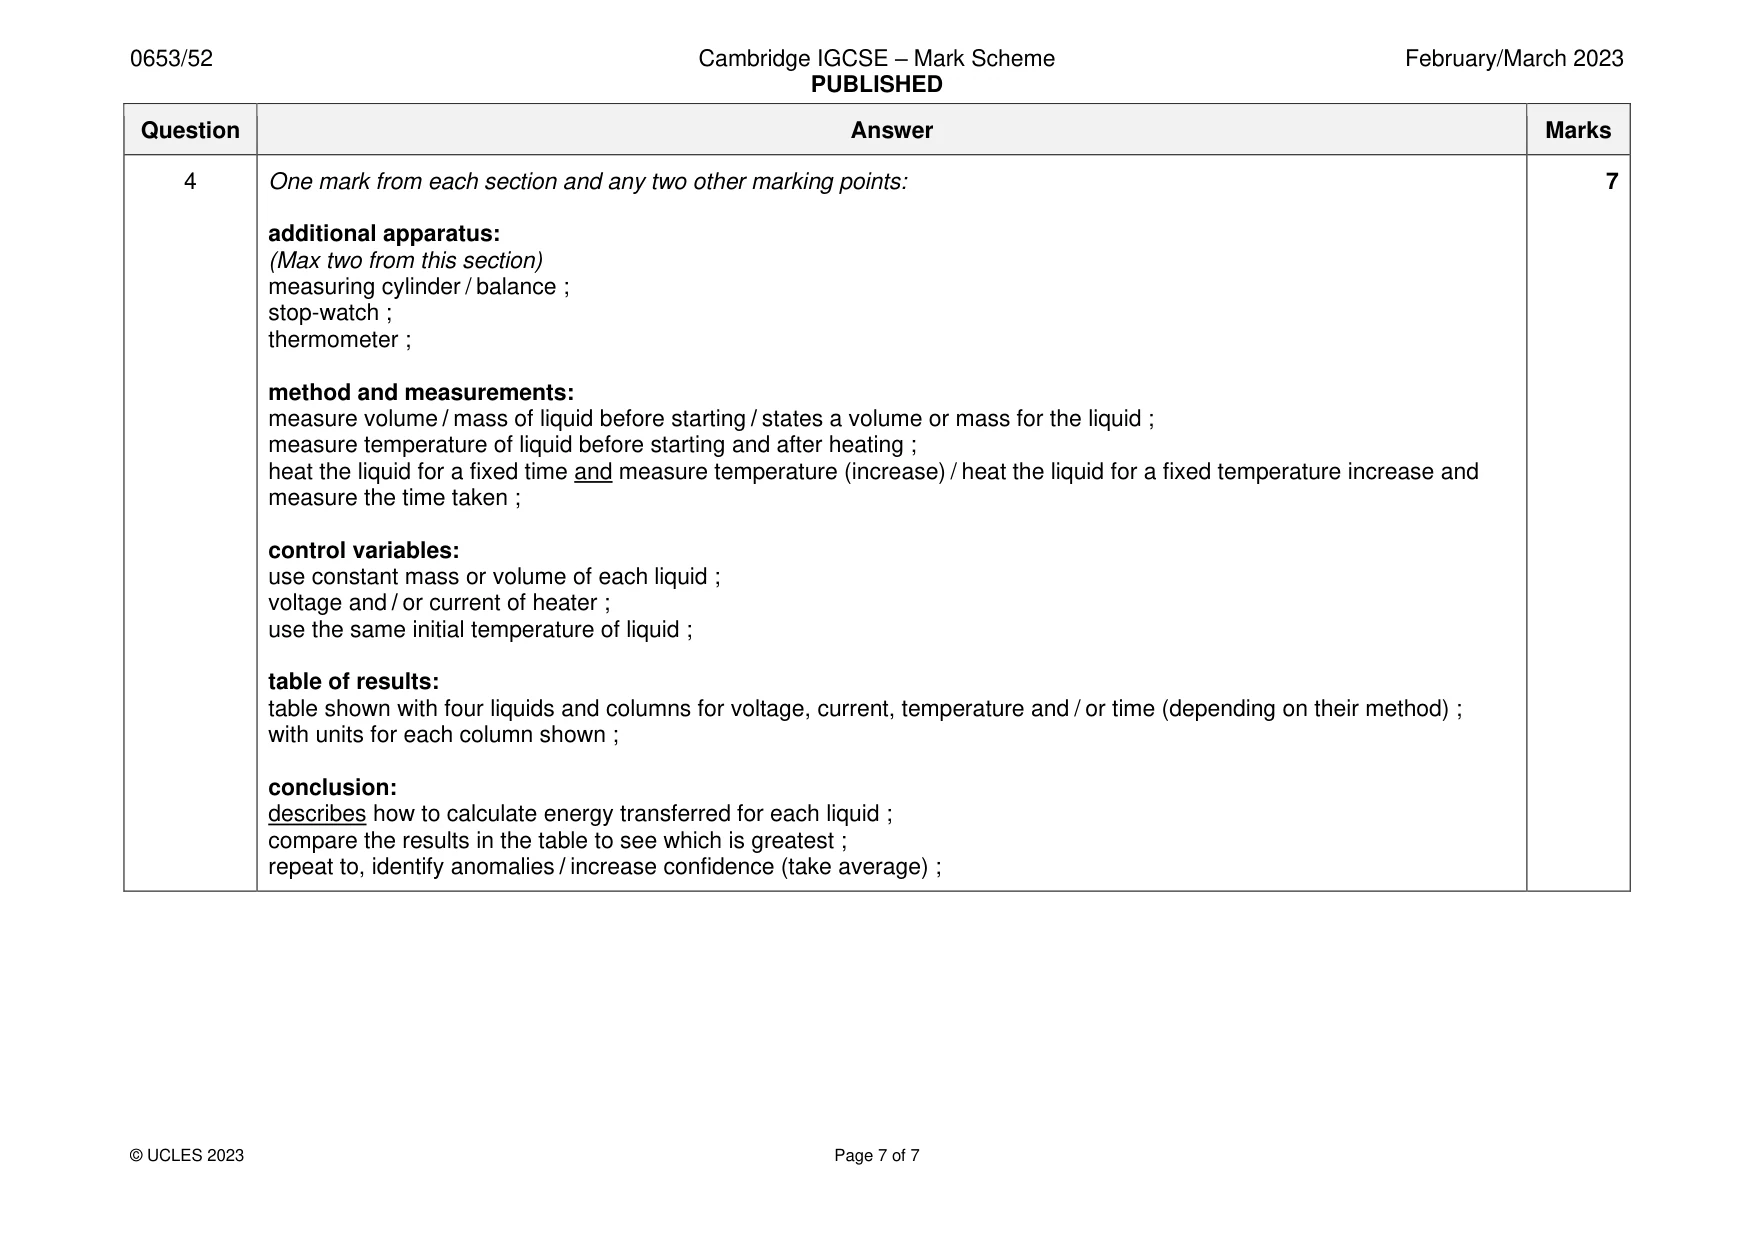
Mark scheme: 4 One mark from each section and any two other marking points: 7 additional apparatus: (Max two from this section) measuring cylinder / balance ; stop-watch ; thermometer ; method and measurements: measure volume / mass of liquid before starting / states a volume or mass for the liquid ; measure temperature of liquid before starting and after heating ; heat the liquid for a fixed time and measure temperature (increase) / heat the liquid for a fixed temperature increase and measure the time taken ; control variables: use constant mass or volume of each liquid ; voltage and / or current of heater ; use the same initial temperature of liquid ; table of results: table shown with four liquids and columns for voltage, current, temperature and / or time (depending on their method) ; with units for each column shown ; conclusion: describes how to calculate energy transferred for each liquid ; compare the results in the table to see which is greatest ; repeat to, identify anomalies / increase confidence (take average) ;
What was in this paper
The subtopics covered by these 4 questions, and how many questions each got. Open one in a new tab to see every Cambridge question on it.
What you needed in this session
Cambridge’s own grade thresholds for 2023 Feb/March, Paper 5 · Variant 2. A higher threshold means an easier paper — the bar moves with how the cohort did.