Cambridge IGCSE Science - Combined 0653 — 2025 Oct/Nov Paper 5 · Variant 2
0653/52/O/N/25 · 4 questions · 40 marks · 75 min
The question paper and its mark scheme, free to read here and free to download. This is Cambridge’s own paper, exactly as it was sat.
Question paper16 pages



Mark scheme8 pages
Answers below. Sit the paper first if you are practising.
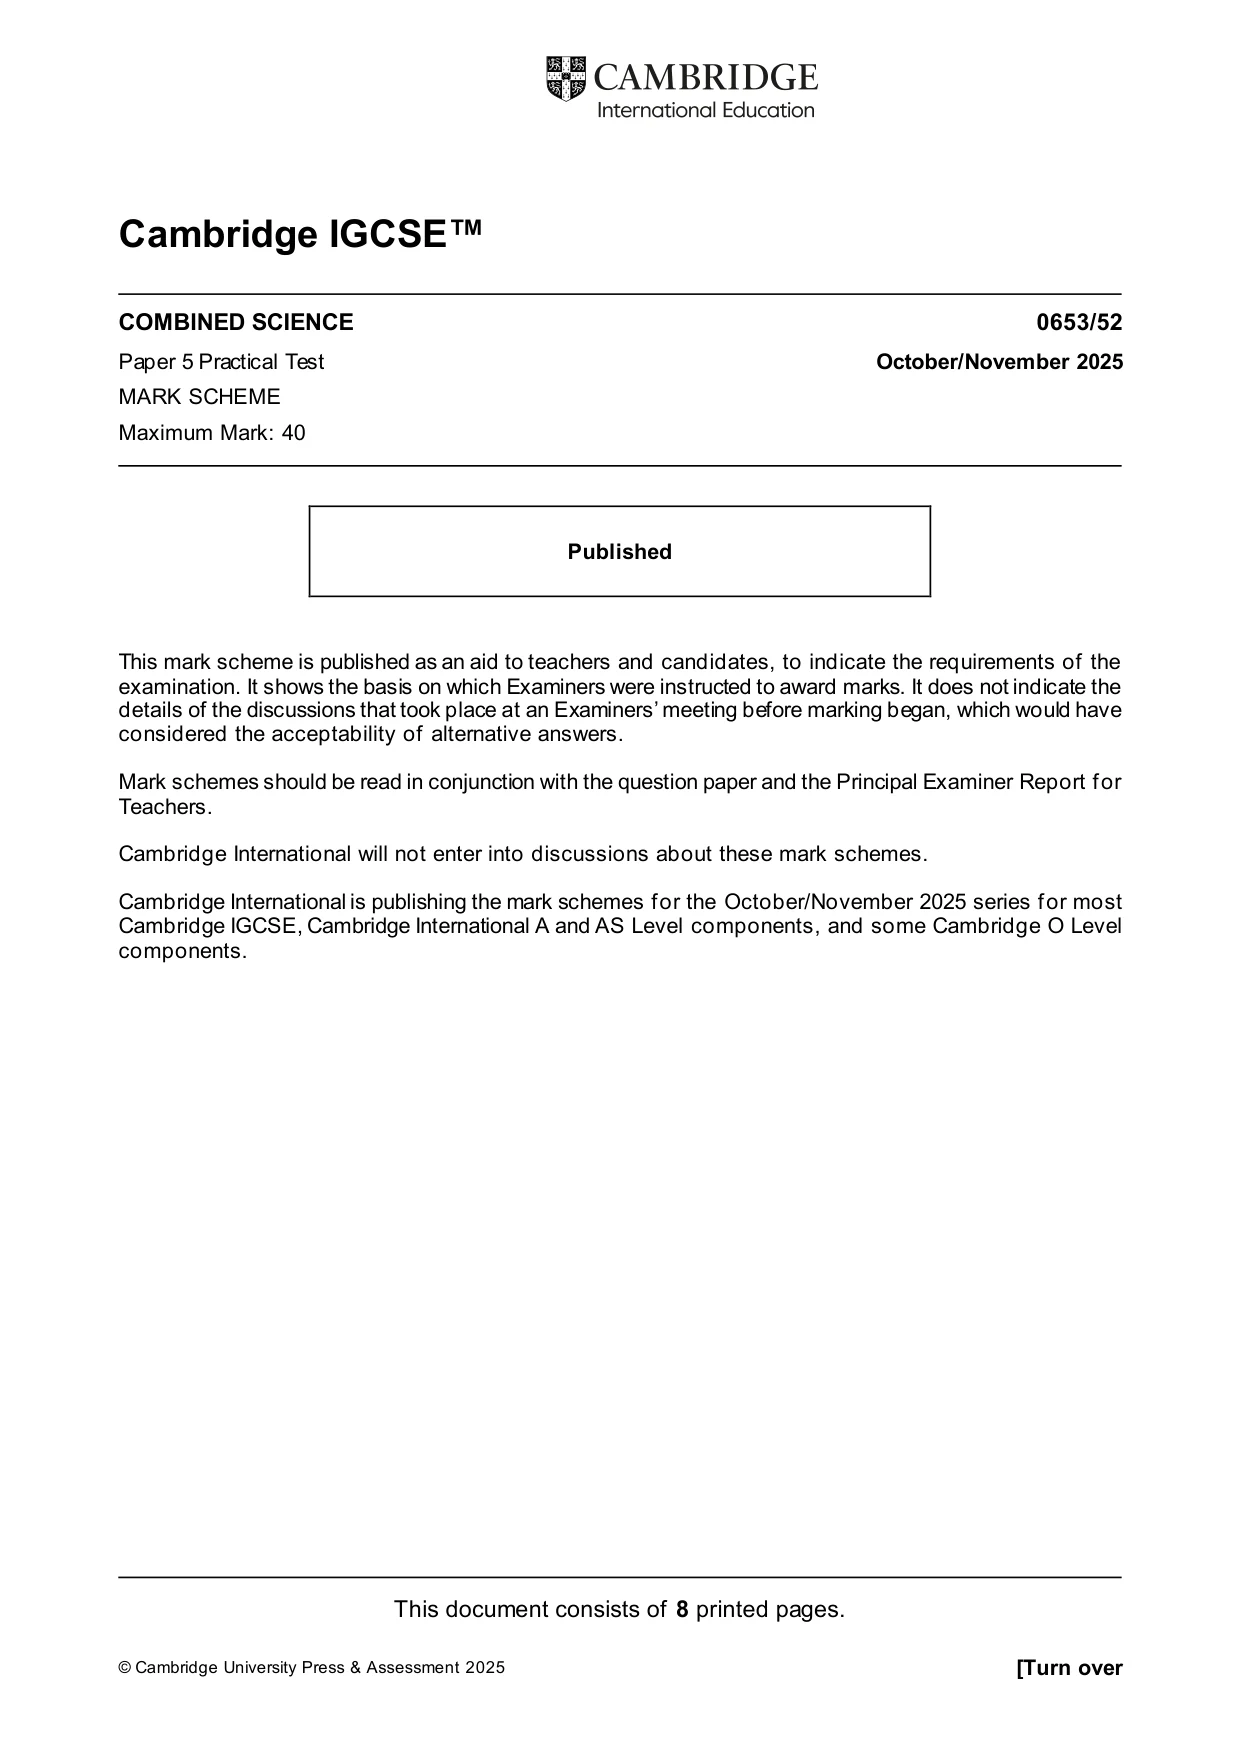
Questions as text
Q1 · You are going to investigate an enzyme-controlled reaction
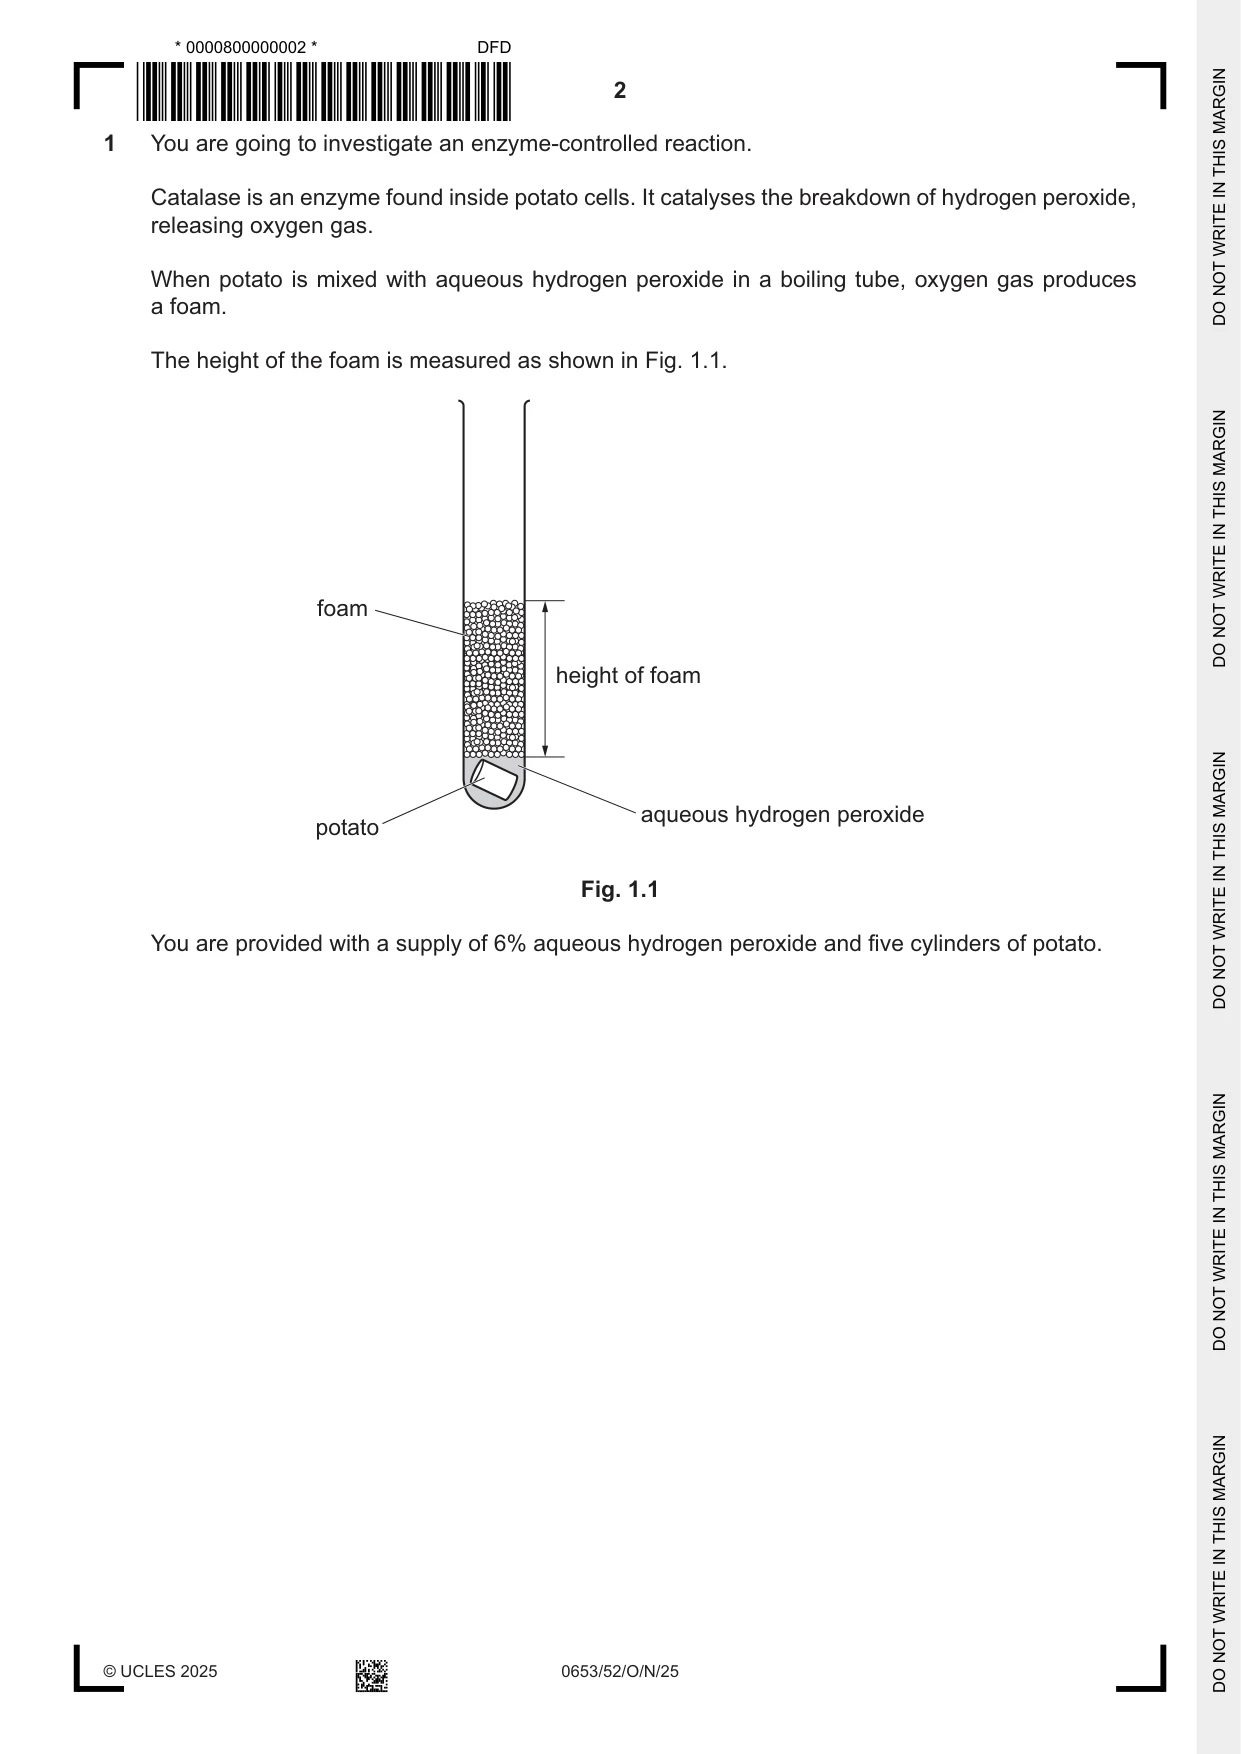
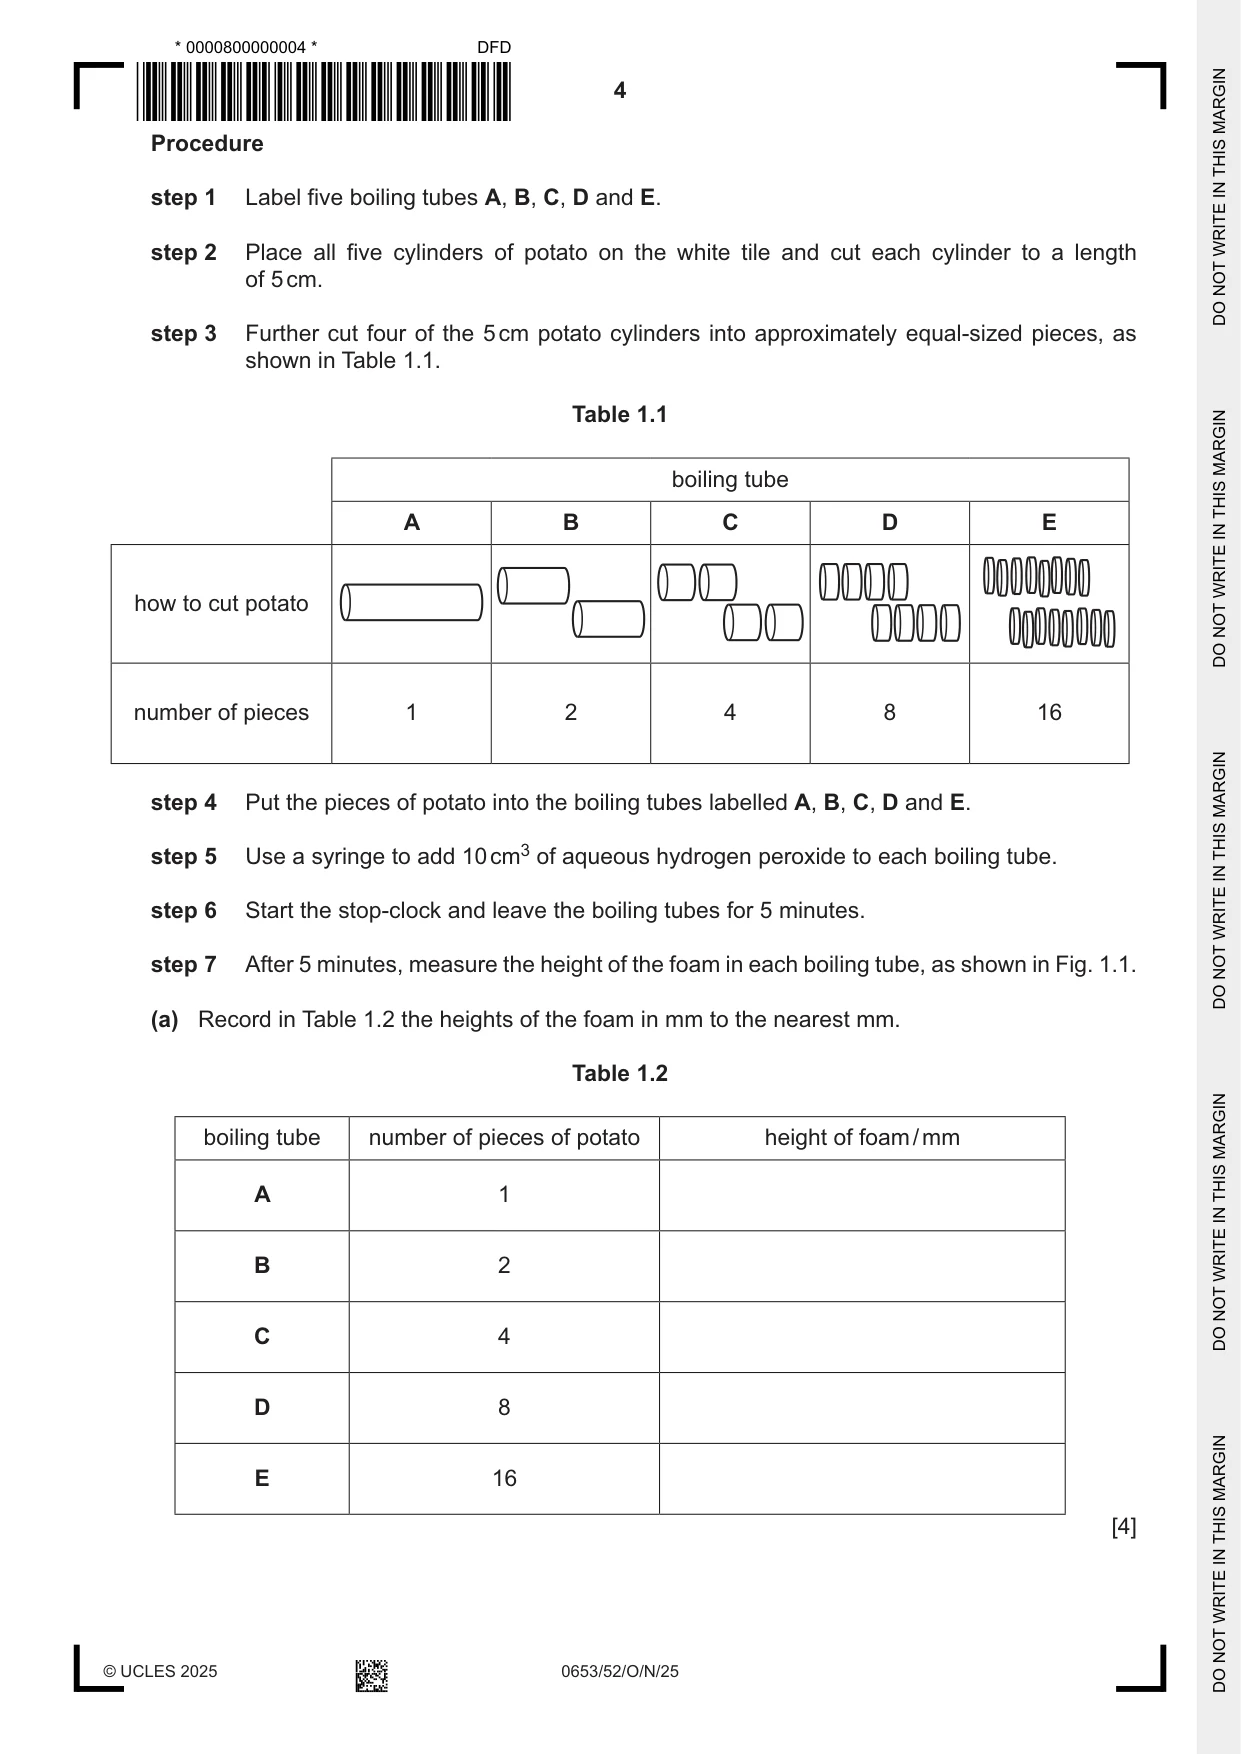
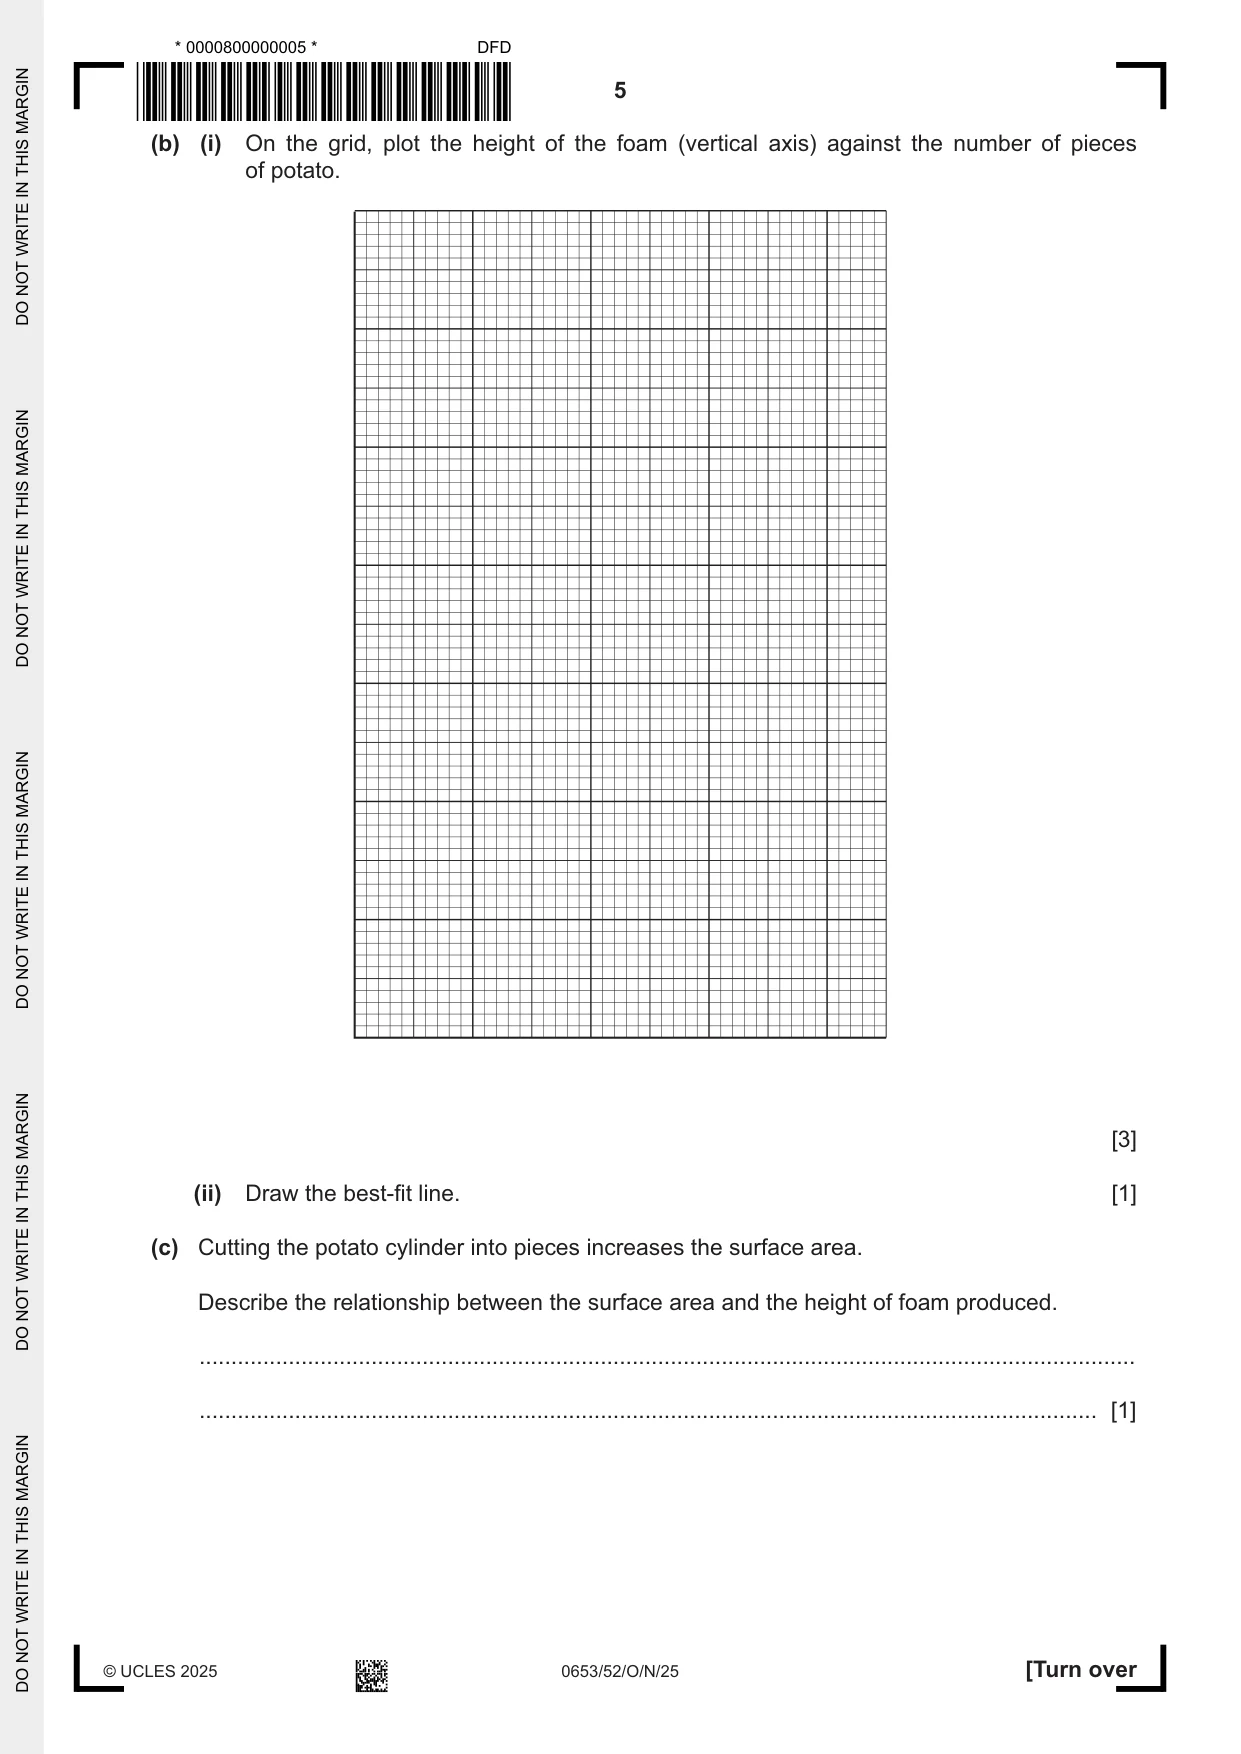
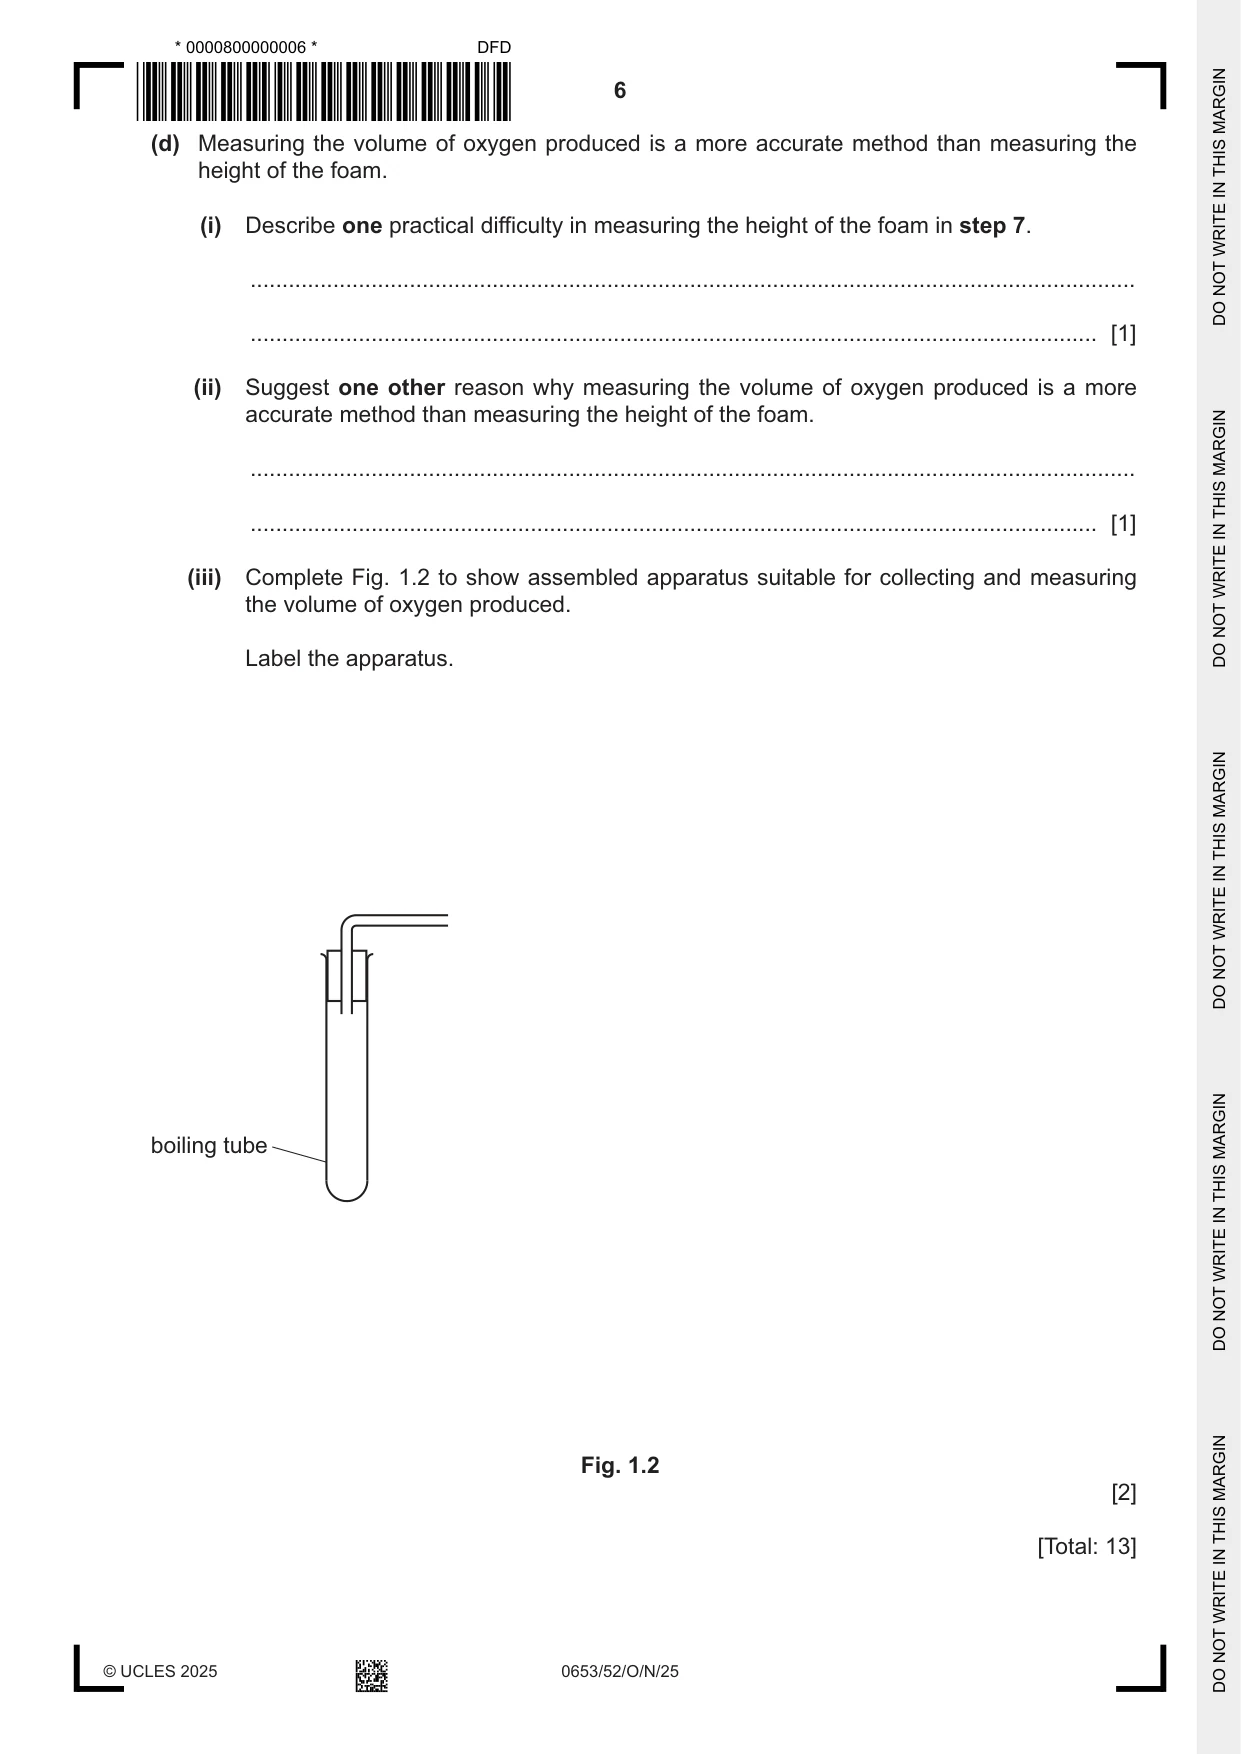
1 You are going to investigate an enzyme-controlled reaction. Catalase is an enzyme found inside potato cells. It catalyses the breakdown of hydrogen peroxide, releasing oxygen gas. When potato is mixed with aqueous hydrogen peroxide in a boiling tube, oxygen gas produces a foam. The height of the foam is measured as shown in Fig. 1.1. foam height of foam aqueous hydrogen peroxide potato Fig. 1.1 You are provided with a supply of 6% aqueous hydrogen peroxide and five cylinders of potato. Procedure step 1 Label five boiling tubes A, B, C, D and E. step 2 Place all five cylinders of potato on the white tile and cut each cylinder to a length of 5 cm. step 3 Further cut four of the 5 cm potato cylinders into approximately equal-sized pieces, as shown in Table 1.1. Table 1.1 boiling tube A B C D E how to cut potato number of pieces 1 2 4 8 16 step 4 Put the pieces of potato into the boiling tubes labelled A, B, C, D and E. step 5 Use a syringe to add 10 cm3 of aqueous hydrogen peroxide to each boiling tube. step 6 Start the stop-clock and leave the boiling tubes for 5 minutes. step 7 After 5 minutes, measure the height of the foam in each boiling tube, as shown in Fig. 1.1. (a) Record in Table 1.2 the heights of the foam in mm to the nearest mm. Table 1.2 boiling tube number of pieces of potato height of foam / mm A 1 B 2 C 4 D 8 E 16 [4] (b) (i) On the grid, plot the height of the foam (vertical axis) against the number of pieces of potato. [3] (ii) Draw the best-fit line. [1] (c) Cutting the potato cylinder into pieces increases the surface area. Describe the relationship between the surface area and the height of foam produced. ................................................................................................................................................... ............................................................................................................................................. [1] (d) Measuring the volume of oxygen produced is a more accurate method than measuring the height of the foam. (i) Describe one practical difficulty in measuring the height of the foam in step 7. ........................................................................................................................................... ..................................................................................................................................... [1] (ii) Suggest one other reason why measuring the volume of oxygen produced is a more accurate method than measuring the height of the foam. ........................................................................................................................................... ..................................................................................................................................... [1] (iii) Complete Fig. 1.2 to show assembled apparatus suitable for collecting and measuring the volume of oxygen produced. Label the apparatus. boiling tube Fig. 1.2 [2] [Total: 13]
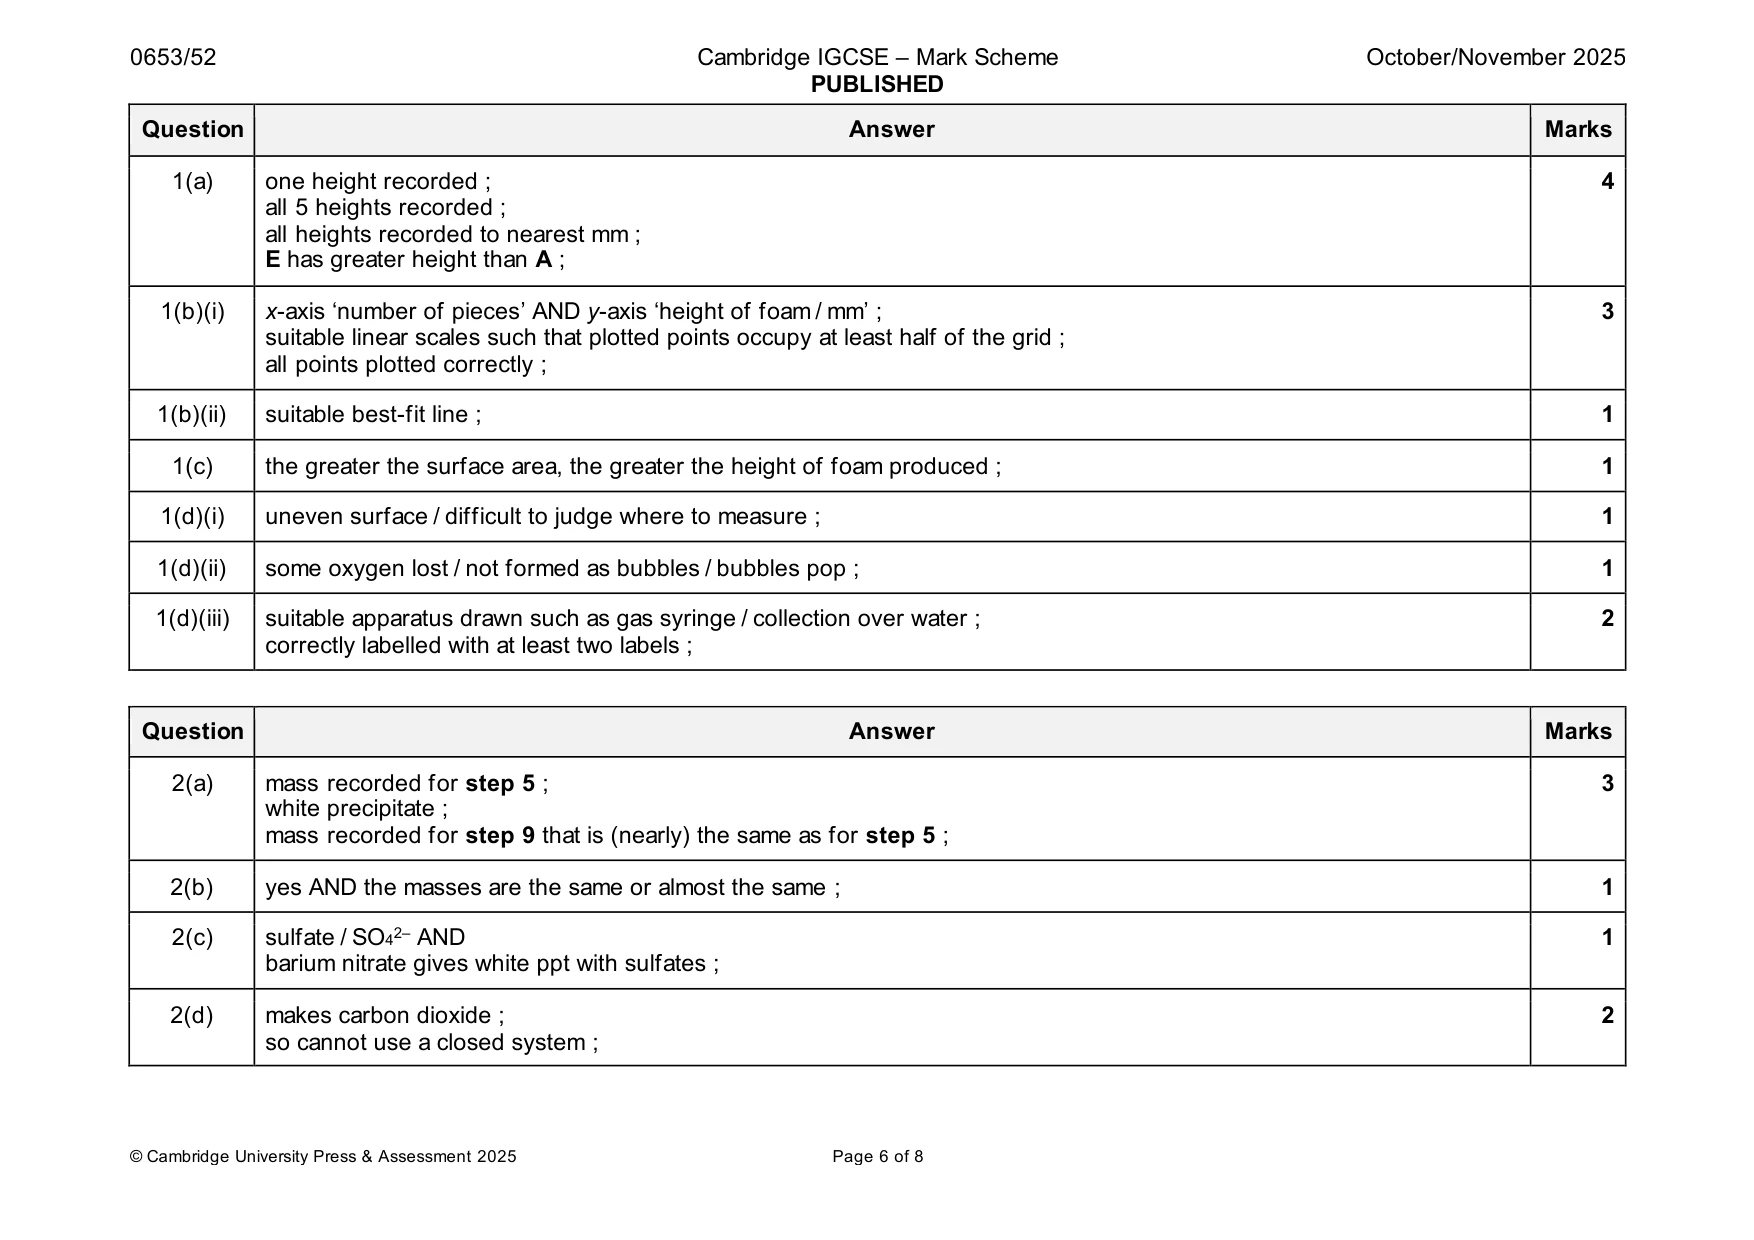
Mark scheme: Question Answer Marks 1(a) one height recorded ; 4 all 5 heights recorded ; all heights recorded to nearest mm ; E has greater height than A ; 1(b)(i) x-axis ‘number of pieces’ AND y-axis ‘height of foam / mm’ ; 3 suitable linear scales such that plotted points occupy at least half of the grid ; all points plotted correctly ; 1(b)(ii) suitable best-fit line ; 1 1(c) the greater the surface area, the greater the height of foam produced ; 1 1(d)(i) uneven surface / difficult to judge where to measure ; 1 1(d)(ii) some oxygen lost / not formed as bubbles / bubbles pop ; 1 1(d)(iii) suitable apparatus drawn such as gas syringe / collection over water ; 2 correctly labelled with at least two labels ;
Q2 · You are going to investigate the chemical reaction between aqueous barium nitrate and…
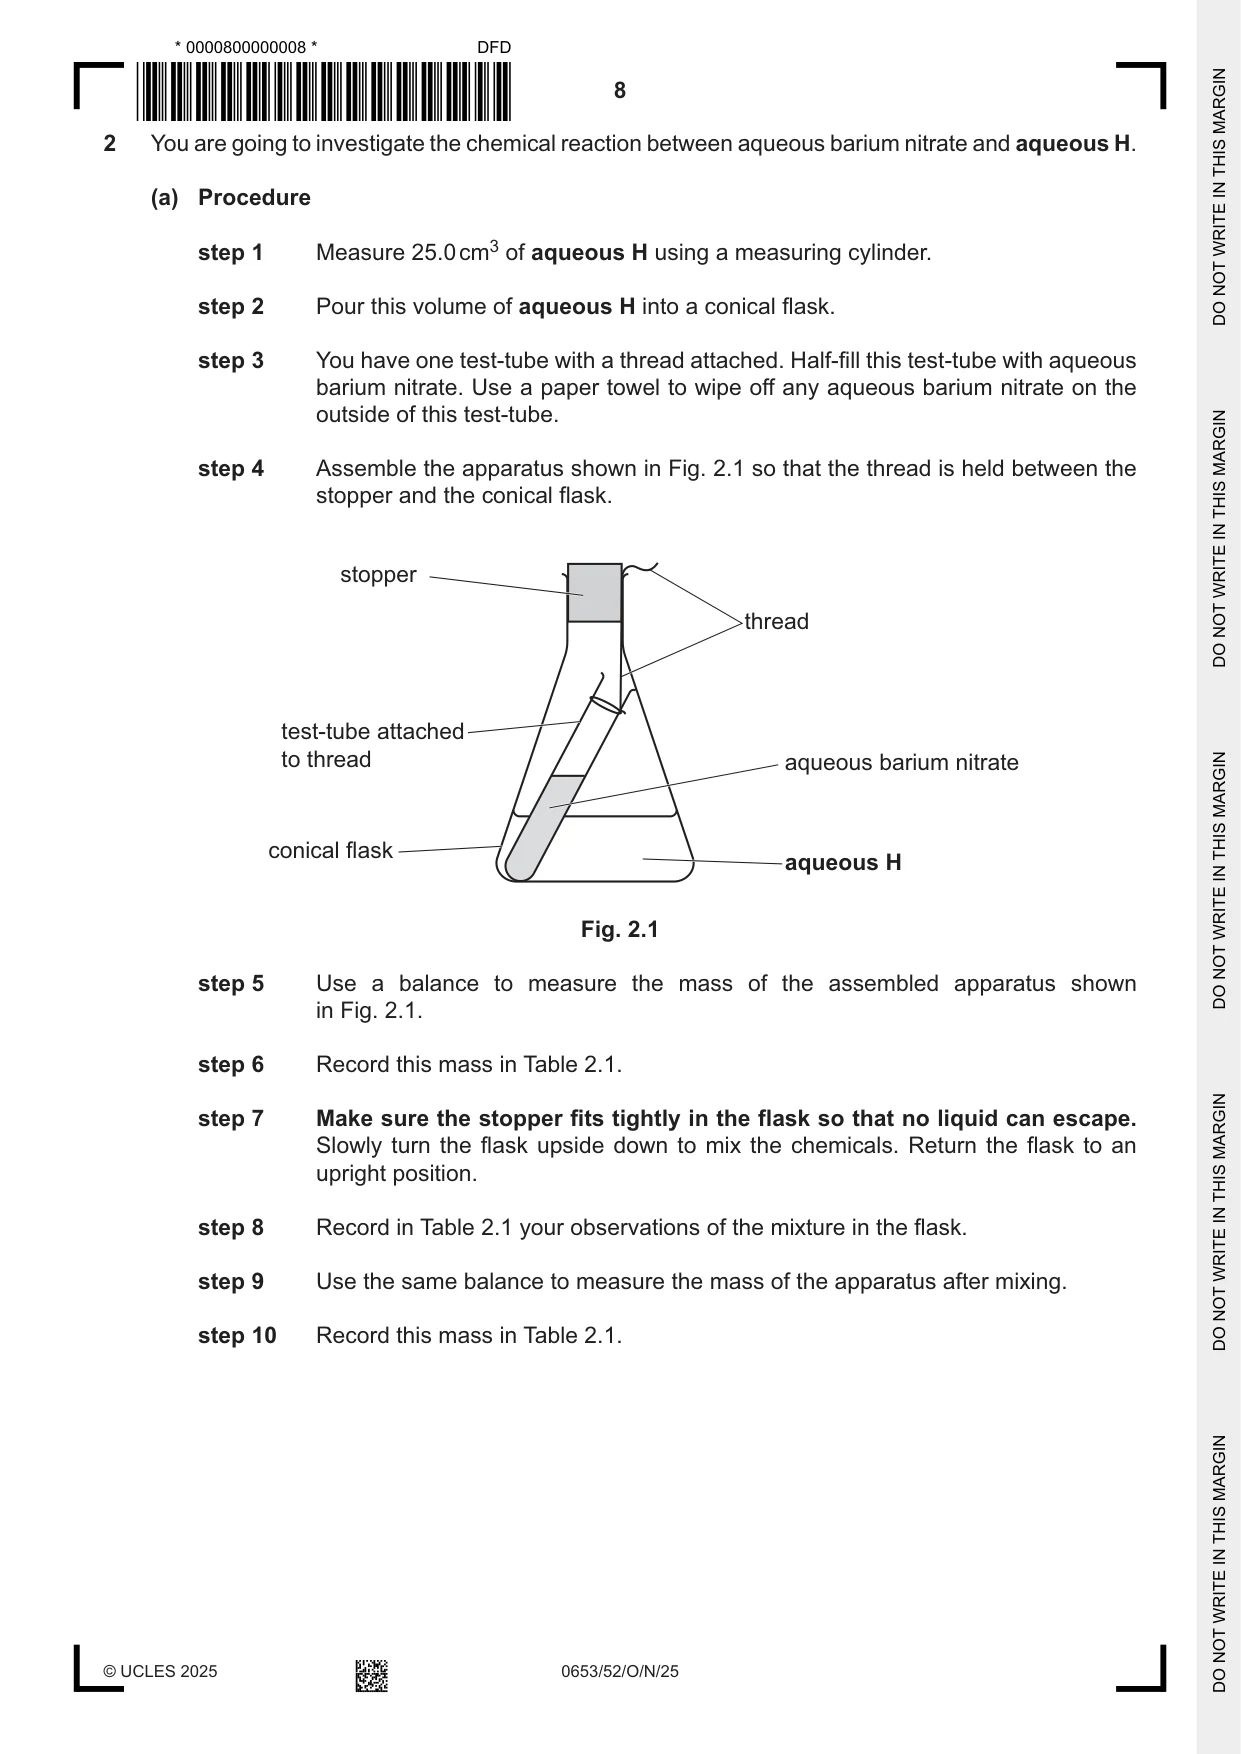
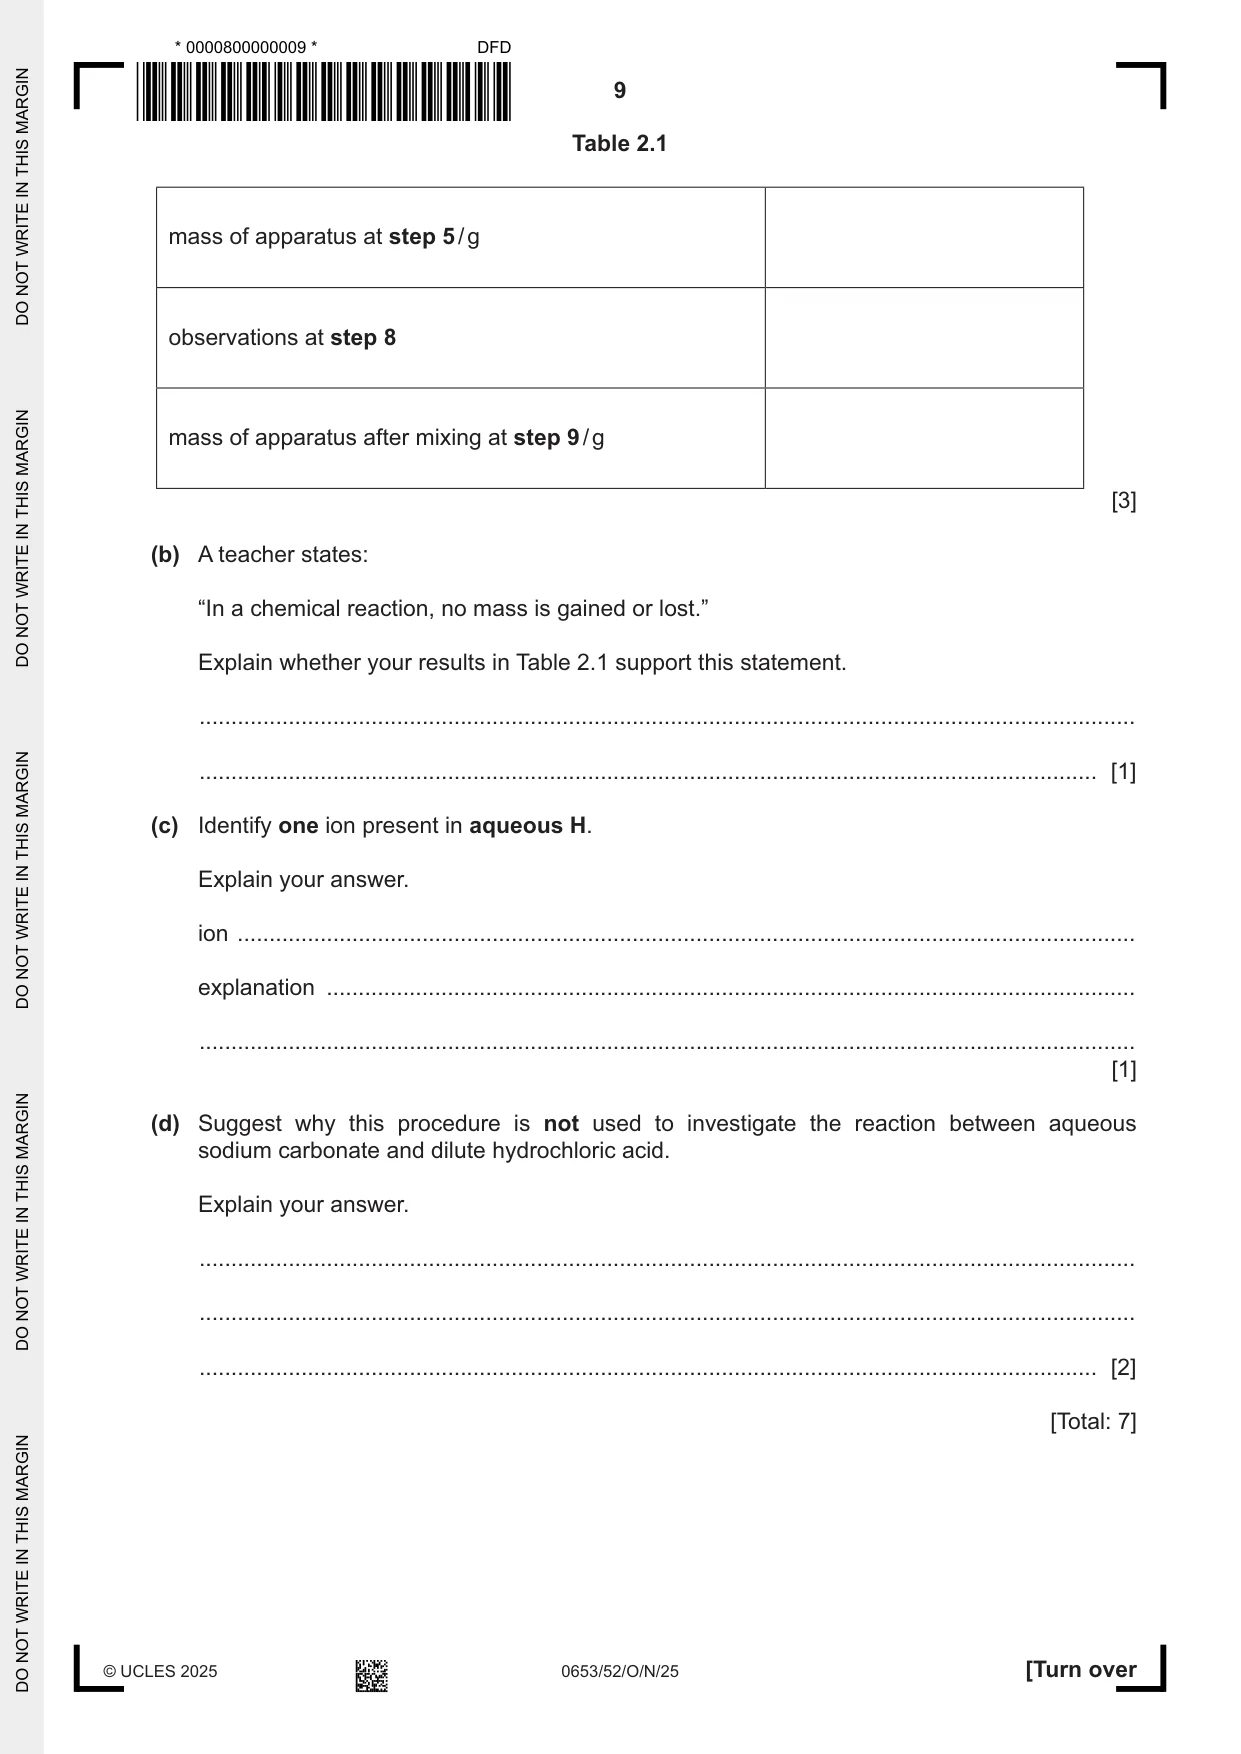
2 You are going to investigate the chemical reaction between aqueous barium nitrate and aqueous H. (a) Procedure step 1 Measure 25.0 cm3 of aqueous H using a measuring cylinder. step 2 Pour this volume of aqueous H into a conical flask. step 3 You have one test-tube with a thread attached. Half-fill this test-tube with aqueous barium nitrate. Use a paper towel to wipe off any aqueous barium nitrate on the outside of this test-tube. step 4 Assemble the apparatus shown in Fig. 2.1 so that the thread is held between the stopper and the conical flask. stopper thread test-tube attached to thread aqueous barium nitrate conical flask aqueous H Fig. 2.1 step 5 Use a balance to measure the mass of the assembled apparatus shown in Fig. 2.1. step 6 Record this mass in Table 2.1. step 7 Make sure the stopper fits tightly in the flask so that no liquid can escape. Slowly turn the flask upside down to mix the chemicals. Return the flask to an upright position. step 8 Record in Table 2.1 your observations of the mixture in the flask. step 9 Use the same balance to measure the mass of the apparatus after mixing. step 10 Record this mass in Table 2.1. Table 2.1 mass of apparatus at step 5 / g observations at step 8 mass of apparatus after mixing at step 9 / g [3] (b) A teacher states: “In a chemical reaction, no mass is gained or lost.” Explain whether your results in Table 2.1 support this statement. ................................................................................................................................................... ............................................................................................................................................. [1] (c) Identify one ion present in aqueous H. Explain your answer. ion ............................................................................................................................................. explanation ............................................................................................................................... ................................................................................................................................................... [1] (d) Suggest why this procedure is not used to investigate the reaction between aqueous sodium carbonate and dilute hydrochloric acid. Explain your answer. ................................................................................................................................................... ................................................................................................................................................... ............................................................................................................................................. [2] [Total: 7]
Mark scheme: 2(a) mass recorded for step 5 ; 3 white precipitate ; mass recorded for step 9 that is (nearly) the same as for step 5 ; 2(b) yes AND the masses are the same or almost the same ; 1 2(c) sulfate / SO42– AND 1 barium nitrate gives white ppt with sulfates ; 2(d) makes carbon dioxide ; 2 so cannot use a closed system ;
Q3 · Solid citric acid is added to aqueous sodium hydrogencarbonate
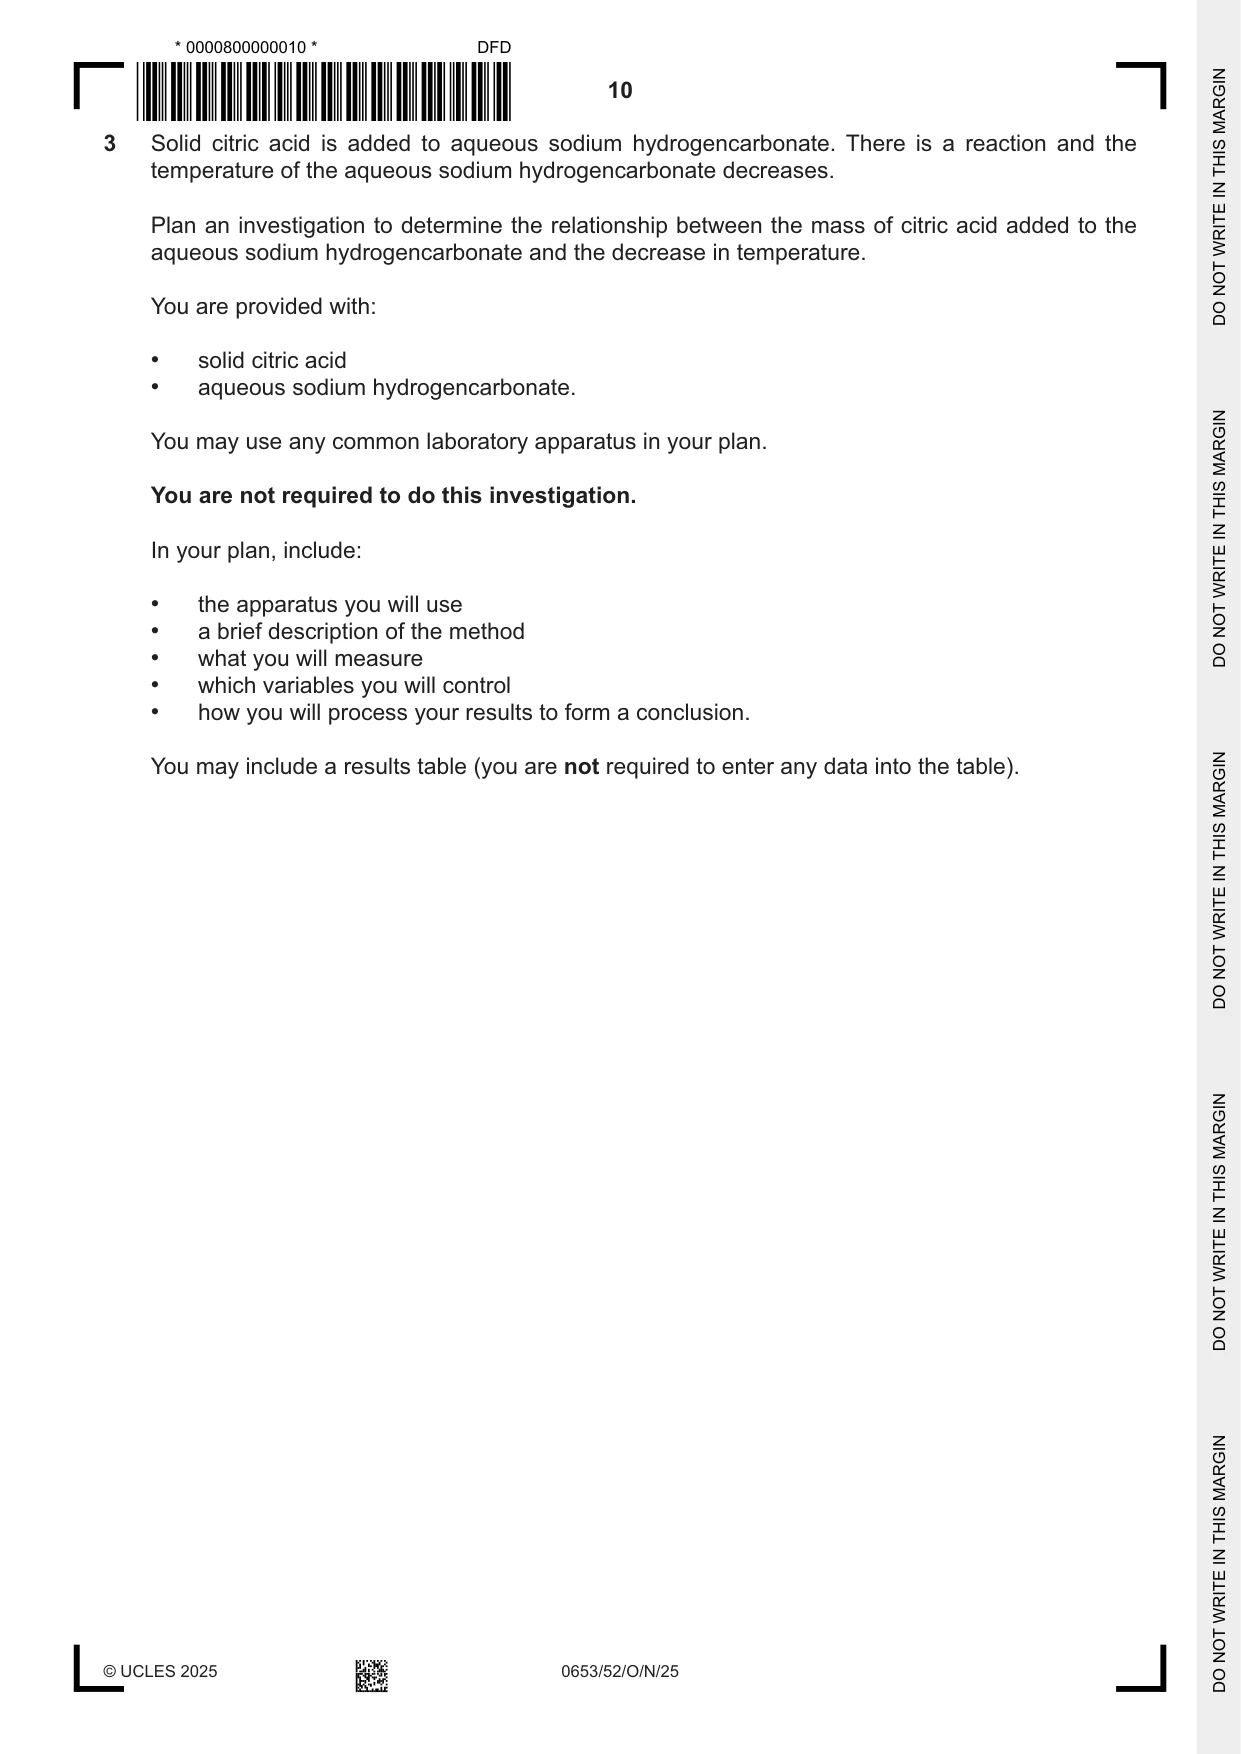
3 Solid citric acid is added to aqueous sodium hydrogencarbonate. There is a reaction and the temperature of the aqueous sodium hydrogencarbonate decreases. Plan an investigation to determine the relationship between the mass of citric acid added to the aqueous sodium hydrogencarbonate and the decrease in temperature. You are provided with: • solid citric acid • aqueous sodium hydrogencarbonate. You may use any common laboratory apparatus in your plan. You are not required to do this investigation. In your plan, include: • the apparatus you will use • a brief description of the method • what you will measure • which variables you will control • how you will process your results to form a conclusion. You may include a results table (you are not required to enter any data into the table). .......................................................................................................................................................... .......................................................................................................................................................... .......................................................................................................................................................... .......................................................................................................................................................... .......................................................................................................................................................... .......................................................................................................................................................... .......................................................................................................................................................... .......................................................................................................................................................... .......................................................................................................................................................... .......................................................................................................................................................... .......................................................................................................................................................... .......................................................................................................................................................... .......................................................................................................................................................... .......................................................................................................................................................... .......................................................................................................................................................... .......................................................................................................................................................... .......................................................................................................................................................... .......................................................................................................................................................... .......................................................................................................................................................... .......................................................................................................................................................... .................................................................................................................................................... [7]
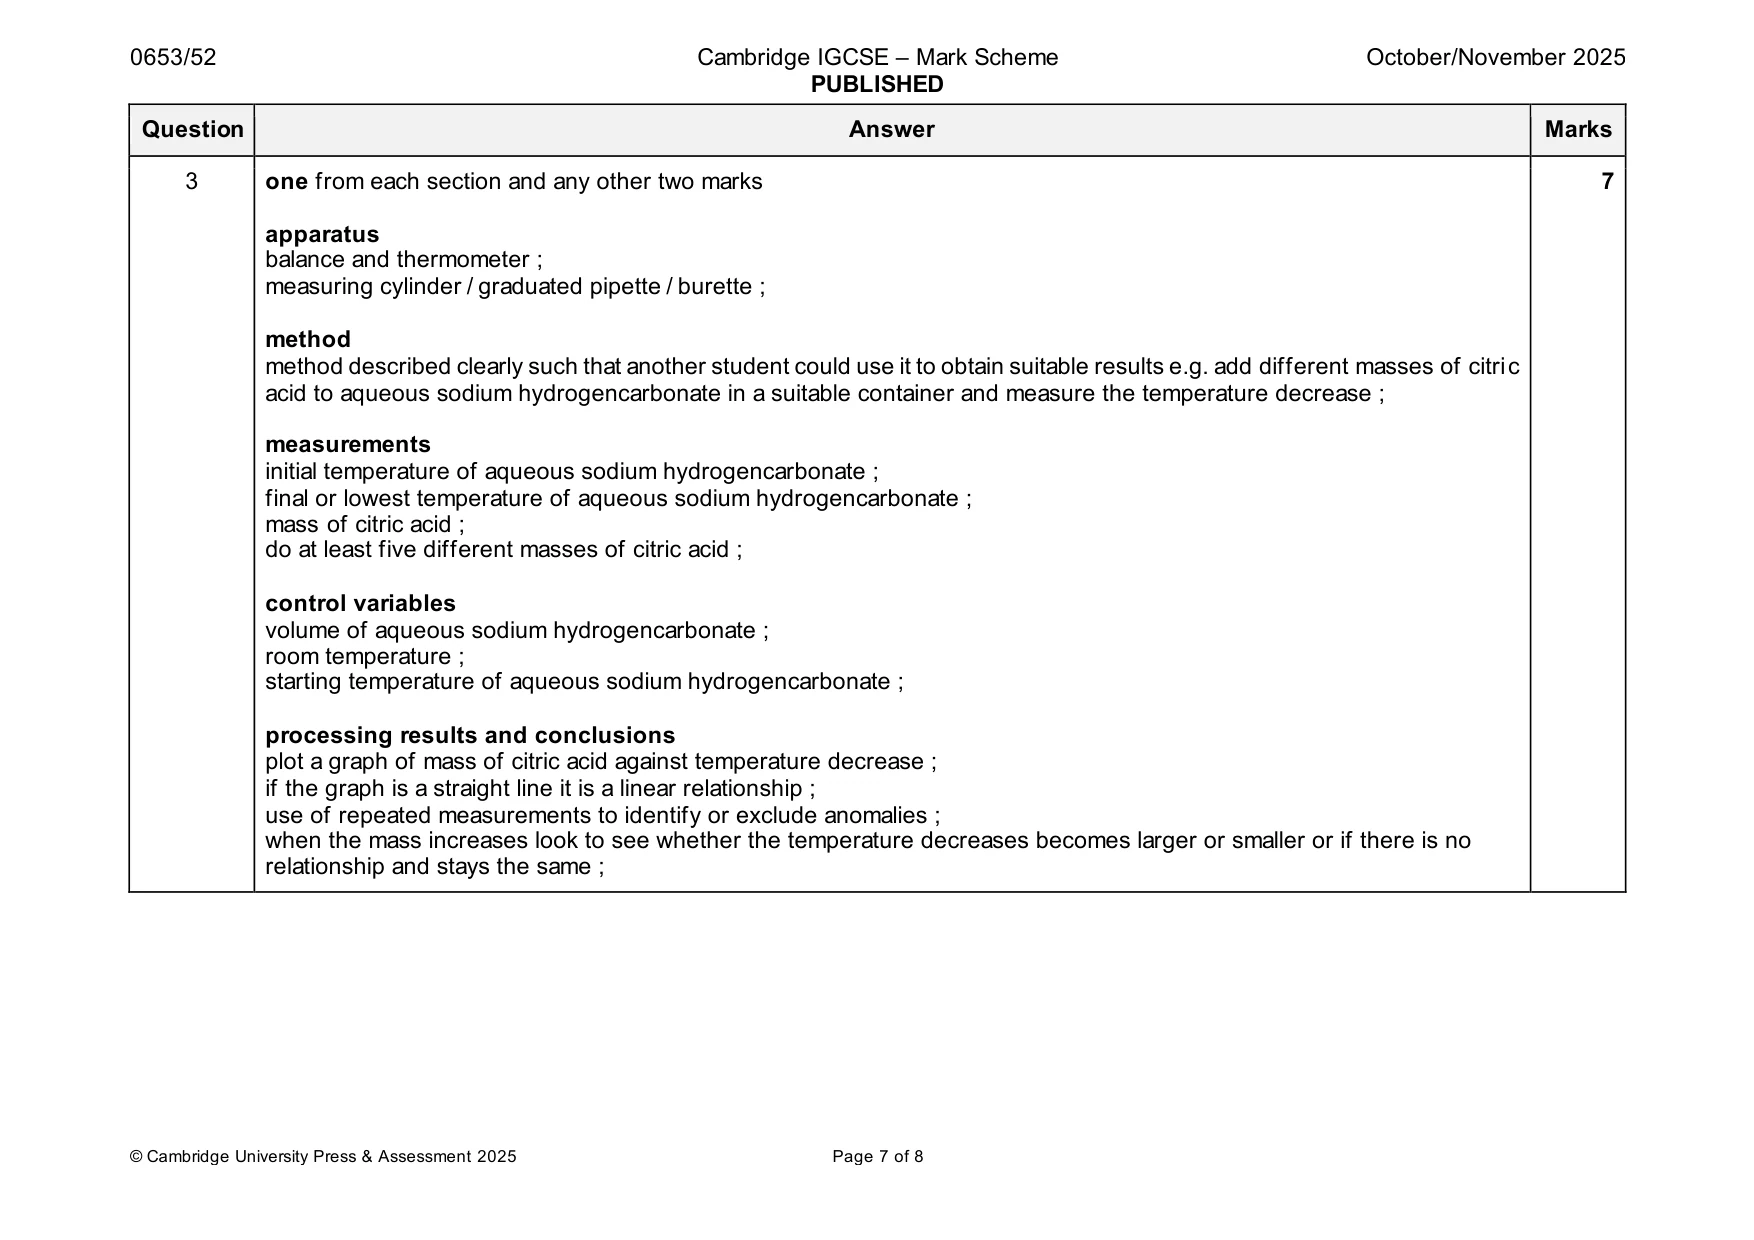
Mark scheme: 3 one from each section and any other two marks 7 apparatus balance and thermometer ; measuring cylinder / graduated pipette / burette ; method method described clearly such that another student could use it to obtain suitable results e.g. add different masses of citric acid to aqueous sodium hydrogencarbonate in a suitable container and measure the temperature decrease ; measurements initial temperature of aqueous sodium hydrogencarbonate ; final or lowest temperature of aqueous sodium hydrogencarbonate ; mass of citric acid ; do at least five different masses of citric acid ; control variables volume of aqueous sodium hydrogencarbonate ; room temperature ; starting temperature of aqueous sodium hydrogencarbonate ; processing results and conclusions plot a graph of mass of citric acid against temperature decrease ; if the graph is a straight line it is a linear relationship ; use of repeated measurements to identify or exclude anomalies ; when the mass increases look to see whether the temperature decreases becomes larger or smaller or if there is no relationship and stays the same ;
Q4 · You are going to use two methods to determine the resistance R of resistor W
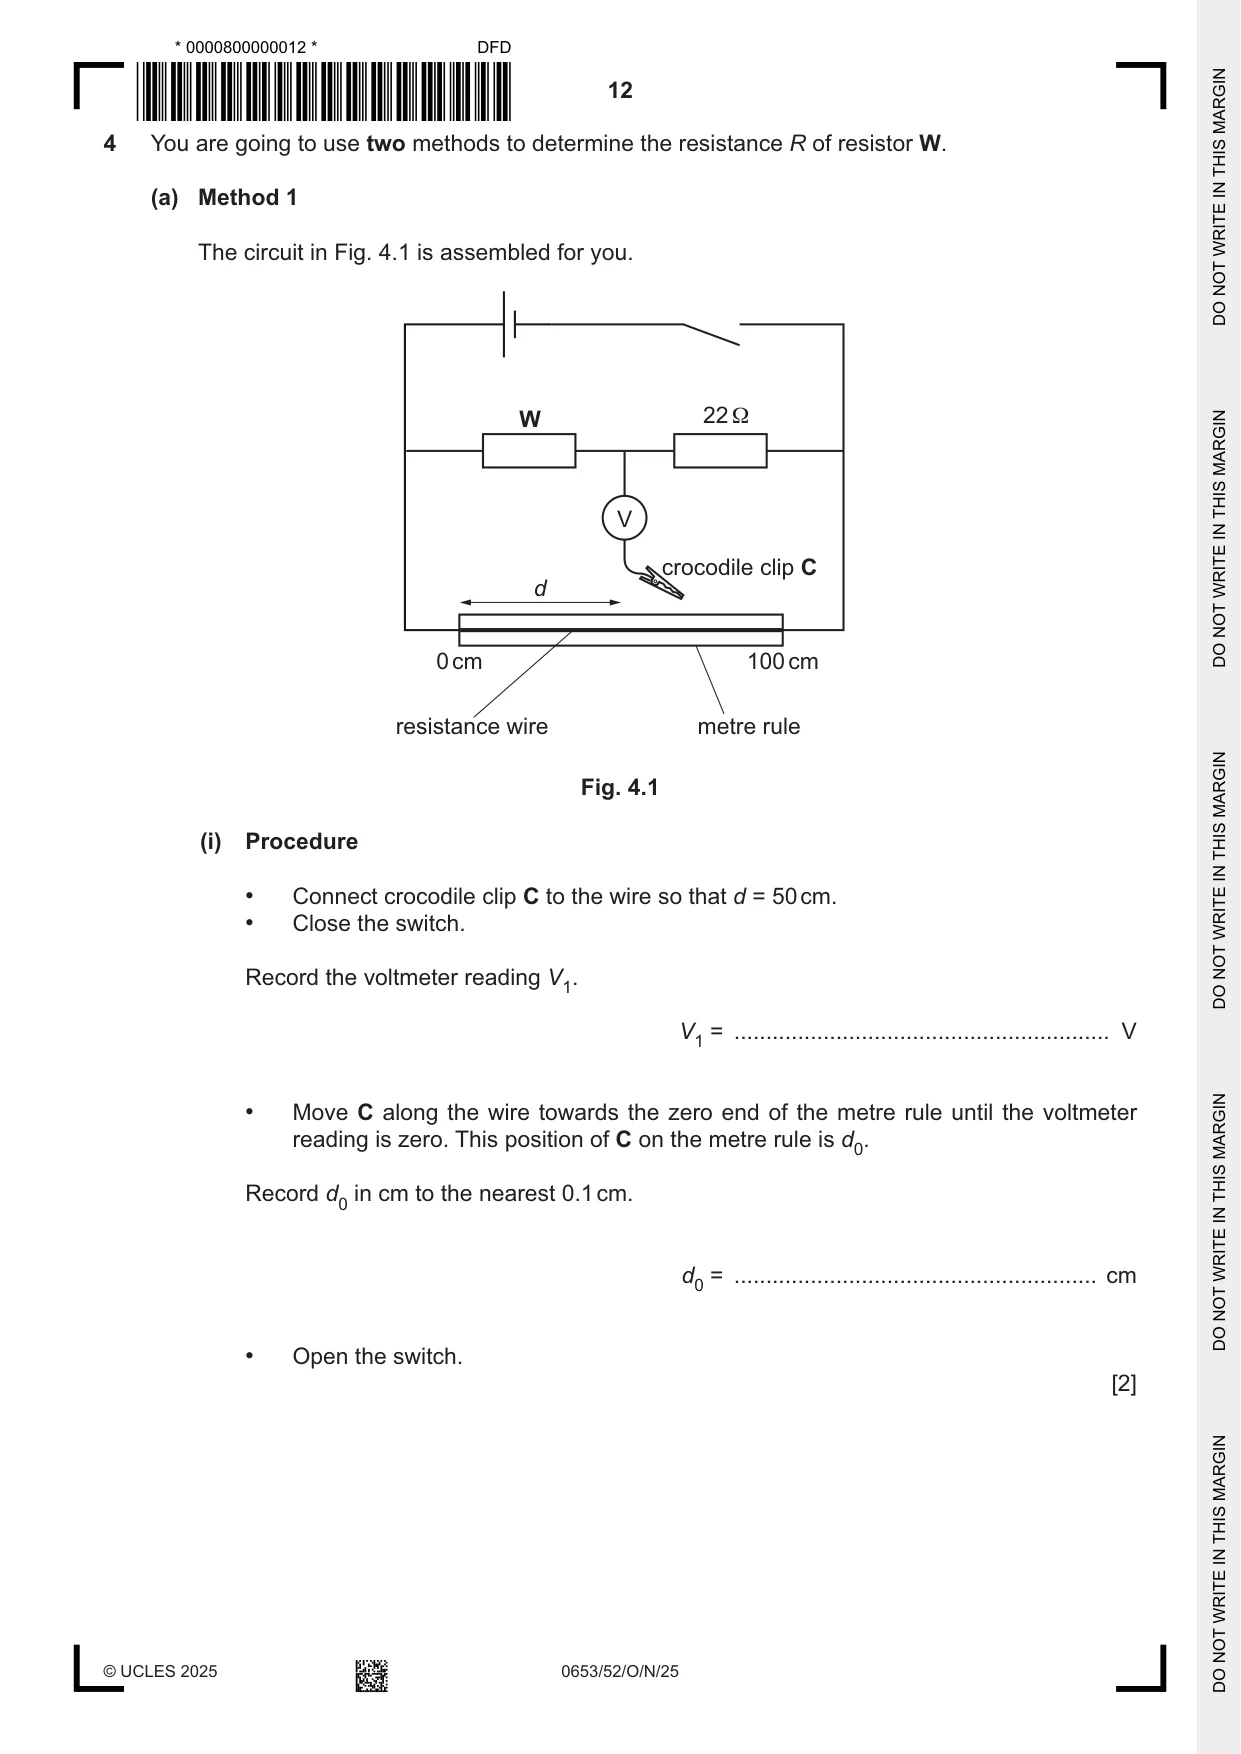
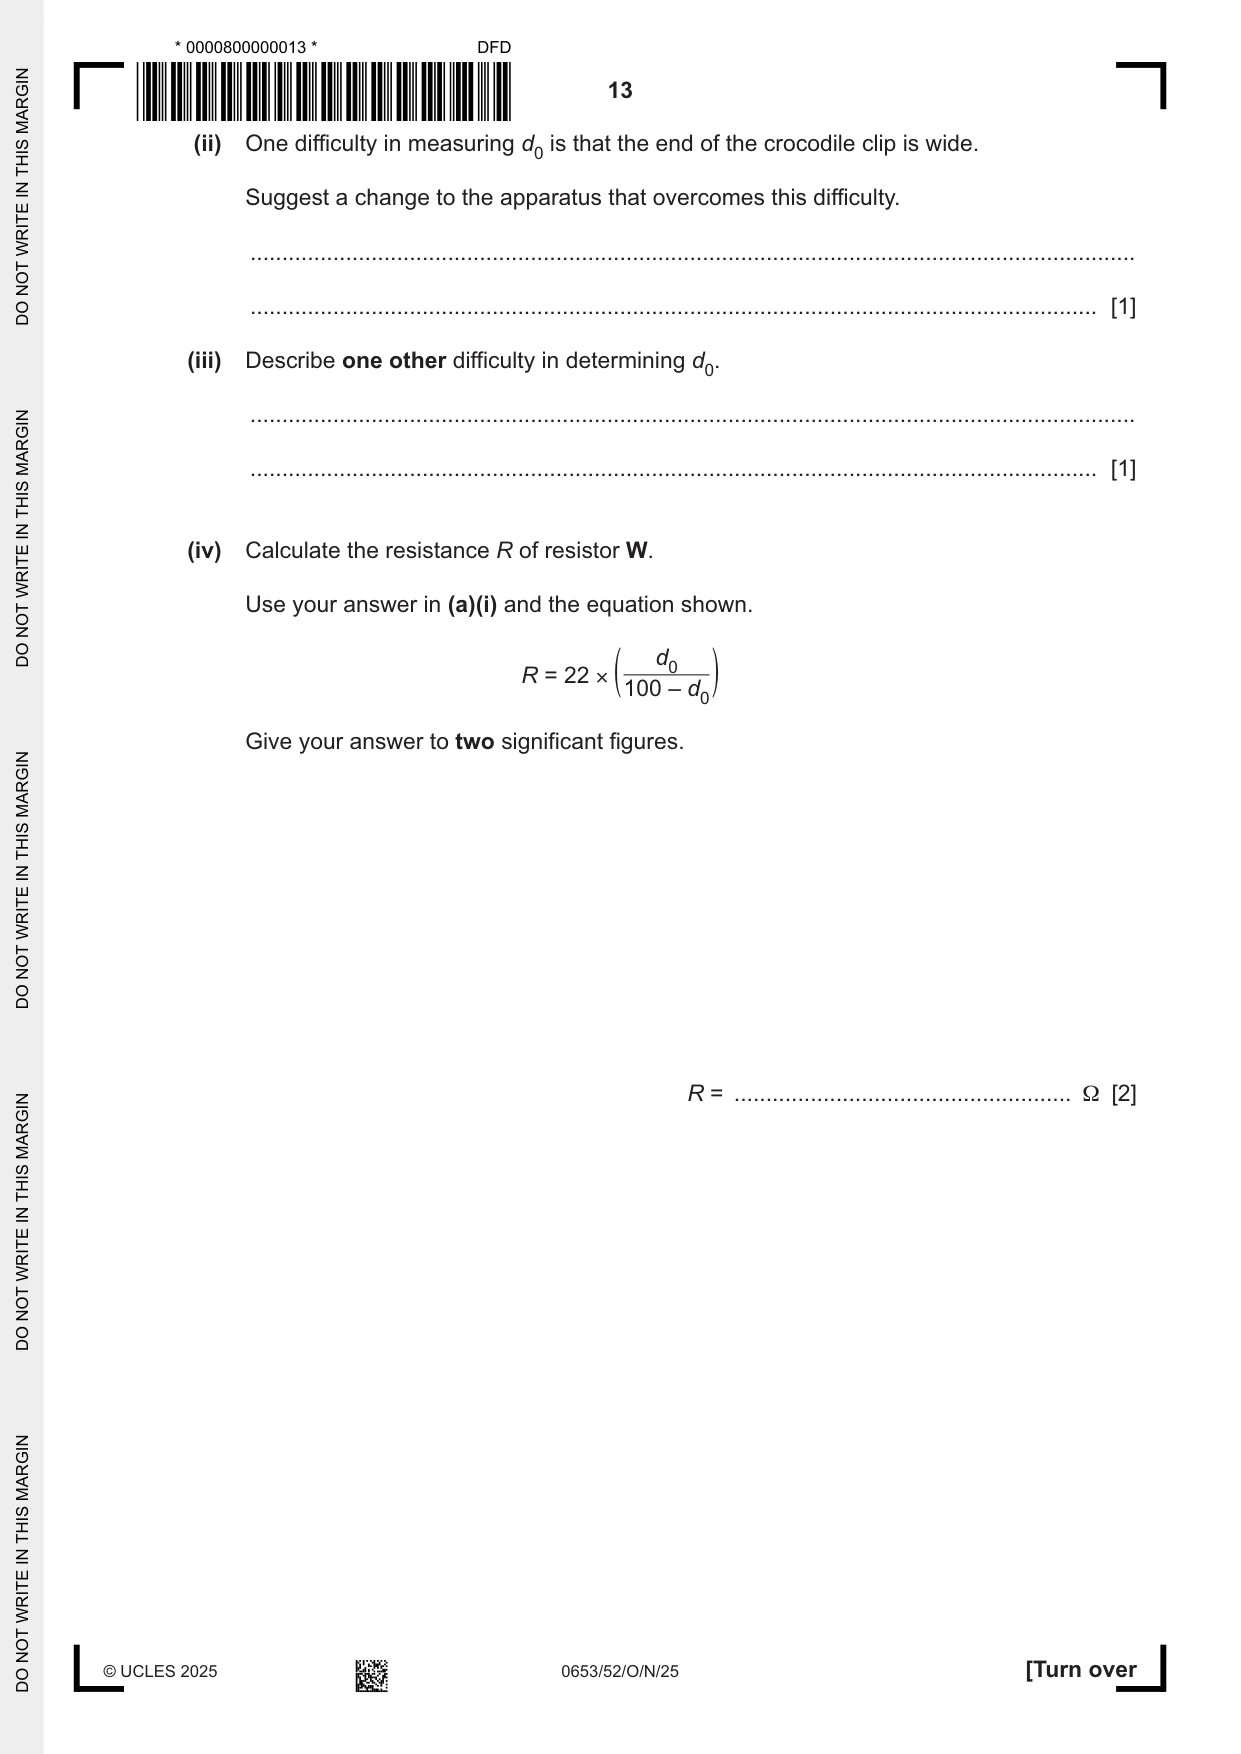
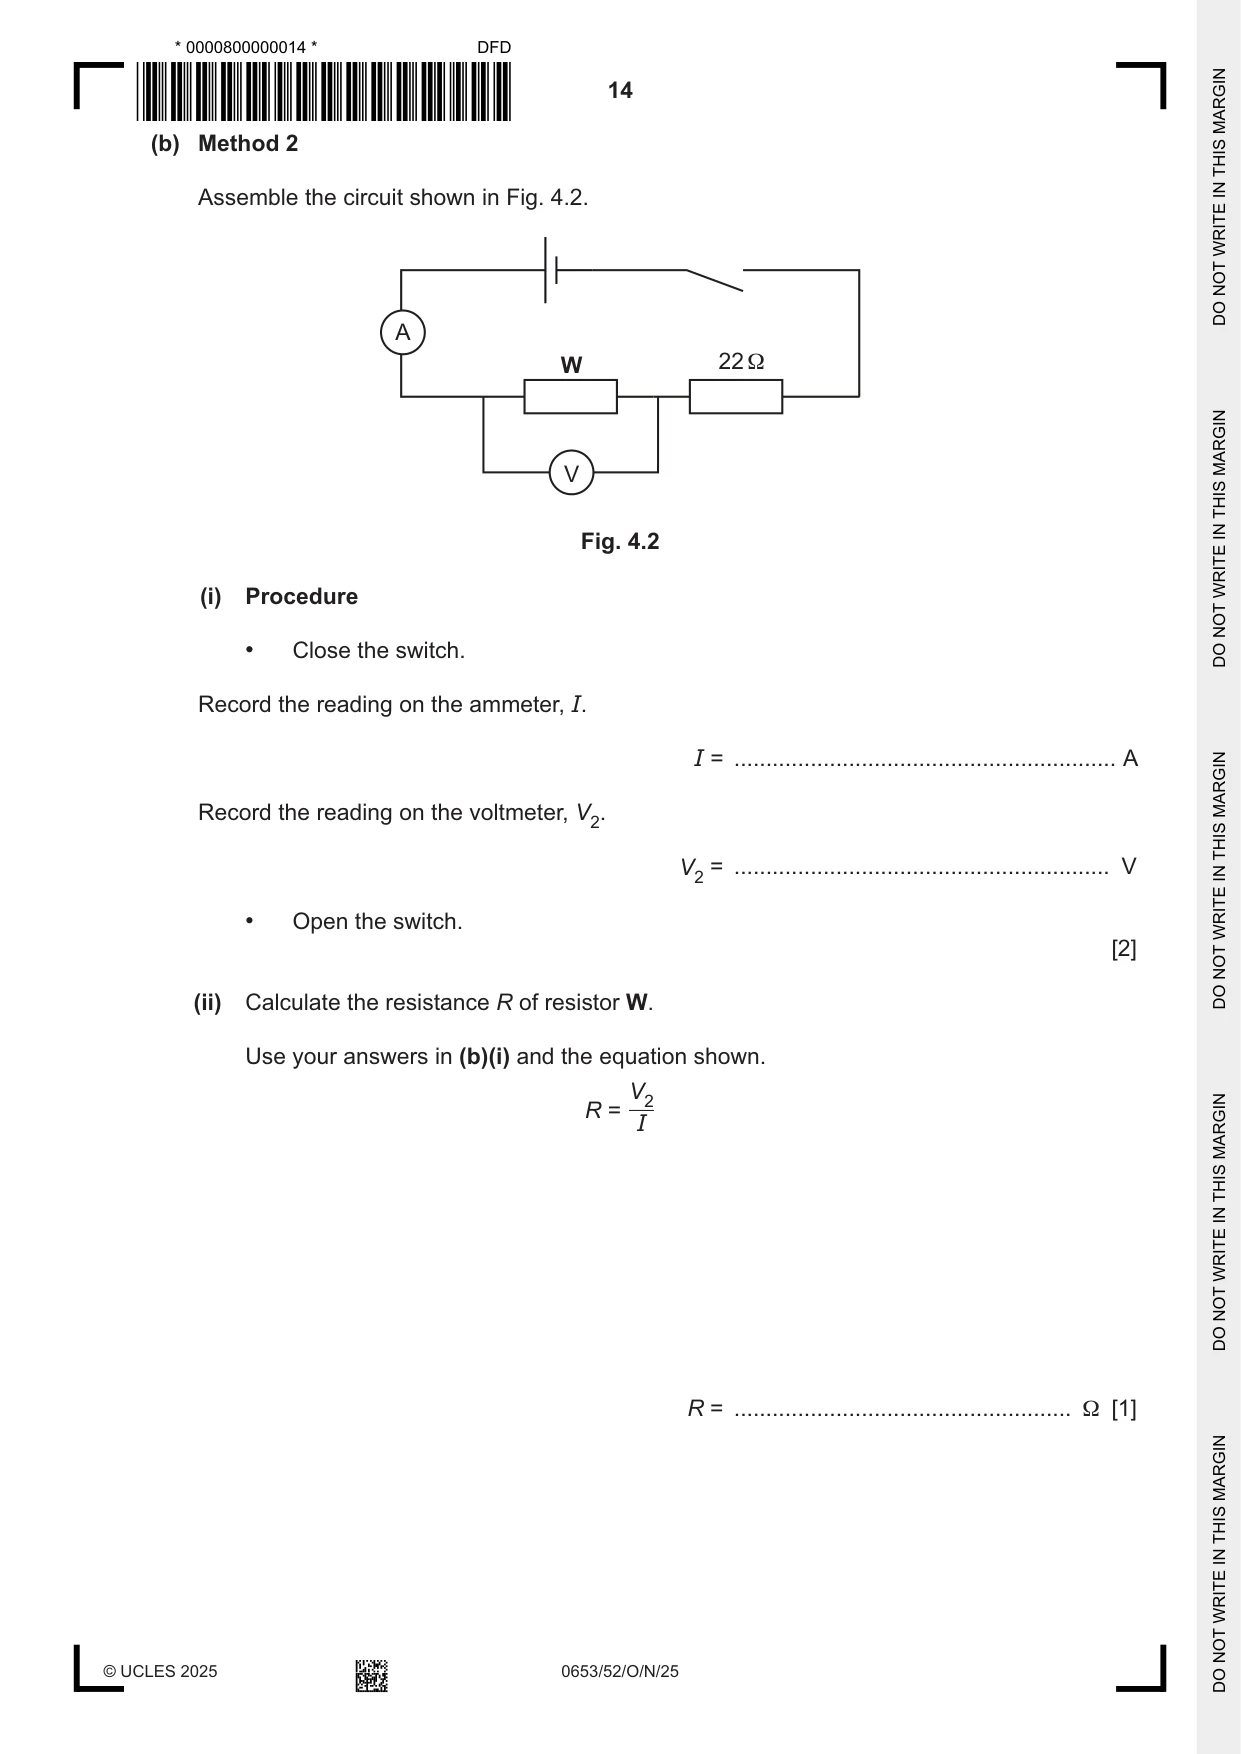
4 You are going to use two methods to determine the resistance R of resistor W. (a) Method 1 The circuit in Fig. 4.1 is assembled for you. W 22 Ω V crocodile clip C d 0 cm 100 cm resistance wire metre rule Fig. 4.1 (i) Procedure • Connect crocodile clip C to the wire so that d = 50 cm. • Close the switch. Record the voltmeter reading V1. V1 = ........................................................... V • Move C along the wire towards the zero end of the metre rule until the voltmeter reading is zero. This position of C on the metre rule is d0. Record d0 in cm to the nearest 0.1 cm. d0 = ......................................................... cm • Open the switch. [2] (ii) One difficulty in measuring d0 is that the end of the crocodile clip is wide. Suggest a change to the apparatus that overcomes this difficulty. ........................................................................................................................................... ..................................................................................................................................... [1] (iii) Describe one other difficulty in determining d0. ........................................................................................................................................... ..................................................................................................................................... [1] (iv) Calculate the resistance R of resistor W. Use your answer in (a)(i) and the equation shown. d0 R = 22 × ( 100 – d0) Give your answer to two significant figures. R = ..................................................... Ω [2] (b) Method 2 Assemble the circuit shown in Fig. 4.2. A W 22 Ω V Fig. 4.2 (i) Procedure • Close the switch. Record the reading on the ammeter, I. I = ............................................................ A Record the reading on the voltmeter, V2. V2 = ........................................................... V • Open the switch. [2] (ii) Calculate the resistance R of resistor W. Use your answers in (b)(i) and the equation shown. V2 R = I R = ..................................................... Ω [1]
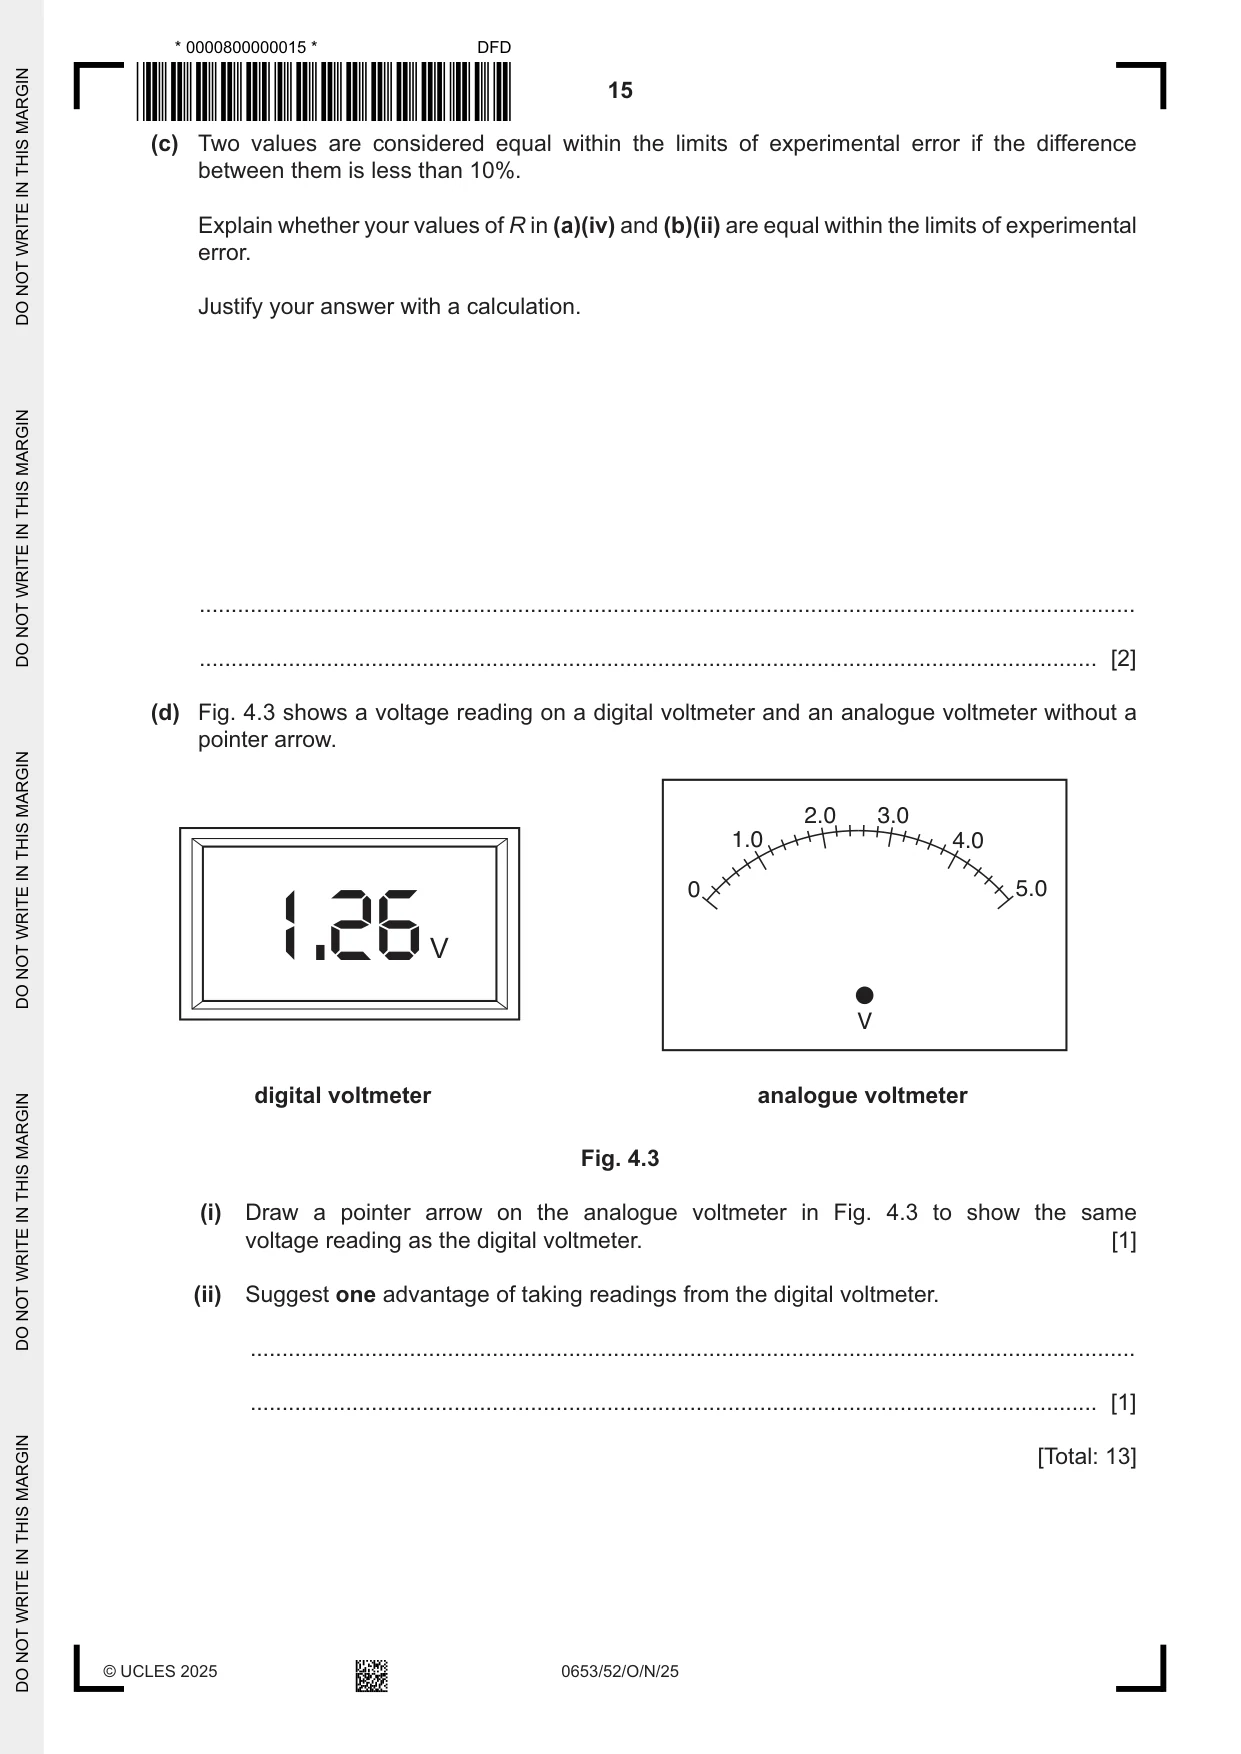
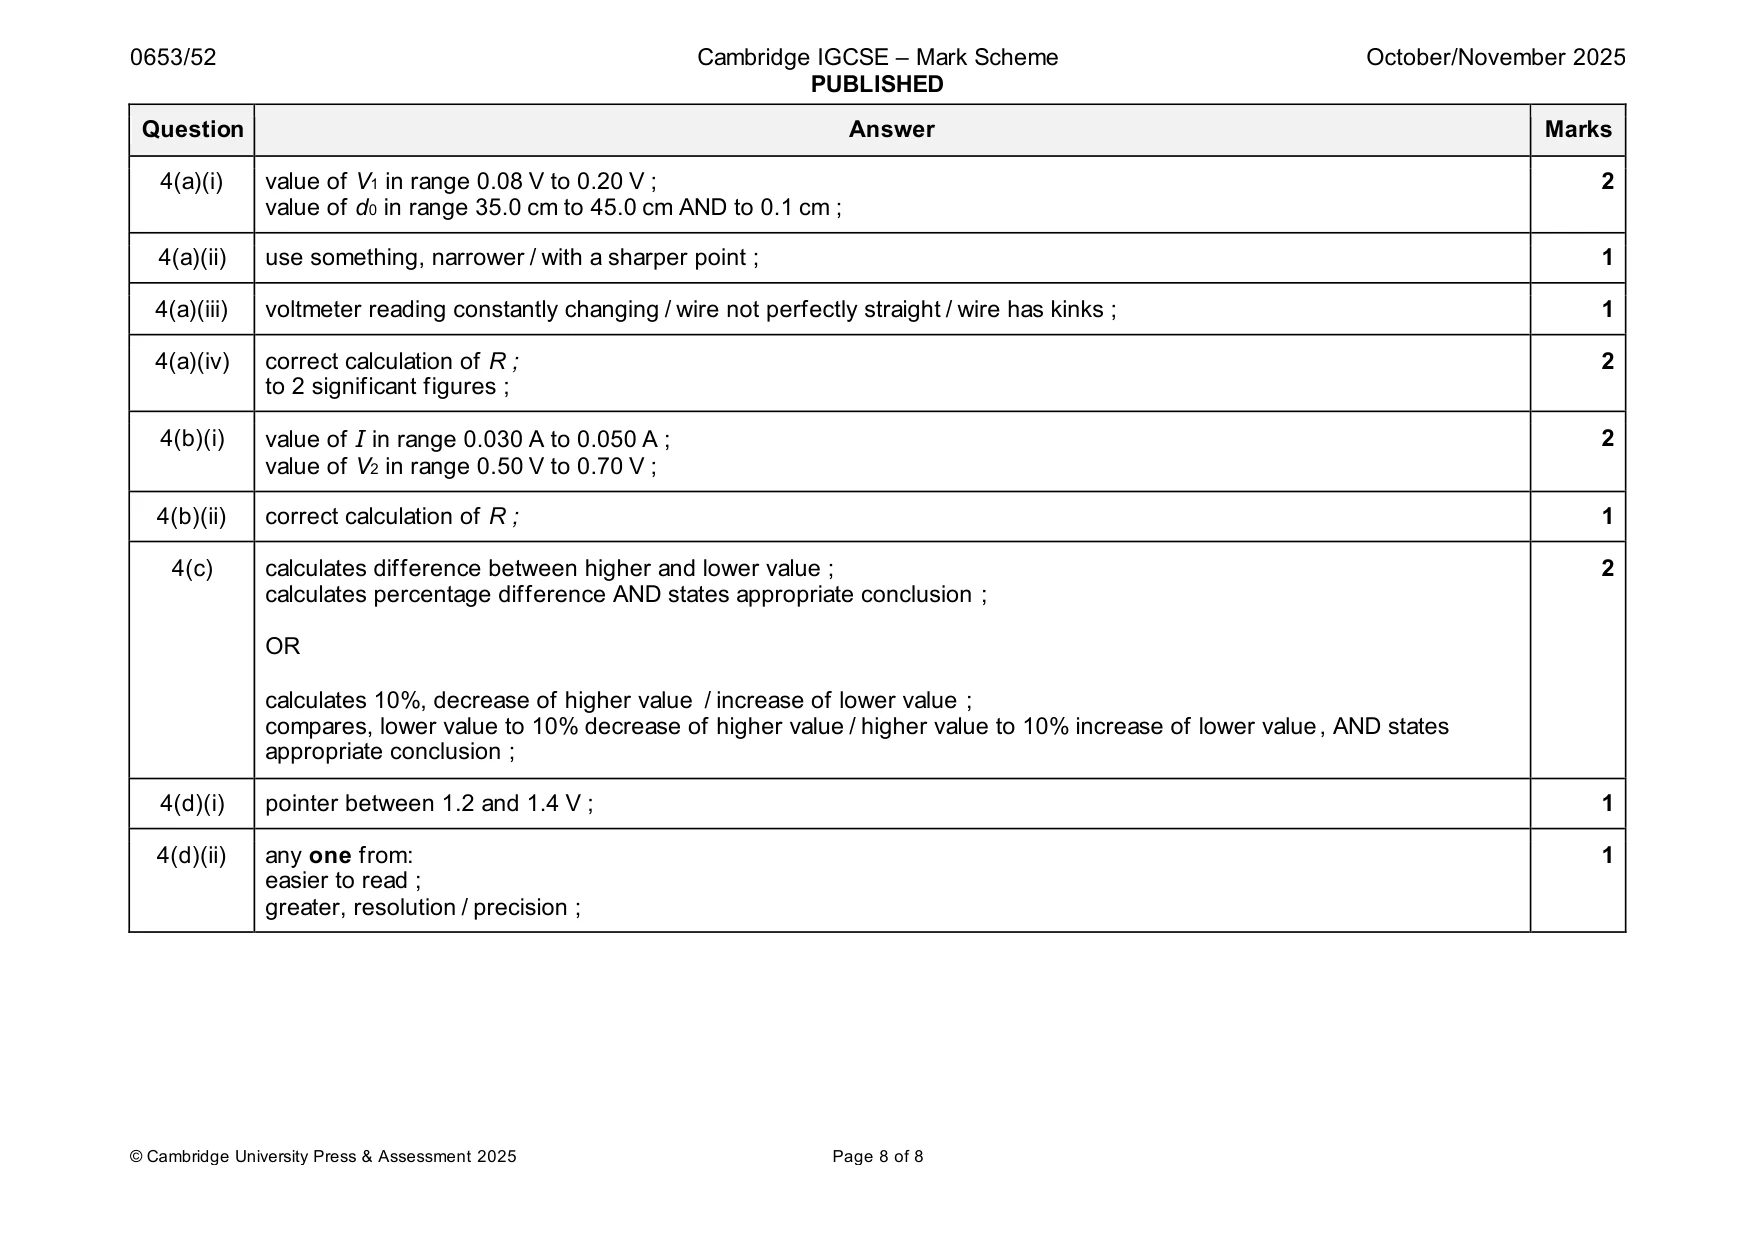
Mark scheme: 4(a)(i) value of V1 in range 0.08 V to 0.20 V ; 2 value of d0 in range 35.0 cm to 45.0 cm AND to 0.1 cm ; 4(a)(ii) use something, narrower / with a sharper point ; 1 4(a)(iii) voltmeter reading constantly changing / wire not perfectly straight / wire has kinks ; 1 4(a)(iv) correct calculation of R ; 2 to 2 significant figures ; 4(b)(i) value of I in range 0.030 A to 0.050 A ; 2 value of V2 in range 0.50 V to 0.70 V ; 4(b)(ii) correct calculation of R ; 1 4(c) calculates difference between higher and lower value ; 2 calculates percentage difference AND states appropriate conclusion ; OR calculates 10%, decrease of higher value / increase of lower value ; compares, lower value to 10% decrease of higher value / higher value to 10% increase of lower value, AND states appropriate conclusion ; 4(d)(i) pointer between 1.2 and 1.4 V ; 1 4(d)(ii) any one from: 1 easier to read ; greater, resolution / precision ;
What was in this paper
The subtopics covered by these 4 questions, and how many questions each got. Open one in a new tab to see every Cambridge question on it.
What you needed in this session
Cambridge’s own grade thresholds for 2025 Oct/Nov, Paper 5 · Variant 2. A higher threshold means an easier paper — the bar moves with how the cohort did.