Cambridge IGCSE Physics 0625 — 2019 Oct/Nov Paper 5 · Variant 3
0625/53/O/N/19 · 4 questions · 40 marks · ≈45 min
The question paper and its mark scheme, free to read here and free to download. This is Cambridge’s own paper, exactly as it was sat.
Question paper12 pages

Mark scheme7 pages
Answers below. Sit the paper first if you are practising.
Questions as text
Q1 · In this experiment, you will investigate how the resistance of a filament lamp changes as…
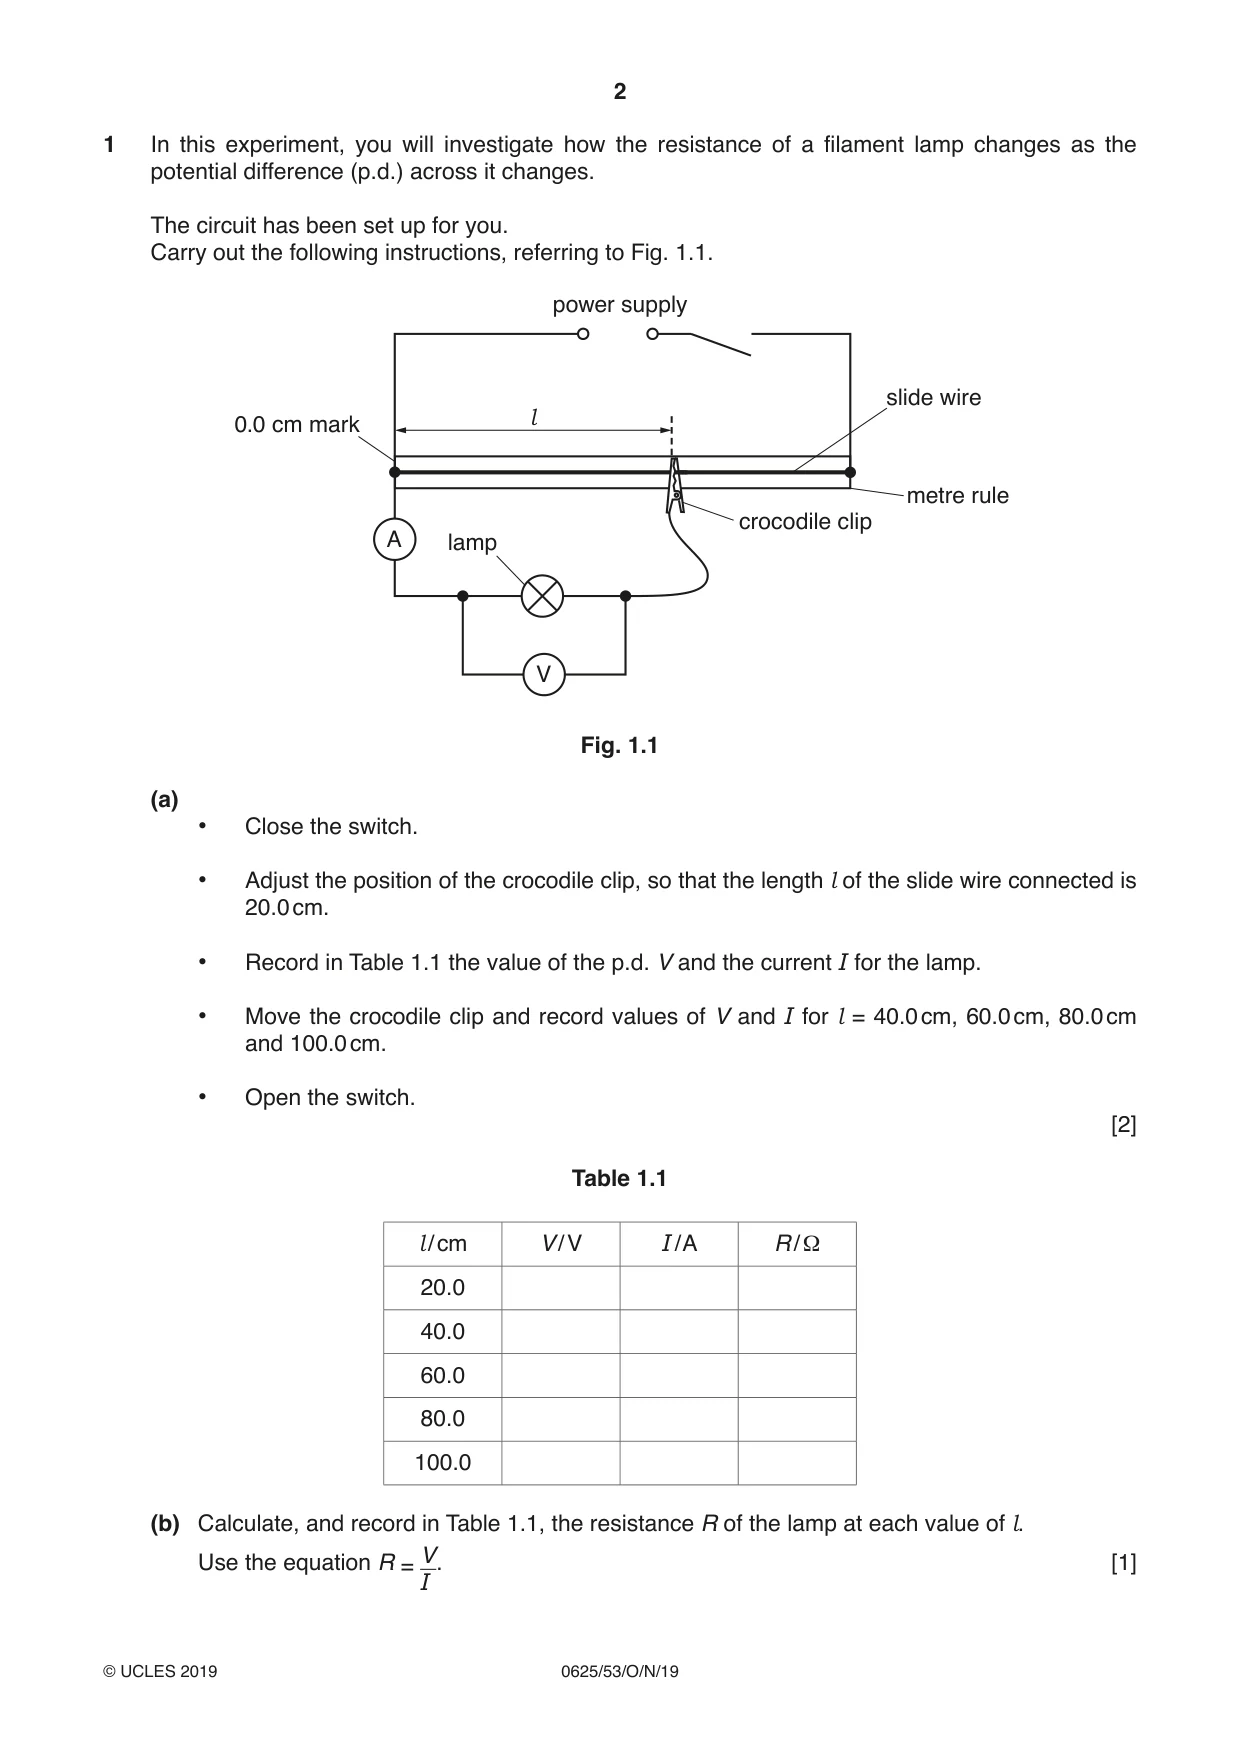
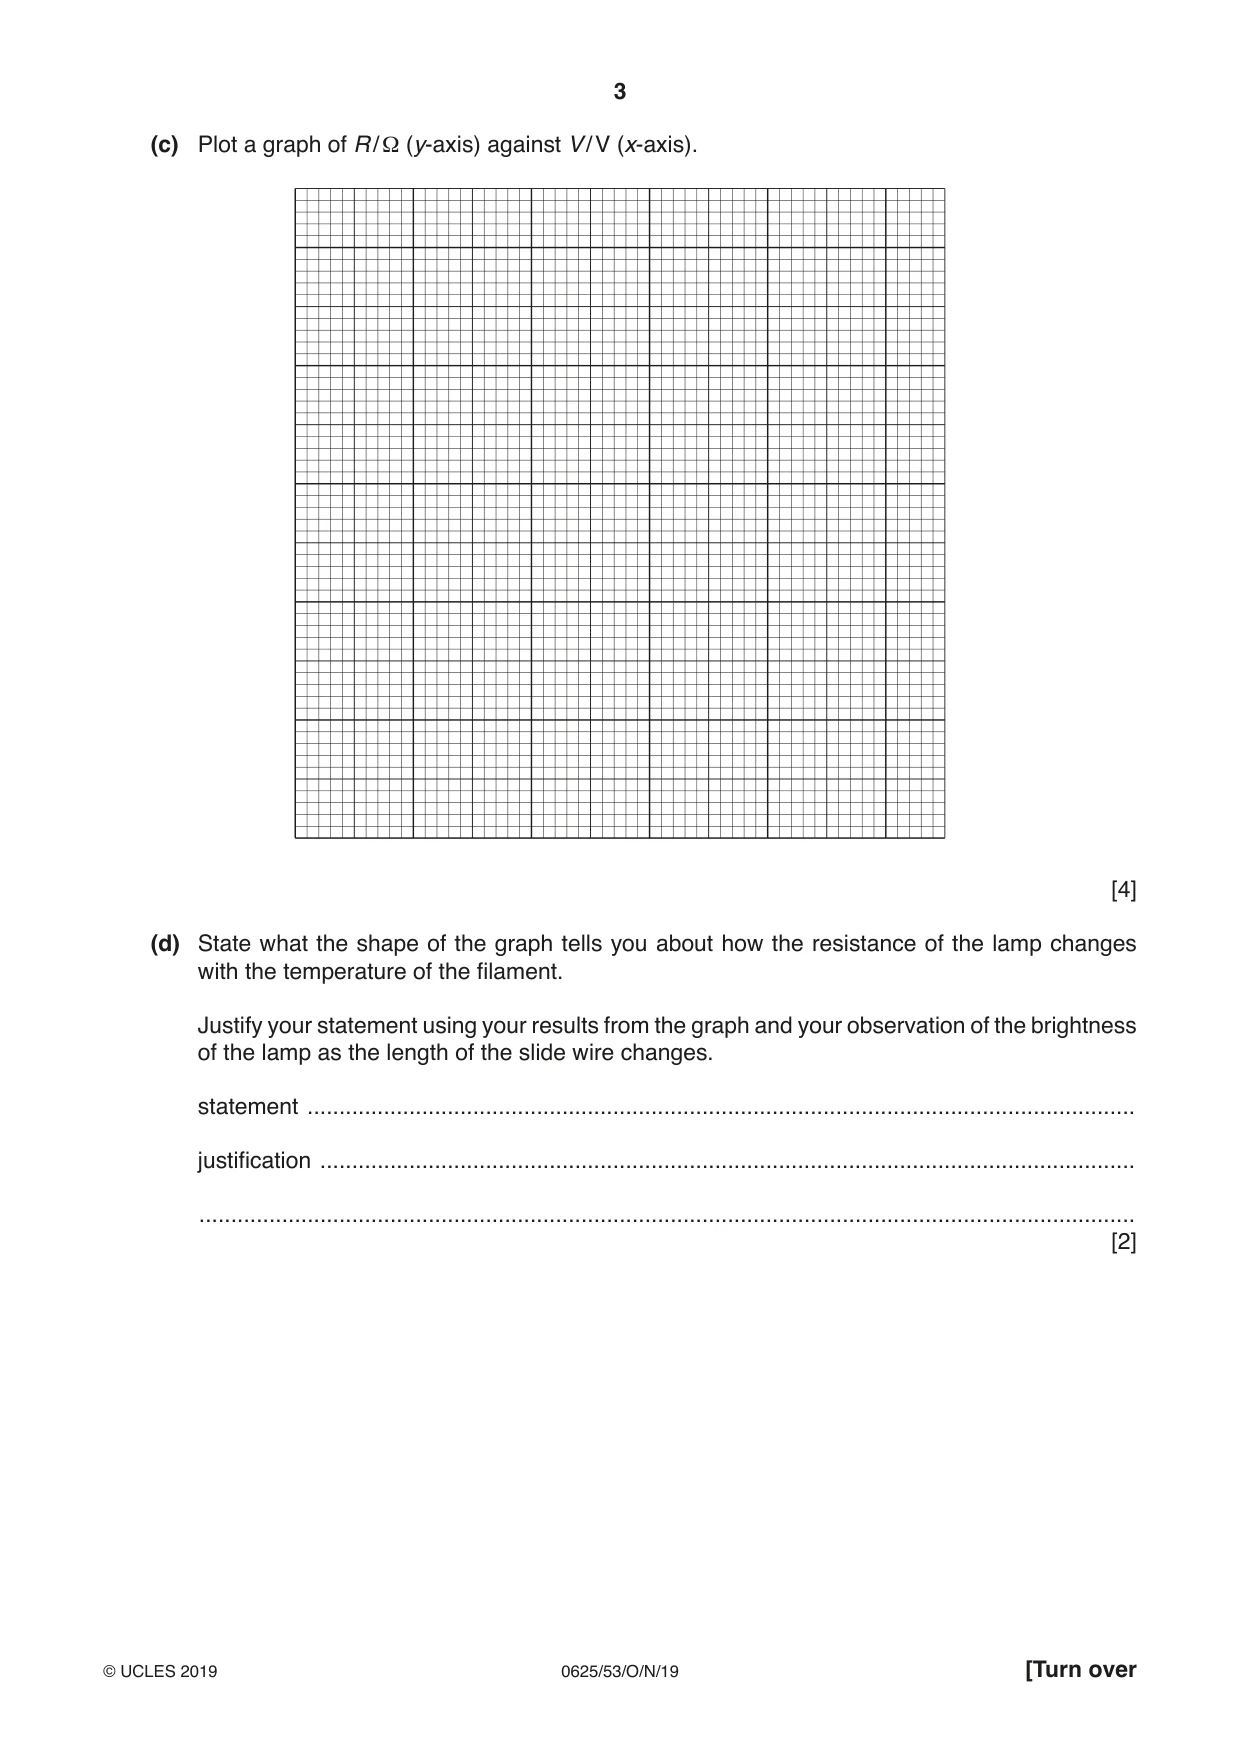
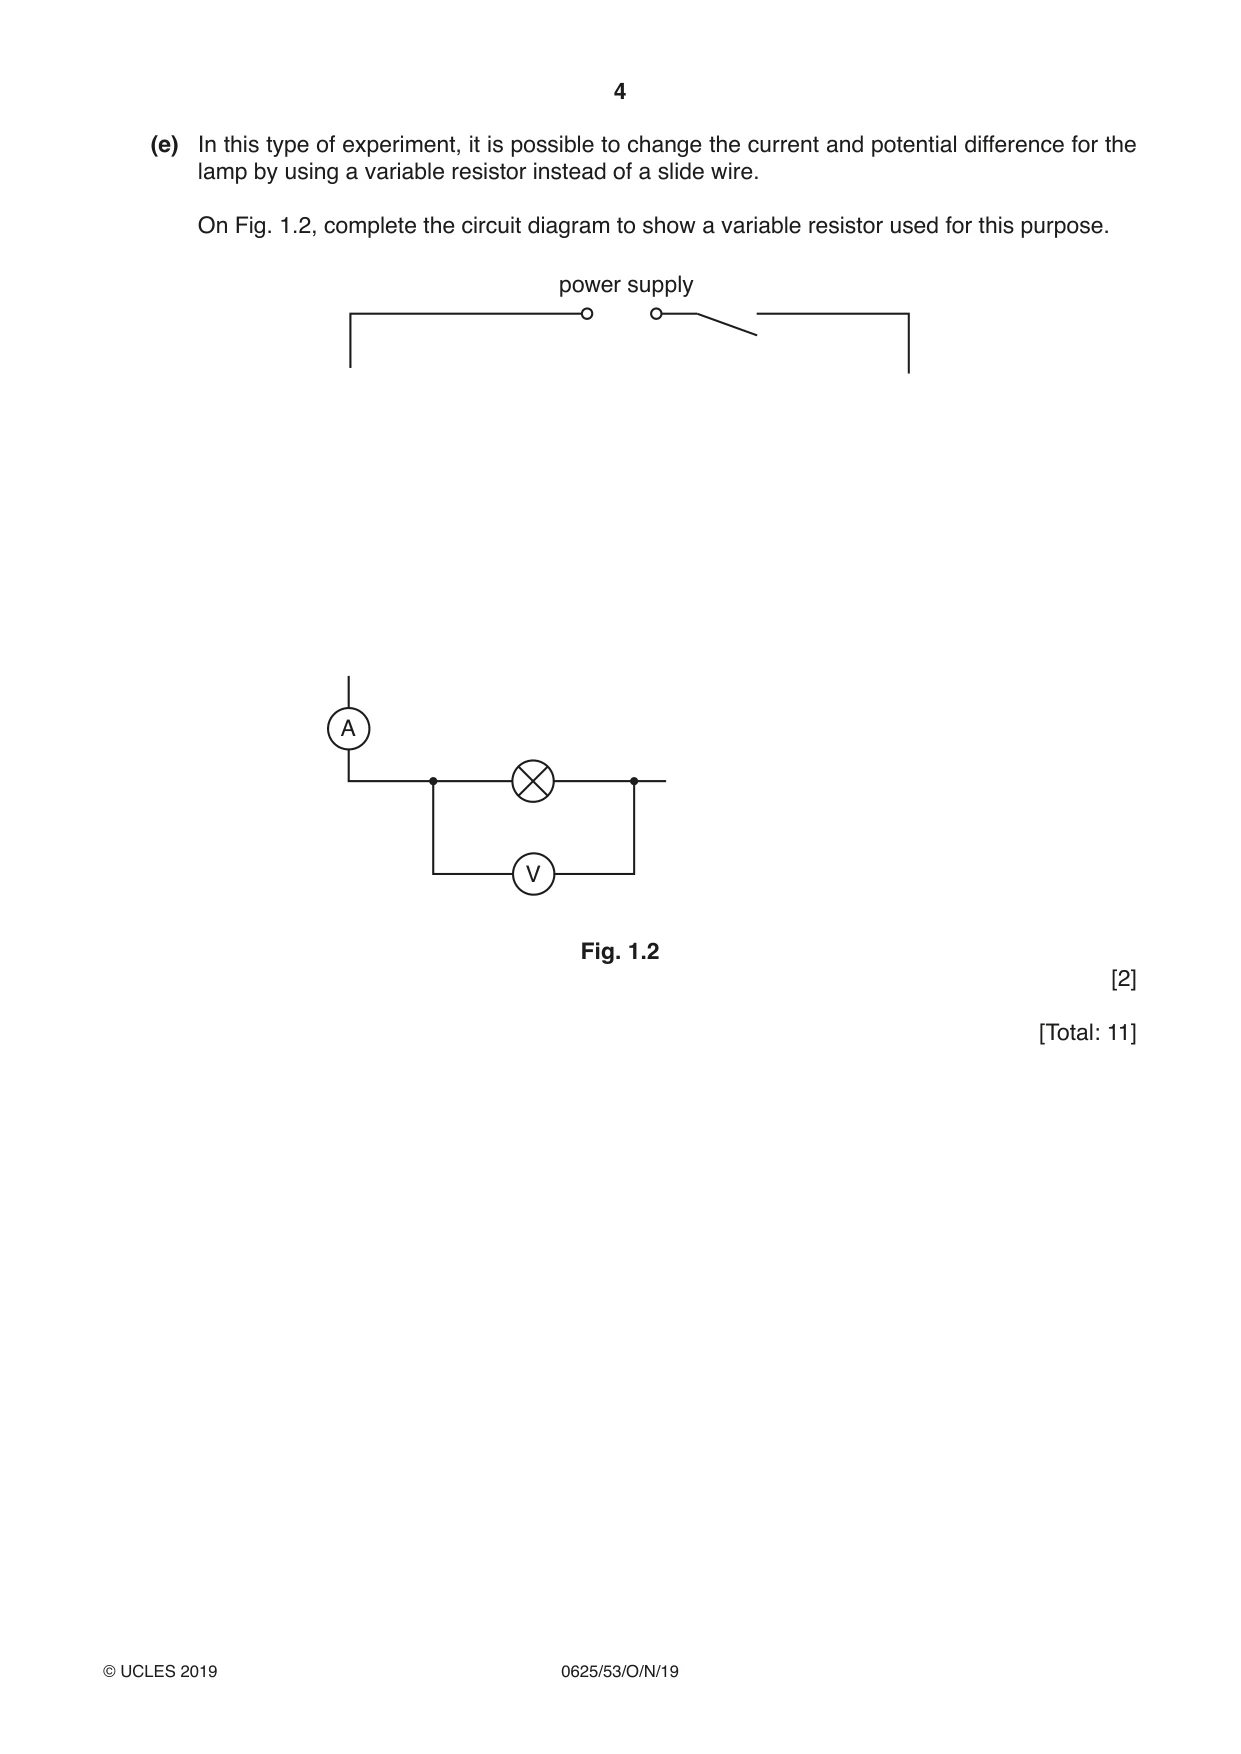
1 In this experiment, you will investigate how the resistance of a filament lamp changes as the potential difference (p.d.) across it changes. The circuit has been set up for you. Carry out the following instructions, referring to Fig. 1.1. power supply slide wire 0.0 cm mark l metre rule crocodile clip A lamp V Fig. 1.1 (a) • Close the switch. • Adjust the position of the crocodile clip, so that the length l of the slide wire connected is 20.0 cm. • Record in Table 1.1 the value of the p.d. V and the current I for the lamp. • Move the crocodile clip and record values of V and I for l = 40.0 cm, 60.0 cm, 80.0 cm and 100.0 cm. • Open the switch. [2] Table 1.1 l / cm V / V I / A R / Ω 20.0 40.0 60.0 80.0 100.0 (b) Calculate, and record in Table 1.1, the resistance R of the lamp at each value of l. V Use the equation R = . [1] I (c) Plot a graph of R / Ω (y-axis) against V / V (x-axis). [4] (d) State what the shape of the graph tells you about how the resistance of the lamp changes with the temperature of the filament. Justify your statement using your results from the graph and your observation of the brightness of the lamp as the length of the slide wire changes. statement .................................................................................................................................. justification ................................................................................................................................ ................................................................................................................................................... [2] (e) In this type of experiment, it is possible to change the current and potential difference for the lamp by using a variable resistor instead of a slide wire. On Fig. 1.2, complete the circuit diagram to show a variable resistor used for this purpose. power supply A V Fig. 1.2 [2] [Total: 11]
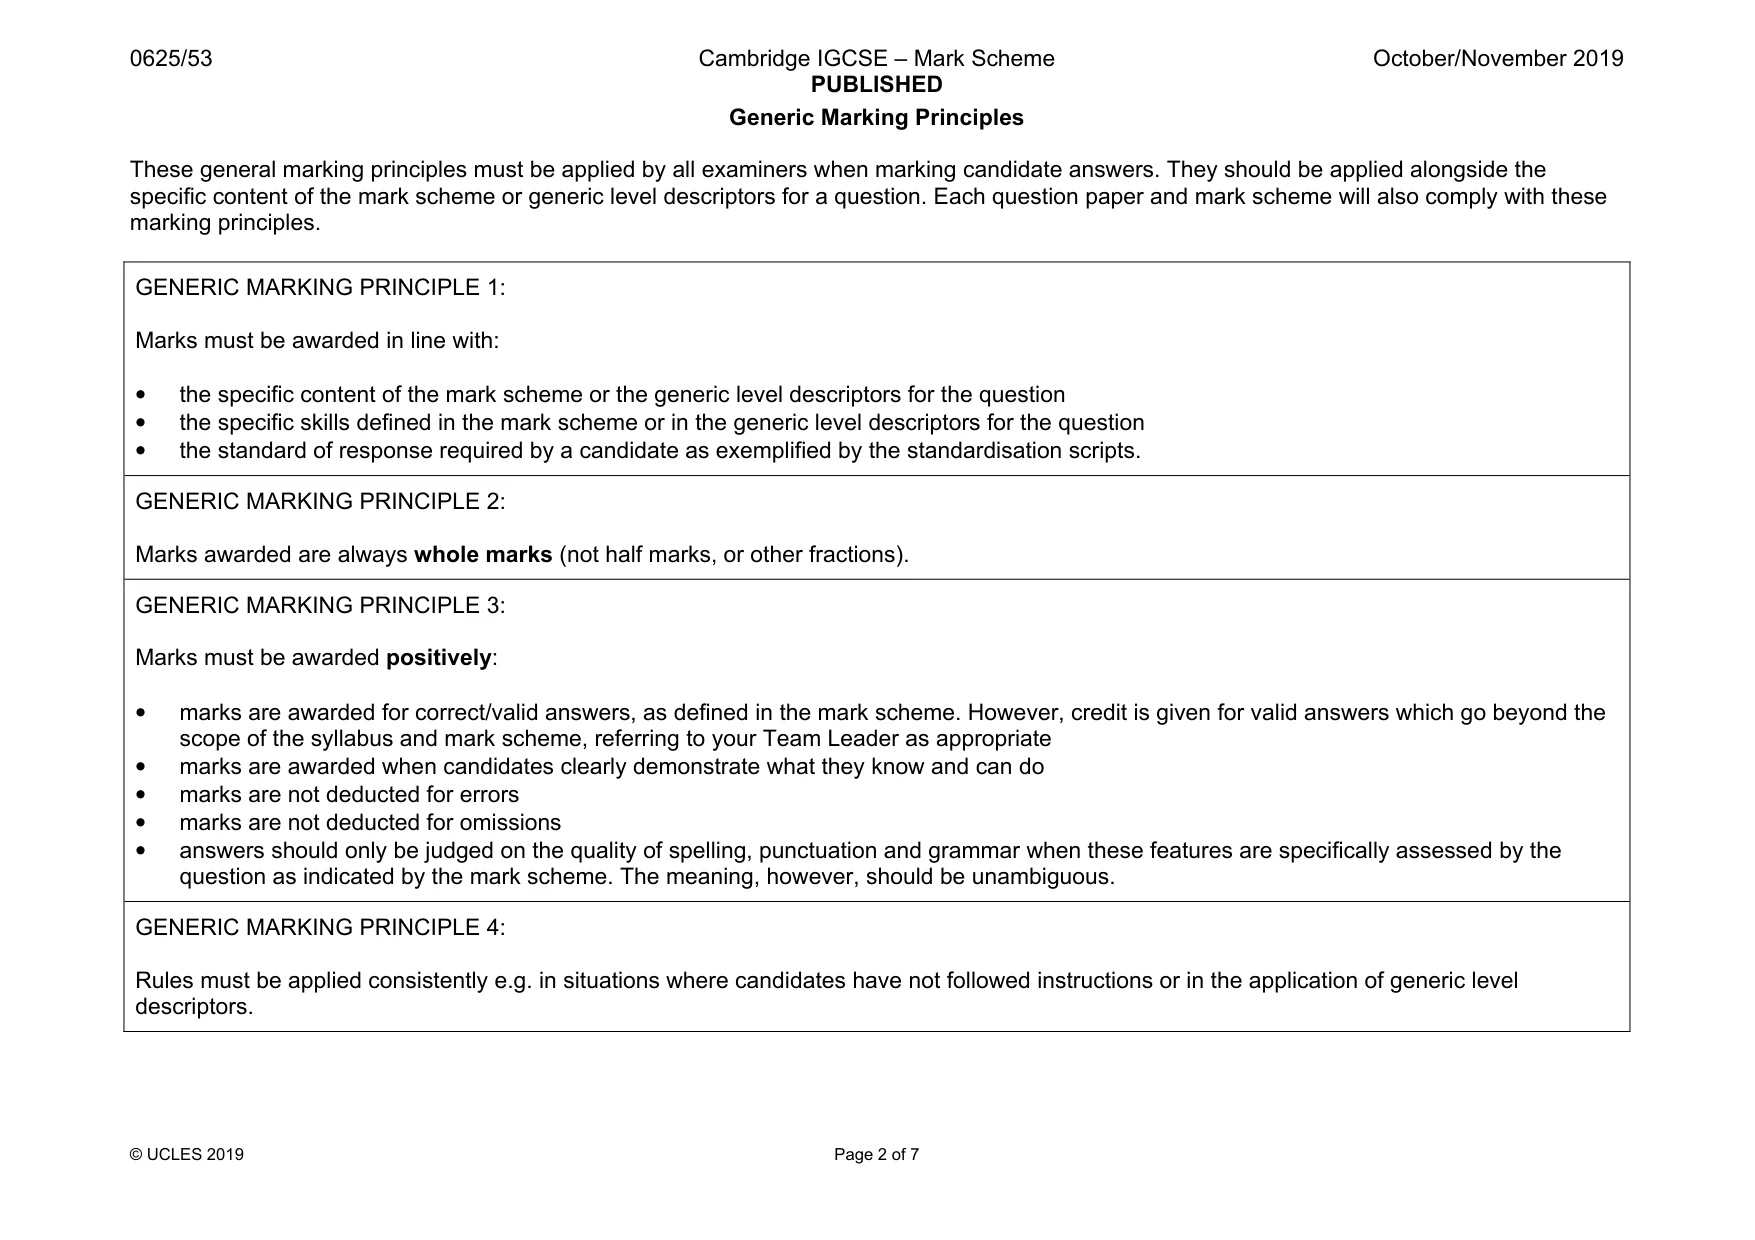
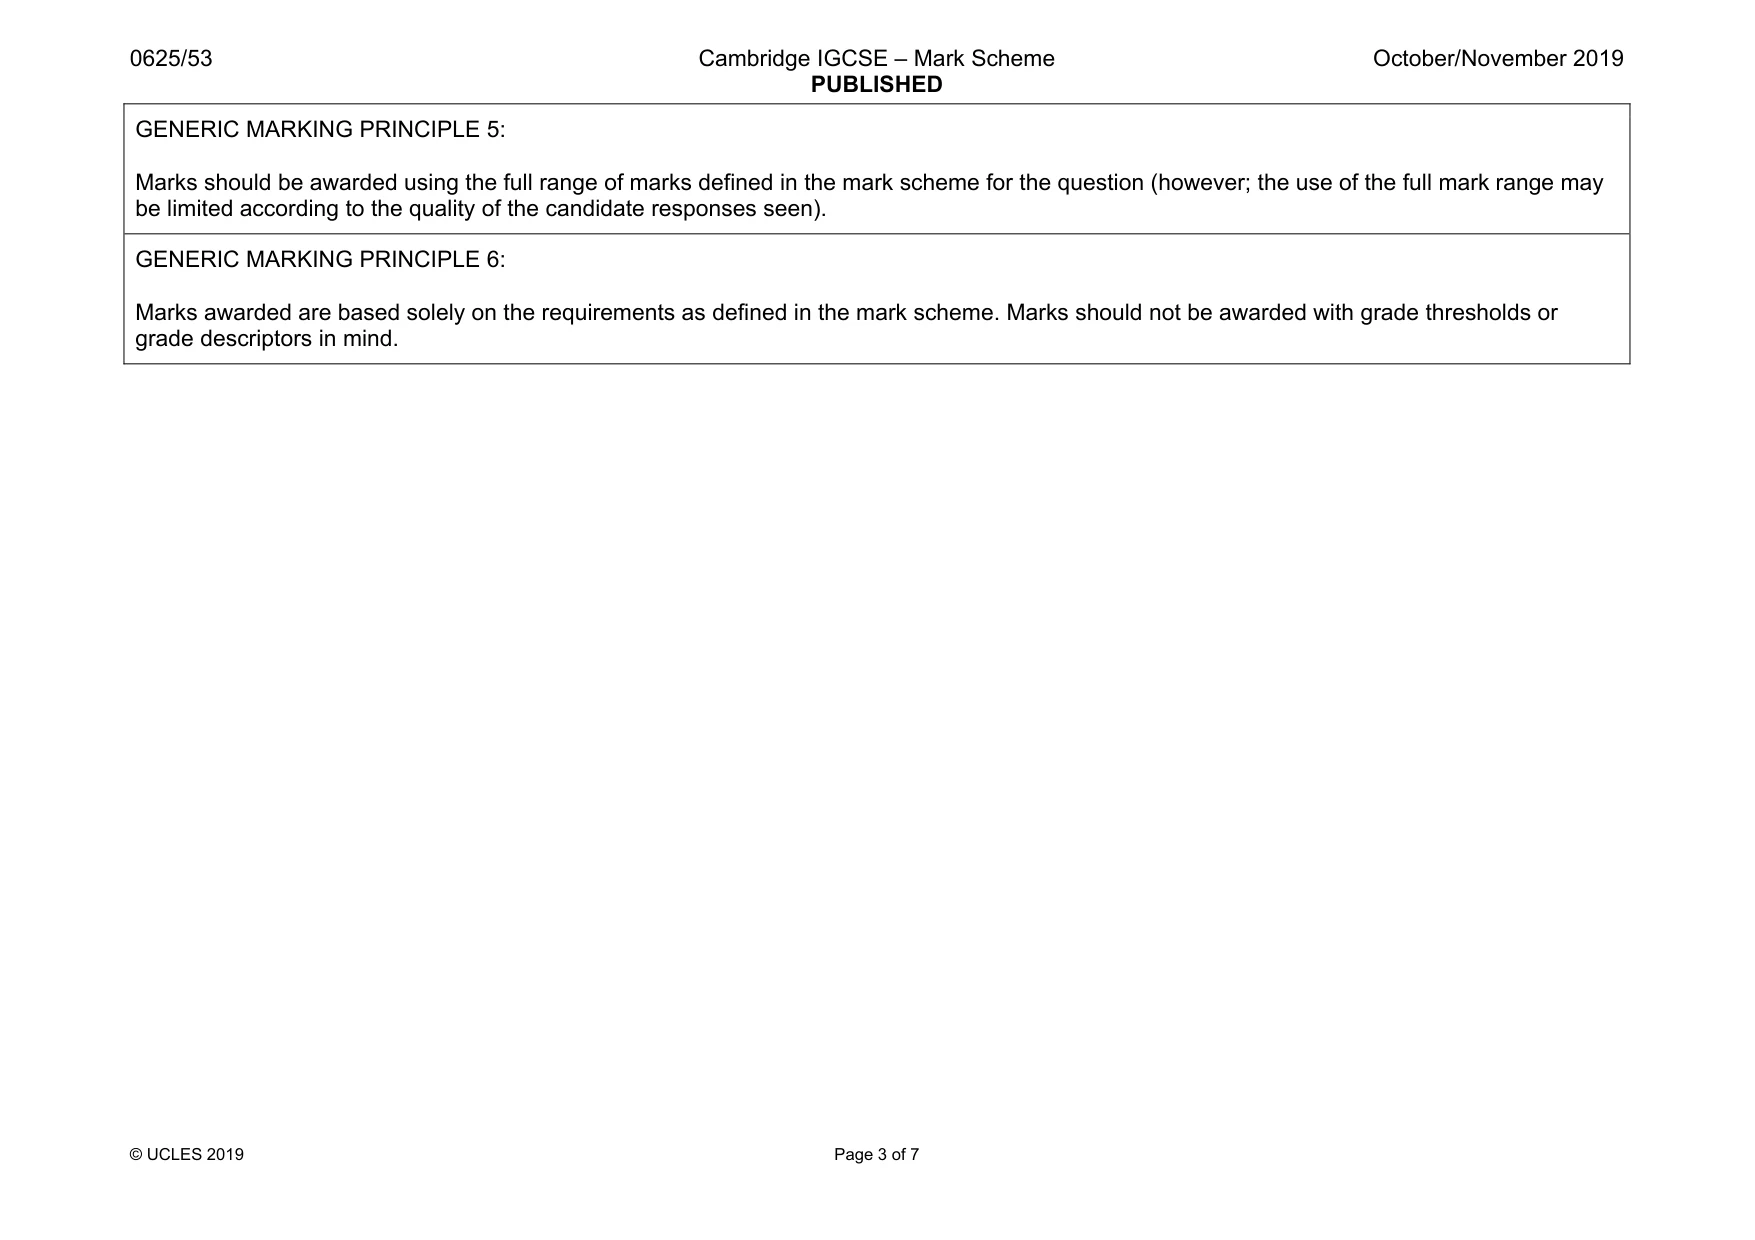
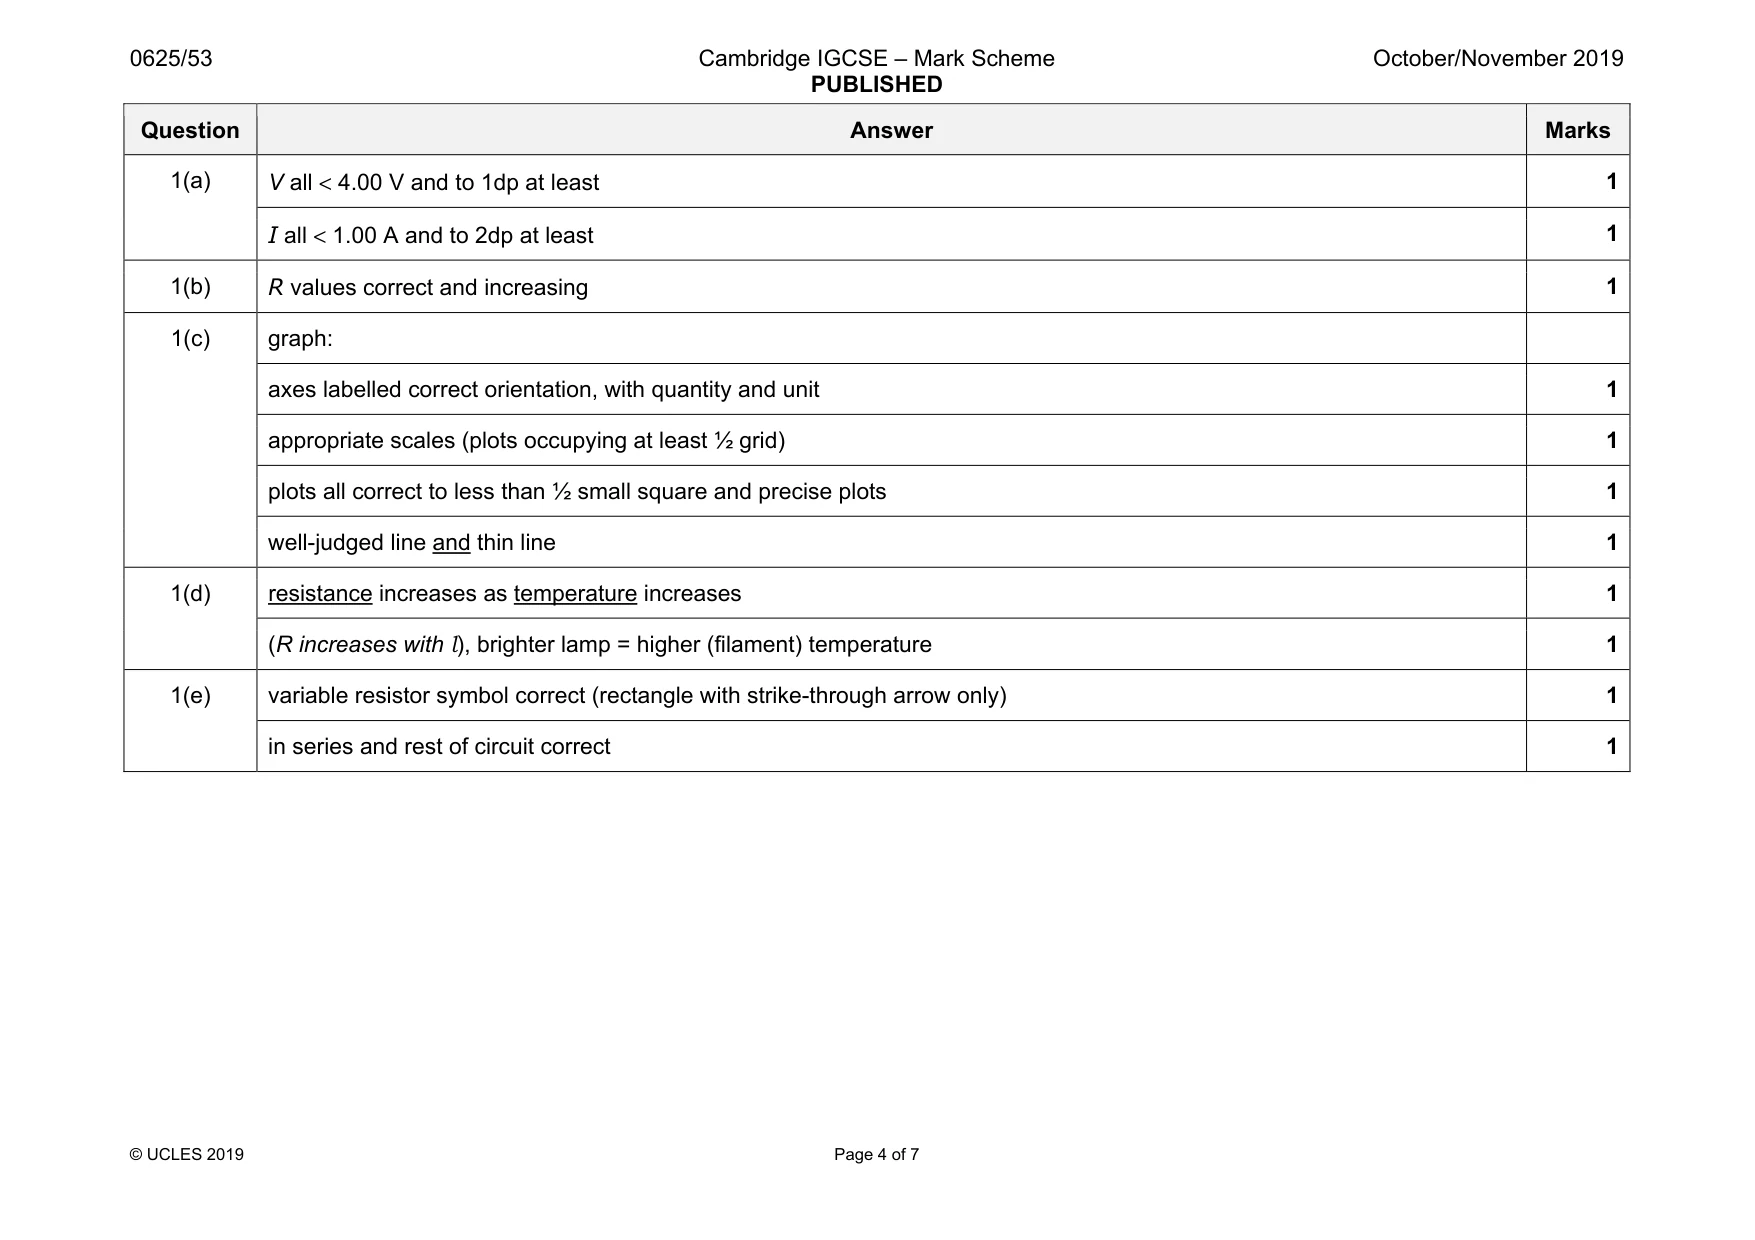
Mark scheme: 1(a) 1 I all < 1.00 A and to 2dp at least 1 1(b) R values correct and increasing 1 1(c) graph: axes labelled correct orientation, with quantity and unit 1 appropriate scales (plots occupying at least ½ grid) 1 plots all correct to less than ½ small square and precise plots 1 well-judged line and thin line 1 1(d) resistance increases as temperature increases 1 (R increases with l), brighter lamp = higher (filament) temperature 1 1(e) variable resistor symbol correct (rectangle with strike-through arrow only) 1 in series and rest of circuit correct 1
Q2 · In this experiment you will determine the focal length of a converging lens by two…
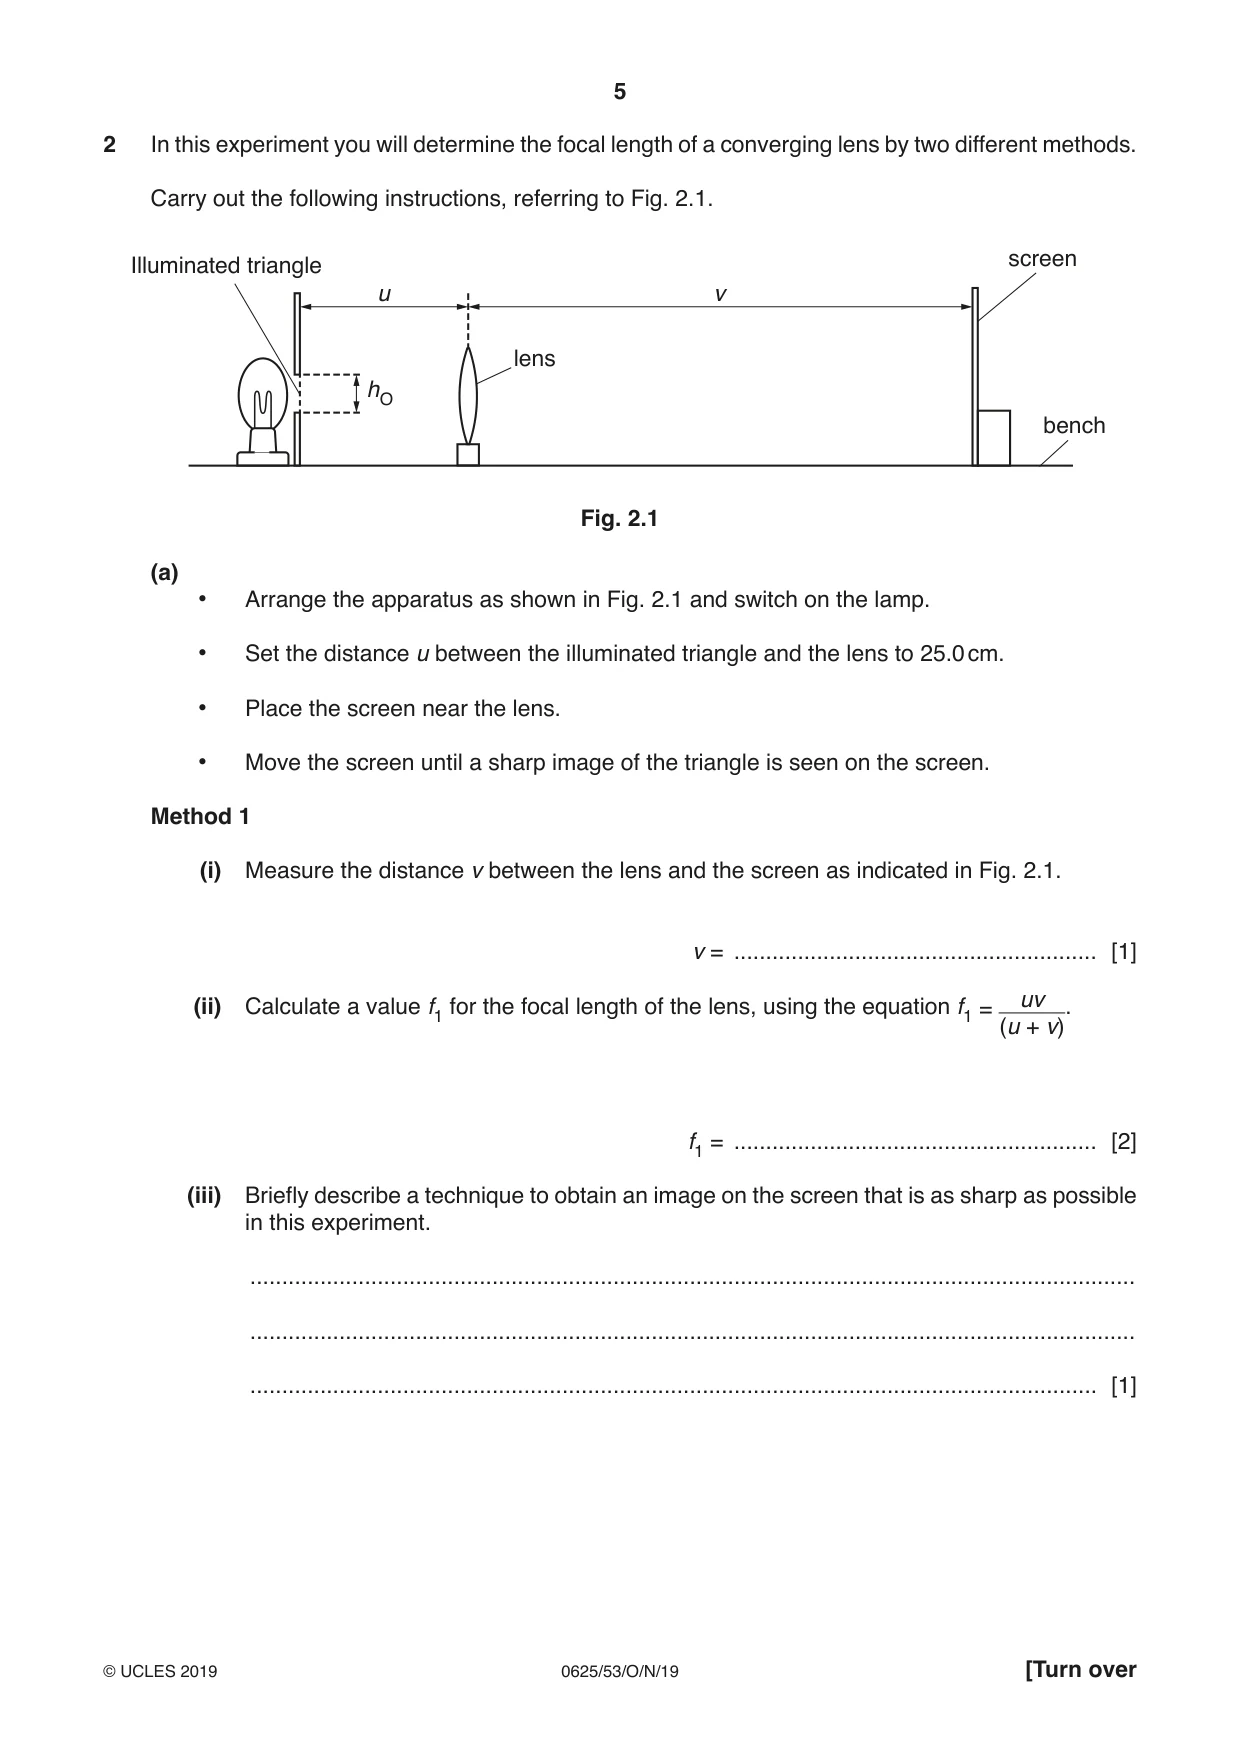
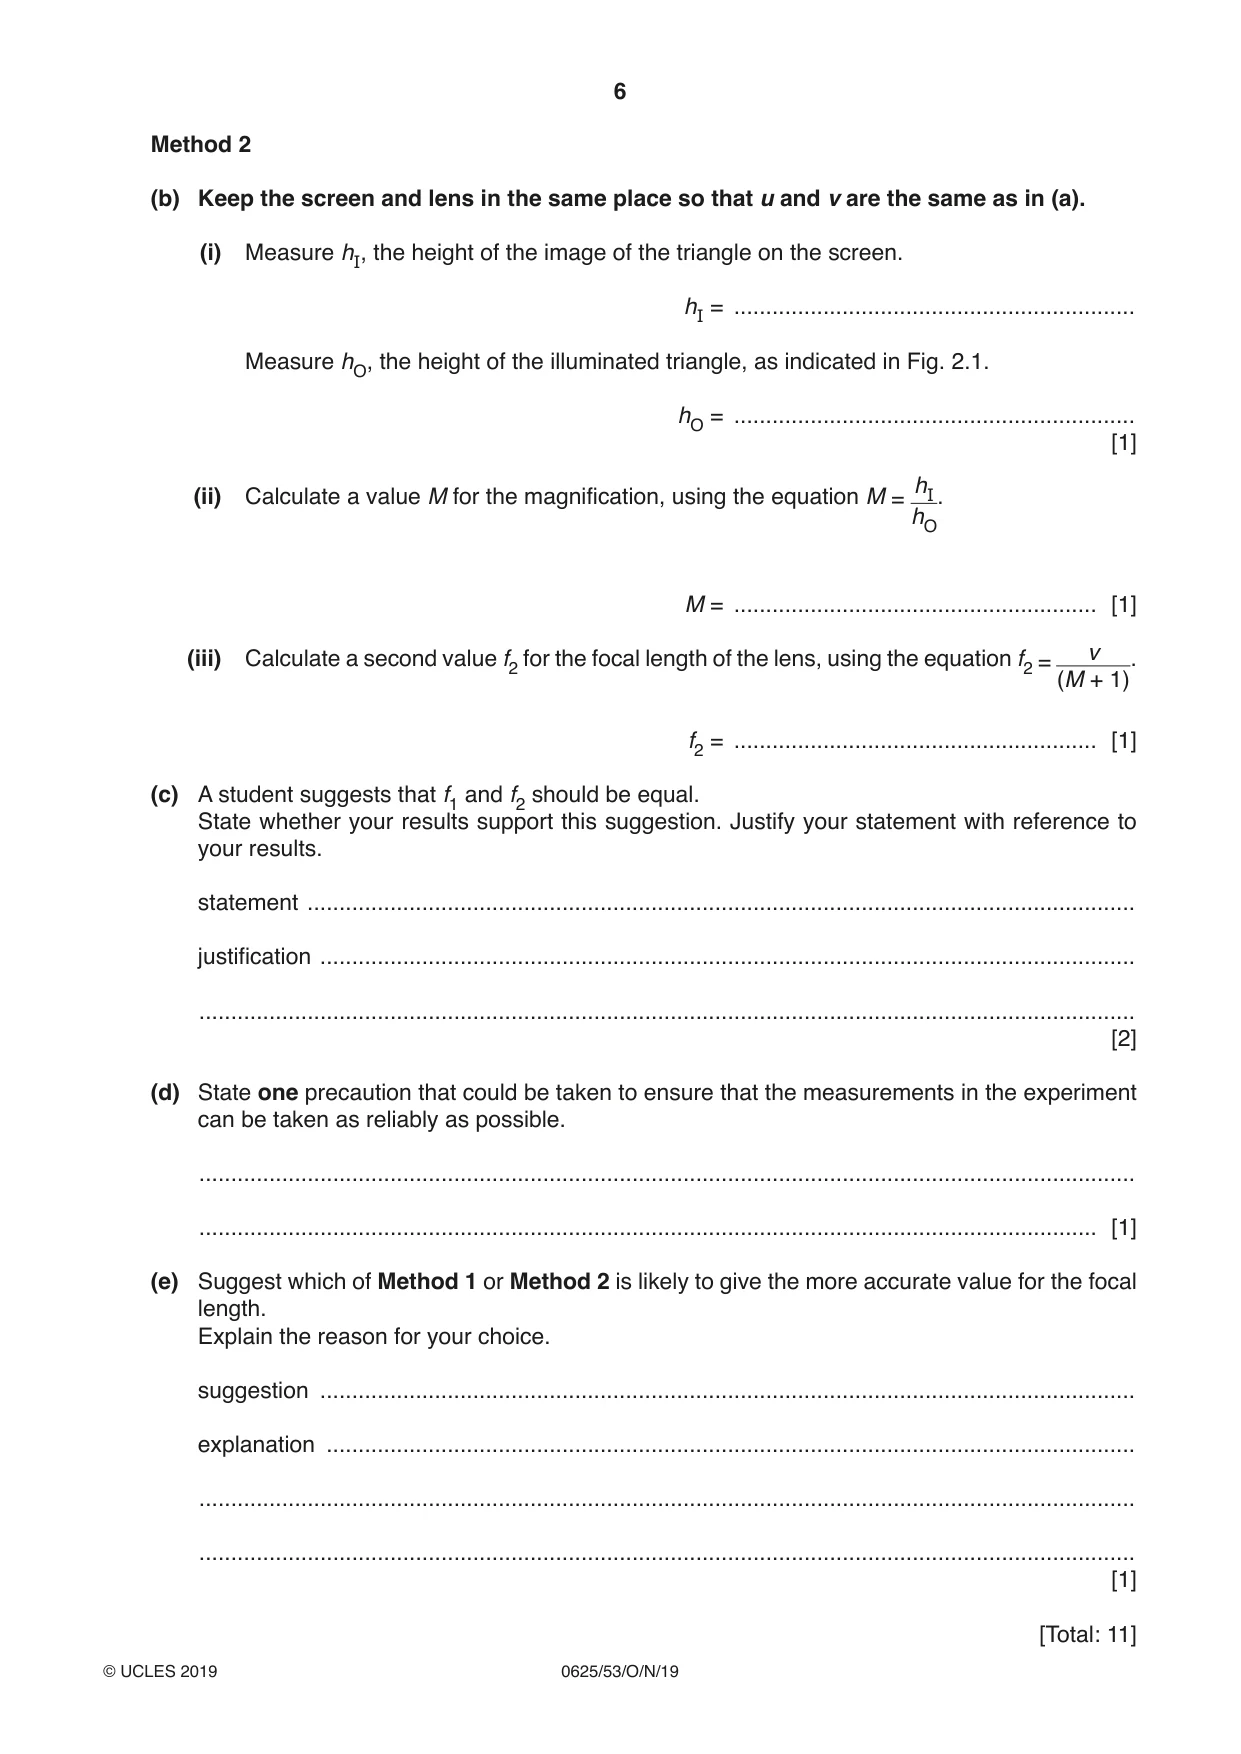
2 In this experiment you will determine the focal length of a converging lens by two different methods. Carry out the following instructions, referring to Fig. 2.1. screen Illuminated triangle u v lens hO bench Fig. 2.1 (a) • Arrange the apparatus as shown in Fig. 2.1 and switch on the lamp. • Set the distance u between the illuminated triangle and the lens to 25.0 cm. • Place the screen near the lens. • Move the screen until a sharp image of the triangle is seen on the screen. Method 1 (i) Measure the distance v between the lens and the screen as indicated in Fig. 2.1. v = ......................................................... [1] uv (ii) Calculate a value f1 for the focal length of the lens, using the equation f1 = . (u + v) f1 = ......................................................... [2] (iii) Briefly describe a technique to obtain an image on the screen that is as sharp as possible in this experiment. ........................................................................................................................................... ........................................................................................................................................... ..................................................................................................................................... [1] Method 2 (b) Keep the screen and lens in the same place so that u and v are the same as in (a). (i) Measure hI, the height of the image of the triangle on the screen. hI = ............................................................... Measure hO, the height of the illuminated triangle, as indicated in Fig. 2.1. hO = ............................................................... [1] hI (ii) Calculate a value M for the magnification, using the equation M = . hO M = ......................................................... [1] v (iii) Calculate a second value f2 for the focal length of the lens, using the equation f2 = . (M + 1) f2 = ......................................................... [1] (c) A student suggests that f1 and f2 should be equal. State whether your results support this suggestion. Justify your statement with reference to your results. statement .................................................................................................................................. justification ................................................................................................................................ ................................................................................................................................................... [2] (d) State one precaution that could be taken to ensure that the measurements in the experiment can be taken as reliably as possible. ................................................................................................................................................... ............................................................................................................................................. [1] (e) Suggest which of Method 1 or Method 2 is likely to give the more accurate value for the focal length. Explain the reason for your choice. suggestion ................................................................................................................................ explanation ............................................................................................................................... ................................................................................................................................................... ................................................................................................................................................... [1] [Total: 11]
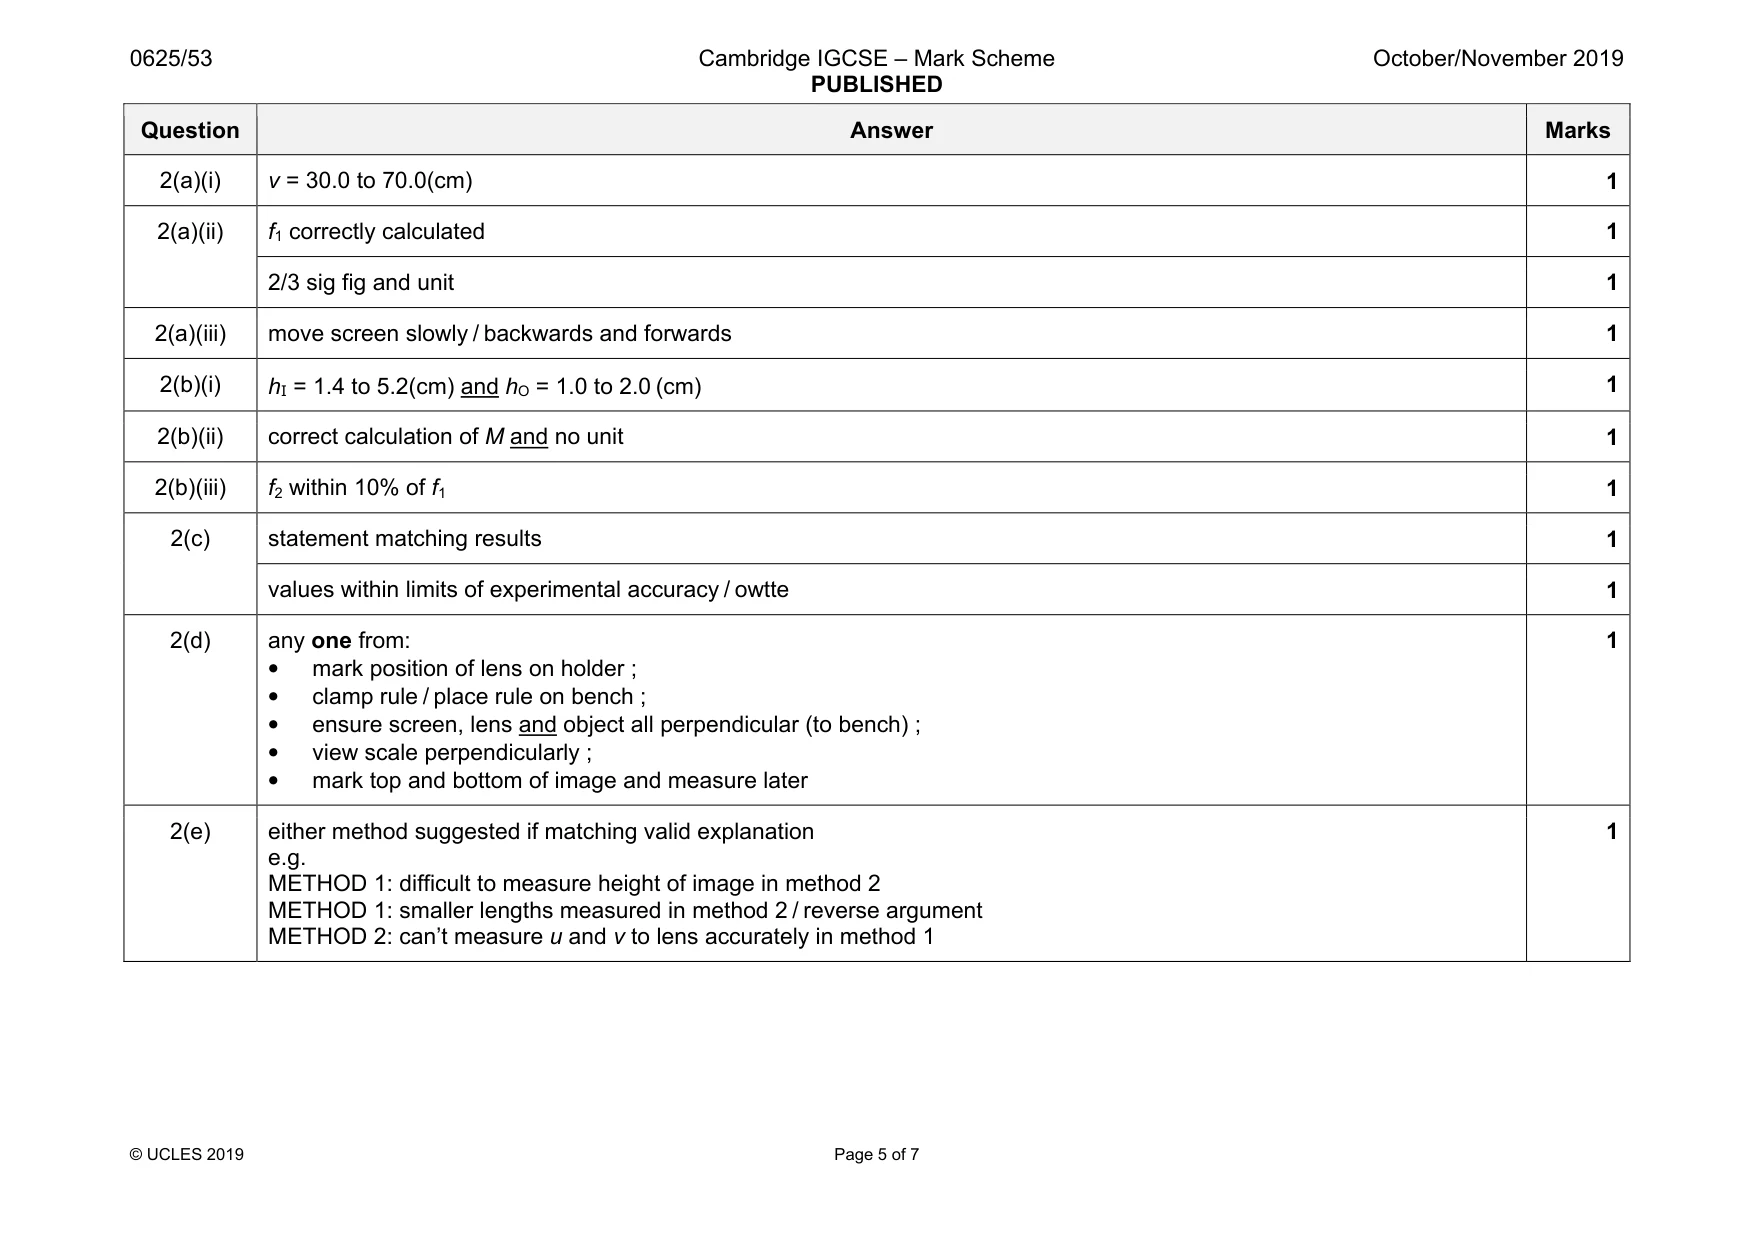
Mark scheme: 2(a)(i) v = 30.0 to 70.0(cm) 1 2(a)(ii) f1 correctly calculated 1 2/3 sig fig and unit 1 2(a)(iii) move screen slowly / backwards and forwards 1 2(b)(i) hI = 1.4 to 5.2(cm) and hO = 1.0 to 2.0 (cm) 1 2(b)(ii) correct calculation of M and no unit 1 2(b)(iii) f2 within 10% of f1 1 2(c) statement matching results 1 values within limits of experimental accuracy / owtte 1 2(d) any one from: • mark position of lens on holder ; • clamp rule / place rule on bench ; • ensure screen, lens and object all perpendicular (to bench) ; • view scale perpendicularly ; • mark top and bottom of image and measure later 1 2(e) either method suggested if matching valid explanation e.g. METHOD 1: difficult to measure height of image in method 2 METHOD 1: smaller lengths measured in method 2 / reverse argument METHOD 2: can’t measure u and v to lens accurately in method 1 1
Q3 · In this experiment you will investigate the behaviour of a spring
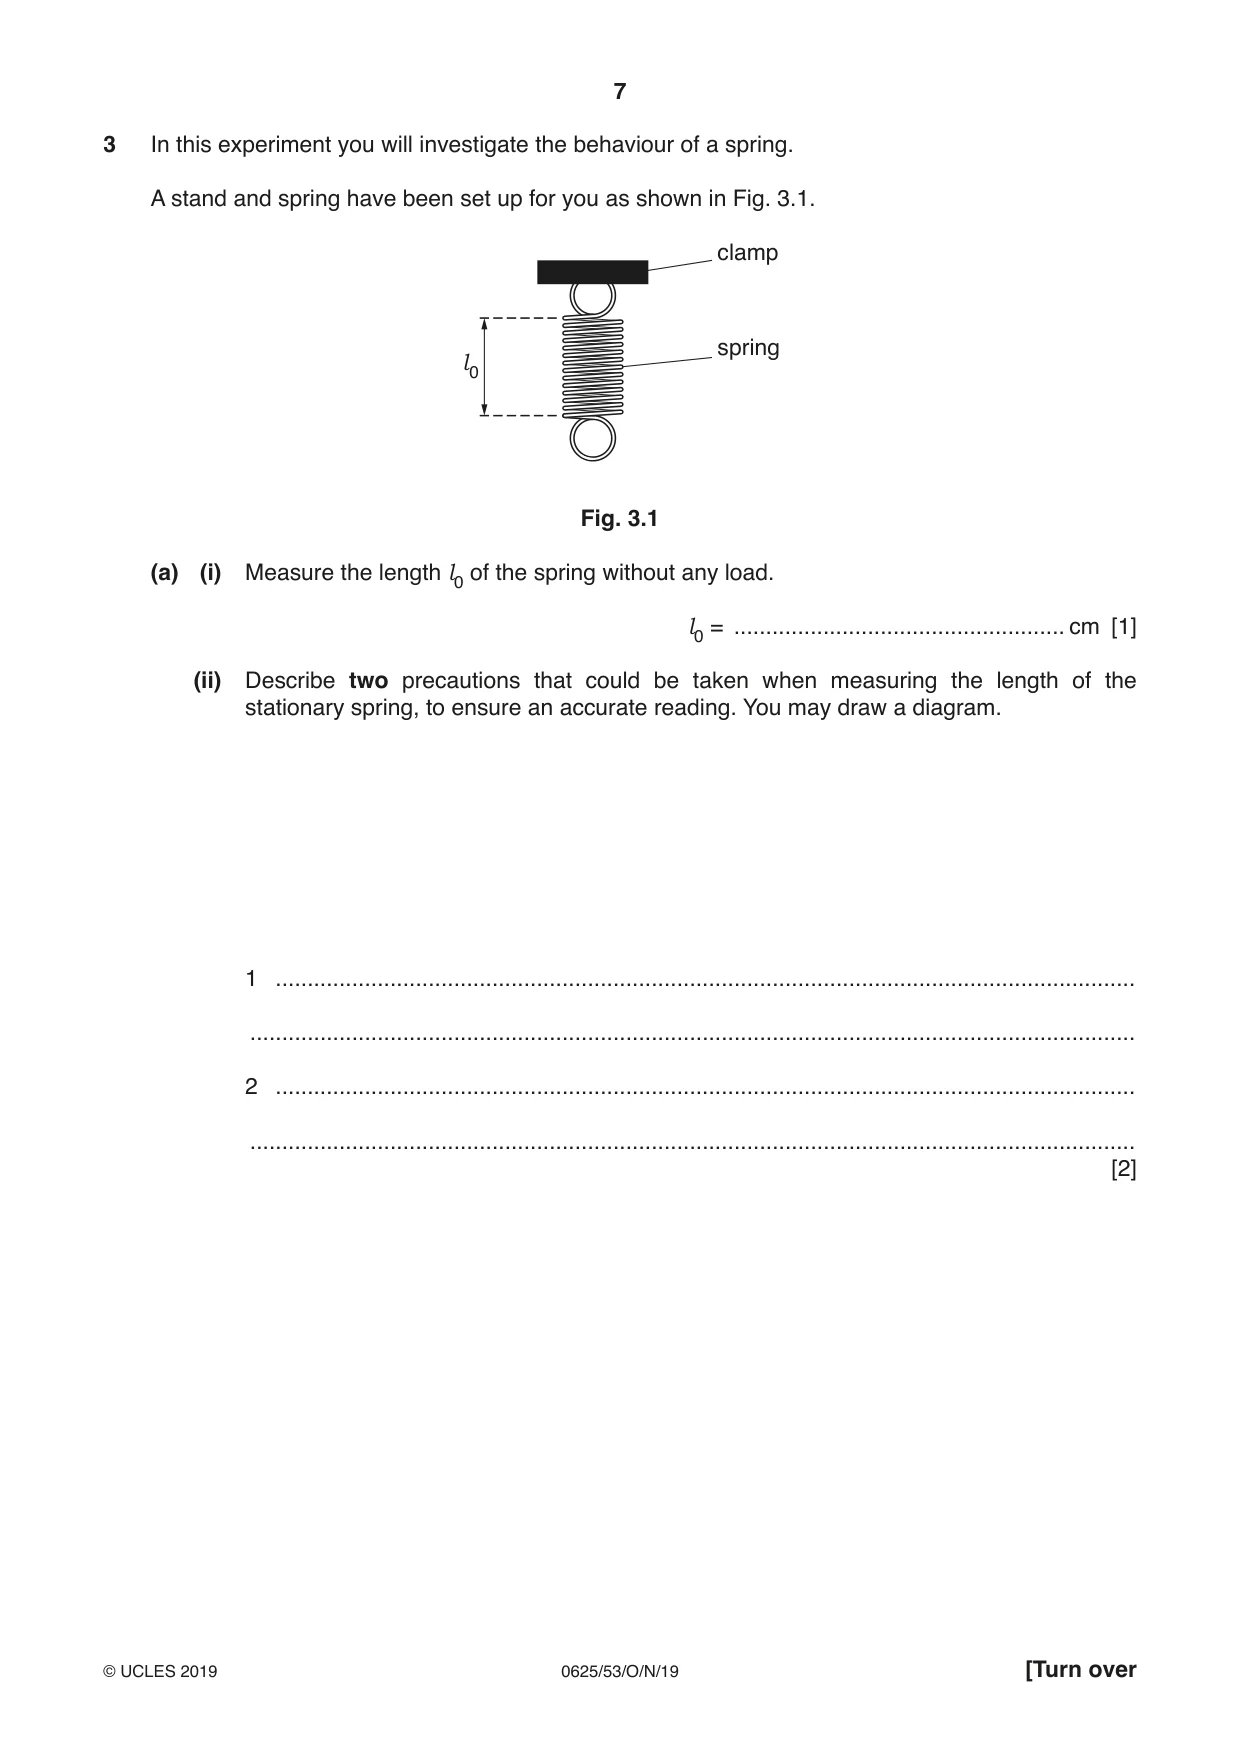
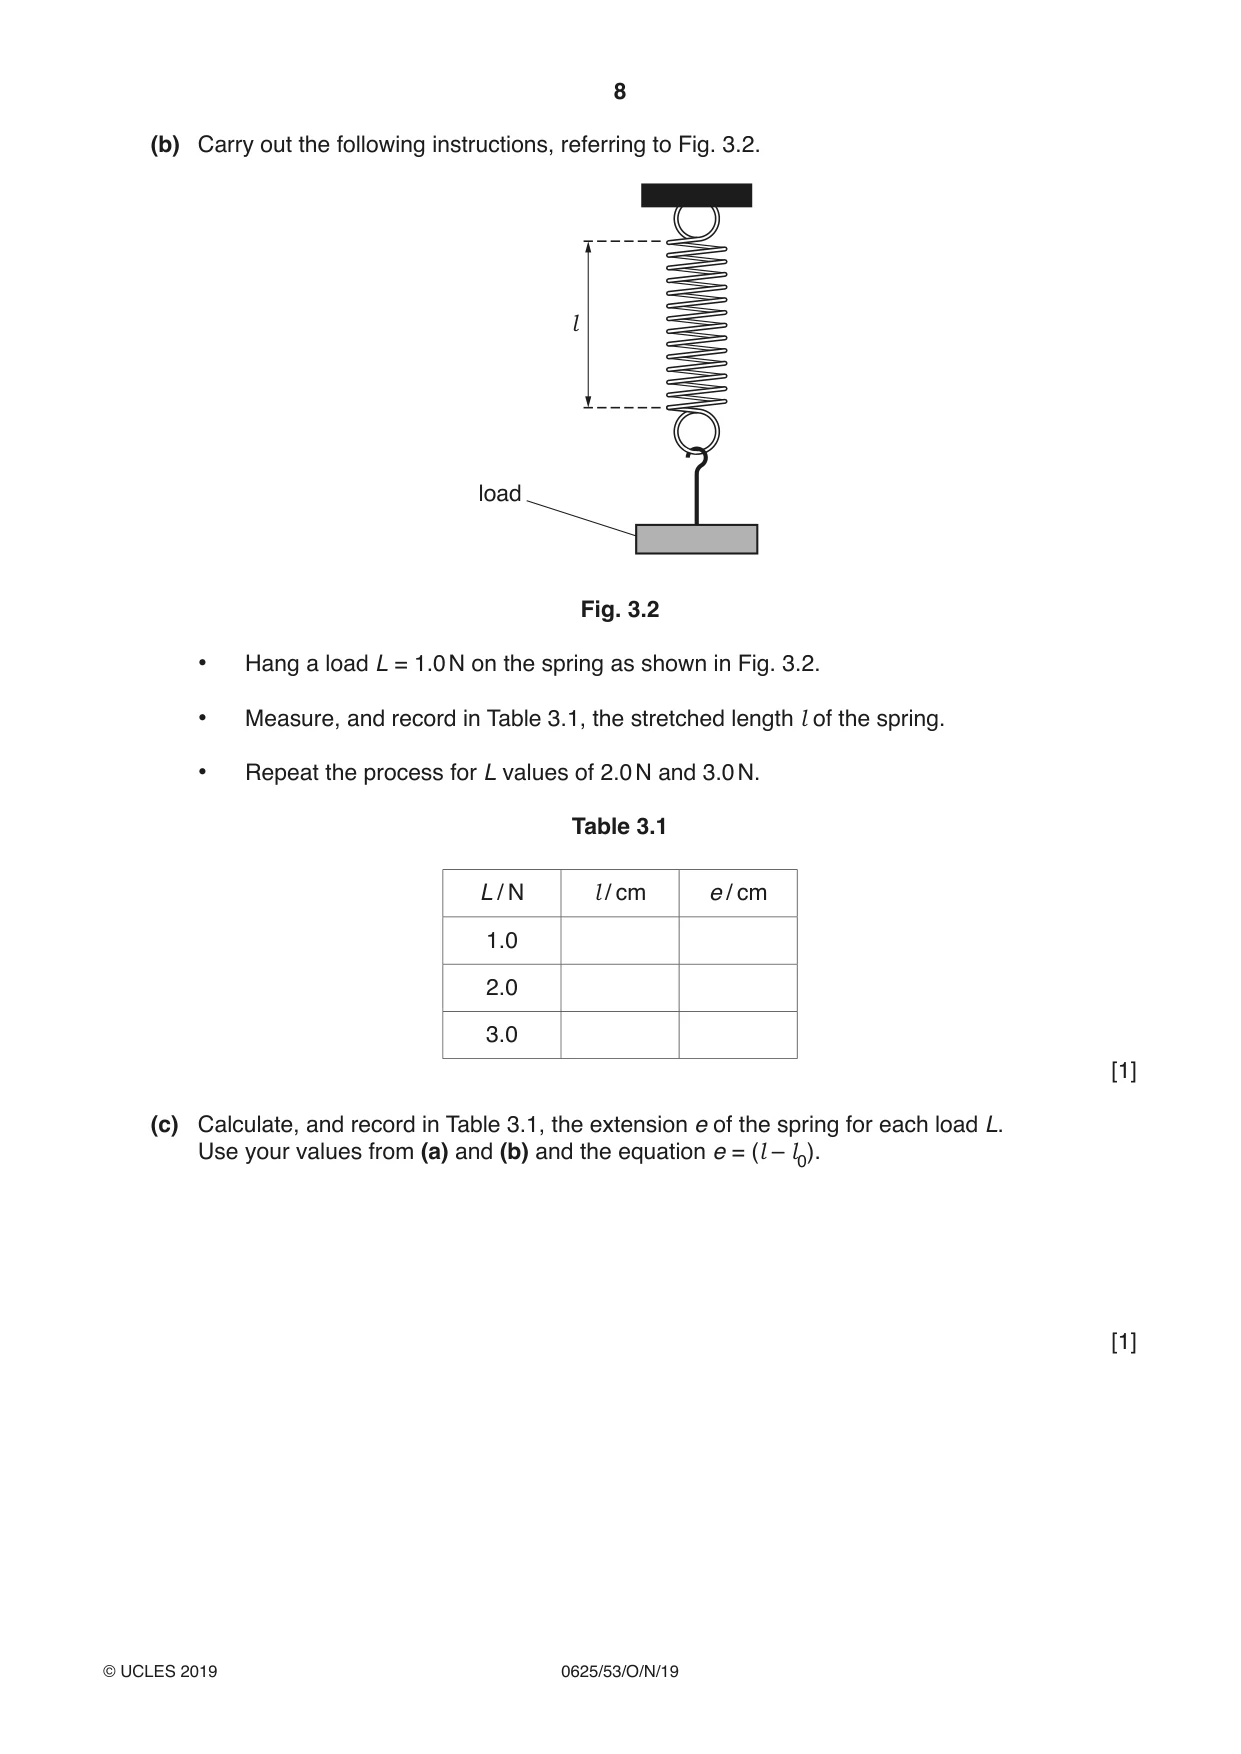
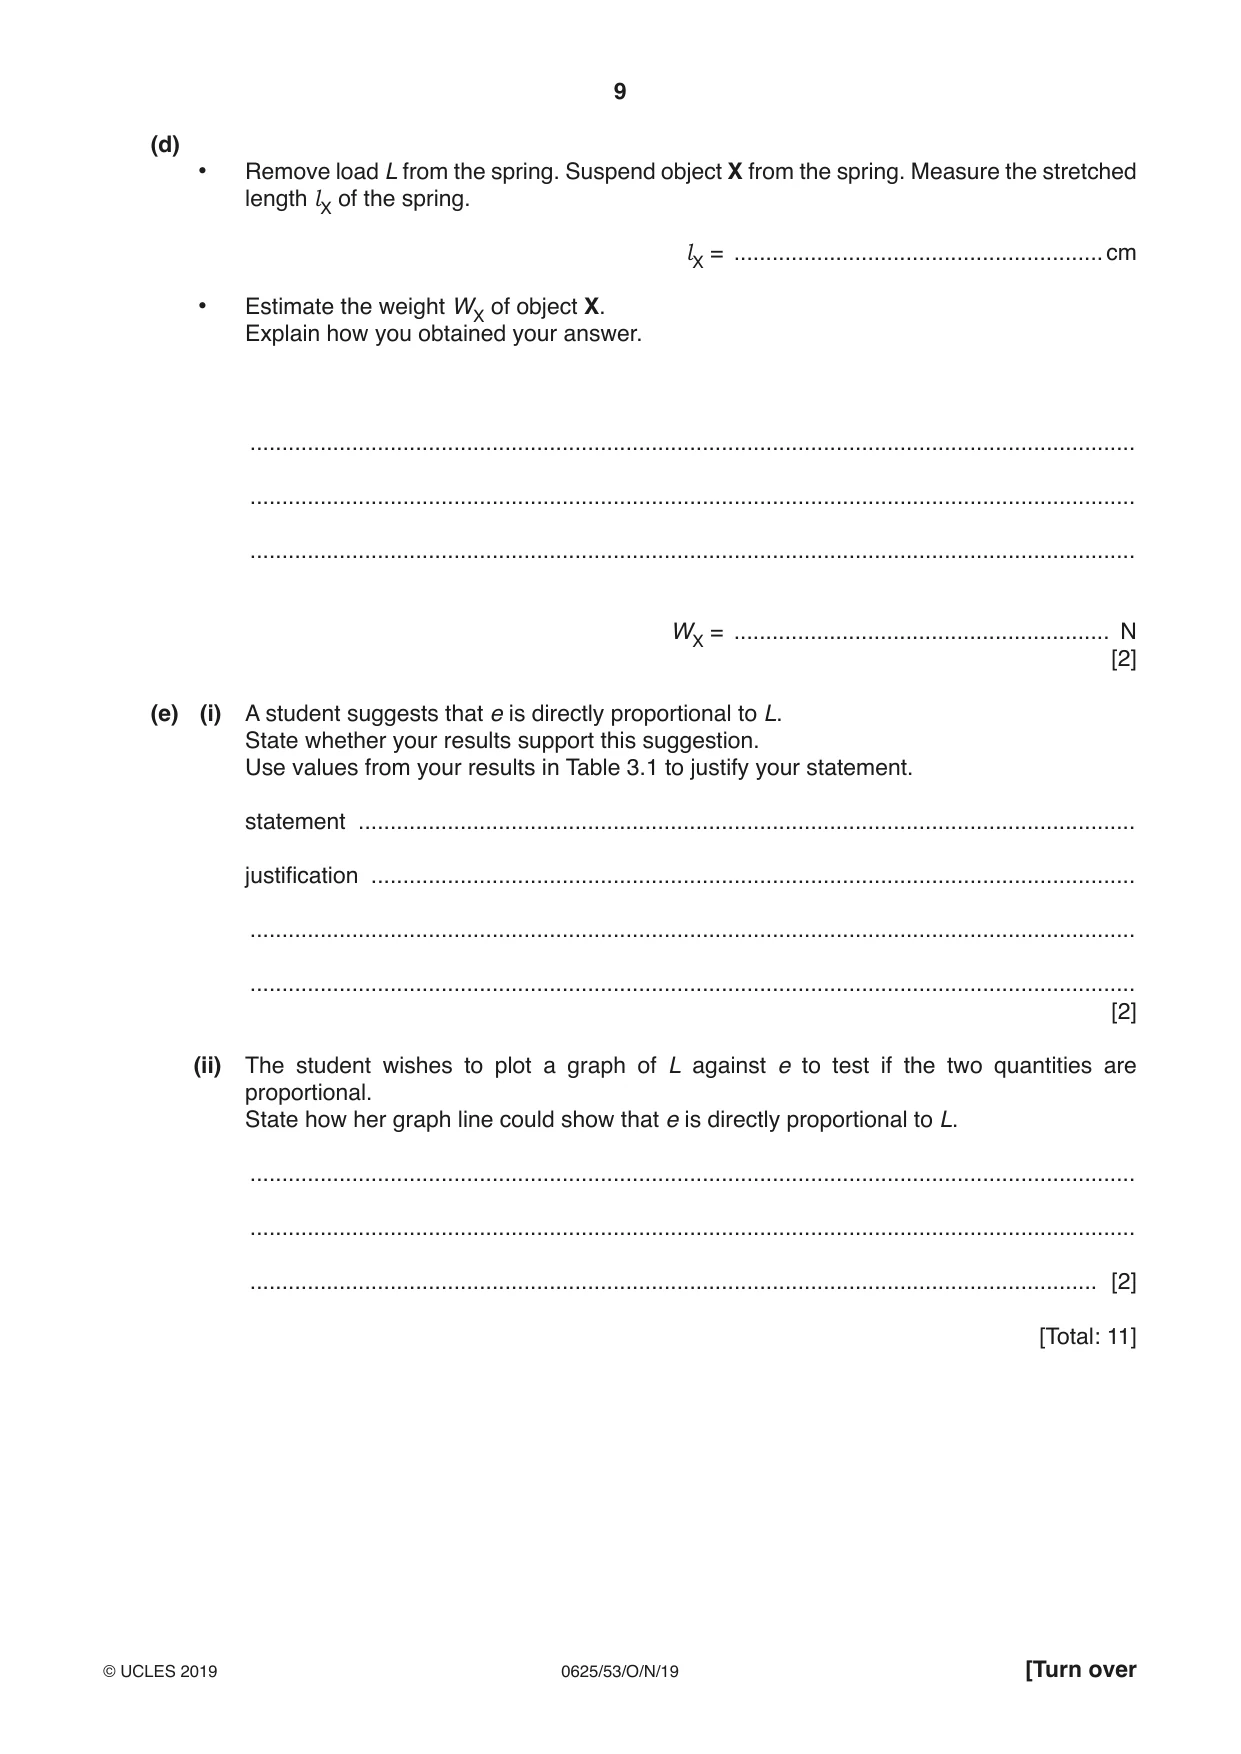
3 In this experiment you will investigate the behaviour of a spring. A stand and spring have been set up for you as shown in Fig. 3.1. clamp spring l0 Fig. 3.1 (a) (i) Measure the length l0 of the spring without any load. l0 = .................................................... cm [1] (ii) Describe two precautions that could be taken when measuring the length of the stationary spring, to ensure an accurate reading. You may draw a diagram. 1 ....................................................................................................................................... ........................................................................................................................................... 2 ....................................................................................................................................... ........................................................................................................................................... [2] (b) Carry out the following instructions, referring to Fig. 3.2. l load Fig. 3.2 • Hang a load L = 1.0 N on the spring as shown in Fig. 3.2. • Measure, and record in Table 3.1, the stretched length l of the spring. • Repeat the process for L values of 2.0 N and 3.0 N. Table 3.1 L / N l / cm e / cm 1.0 2.0 3.0 [1] (c) Calculate, and record in Table 3.1, the extension e of the spring for each load L. Use your values from (a) and (b) and the equation e = (l – l0). [1] (d) • Remove load L from the spring. Suspend object X from the spring. Measure the stretched length lX of the spring. lX = ..........................................................cm • Estimate the weight WX of object X. Explain how you obtained your answer. ........................................................................................................................................... ........................................................................................................................................... ........................................................................................................................................... WX = ........................................................... N [2] (e) (i) A student suggests that e is directly proportional to L. State whether your results support this suggestion. Use values from your results in Table 3.1 to justify your statement. statement .......................................................................................................................... justification ........................................................................................................................ ........................................................................................................................................... ........................................................................................................................................... [2] (ii) The student wishes to plot a graph of L against e to test if the two quantities are proportional. State how her graph line could show that e is directly proportional to L. ........................................................................................................................................... ........................................................................................................................................... ..................................................................................................................................... [2] [Total: 11]
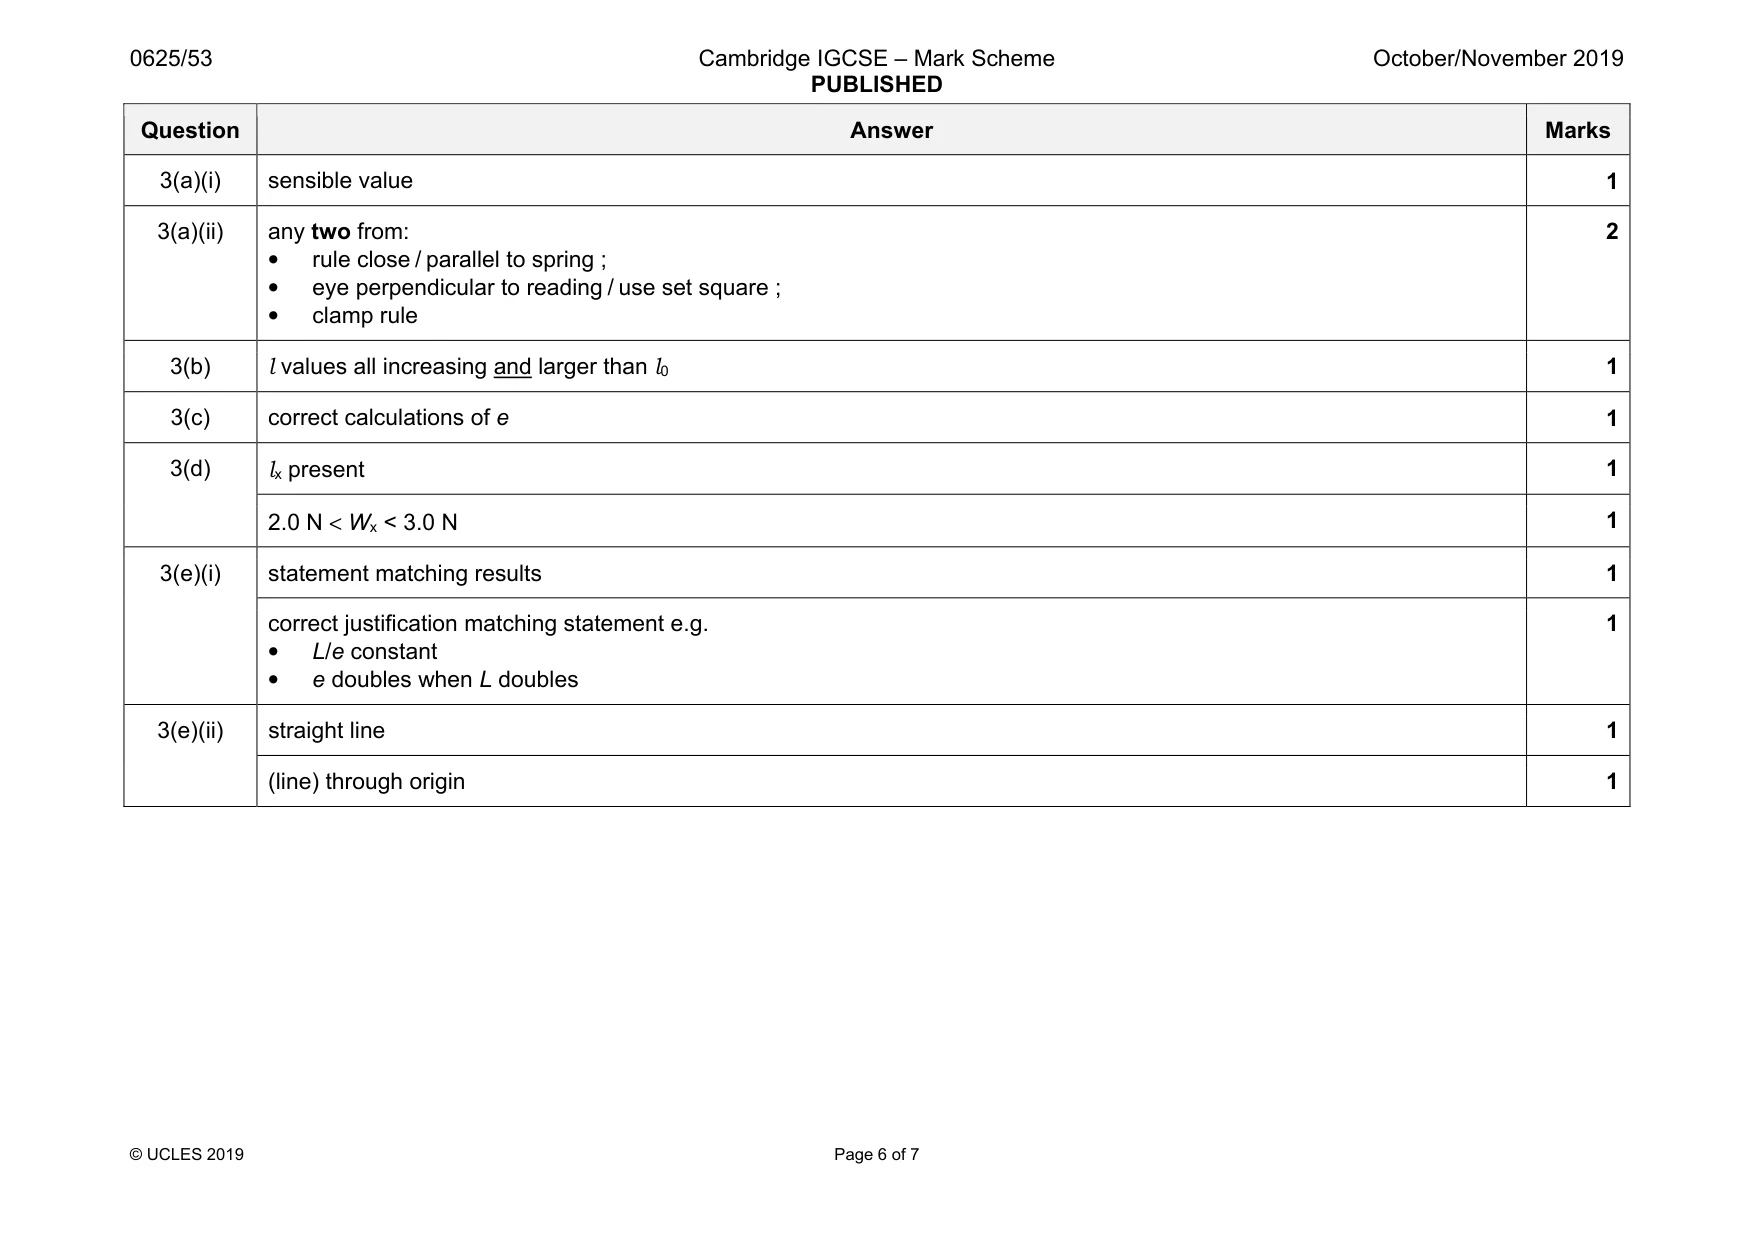
Mark scheme: 3(a)(i) sensible value 1 3(a)(ii) any two from: • rule close / parallel to spring ; • eye perpendicular to reading / use set square ; • clamp rule 2 3(b) l values all increasing and larger than l0 1 3(c) correct calculations of e 1 3(d) lx present 1 2.0 N < Wx < 3.0 N 1 3(e)(i) statement matching results 1 correct justification matching statement e.g. • L/e constant • e doubles when L doubles 1 3(e)(ii) straight line 1 (line) through origin 1
Q4 · A student is investigating ways of slowing the rate of cooling of hot liquids in a…
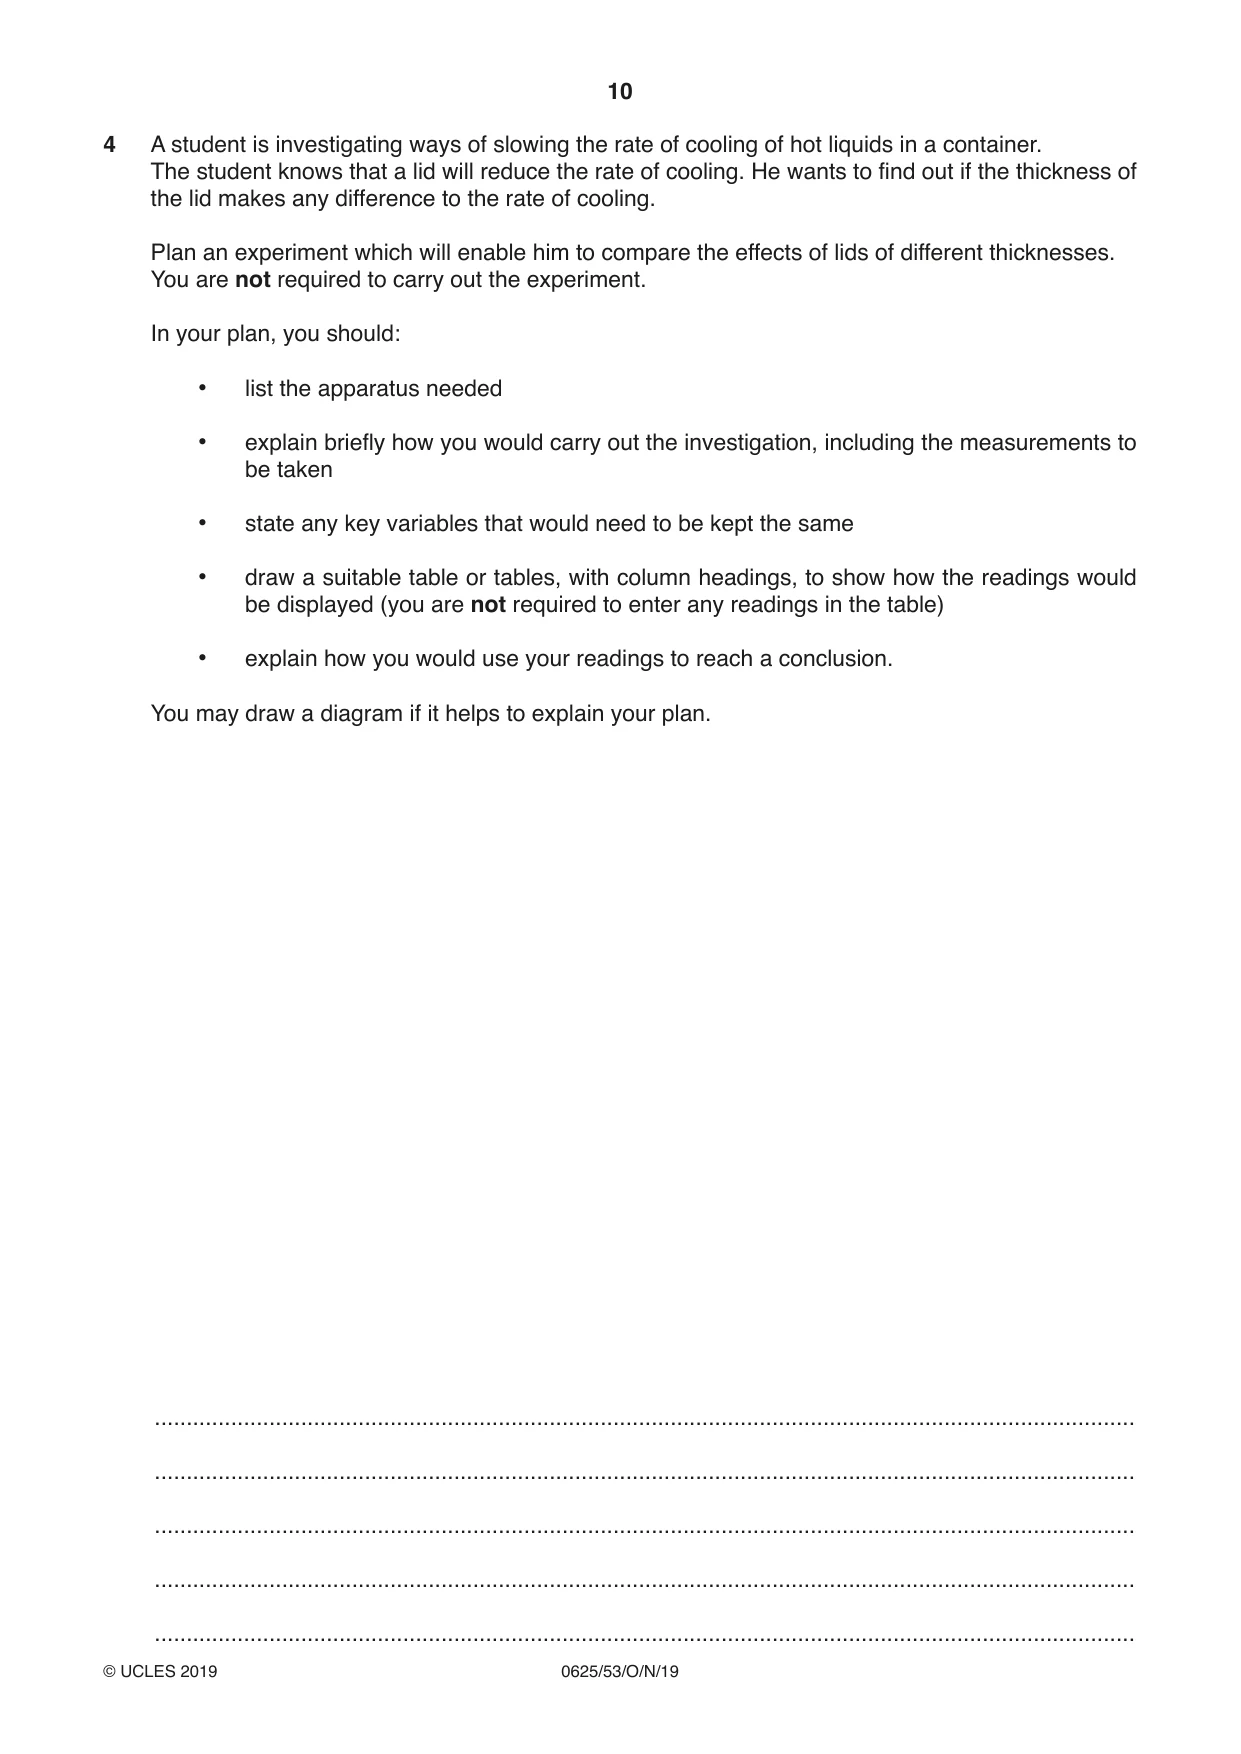
4 A student is investigating ways of slowing the rate of cooling of hot liquids in a container. The student knows that a lid will reduce the rate of cooling. He wants to find out if the thickness of the lid makes any difference to the rate of cooling. Plan an experiment which will enable him to compare the effects of lids of different thicknesses. You are not required to carry out the experiment. In your plan, you should: • list the apparatus needed • explain briefly how you would carry out the investigation, including the measurements to be taken • state any key variables that would need to be kept the same • draw a suitable table or tables, with column headings, to show how the readings would be displayed (you are not required to enter any readings in the table) • explain how you would use your readings to reach a conclusion. You may draw a diagram if it helps to explain your plan. .......................................................................................................................................................... .......................................................................................................................................................... .......................................................................................................................................................... .......................................................................................................................................................... .......................................................................................................................................................... .......................................................................................................................................................... .......................................................................................................................................................... .......................................................................................................................................................... .......................................................................................................................................................... .......................................................................................................................................................... .......................................................................................................................................................... .......................................................................................................................................................... .......................................................................................................................................................... .......................................................................................................................................................... .......................................................................................................................................................... .......................................................................................................................................................... .......................................................................................................................................................... .......................................................................................................................................................... .......................................................................................................................................................... .......................................................................................................................................................... .......................................................................................................................................................... .......................................................................................................................................................... .......................................................................................................................................................... .......................................................................................................................................................... .......................................................................................................................................................... .......................................................................................................................................................... .......................................................................................................................................................... .......................................................................................................................................................... .................................................................................................................................................... [7] [Total: 7]
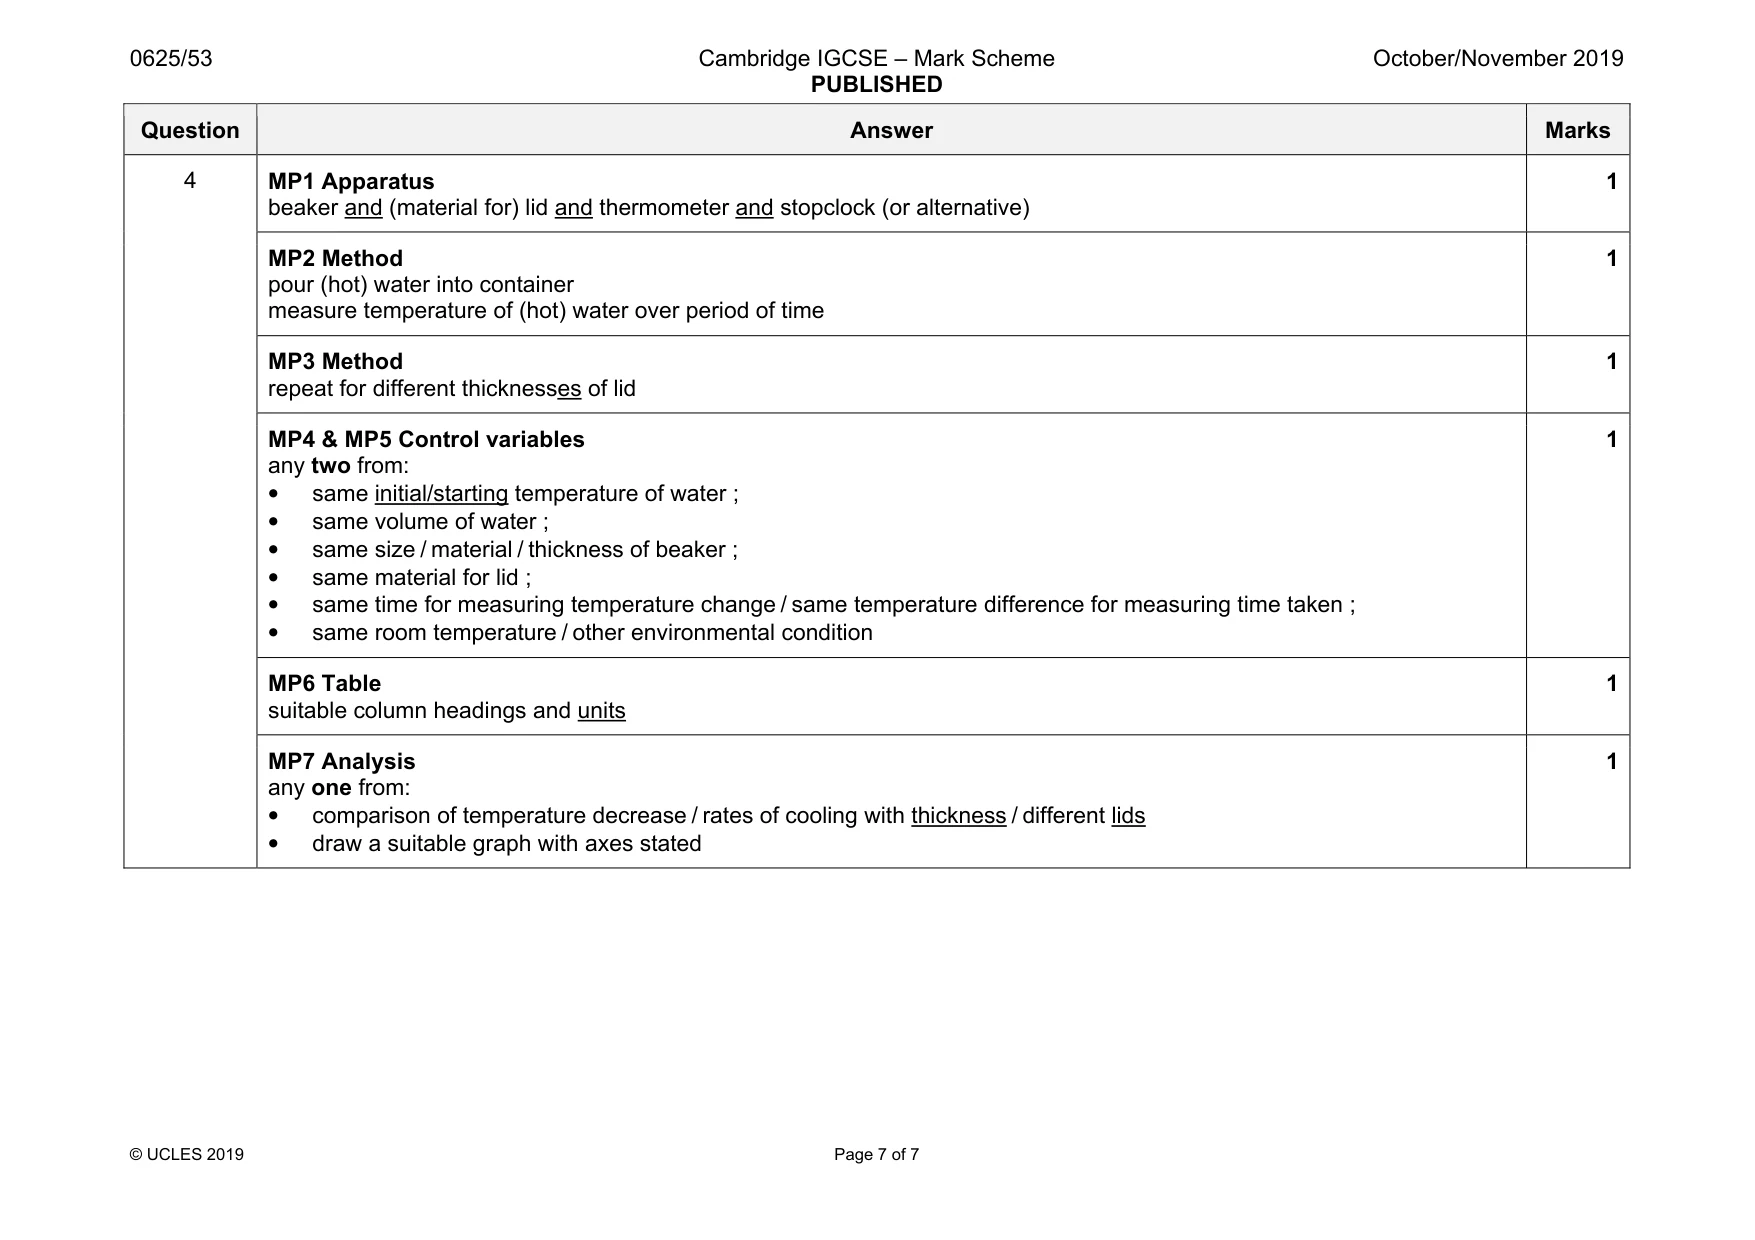
Mark scheme: 4 MP1 Apparatus beaker and (material for) lid and thermometer and stopclock (or alternative) 1 MP2 Method pour (hot) water into container measure temperature of (hot) water over period of time 1 MP3 Method repeat for different thicknesses of lid 1 MP4 & MP5 Control variables any two from: • same initial/starting temperature of water ; • same volume of water ; • same size / material / thickness of beaker ; • same material for lid ; • same time for measuring temperature change / same temperature difference for measuring time taken ; • same room temperature / other environmental condition 1 MP6 Table suitable column headings and units 1 MP7 Analysis any one from: • comparison of temperature decrease / rates of cooling with thickness / different lids • draw a suitable graph with axes stated 1
What was in this paper
The subtopics covered by these 4 questions, and how many questions each got. Open one in a new tab to see every Cambridge question on it.
What you needed in this session
Cambridge’s own grade thresholds for 2019 Oct/Nov, Paper 5 · Variant 3. A higher threshold means an easier paper — the bar moves with how the cohort did.