Cambridge IGCSE Physics 0625 — 2018 Oct/Nov Paper 6 · Variant 3
0625/63/O/N/18 · 4 questions · 40 marks · ≈45 min
The question paper and its mark scheme, free to read here and free to download. This is Cambridge’s own paper, exactly as it was sat.
Question paper16 pages



Mark scheme7 pages
Answers below. Sit the paper first if you are practising.
Questions as text
Q1 · A student is determining the density of modelling clay
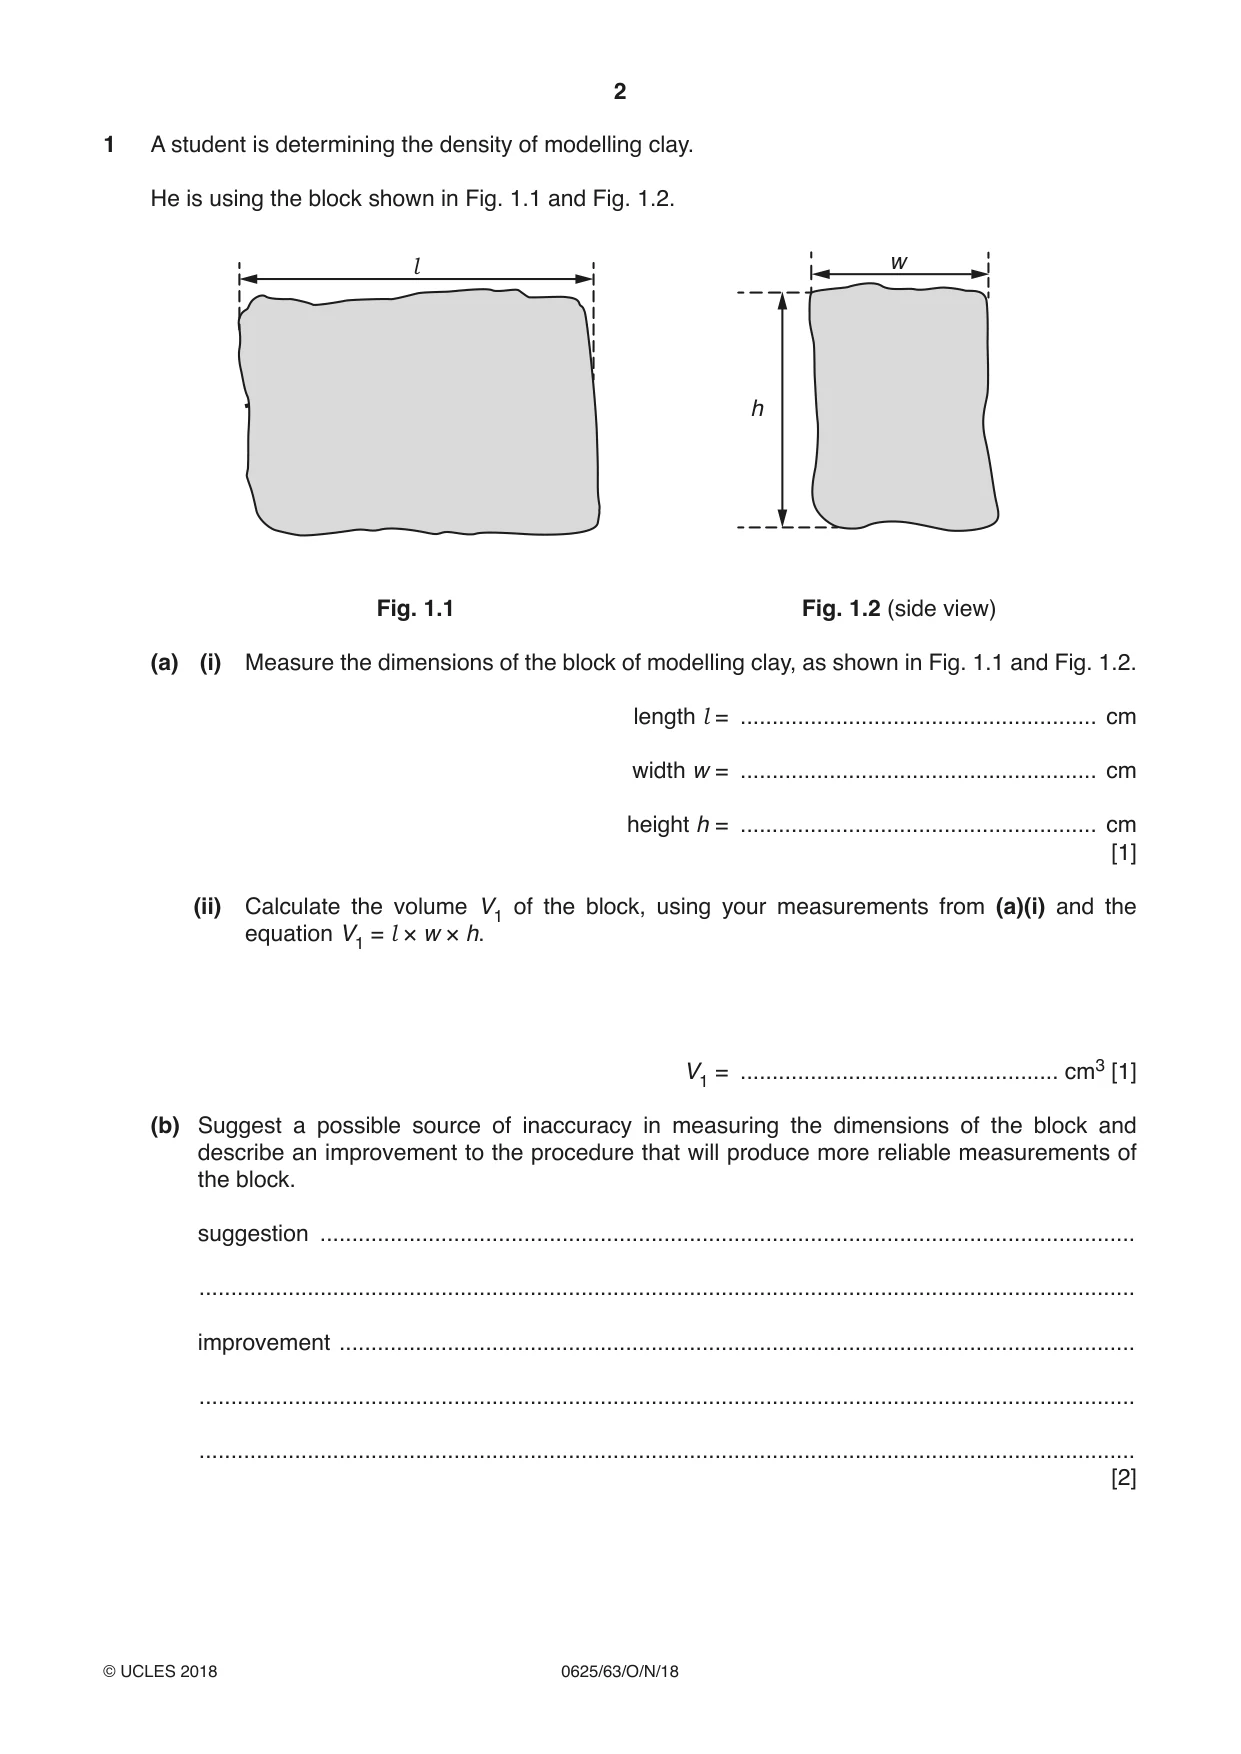
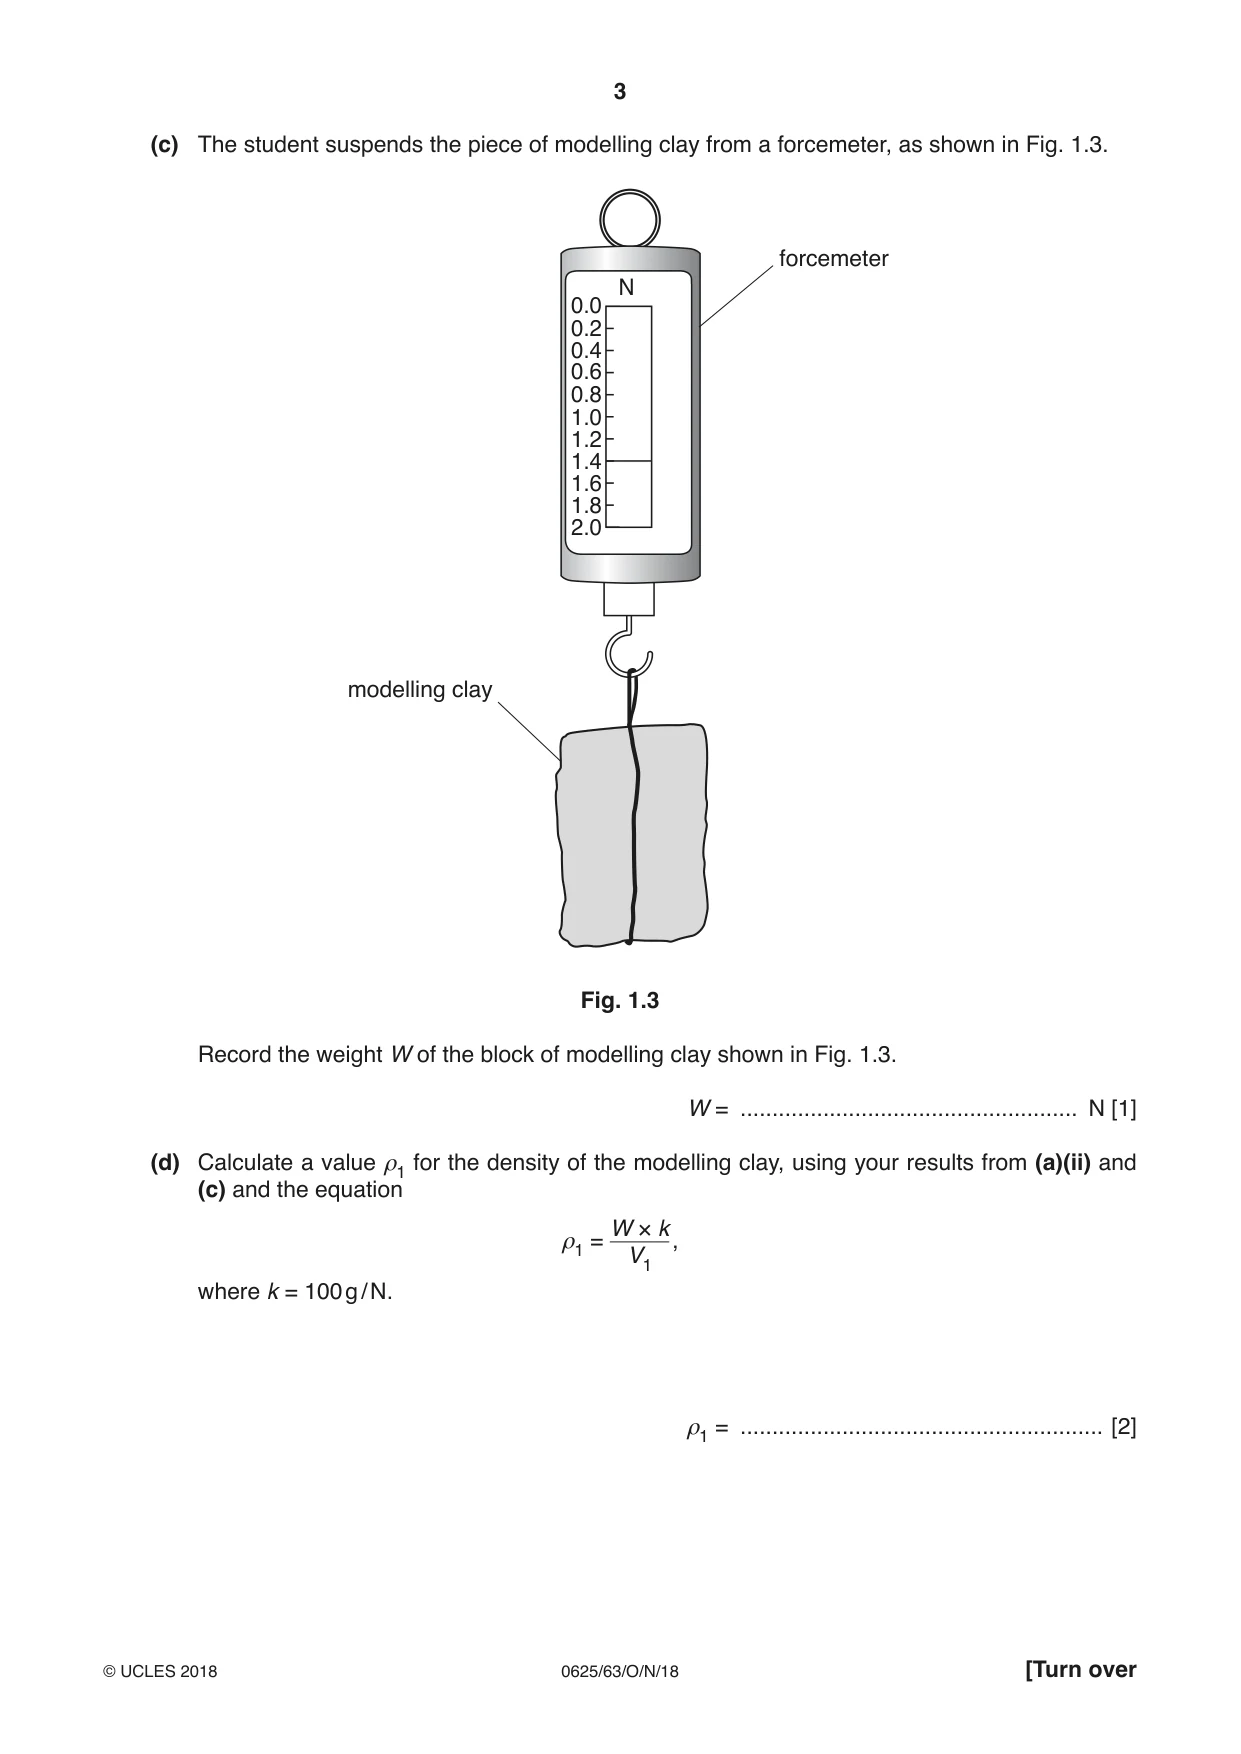
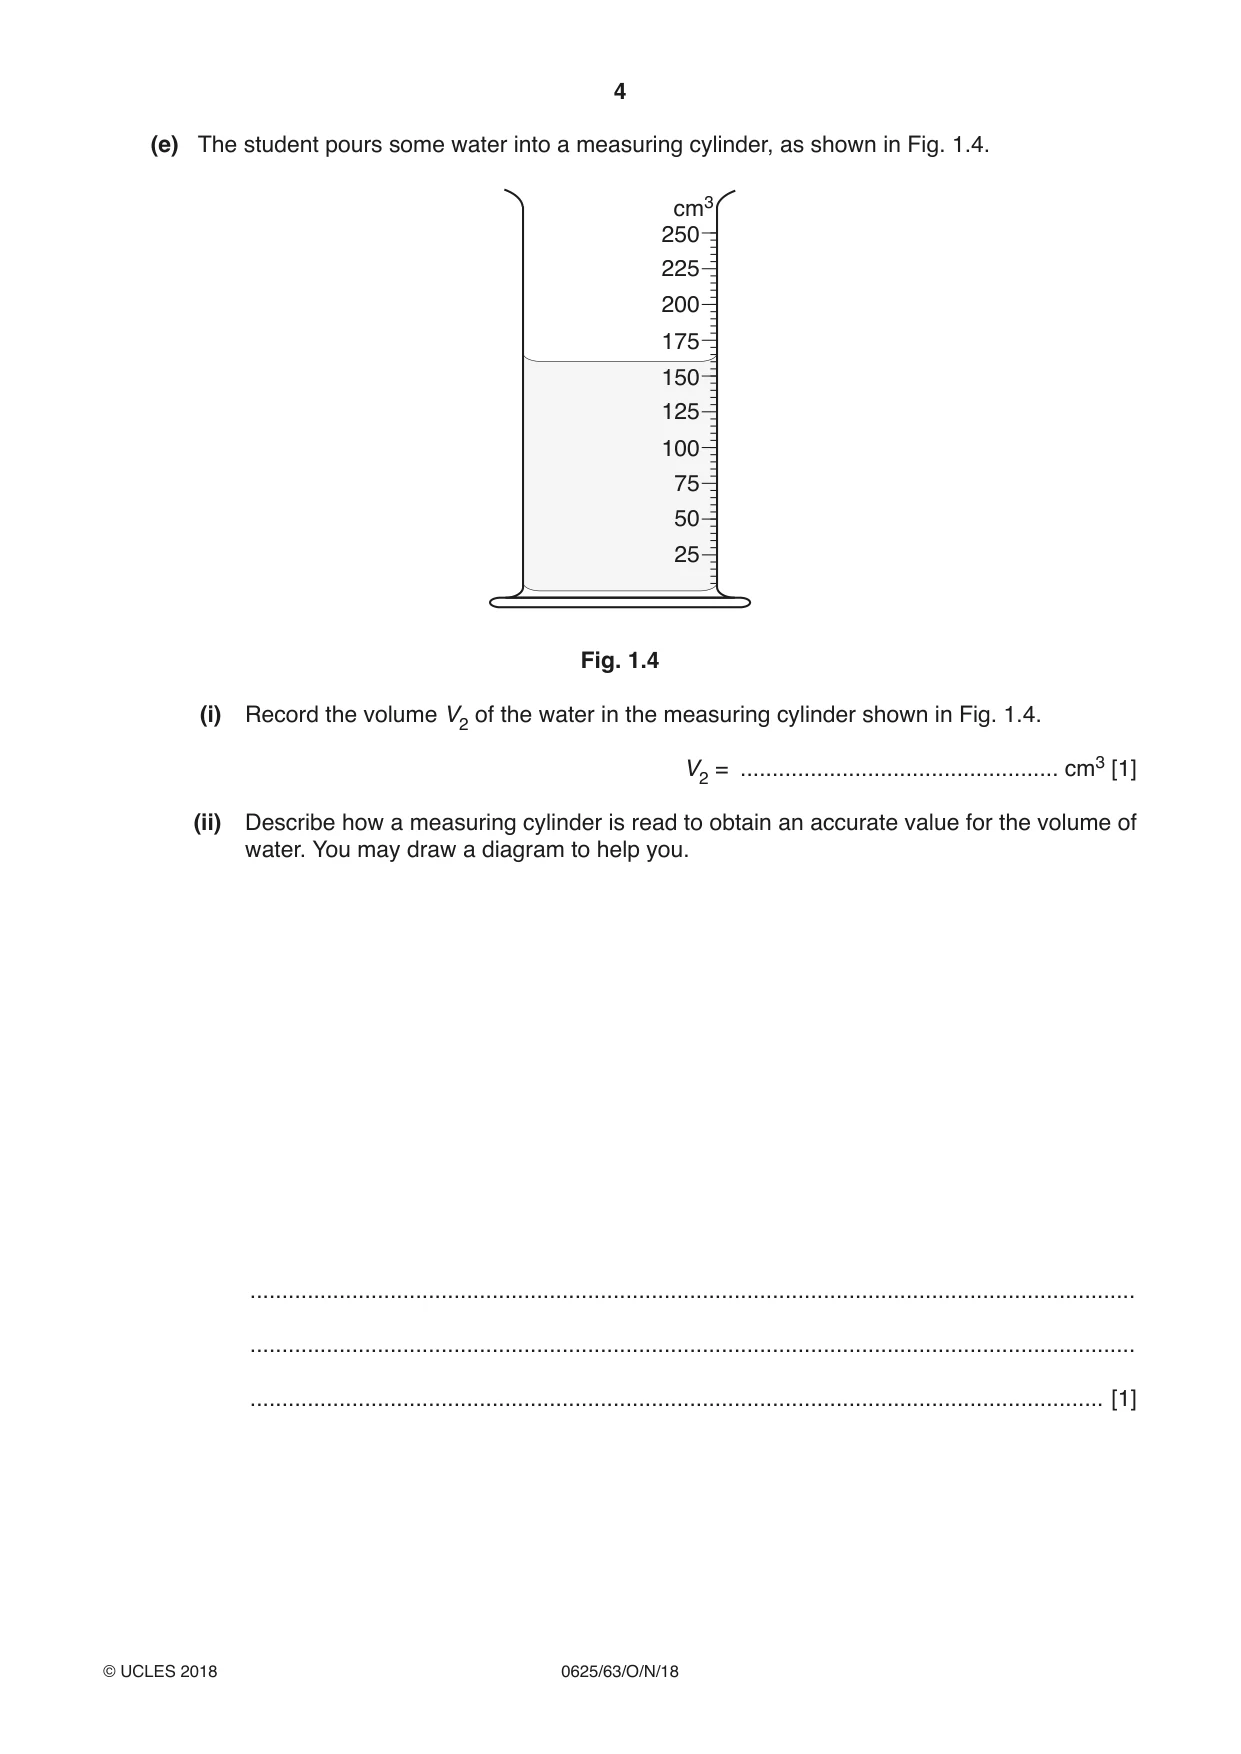
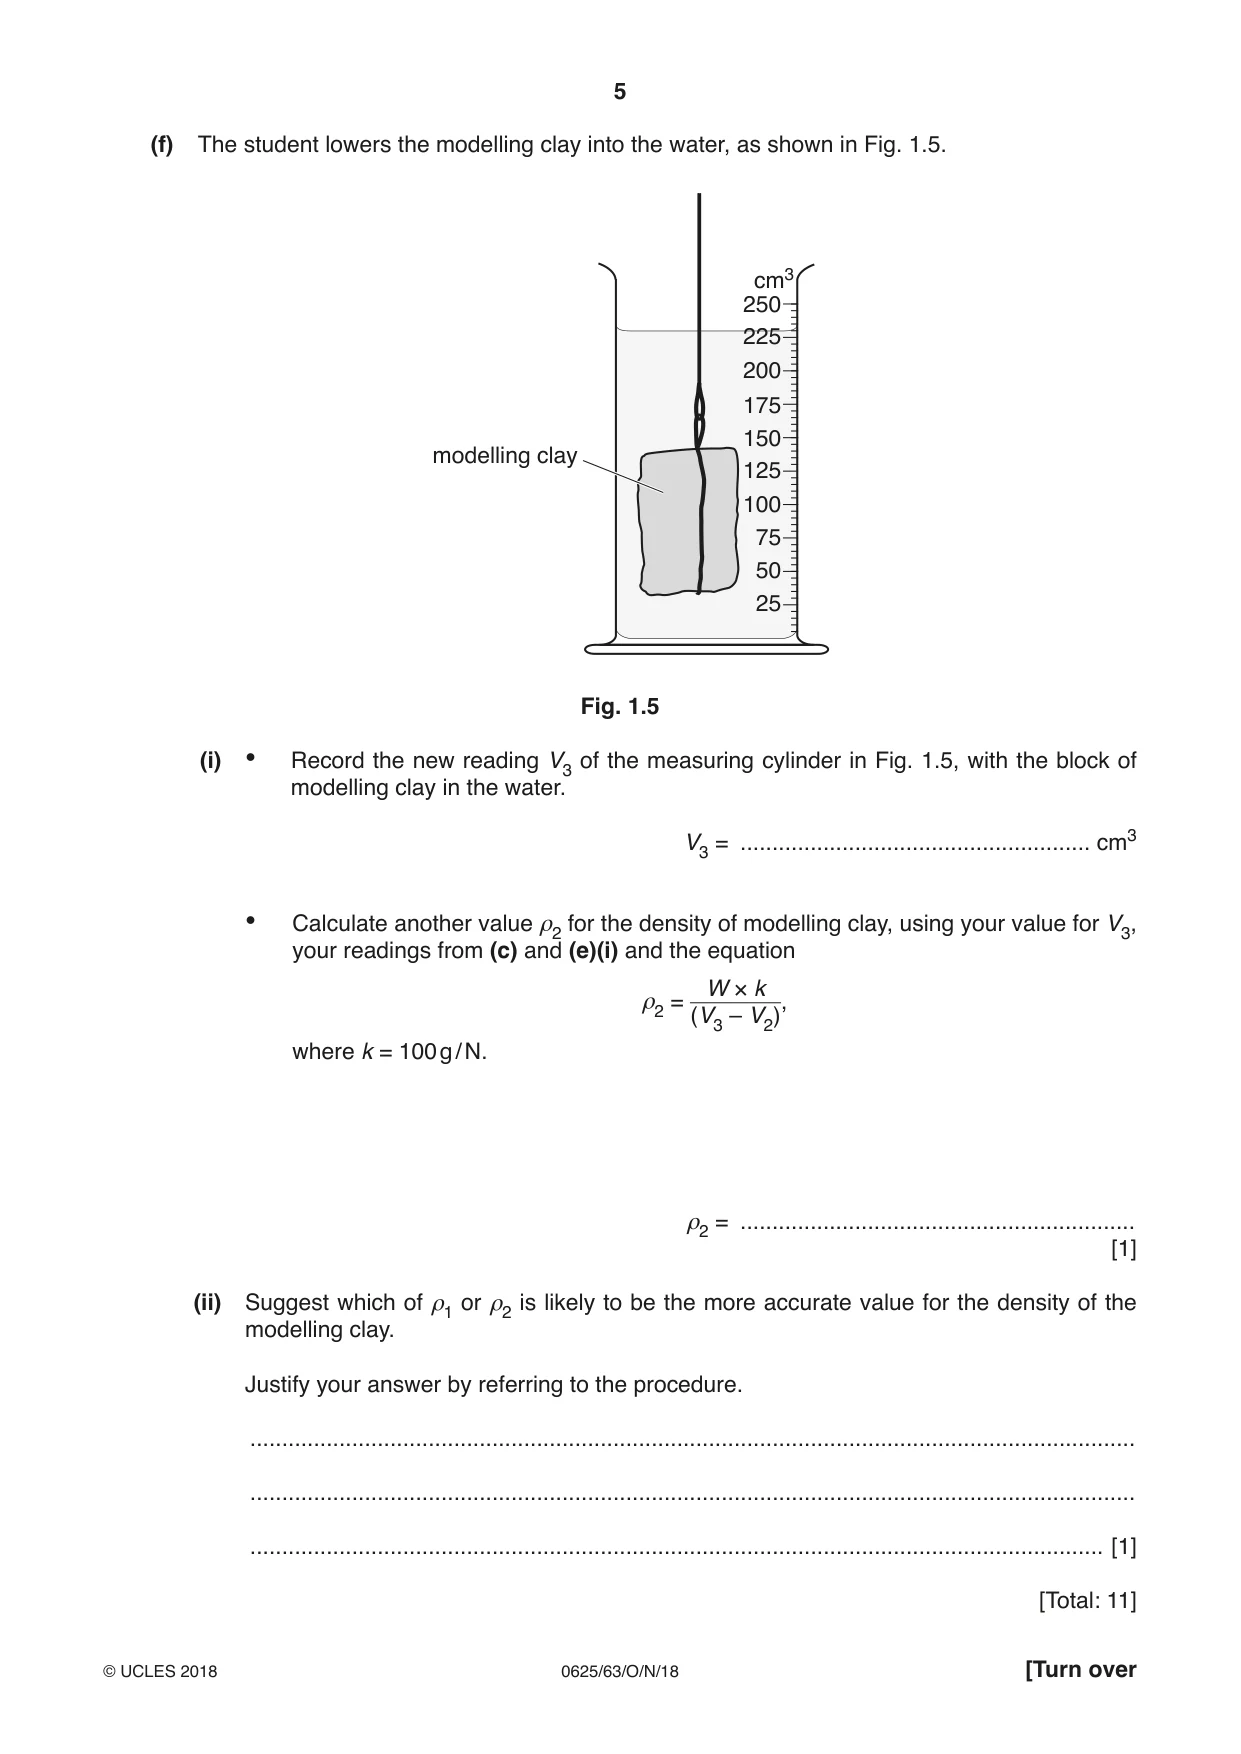
1 A student is determining the density of modelling clay. He is using the block shown in Fig. 1.1 and Fig. 1.2. l w h Fig. 1.1 Fig. 1.2 (side view) (a) (i) Measure the dimensions of the block of modelling clay, as shown in Fig. 1.1 and Fig. 1.2. length l = ........................................................ cm width w = ........................................................ cm height h = ........................................................ cm [1] (ii) Calculate the volume V1 of the block, using your measurements from (a)(i) and the equation V1 = l × w × h. V1 = .................................................. cm3 [1] (b) Suggest a possible source of inaccuracy in measuring the dimensions of the block and describe an improvement to the procedure that will produce more reliable measurements of the block. suggestion ................................................................................................................................ ................................................................................................................................................... improvement ............................................................................................................................. ................................................................................................................................................... ................................................................................................................................................... [2] (c) The student suspends the piece of modelling clay from a forcemeter, as shown in Fig. 1.3. forcemeter N 0.0 0.2 0.4 0.6 0.8 1.0 1.2 1.4 1.6 1.8 2.0 modelling clay Fig. 1.3 Record the weight W of the block of modelling clay shown in Fig. 1.3. W = ..................................................... N [1] (d) Calculate a value ρ1 for the density of the modelling clay, using your results from (a)(ii) and (c) and the equation W × k ρ1 = , V1 where k = 100 g / N. ρ1 = ......................................................... [2] (e) The student pours some water into a measuring cylinder, as shown in Fig. 1.4. cm3 250 225 200 175 150 125 100 75 50 25 Fig. 1.4 (i) Record the volume V2 of the water in the measuring cylinder shown in Fig. 1.4. V2 = .................................................. cm3 [1] (ii) Describe how a measuring cylinder is read to obtain an accurate value for the volume of water. You may draw a diagram to help you. ........................................................................................................................................... ........................................................................................................................................... ...................................................................................................................................... [1] (f) The student lowers the modelling clay into the water, as shown in Fig. 1.5. cm3 250 225 200 175 150 modelling clay 125 100 75 50 25 Fig. 1.5 (i) • Record the new reading V3 of the measuring cylinder in Fig. 1.5, with the block of modelling clay in the water. V3 = ....................................................... cm3 • Calculate another value ρ2 for the density of modelling clay, using your value for V3, your readings from (c) and (e)(i) and the equation W × k ρ2 = (V3 – V2), where k = 100 g / N. ρ2 = .............................................................. [1] (ii) Suggest which of ρ1 or ρ2 is likely to be the more accurate value for the density of the modelling clay. Justify your answer by referring to the procedure. ........................................................................................................................................... ........................................................................................................................................... ...................................................................................................................................... [1] [Total: 11]
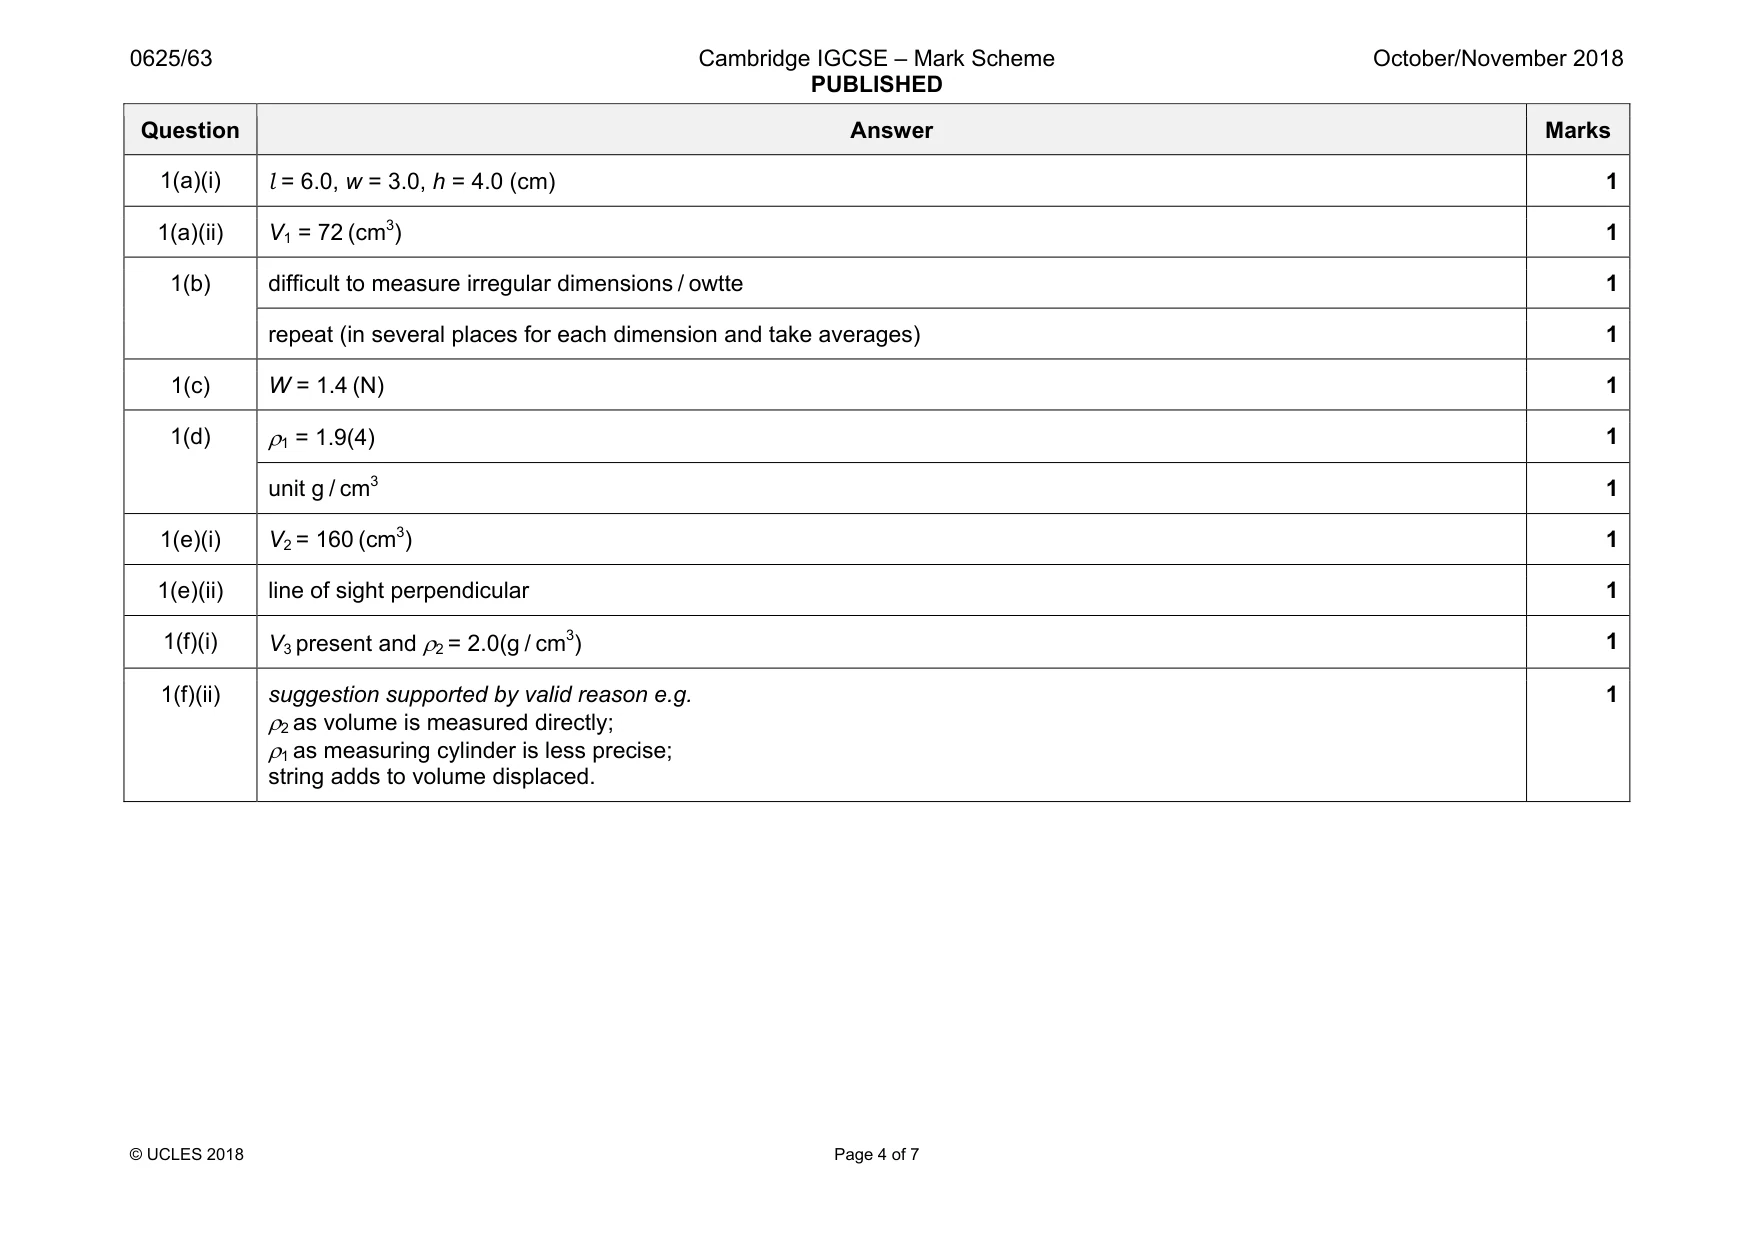
Mark scheme: 1(a)(i) 1 1(a)(ii) V1 = 72 (cm3) 1 1(b) difficult to measure irregular dimensions / owtte 1 repeat (in several places for each dimension and take averages) 1 1(c) W = 1.4 (N) 1 1(d) ρ1 = 1.9(4) 1 unit g / cm3 1 1(e)(i) V2 = 160 (cm3) 1 1(e)(ii) line of sight perpendicular 1 1(f)(i) V3 present and ρ2 = 2.0(g / cm3) 1 1(f)(ii) suggestion supported by valid reason e.g. ρ2 as volume is measured directly; ρ1 as measuring cylinder is less precise; string adds to volume displaced. 1
More questions on Physical quantities and measurement techniques
Q2 · Some students are determining the resistance per unit length of wire X
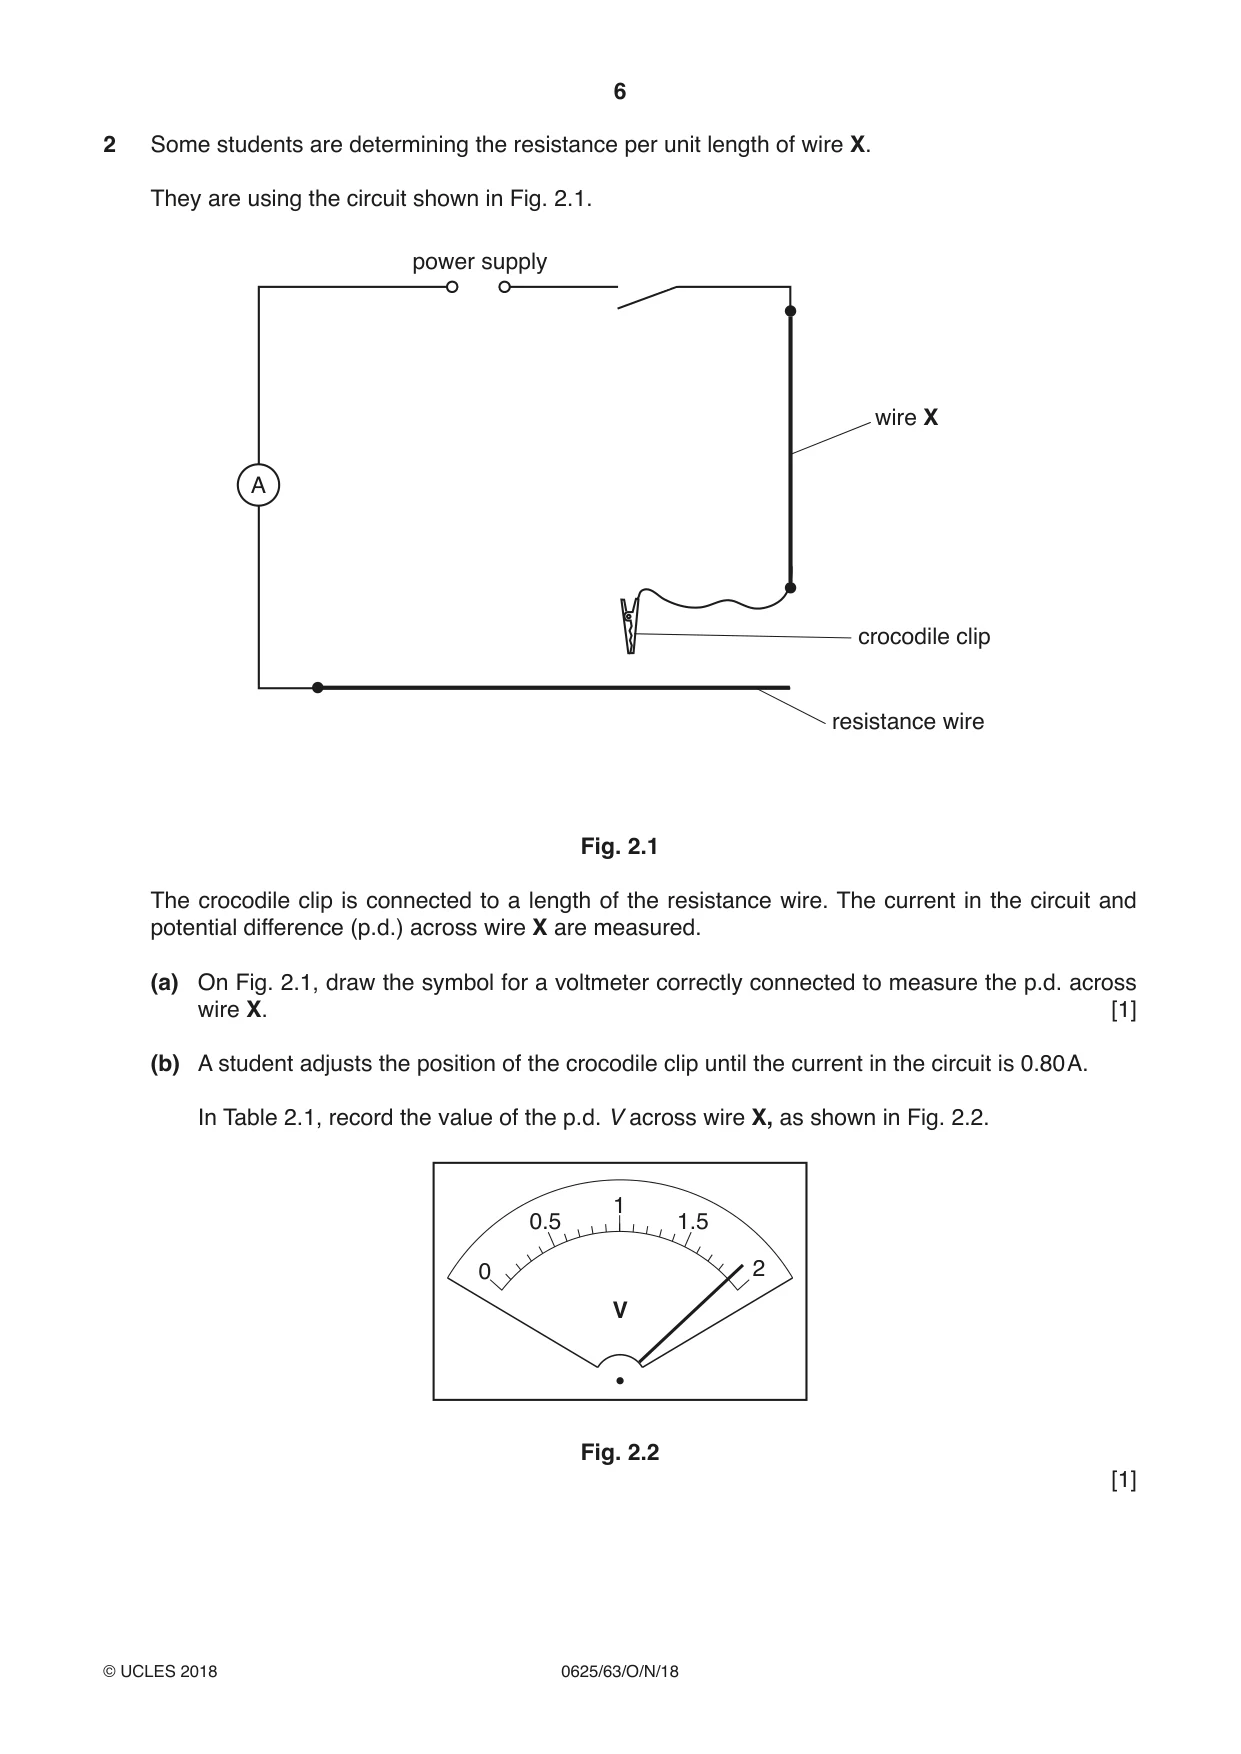
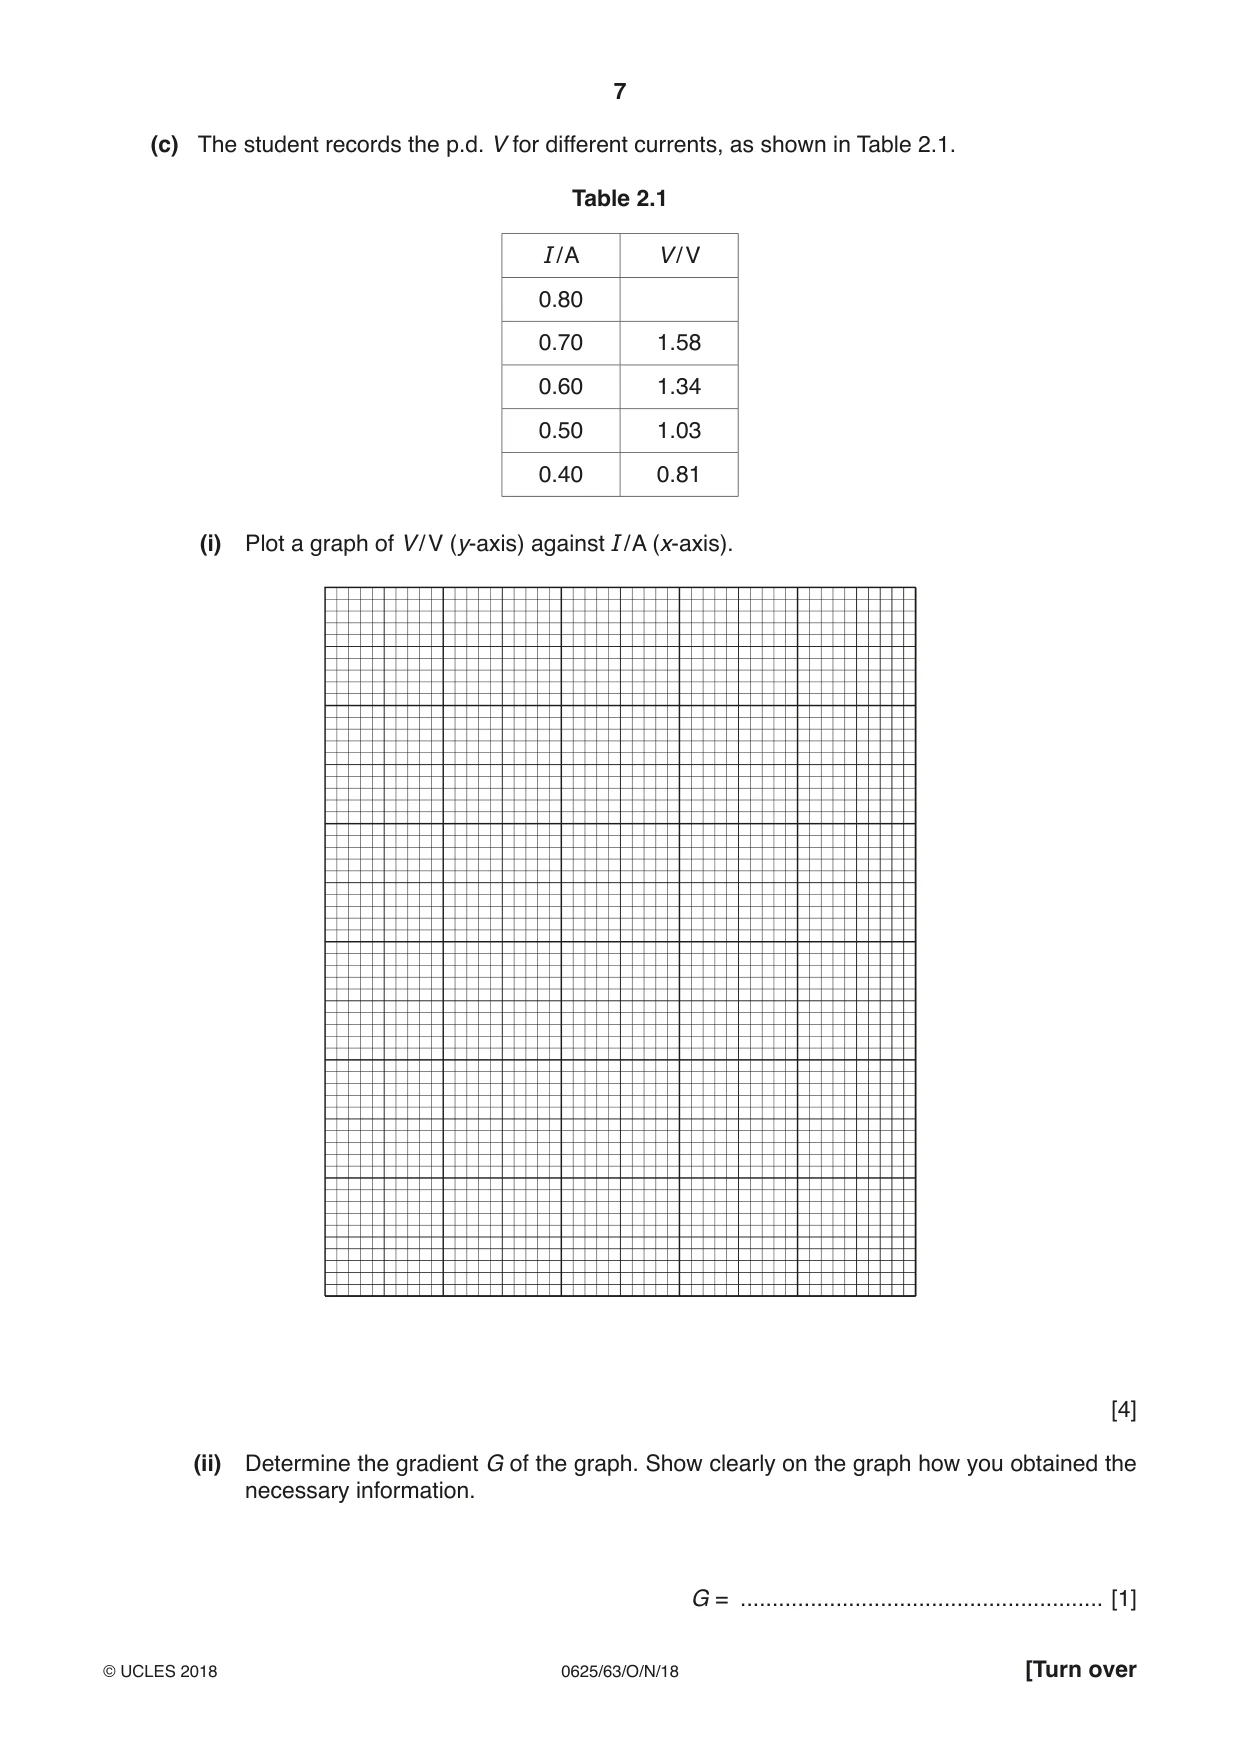
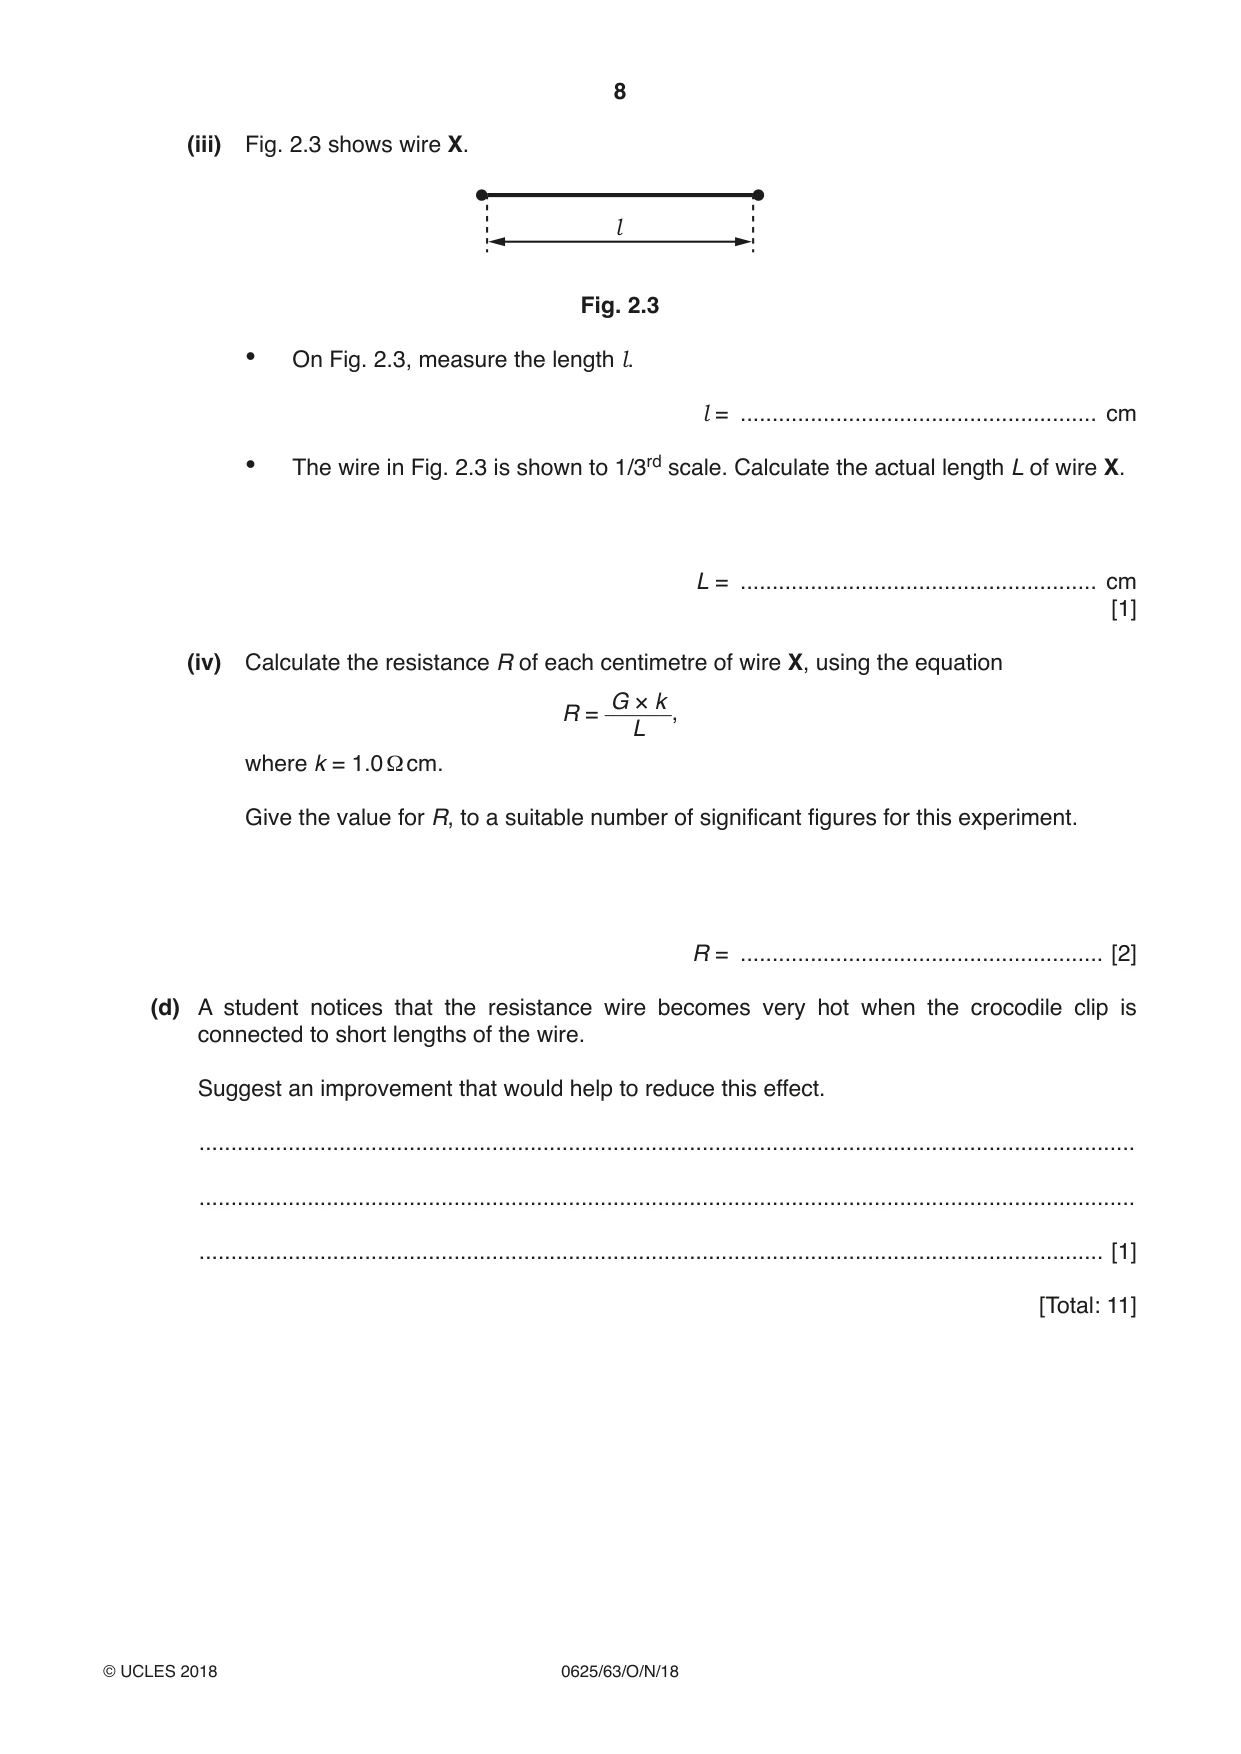
2 Some students are determining the resistance per unit length of wire X. They are using the circuit shown in Fig. 2.1. power supply wire X A crocodile clip resistance wire Fig. 2.1 The crocodile clip is connected to a length of the resistance wire. The current in the circuit and potential difference (p.d.) across wire X are measured. (a) On Fig. 2.1, draw the symbol for a voltmeter correctly connected to measure the p.d. across wire X. [1] (b) A student adjusts the position of the crocodile clip until the current in the circuit is 0.80 A. In Table 2.1, record the value of the p.d. V across wire X, as shown in Fig. 2.2. 1 0.5 1.5 0 2 V Fig. 2.2 [1] (c) The student records the p.d. V for different currents, as shown in Table 2.1. Table 2.1 I / A V / V 0.80 0.70 1.58 0.60 1.34 0.50 1.03 0.40 0.81 (i) Plot a graph of V / V (y-axis) against I / A (x-axis). [4] (ii) Determine the gradient G of the graph. Show clearly on the graph how you obtained the necessary information. G = ......................................................... [1] (iii) Fig. 2.3 shows wire X. l Fig. 2.3 • On Fig. 2.3, measure the length l. l = ........................................................ cm • The wire in Fig. 2.3 is shown to 1/3rd scale. Calculate the actual length L of wire X. L = ........................................................ cm [1] (iv) Calculate the resistance R of each centimetre of wire X, using the equation G × k R = , L where k = 1.0 Ω cm. Give the value for R, to a suitable number of significant figures for this experiment. R = ......................................................... [2] (d) A student notices that the resistance wire becomes very hot when the crocodile clip is connected to short lengths of the wire. Suggest an improvement that would help to reduce this effect. ................................................................................................................................................... ................................................................................................................................................... .............................................................................................................................................. [1] [Total: 11]
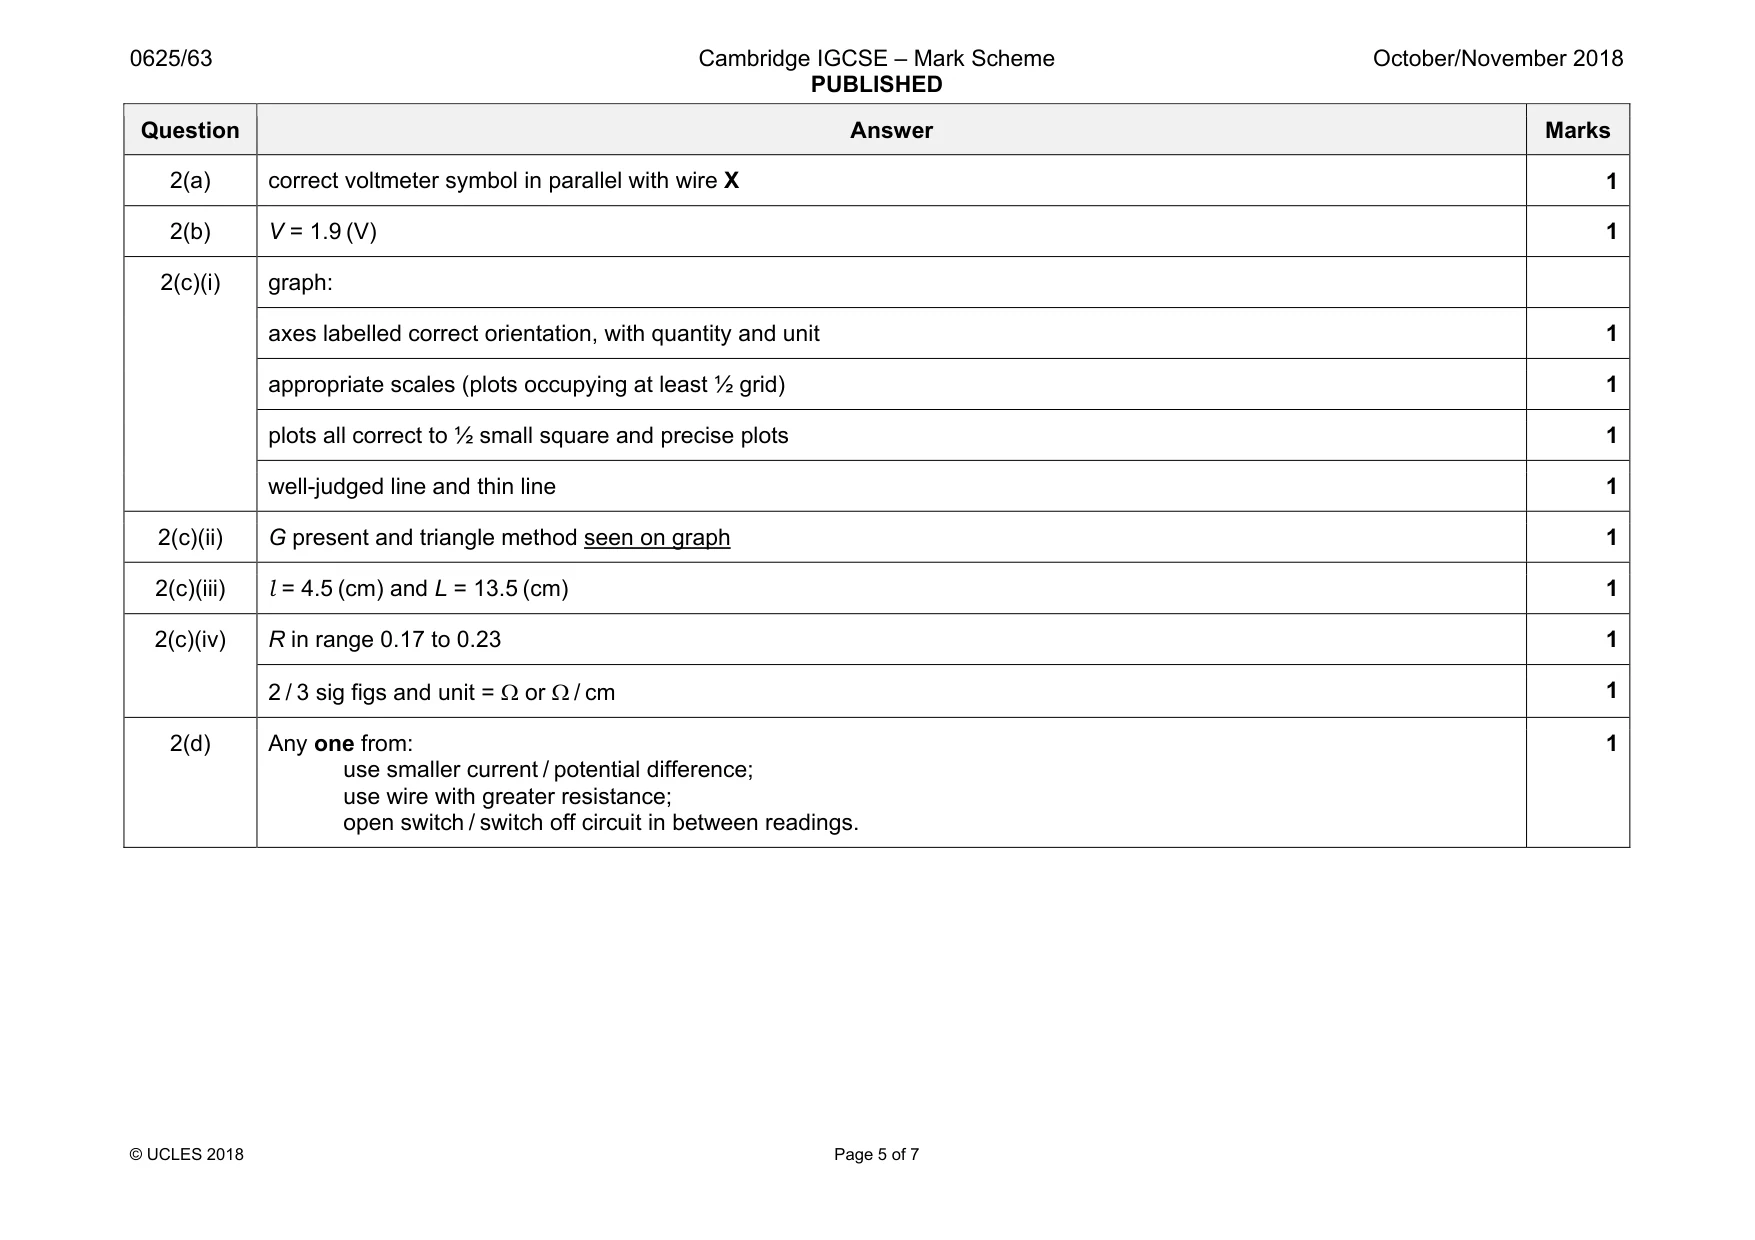
Mark scheme: 2(a) correct voltmeter symbol in parallel with wire X 1 2(b) V = 1.9 (V) 1 2(c)(i) graph: axes labelled correct orientation, with quantity and unit 1 appropriate scales (plots occupying at least ½ grid) 1 plots all correct to ½ small square and precise plots 1 well-judged line and thin line 1 2(c)(ii) G present and triangle method seen on graph 1 2(c)(iii) l = 4.5 (cm) and L = 13.5 (cm) 1 2(c)(iv) R in range 0.17 to 0.23 1 2 / 3 sig figs and unit = Ω or Ω / cm 1 2(d) Any one from: use smaller current / potential difference; use wire with greater resistance; open switch / switch off circuit in between readings. 1
Q3 · A student is investigating the reflection of light by a plane mirror
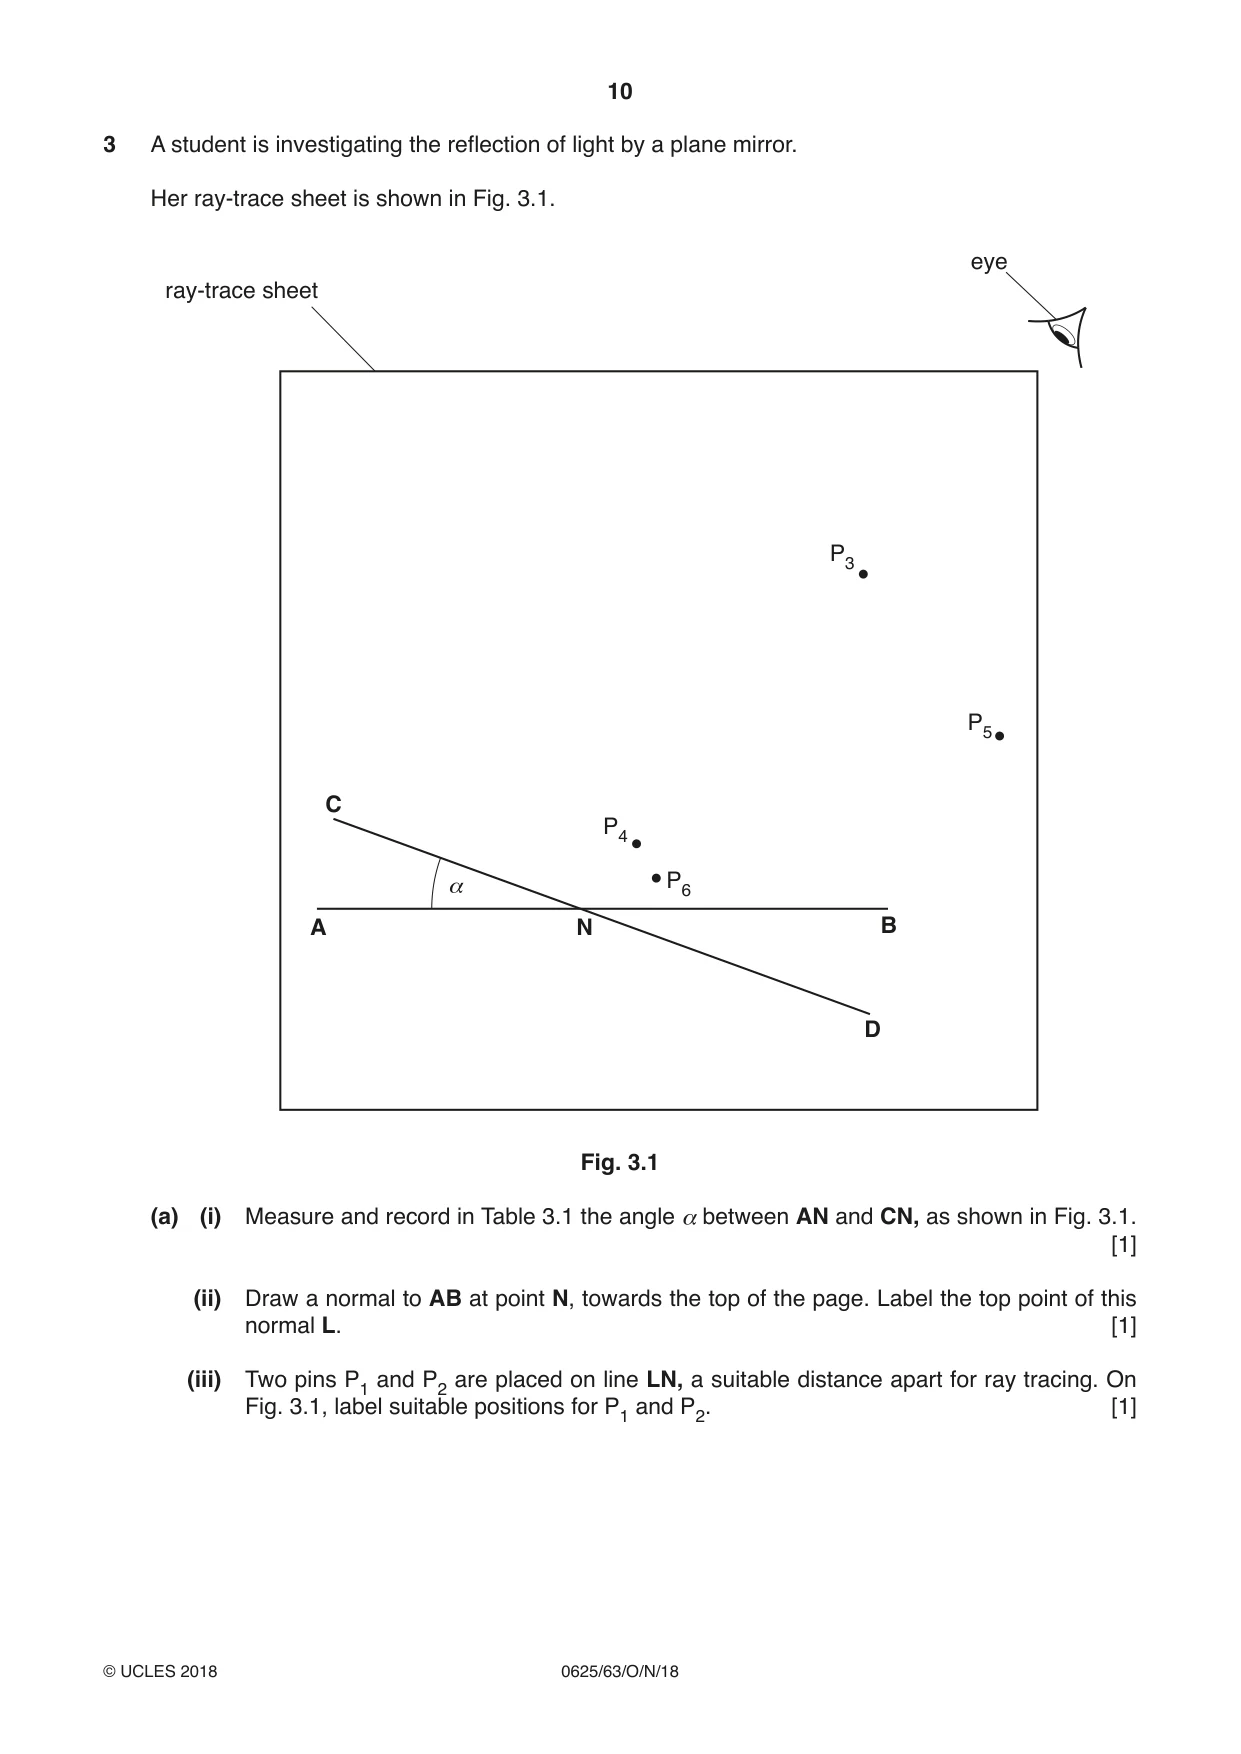
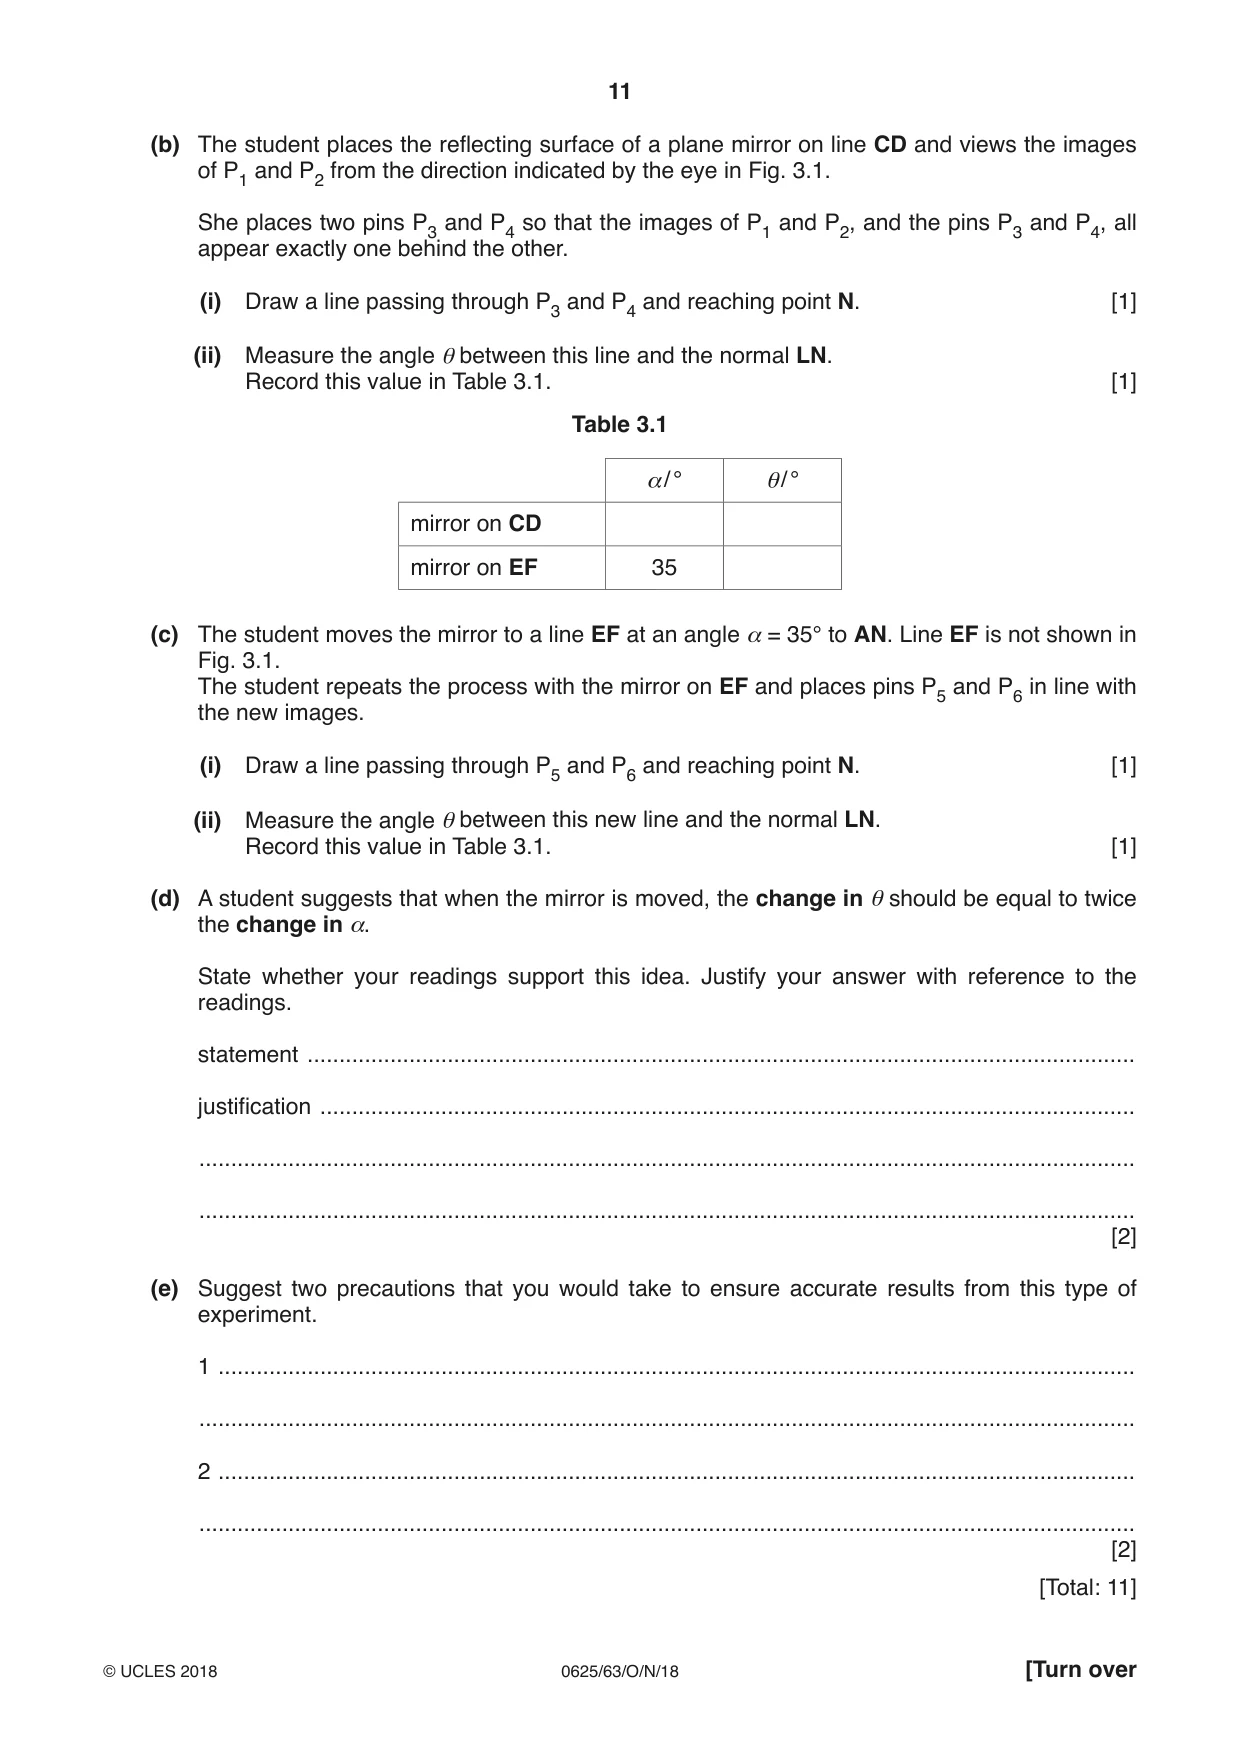
3 A student is investigating the reflection of light by a plane mirror. Her ray-trace sheet is shown in Fig. 3.1. eye ray-trace sheet P3 P5 C P4 α P6 A N B D Fig. 3.1 (a) (i) Measure and record in Table 3.1 the angle α between AN and CN, as shown in Fig. 3.1. [1] (ii) Draw a normal to AB at point N, towards the top of the page. Label the top point of this normal L. [1] (iii) Two pins P1 and P2 are placed on line LN, a suitable distance apart for ray tracing. On Fig. 3.1, label suitable positions for P1 and P2. [1] (b) The student places the reflecting surface of a plane mirror on line CD and views the images of P1 and P2 from the direction indicated by the eye in Fig. 3.1. She places two pins P3 and P4 so that the images of P1 and P2, and the pins P3 and P4, all appear exactly one behind the other. (i) Draw a line passing through P3 and P4 and reaching point N. [1] (ii) Measure the angle θ between this line and the normal LN. Record this value in Table 3.1. [1] Table 3.1 α / ° θ/ ° mirror on CD mirror on EF 35 (c) The student moves the mirror to a line EF at an angle α = 35° to AN. Line EF is not shown in Fig. 3.1. The student repeats the process with the mirror on EF and places pins P5 and P6 in line with the new images. (i) Draw a line passing through P5 and P6 and reaching point N. [1] (ii) Measure the angle θ between this new line and the normal LN. Record this value in Table 3.1. [1] (d) A student suggests that when the mirror is moved, the change in θ should be equal to twice the change in α. State whether your readings support this idea. Justify your answer with reference to the readings. statement .................................................................................................................................. justification ................................................................................................................................ ................................................................................................................................................... ................................................................................................................................................... [2] (e) Suggest two precautions that you would take to ensure accurate results from this type of experiment. 1 ................................................................................................................................................ ................................................................................................................................................... 2 ................................................................................................................................................ ................................................................................................................................................... [2] [Total: 11]
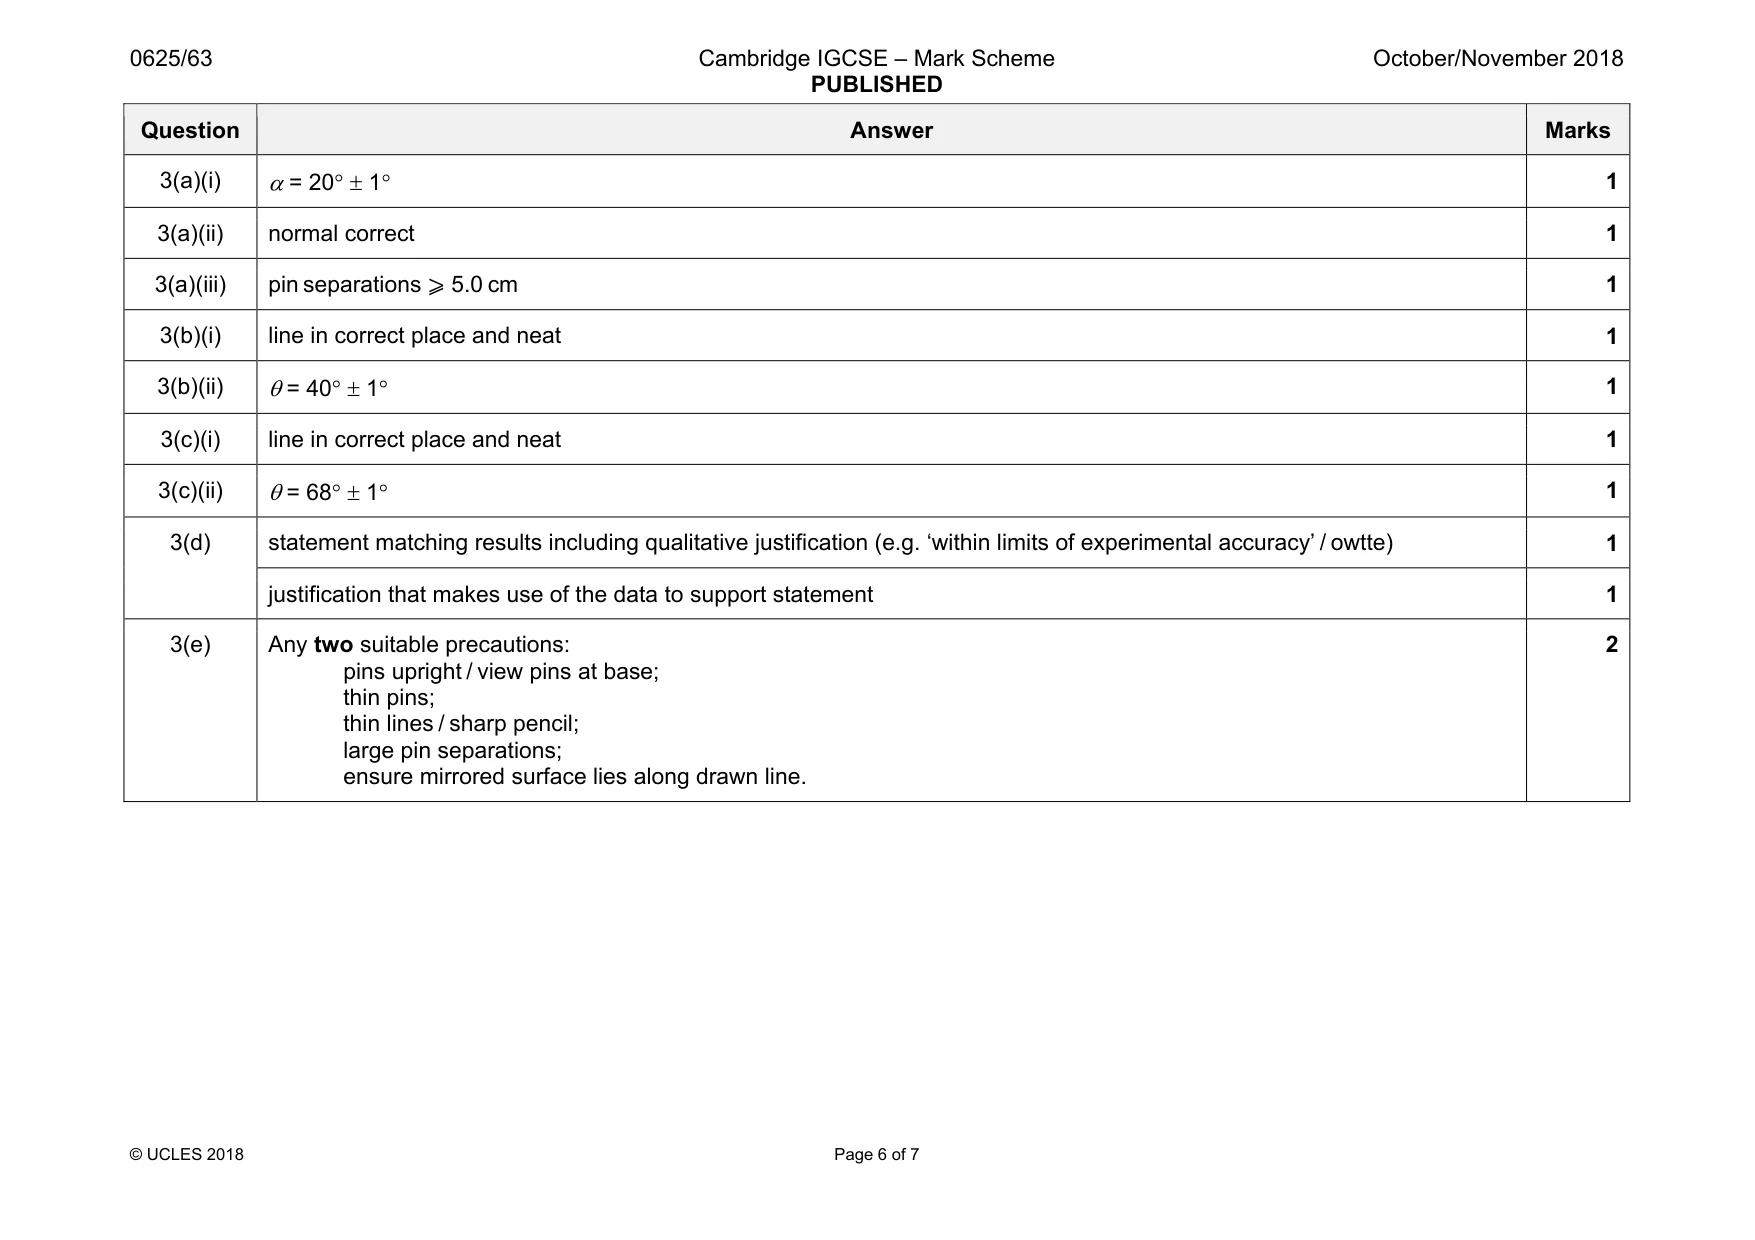
Mark scheme: 3(a)(i) 1 3(a)(ii) normal correct 1 3(a)(iii) pin separations ⩾ 5.0 cm 1 3(b)(i) line in correct place and neat 1 3(b)(ii) θ = 40° ± 1° 1 3(c)(i) line in correct place and neat 1 3(c)(ii) θ = 68° ± 1° 1 3(d) statement matching results including qualitative justification (e.g. ‘within limits of experimental accuracy’ / owtte) 1 justification that makes use of the data to support statement 1 3(e) Any two suitable precautions: pins upright / view pins at base; thin pins; thin lines / sharp pencil; large pin separations; ensure mirrored surface lies along drawn line. 2
Q4 · A student is investigating the conduction of thermal energy by metals
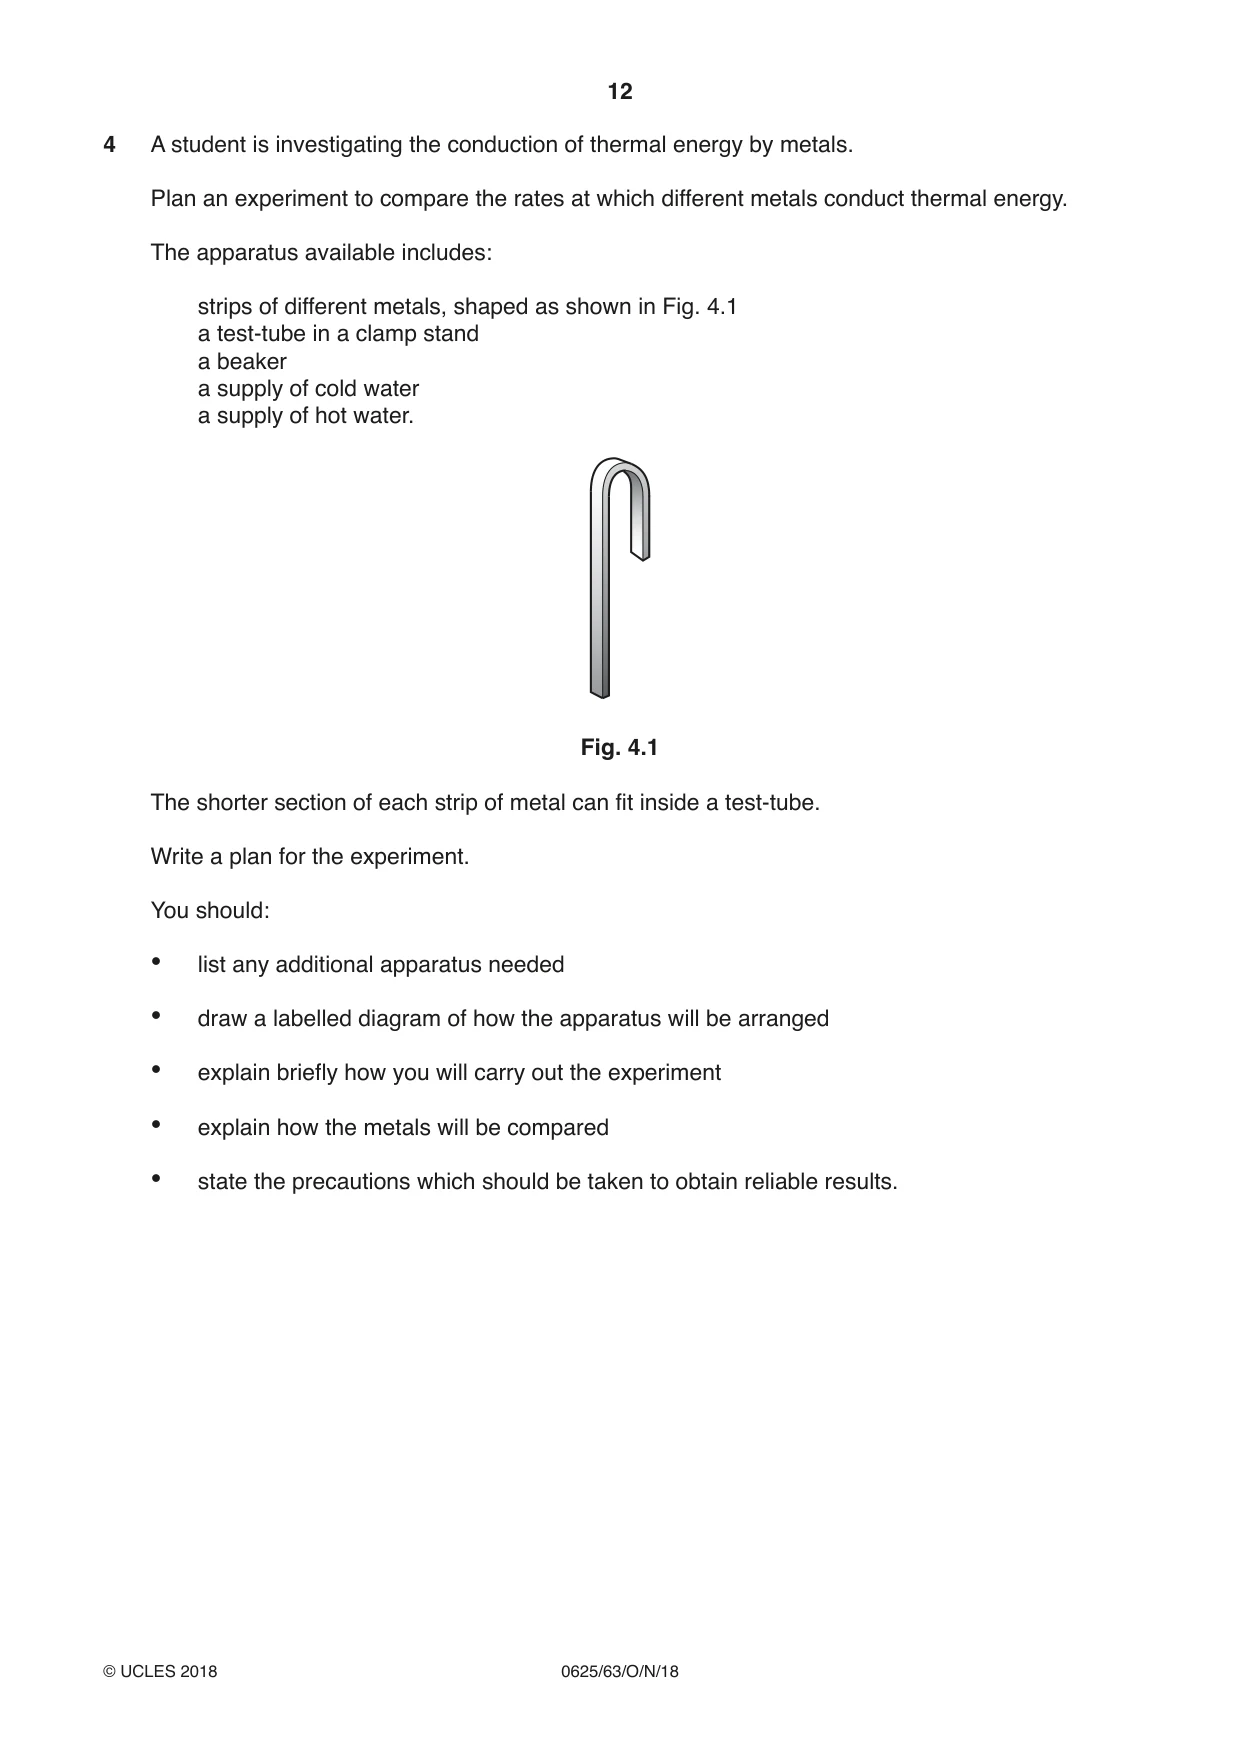
4 A student is investigating the conduction of thermal energy by metals. Plan an experiment to compare the rates at which different metals conduct thermal energy. The apparatus available includes: strips of different metals, shaped as shown in Fig. 4.1 a test-tube in a clamp stand a beaker a supply of cold water a supply of hot water. Fig. 4.1 The shorter section of each strip of metal can fit inside a test-tube. Write a plan for the experiment. You should: • list any additional apparatus needed • draw a labelled diagram of how the apparatus will be arranged • explain briefly how you will carry out the experiment • explain how the metals will be compared • state the precautions which should be taken to obtain reliable results. .......................................................................................................................................................... .......................................................................................................................................................... .......................................................................................................................................................... .......................................................................................................................................................... .......................................................................................................................................................... .......................................................................................................................................................... .......................................................................................................................................................... .......................................................................................................................................................... .......................................................................................................................................................... .......................................................................................................................................................... .......................................................................................................................................................... .......................................................................................................................................................... .......................................................................................................................................................... .......................................................................................................................................................... .......................................................................................................................................................... .......................................................................................................................................................... .......................................................................................................................................................... .......................................................................................................................................................... .......................................................................................................................................................... .......................................................................................................................................................... .......................................................................................................................................................... .......................................................................................................................................................... ..................................................................................................................................................... [7] [Total: 7]
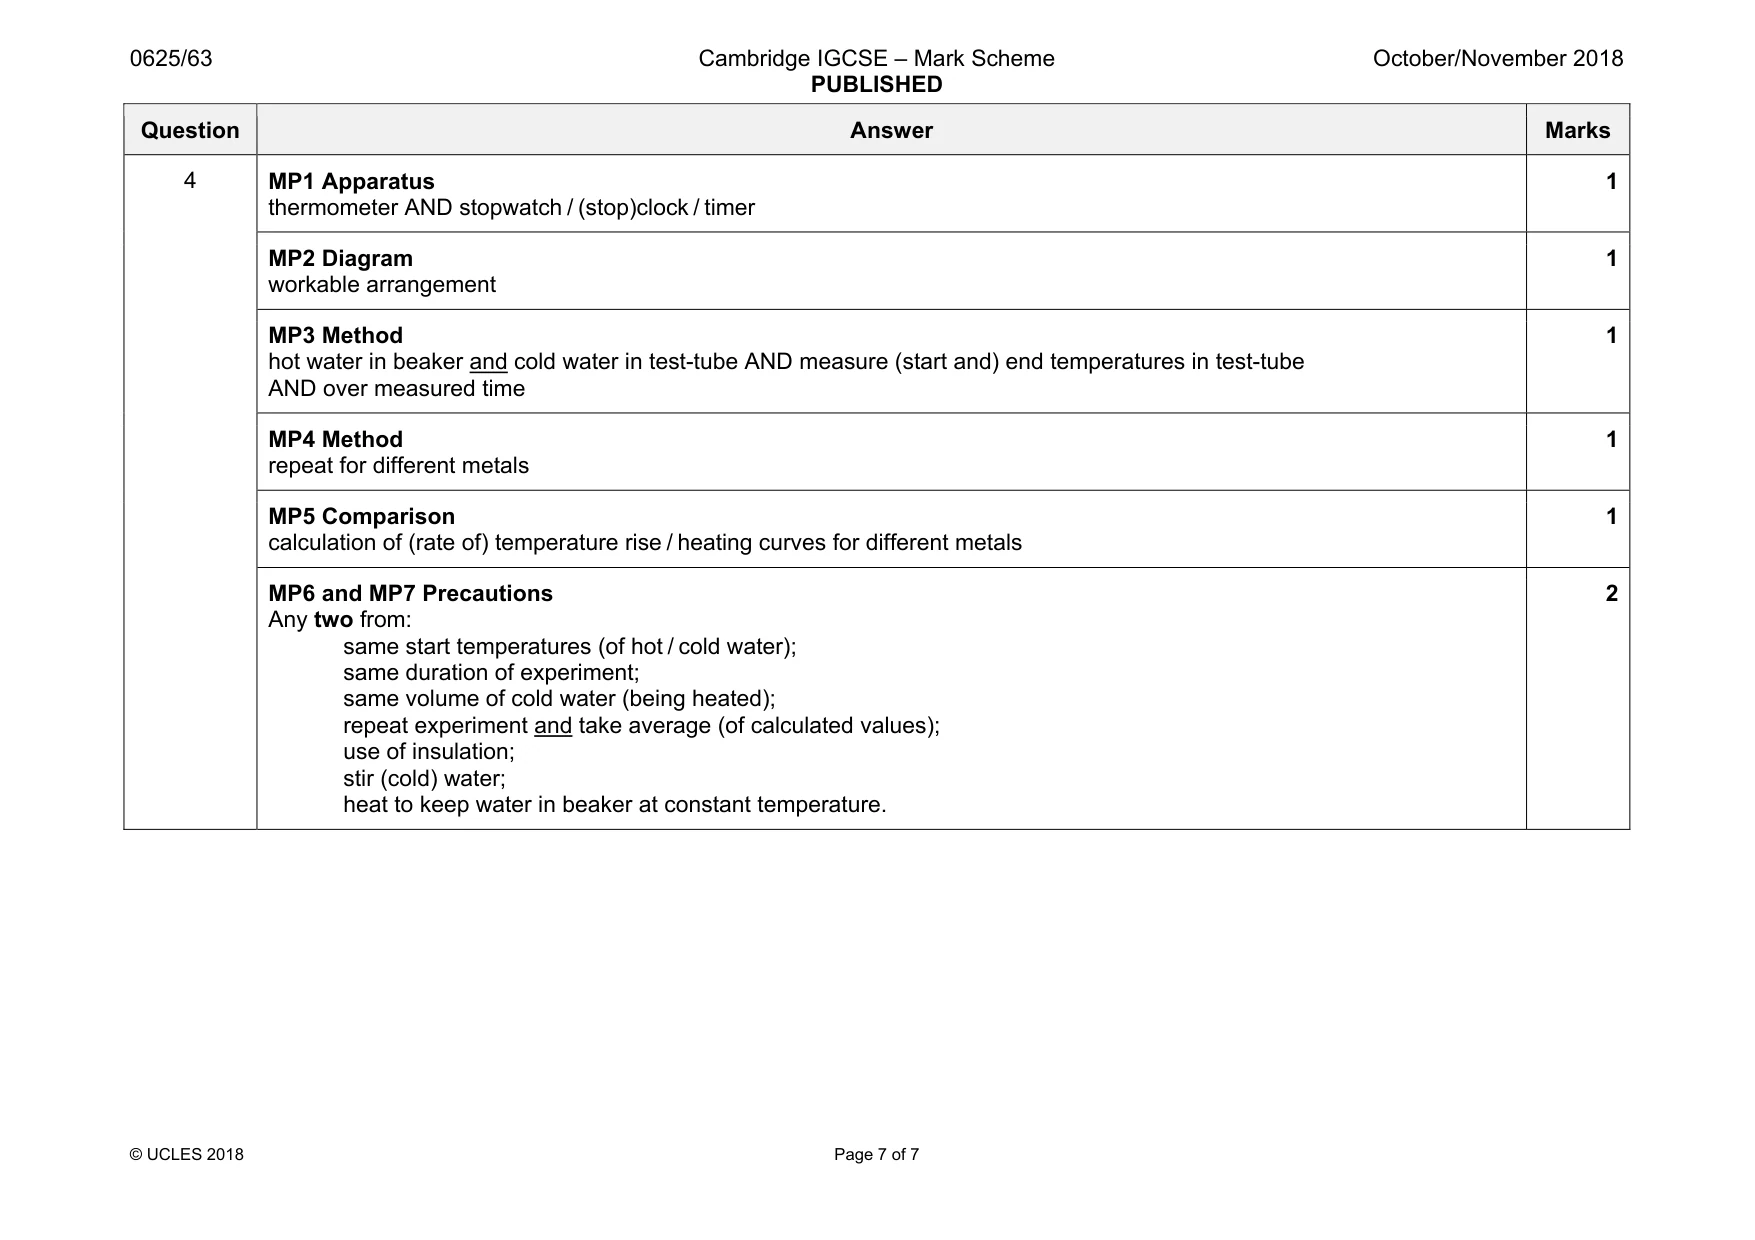
Mark scheme: 4 MP1 Apparatus thermometer AND stopwatch / (stop)clock / timer 1 MP2 Diagram workable arrangement 1 MP3 Method hot water in beaker and cold water in test-tube AND measure (start and) end temperatures in test-tube AND over measured time 1 MP4 Method repeat for different metals 1 MP5 Comparison calculation of (rate of) temperature rise / heating curves for different metals 1 MP6 and MP7 Precautions Any two from: same start temperatures (of hot / cold water); same duration of experiment; same volume of cold water (being heated); repeat experiment and take average (of calculated values); use of insulation; stir (cold) water; heat to keep water in beaker at constant temperature. 2
What was in this paper
The subtopics covered by these 4 questions, and how many questions each got. Open one in a new tab to see every Cambridge question on it.
What you needed in this session
Cambridge’s own grade thresholds for 2018 Oct/Nov, Paper 6 · Variant 3. A higher threshold means an easier paper — the bar moves with how the cohort did.