Cambridge IGCSE Physics 0625 — 2018 Oct/Nov Paper 6 · Variant 1
0625/61/O/N/18 · 4 questions · 40 marks · ≈45 min
The question paper and its mark scheme, free to read here and free to download. This is Cambridge’s own paper, exactly as it was sat.
Question paper16 pages



Mark scheme7 pages
Answers below. Sit the paper first if you are practising.
Questions as text
Q1 · A student is determining the spring constant k of a spring by two methods
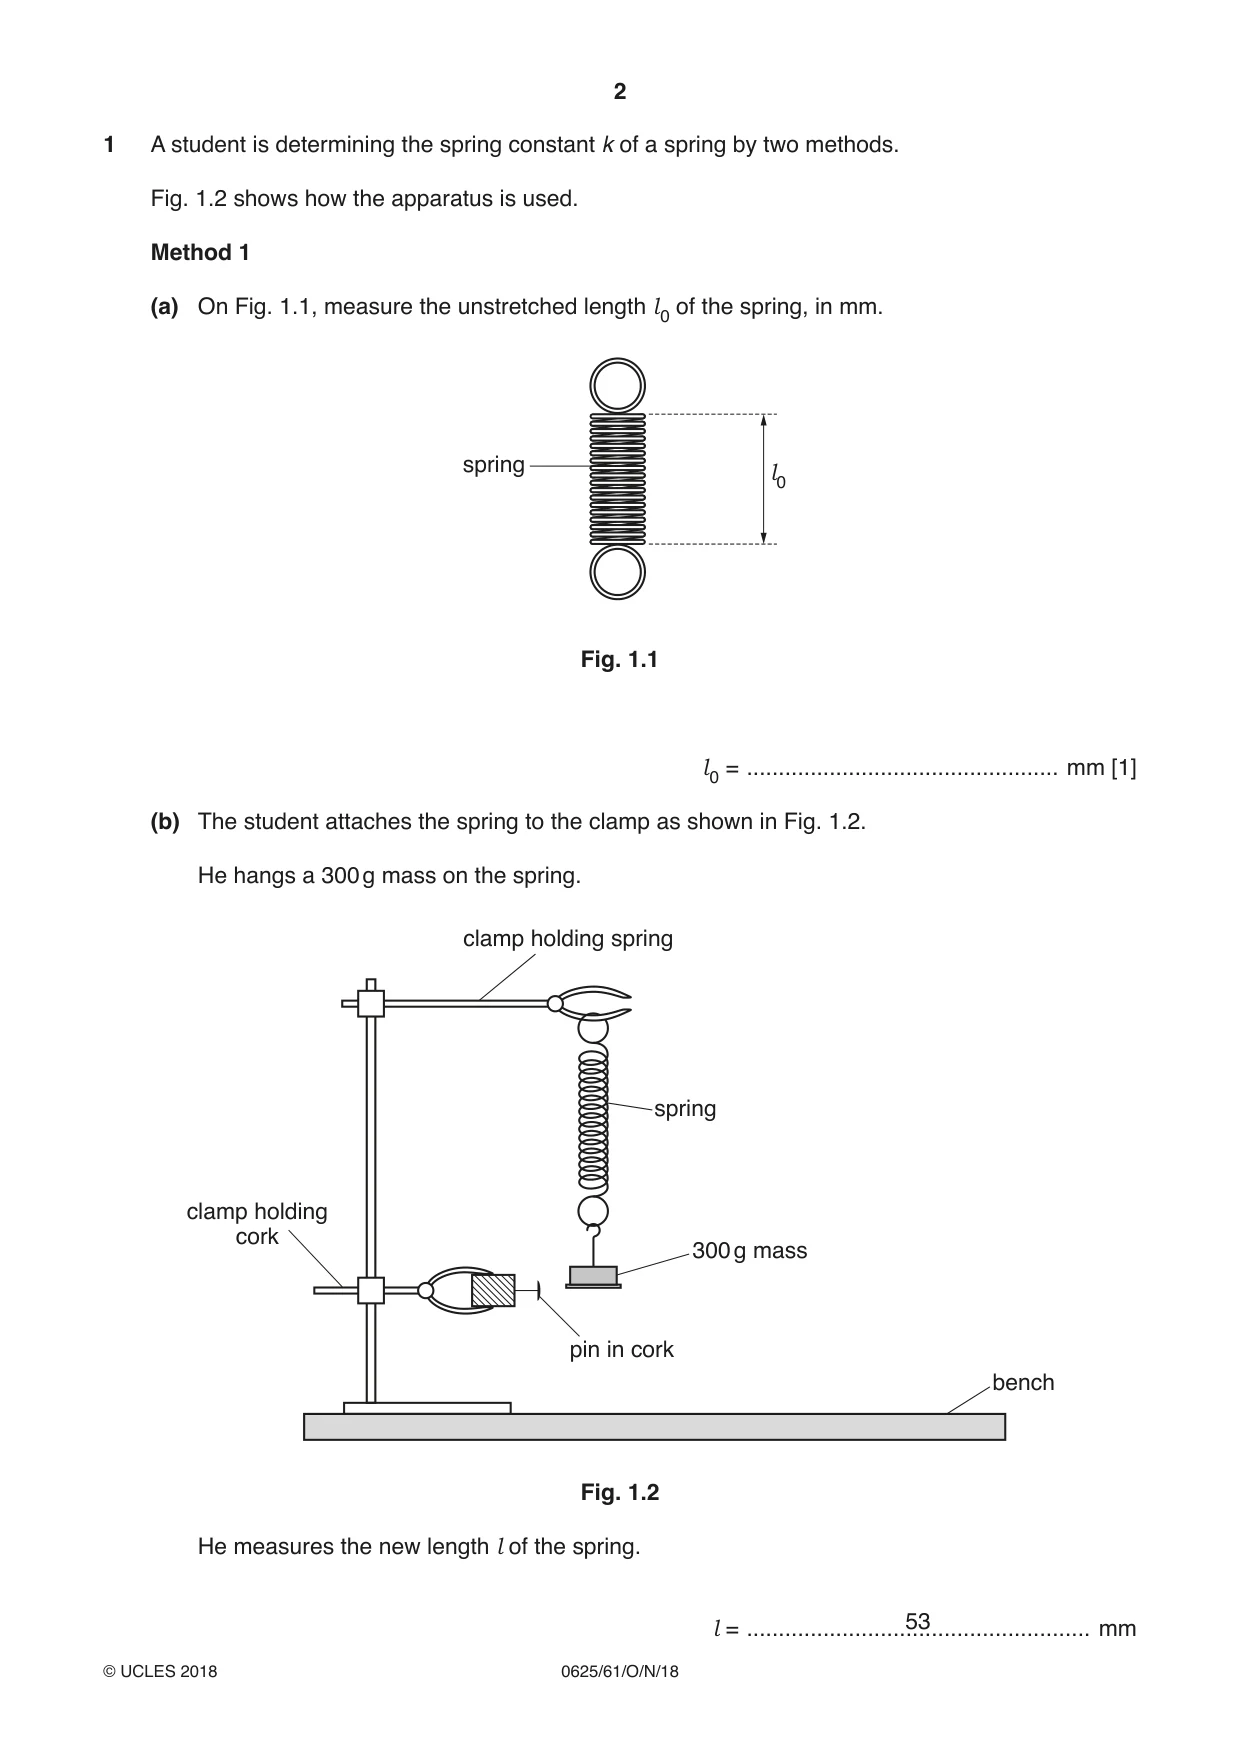
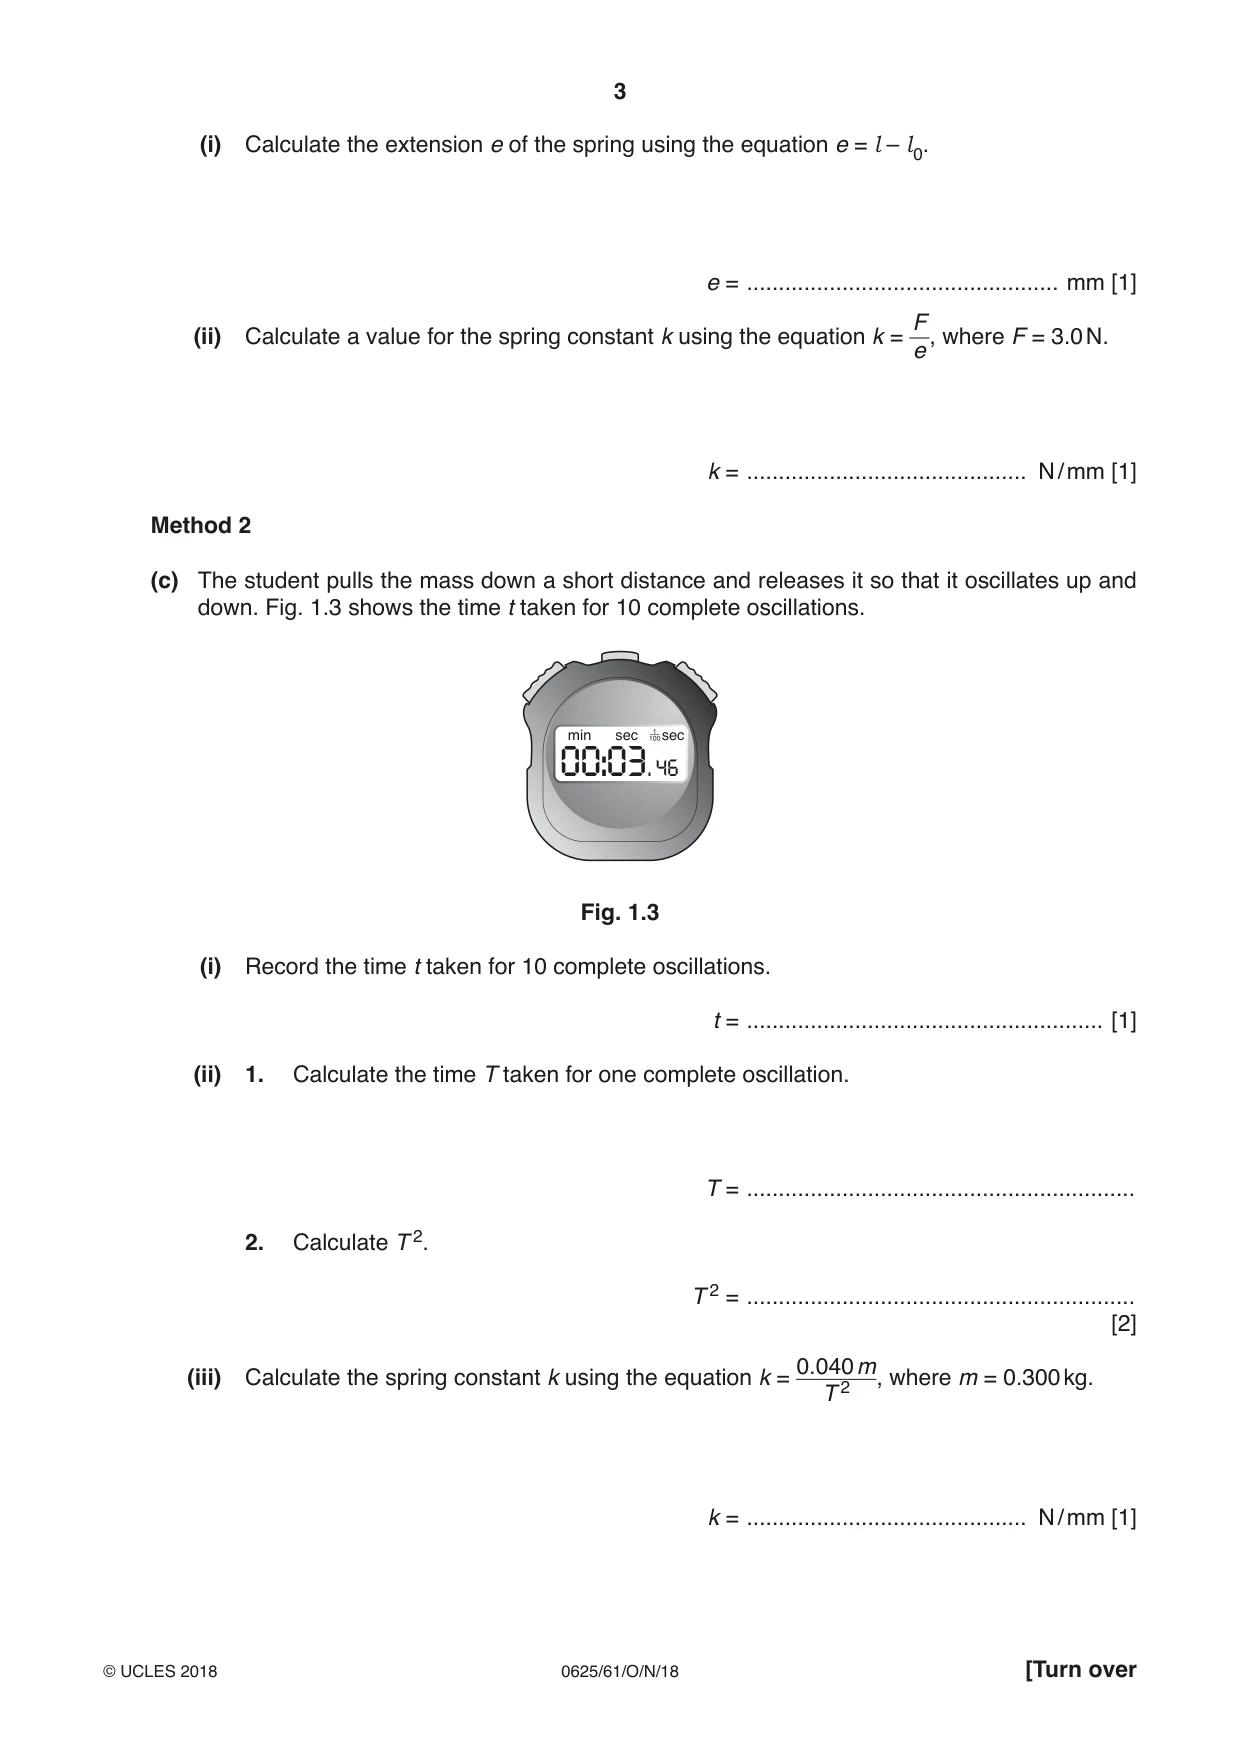
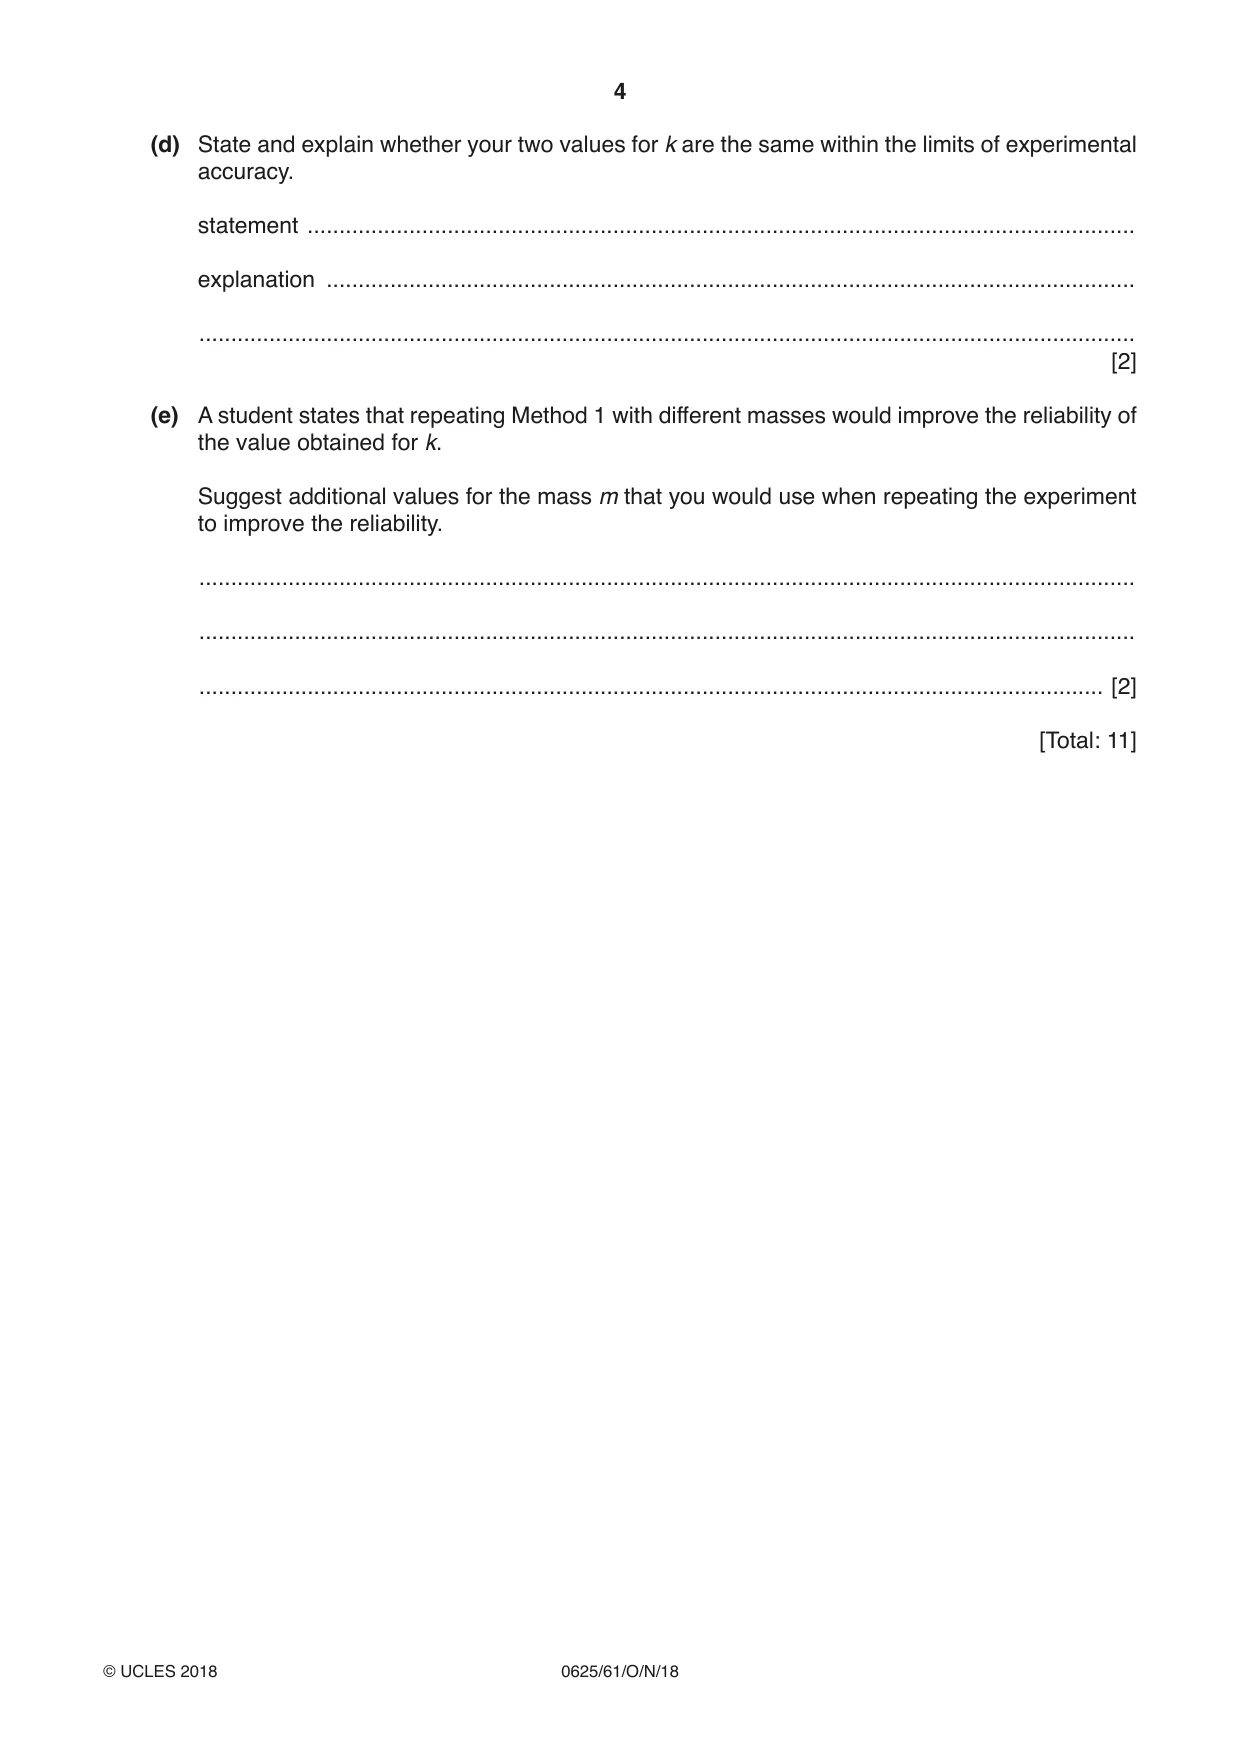
1 A student is determining the spring constant k of a spring by two methods. Fig. 1.2 shows how the apparatus is used. Method 1 (a) On Fig. 1.1, measure the unstretched length l0 of the spring, in mm. spring l0 Fig. 1.1 l0 = ................................................. mm [1] (b) The student attaches the spring to the clamp as shown in Fig. 1.2. He hangs a 300 g mass on the spring. clamp holding spring spring clamp holding cork 300 g mass pin in cork bench Fig. 1.2 He measures the new length l of the spring. 53 l = ...................................................... mm (i) Calculate the extension e of the spring using the equation e = l – l0. e = ................................................. mm [1] F (ii) Calculate a value for the spring constant k using the equation k = , where F = 3.0 N. e k = ............................................ N / mm [1] Method 2 (c) The student pulls the mass down a short distance and releases it so that it oscillates up and down. Fig. 1.3 shows the time t taken for 10 complete oscillations. min sec sec 00:03. 46 Fig. 1.3 (i) Record the time t taken for 10 complete oscillations. t = ........................................................ [1] (ii) 1. Calculate the time T taken for one complete oscillation. T = ............................................................. 2. Calculate T 2. T 2 = ............................................................. [2] 0.040 m (iii) Calculate the spring constant k using the equation k = 2 , where m = 0.300 kg. T k = ............................................ N / mm [1] (d) State and explain whether your two values for k are the same within the limits of experimental accuracy. statement .................................................................................................................................. explanation ............................................................................................................................... ................................................................................................................................................... [2] (e) A student states that repeating Method 1 with different masses would improve the reliability of the value obtained for k. Suggest additional values for the mass m that you would use when repeating the experiment to improve the reliability. ................................................................................................................................................... ................................................................................................................................................... .............................................................................................................................................. [2] [Total: 11]
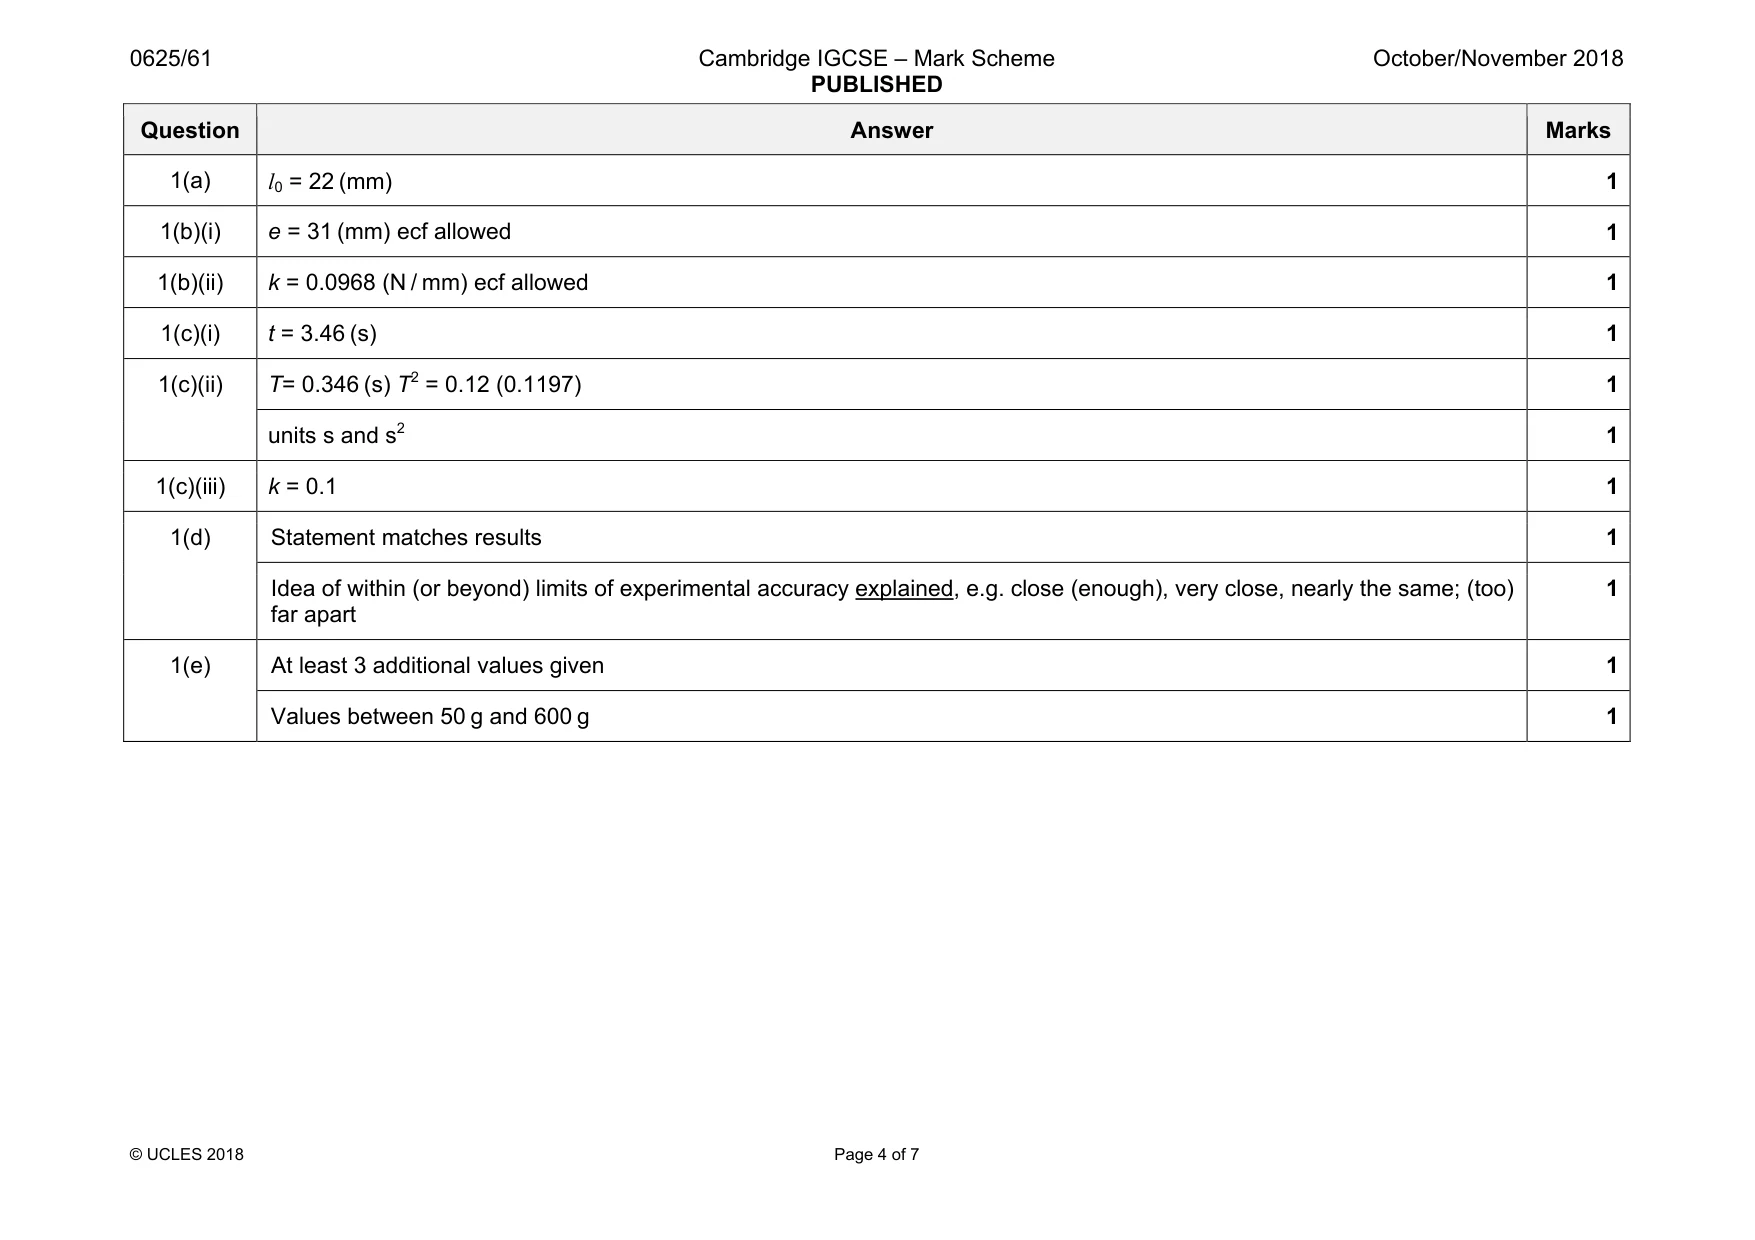
Mark scheme: 1(a) l0 = 22 (mm) 1 1(b)(i) e = 31 (mm) ecf allowed 1 1(b)(ii) k = 0.0968 (N / mm) ecf allowed 1 1(c)(i) t = 3.46 (s) 1 1(c)(ii) T= 0.346 (s) T2 = 0.12 (0.1197) 1 units s and s2 1 1(c)(iii) k = 0.1 1 1(d) Statement matches results 1 Idea of within (or beyond) limits of experimental accuracy explained, e.g. close (enough), very close, nearly the same; (too) far apart 1 1(e) At least 3 additional values given 1 Values between 50 g and 600 g 1
Q2 · A student is determining the resistance of a piece of wire
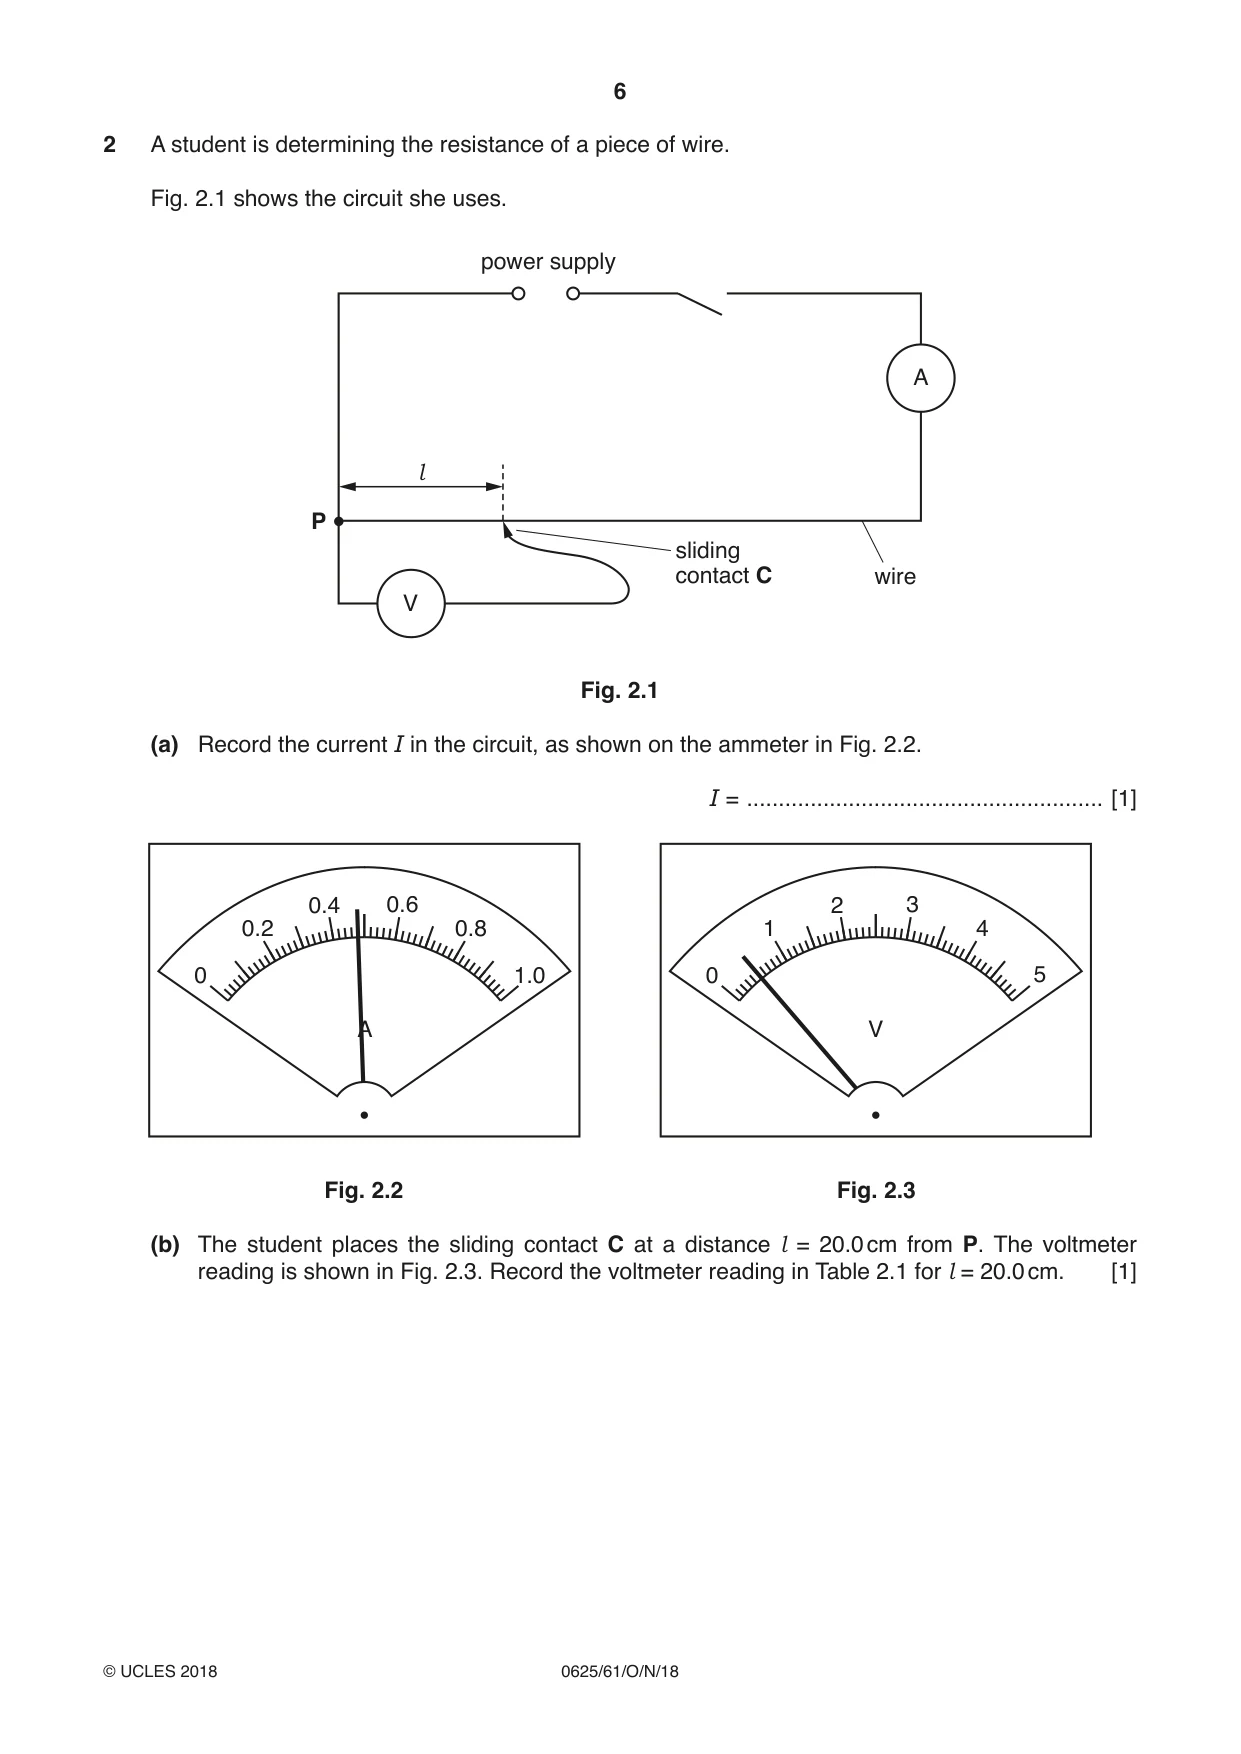
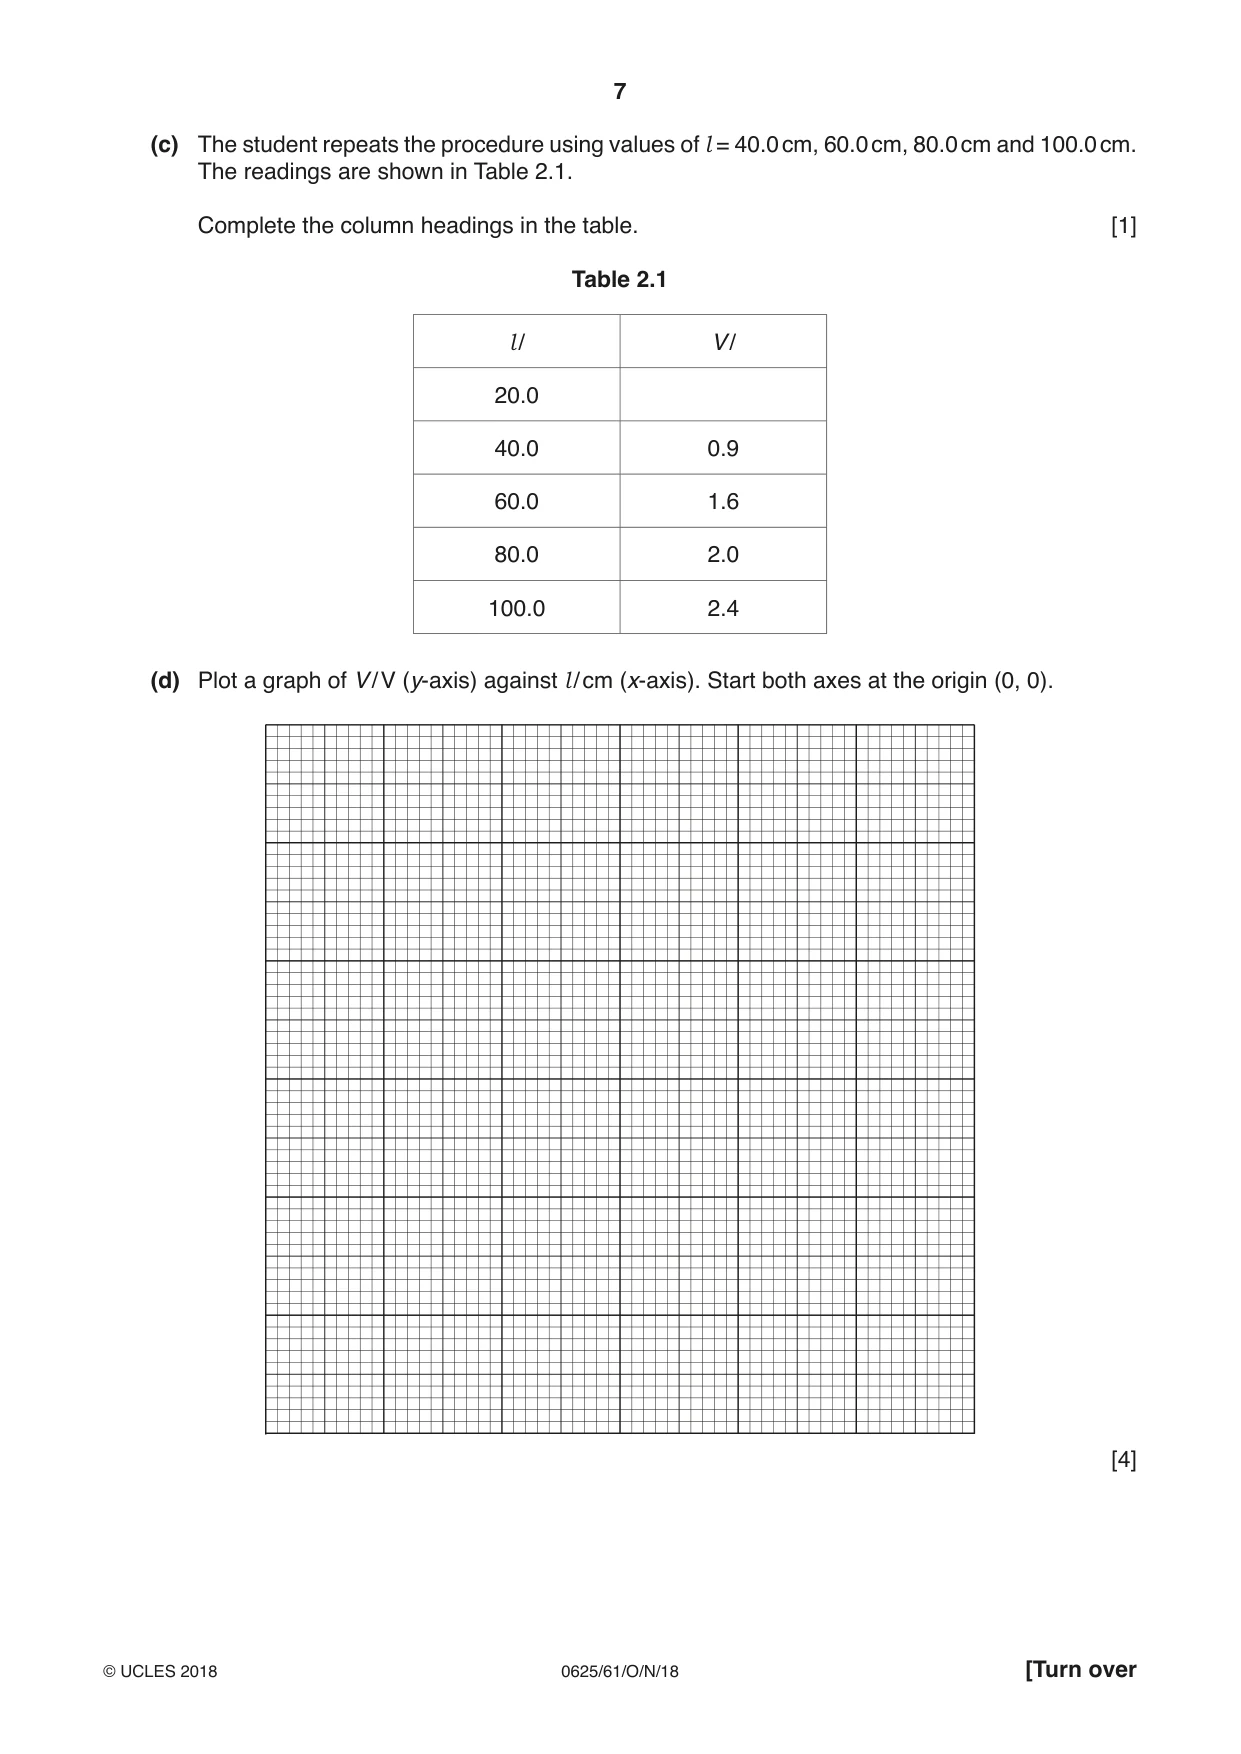
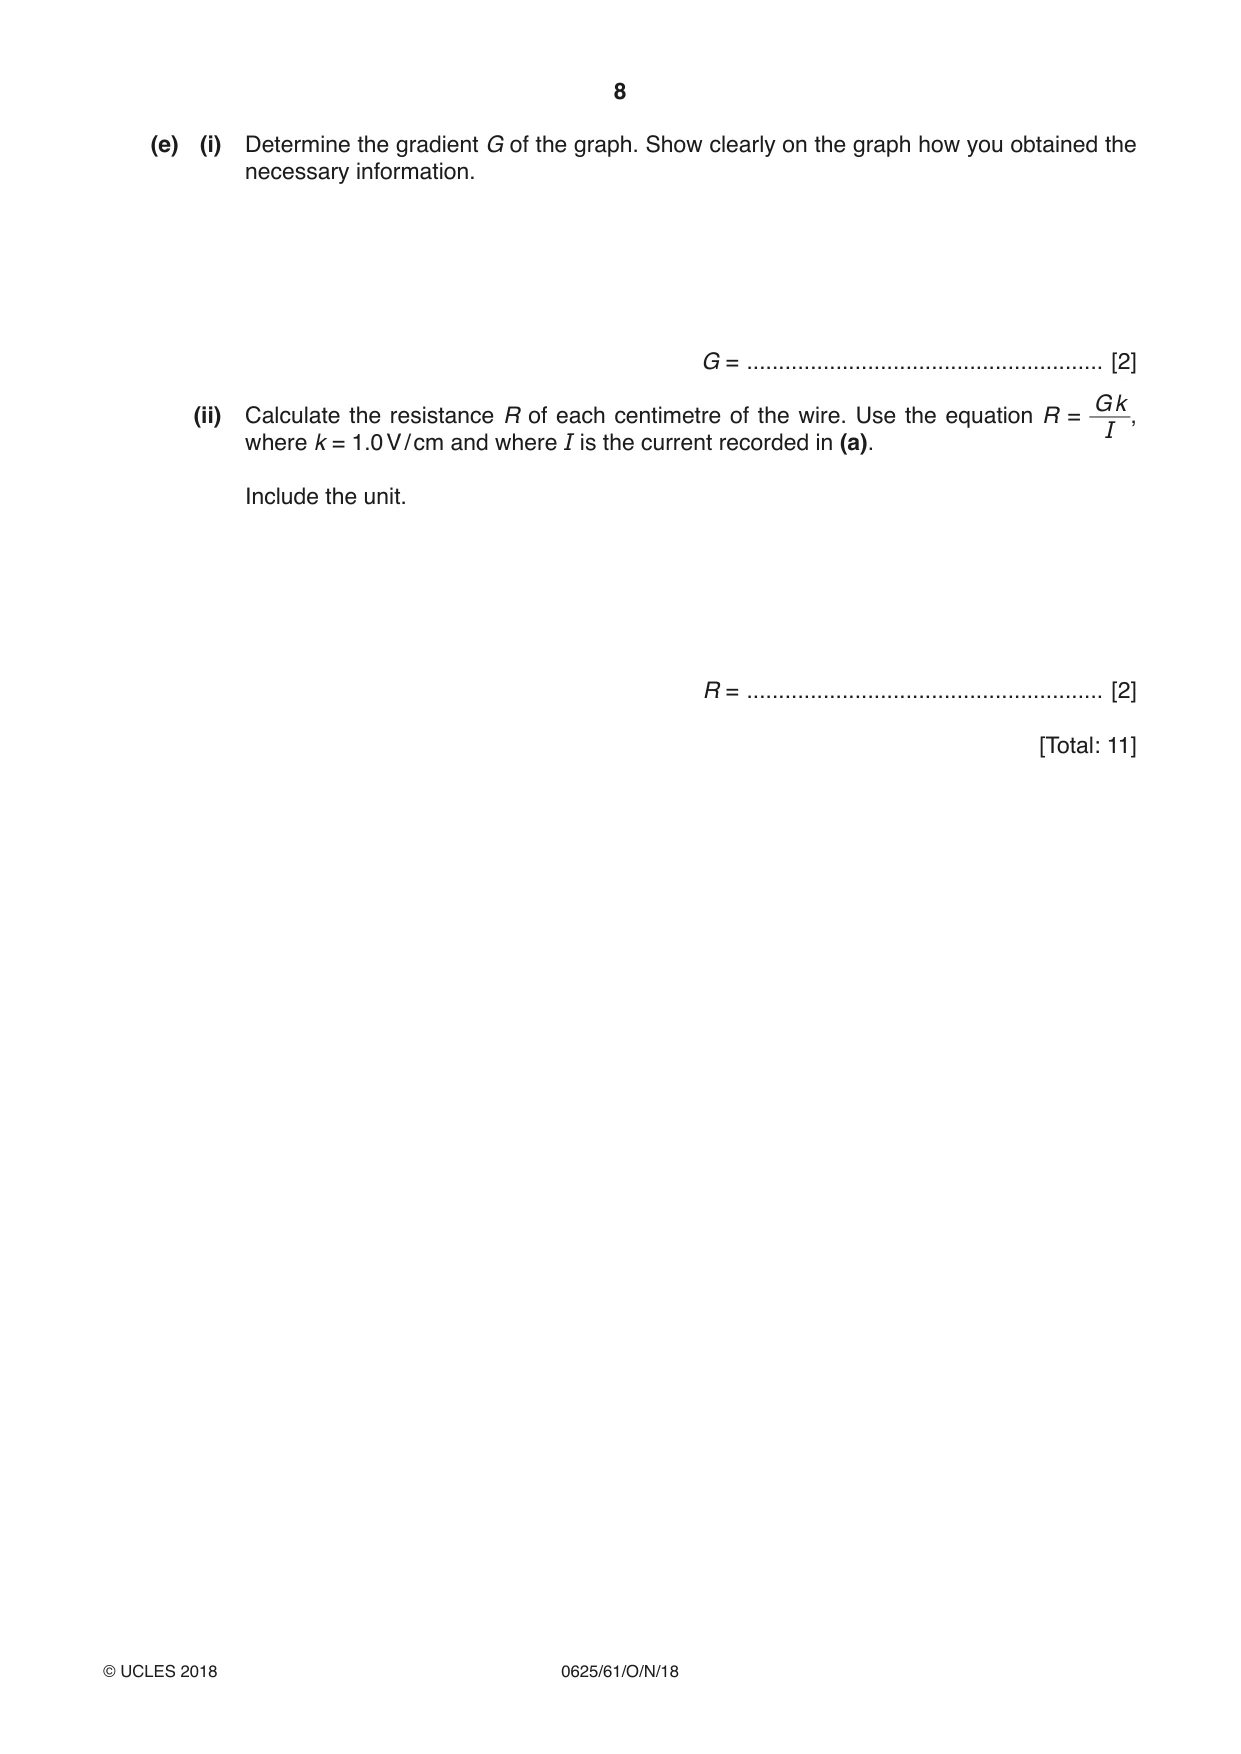
2 A student is determining the resistance of a piece of wire. Fig. 2.1 shows the circuit she uses. power supply A l P sliding contact C wire V Fig. 2.1 (a) Record the current I in the circuit, as shown on the ammeter in Fig. 2.2. I = ........................................................ [1] 0.4 0.6 2 3 0.2 0.8 1 4 0 1.0 0 5 A V Fig. 2.2 Fig. 2.3 (b) The student places the sliding contact C at a distance l = 20.0 cm from P. The voltmeter reading is shown in Fig. 2.3. Record the voltmeter reading in Table 2.1 for l = 20.0 cm. [1] (c) The student repeats the procedure using values of l = 40.0 cm, 60.0 cm, 80.0 cm and 100.0 cm. The readings are shown in Table 2.1. Complete the column headings in the table. [1] Table 2.1 l / V / 20.0 40.0 0.9 60.0 1.6 80.0 2.0 100.0 2.4 (d) Plot a graph of V / V (y-axis) against l / cm (x-axis). Start both axes at the origin (0, 0). [4] (e) (i) Determine the gradient G of the graph. Show clearly on the graph how you obtained the necessary information. G = ........................................................ [2] G k (ii) Calculate the resistance R of each centimetre of the wire. Use the equation R = , I where k = 1.0 V / cm and where I is the current recorded in (a). Include the unit. R = ........................................................ [2] [Total: 11]
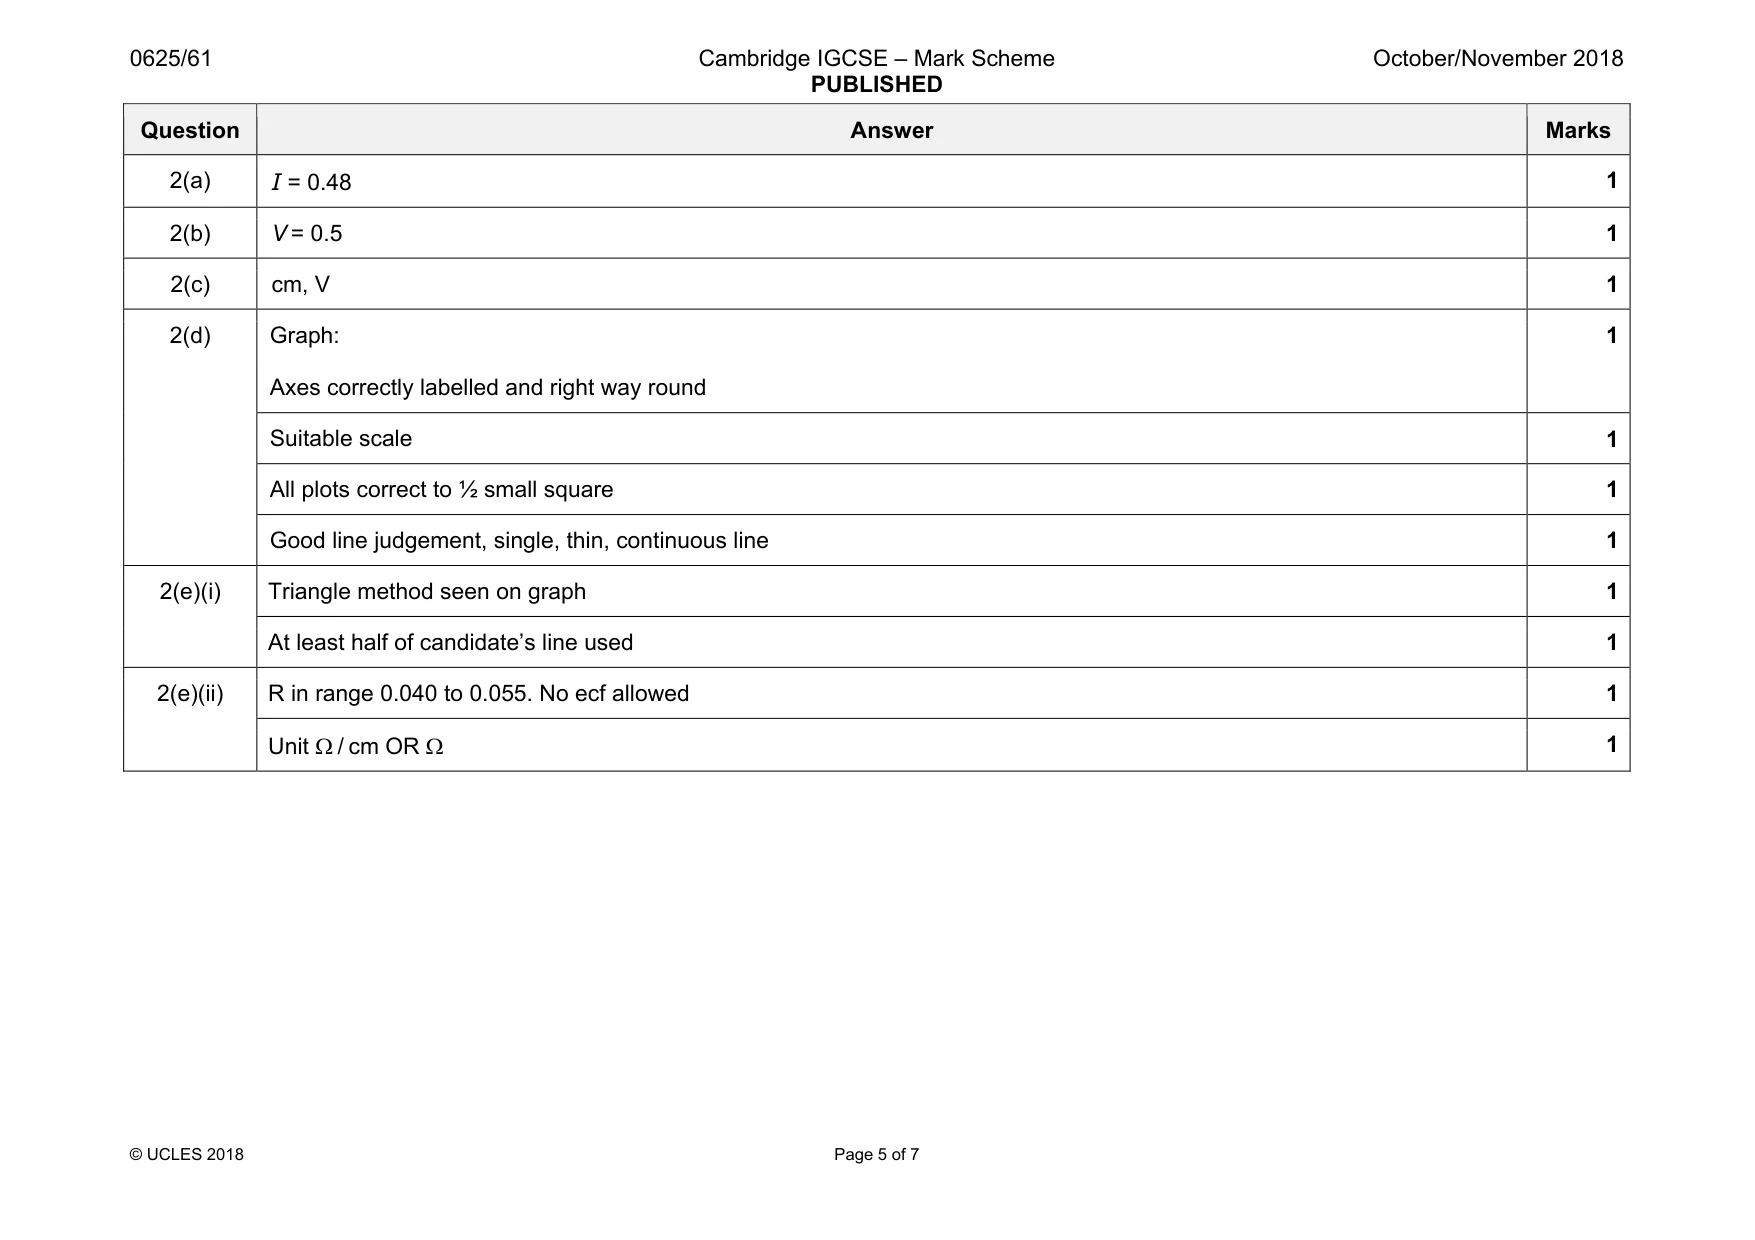
Mark scheme: 2(a) 1 2(b) V = 0.5 1 2(c) cm, V 1 2(d) Graph: Axes correctly labelled and right way round 1 Suitable scale 1 All plots correct to ½ small square 1 Good line judgement, single, thin, continuous line 1 2(e)(i) Triangle method seen on graph 1 At least half of candidate’s line used 1 2(e)(ii) R in range 0.040 to 0.055. No ecf allowed 1 Unit Ω / cm OR Ω 1
Q3 · A student is determining the refractive index n of the material of a transparent block
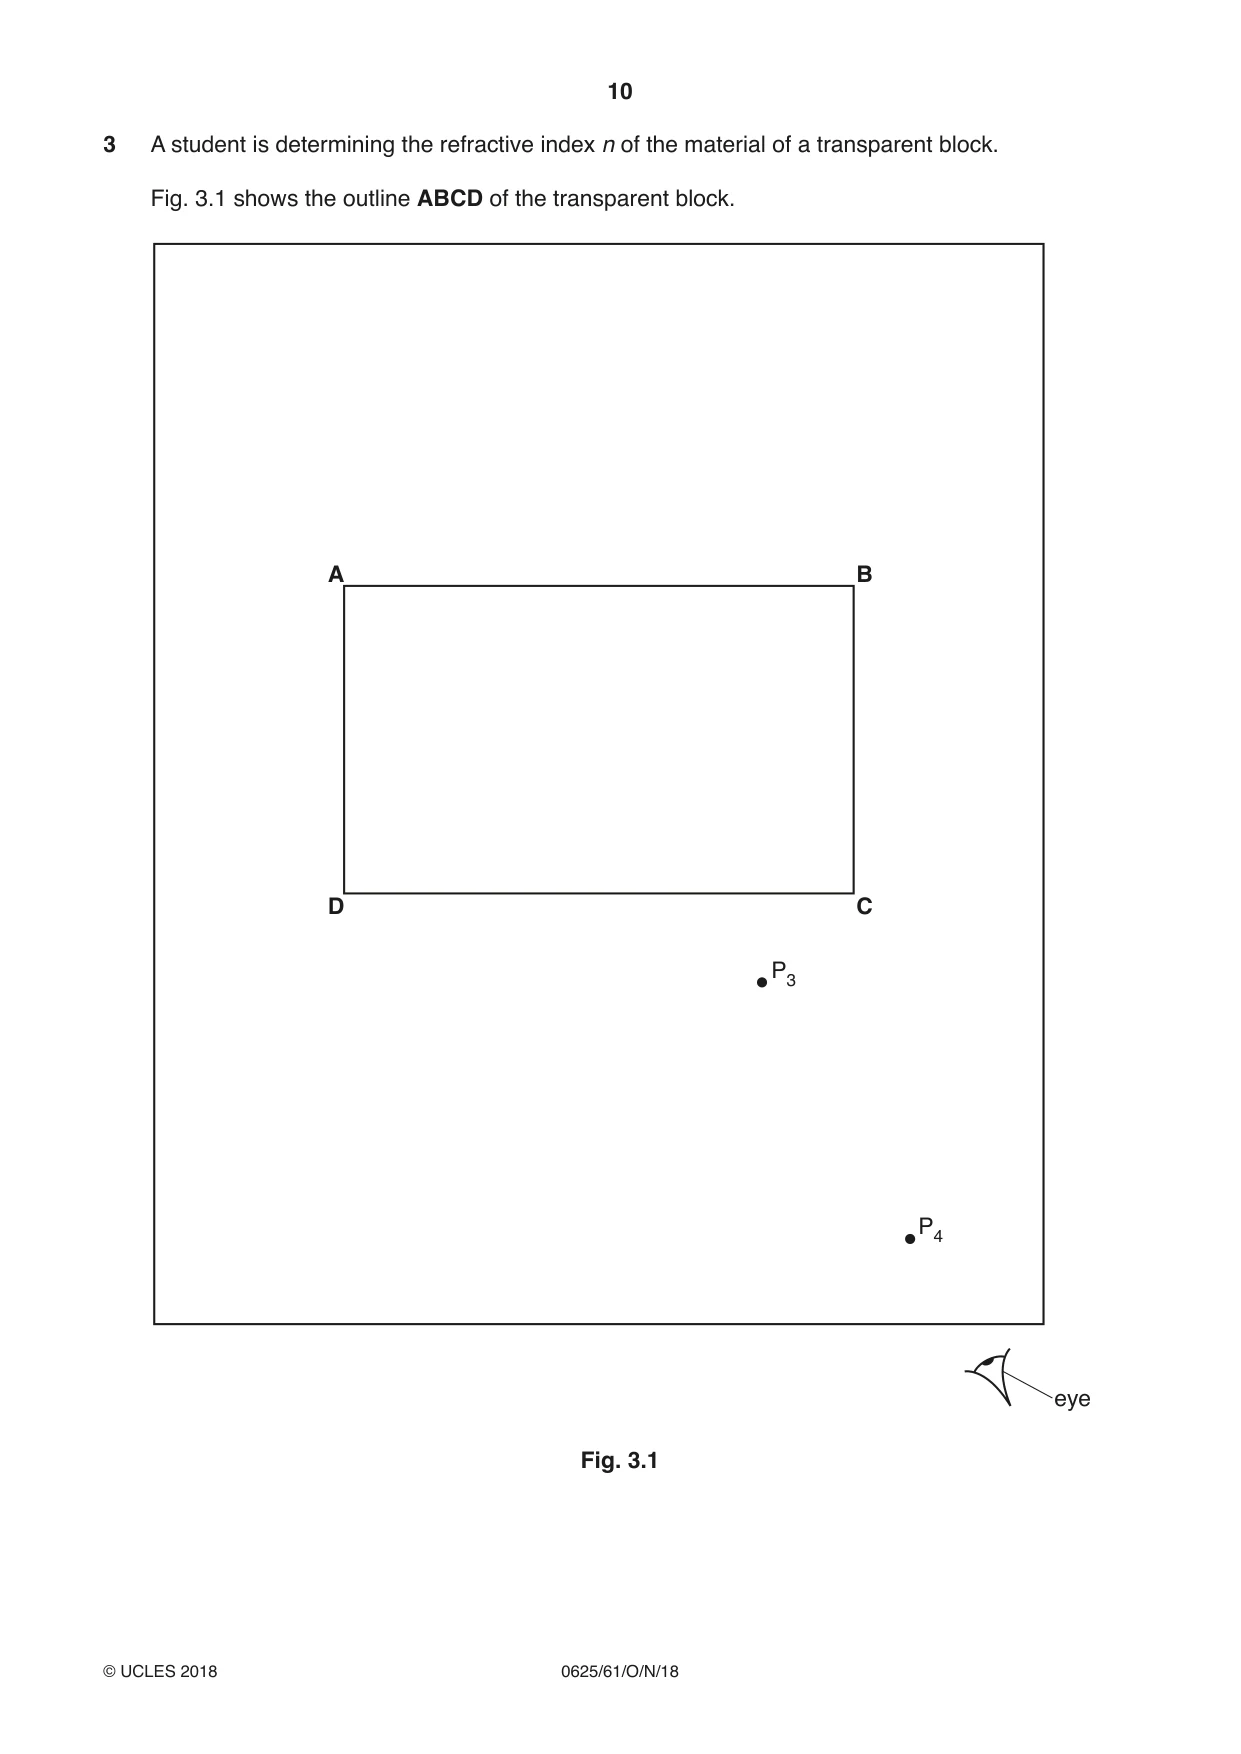
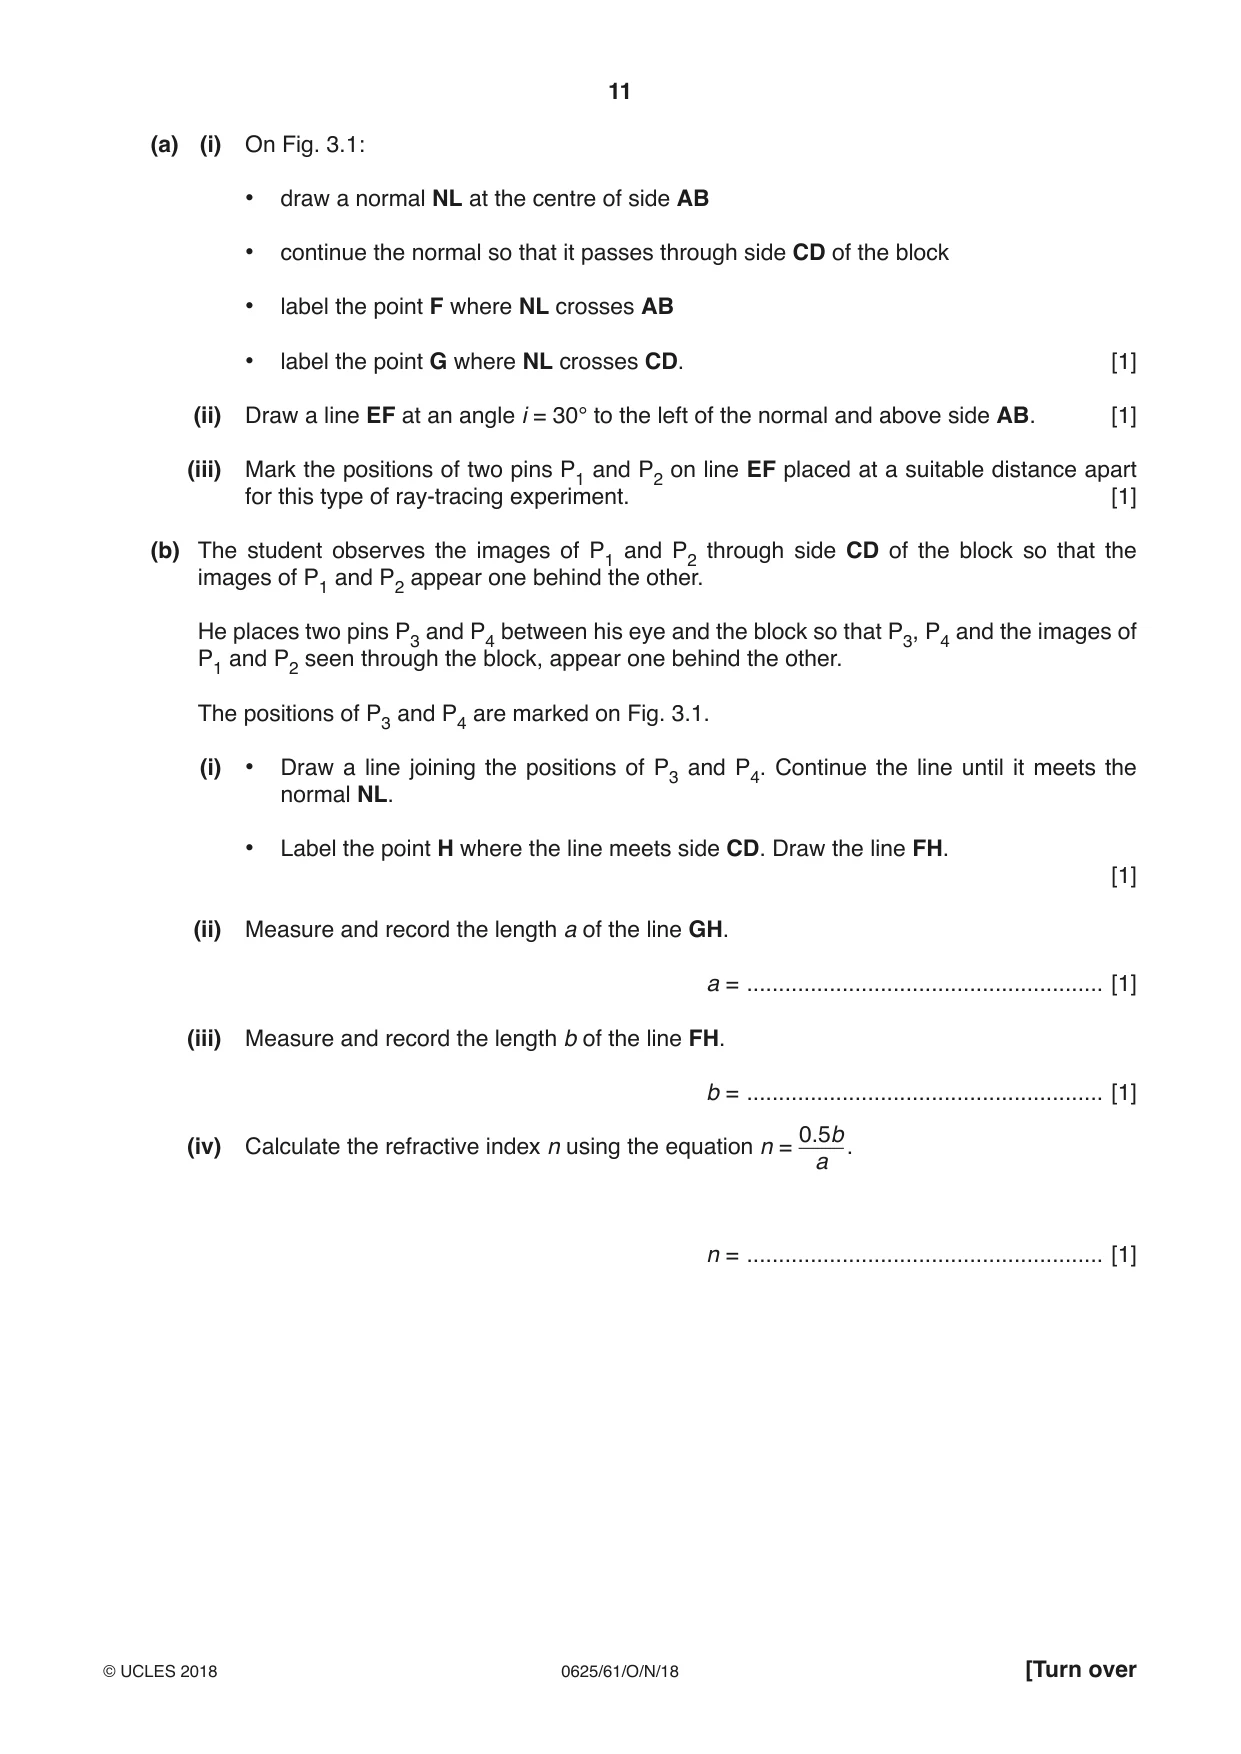
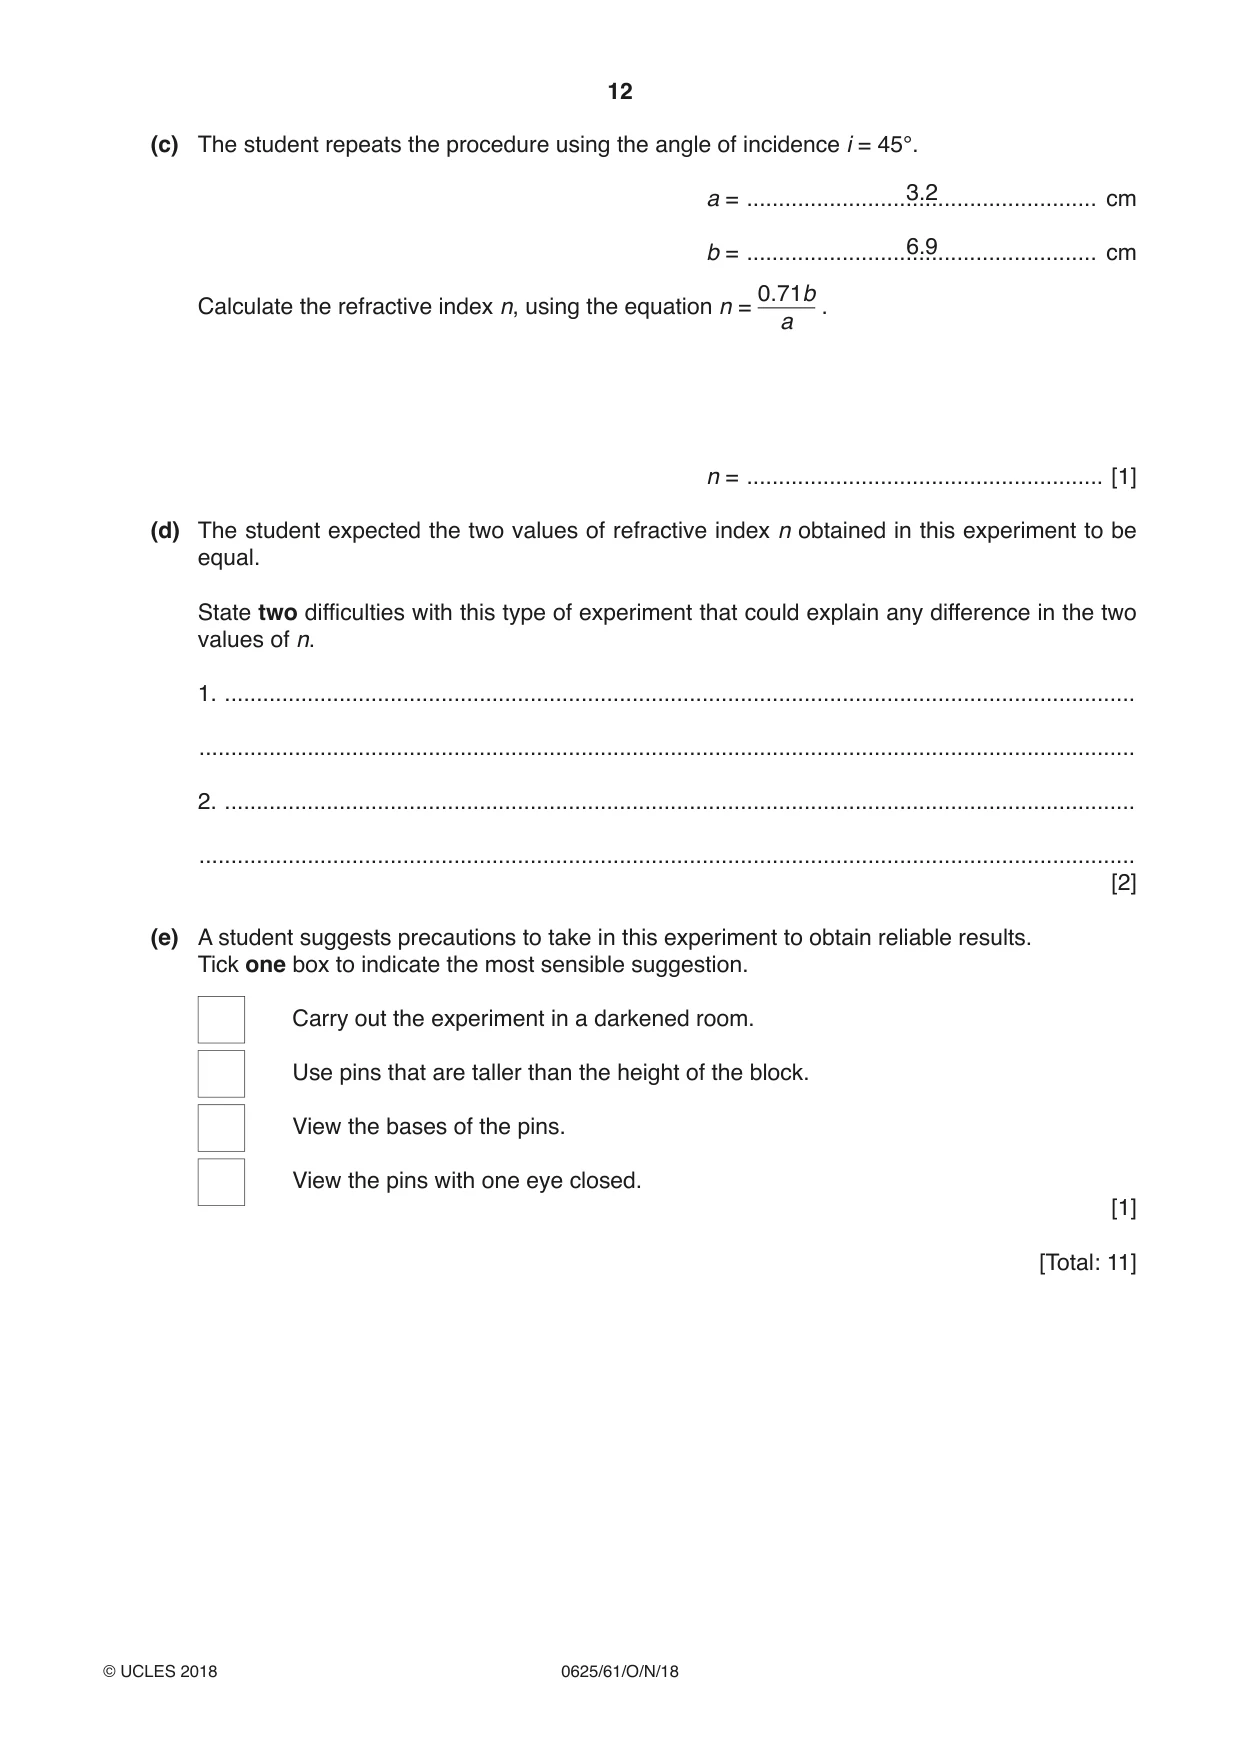
3 A student is determining the refractive index n of the material of a transparent block. Fig. 3.1 shows the outline ABCD of the transparent block. A B D C P3 P4 eye Fig. 3.1 (a) (i) On Fig. 3.1: • draw a normal NL at the centre of side AB • continue the normal so that it passes through side CD of the block • label the point F where NL crosses AB • label the point G where NL crosses CD. [1] (ii) Draw a line EF at an angle i = 30° to the left of the normal and above side AB. [1] (iii) Mark the positions of two pins P1 and P2 on line EF placed at a suitable distance apart for this type of ray-tracing experiment. [1] (b) The student observes the images of P1 and P2 through side CD of the block so that the images of P1 and P2 appear one behind the other. He places two pins P3 and P4 between his eye and the block so that P3, P4 and the images of P1 and P2 seen through the block, appear one behind the other. The positions of P3 and P4 are marked on Fig. 3.1. (i) • Draw a line joining the positions of P3 and P4. Continue the line until it meets the normal NL. • Label the point H where the line meets side CD. Draw the line FH. [1] (ii) Measure and record the length a of the line GH. a = ........................................................ [1] (iii) Measure and record the length b of the line FH. b = ........................................................ [1] 0.5b (iv) Calculate the refractive index n using the equation n = . a n = ........................................................ [1] (c) The student repeats the procedure using the angle of incidence i = 45°. a = .......................................................3.2 cm b = .......................................................6.9 cm 0.71b Calculate the refractive index n, using the equation n = . a n = ........................................................ [1] (d) The student expected the two values of refractive index n obtained in this experiment to be equal. State two difficulties with this type of experiment that could explain any difference in the two values of n. 1. ............................................................................................................................................... ................................................................................................................................................... 2. ............................................................................................................................................... ................................................................................................................................................... [2] (e) A student suggests precautions to take in this experiment to obtain reliable results. Tick one box to indicate the most sensible suggestion. Carry out the experiment in a darkened room. Use pins that are taller than the height of the block. View the bases of the pins. View the pins with one eye closed. [1] [Total: 11]
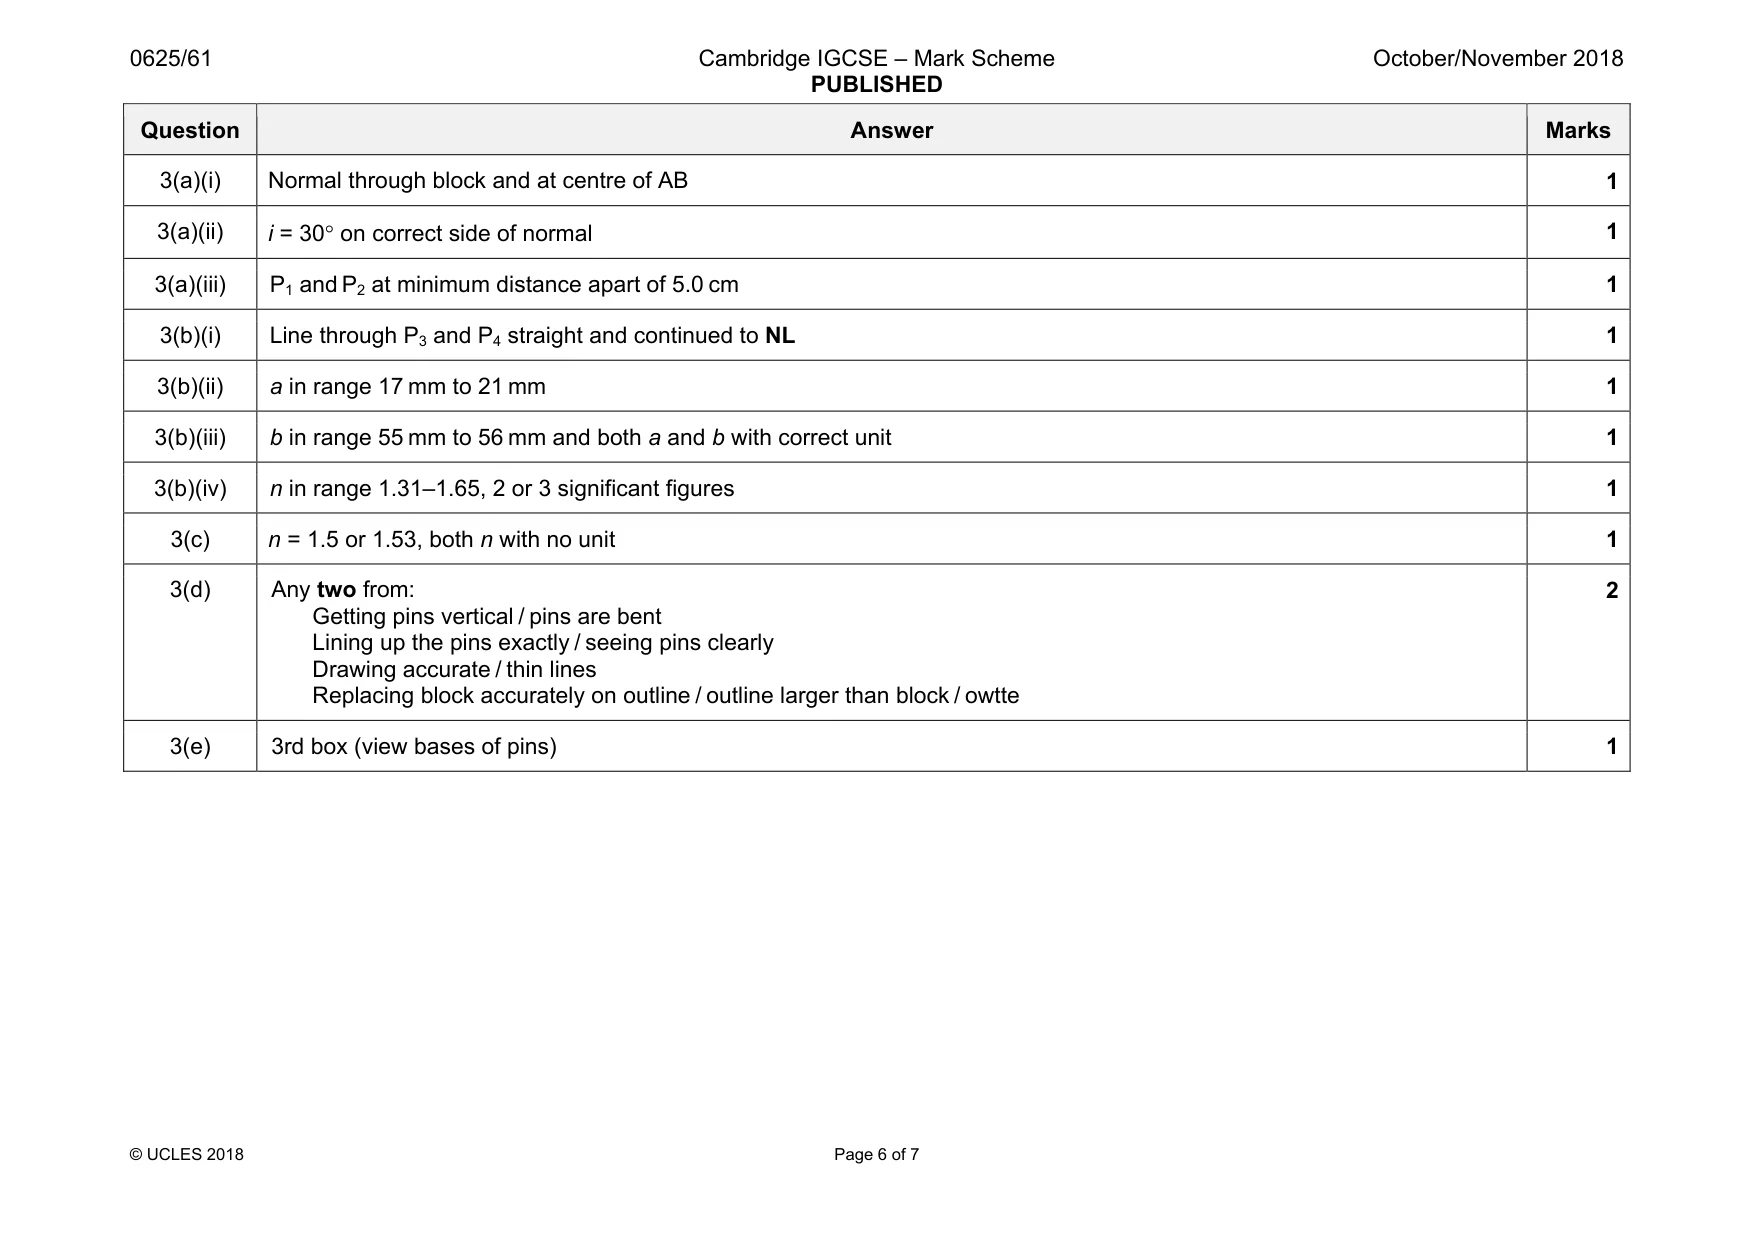
Mark scheme: 3(a)(i) Normal through block and at centre of AB 1 3(a)(ii) i = 30° on correct side of normal 1 3(a)(iii) P1 and P2 at minimum distance apart of 5.0 cm 1 3(b)(i) Line through P3 and P4 straight and continued to NL 1 3(b)(ii) a in range 17 mm to 21 mm 1 3(b)(iii) b in range 55 mm to 56 mm and both a and b with correct unit 1 3(b)(iv) n in range 1.31–1.65, 2 or 3 significant figures 1 3(c) n = 1.5 or 1.53, both n with no unit 1 3(d) Any two from: Getting pins vertical / pins are bent Lining up the pins exactly / seeing pins clearly Drawing accurate / thin lines Replacing block accurately on outline / outline larger than block / owtte 2 3(e) 3rd box (view bases of pins) 1
Q4 · A student is investigating the relationship between the power produced by an electrical…
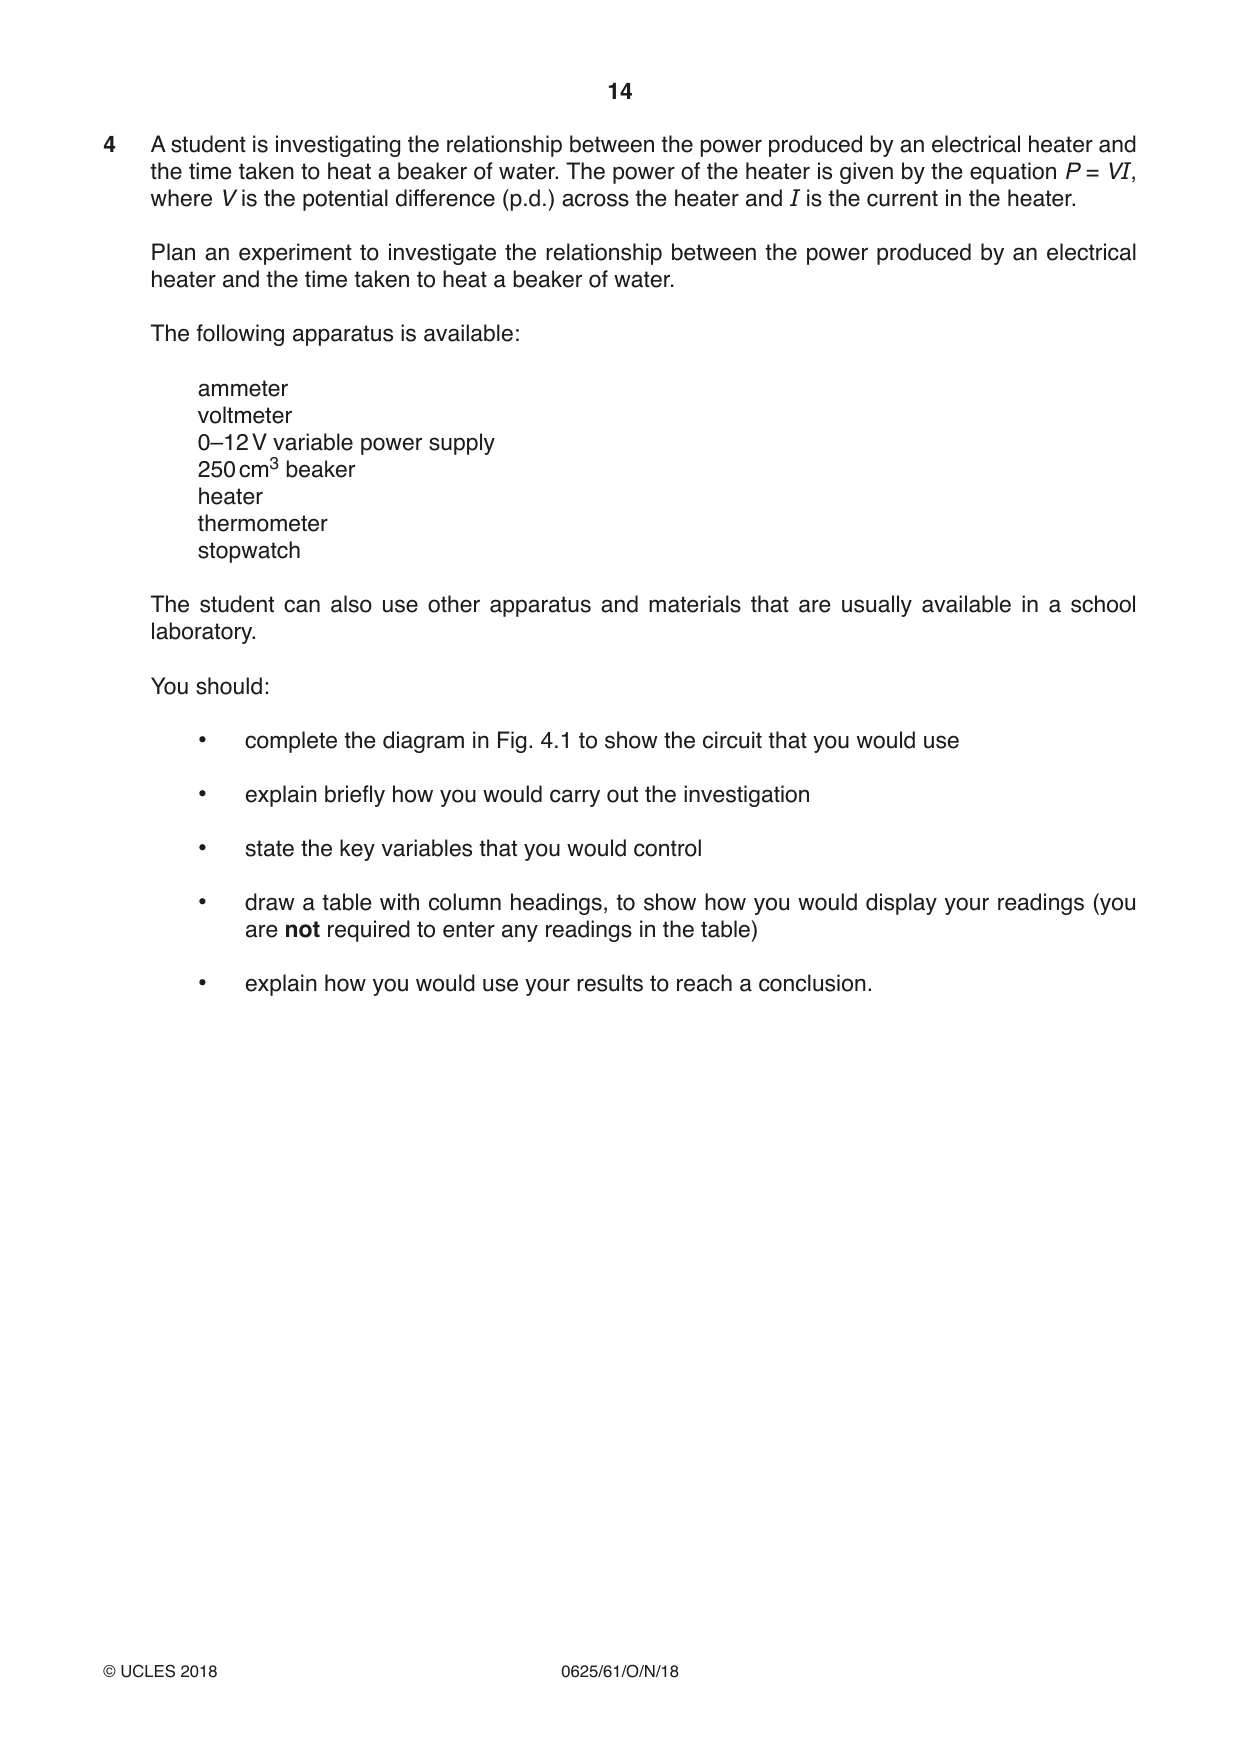
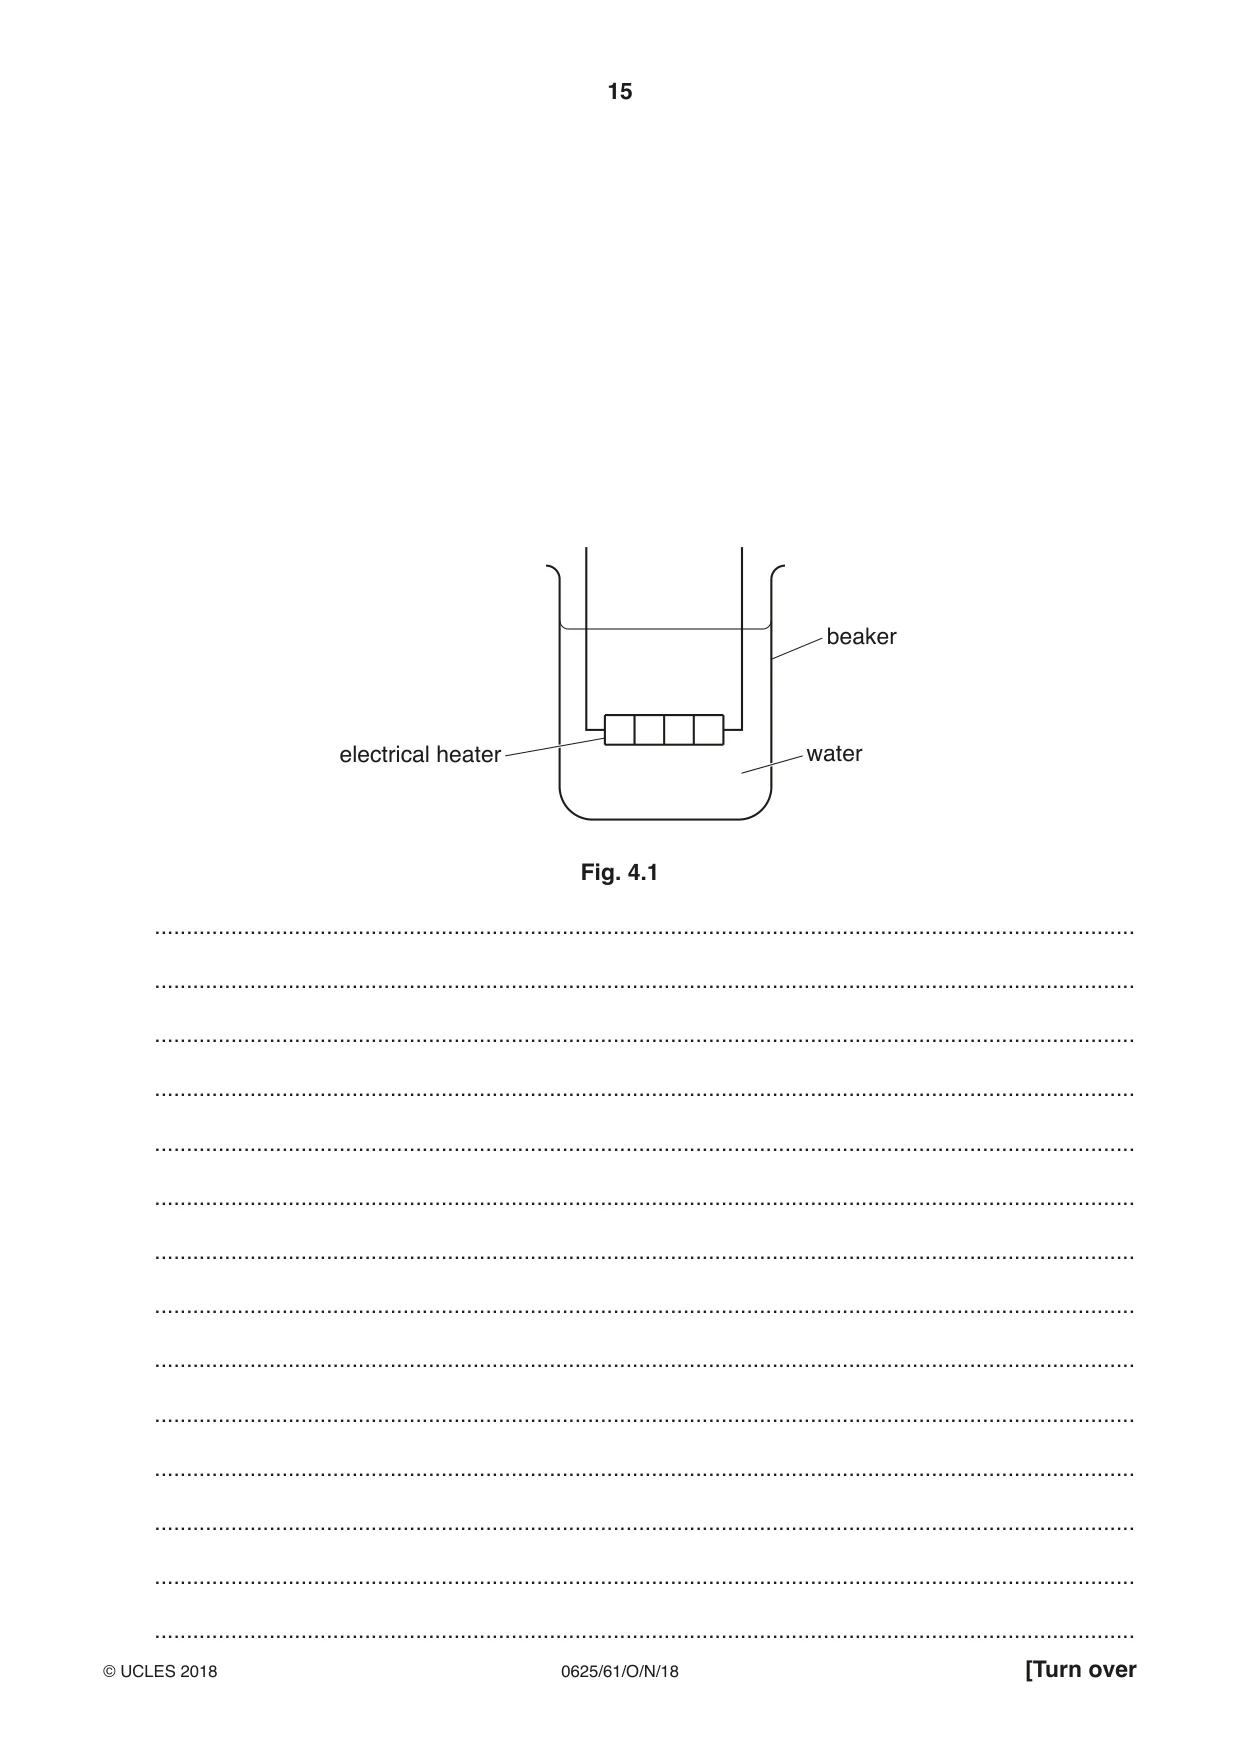
4 A student is investigating the relationship between the power produced by an electrical heater and the time taken to heat a beaker of water. The power of the heater is given by the equation P = VI, where V is the potential difference (p.d.) across the heater and I is the current in the heater. Plan an experiment to investigate the relationship between the power produced by an electrical heater and the time taken to heat a beaker of water. The following apparatus is available: ammeter voltmeter 0–12 V variable power supply 250 cm3 beaker heater thermometer stopwatch The student can also use other apparatus and materials that are usually available in a school laboratory. You should: • complete the diagram in Fig. 4.1 to show the circuit that you would use • explain briefly how you would carry out the investigation • state the key variables that you would control • draw a table with column headings, to show how you would display your readings (you are not required to enter any readings in the table) • explain how you would use your results to reach a conclusion. beaker electrical heater water Fig. 4.1 .......................................................................................................................................................... .......................................................................................................................................................... .......................................................................................................................................................... .......................................................................................................................................................... .......................................................................................................................................................... .......................................................................................................................................................... .......................................................................................................................................................... .......................................................................................................................................................... .......................................................................................................................................................... .......................................................................................................................................................... .......................................................................................................................................................... .......................................................................................................................................................... .......................................................................................................................................................... .......................................................................................................................................................... .......................................................................................................................................................... .......................................................................................................................................................... .......................................................................................................................................................... .......................................................................................................................................................... .......................................................................................................................................................... .......................................................................................................................................................... .......................................................................................................................................................... ..................................................................................................................................................... [7] [Total: 7]
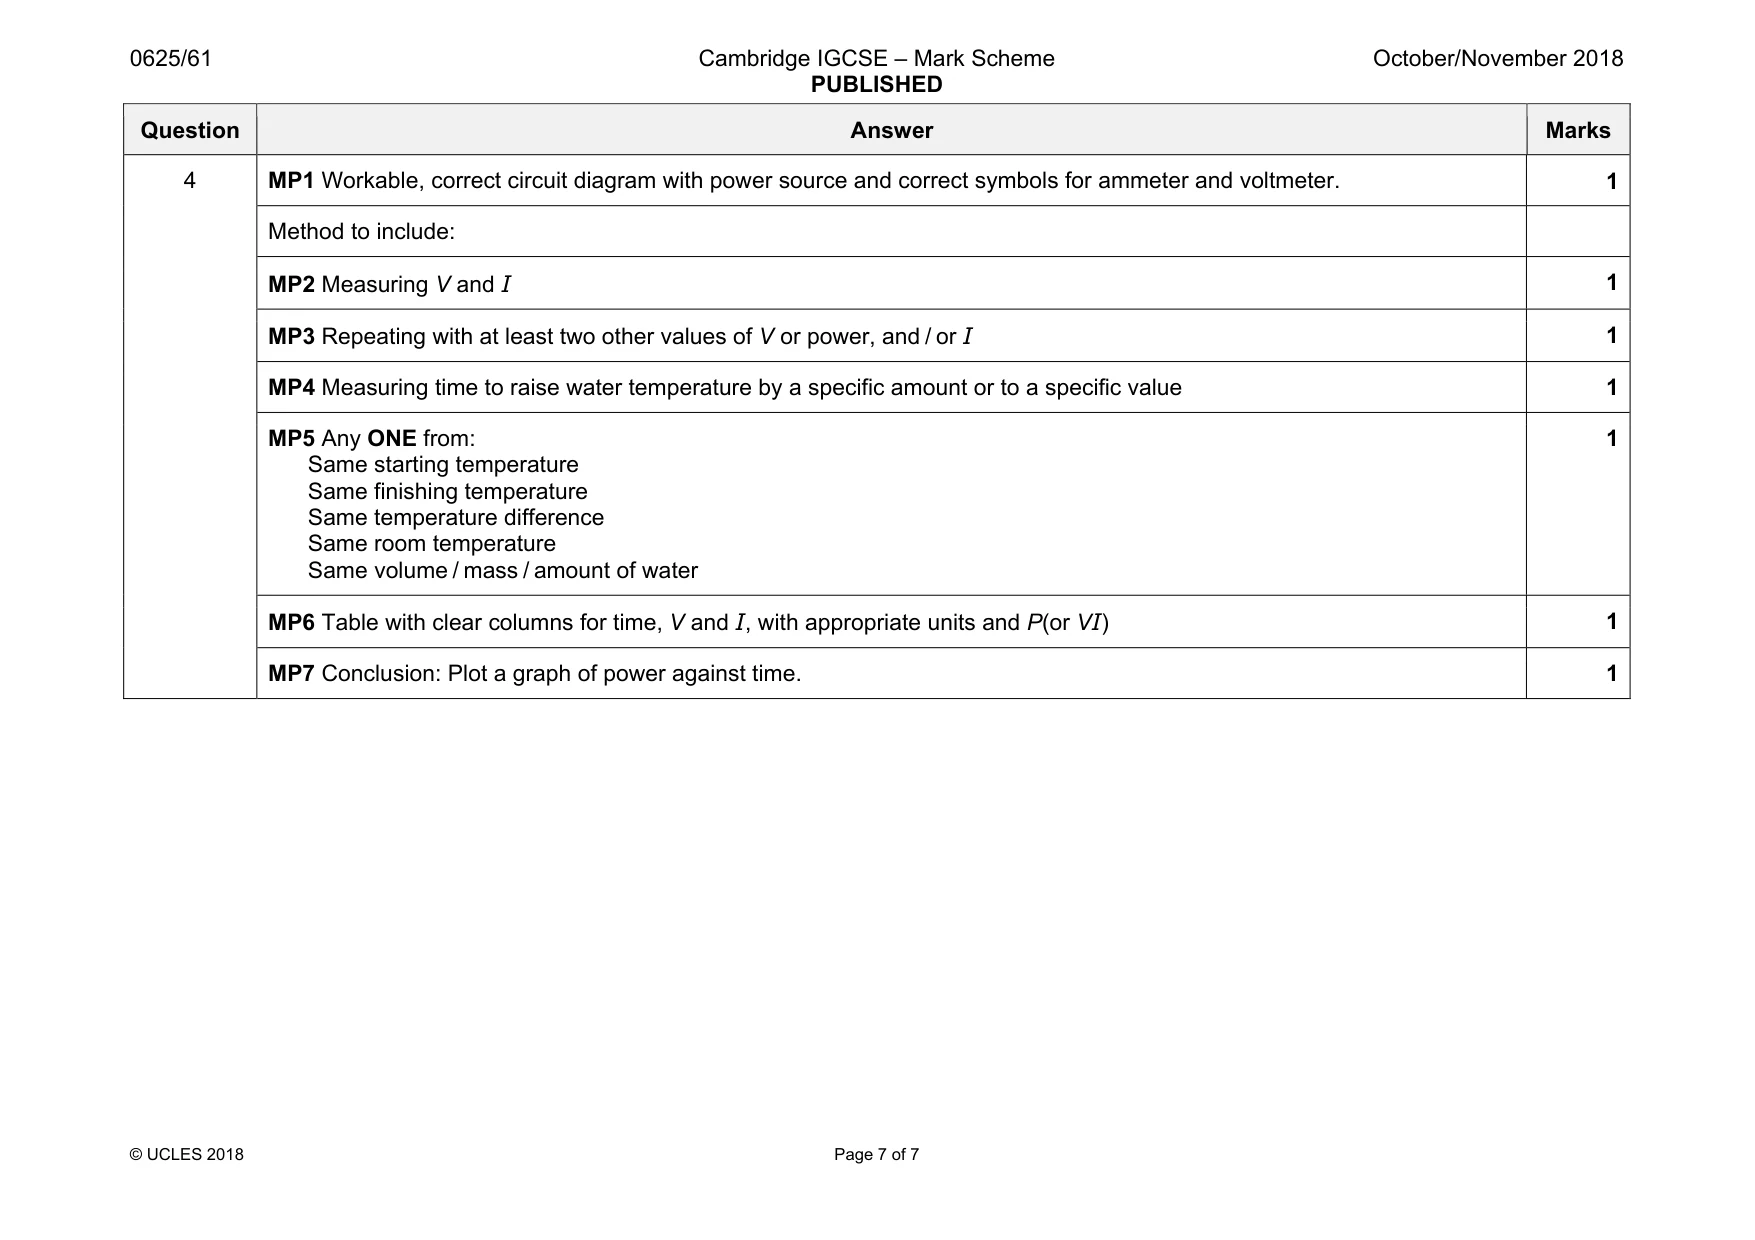
Mark scheme: 4 MP1 Workable, correct circuit diagram with power source and correct symbols for ammeter and voltmeter. 1 Method to include: MP2 Measuring V and I 1 MP3 Repeating with at least two other values of V or power, and / or I 1 MP4 Measuring time to raise water temperature by a specific amount or to a specific value 1 MP5 Any ONE from: Same starting temperature Same finishing temperature Same temperature difference Same room temperature Same volume / mass / amount of water 1 MP6 Table with clear columns for time, V and I, with appropriate units and P(or VI) 1 MP7 Conclusion: Plot a graph of power against time. 1
What was in this paper
The subtopics covered by these 4 questions, and how many questions each got. Open one in a new tab to see every Cambridge question on it.
What you needed in this session
Cambridge’s own grade thresholds for 2018 Oct/Nov, Paper 6 · Variant 1. A higher threshold means an easier paper — the bar moves with how the cohort did.