Cambridge IGCSE Physics 0625 — 2015 May/June Paper 5 · Variant 3
0625/53/M/J/15 · 4 questions · 40 marks · ≈45 min
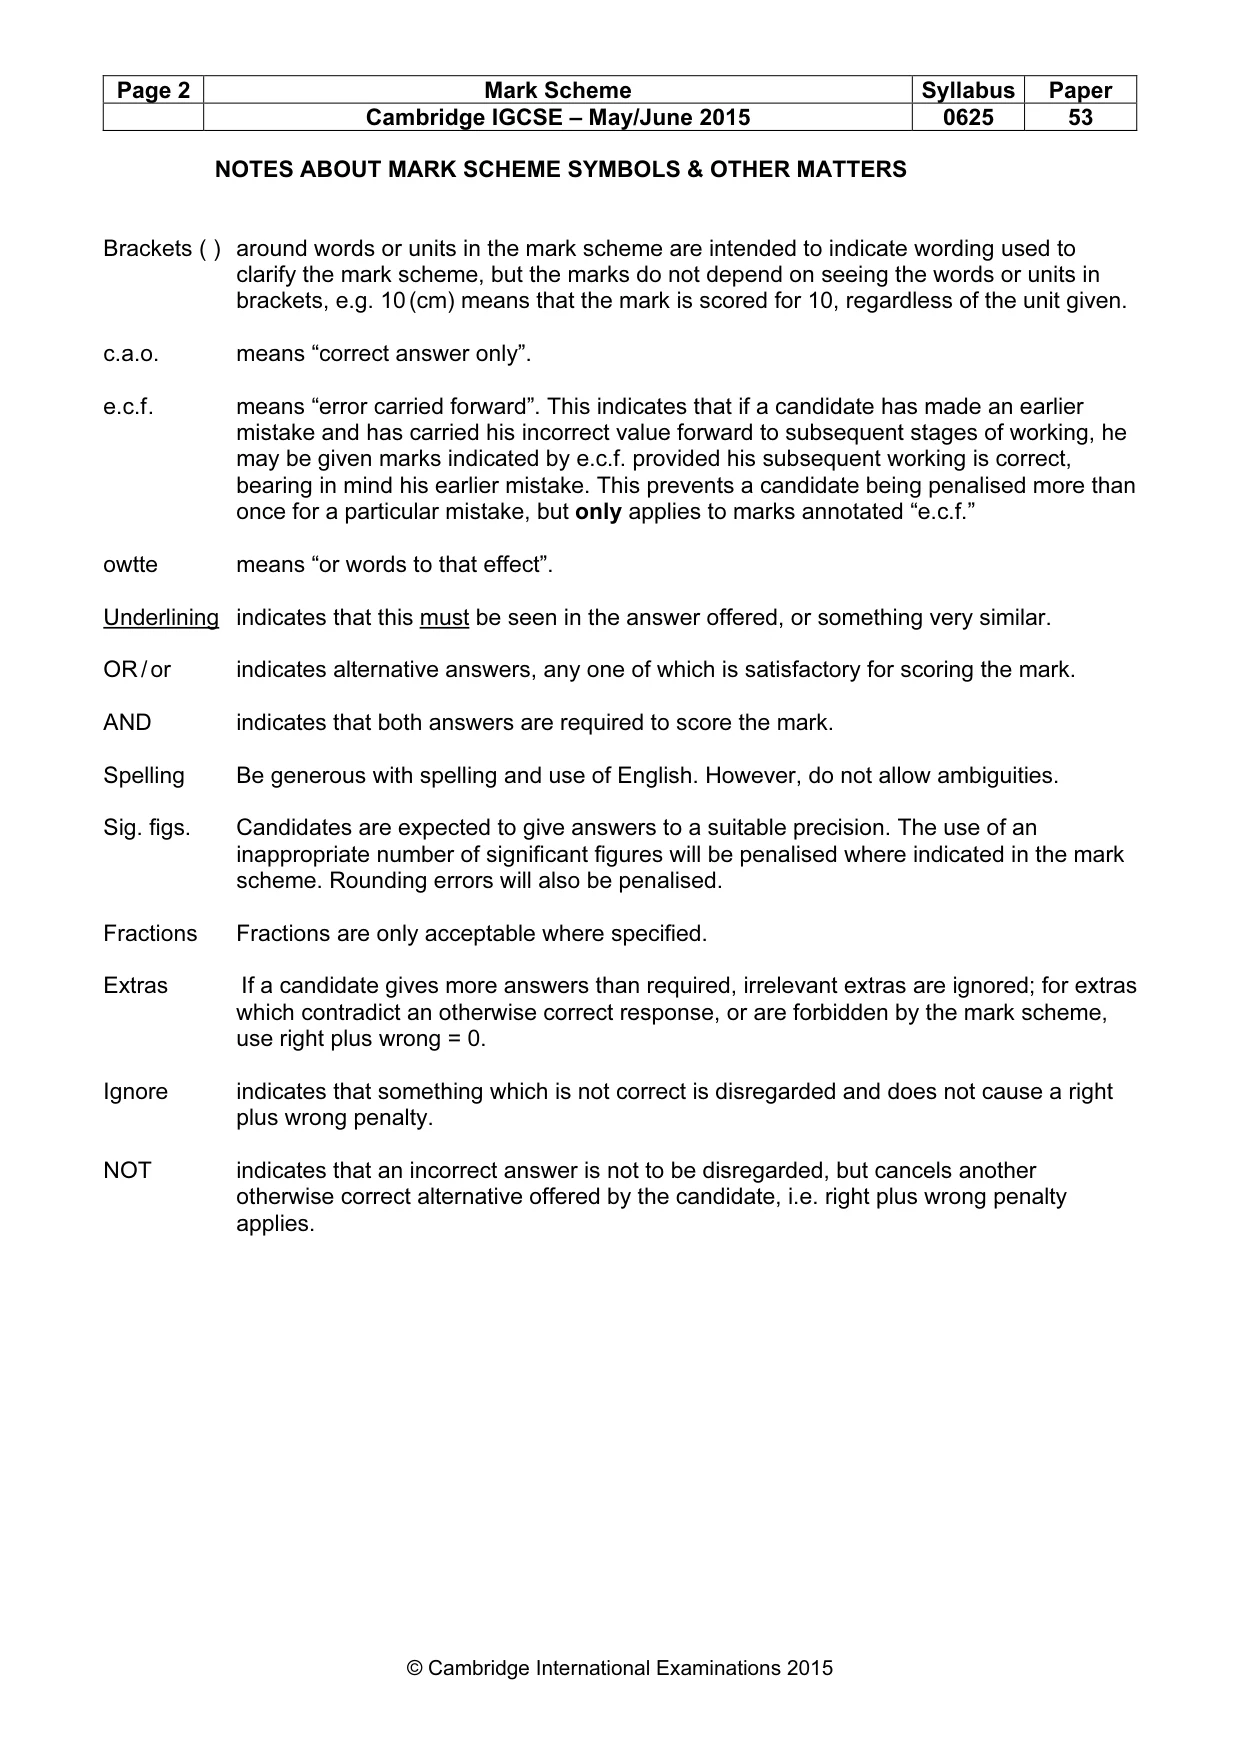
The question paper and its mark scheme, free to read here and free to download. This is Cambridge’s own paper, exactly as it was sat.
Question paper12 pages

Mark scheme5 pages
Answers below. Sit the paper first if you are practising.
Questions as text
Q1 · In this experiment, you will determine the mass of an object using two strings
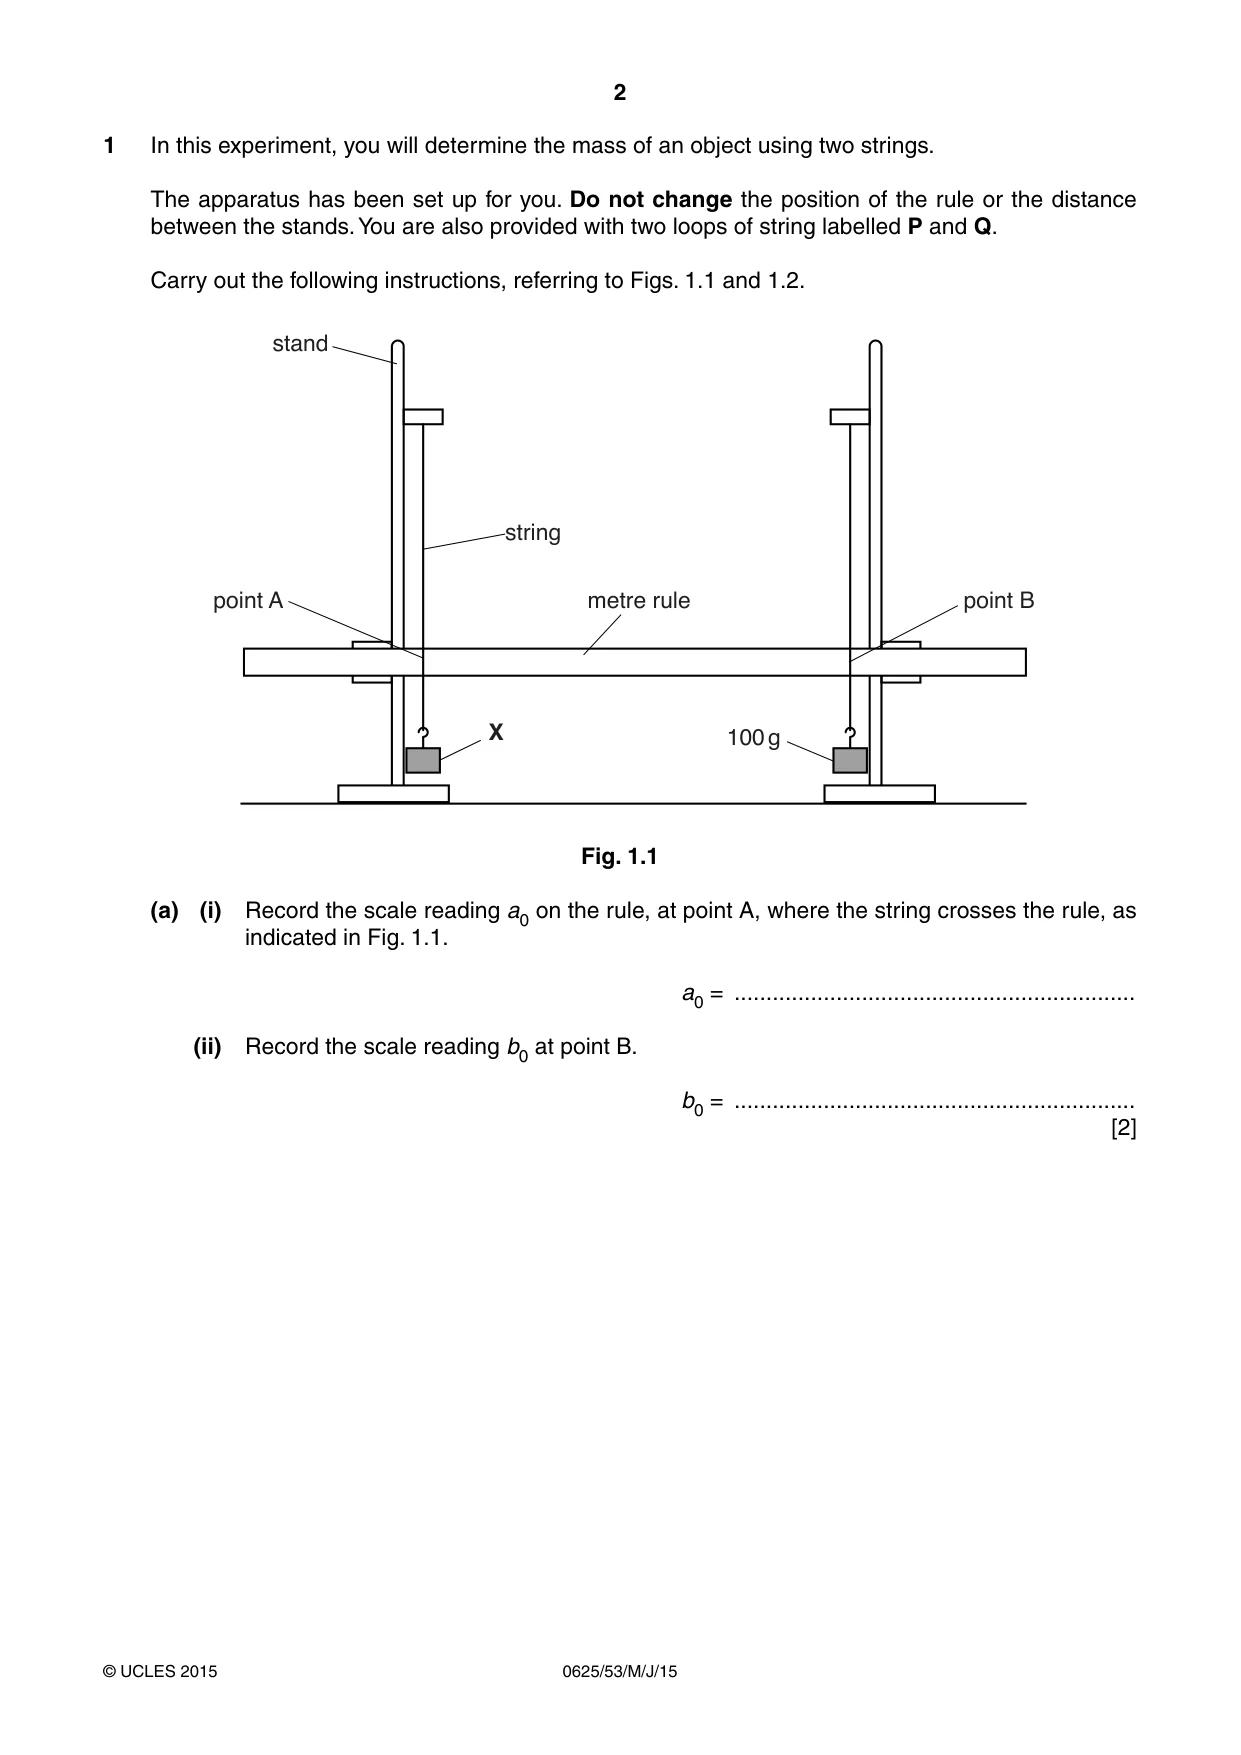
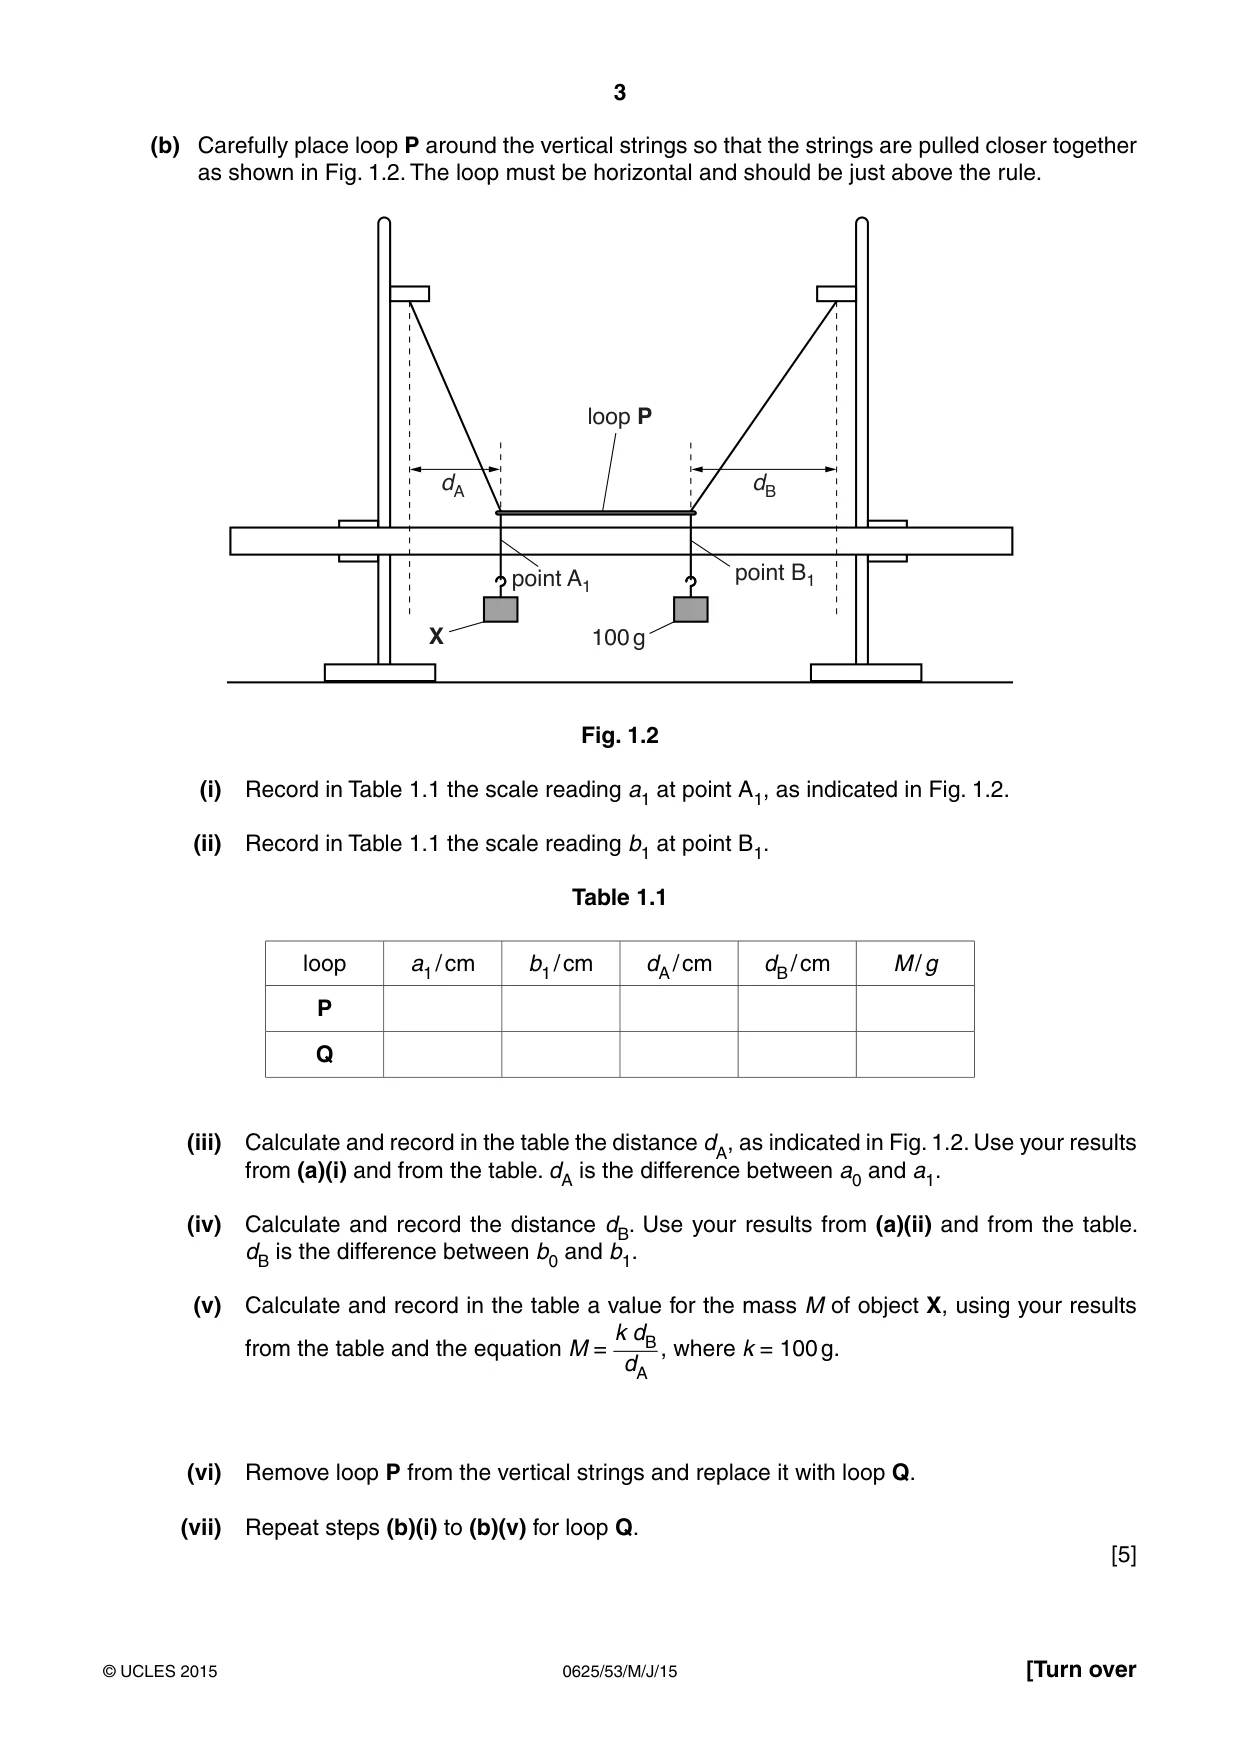
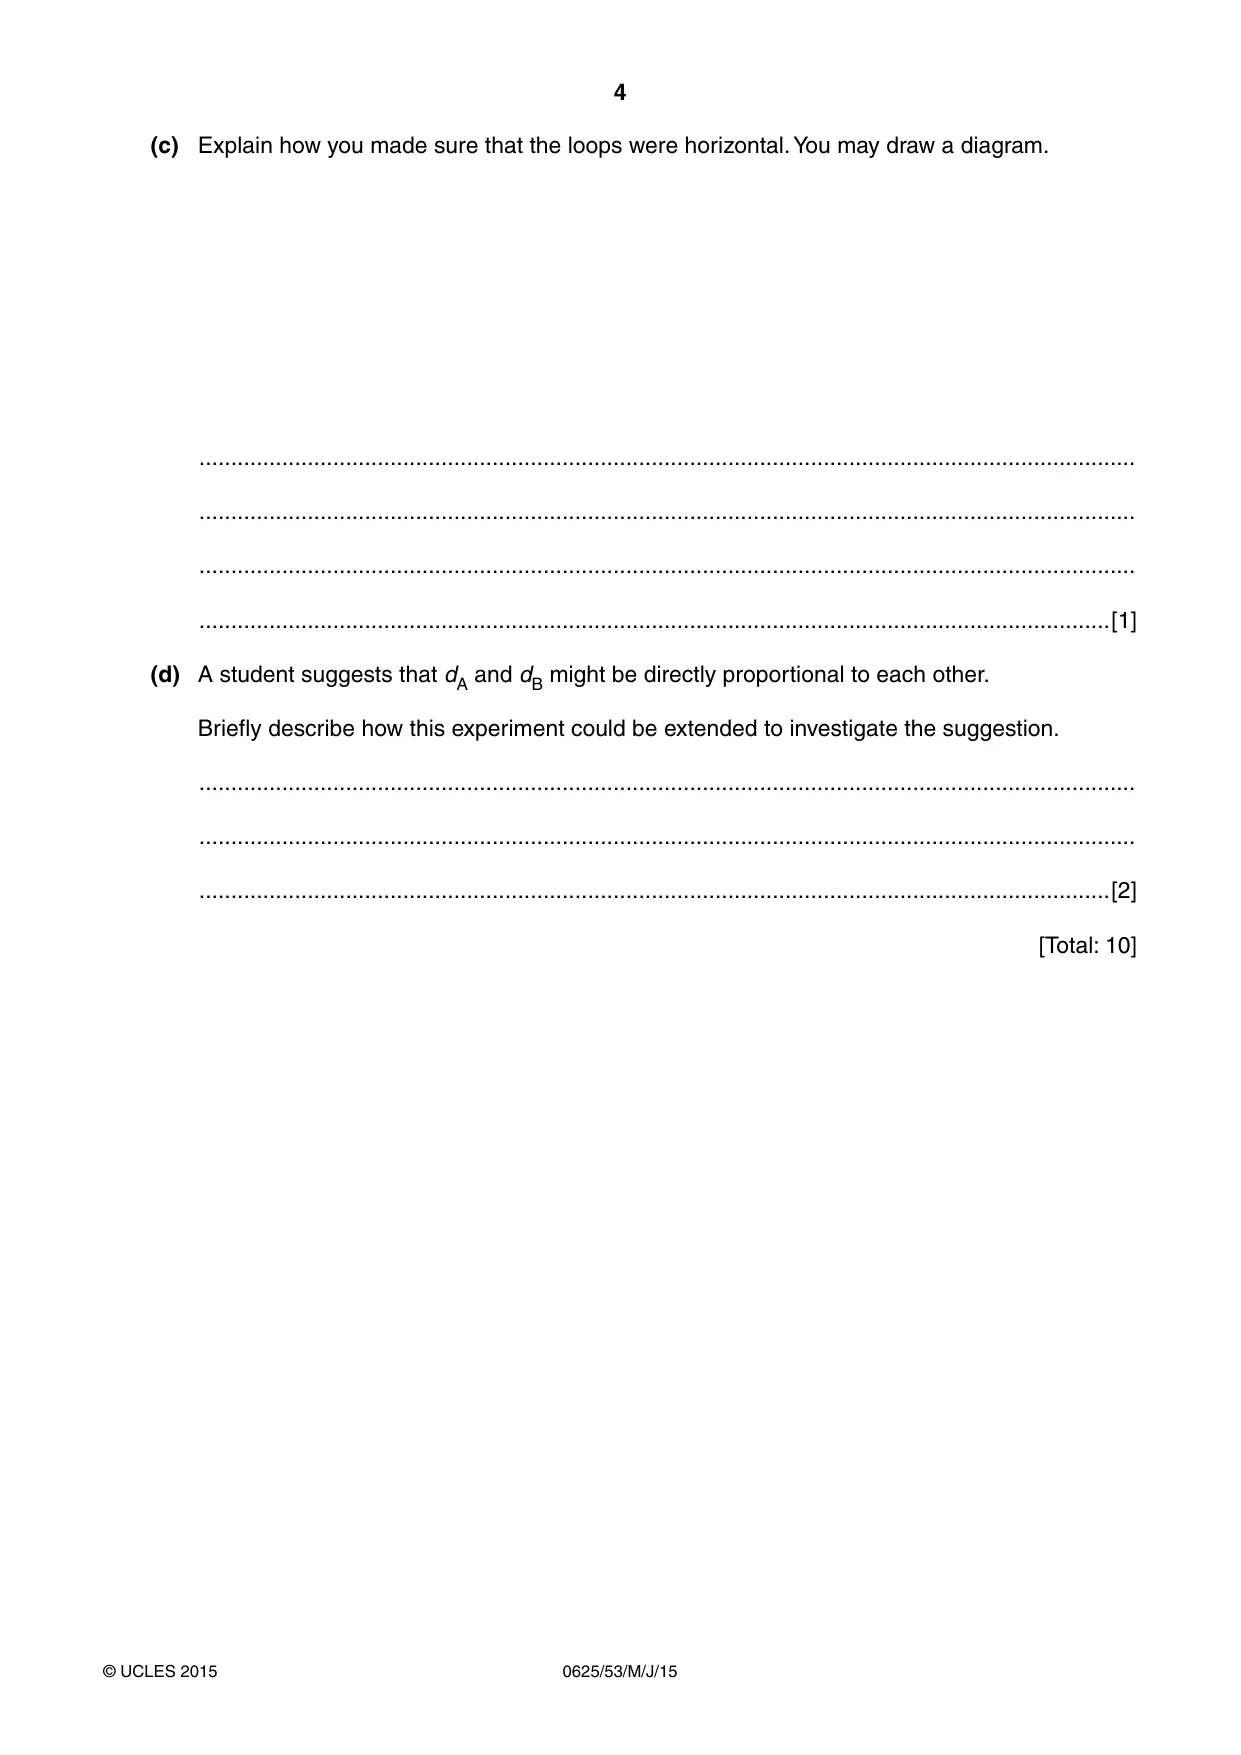
1 In this experiment, you will determine the mass of an object using two strings. The apparatus has been set up for you. Do not change the position of the rule or the distance between the stands. You are also provided with two loops of string labelled P and Q. Carry out the following instructions, referring to Figs. 1.1 and 1.2. stand string point A metre rule point B X 100 g Fig. 1.1 (a) (i) Record the scale reading a0 on the rule, at point A, where the string crosses the rule, as indicated in Fig. 1.1. a0 = ............................................................... (ii) Record the scale reading b0 at point B. b0 = ............................................................... [2] (b) Carefully place loop P around the vertical strings so that the strings are pulled closer together as shown in Fig. 1.2. The loop must be horizontal and should be just above the rule. loop P dA dB point A1 point B1 X 100 g Fig. 1.2 (i) Record in Table 1.1 the scale reading a1 at point A1, as indicated in Fig. 1.2. (ii) Record in Table 1.1 the scale reading b1 at point B1. Table 1.1 loop a1 / cm b1 / cm dA / cm dB / cm M / g P Q (iii) Calculate and record in the table the distance dA, as indicated in Fig. 1.2. Use your results from (a)(i) and from the table. dA is the difference between a0 and a1. (iv) Calculate and record the distance dB. Use your results from (a)(ii) and from the table. dB is the difference between b0 and b1. (v) Calculate and record in the table a value for the mass M of object X, using your results k dB from the table and the equation M = , where k = 100 g. dA (vi) Remove loop P from the vertical strings and replace it with loop Q. (vii) Repeat steps (b)(i) to (b)(v) for loop Q. [5] (c) Explain how you made sure that the loops were horizontal. You may draw a diagram. ................................................................................................................................................... ................................................................................................................................................... ................................................................................................................................................... ...............................................................................................................................................[1] (d) A student suggests that dA and dB might be directly proportional to each other. Briefly describe how this experiment could be extended to investigate the suggestion. ................................................................................................................................................... ................................................................................................................................................... ...............................................................................................................................................[2] [Total: 10]
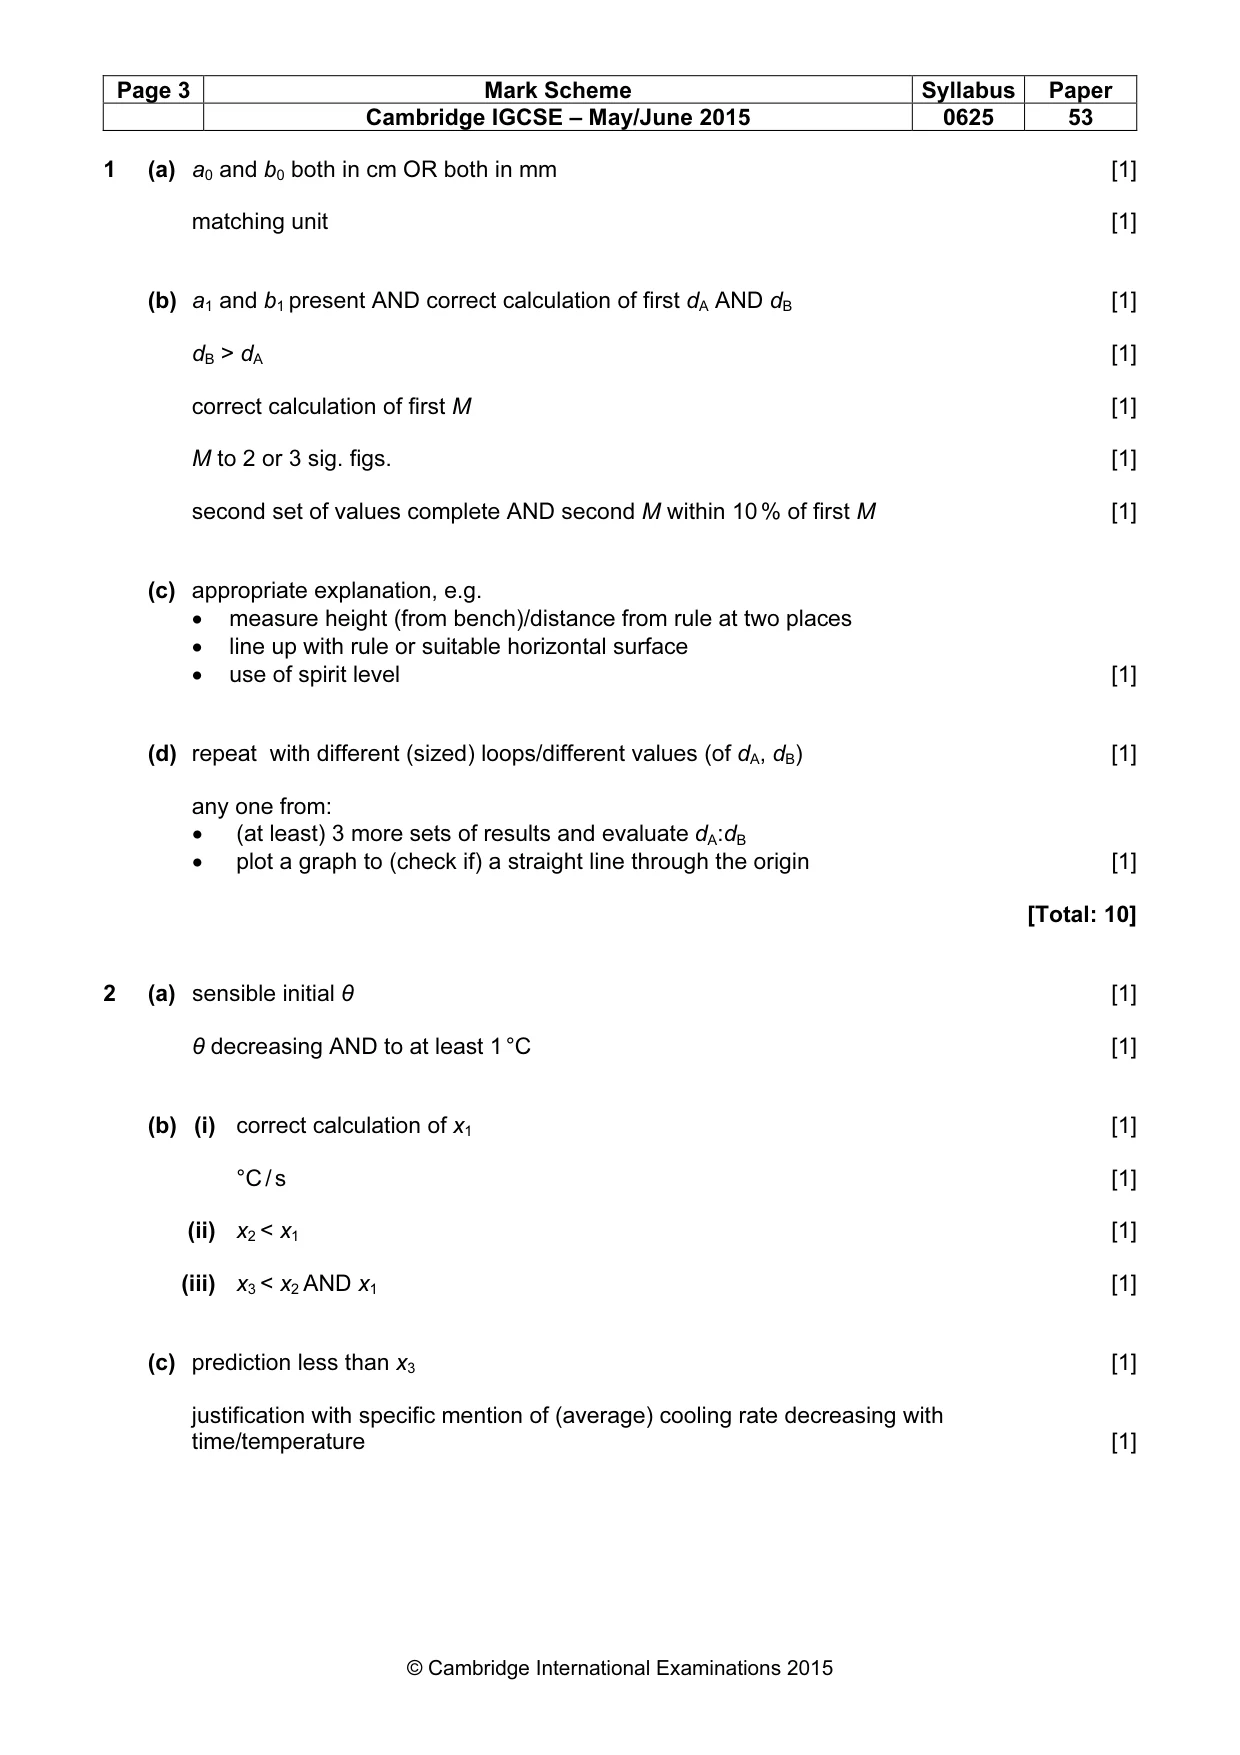
Mark scheme: 1 (a) a0 and b0 both in cm OR both in mm [1] matching unit [1] (b) a1 and b1 present AND correct calculation of first dA AND dB [1] dB > dA [1] correct calculation of first M [1] M to 2 or 3 sig. figs. [1] second set of values complete AND second M within 10 % of first M [1] (c) appropriate explanation, e.g. • measure height (from bench)/distance from rule at two places • line up with rule or suitable horizontal surface • use of spirit level [1] (d) repeat with different (sized) loops/different values (of dA, dB) [1] any one from: • (at least) 3 more sets of results and evaluate dA:dB • plot a graph to (check if) a straight line through the origin [1] [Total: 10]
More questions on Physical quantities and measurement techniques
Q2 · In this experiment, you will investigate the cooling of water
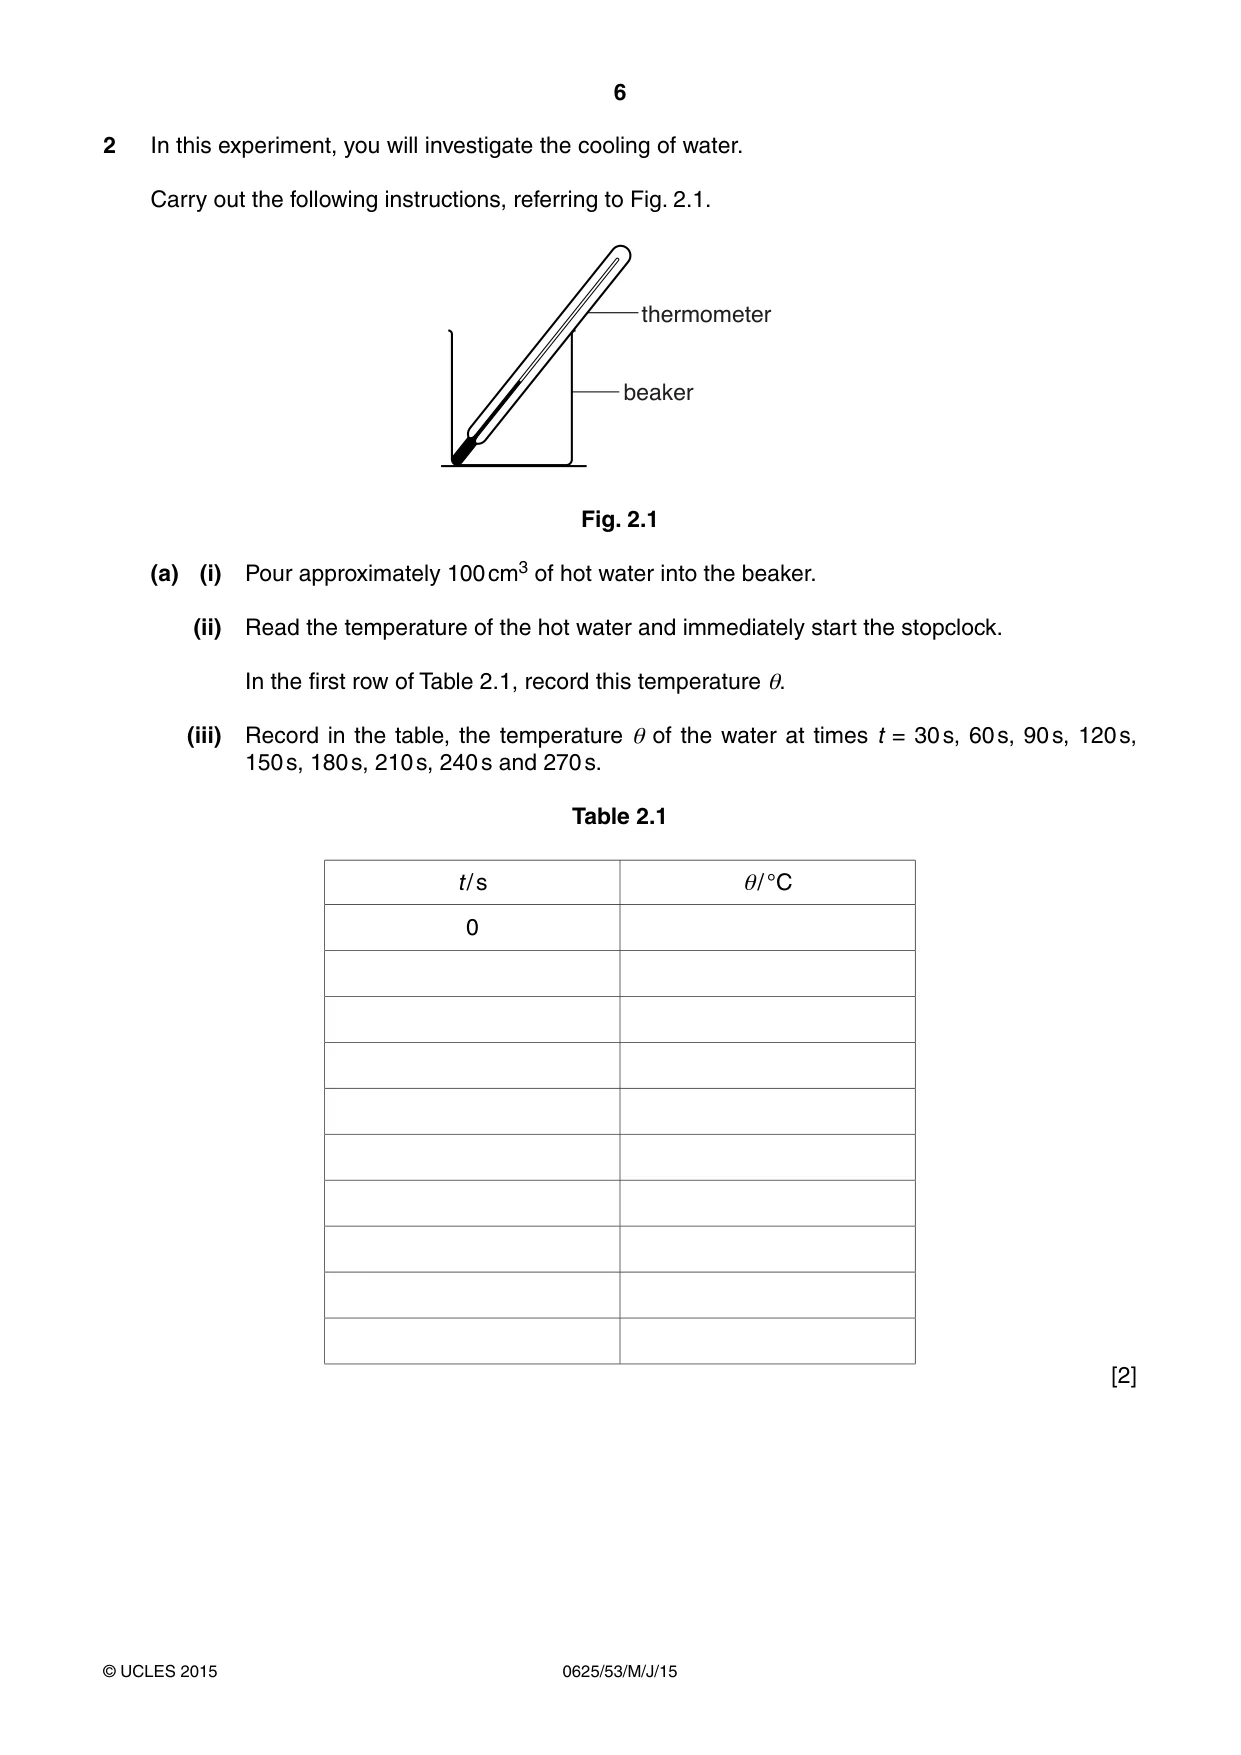
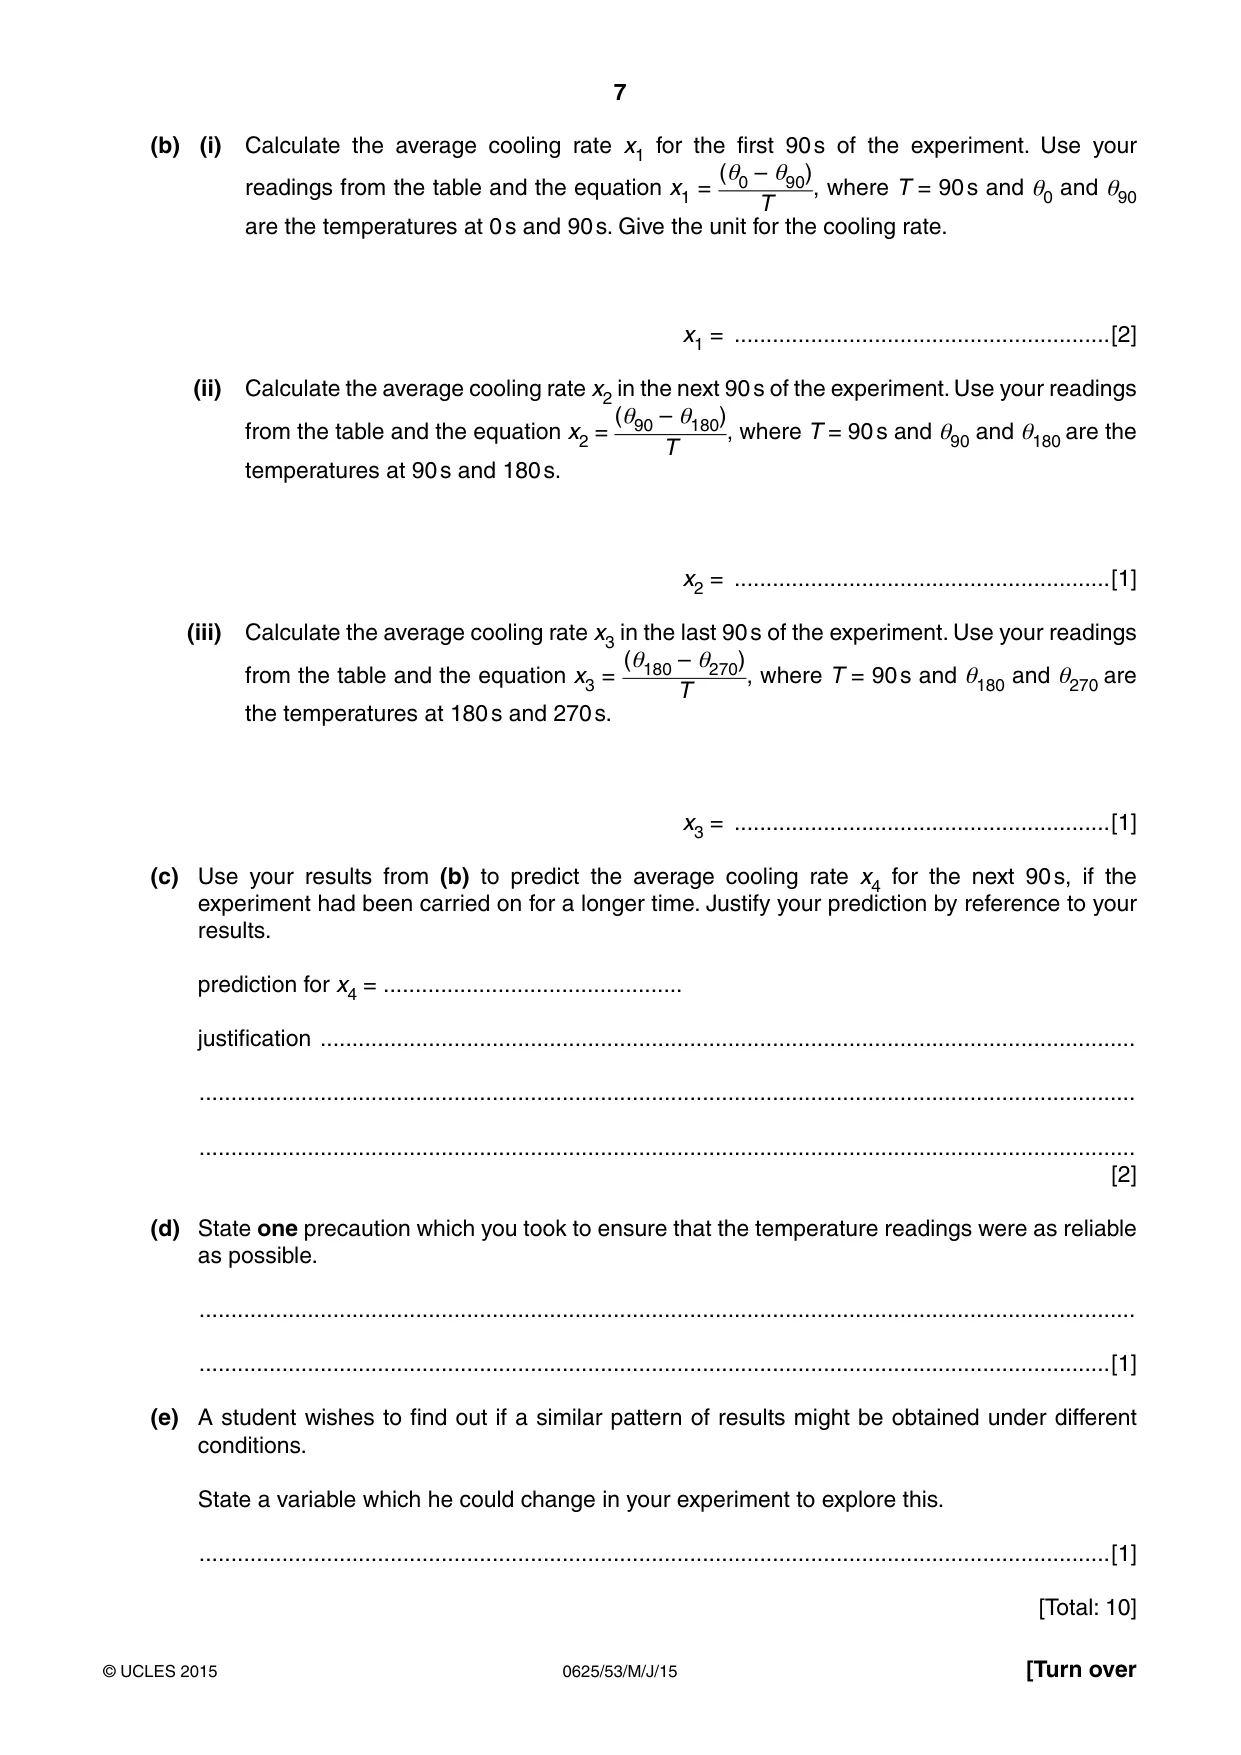
2 In this experiment, you will investigate the cooling of water. Carry out the following instructions, referring to Fig. 2.1. thermometer beaker Fig. 2.1 (a) (i) Pour approximately 100 cm3 of hot water into the beaker. (ii) Read the temperature of the hot water and immediately start the stopclock. In the first row of Table 2.1, record this temperature θ. (iii) Record in the table, the temperature θ of the water at times t = 30 s, 60 s, 90 s, 120 s, 150 s, 180 s, 210 s, 240 s and 270 s. Table 2.1 t / s θ/ °C 0 [2] (b) (i) Calculate the average cooling rate x1 for the first 90 s of the experiment. Use your (θ0 – θ90) readings from the table and the equation x1 = , where T = 90 s and θ0 and θ90 T are the temperatures at 0 s and 90 s. Give the unit for the cooling rate. x1 = ...........................................................[2] (ii) Calculate the average cooling rate x2 in the next 90 s of the experiment. Use your readings (θ90 – θ180) from the table and the equation x2 = , where T = 90 s and θ90 and θ180 are the T temperatures at 90 s and 180 s. x2 = ...........................................................[1] (iii) Calculate the average cooling rate x3 in the last 90 s of the experiment. Use your readings (θ180 – θ270) from the table and the equation x3 = , where T = 90 s and θ180 and θ270 are T the temperatures at 180 s and 270 s. x3 = ...........................................................[1] (c) Use your results from (b) to predict the average cooling rate x4 for the next 90 s, if the experiment had been carried on for a longer time. Justify your prediction by reference to your results. prediction for x4 = ............................................... justification ................................................................................................................................ ................................................................................................................................................... ................................................................................................................................................... [2] (d) State one precaution which you took to ensure that the temperature readings were as reliable as possible. ................................................................................................................................................... ...............................................................................................................................................[1] (e) A student wishes to find out if a similar pattern of results might be obtained under different conditions. State a variable which he could change in your experiment to explore this. ...............................................................................................................................................[1] [Total: 10]
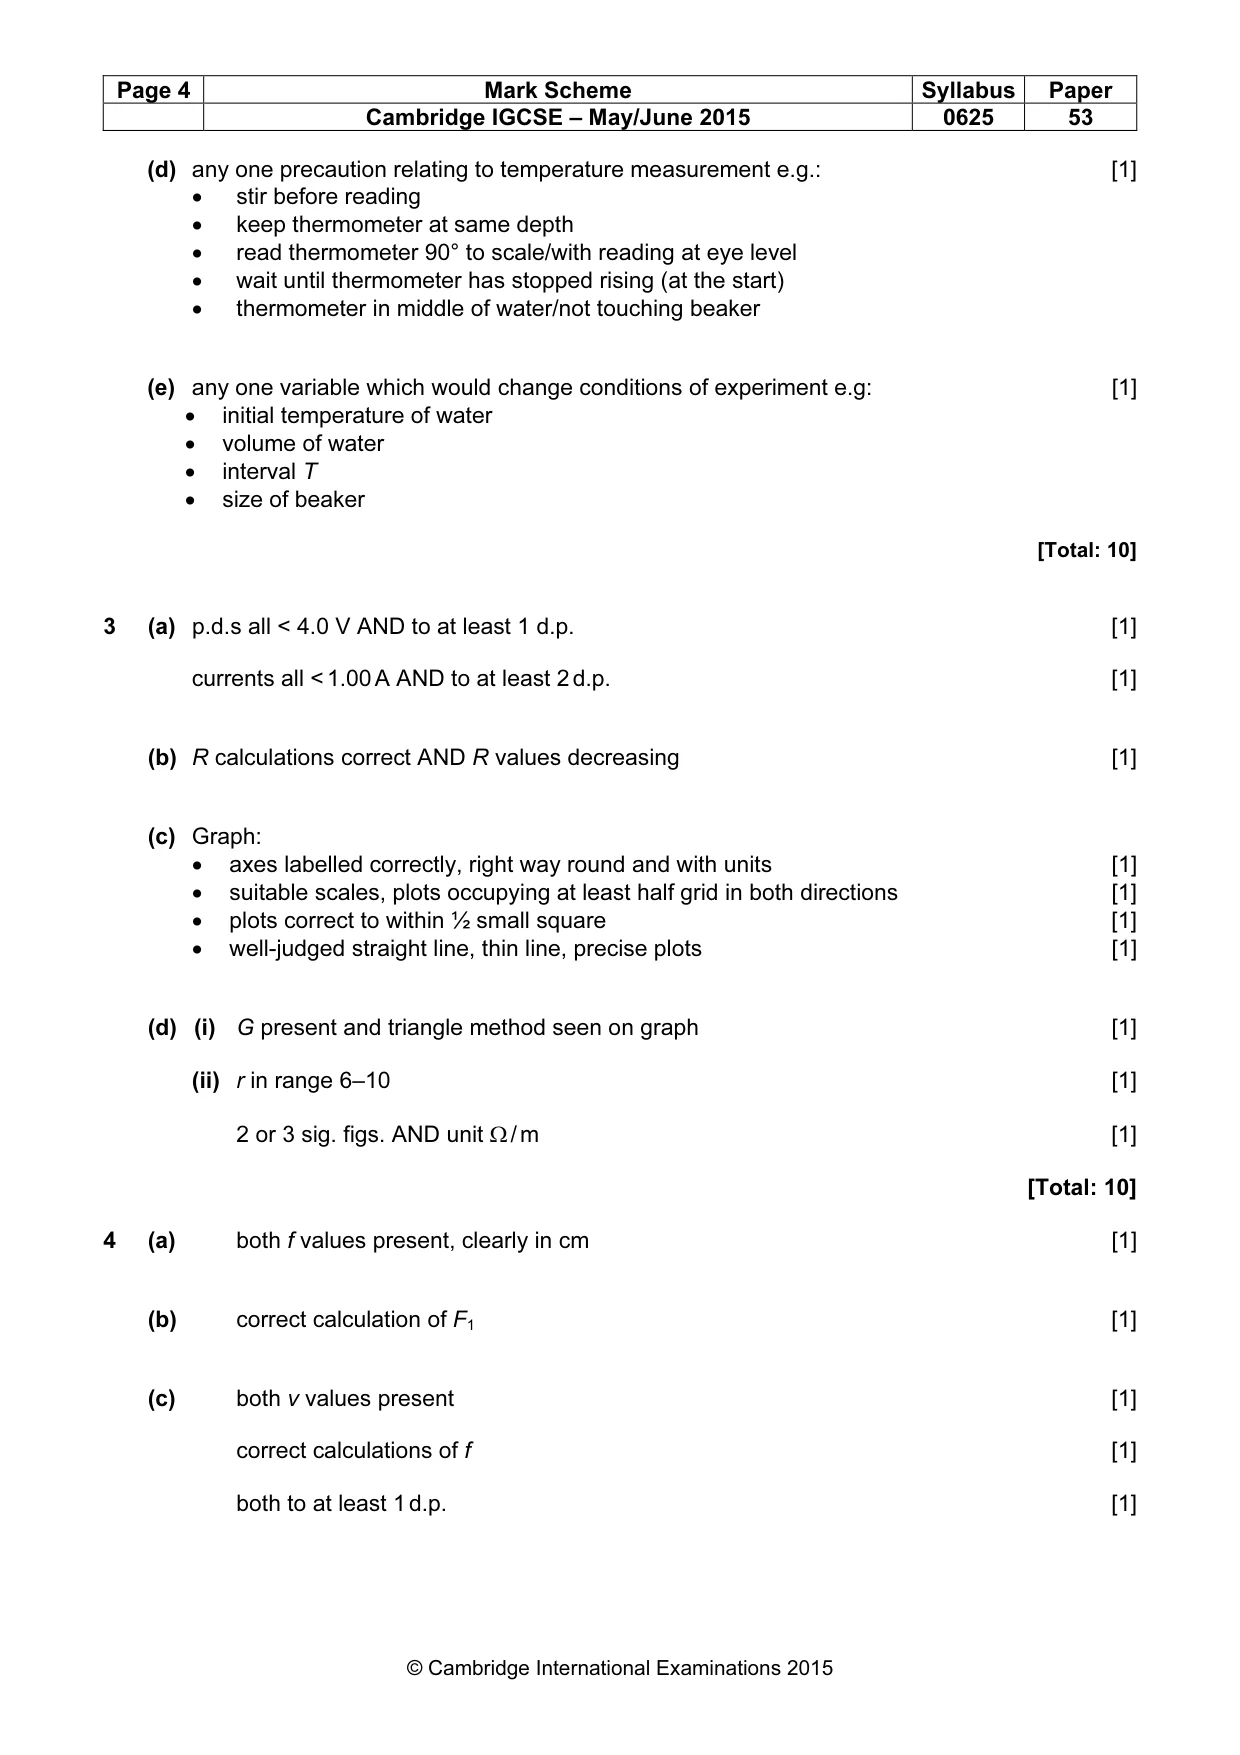
Mark scheme: 2 (a) sensible initial θ [1] θ decreasing AND to at least 1 °C [1] (b) (i) correct calculation of x1 [1] °C / s [1] (ii) x2 < x1 [1] (iii) x3 < x2 AND x1 [1] (c) prediction less than x3 [1] justification with specific mention of (average) cooling rate decreasing with time/temperature [1] (d) any one precaution relating to temperature measurement e.g.: [1] • stir before reading • keep thermometer at same depth • read thermometer 90° to scale/with reading at eye level • wait until thermometer has stopped rising (at the start) • thermometer in middle of water/not touching beaker (e) any one variable which would change conditions of experiment e.g: [1] • initial temperature of water • volume of water • interval T • size of beaker [Total: 10]
Q3 · In this experiment, you will determine the resistance per unit length of a wire
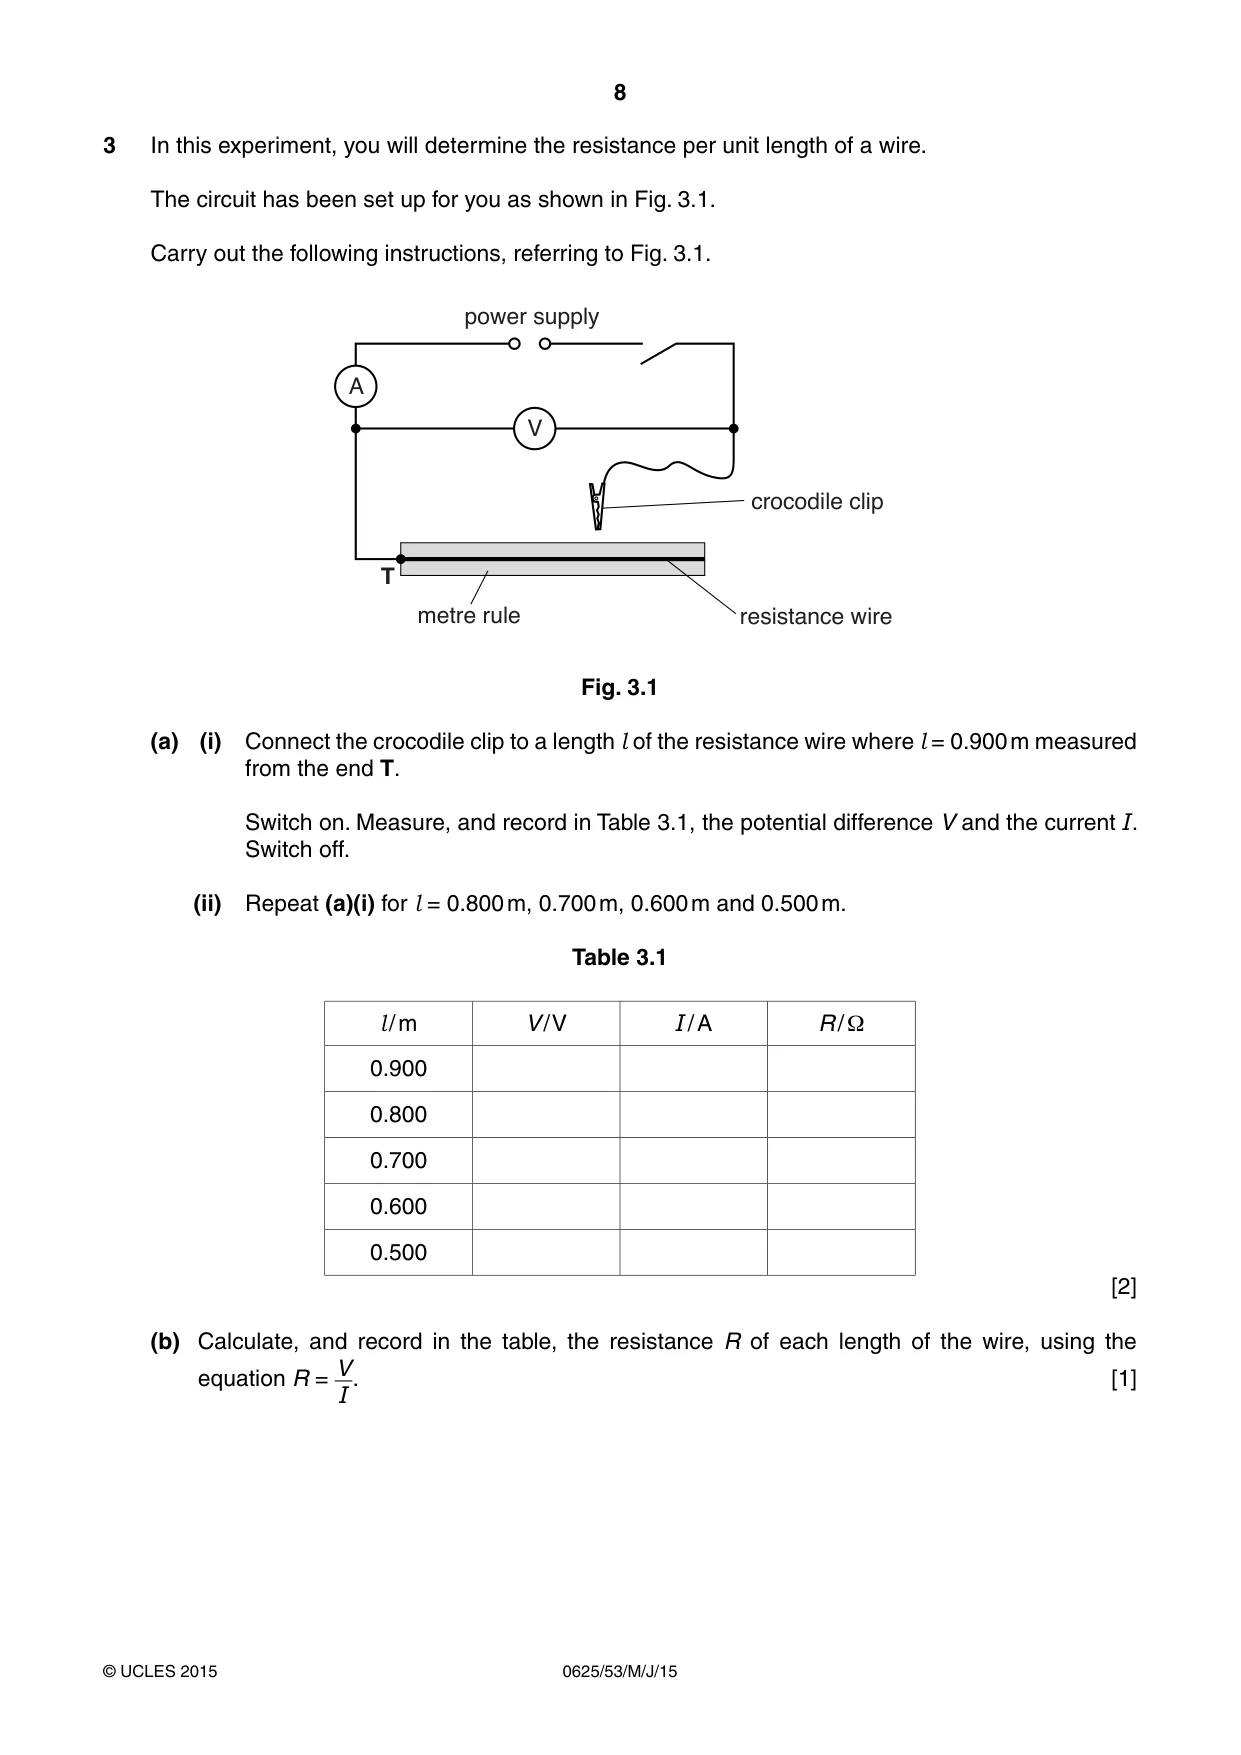
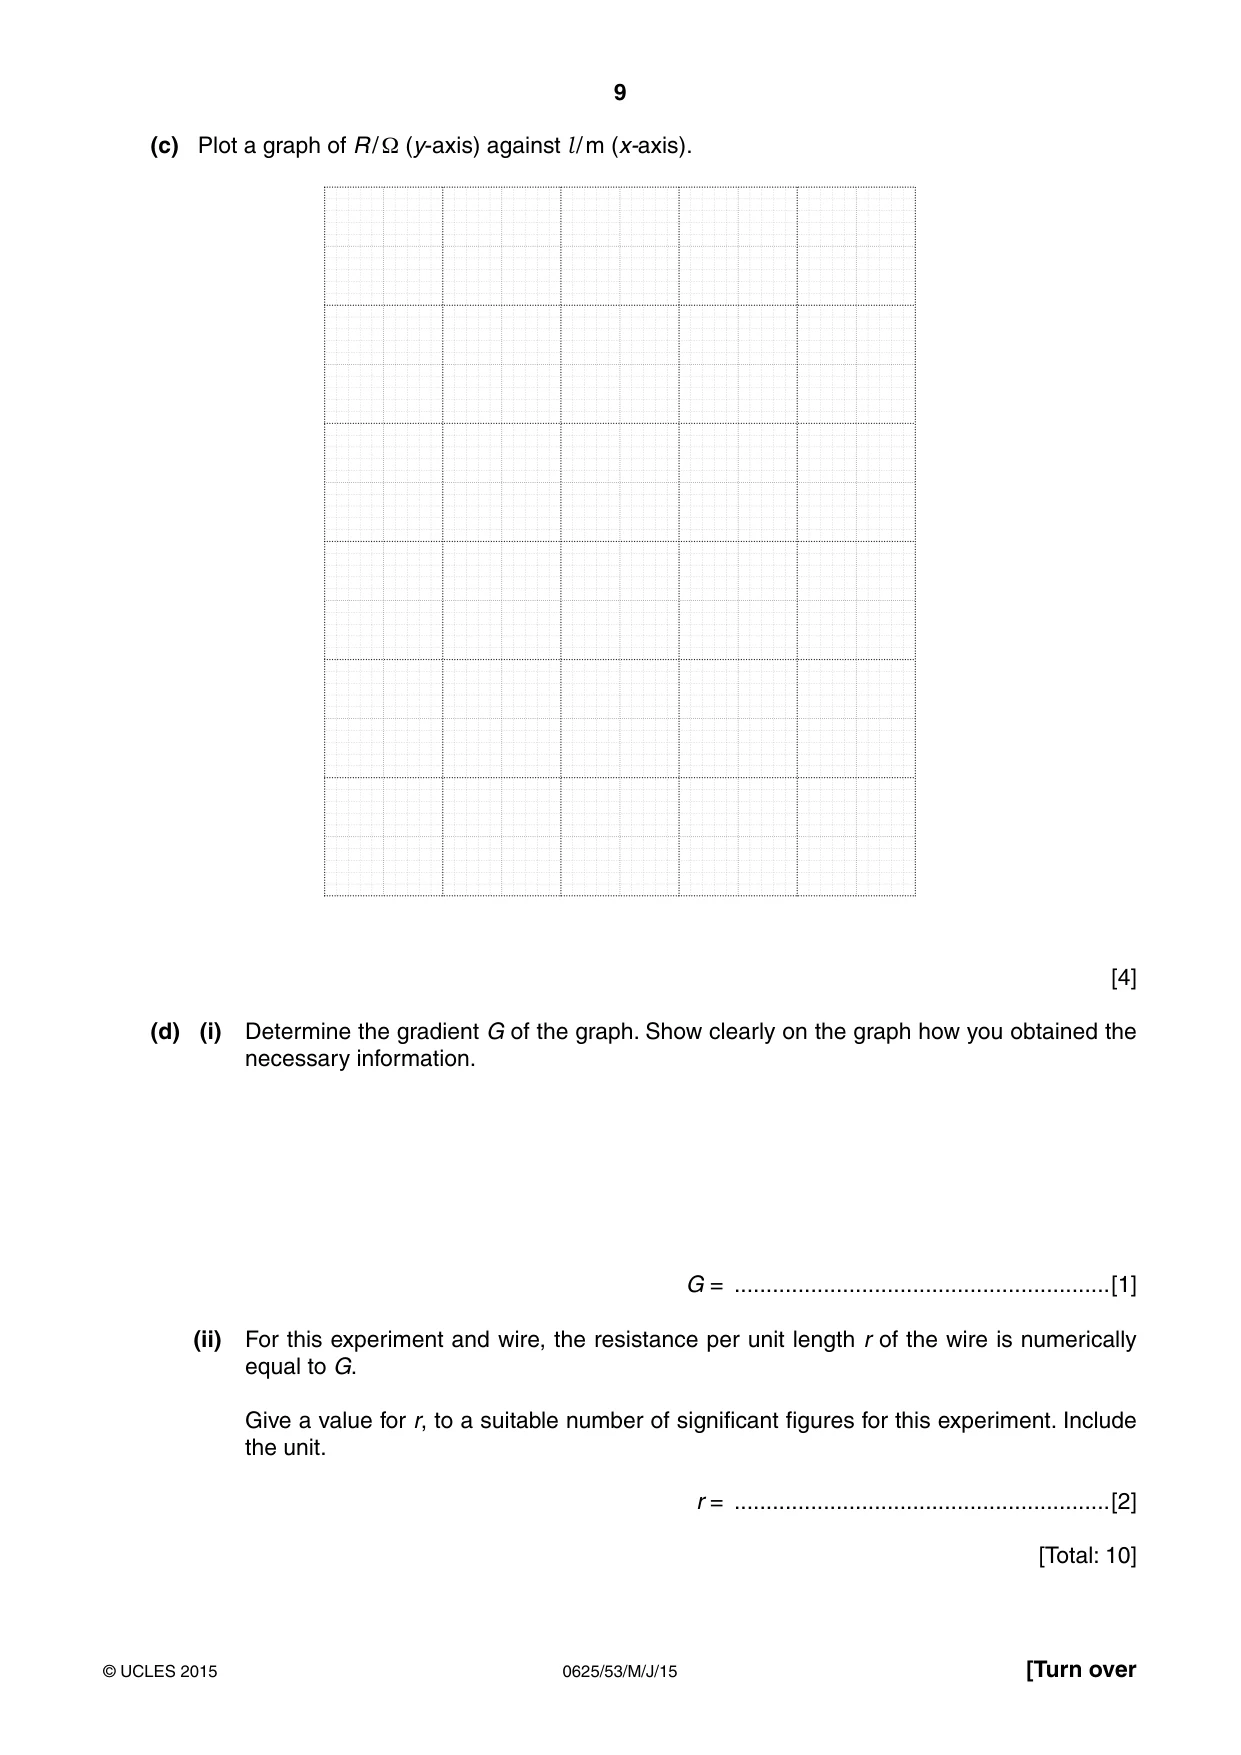
3 In this experiment, you will determine the resistance per unit length of a wire. The circuit has been set up for you as shown in Fig. 3.1. Carry out the following instructions, referring to Fig. 3.1. power supply A V crocodile clip T metre rule resistance wire Fig. 3.1 (a) (i) Connect the crocodile clip to a length l of the resistance wire where l = 0.900 m measured from the end T. Switch on. Measure, and record in Table 3.1, the potential difference V and the current I. Switch off. (ii) Repeat (a)(i) for l = 0.800 m, 0.700 m, 0.600 m and 0.500 m. Table 3.1 l / m V / V I / A R / Ω 0.900 0.800 0.700 0.600 0.500 [2] (b) Calculate, and record in the table, the resistance R of each length of the wire, using the V equation R = . [1] I (c) Plot a graph of R / Ω (y-axis) against l / m (x-axis). [4] (d) (i) Determine the gradient G of the graph. Show clearly on the graph how you obtained the necessary information. G = ...........................................................[1] (ii) For this experiment and wire, the resistance per unit length r of the wire is numerically equal to G. Give a value for r, to a suitable number of significant figures for this experiment. Include the unit. r = ...........................................................[2] [Total: 10]
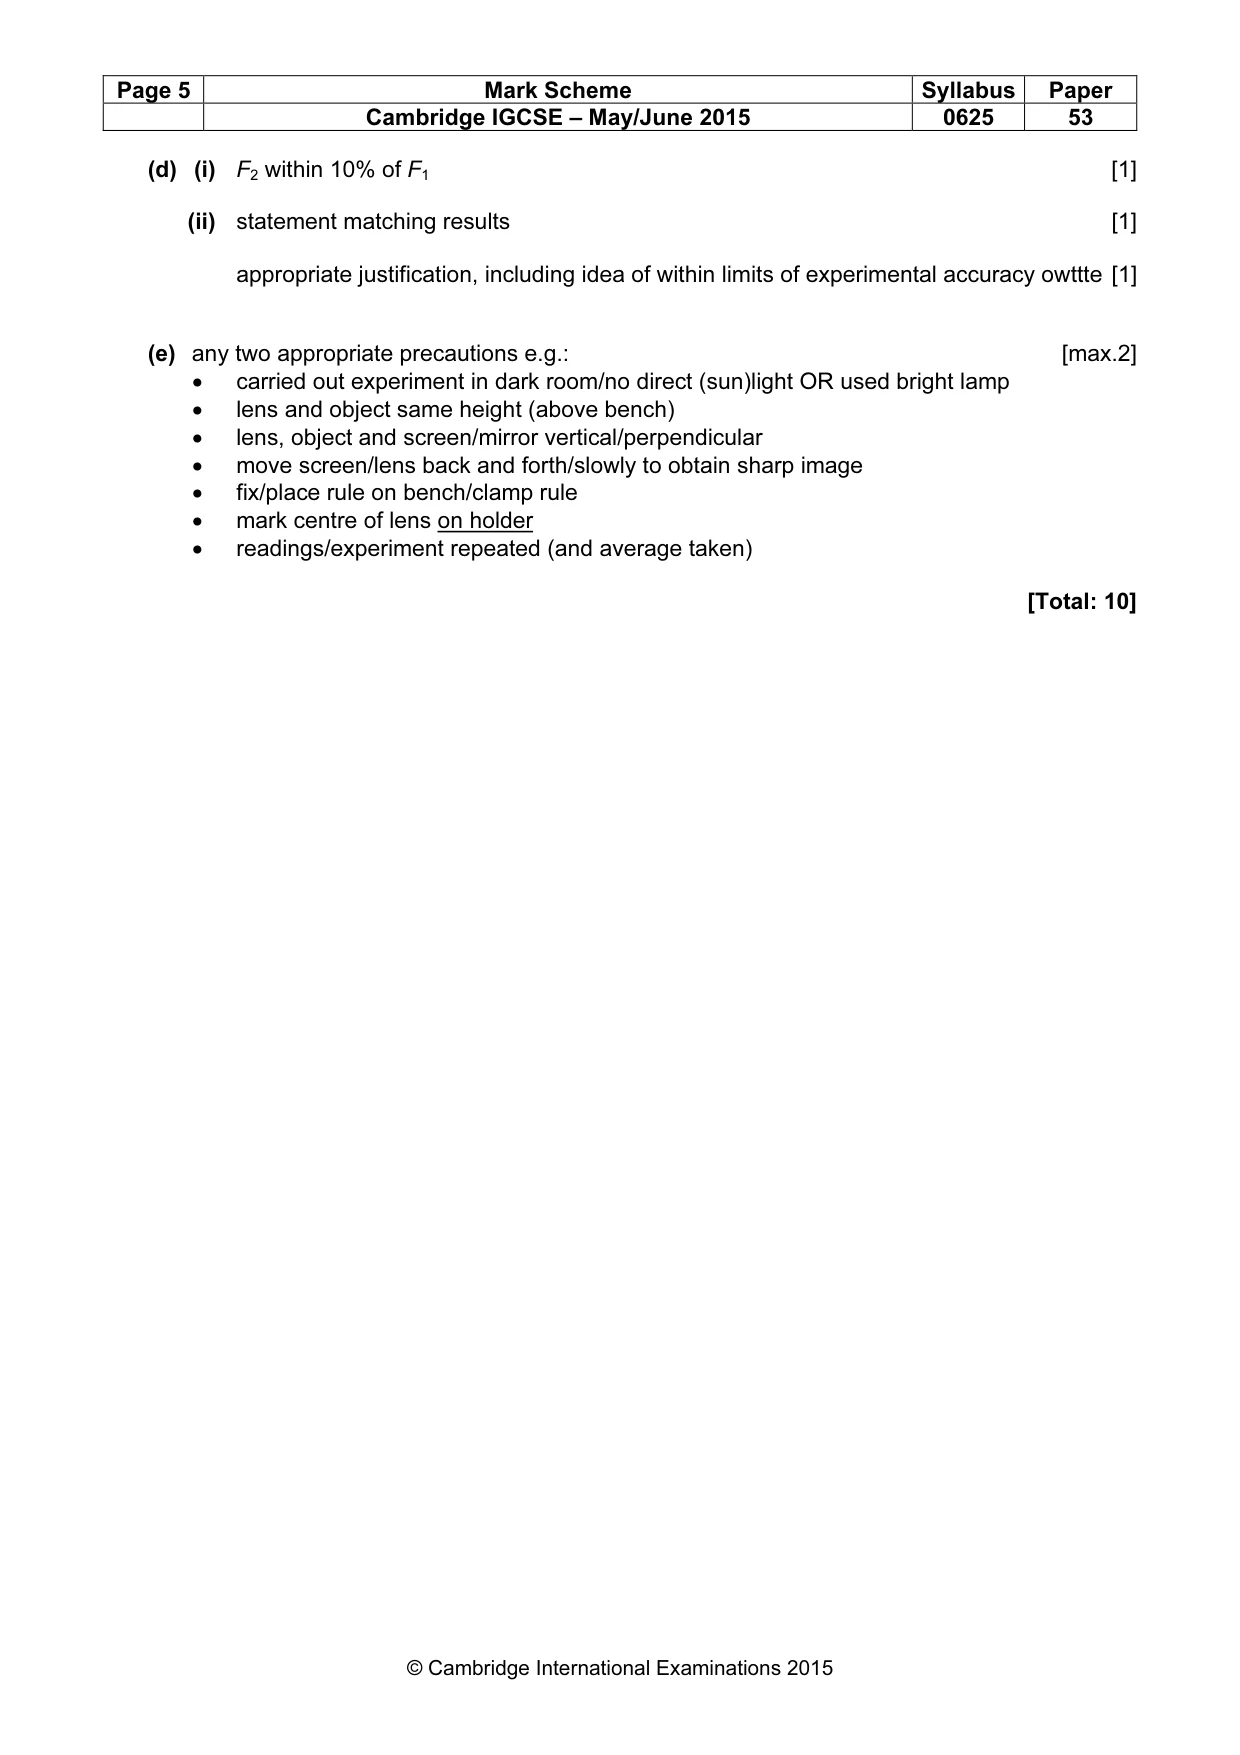
Mark scheme: 3 (a) p.d.s all < 4.0 V AND to at least 1 d.p. [1] currents all < 1.00 A AND to at least 2 d.p. [1] (b) R calculations correct AND R values decreasing [1] (c) Graph: • axes labelled correctly, right way round and with units [1] • suitable scales, plots occupying at least half grid in both directions [1] • plots correct to within ½ small square [1] • well-judged straight line, thin line, precise plots [1] (d) (i) G present and triangle method seen on graph [1] (ii) r in range 6–10 [1] 2 or 3 sig. figs. AND unit Ω / m [1] [Total: 10]
Q4 · In this experiment, you will determine the focal length of a converging lens by two…
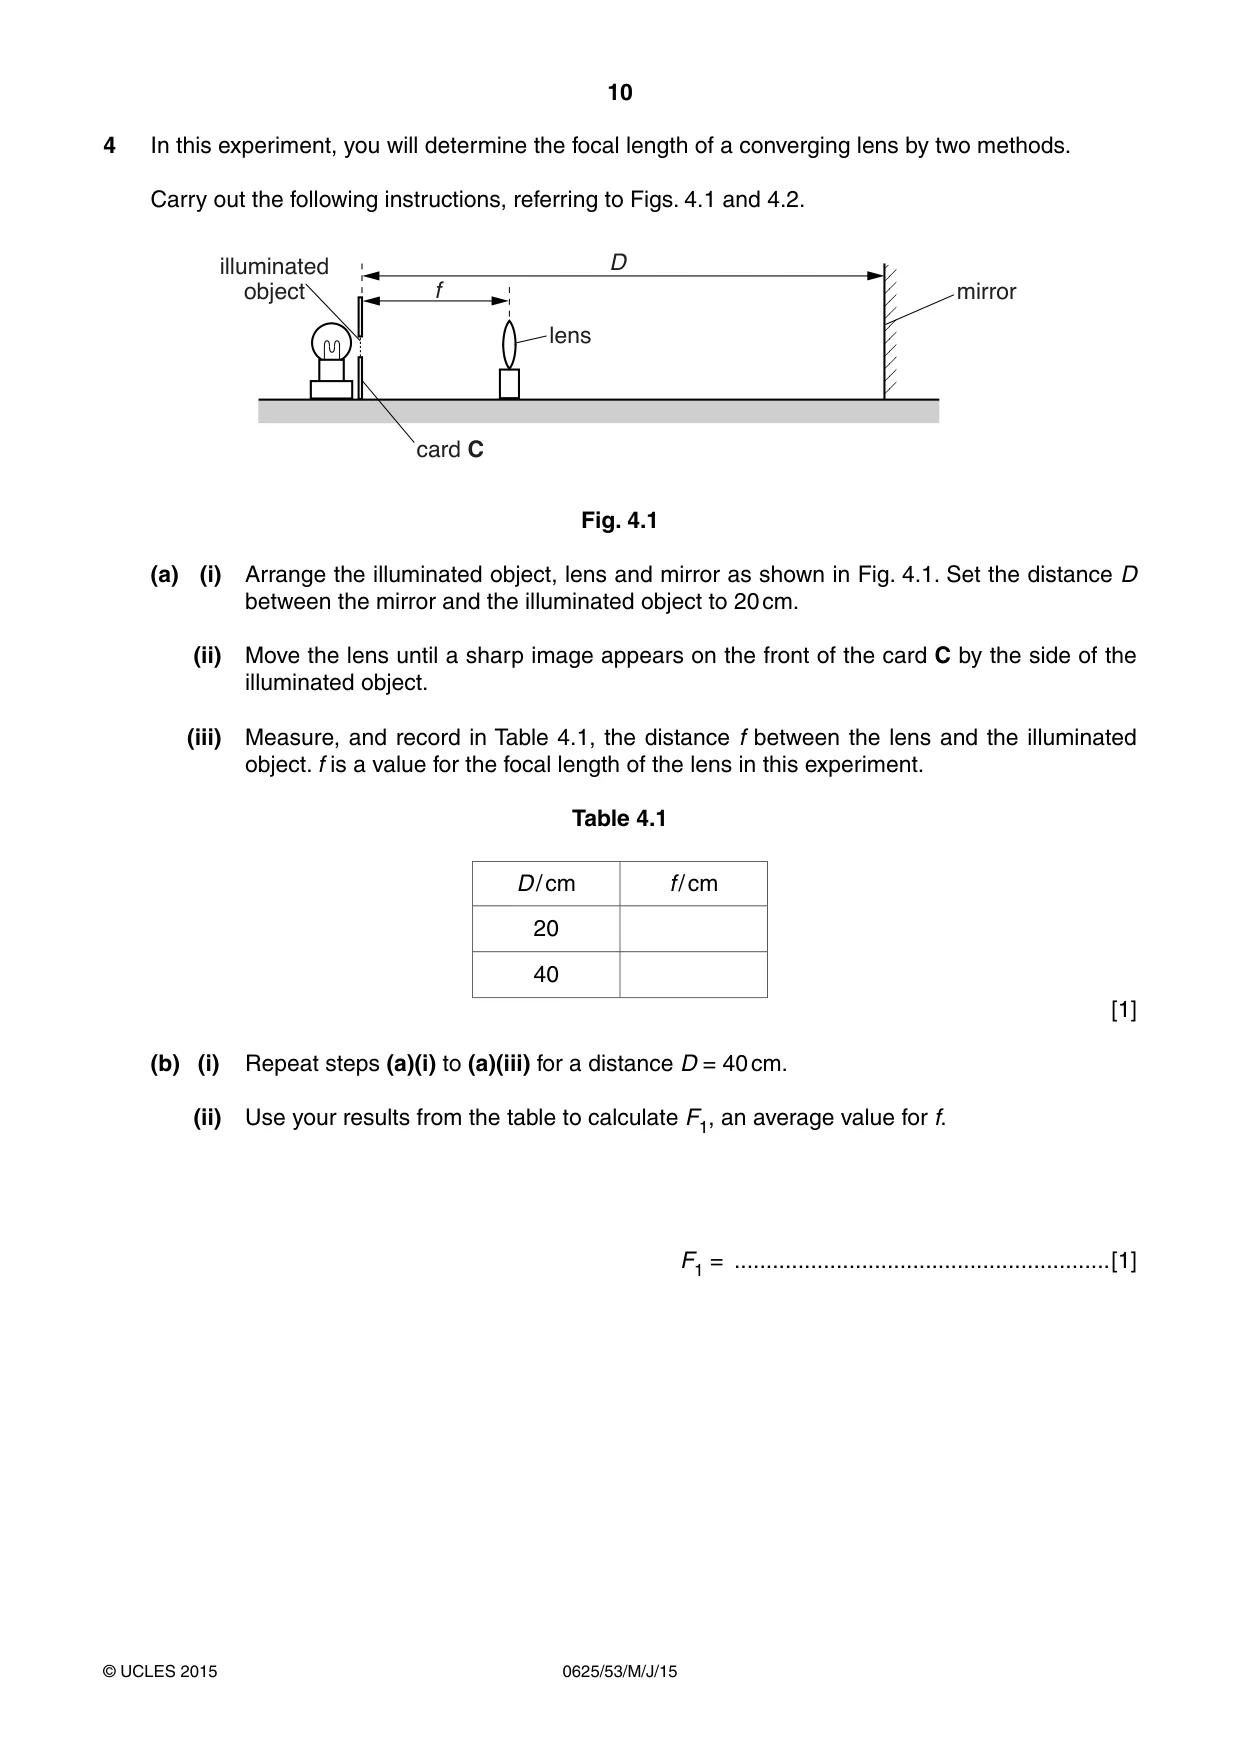
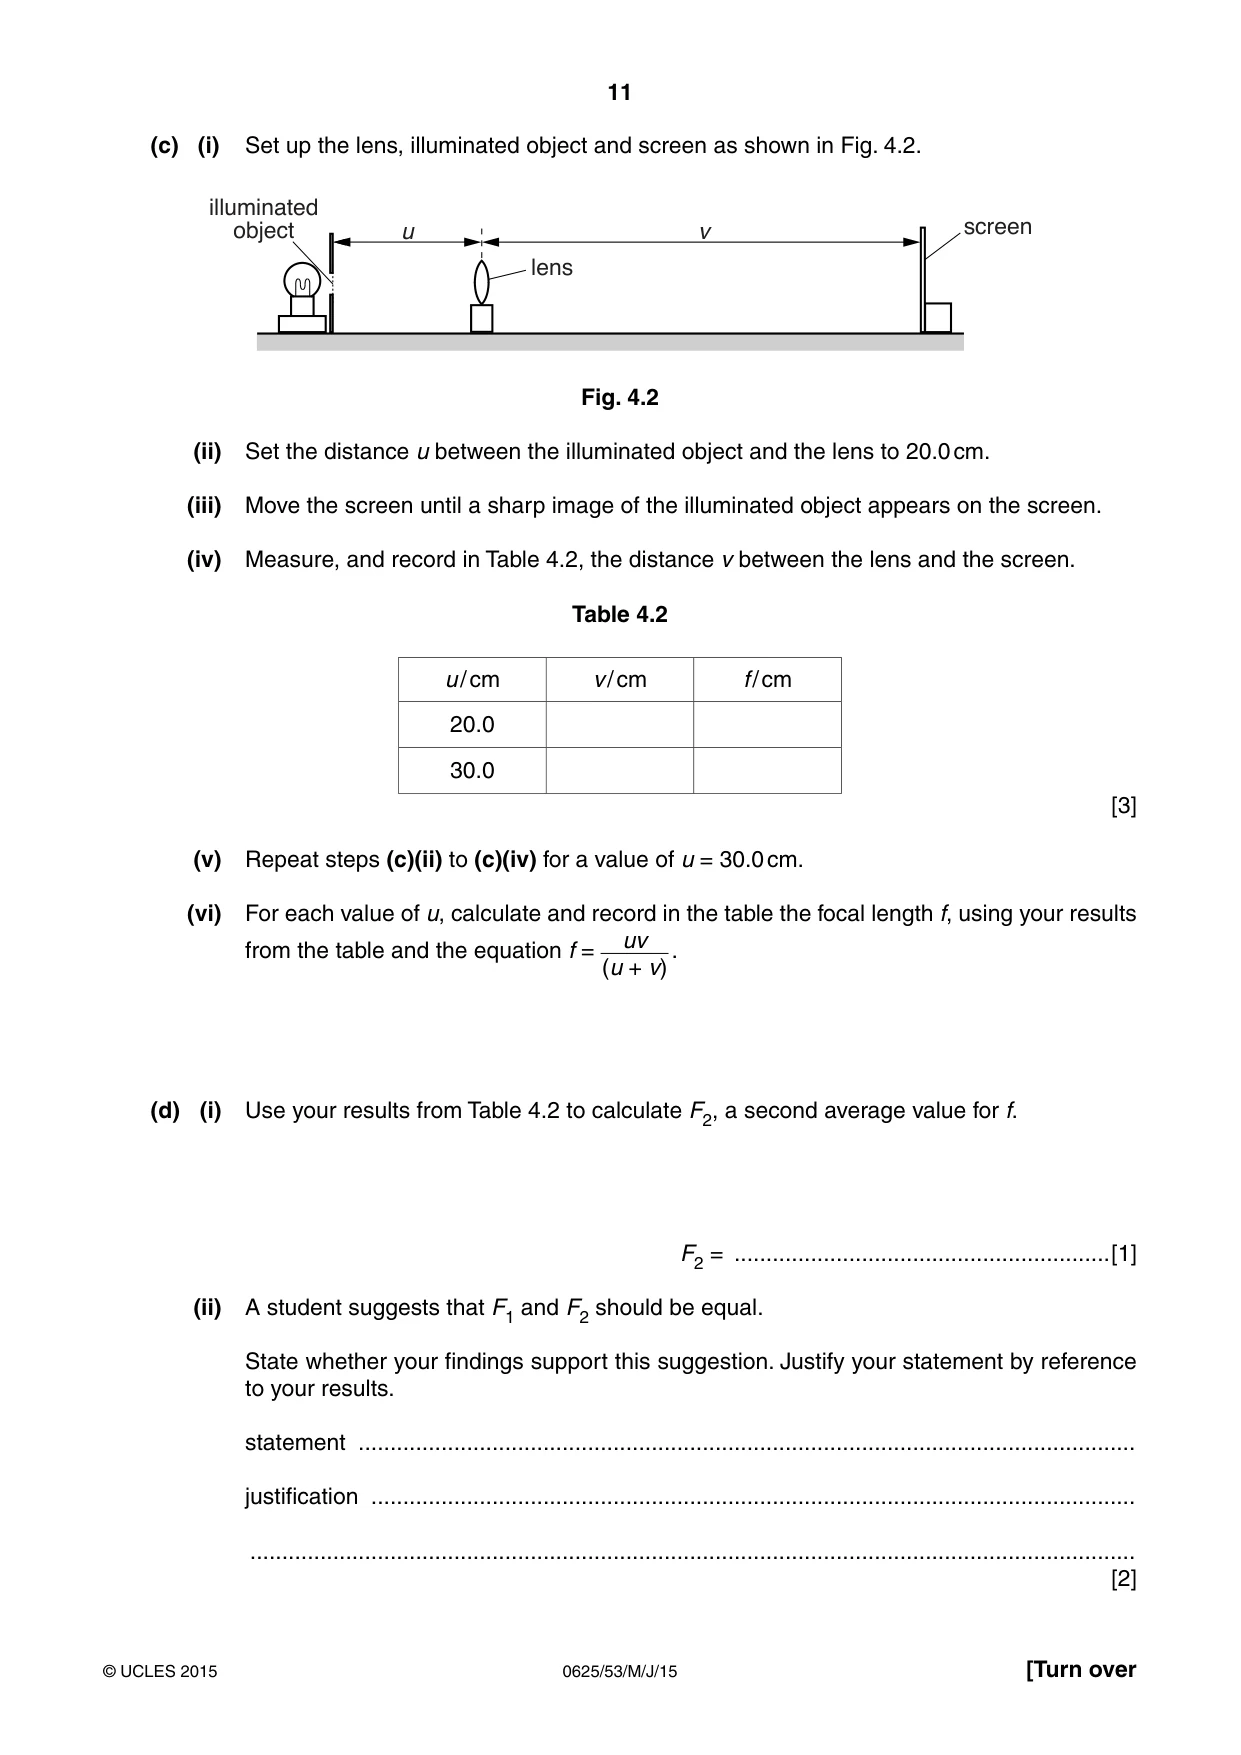
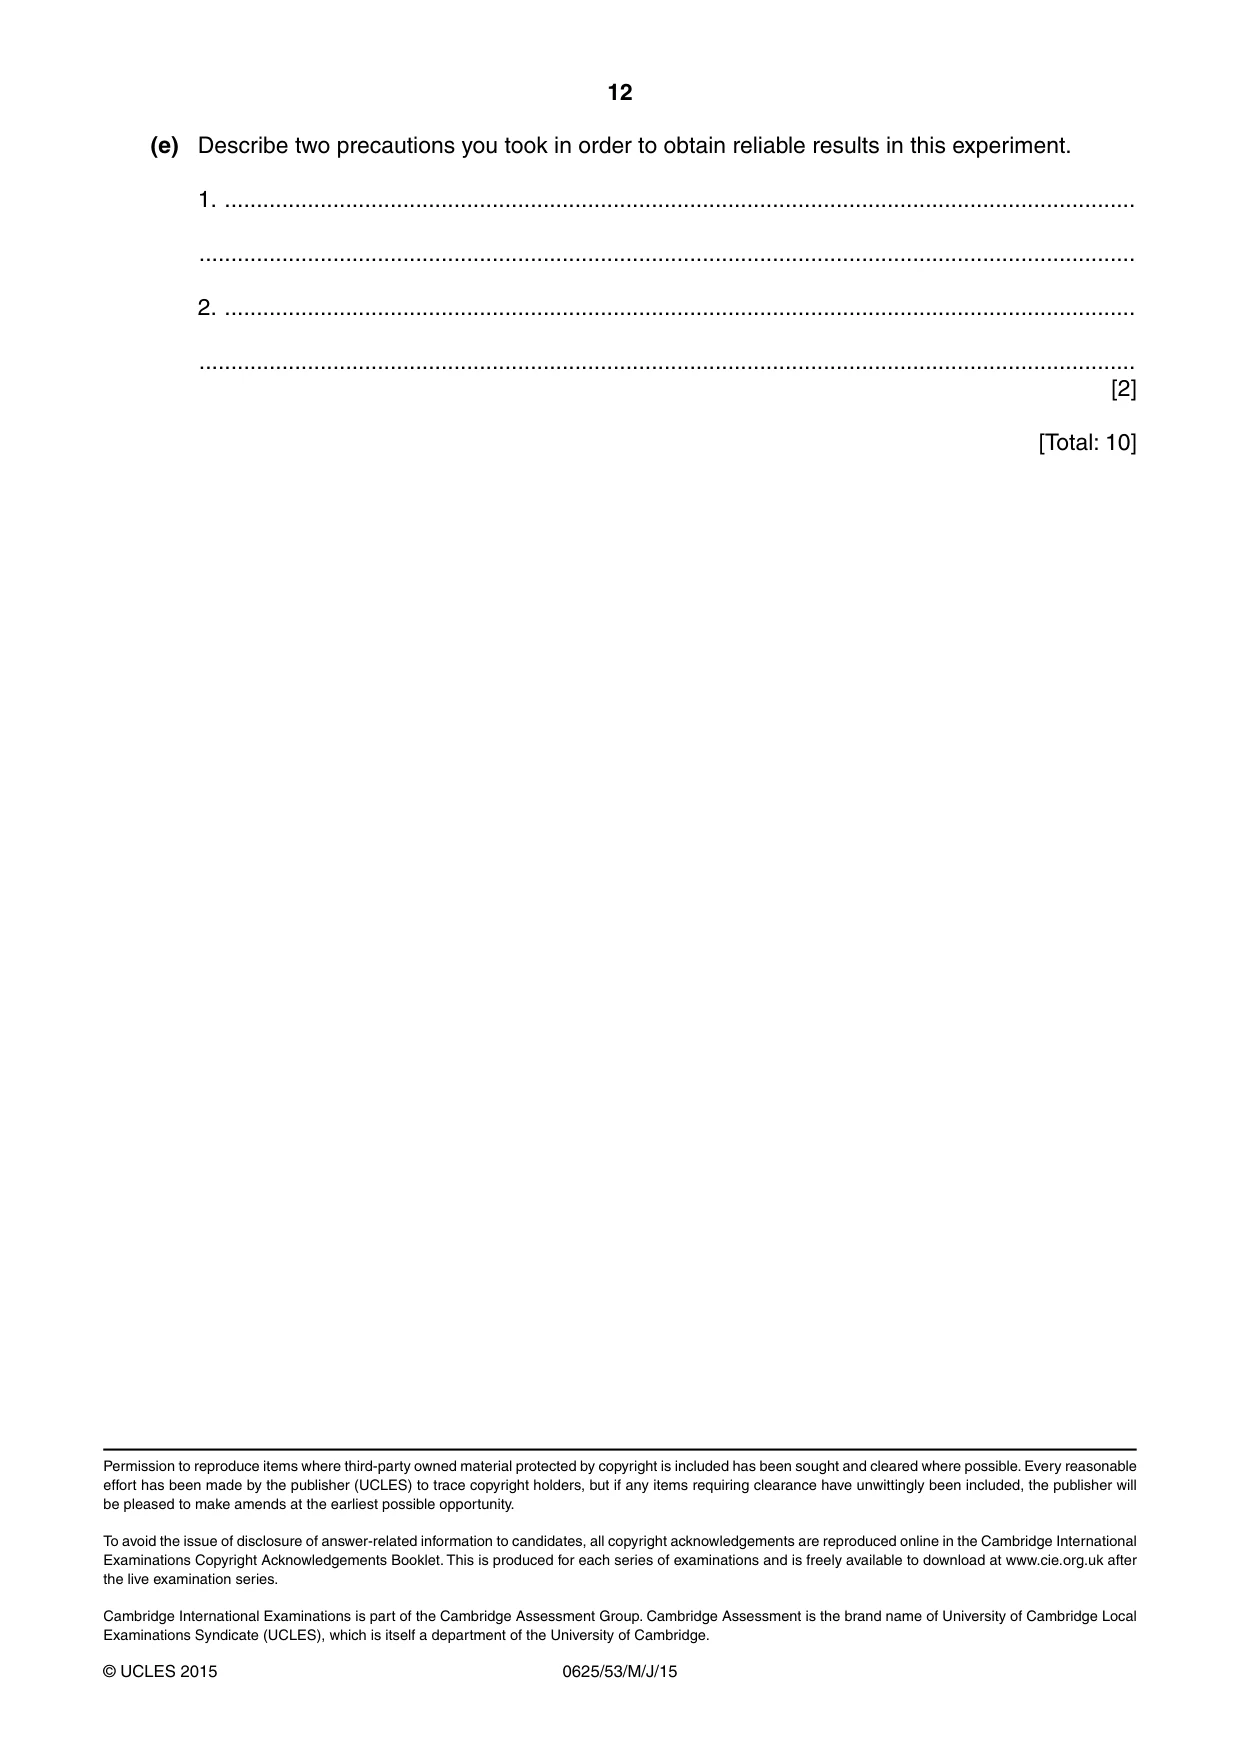
4 In this experiment, you will determine the focal length of a converging lens by two methods. Carry out the following instructions, referring to Figs. 4.1 and 4.2. illuminated D object f mirror lens card C Fig. 4.1 (a) (i) Arrange the illuminated object, lens and mirror as shown in Fig. 4.1. Set the distance D between the mirror and the illuminated object to 20 cm. (ii) Move the lens until a sharp image appears on the front of the card C by the side of the illuminated object. (iii) Measure, and record in Table 4.1, the distance f between the lens and the illuminated object. f is a value for the focal length of the lens in this experiment. Table 4.1 D / cm f / cm 20 40 [1] (b) (i) Repeat steps (a)(i) to (a)(iii) for a distance D = 40 cm. (ii) Use your results from the table to calculate F1, an average value for f. F1 = ...........................................................[1] (c) (i) Set up the lens, illuminated object and screen as shown in Fig. 4.2. illuminated object u v screen lens Fig. 4.2 (ii) Set the distance u between the illuminated object and the lens to 20.0 cm. (iii) Move the screen until a sharp image of the illuminated object appears on the screen. (iv) Measure, and record in Table 4.2, the distance v between the lens and the screen. Table 4.2 u / cm v / cm f / cm 20.0 30.0 [3] (v) Repeat steps (c)(ii) to (c)(iv) for a value of u = 30.0 cm. (vi) For each value of u, calculate and record in the table the focal length f, using your results uv from the table and the equation f = . (u + v) (d) (i) Use your results from Table 4.2 to calculate F2, a second average value for f. F2 = ...........................................................[1] (ii) A student suggests that F1 and F2 should be equal. State whether your findings support this suggestion. Justify your statement by reference to your results. statement .......................................................................................................................... justification ........................................................................................................................ ........................................................................................................................................... [2] (e) Describe two precautions you took in order to obtain reliable results in this experiment. 1. ............................................................................................................................................... ................................................................................................................................................... 2. ............................................................................................................................................... ................................................................................................................................................... [2] [Total: 10]
Mark scheme: 4 (a) both f values present, clearly in cm [1] (b) correct calculation of F1 [1] (c) both v values present [1] correct calculations of f [1] both to at least 1 d.p. [1] (d) (i) F2 within 10% of F1 [1] (ii) statement matching results [1] appropriate justification, including idea of within limits of experimental accuracy owttte [1] (e) any two appropriate precautions e.g.: [max.2] • carried out experiment in dark room/no direct (sun)light OR used bright lamp • lens and object same height (above bench) • lens, object and screen/mirror vertical/perpendicular • move screen/lens back and forth/slowly to obtain sharp image • fix/place rule on bench/clamp rule • mark centre of lens on holder • readings/experiment repeated (and average taken) [Total: 10]
What was in this paper
The subtopics covered by these 4 questions, and how many questions each got. Open one in a new tab to see every Cambridge question on it.
What you needed in this session
Cambridge’s own grade thresholds for 2015 May/June, Paper 5 · Variant 3. A higher threshold means an easier paper — the bar moves with how the cohort did.