Cambridge IGCSE Physics 0625 — 2011 Oct/Nov Paper 5 · Variant 3
0625/53/O/N/11 · 4 questions · 40 marks · ≈45 min
The question paper and its mark scheme, free to read here and free to download. This is Cambridge’s own paper, exactly as it was sat.
Question paper12 pages

Mark scheme3 pages
Answers below. Sit the paper first if you are practising.
Questions as text
Q1 · In this experiment, you will determine the density of modelling clay by two methods
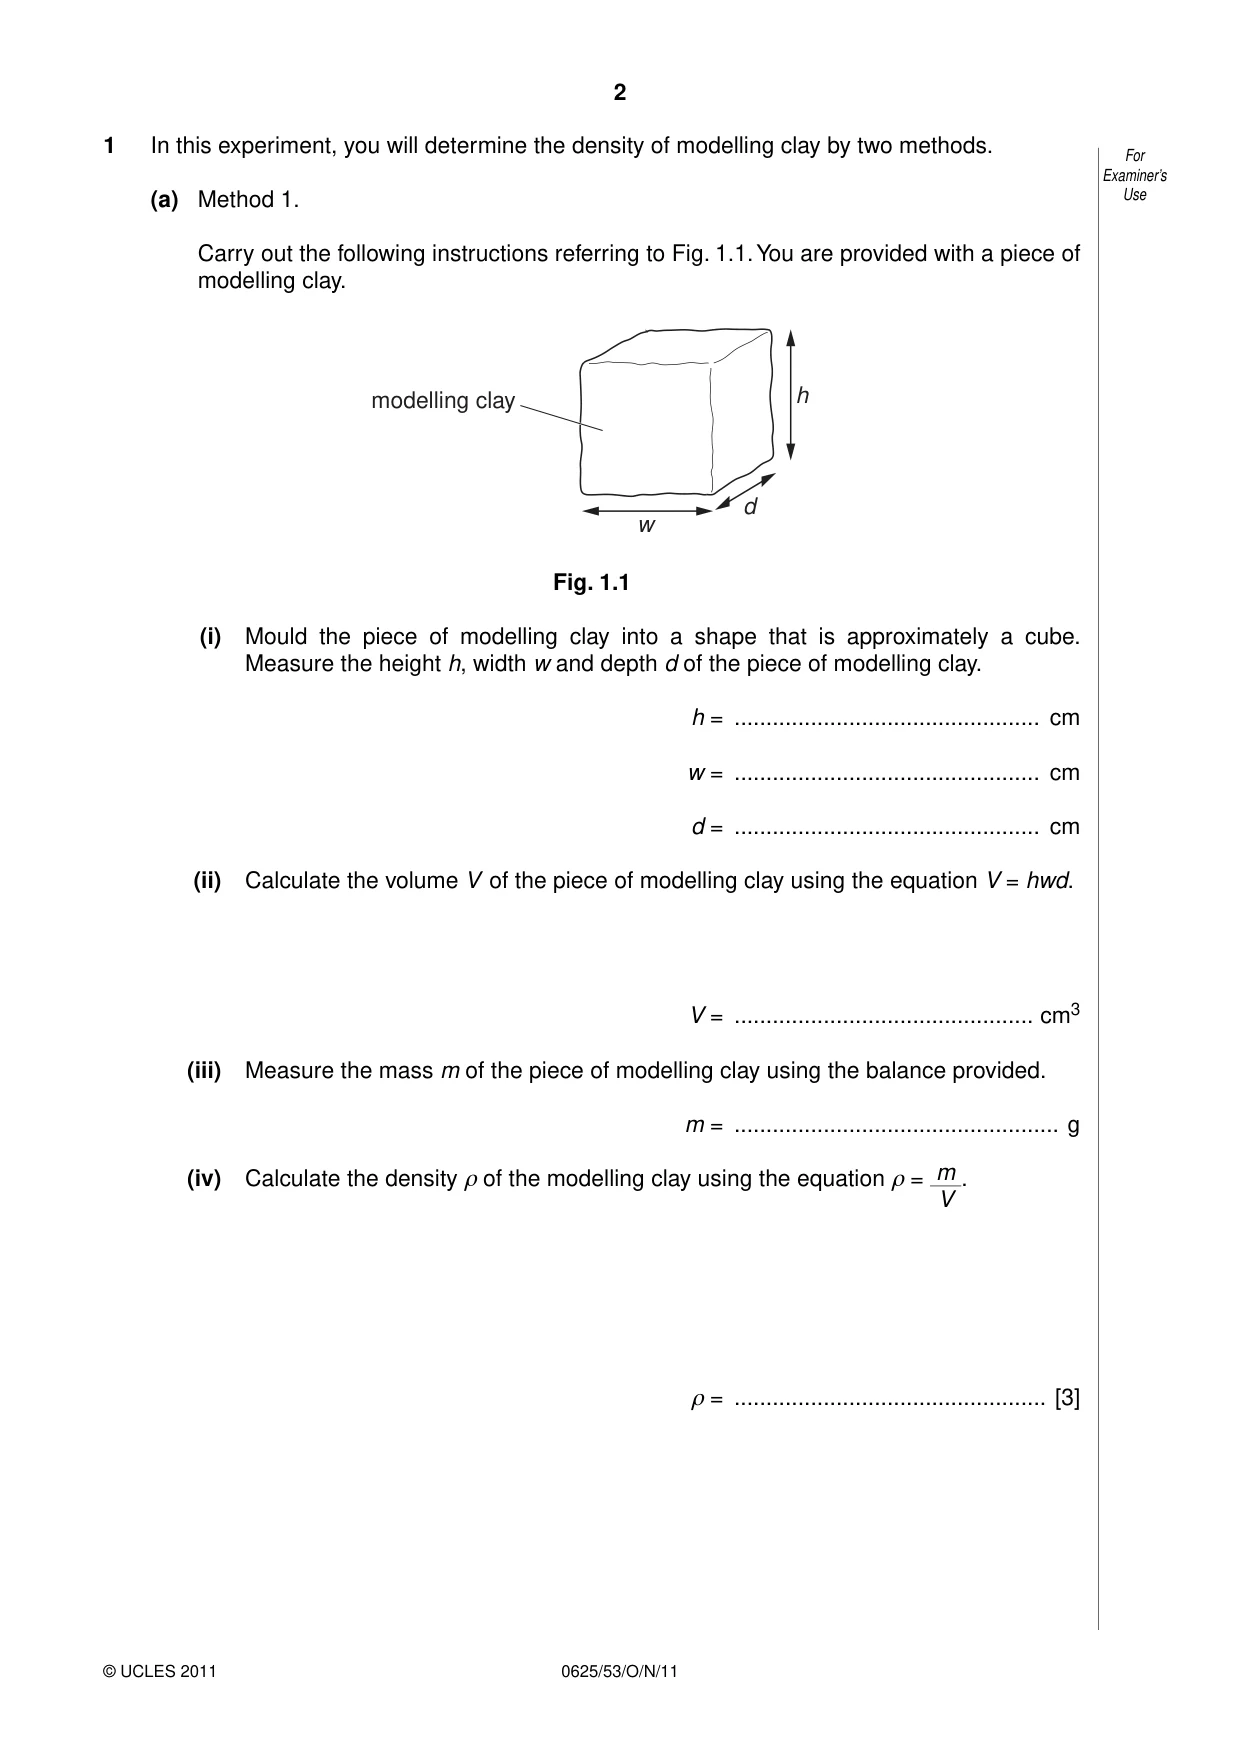
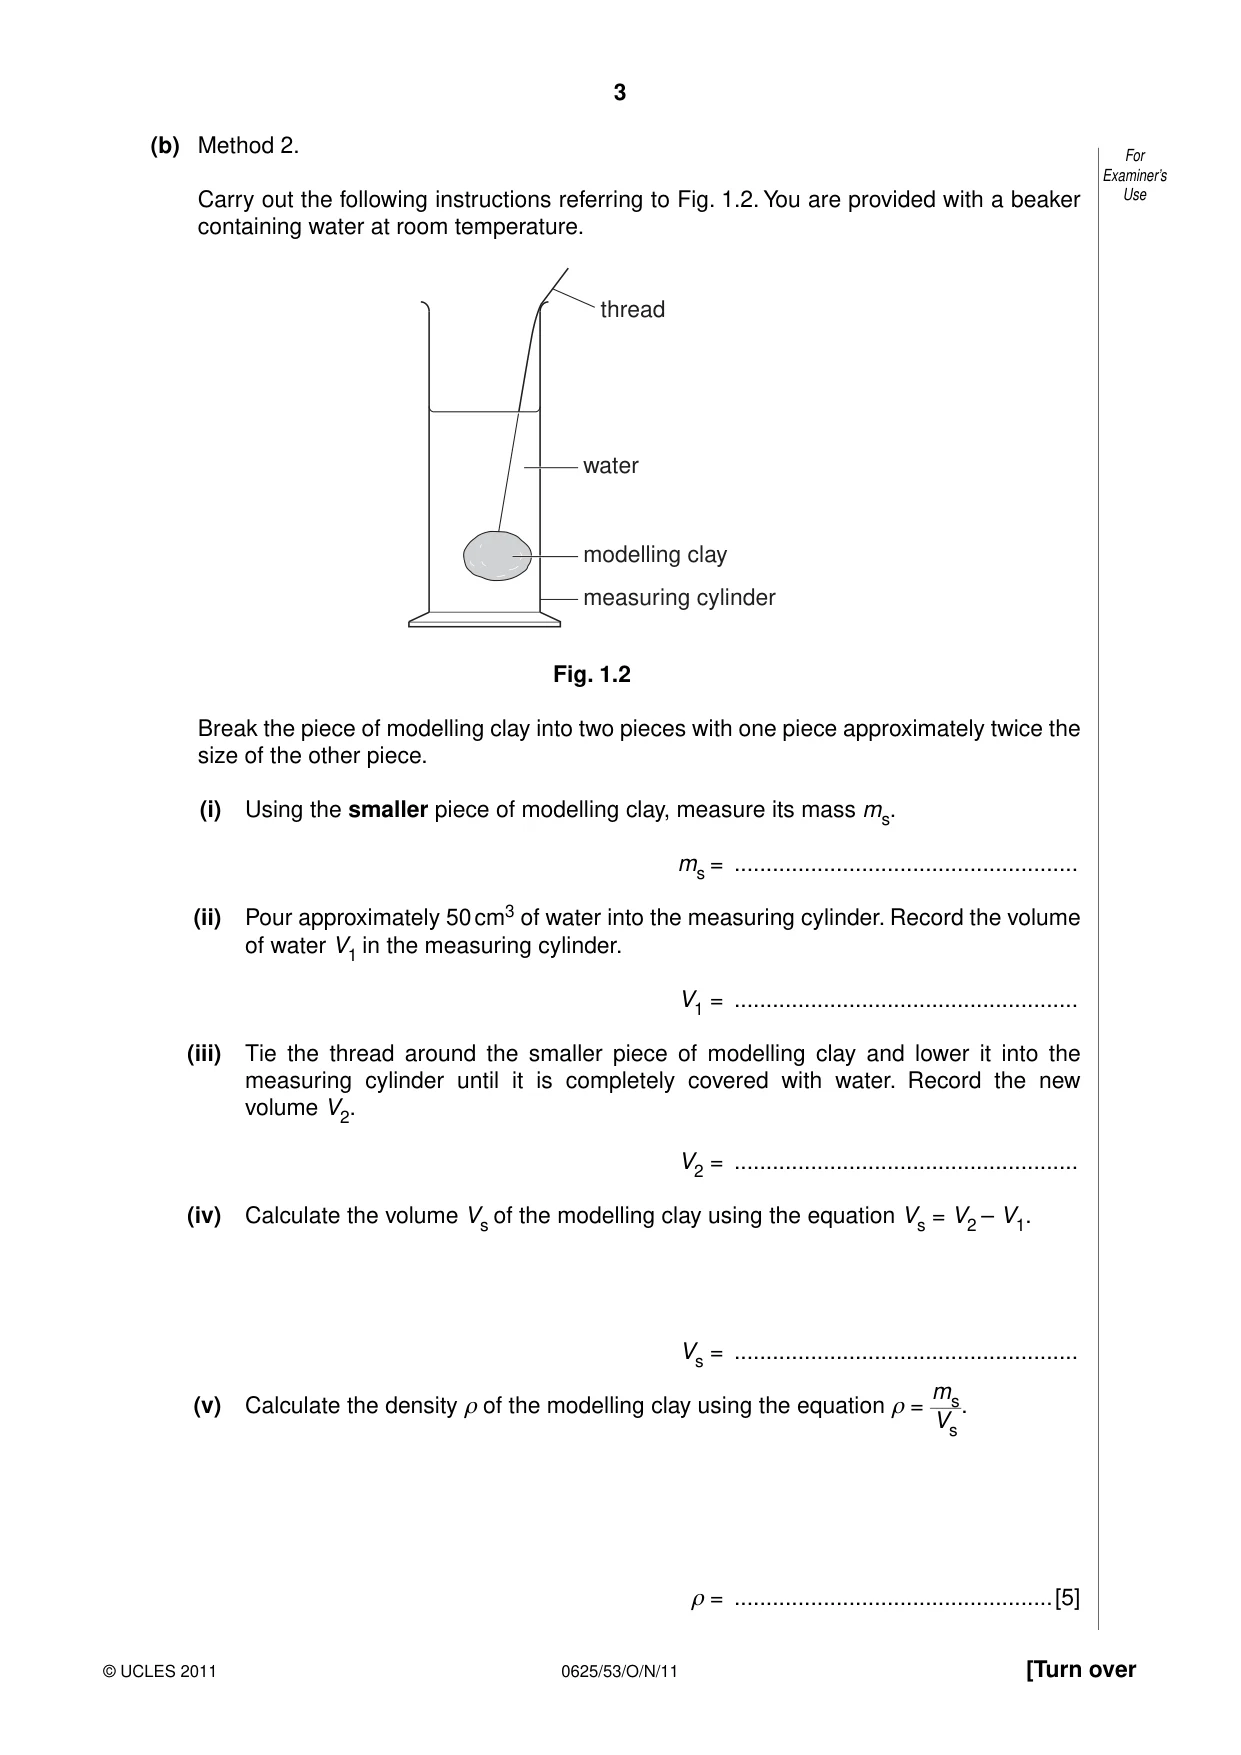
1 In this experiment, you will determine the density of modelling clay by two methods. For Examiner’s (a) Method 1. Use Carry out the following instructions referring to Fig. 1.1. You are provided with a piece of modelling clay. modelling clay h d w Fig. 1.1 (i) Mould the piece of modelling clay into a shape that is approximately a cube. Measure the height h, width w and depth d of the piece of modelling clay. h = ................................................ cm w = ................................................ cm d = ................................................ cm (ii) Calculate the volume V of the piece of modelling clay using the equation V = hwd. V = ............................................... cm3 (iii) Measure the mass m of the piece of modelling clay using the balance provided. m = ................................................... g (iv) Calculate the density ρ of the modelling clay using the equation ρ = m . V ρ = ................................................. [3] (b) Method 2. For Examiner’s Carry out the following instructions referring to Fig. 1.2. You are provided with a beaker Use containing water at room temperature. thread water modelling clay measuring cylinder Fig. 1.2 Break the piece of modelling clay into two pieces with one piece approximately twice the size of the other piece. (i) Using the smaller piece of modelling clay, measure its mass ms. ms = ...................................................... (ii) Pour approximately 50 cm3 of water into the measuring cylinder. Record the volume of water V1 in the measuring cylinder. V1 = ...................................................... (iii) Tie the thread around the smaller piece of modelling clay and lower it into the measuring cylinder until it is completely covered with water. Record the new volume V2. V2 = ...................................................... (iv) Calculate the volume Vs of the modelling clay using the equation Vs = V2 – V1. Vs = ...................................................... ms (v) Calculate the density ρ of the modelling clay using the equation ρ = . Vs ρ = ..................................................[5] (c) Assuming that the experiment has been carried out with reasonable care, suggest two For reasons why the two values obtained for the density of the modelling clay may not be Examiner’s the same. Use 1. ...................................................................................................................................... .......................................................................................................................................... 2. ...................................................................................................................................... ......................................................................................................................................[2] [Total: 10]
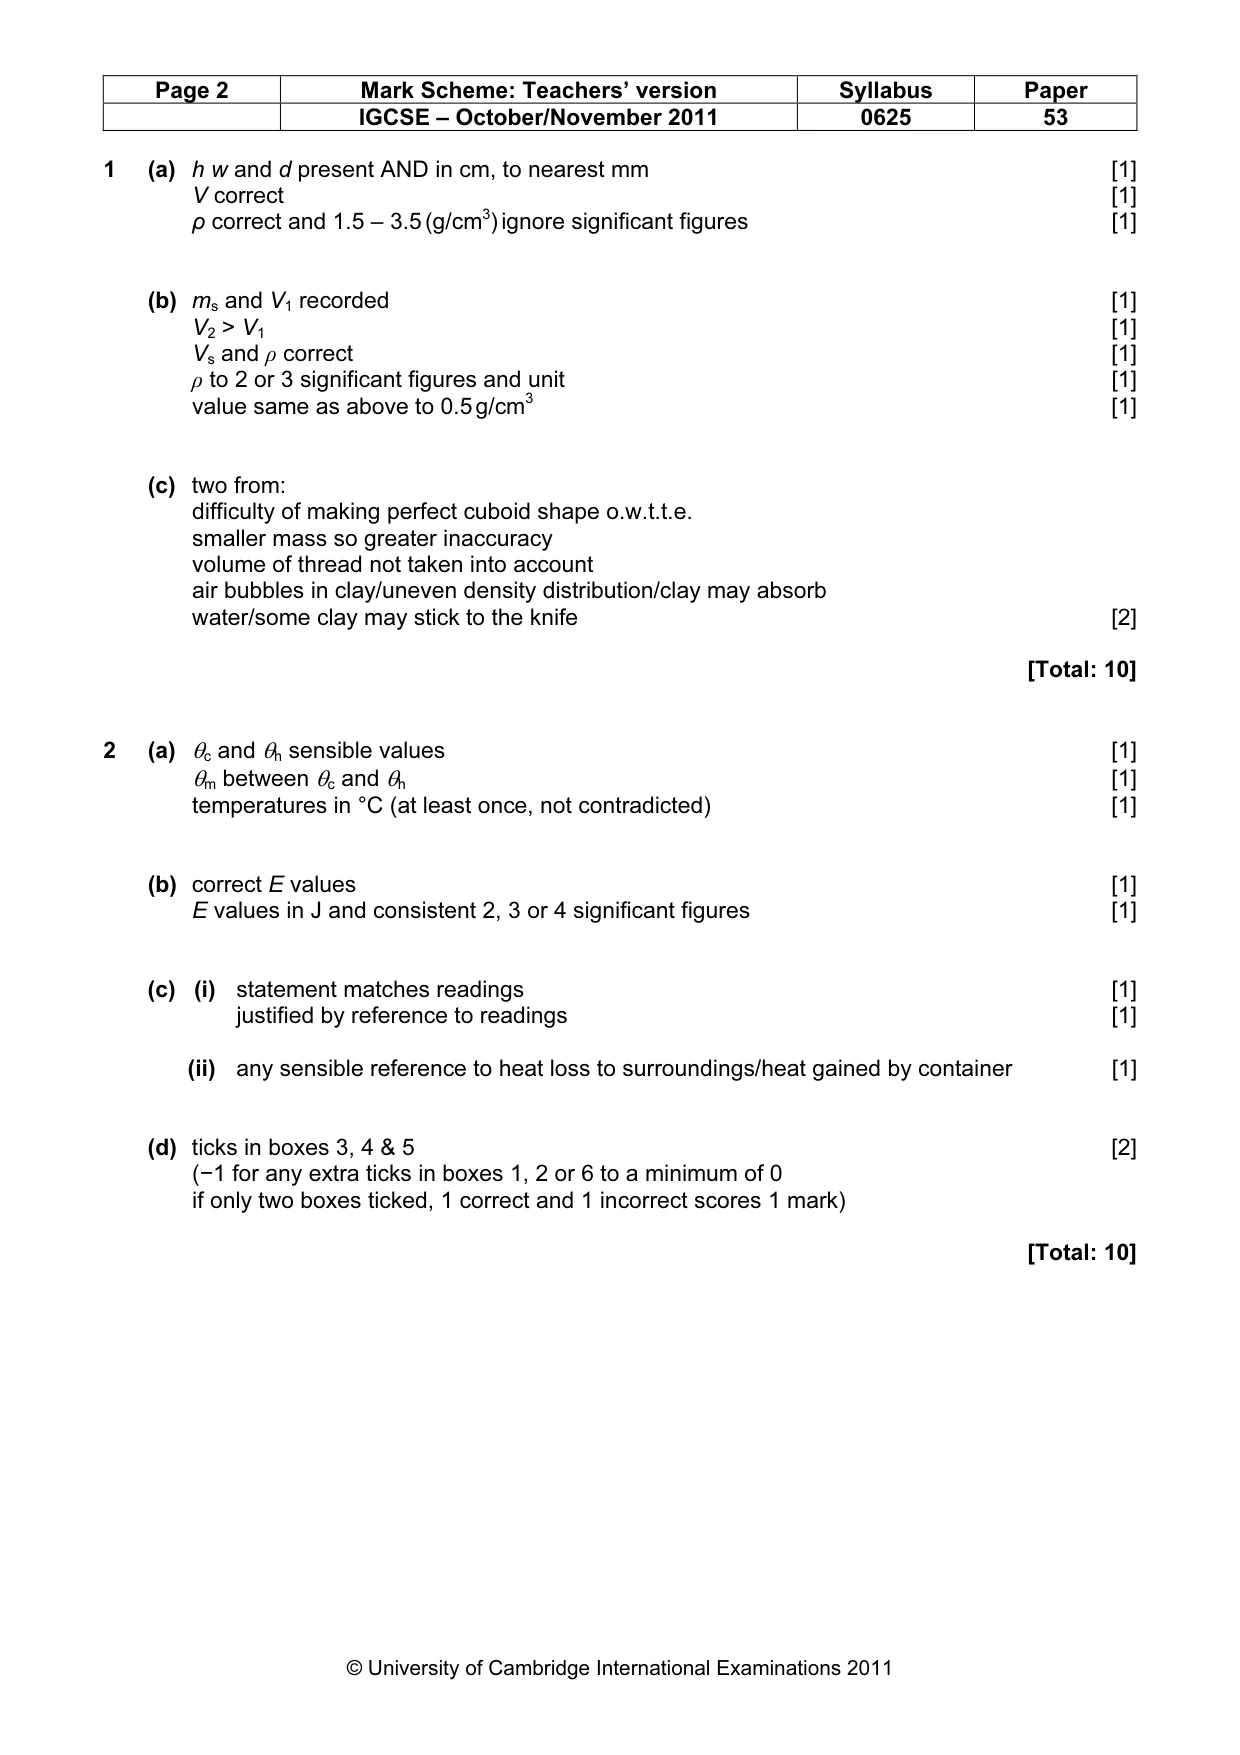
Mark scheme: 1 (a) h w and d present AND in cm, to nearest mm [1] V correct [1] ρ correct and 1.5 – 3.5 (g/cm3) ignore significant figures [1] (b) ms and V1 recorded [1] V2 > V1 [1] Vs and ρ correct [1] ρ to 2 or 3 significant figures and unit [1] value same as above to 0.5 g/cm3 [1] (c) two from: difficulty of making perfect cuboid shape o.w.t.t.e. smaller mass so greater inaccuracy volume of thread not taken into account air bubbles in clay/uneven density distribution/clay may absorb water/some clay may stick to the knife [2] [Total: 10]
Q2 · In this experiment, you will investigate the energy changes that occur when hot and cold…
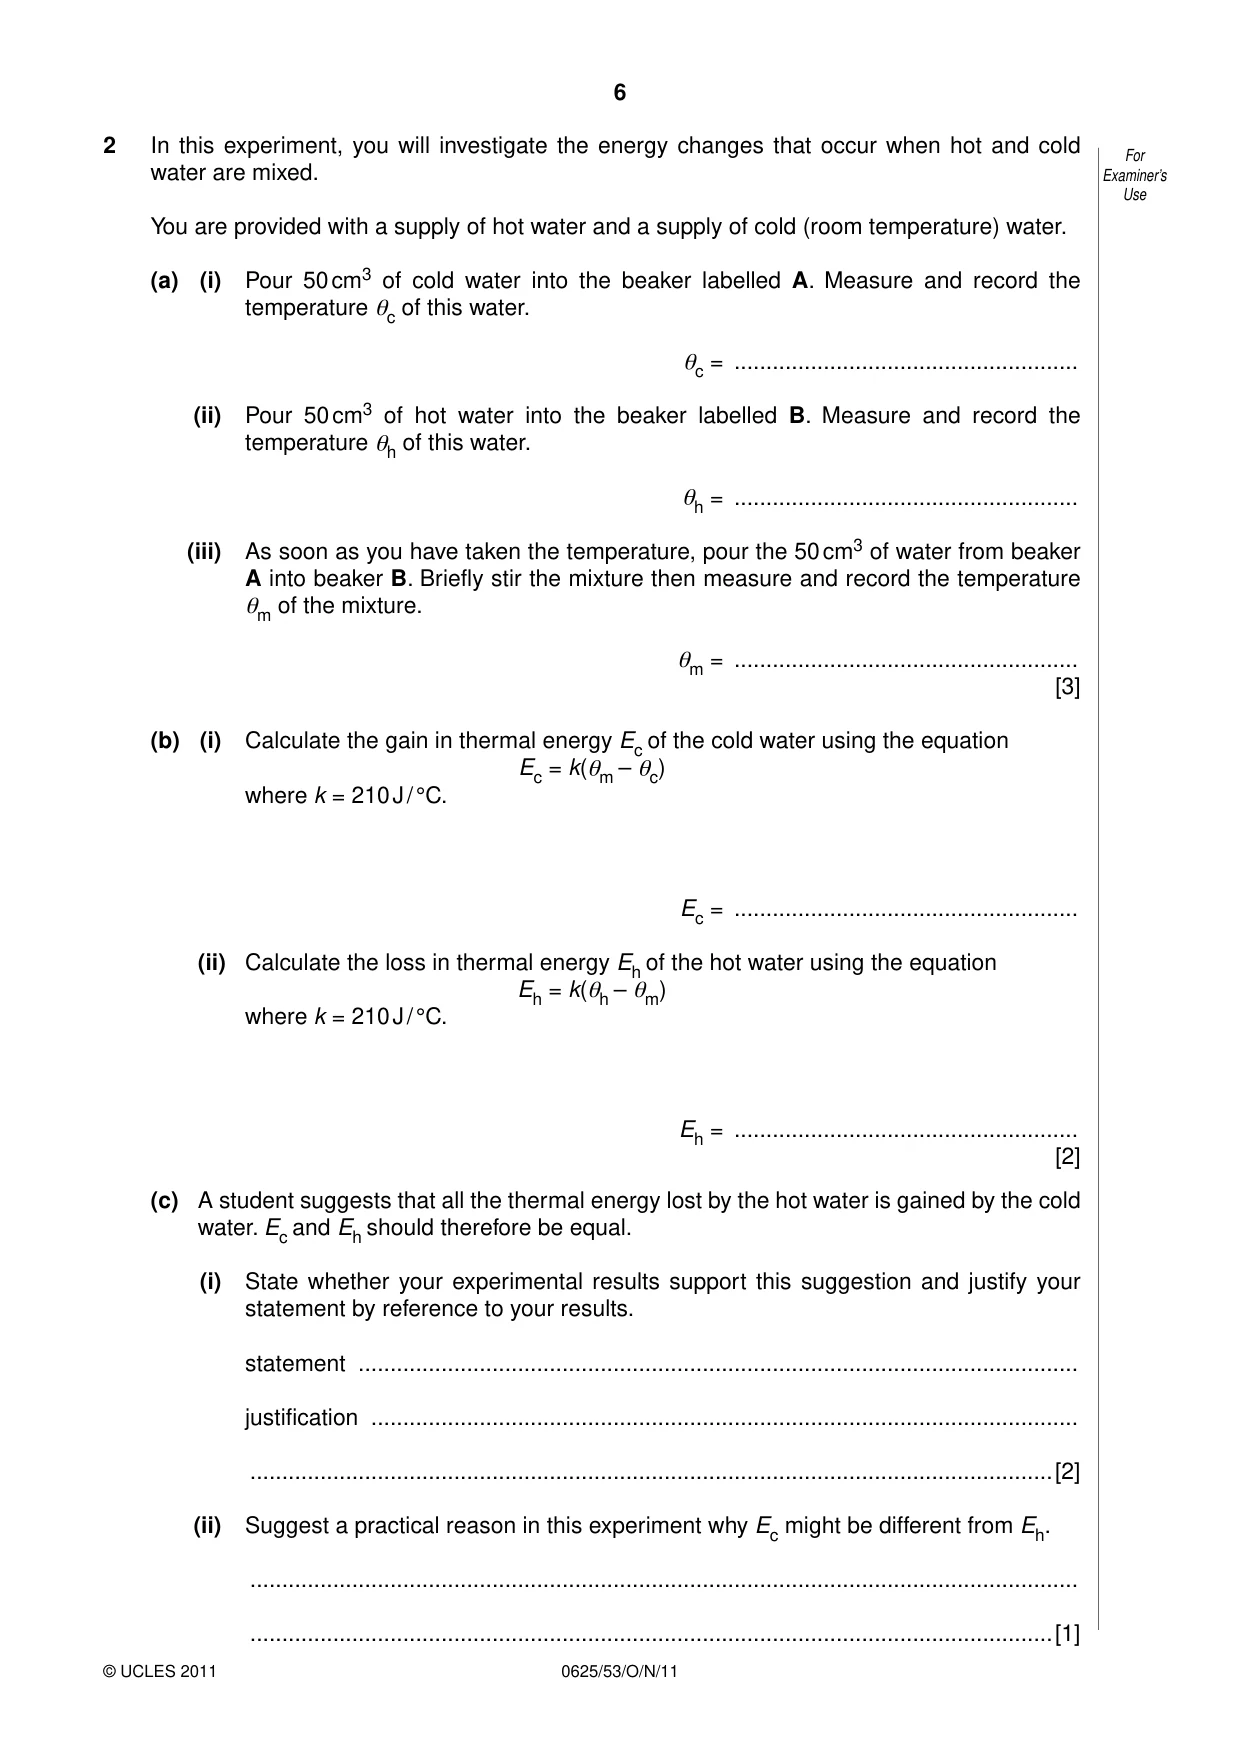
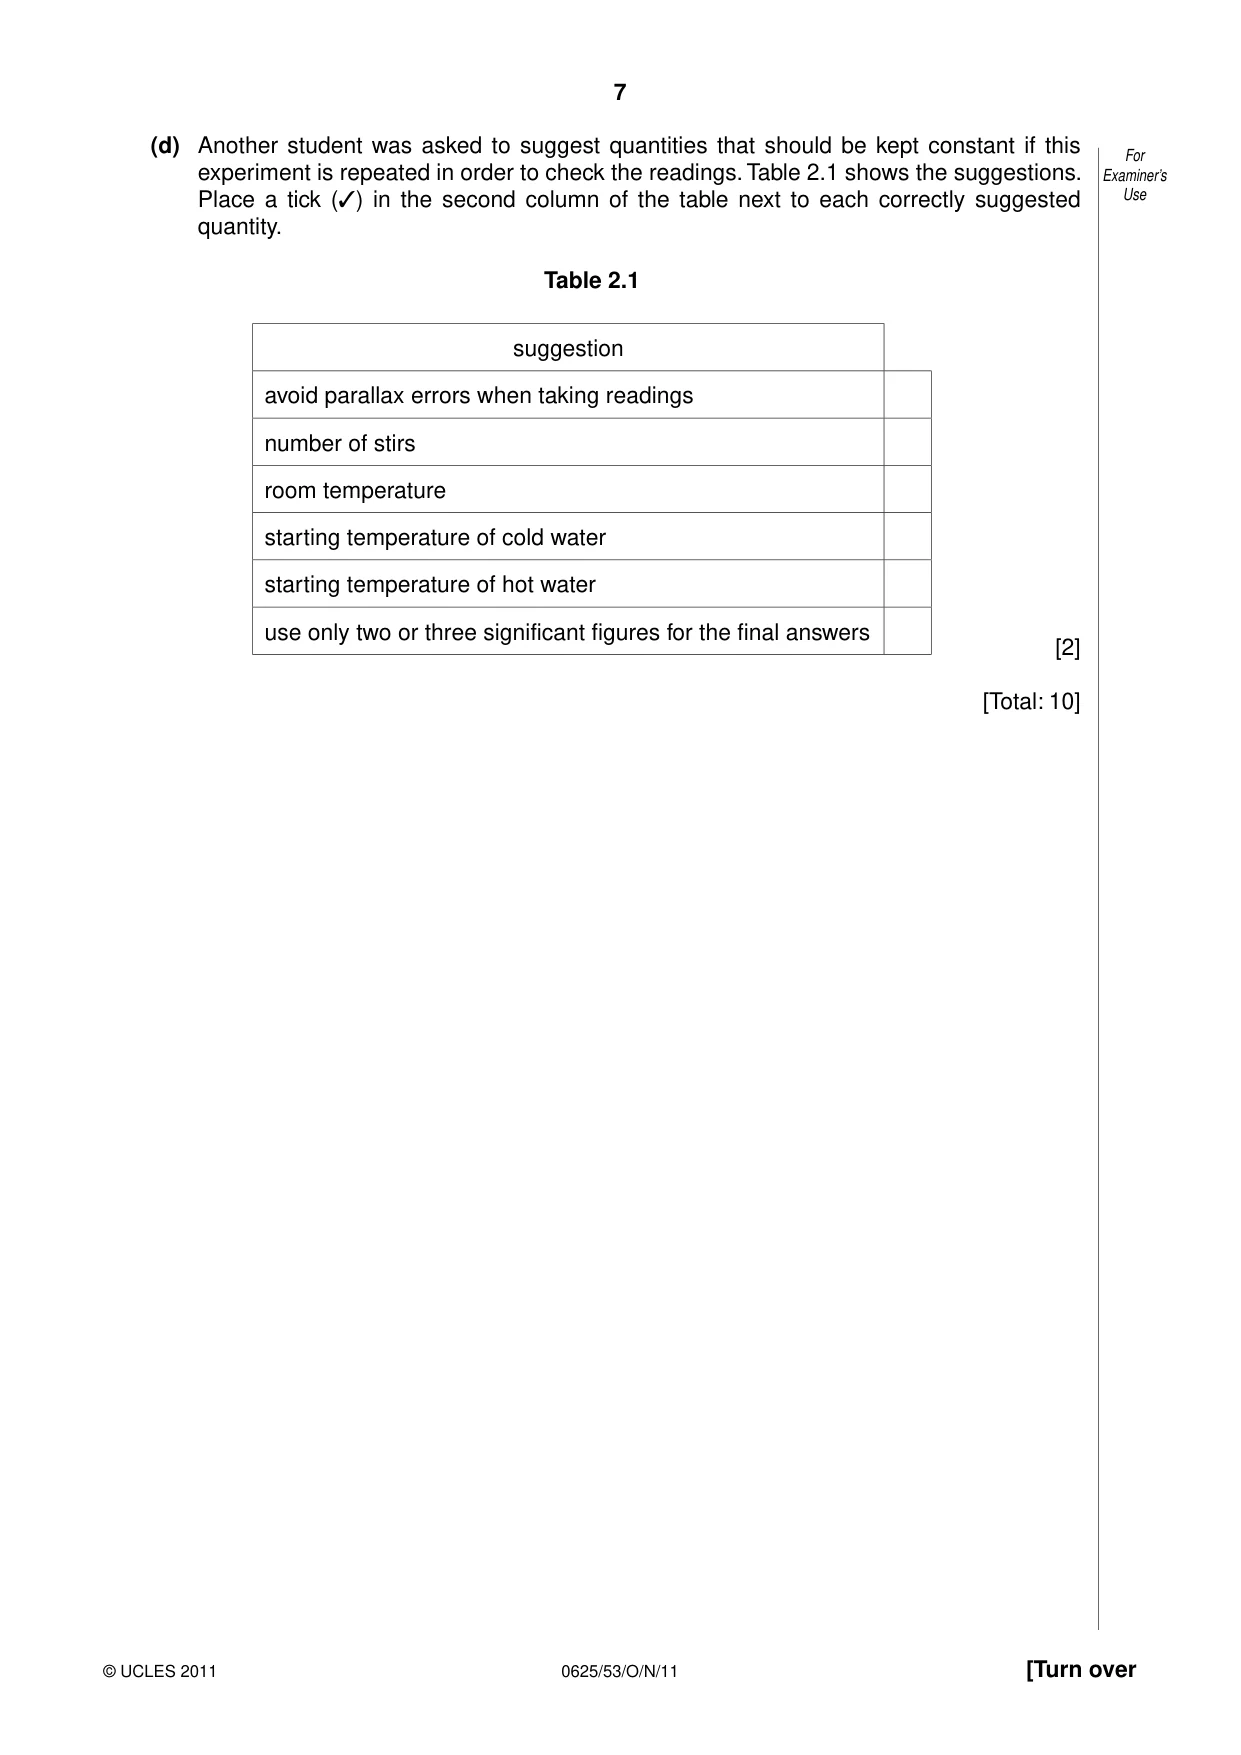
2 In this experiment, you will investigate the energy changes that occur when hot and cold For water are mixed. Examiner’s Use You are provided with a supply of hot water and a supply of cold (room temperature) water. (a) (i) Pour 50 cm3 of cold water into the beaker labelled A. Measure and record the temperature θc of this water. θc = ...................................................... (ii) Pour 50 cm3 of hot water into the beaker labelled B. Measure and record the temperature θh of this water. θh = ...................................................... (iii) As soon as you have taken the temperature, pour the 50 cm3 of water from beaker A into beaker B. Briefly stir the mixture then measure and record the temperature θm of the mixture. θm = ...................................................... [3] (b) (i) Calculate the gain in thermal energy Ec of the cold water using the equation Ec = k(θm – θc) where k = 210 J / °C. Ec = ...................................................... (ii) Calculate the loss in thermal energy Eh of the hot water using the equation Eh = k(θh – θm) where k = 210 J / °C. Eh = ...................................................... [2] (c) A student suggests that all the thermal energy lost by the hot water is gained by the cold water. Ec and Eh should therefore be equal. (i) State whether your experimental results support this suggestion and justify your statement by reference to your results. statement ................................................................................................................. justification ............................................................................................................... ..............................................................................................................................[2] (ii) Suggest a practical reason in this experiment why Ec might be different from Eh. .................................................................................................................................. ..............................................................................................................................[1] (d) Another student was asked to suggest quantities that should be kept constant if this For experiment is repeated in order to check the readings. Table 2.1 shows the suggestions. Examiner’s Place a tick (✓) in the second column of the table next to each correctly suggested Use quantity. Table 2.1 suggestion avoid parallax errors when taking readings number of stirs room temperature starting temperature of cold water starting temperature of hot water use only two or three significant figures for the final answers [2] [Total: 10]
Mark scheme: 2 (a) θc and θh sensible values [1] θm between θc and θh [1] temperatures in °C (at least once, not contradicted) [1] (b) correct E values [1] E values in J and consistent 2, 3 or 4 significant figures [1] (c) (i) statement matches readings [1] justified by reference to readings [1] (ii) any sensible reference to heat loss to surroundings/heat gained by container [1] (d) ticks in boxes 3, 4 & 5 [2] (−1 for any extra ticks in boxes 1, 2 or 6 to a minimum of 0 if only two boxes ticked, 1 correct and 1 incorrect scores 1 mark) [Total: 10] IGCSE – October/November 2011 0625 53
Q3 · In this experiment, you will investigate the resistance of a wire
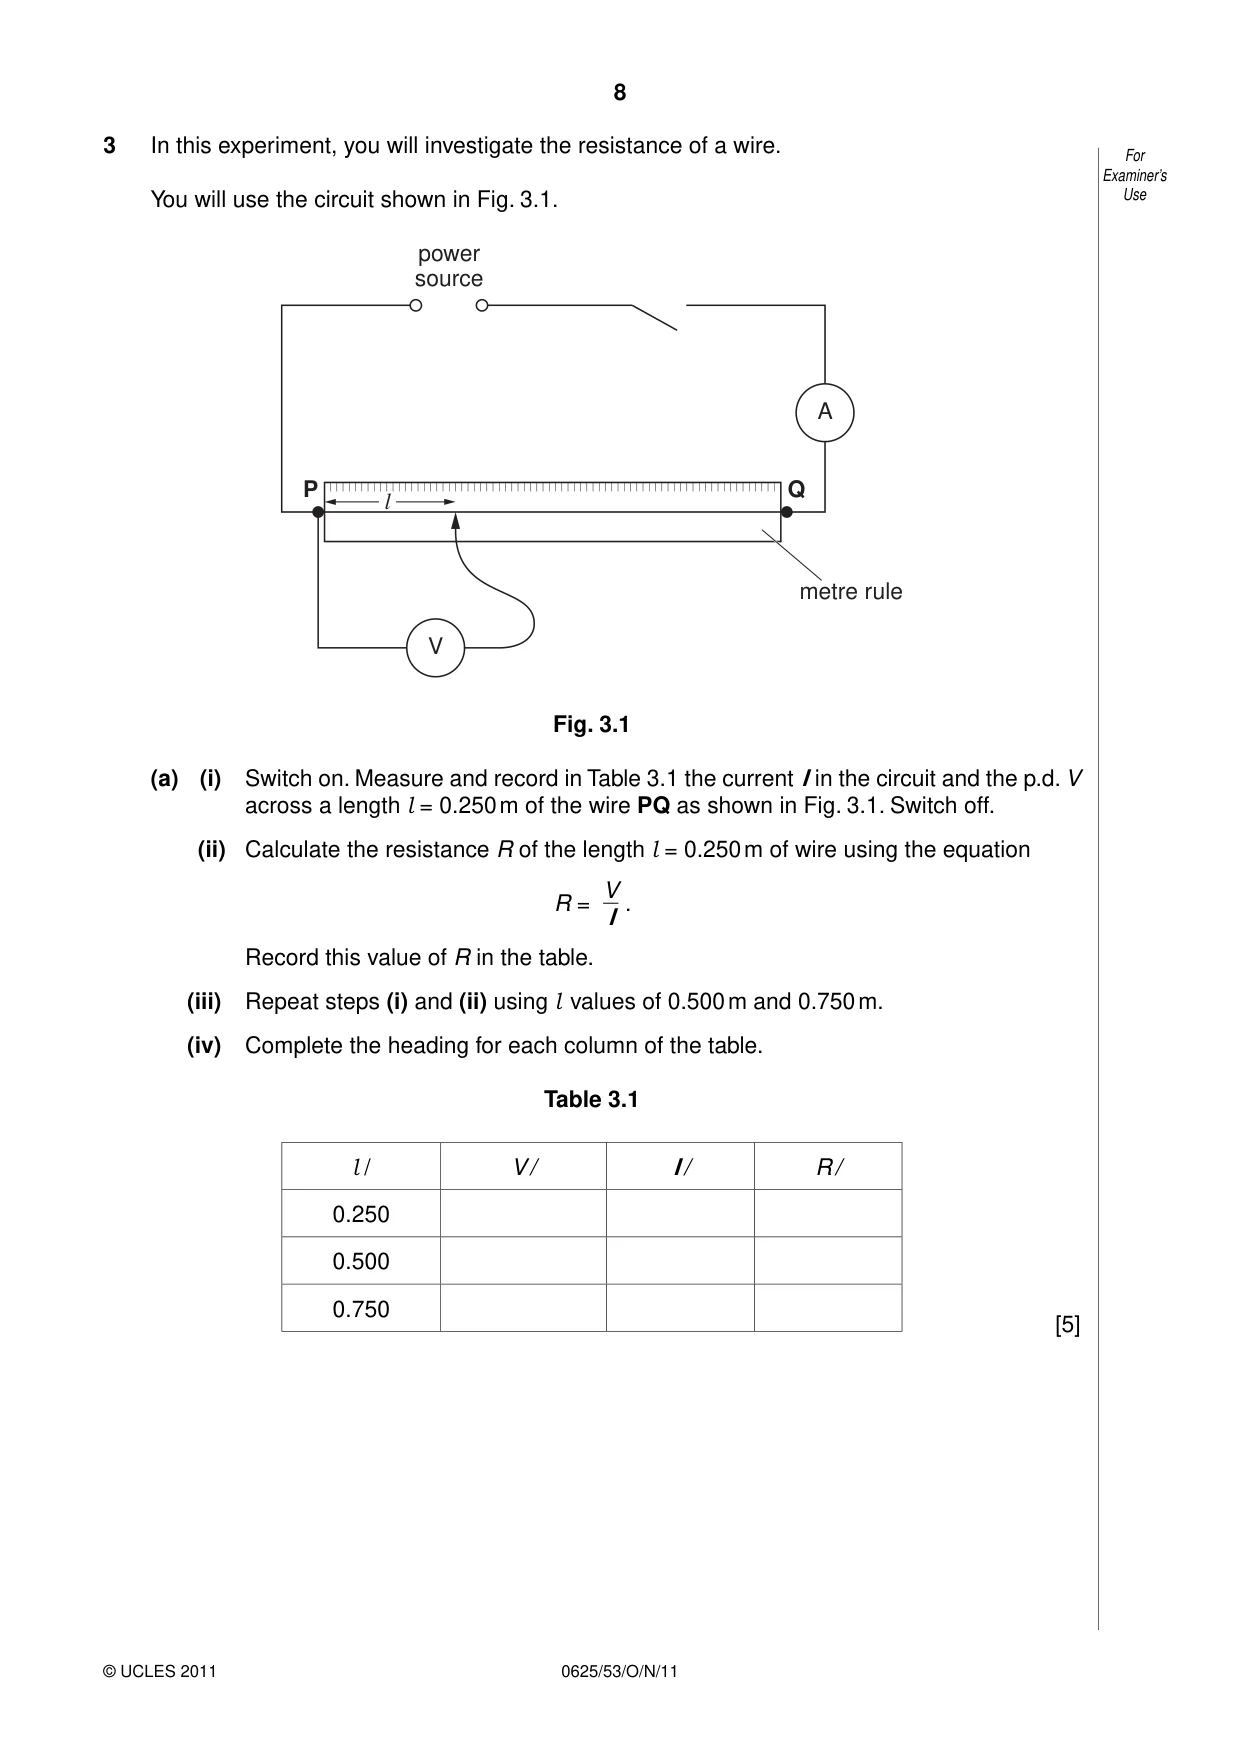
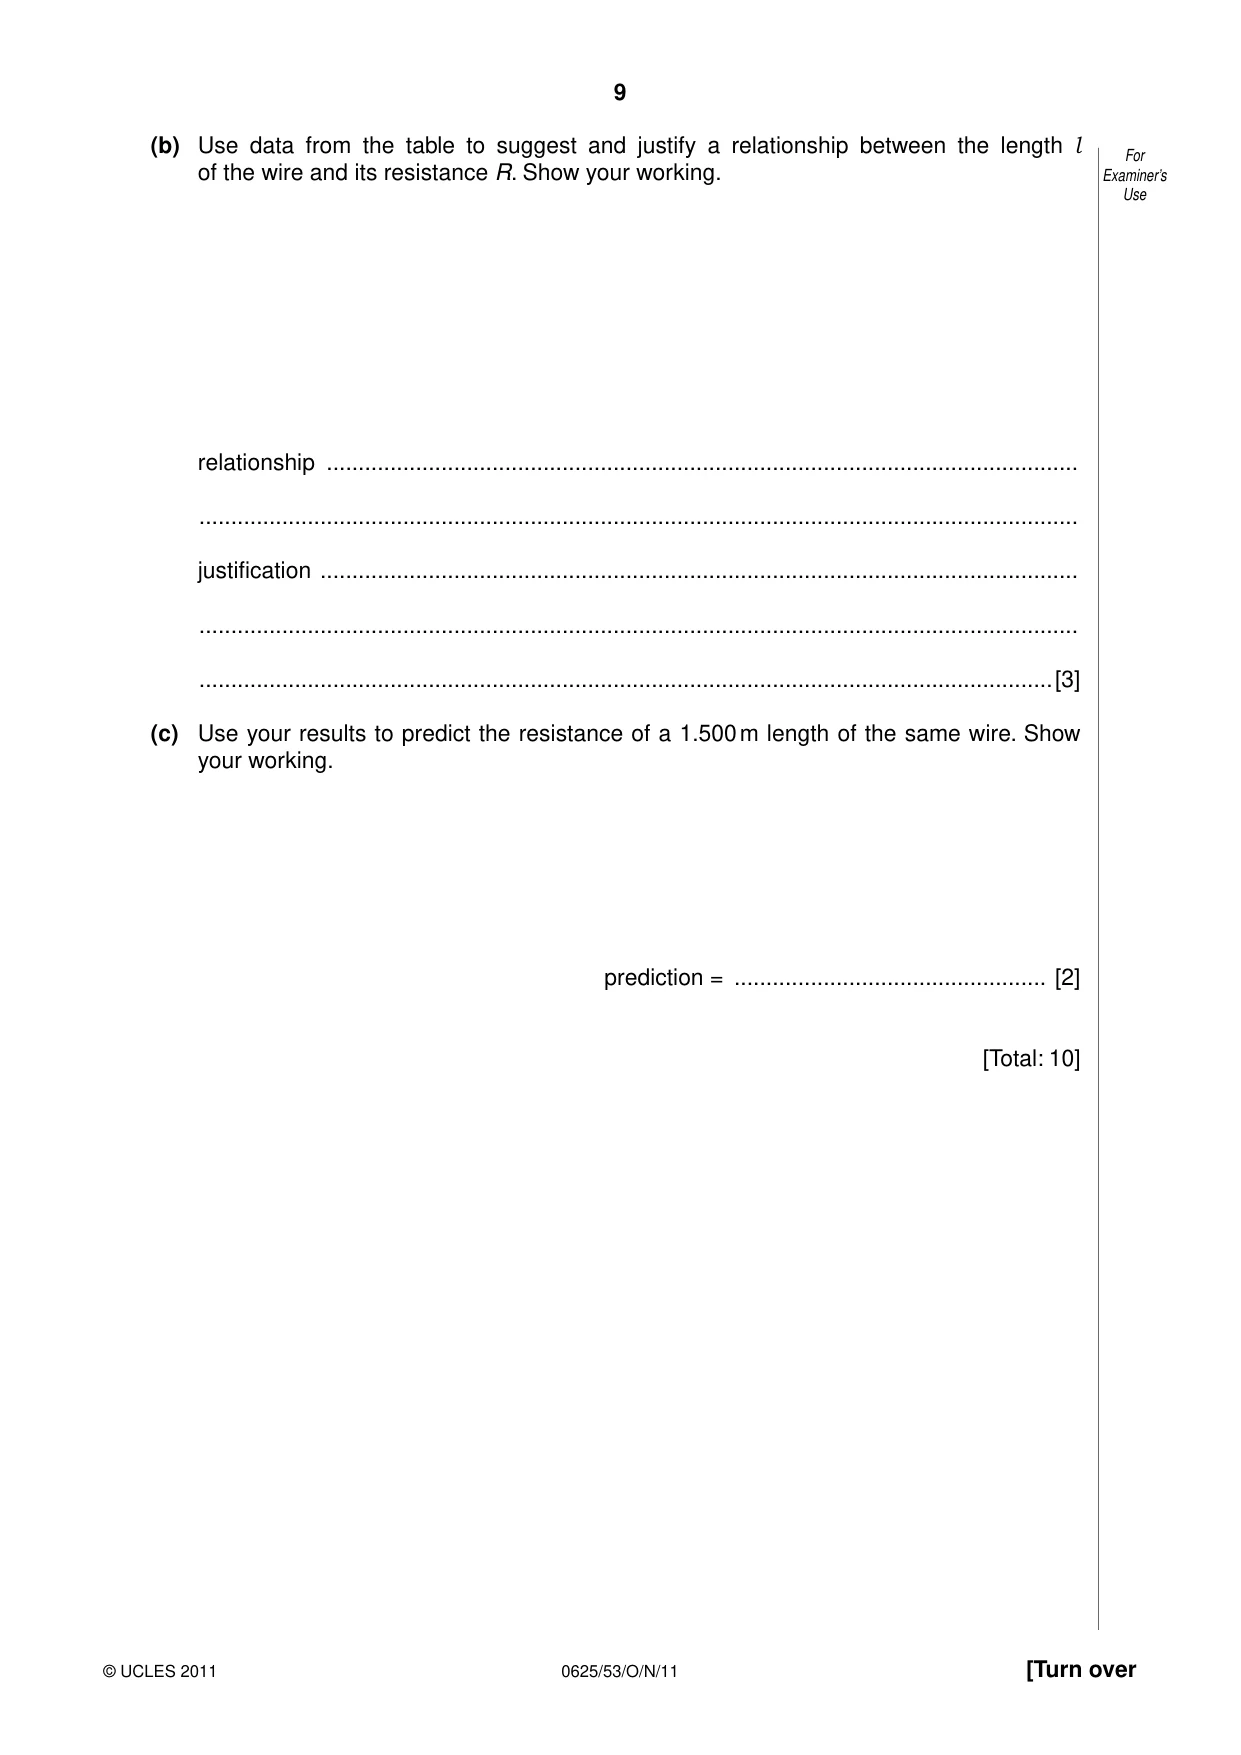
3 In this experiment, you will investigate the resistance of a wire. For Examiner’s You will use the circuit shown in Fig. 3.1. Use power source A P Q l metre rule V Fig. 3.1 (a) (i) Switch on. Measure and record in Table 3.1 the current I in the circuit and the p.d. V across a length l = 0.250 m of the wire PQ as shown in Fig. 3.1. Switch off. (ii) Calculate the resistance R of the length l = 0.250 m of wire using the equation V R = . I Record this value of R in the table. (iii) Repeat steps (i) and (ii) using l values of 0.500 m and 0.750 m. (iv) Complete the heading for each column of the table. Table 3.1 l / V / I / R / 0.250 0.500 0.750 [5] (b) Use data from the table to suggest and justify a relationship between the length l For of the wire and its resistance R. Show your working. Examiner’s Use relationship ...................................................................................................................... .......................................................................................................................................... justification ....................................................................................................................... .......................................................................................................................................... ......................................................................................................................................[3] (c) Use your results to predict the resistance of a 1.500 m length of the same wire. Show your working. prediction = ................................................. [2] [Total: 10]
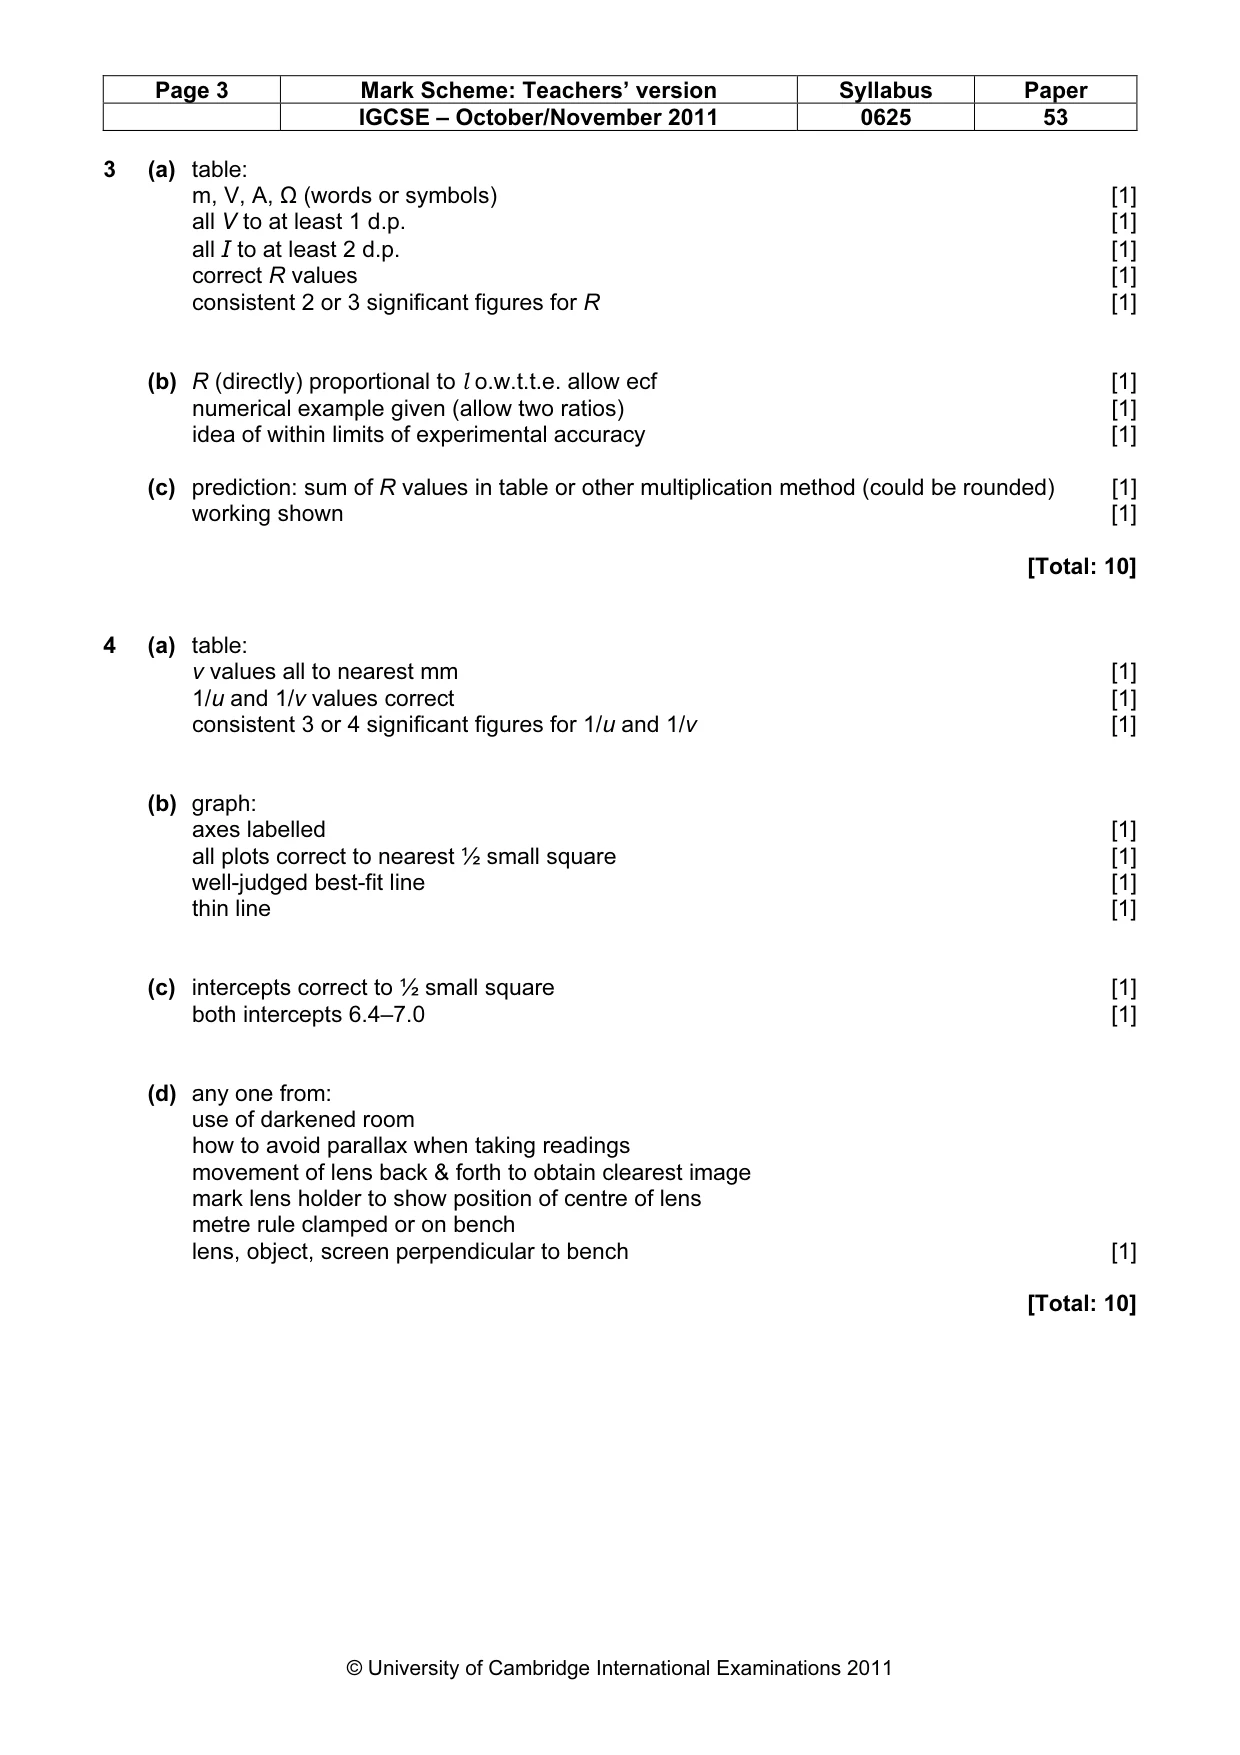
Mark scheme: 3 (a) table: m, V, A, Ω (words or symbols) [1] all V to at least 1 d.p. [1] all I to at least 2 d.p. [1] correct R values [1] consistent 2 or 3 significant figures for R [1] (b) R (directly) proportional to l o.w.t.t.e. allow ecf [1] numerical example given (allow two ratios) [1] idea of within limits of experimental accuracy [1] (c) prediction: sum of R values in table or other multiplication method (could be rounded) [1] working shown [1] [Total: 10]
Q4 · In this experiment, you will investigate the formation of images by a converging lens
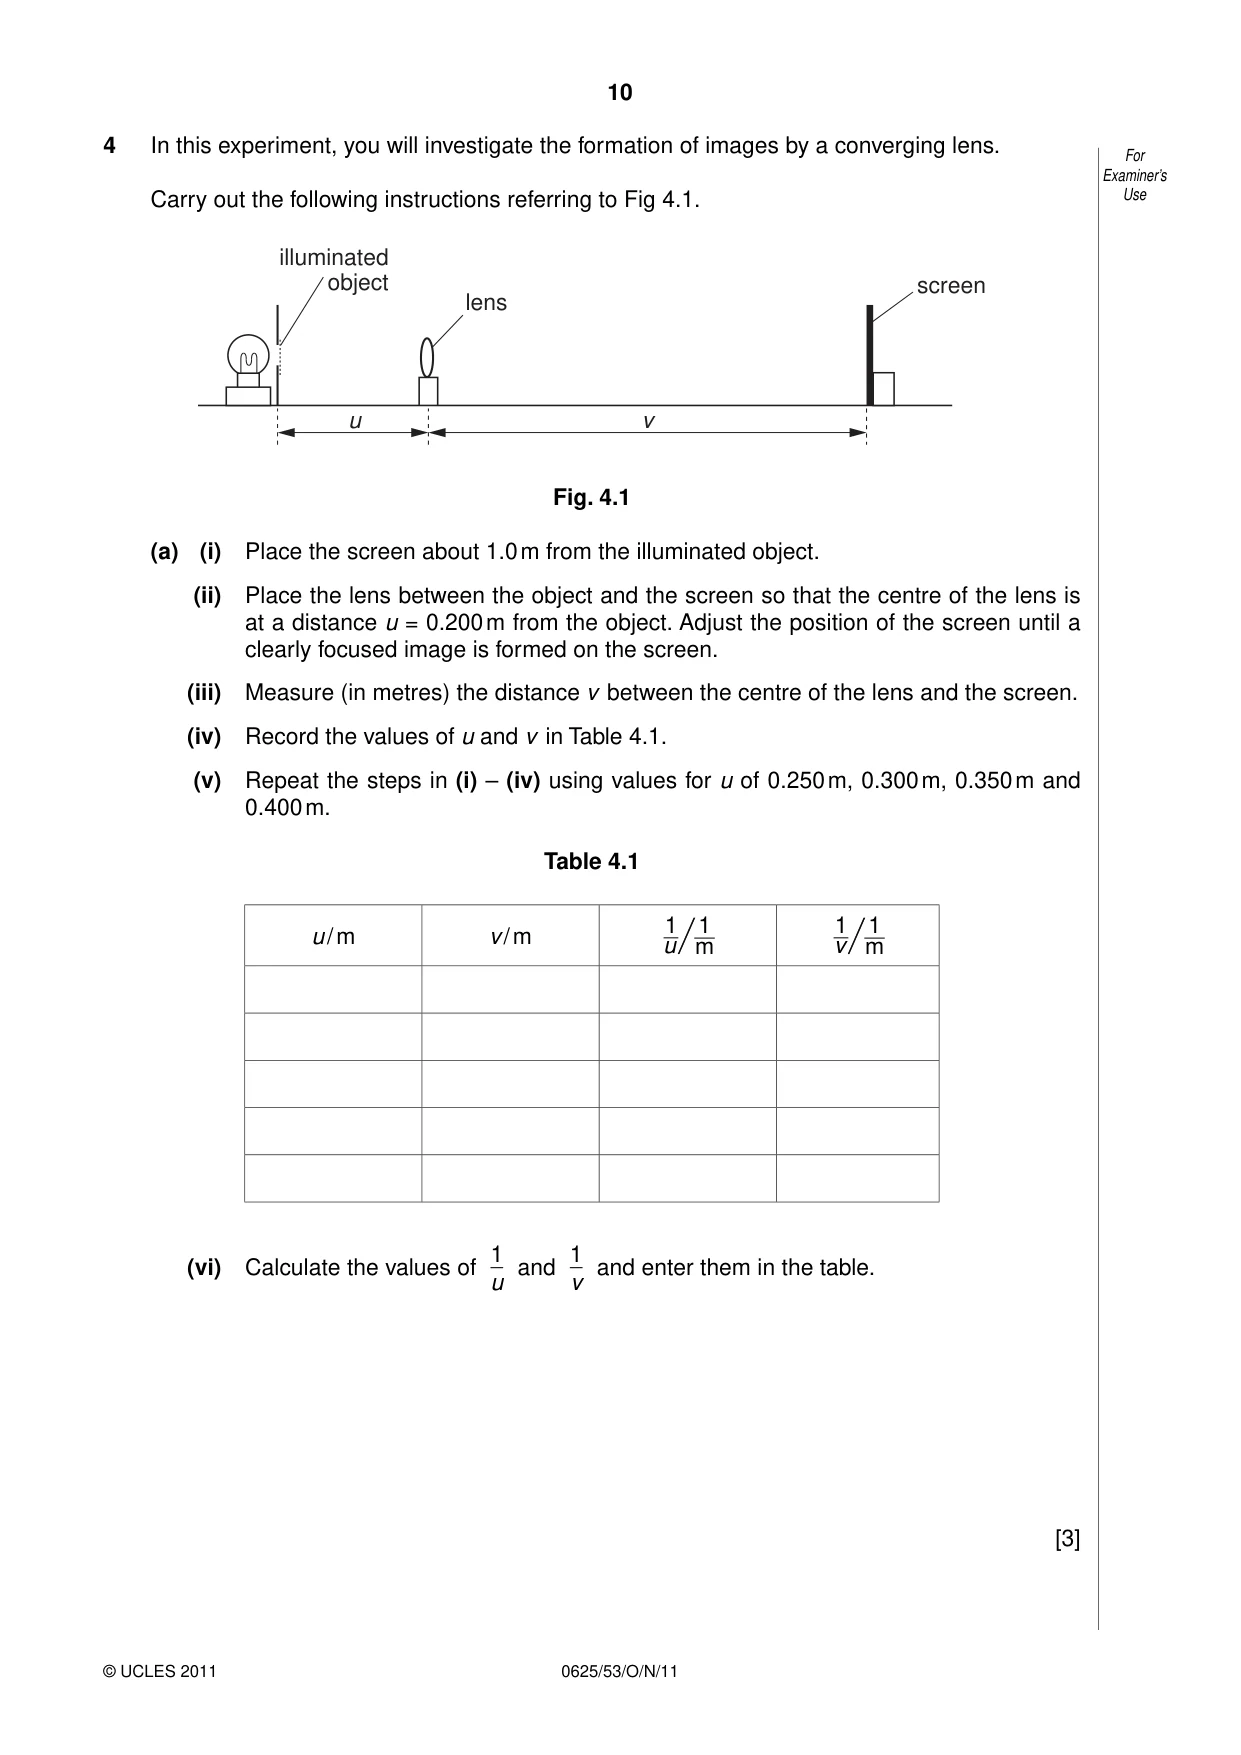
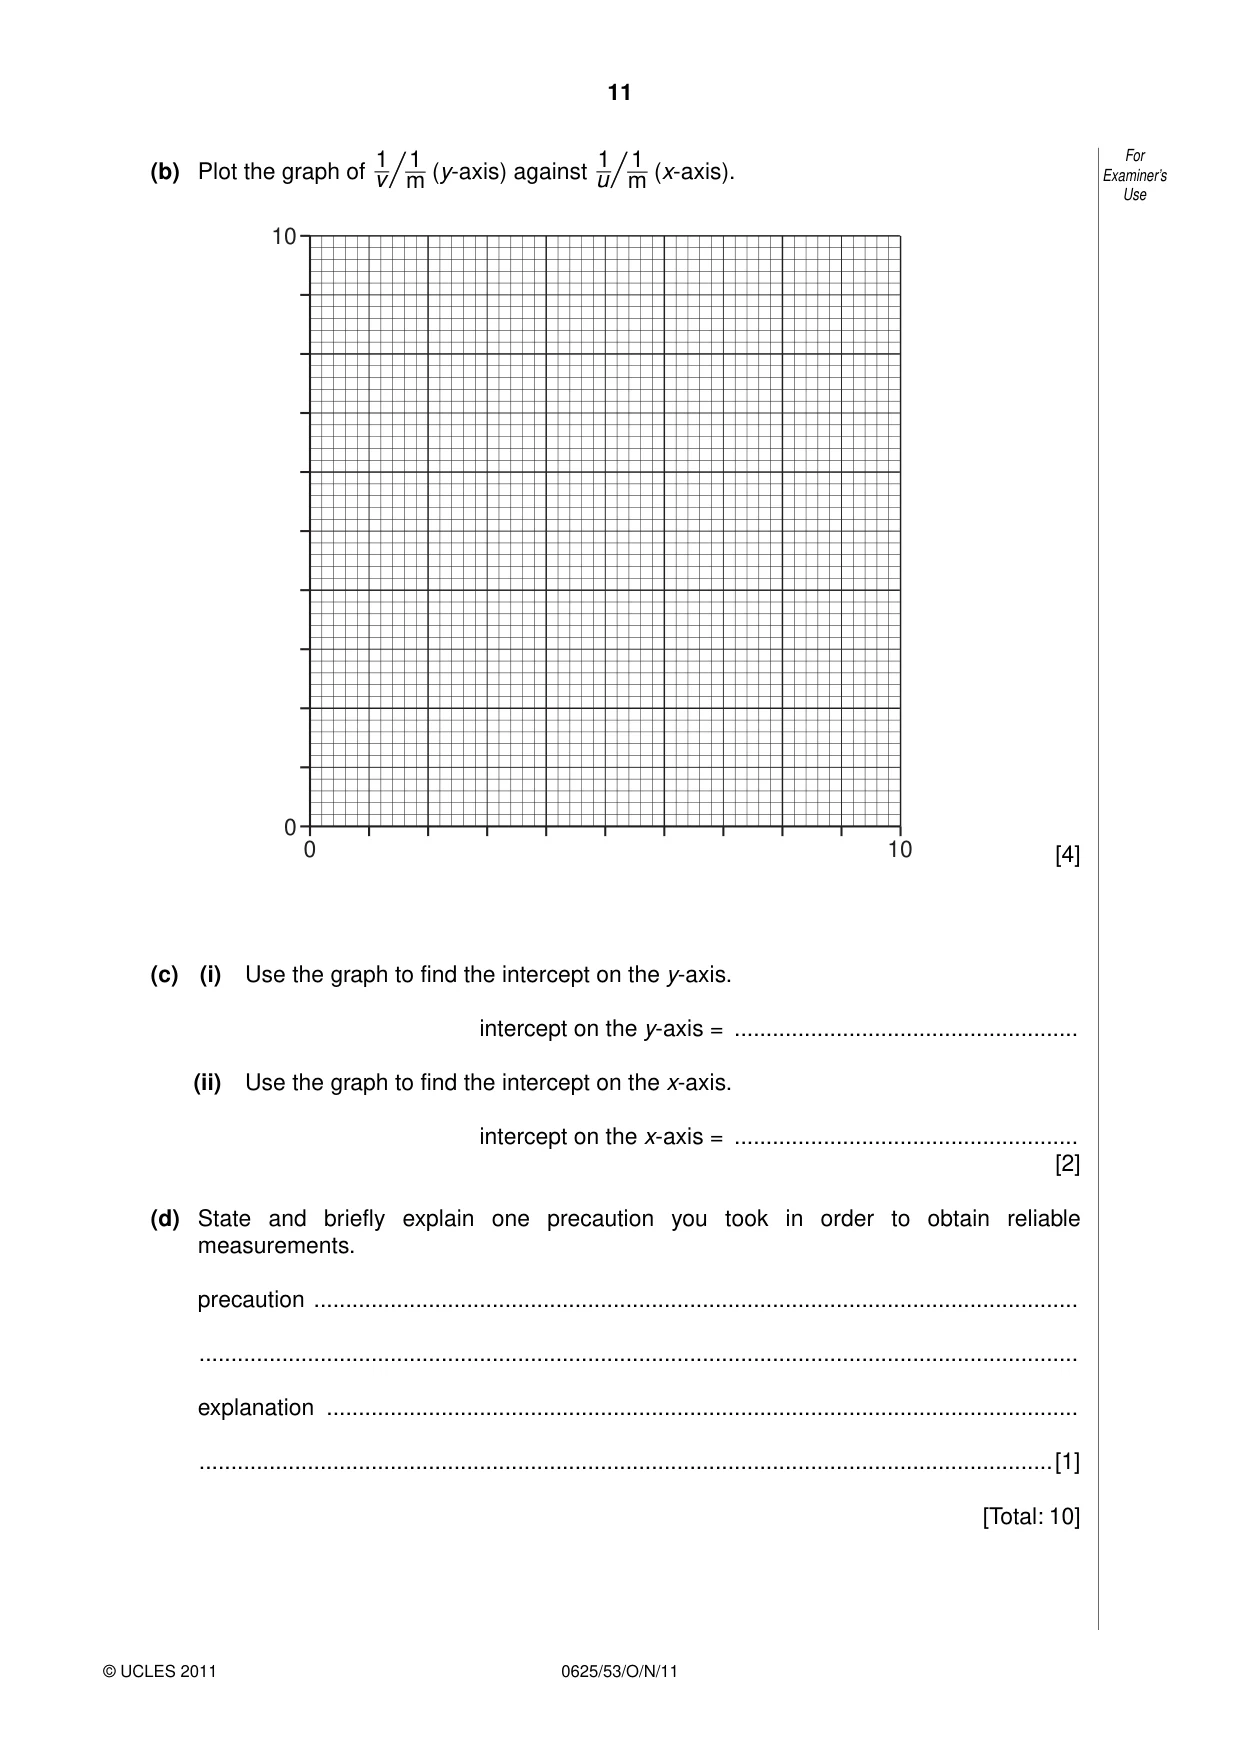
4 In this experiment, you will investigate the formation of images by a converging lens. For Examiner’s Carry out the following instructions referring to Fig 4.1. Use illuminated object screen lens u v Fig. 4.1 (a) (i) Place the screen about 1.0 m from the illuminated object. (ii) Place the lens between the object and the screen so that the centre of the lens is at a distance u = 0.200 m from the object. Adjust the position of the screen until a clearly focused image is formed on the screen. (iii) Measure (in metres) the distance v between the centre of the lens and the screen. (iv) Record the values of u and v in Table 4.1. (v) Repeat the steps in (i) – (iv) using values for u of 0.250 m, 0.300 m, 0.350 m and 0.400 m. Table 4.1 1 1 1 1 u / m v / m u/ m v/ m 1 1 (vi) Calculate the values of and and enter them in the table. u v [3] 1 1 1 1 For (b) Plot the graph of (y-axis) against (x-axis). Examiner’s v/ m u/ m Use 10 0 0 10 [4] (c) (i) Use the graph to find the intercept on the y-axis. intercept on the y-axis = ...................................................... (ii) Use the graph to find the intercept on the x-axis. intercept on the x-axis = ...................................................... [2] (d) State and briefly explain one precaution you took in order to obtain reliable measurements. precaution ........................................................................................................................ .......................................................................................................................................... explanation ...................................................................................................................... ......................................................................................................................................[1] [Total: 10]
Mark scheme: 4 (a) table: v values all to nearest mm [1] 1/u and 1/v values correct [1] consistent 3 or 4 significant figures for 1/u and 1/v [1] (b) graph: axes labelled [1] all plots correct to nearest ½ small square [1] well-judged best-fit line [1] thin line [1] (c) intercepts correct to ½ small square [1] both intercepts 6.4–7.0 [1] (d) any one from: use of darkened room how to avoid parallax when taking readings movement of lens back & forth to obtain clearest image mark lens holder to show position of centre of lens metre rule clamped or on bench lens, object, screen perpendicular to bench [1] [Total: 10]
What was in this paper
The subtopics covered by these 4 questions, and how many questions each got. Open one in a new tab to see every Cambridge question on it.
What you needed in this session
Cambridge’s own grade thresholds for 2011 Oct/Nov, Paper 5 · Variant 3. A higher threshold means an easier paper — the bar moves with how the cohort did.