Cambridge IGCSE Geography (9-1) 0976 — 2022 Oct/Nov Paper 4 · Variant 2
0976/42/O/N/22 · 2 questions · 60 marks · ≈68 min
The question paper and its mark scheme, free to read here and free to download. This is Cambridge’s own paper, exactly as it was sat.
Question paper16 pages



Mark scheme9 pages
Answers below. Sit the paper first if you are practising.
Questions as text
Q1 · Students in Nairobi, the capital city of Kenya, Africa, were studying population migration
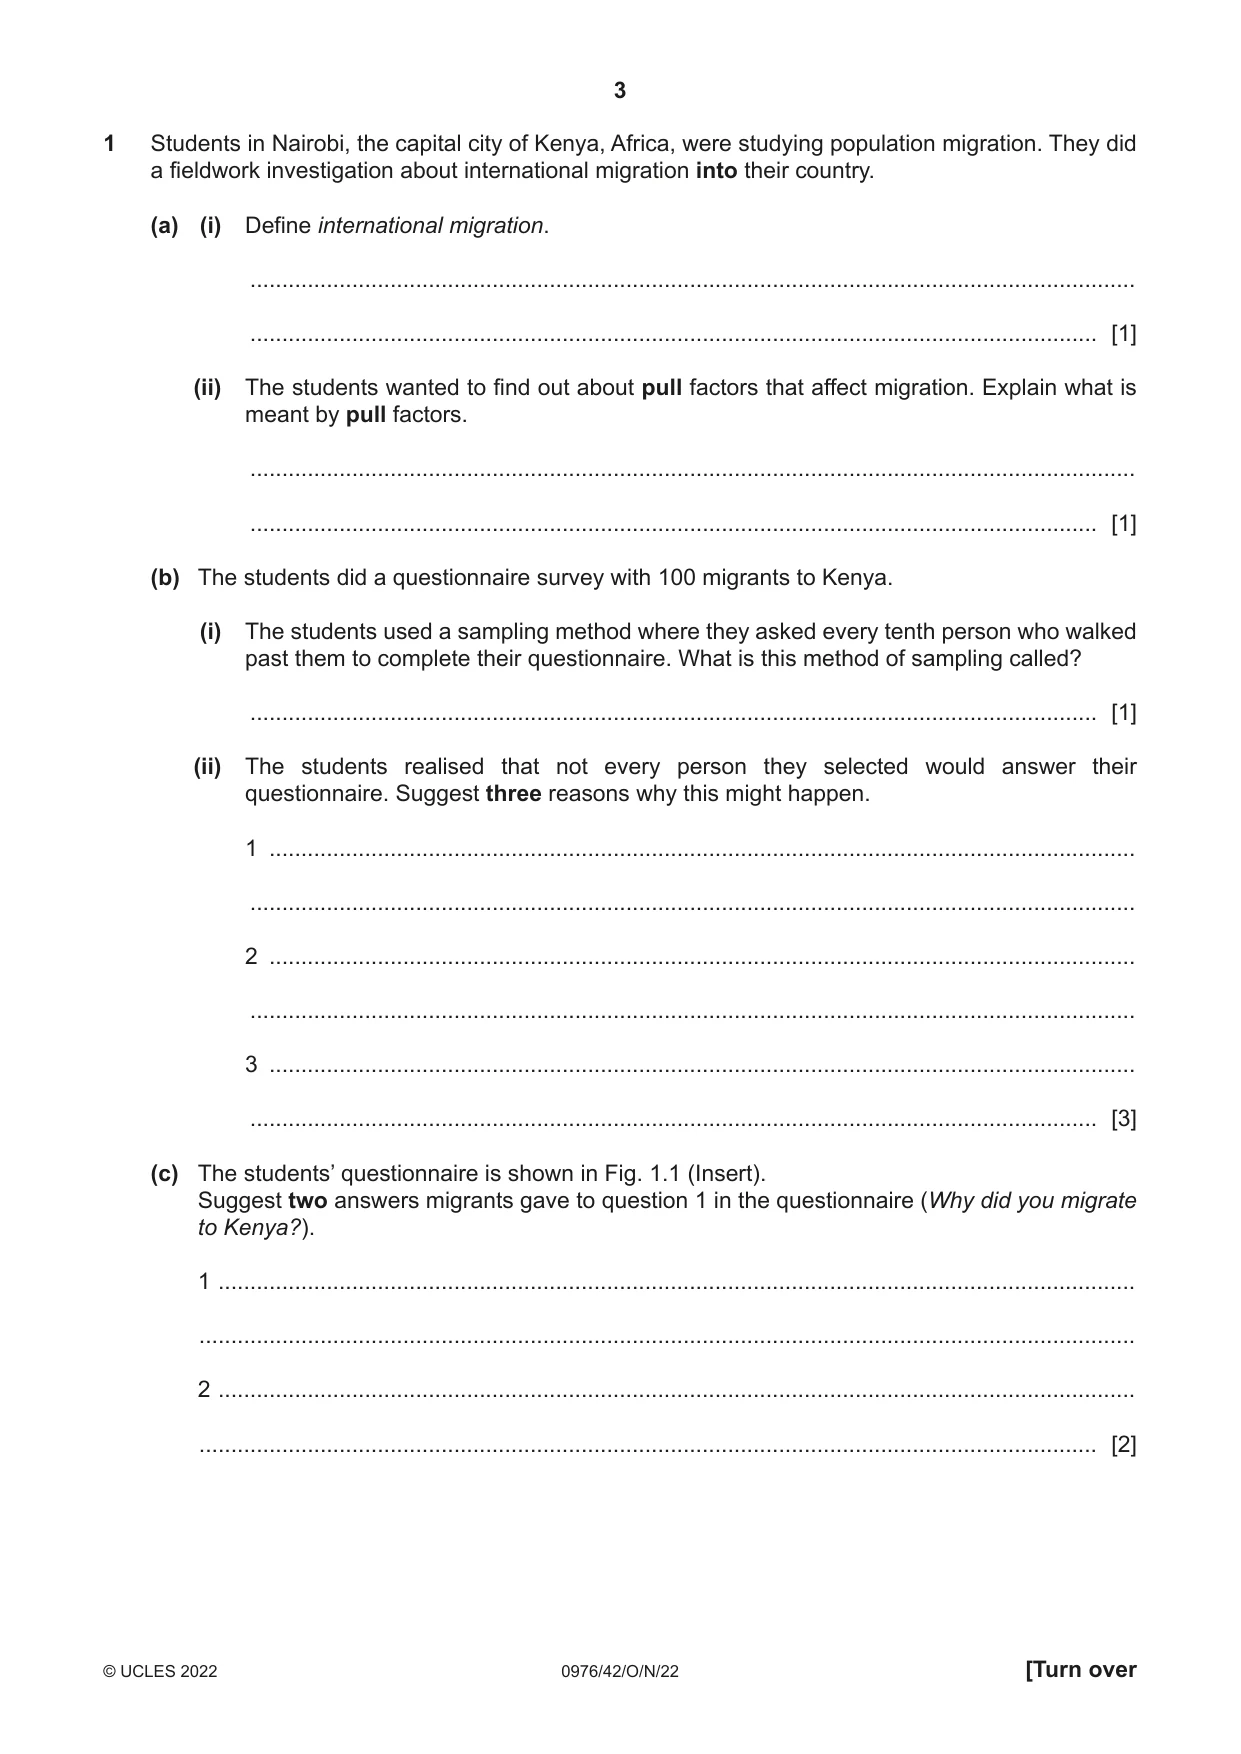
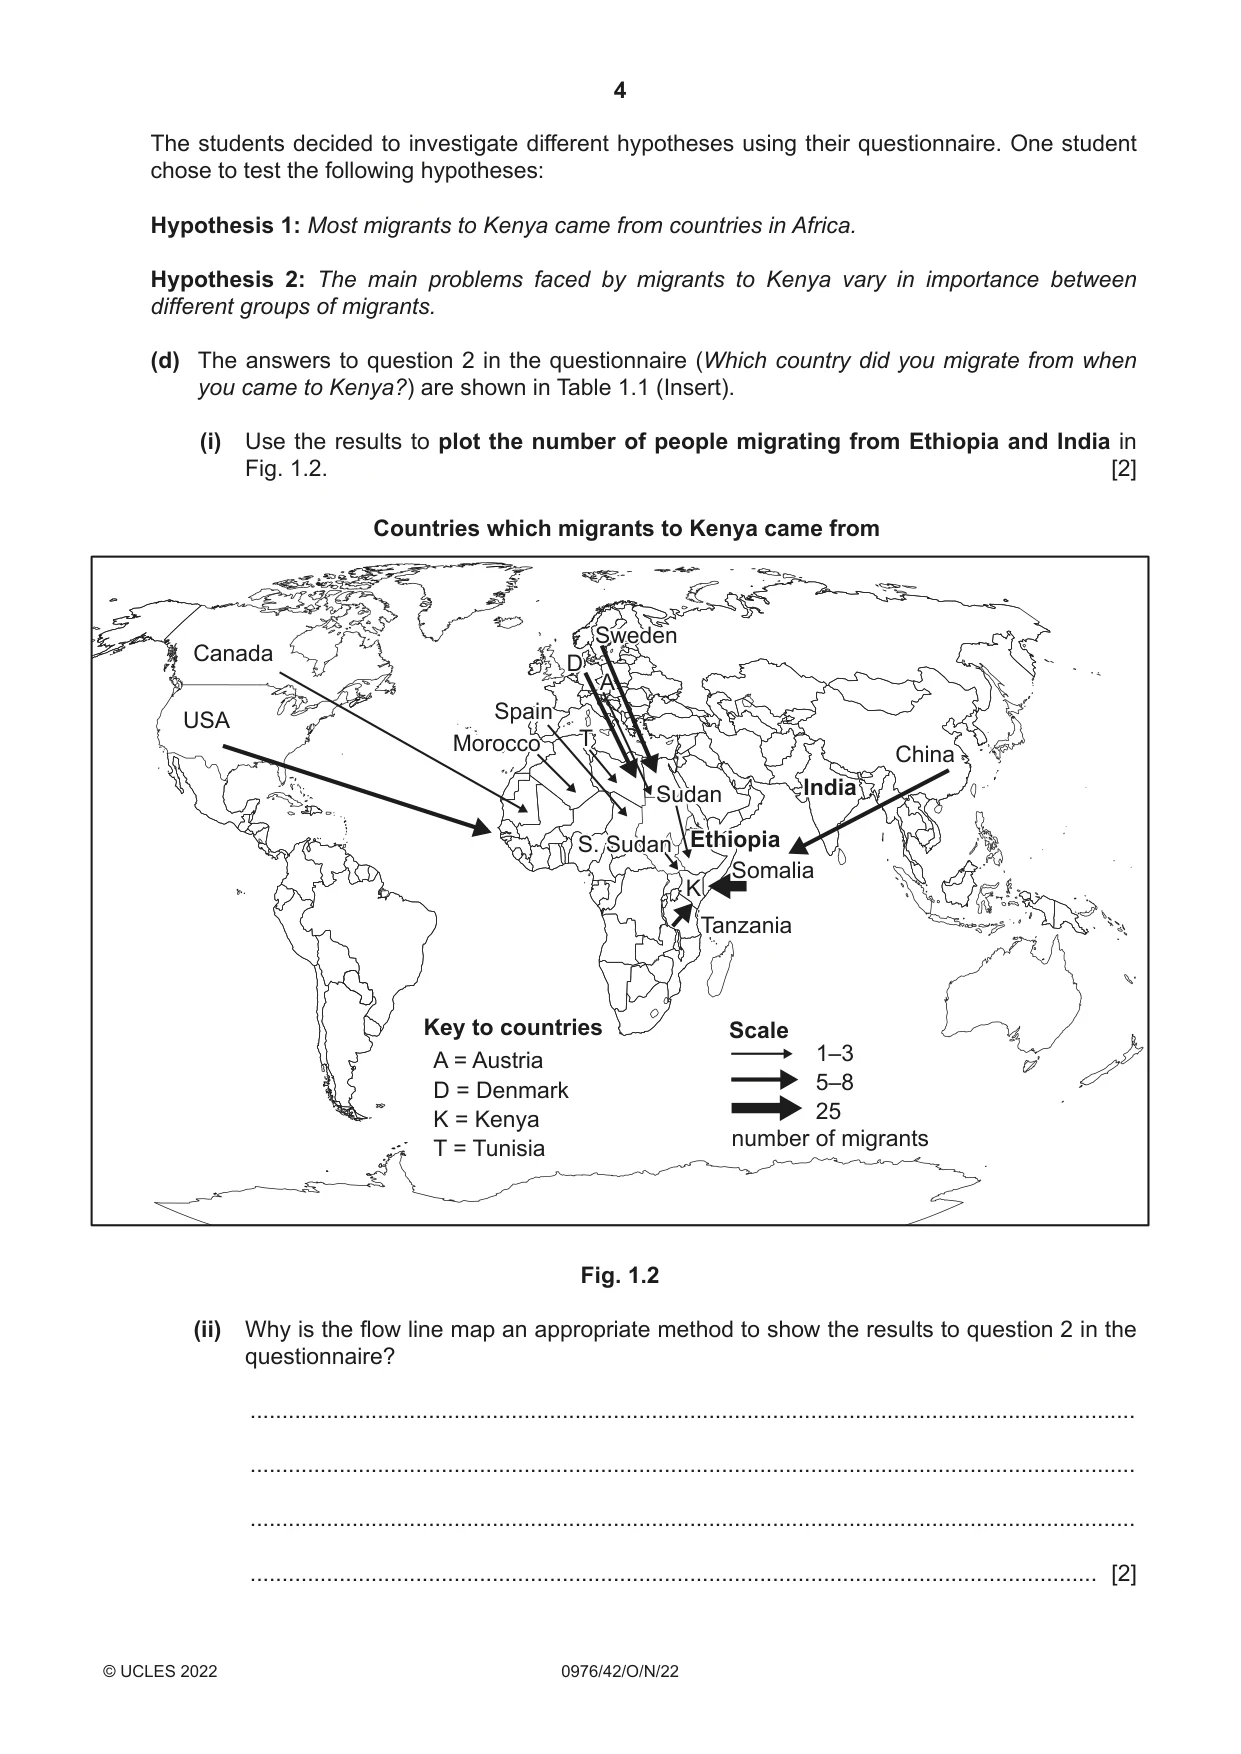
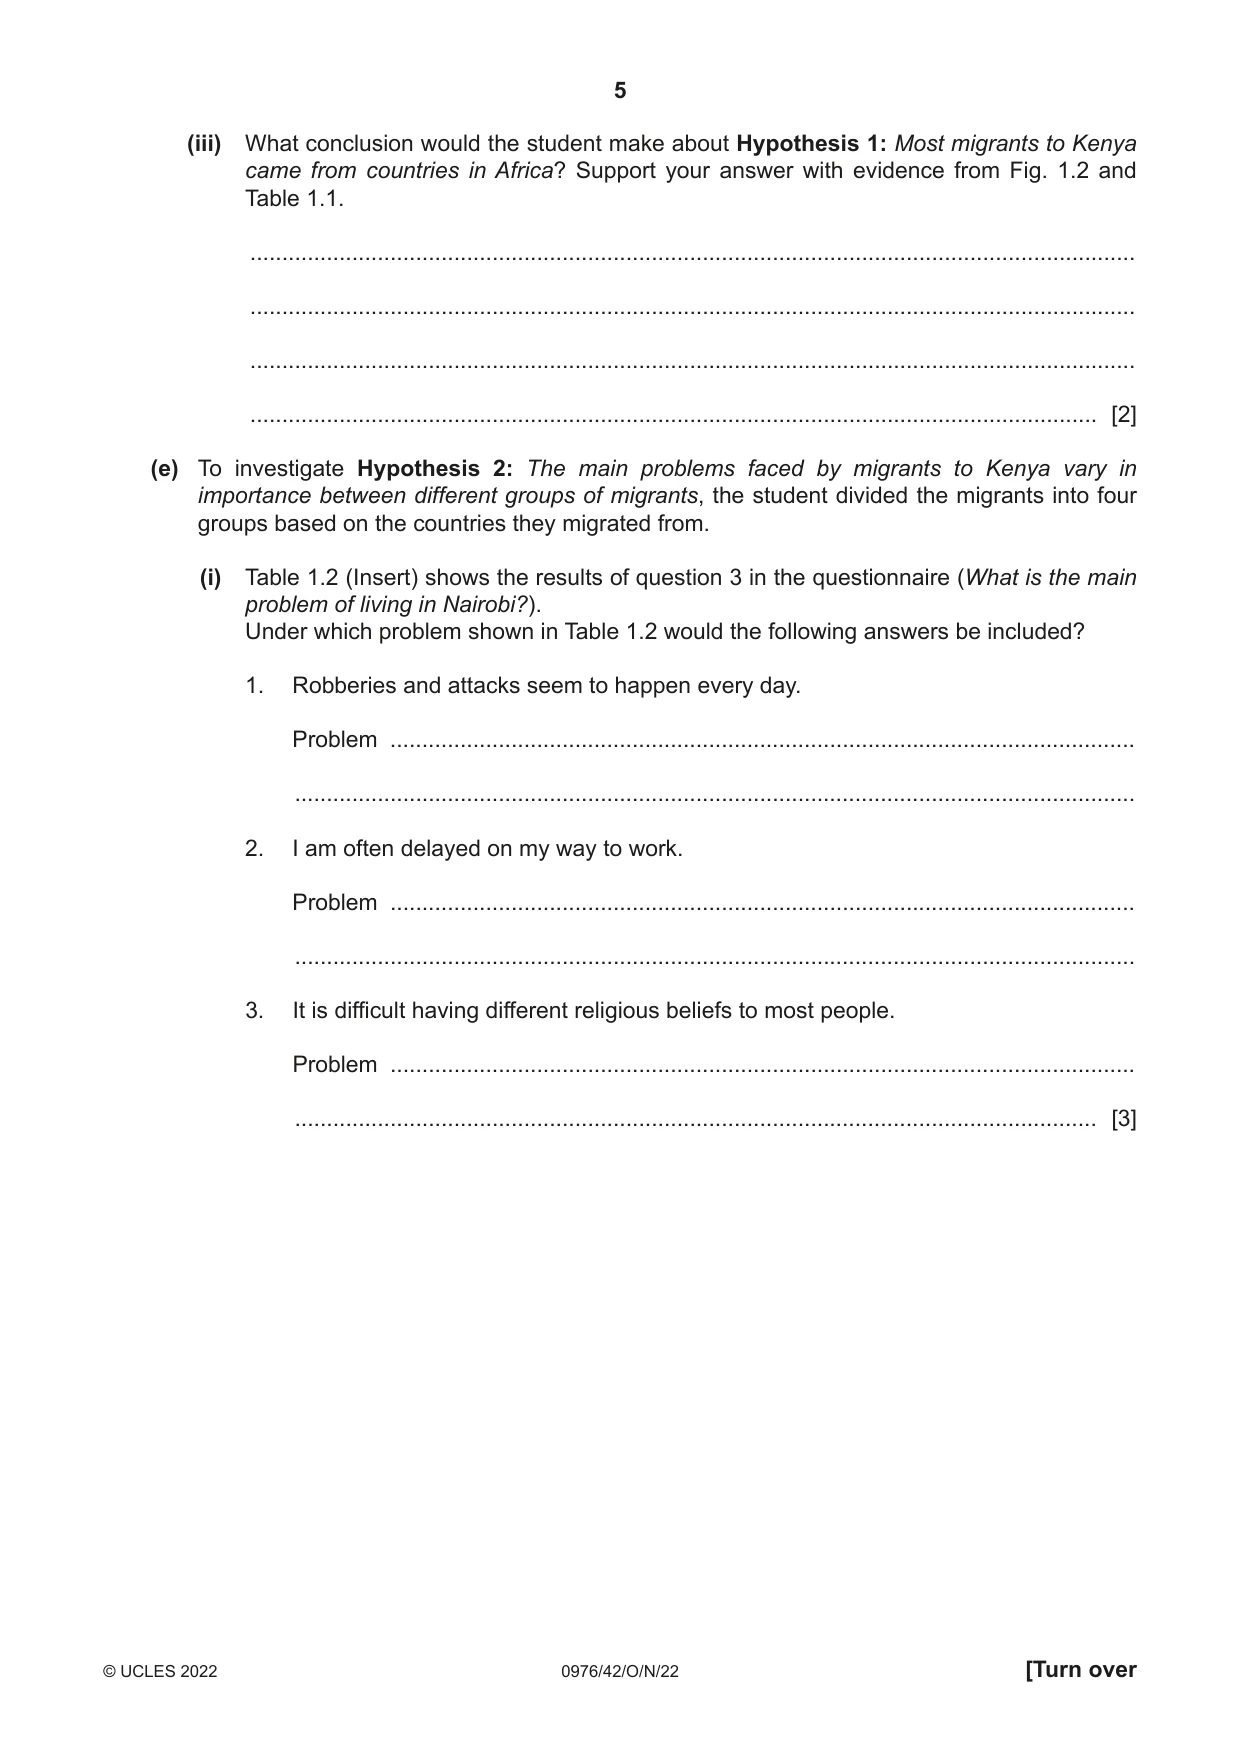
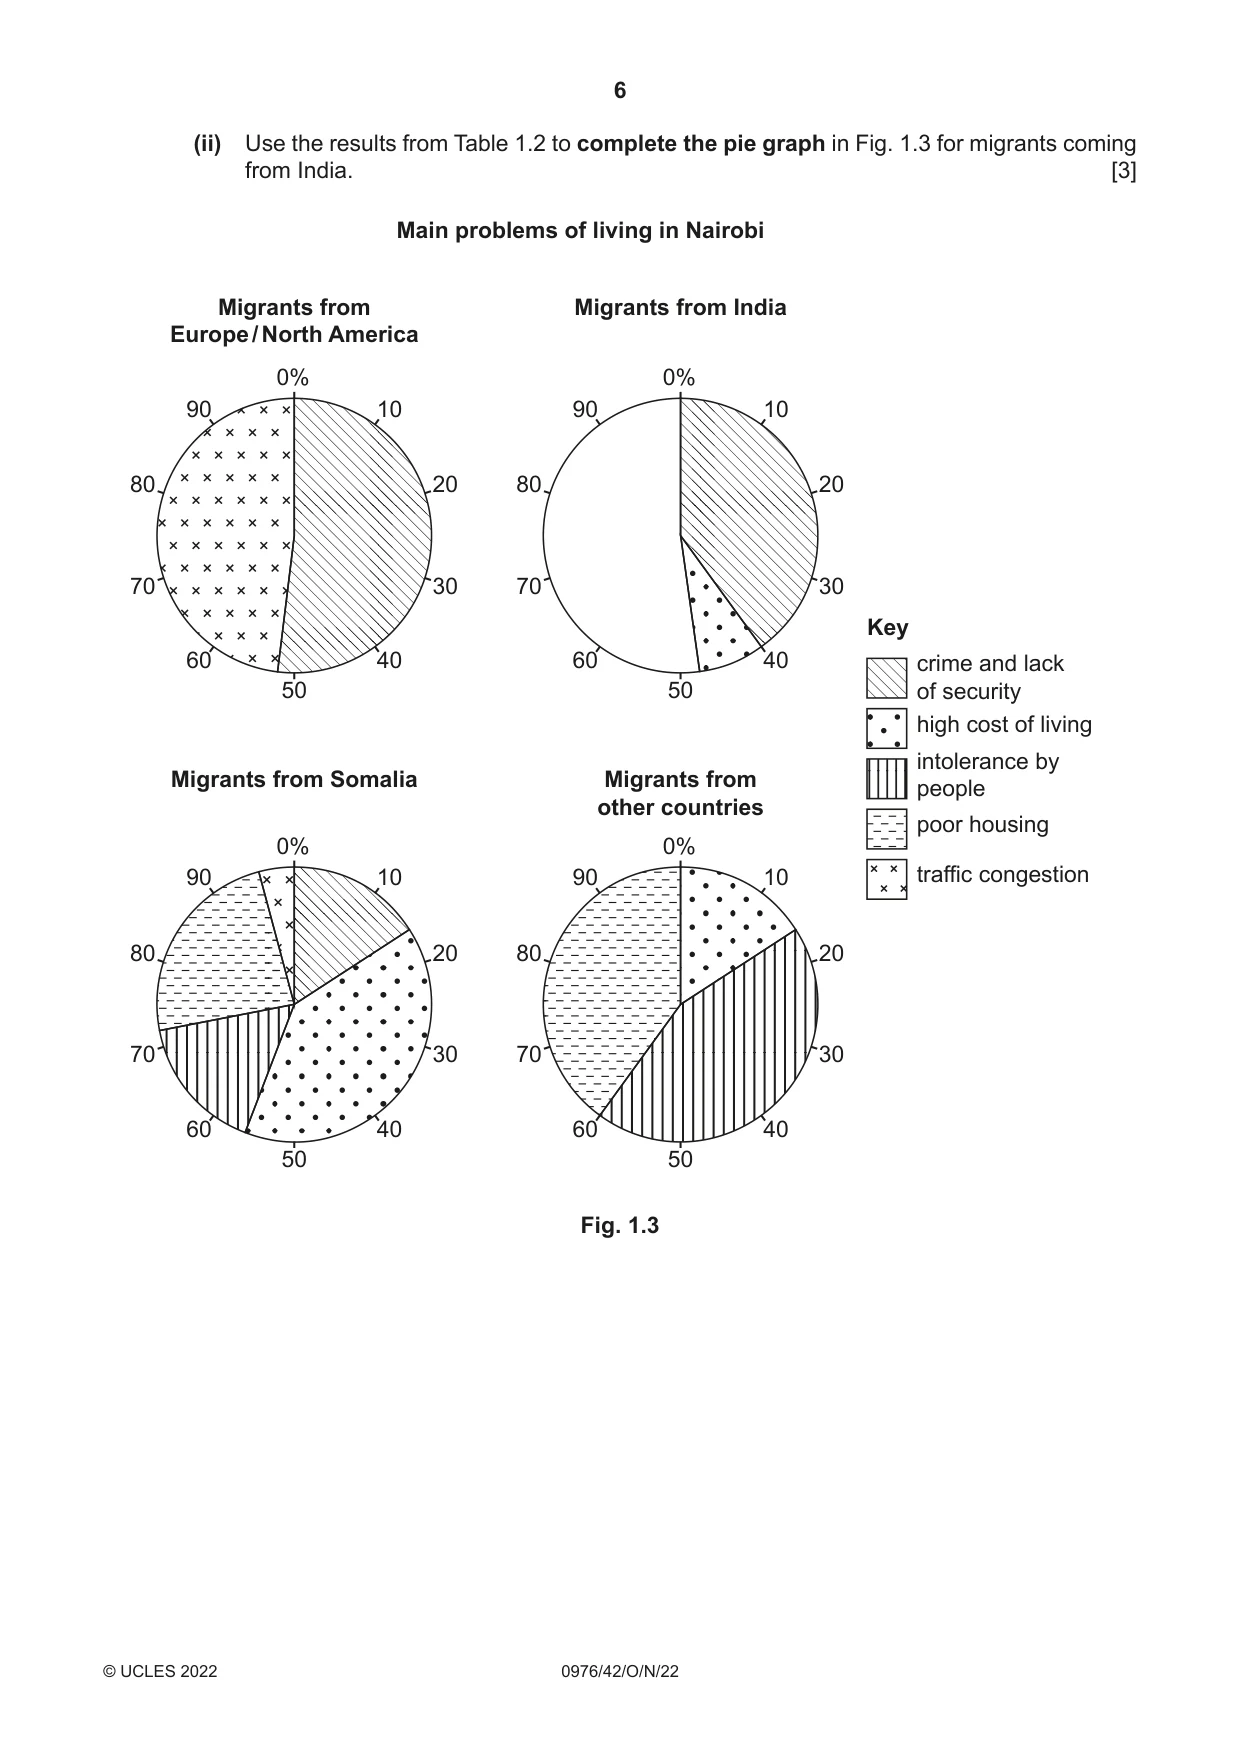
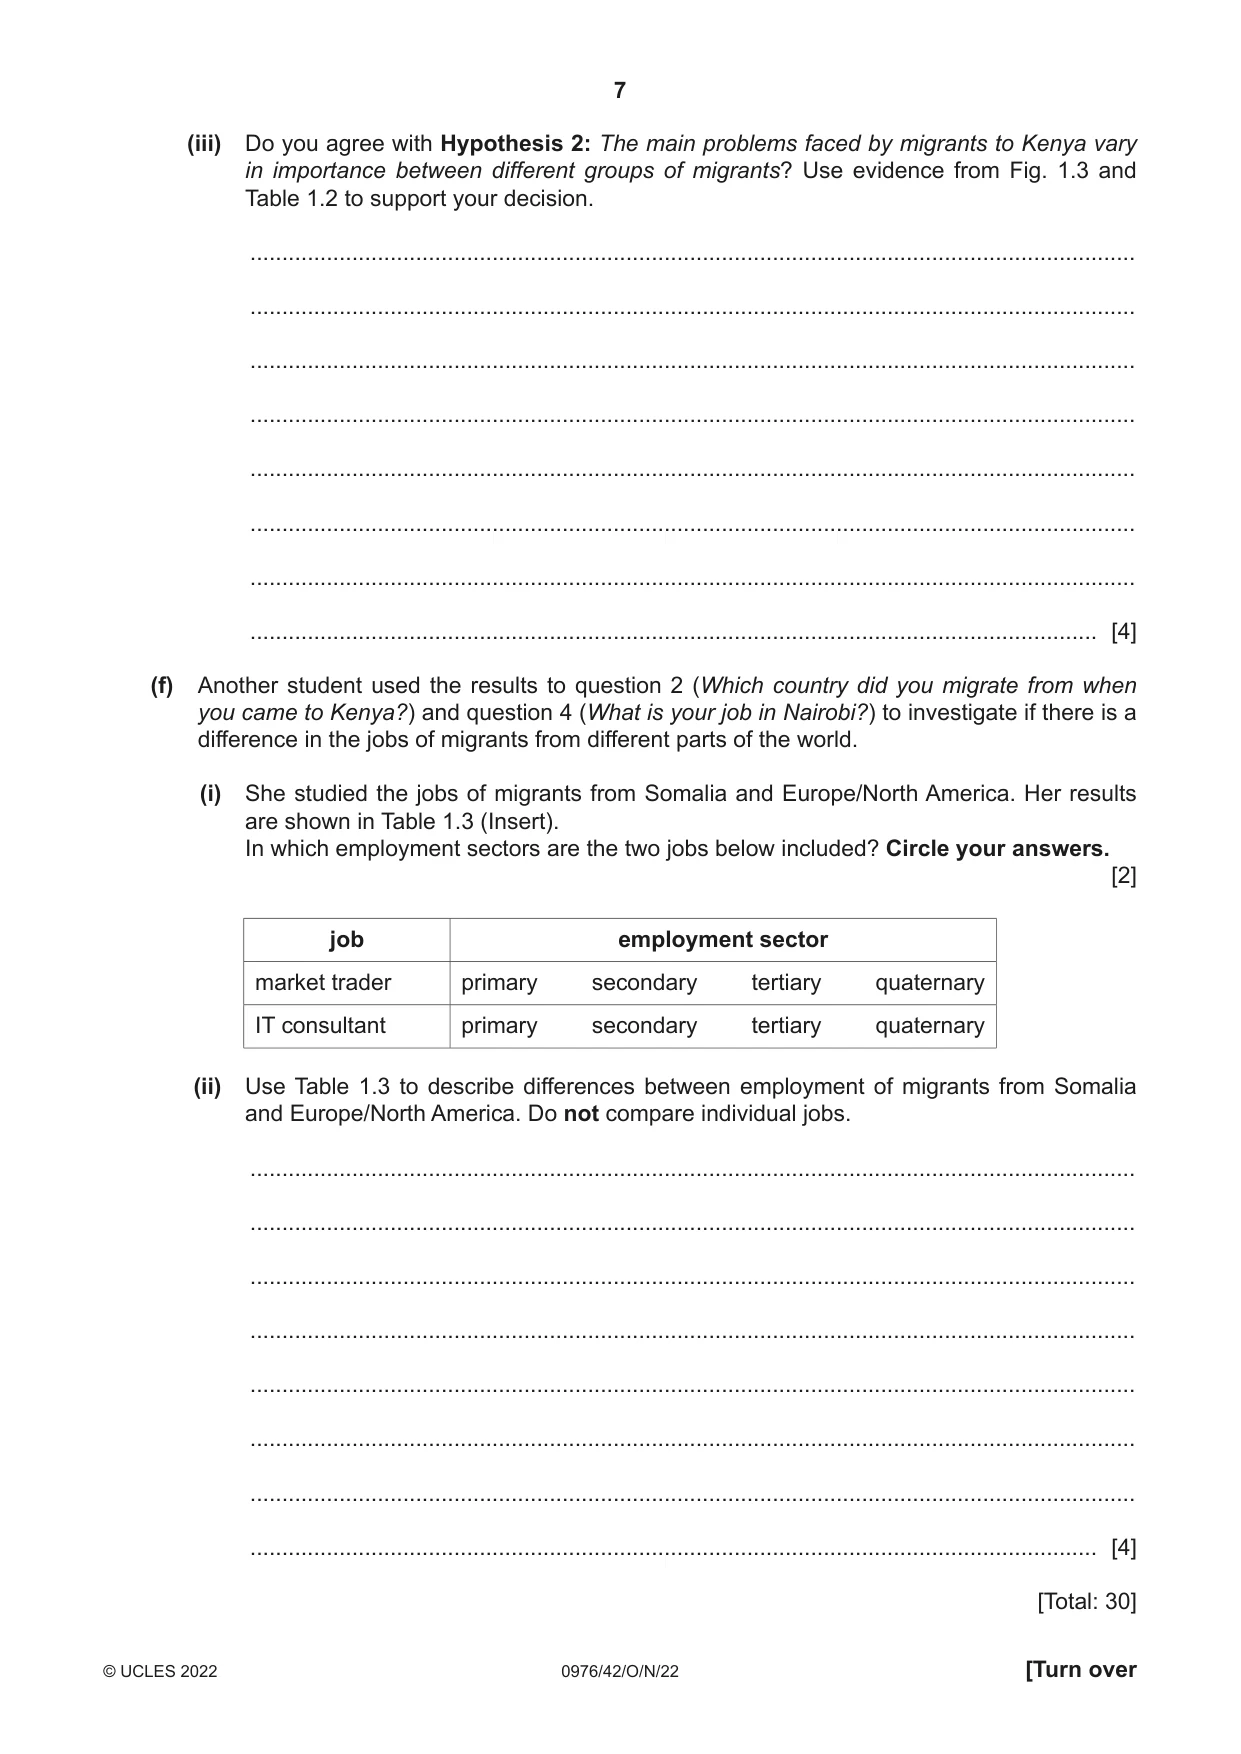
1 Students in Nairobi, the capital city of Kenya, Africa, were studying population migration. They did a fieldwork investigation about international migration into their country. (a) (i) Define international migration. ........................................................................................................................................... ..................................................................................................................................... [1] (ii) The students wanted to find out about pull factors that affect migration. Explain what is meant by pull factors. ........................................................................................................................................... ..................................................................................................................................... [1] (b) The students did a questionnaire survey with 100 migrants to Kenya. (i) The students used a sampling method where they asked every tenth person who walked past them to complete their questionnaire. What is this method of sampling called? ..................................................................................................................................... [1] (ii) The students realised that not every person they selected would answer their questionnaire. Suggest three reasons why this might happen. 1 ........................................................................................................................................ ........................................................................................................................................... 2 ........................................................................................................................................ ........................................................................................................................................... 3 ........................................................................................................................................ ..................................................................................................................................... [3] (c) The students’ questionnaire is shown in Fig. 1.1 (Insert). Suggest two answers migrants gave to question 1 in the questionnaire (Why did you migrate to Kenya?). 1 ................................................................................................................................................ ................................................................................................................................................... 2 ................................................................................................................................................ ............................................................................................................................................. [2] The students decided to investigate different hypotheses using their questionnaire. One student chose to test the following hypotheses: Hypothesis 1: Most migrants to Kenya came from countries in Africa. Hypothesis 2: The main problems faced by migrants to Kenya vary in importance between different groups of migrants. (d) The answers to question 2 in the questionnaire (Which country did you migrate from when you came to Kenya?) are shown in Table 1.1 (Insert). (i) Use the results to plot the number of people migrating from Ethiopia and India in Fig. 1.2. [2] Countries which migrants to Kenya came from SwedenSweden Canada D A SpainSpain USA MoroccoMorocco T China SudanSudan IndiaIndia S.S. SudanSudan EthiopiaEthiopia Somalia K Tanzania Key to countries Scale 1–3 A = Austria 5–8 D = Denmark 25 K = Kenya number of migrants T = Tunisia Fig. 1.2 (ii) Why is the flow line map an appropriate method to show the results to question 2 in the questionnaire? ........................................................................................................................................... ........................................................................................................................................... ........................................................................................................................................... ..................................................................................................................................... [2] (iii) What conclusion would the student make about Hypothesis 1: Most migrants to Kenya came from countries in Africa? Support your answer with evidence from Fig. 1.2 and Table 1.1. ........................................................................................................................................... ........................................................................................................................................... ........................................................................................................................................... ..................................................................................................................................... [2] (e) To investigate Hypothesis 2: The main problems faced by migrants to Kenya vary in importance between different groups of migrants, the student divided the migrants into four groups based on the countries they migrated from. (i) Table 1.2 (Insert) shows the results of question 3 in the questionnaire (What is the main problem of living in Nairobi?). Under which problem shown in Table 1.2 would the following answers be included? 1. Robberies and attacks seem to happen every day. Problem ..................................................................................................................... .................................................................................................................................... 2. I am often delayed on my way to work. Problem ..................................................................................................................... .................................................................................................................................... 3. It is difficult having different religious beliefs to most people. Problem ..................................................................................................................... .............................................................................................................................. [3] (ii) Use the results from Table 1.2 to complete the pie graph in Fig. 1.3 for migrants coming from India. [3] Main problems of living in Nairobi Migrants from Migrants from India Europe / North America 0% 0% 90 10 90 10 80 20 80 20 70 30 70 30 Key 60 40 60 40 crime and lack 50 50 of security high cost of living intolerance by Migrants from Somalia Migrants from people other countries poor housing 0% 0% 90 10 90 10 traffic congestion 80 20 80 20 70 30 70 30 60 40 60 40 50 50 Fig. 1.3 (iii) Do you agree with Hypothesis 2: The main problems faced by migrants to Kenya vary in importance between different groups of migrants? Use evidence from Fig. 1.3 and Table 1.2 to support your decision. ........................................................................................................................................... ........................................................................................................................................... ........................................................................................................................................... ........................................................................................................................................... ........................................................................................................................................... ........................................................................................................................................... ........................................................................................................................................... ..................................................................................................................................... [4] (f) Another student used the results to question 2 (Which country did you migrate from when you came to Kenya?) and question 4 (What is your job in Nairobi?) to investigate if there is a difference in the jobs of migrants from different parts of the world. (i) She studied the jobs of migrants from Somalia and Europe/North America. Her results are shown in Table 1.3 (Insert). In which employment sectors are the two jobs below included? Circle your answers. [2] job employment sector market trader primary secondary tertiary quaternary IT consultant primary secondary tertiary quaternary (ii) Use Table 1.3 to describe differences between employment of migrants from Somalia and Europe/North America. Do not compare individual jobs. ........................................................................................................................................... ........................................................................................................................................... ........................................................................................................................................... ........................................................................................................................................... ........................................................................................................................................... ........................................................................................................................................... ........................................................................................................................................... ..................................................................................................................................... [4] [Total: 30]
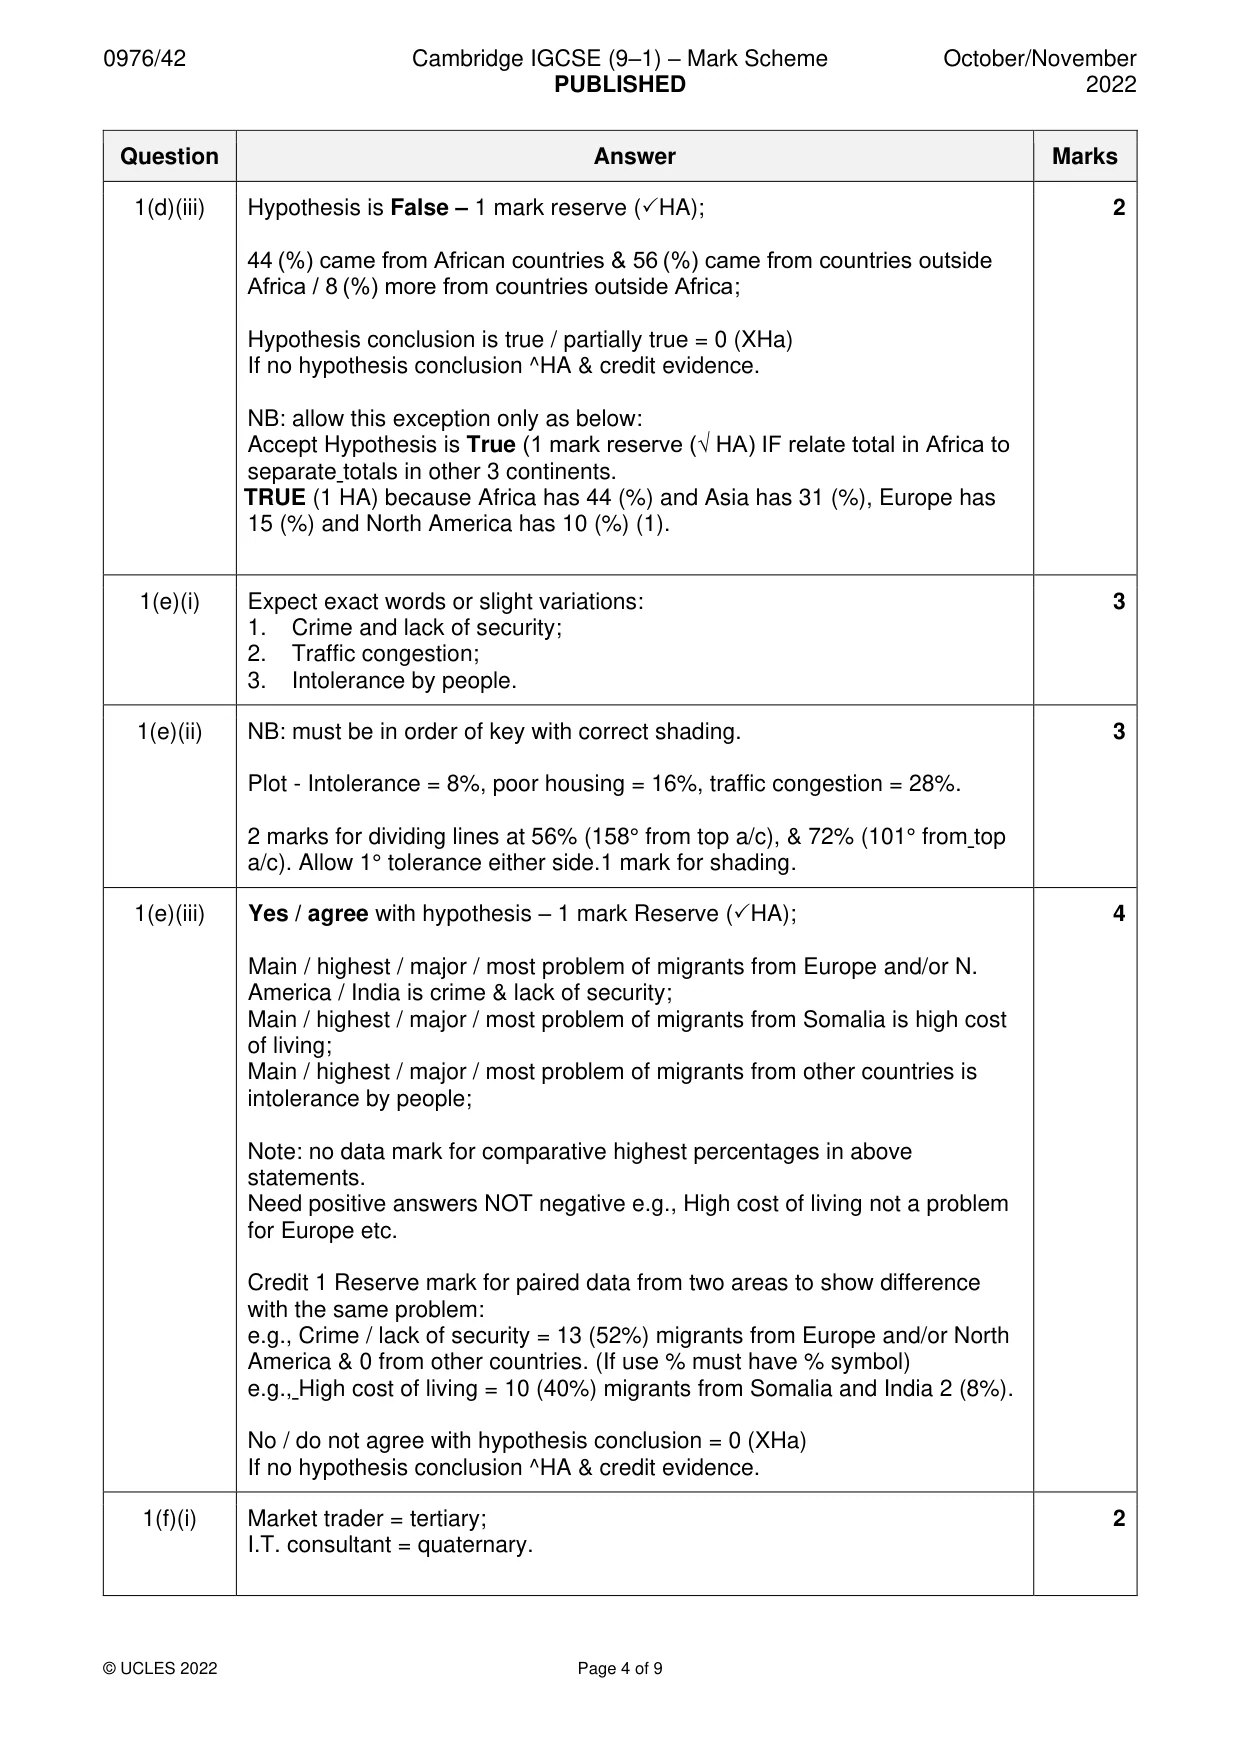
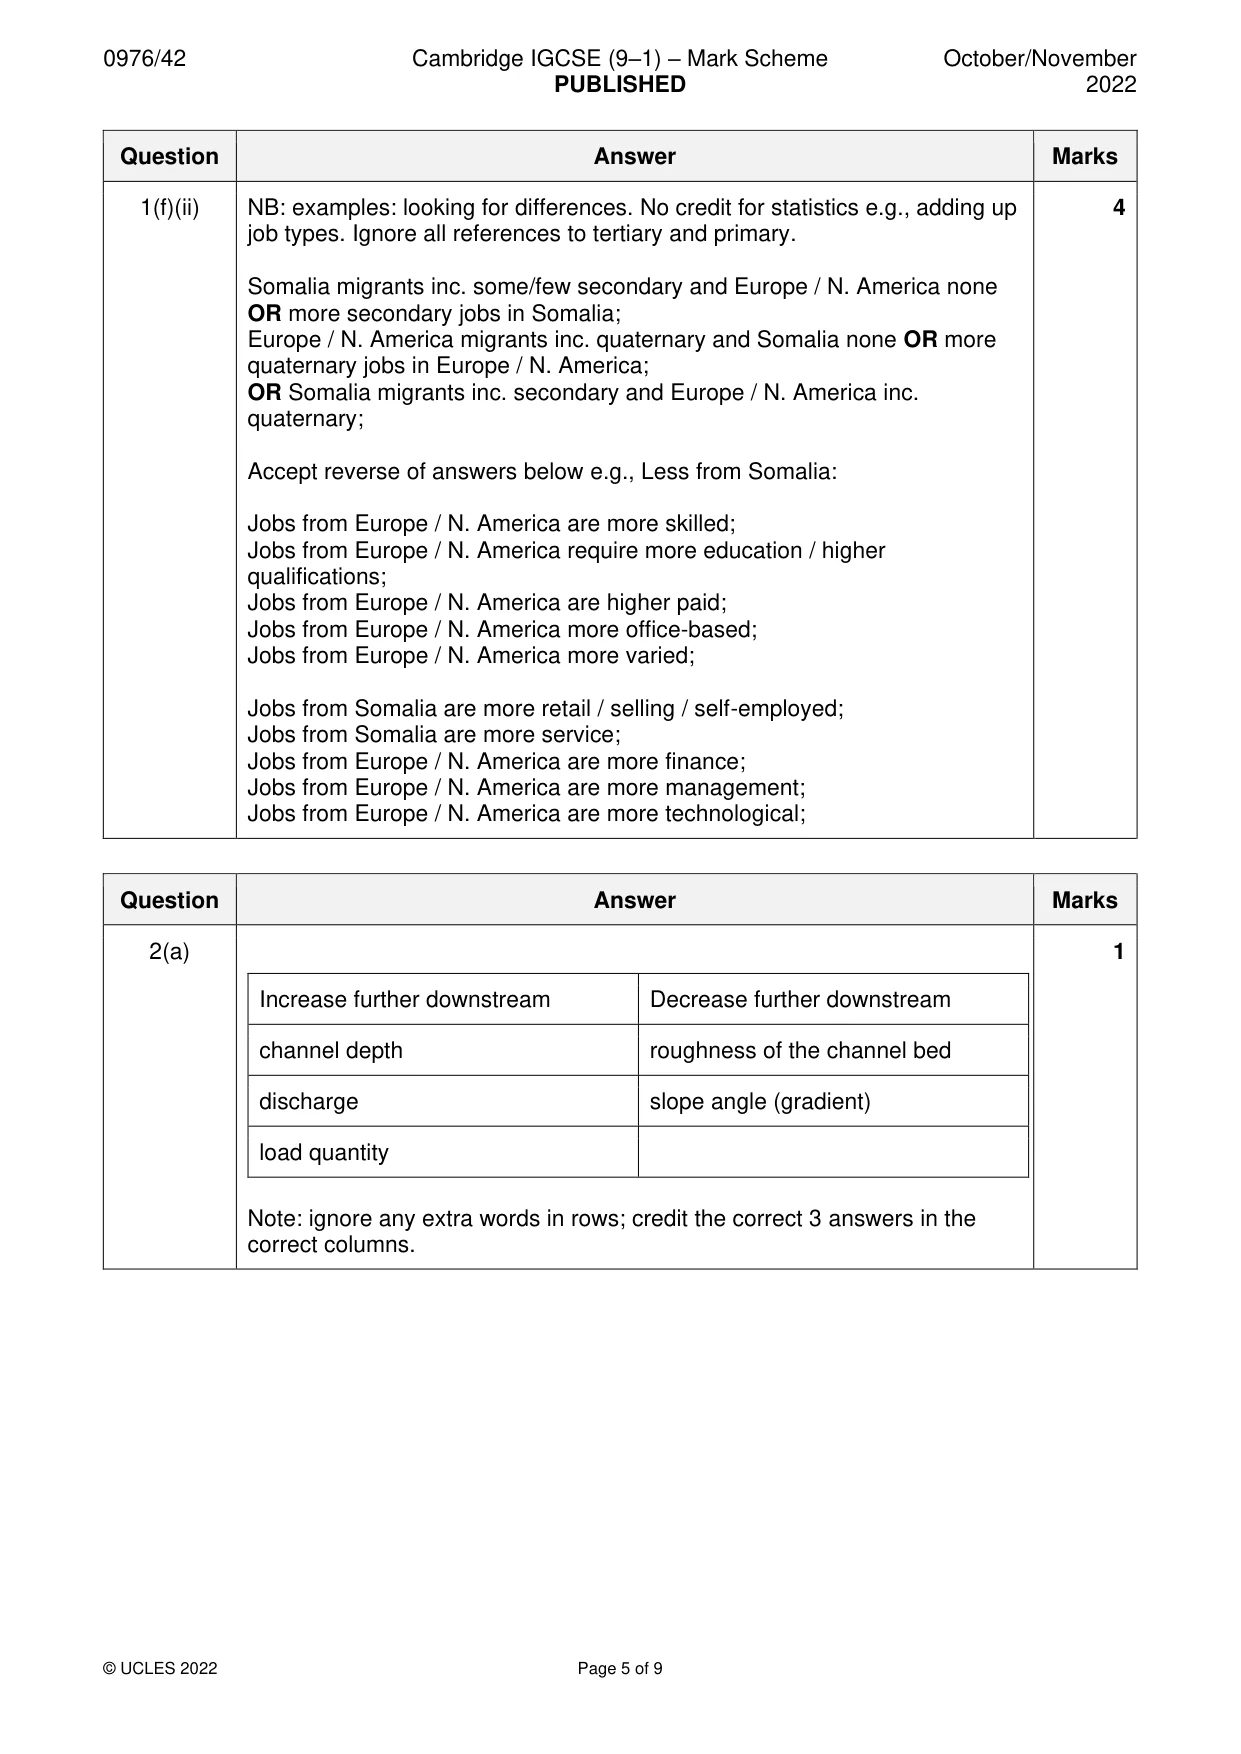
Mark scheme: Question Answer Marks 1(a)(i) Moving from one country to another / across country boundary / moving to 1 or into another country / moving between countries / across borders. 1(a)(ii) Attract (to/into) / encourage / draw people to an area / country. 1 1(b)(i) Systematic 1 1(b)(ii) They were born in Kenya / not a migrant / may be tourist / visitor; 3 They were in a hurry / no time / refused to answer / take too long / busy / don’t want to / not interested / on the phone; Don’t speak the same language / English as the student; Don’t understand the questionnaire / can’t read or write / illiterate; A child may be selected / not old enough / too young; Concerned about information being reported to authorities/privacy of the individual / may be illegal migrant / use for scams / makes them uncomfortable / sceptical re trust / too sensitive / personal; 1(c) Job / higher wages; 2 Low cost of living / better quality of life / better standard of living; Education opportunities; Improved / better healthcare / sanitation / water supply; Family live in Kenya / marriage; Escape from war / persecution / find peace / safety / no war / practise beliefs safely / economic crisis / political tensions; Weather / climate (specific) e.g., drought; It’s the closest country; NB: examples: can be push or pull but do not double credit. 1(d)(i) 3 migrants from Ethiopia – thinnest line; 2 25 migrants from India – thickest line; Arrows must start in Ethiopia and India, be in the right direction and have an arrow at the right end. 1(d)(ii) Examples: 2 Shows by arrows where / the countries migrants came from / to / direction of movement; Shows by width of arrow / scale number of people; OR Shows / can see where from / direction OR number (MAX 1). 1(d)(iii) Hypothesis is False – 1 mark reserve (HA); 2 44 (%) came from African countries & 56 (%) came from countries outside Africa / 8 (%) more from countries outside Africa; Hypothesis conclusion is true / partially true = 0 (XHa) If no hypothesis conclusion ^HA & credit evidence. NB: allow this exception only as below: Accept Hypothesis is True (1 mark reserve (√ HA) IF relate total in Africa to separate totals in other 3 continents. TRUE (1 HA) because Africa has 44 (%) and Asia has 31 (%), Europe has 15 (%) and North America has 10 (%) (1). 1(e)(i) Expect exact words or slight variations: 3 1. Crime and lack of security; 2. Traffic congestion; 3. Intolerance by people. 1(e)(ii) NB: must be in order of key with correct shading. 3 Plot - Intolerance = 8%, poor housing = 16%, traffic congestion = 28%. 2 marks for dividing lines at 56% (158° from top a/c), & 72% (101° from top a/c). Allow 1° tolerance either side.1 mark for shading. 1(e)(iii) Yes / agree with hypothesis – 1 mark Reserve (HA); 4 Main / highest / major / most problem of migrants from Europe and/or N. America / India is crime & lack of security; Main / highest / major / most problem of migrants from Somalia is high cost of living; Main / highest / major / most problem of migrants from other countries is intolerance by people; Note: no data mark for comparative highest percentages in above statements. Need positive answers NOT negative e.g., High cost of living not a problem for Europe etc. Credit 1 Reserve mark for paired data from two areas to show difference with the same problem: e.g., Crime / lack of security = 13 (52%) migrants from Europe and/or North America & 0 from other countries. (If use % must have % symbol) e.g., High cost of living = 10 (40%) migrants from Somalia and India 2 (8%). No / do not agree with hypothesis conclusion = 0 (XHa) If no hypothesis conclusion ^HA & credit evidence. 1(f)(i) Market trader = tertiary; 2 I.T. consultant = quaternary. 1(f)(ii) NB: examples: looking for differences. No credit for statistics e.g., adding up 4 job types. Ignore all references to tertiary and primary. Somalia migrants inc. some/few secondary and Europe / N. America none OR more secondary jobs in Somalia; Europe / N. America migrants inc. quaternary and Somalia none OR more quaternary jobs in Europe / N. America; OR Somalia migrants inc. secondary and Europe / N. America inc. quaternary; Accept reverse of answers below e.g., Less from Somalia: Jobs from Europe / N. America are more skilled; Jobs from Europe / N. America require more education / higher qualifications; Jobs from Europe / N. America are higher paid; Jobs from Europe / N. America more office-based; Jobs from Europe / N. America more varied; Jobs from Somalia are more retail / selling / self-employed; Jobs from Somalia are more service; Jobs from Europe / N. America are more finance; Jobs from Europe / N. America are more management; Jobs from Europe / N. America are more technological;
Q2 · A class of students in South Africa studied the Bradshaw model
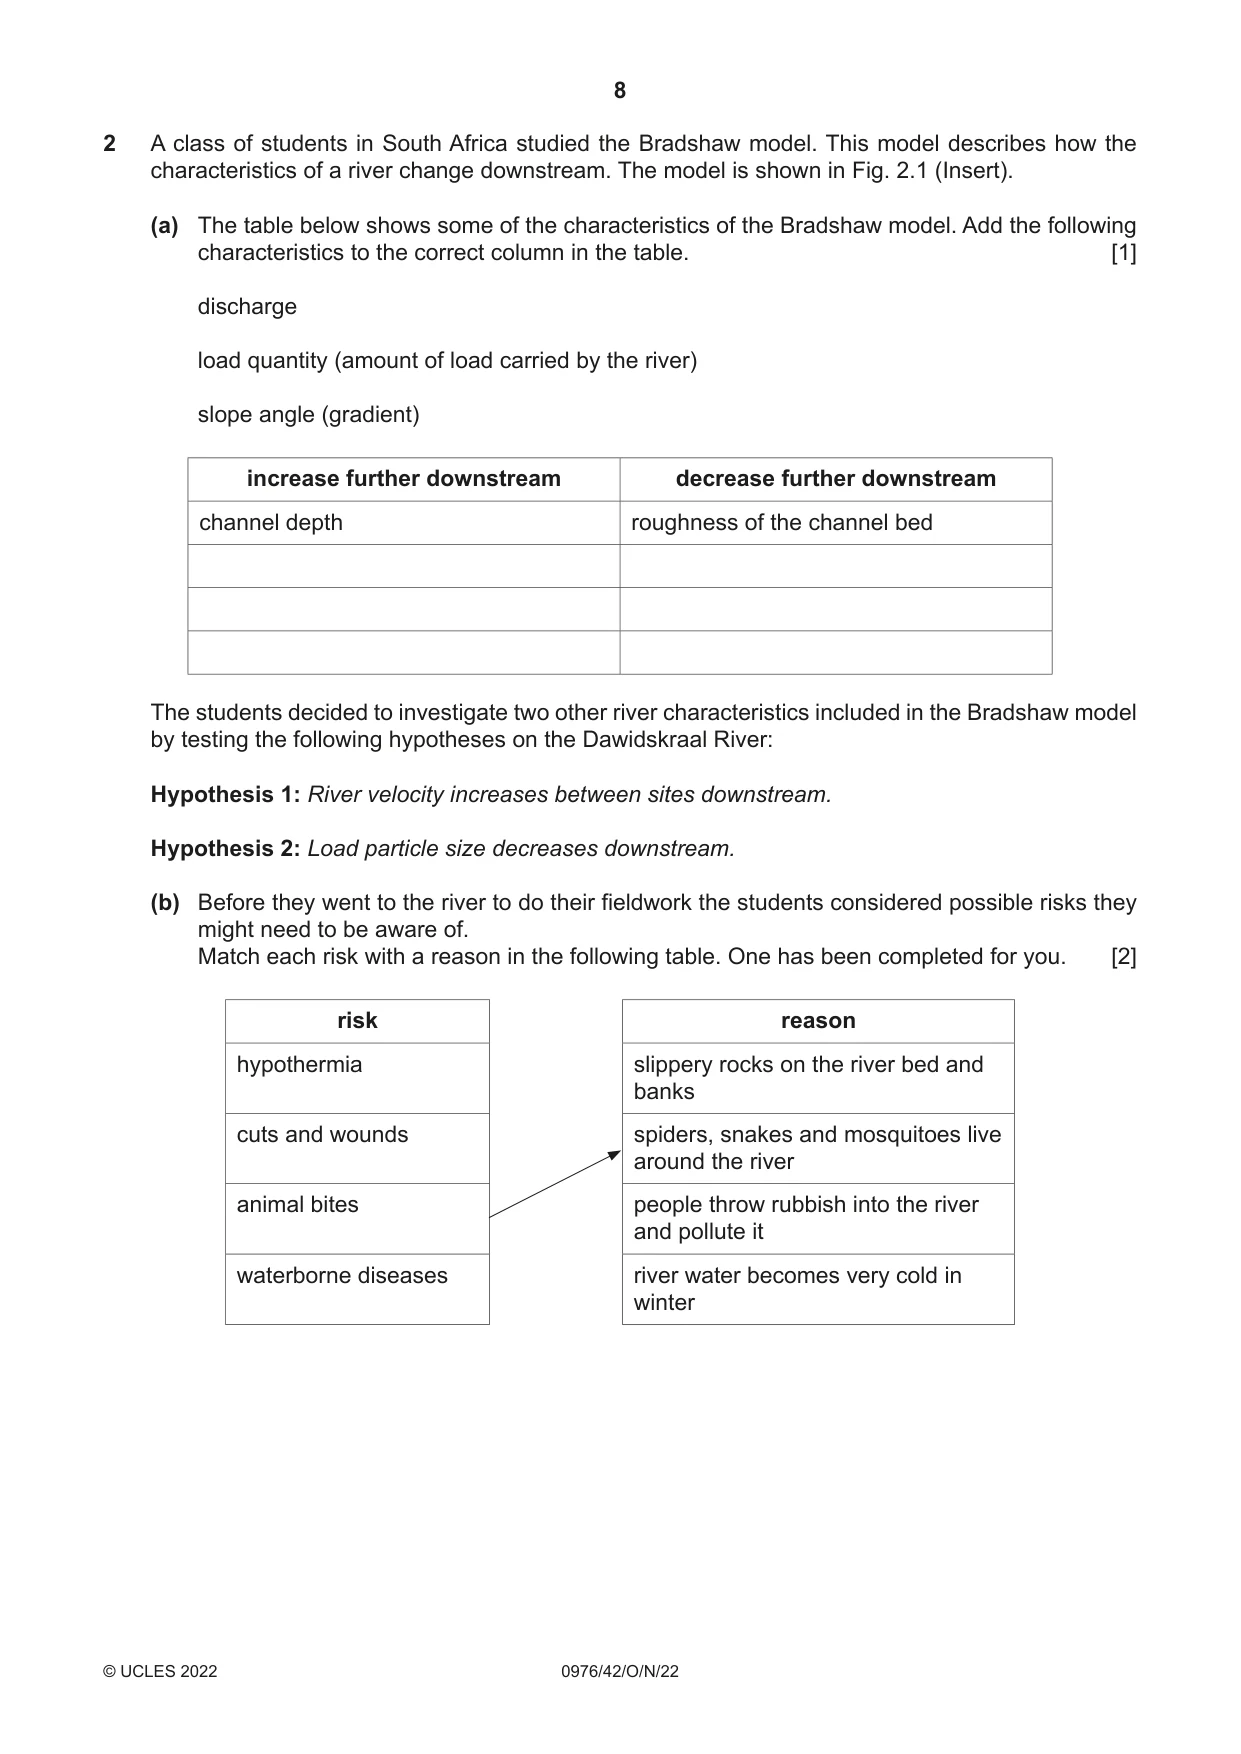
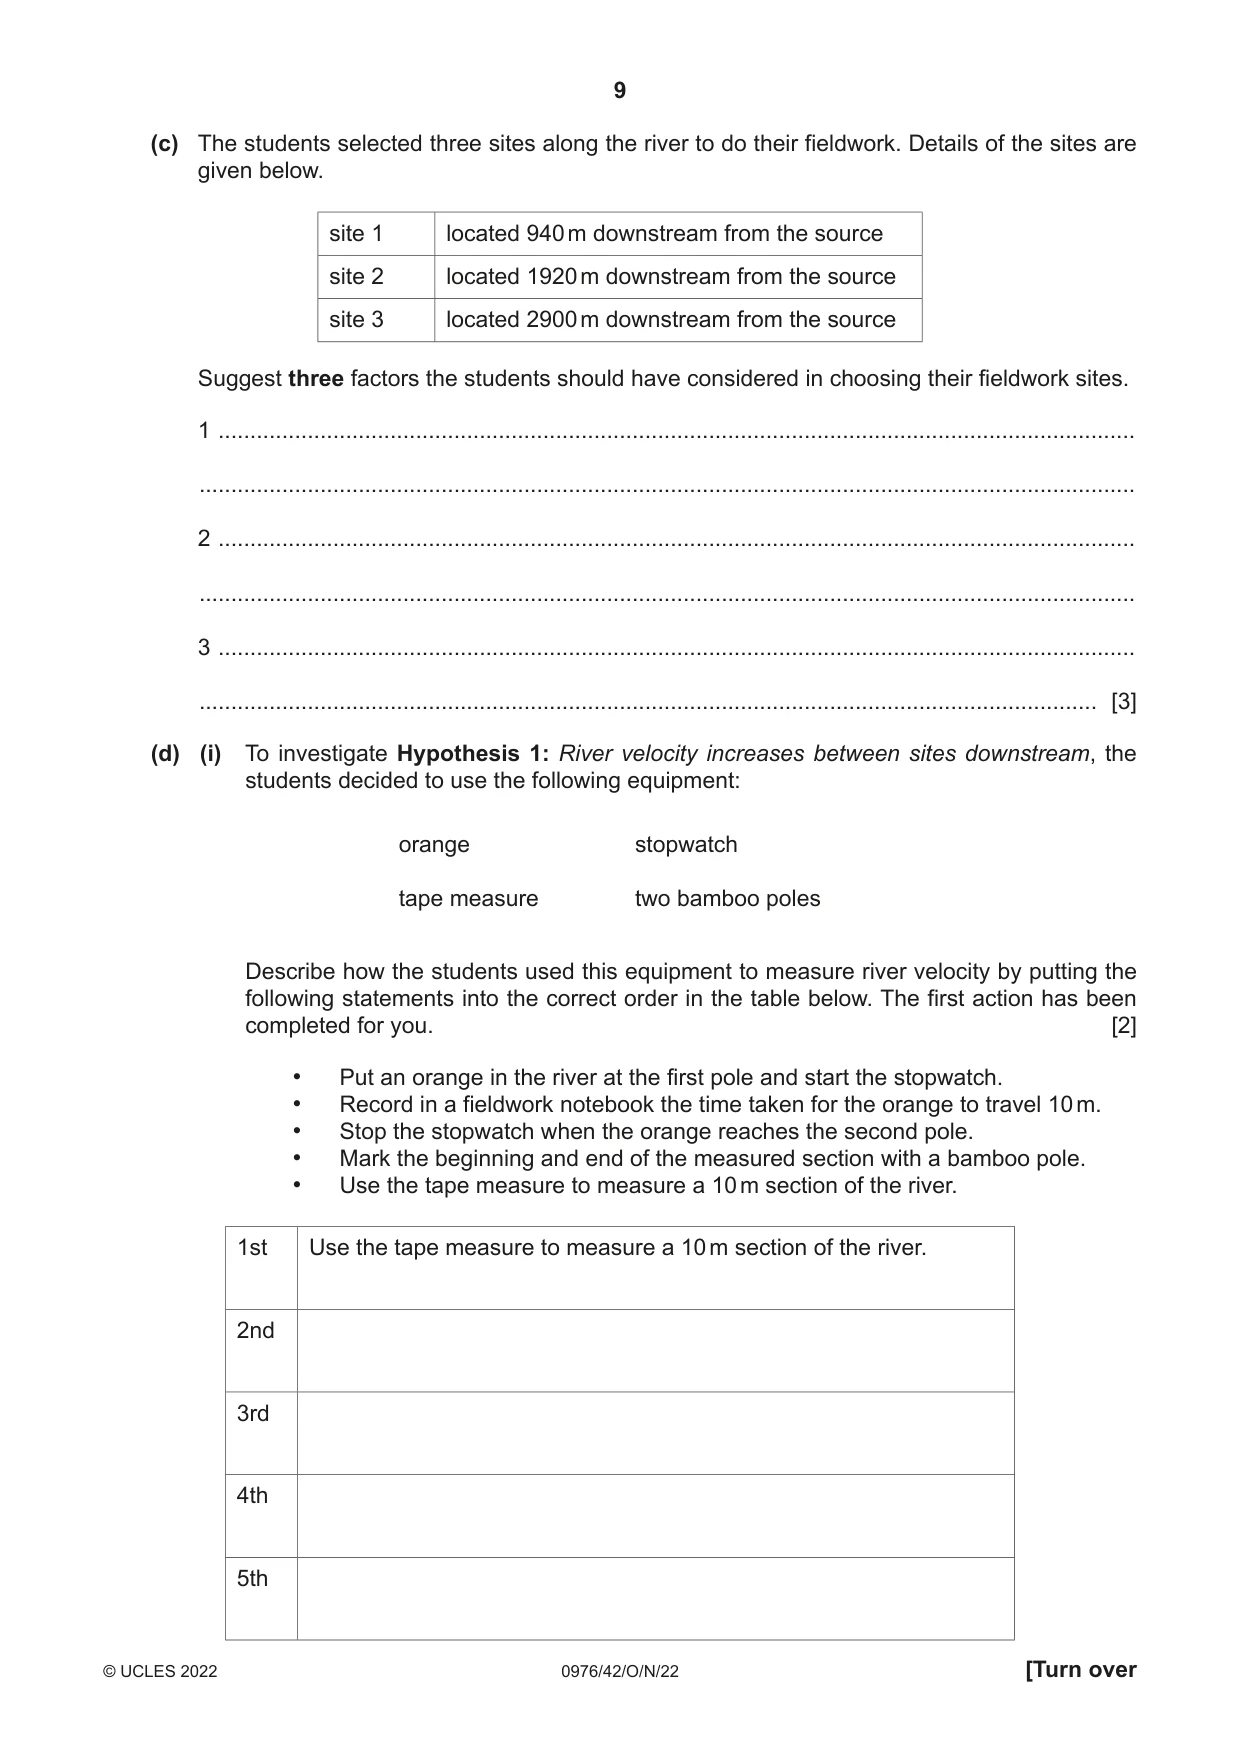
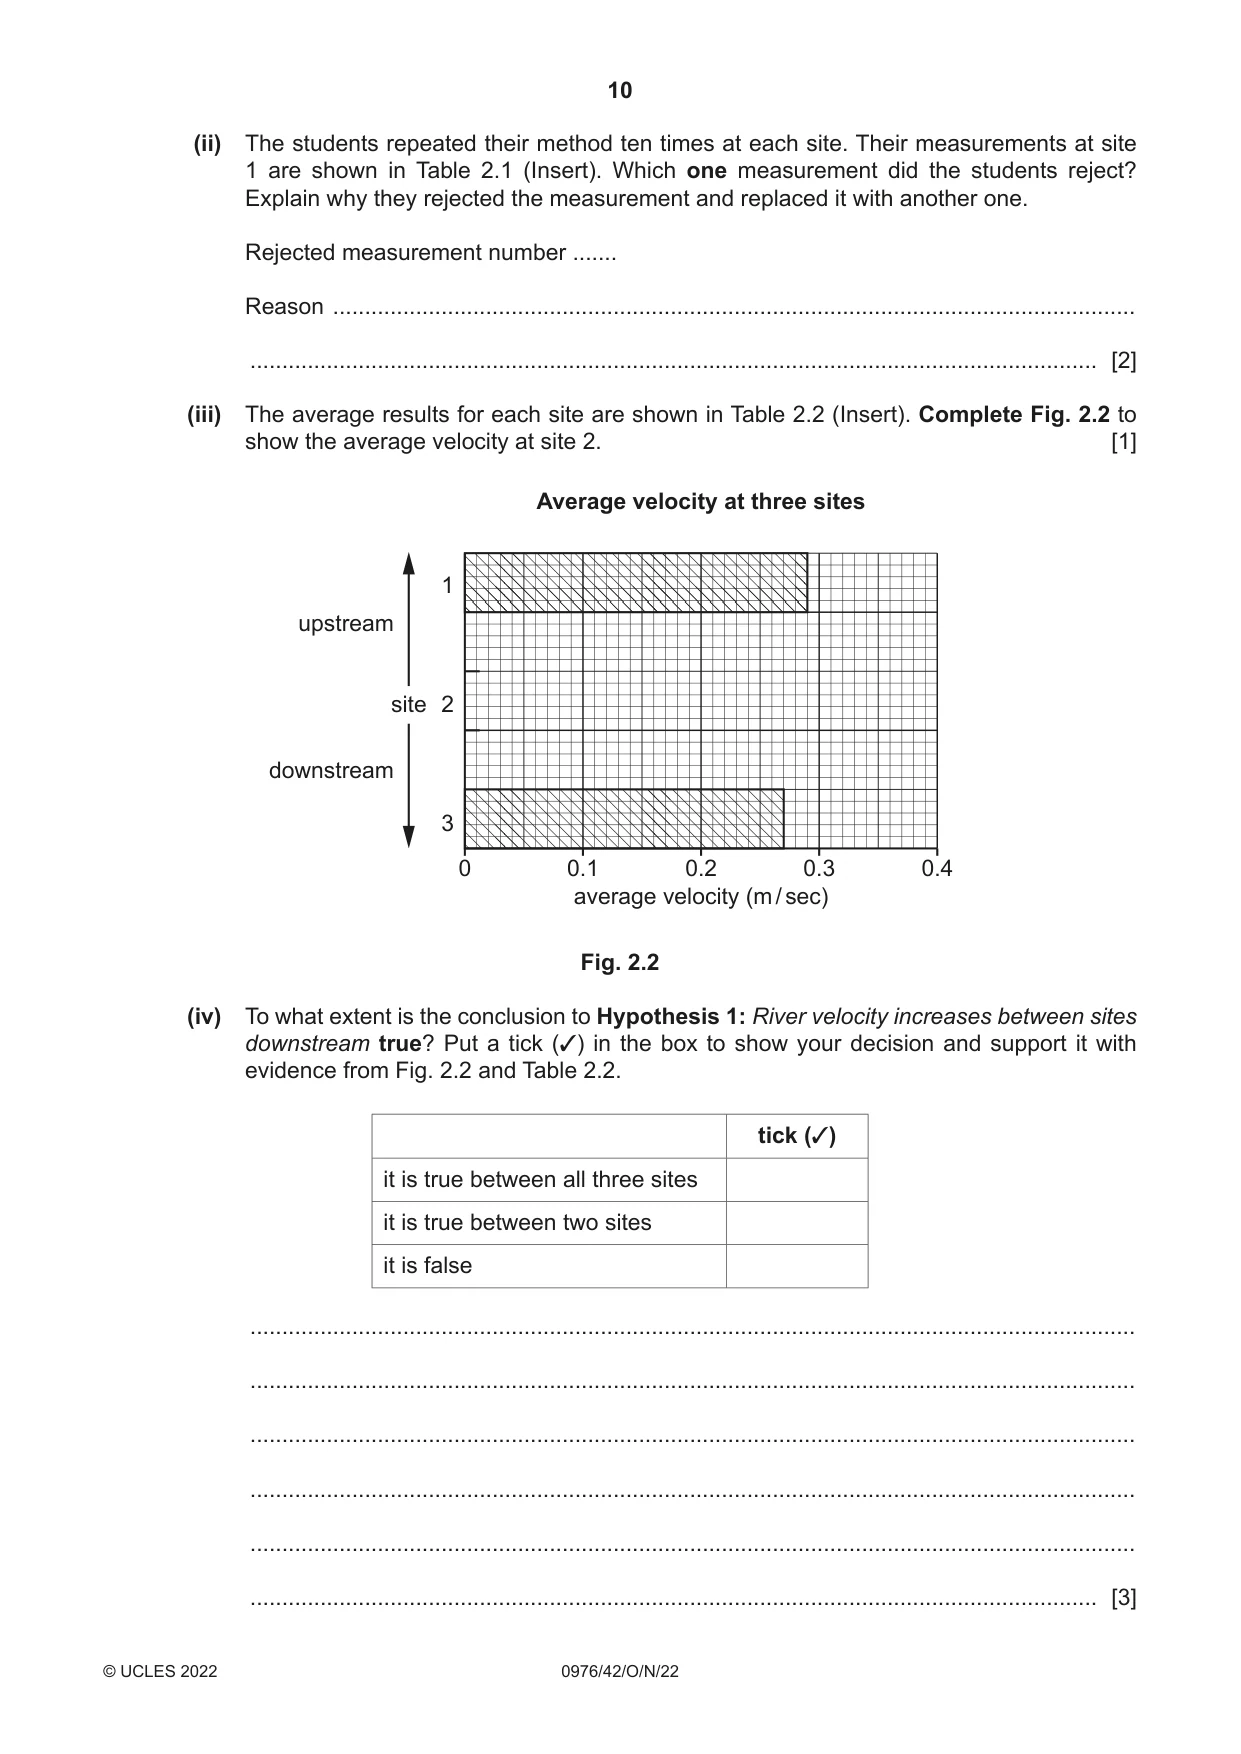
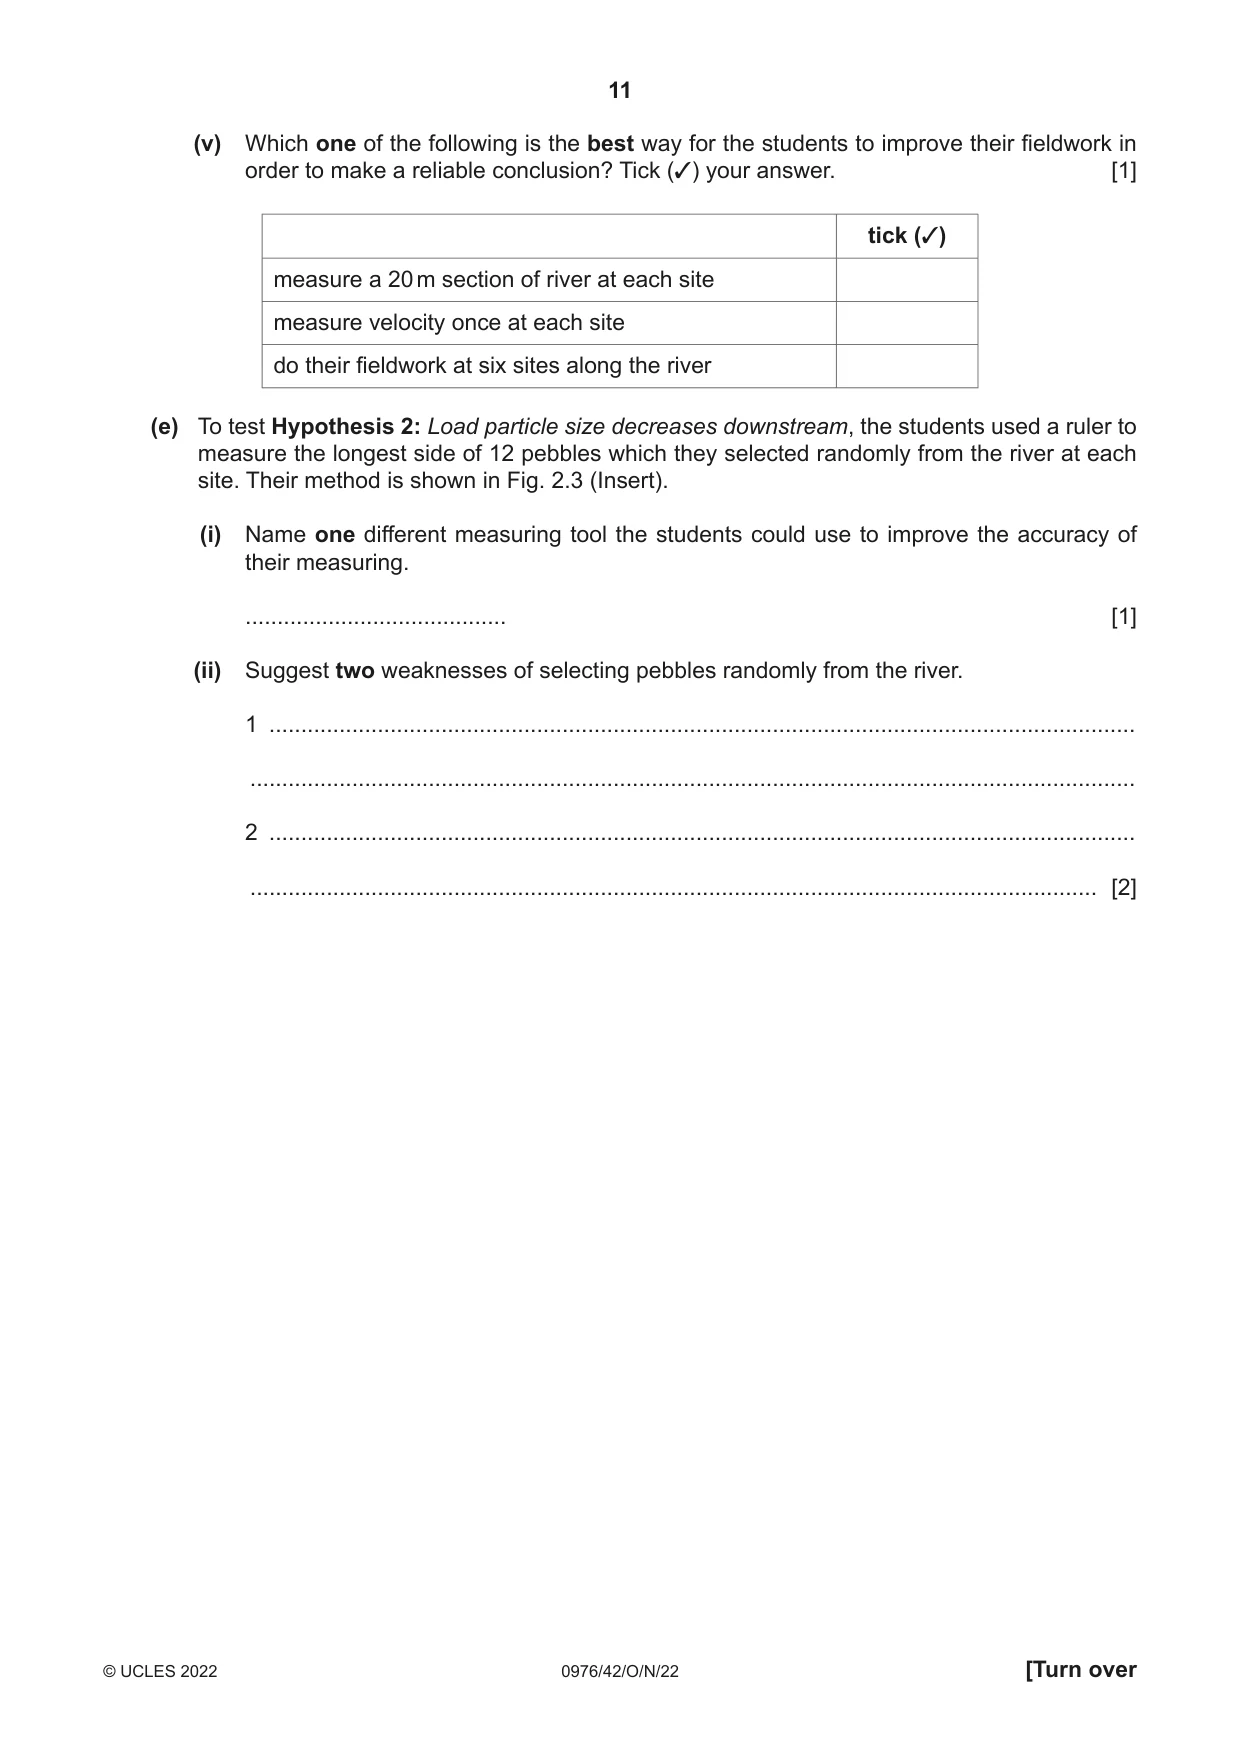
2 A class of students in South Africa studied the Bradshaw model. This model describes how the characteristics of a river change downstream. The model is shown in Fig. 2.1 (Insert). (a) The table below shows some of the characteristics of the Bradshaw model. Add the following characteristics to the correct column in the table. [1] discharge load quantity (amount of load carried by the river) slope angle (gradient) increase further downstream decrease further downstream channel depth roughness of the channel bed The students decided to investigate two other river characteristics included in the Bradshaw model by testing the following hypotheses on the Dawidskraal River: Hypothesis 1: River velocity increases between sites downstream. Hypothesis 2: Load particle size decreases downstream. (b) Before they went to the river to do their fieldwork the students considered possible risks they might need to be aware of. Match each risk with a reason in the following table. One has been completed for you. [2] risk reason hypothermia slippery rocks on the river bed and banks cuts and wounds spiders, snakes and mosquitoes live around the river animal bites people throw rubbish into the river and pollute it waterborne diseases river water becomes very cold in winter (c) The students selected three sites along the river to do their fieldwork. Details of the sites are given below. site 1 located 940 m downstream from the source site 2 located 1920 m downstream from the source site 3 located 2900 m downstream from the source Suggest three factors the students should have considered in choosing their fieldwork sites. 1 ................................................................................................................................................ ................................................................................................................................................... 2 ................................................................................................................................................ ................................................................................................................................................... 3 ................................................................................................................................................ ............................................................................................................................................. [3] (d) (i) To investigate Hypothesis 1: River velocity increases between sites downstream, the students decided to use the following equipment: orange stopwatch tape measure two bamboo poles Describe how the students used this equipment to measure river velocity by putting the following statements into the correct order in the table below. The first action has been completed for you. [2] • Put an orange in the river at the first pole and start the stopwatch. • Record in a fieldwork notebook the time taken for the orange to travel 10 m. • Stop the stopwatch when the orange reaches the second pole. • Mark the beginning and end of the measured section with a bamboo pole. • Use the tape measure to measure a 10 m section of the river. 1st Use the tape measure to measure a 10 m section of the river. 2nd 3rd 4th 5th (ii) The students repeated their method ten times at each site. Their measurements at site 1 are shown in Table 2.1 (Insert). Which one measurement did the students reject? Explain why they rejected the measurement and replaced it with another one. Rejected measurement number ....... Reason .............................................................................................................................. ..................................................................................................................................... [2] (iii) The average results for each site are shown in Table 2.2 (Insert). Complete Fig. 2.2 to show the average velocity at site 2. [1] Average velocity at three sites 1 upstream site 2 downstream 3 0 0.1 0.2 0.3 0.4 average velocity (m / sec) Fig. 2.2 (iv) To what extent is the conclusion to Hypothesis 1: River velocity increases between sites downstream true? Put a tick (3) in the box to show your decision and support it with evidence from Fig. 2.2 and Table 2.2. tick (3) it is true between all three sites it is true between two sites it is false ........................................................................................................................................... ........................................................................................................................................... ........................................................................................................................................... ........................................................................................................................................... ........................................................................................................................................... ..................................................................................................................................... [3]
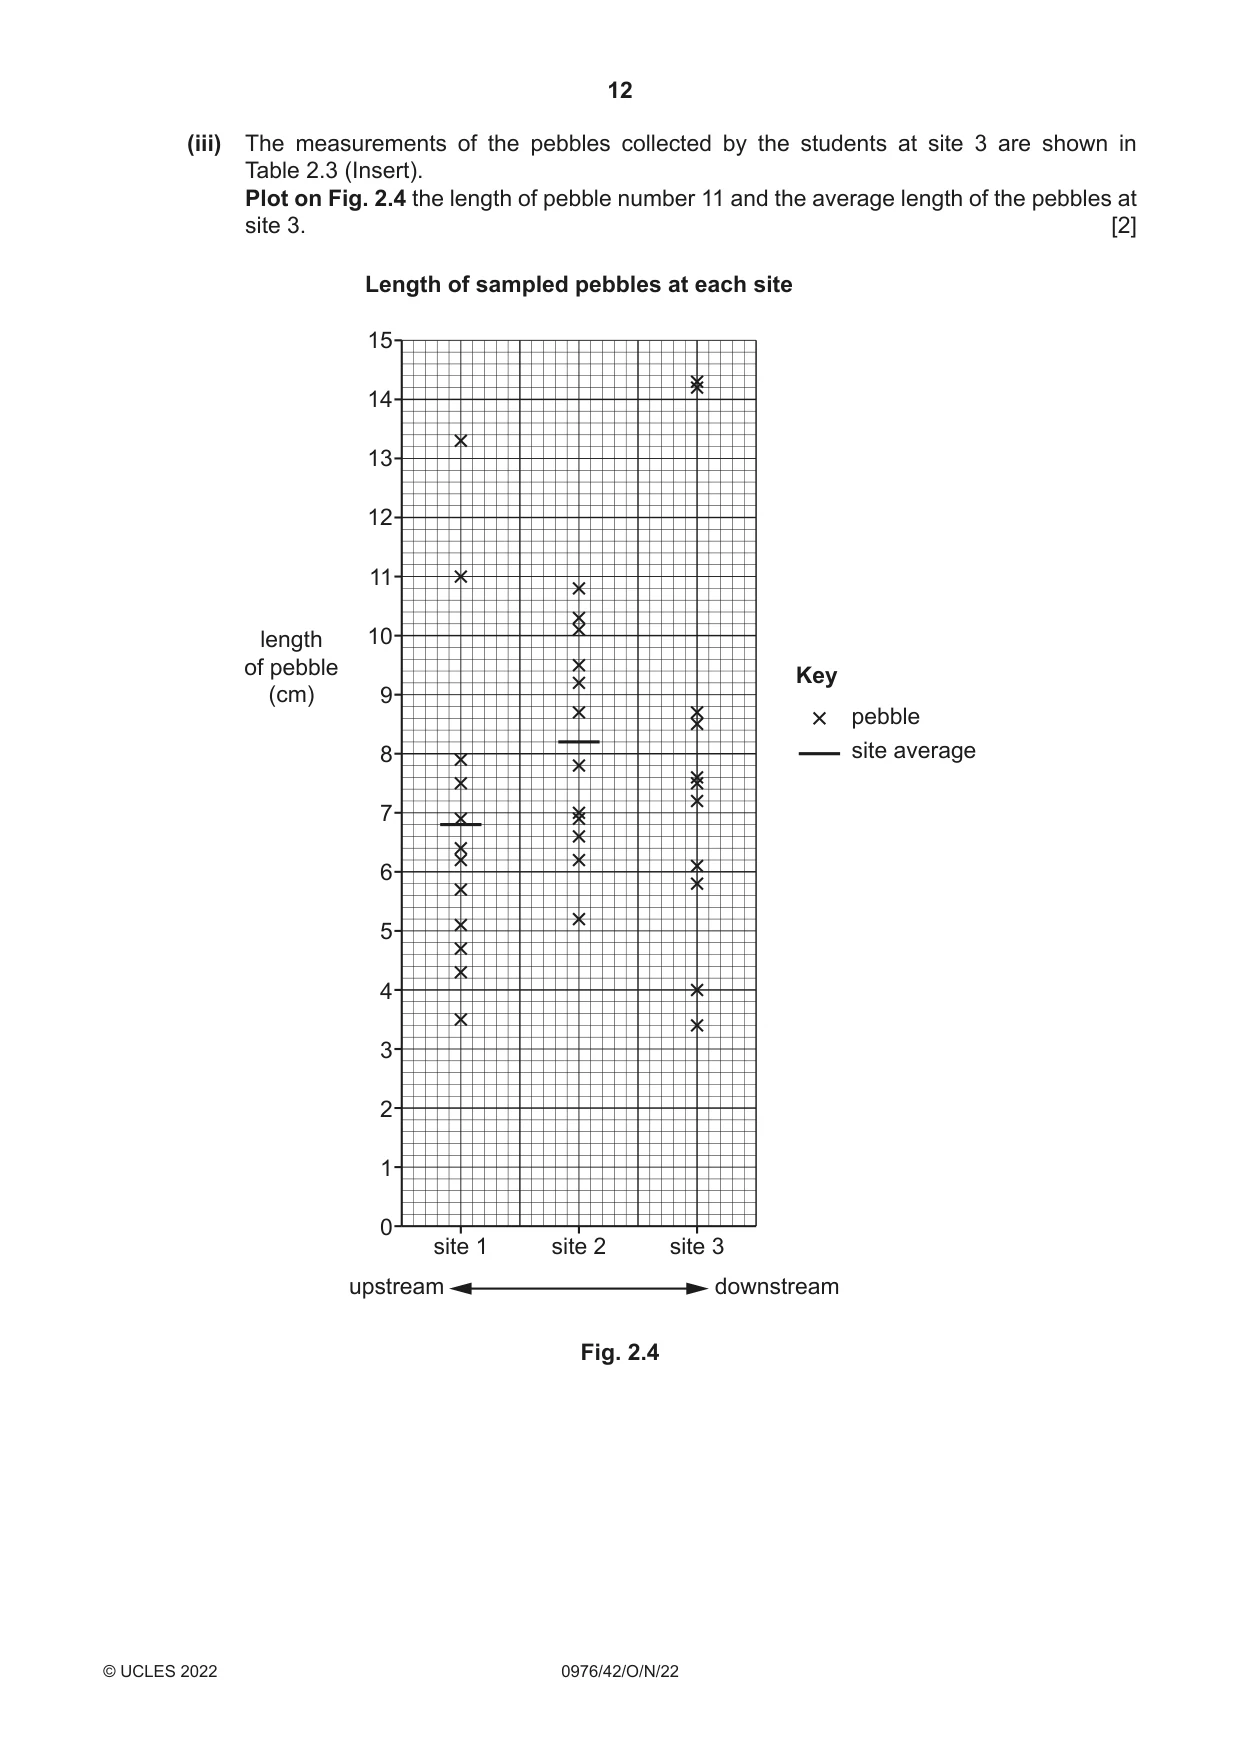
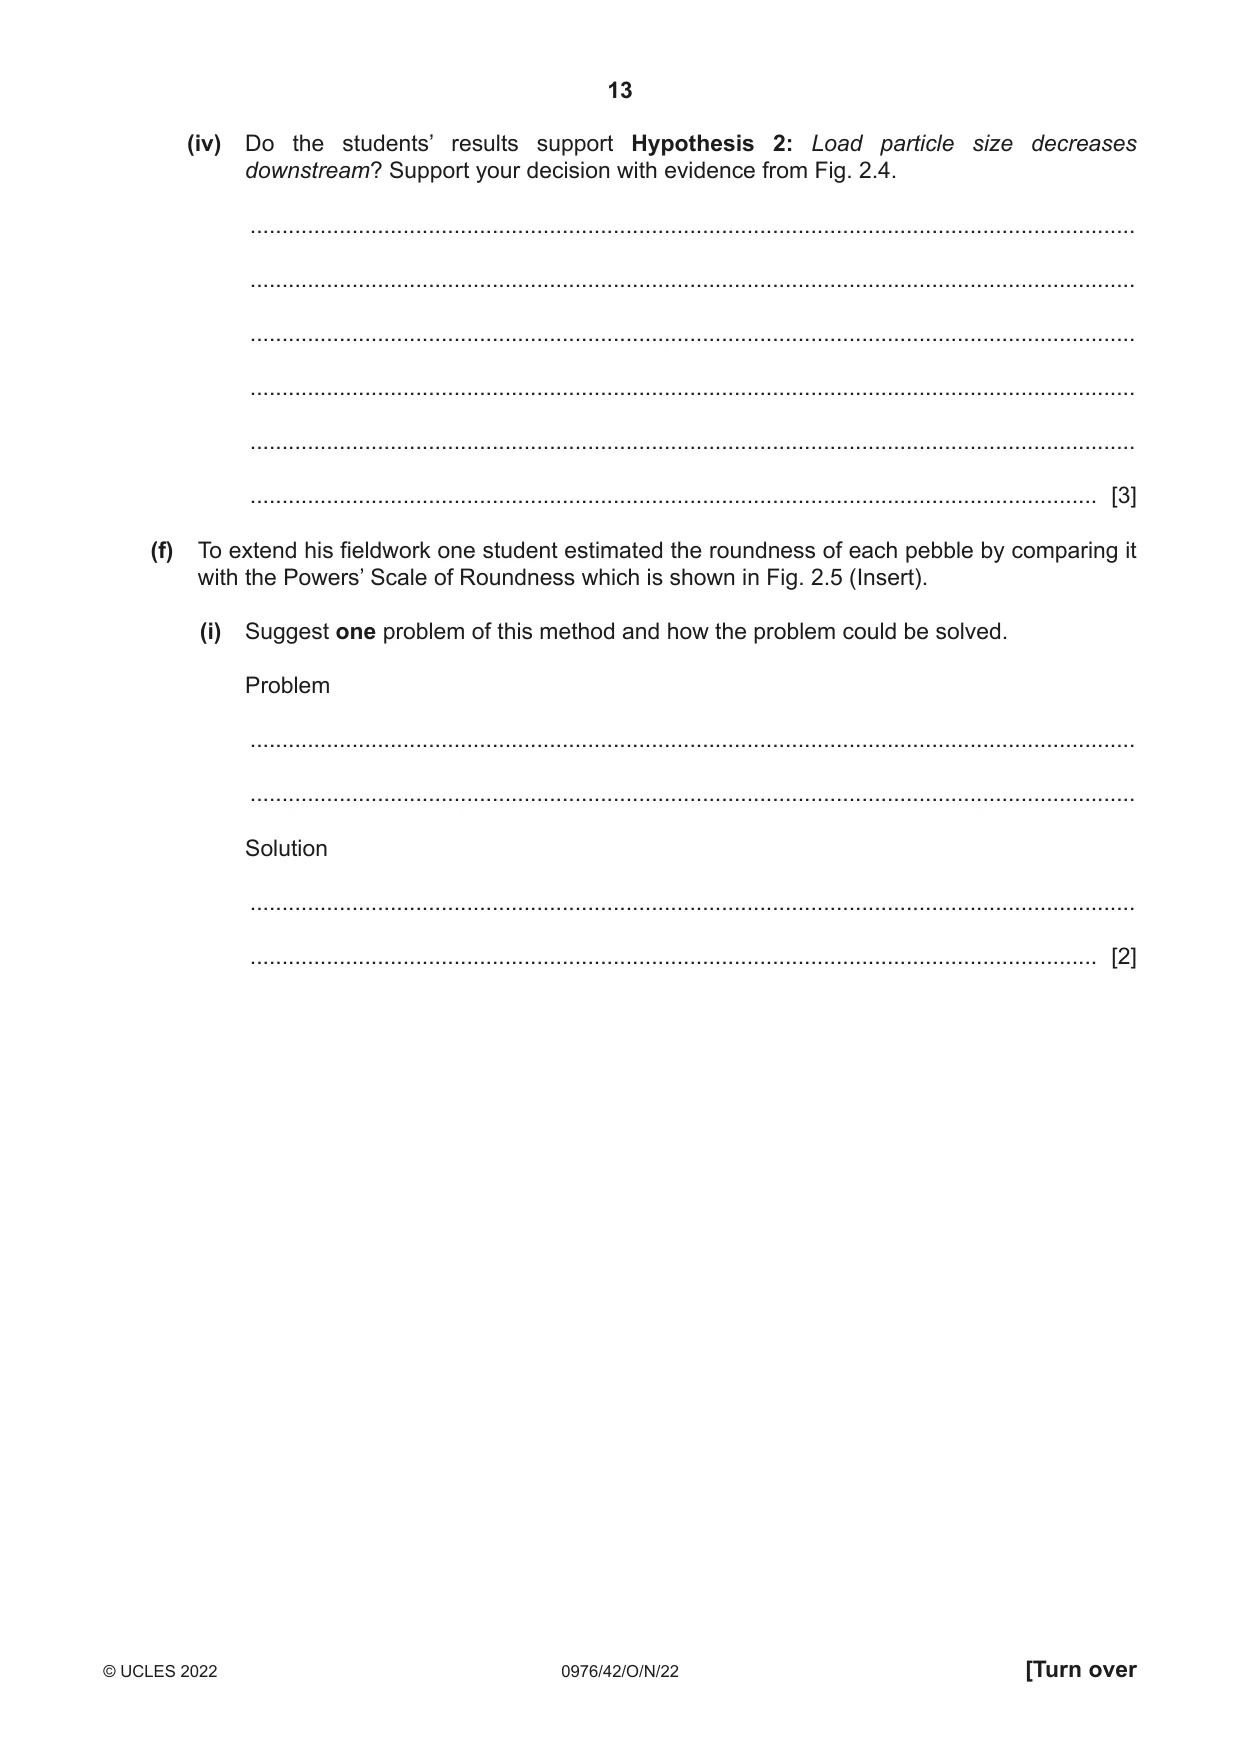
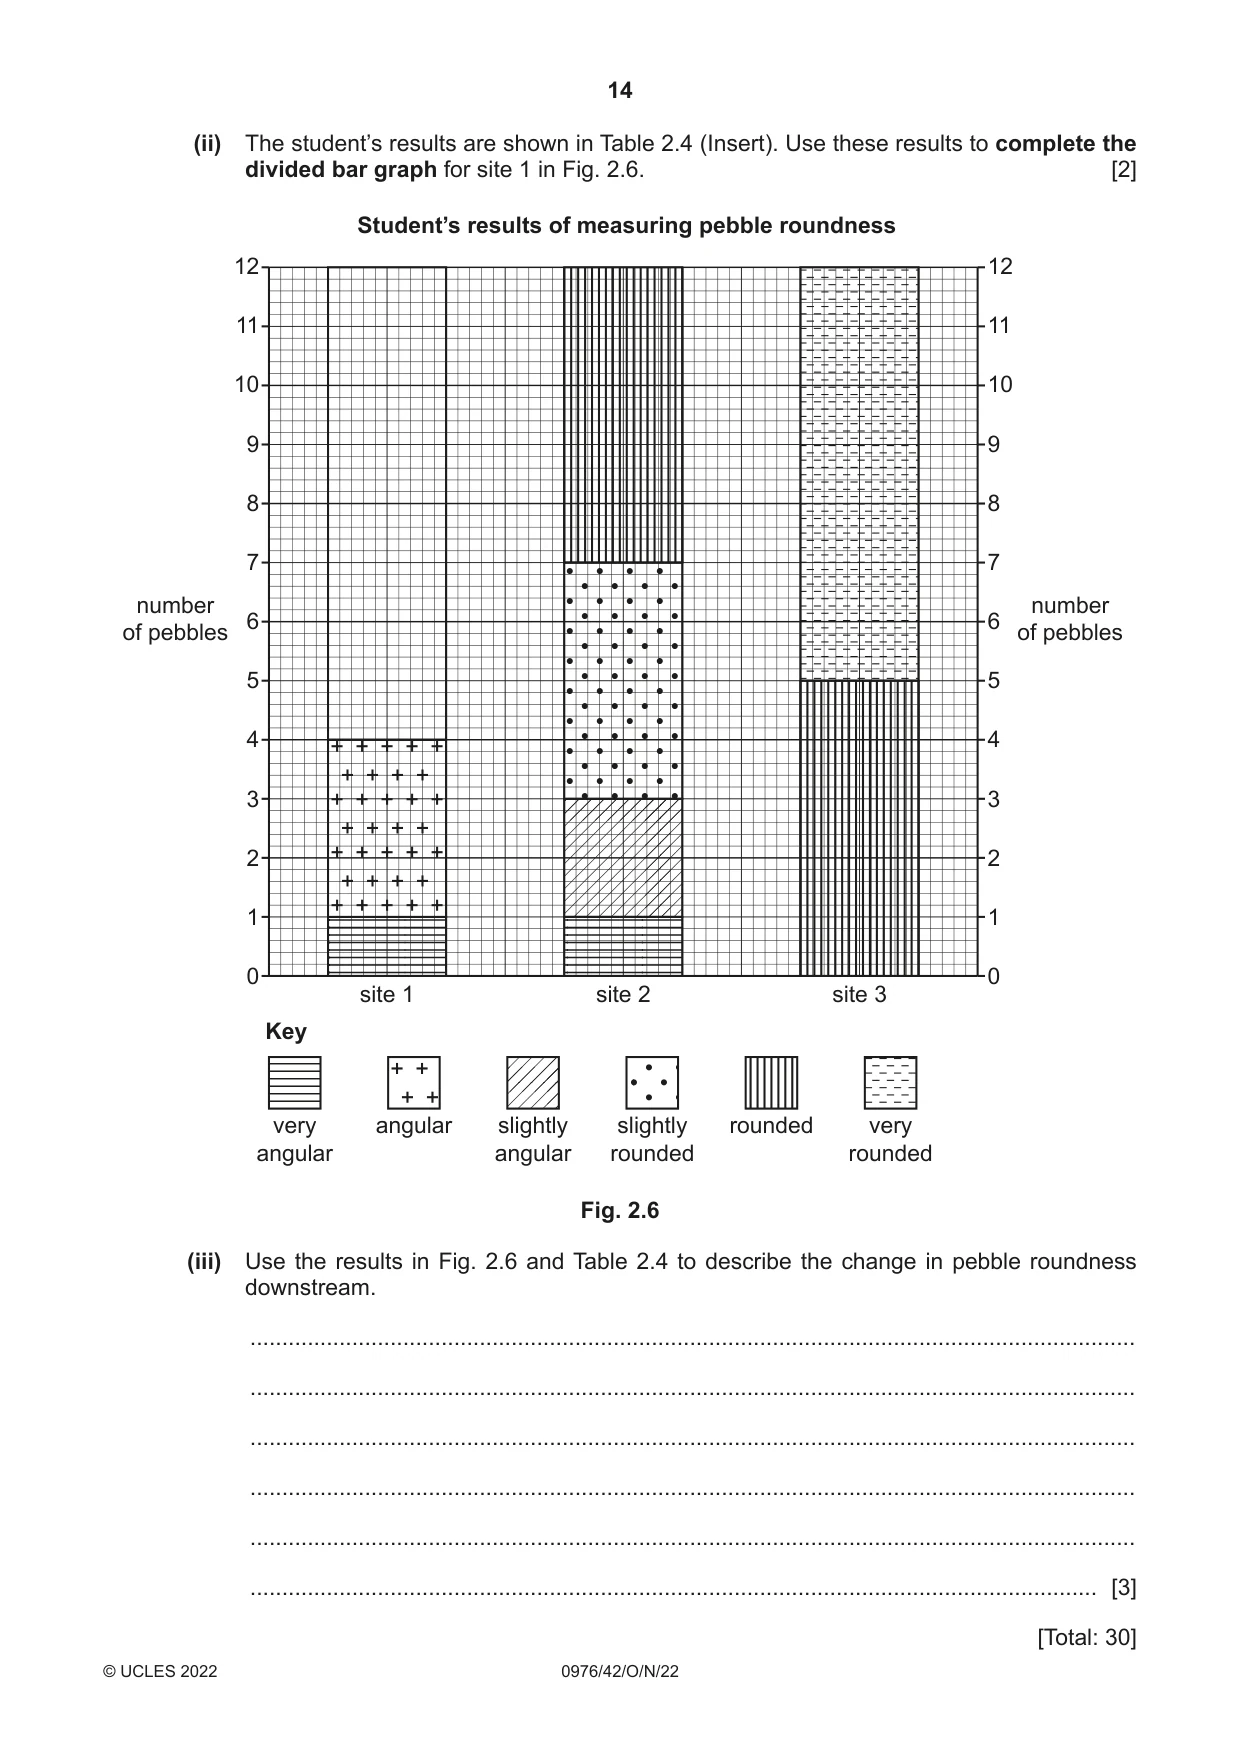
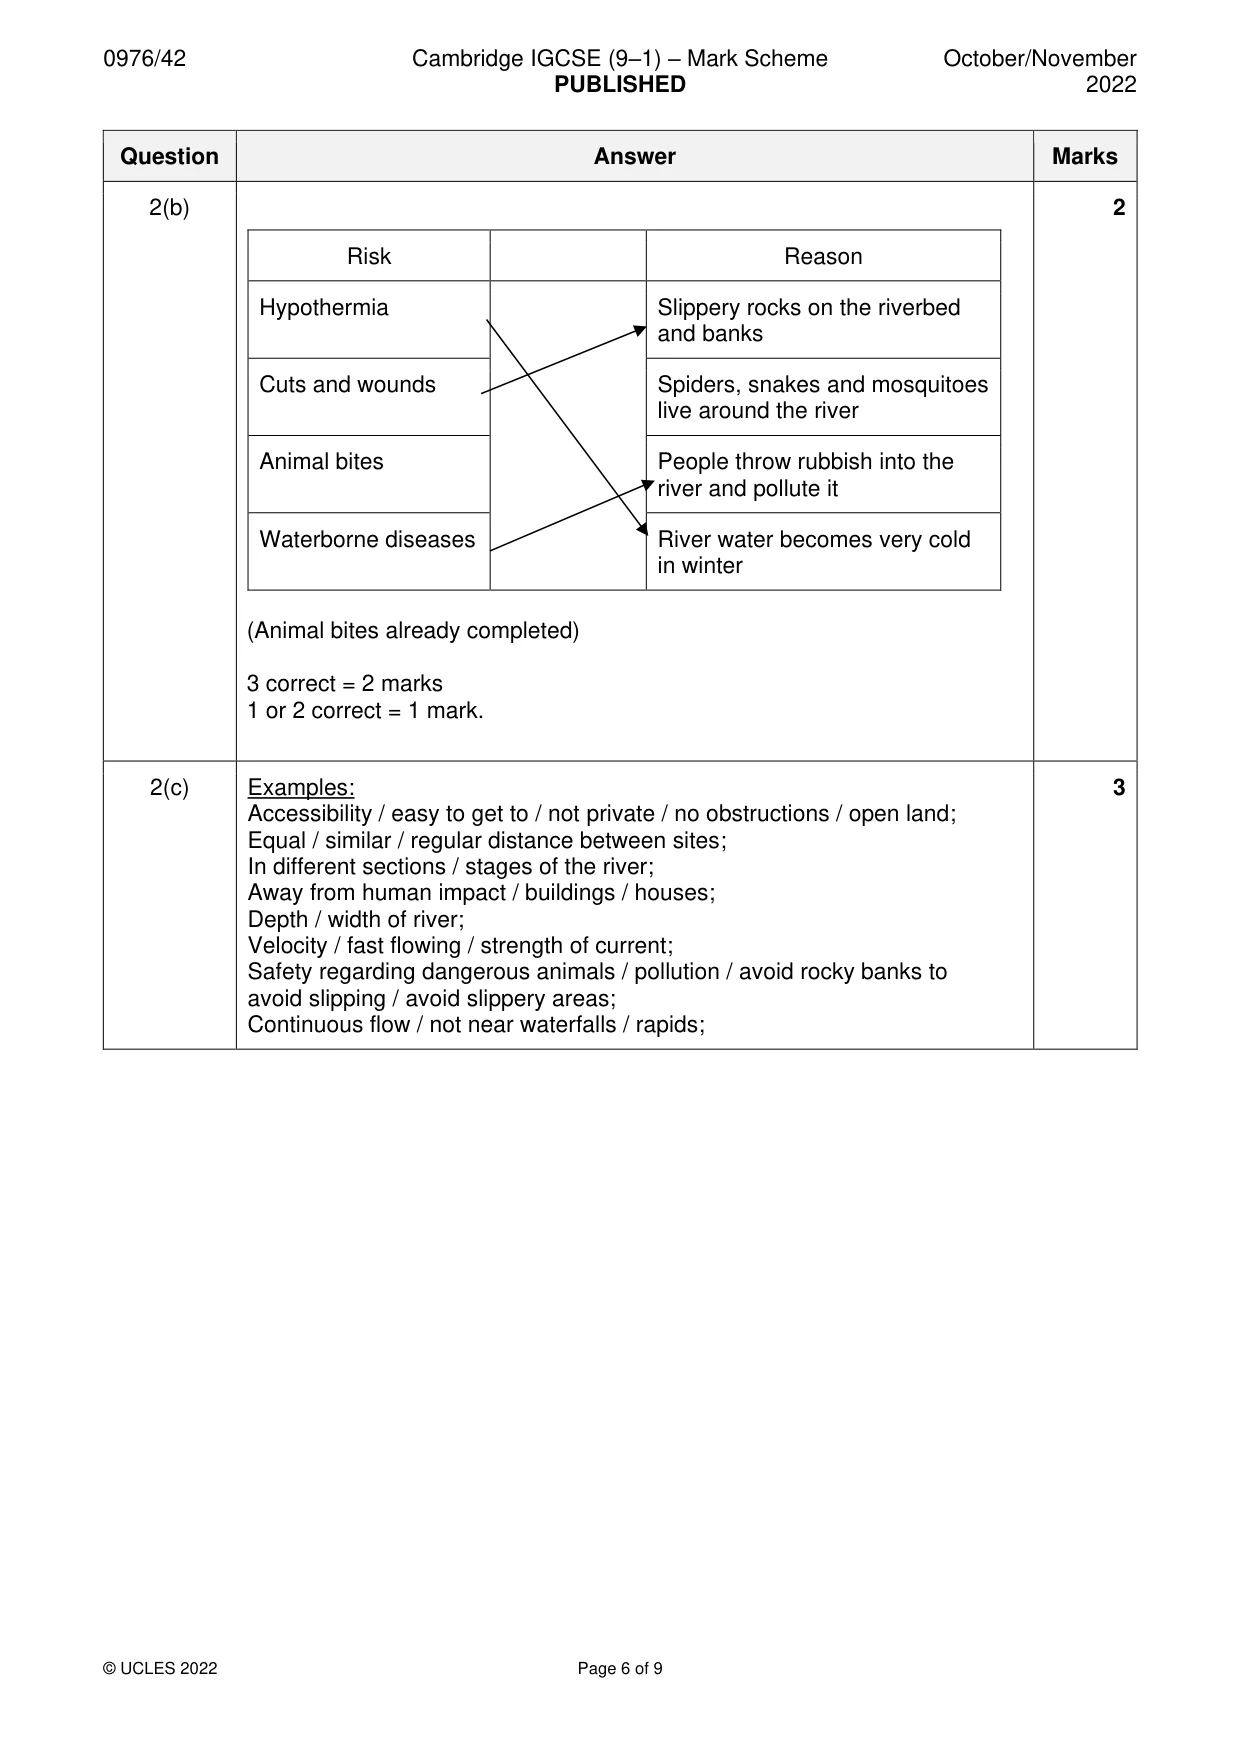
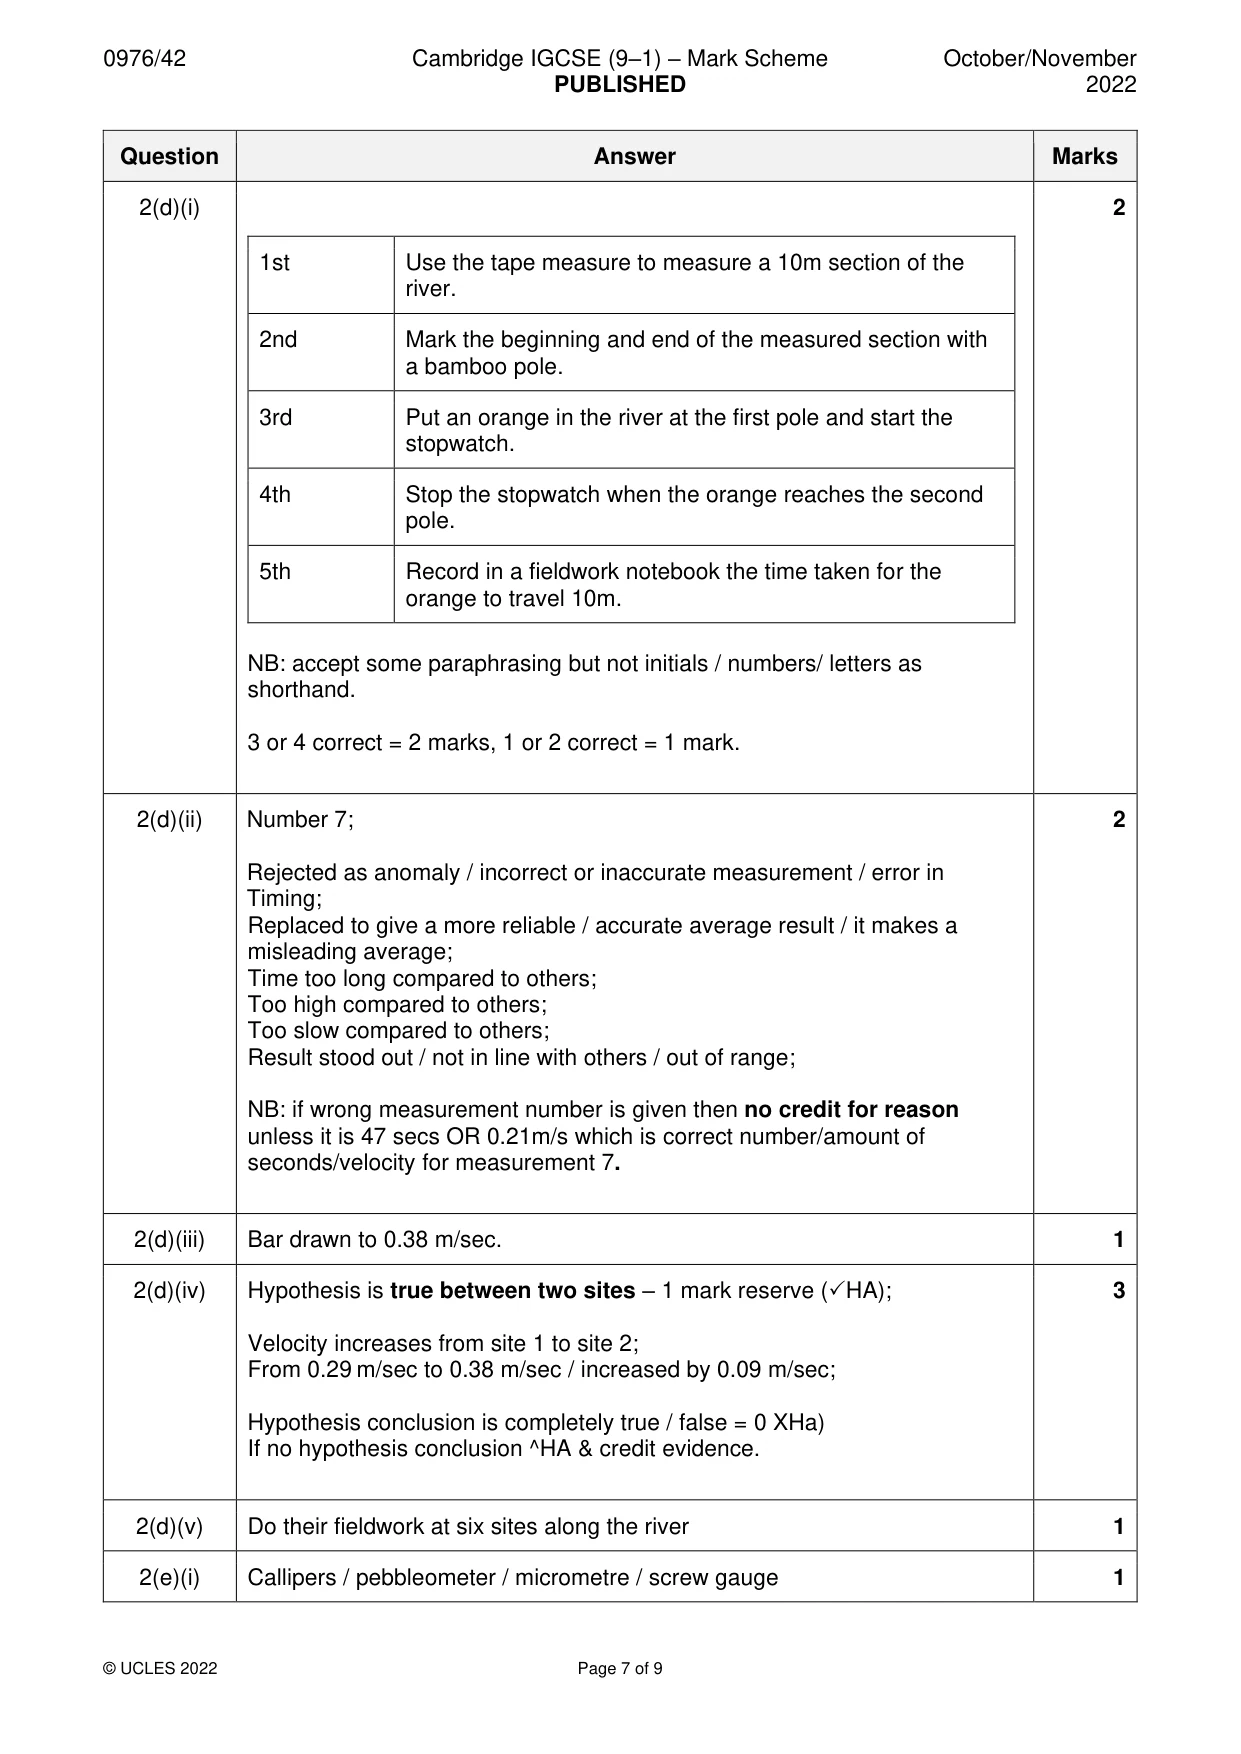
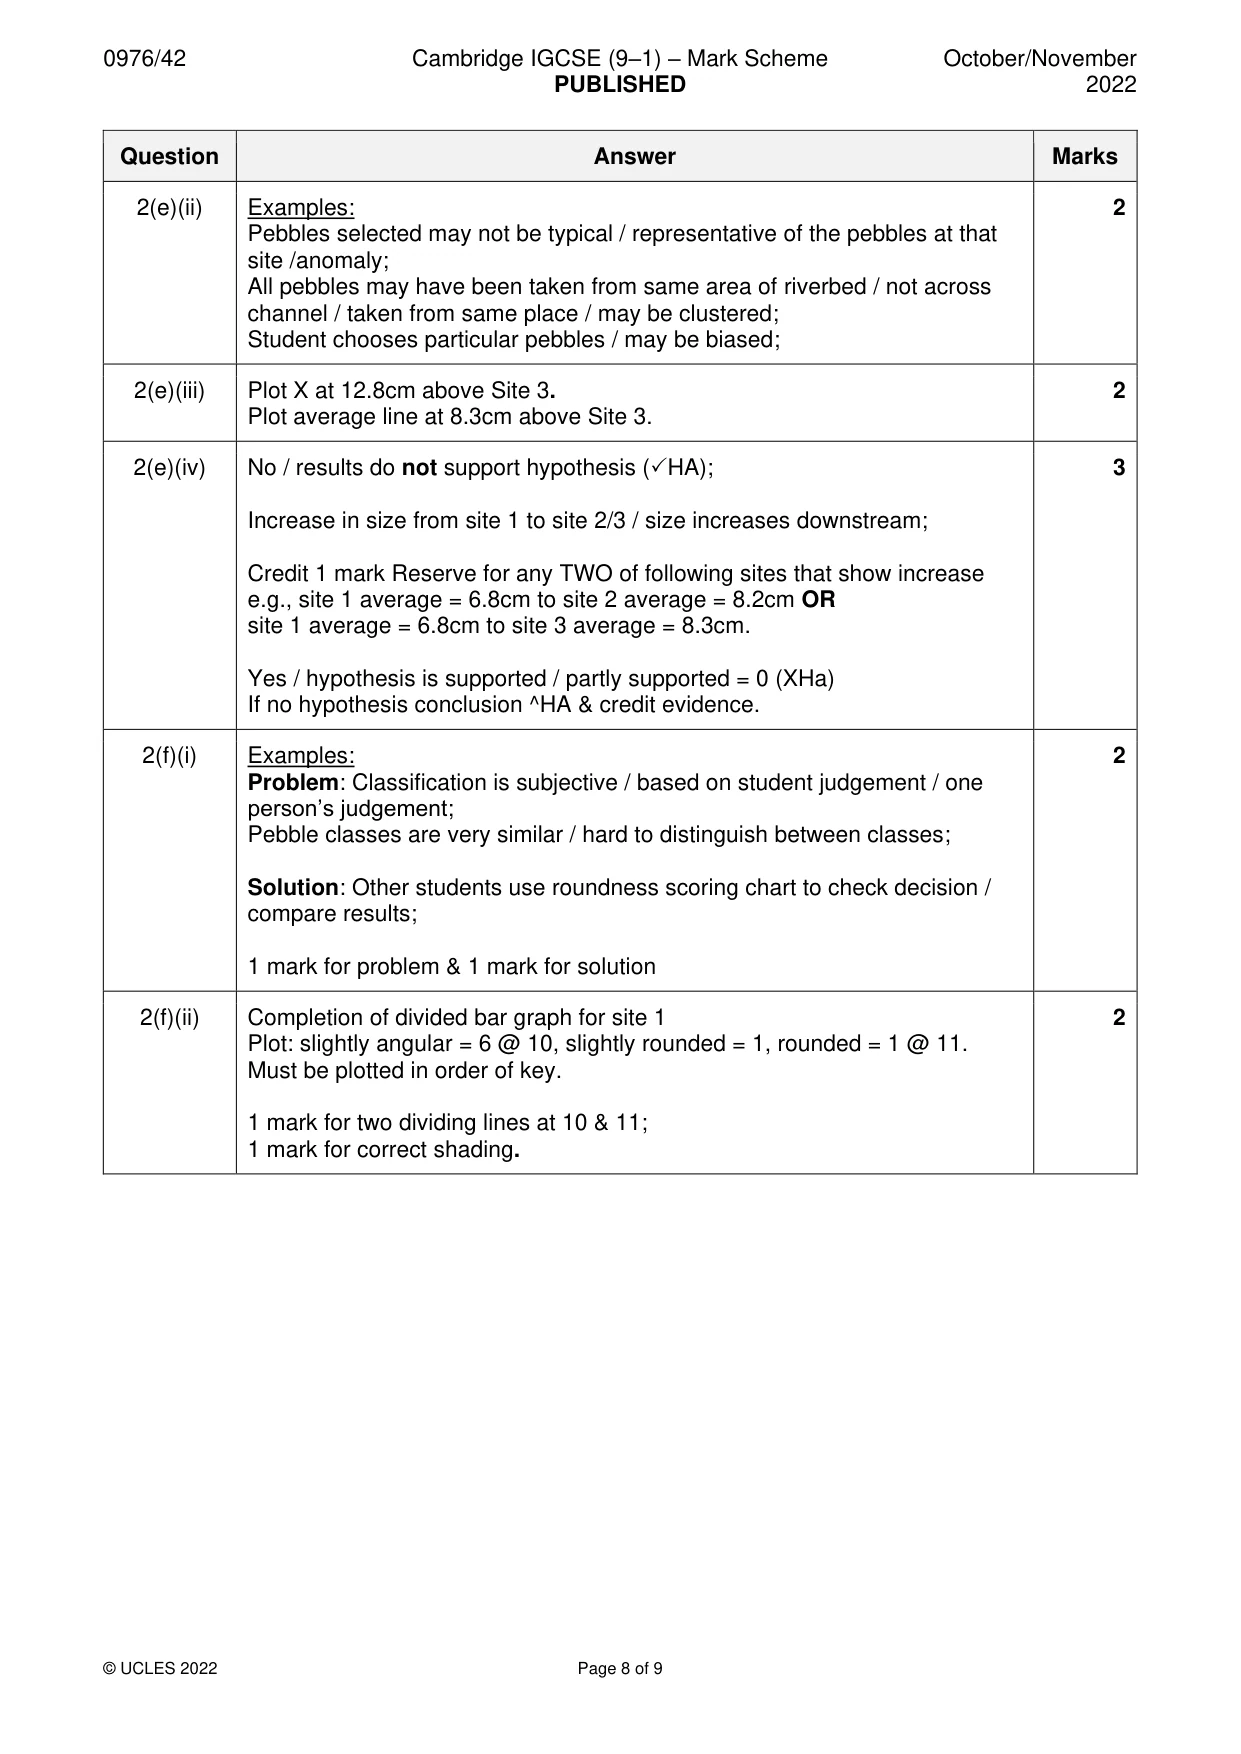
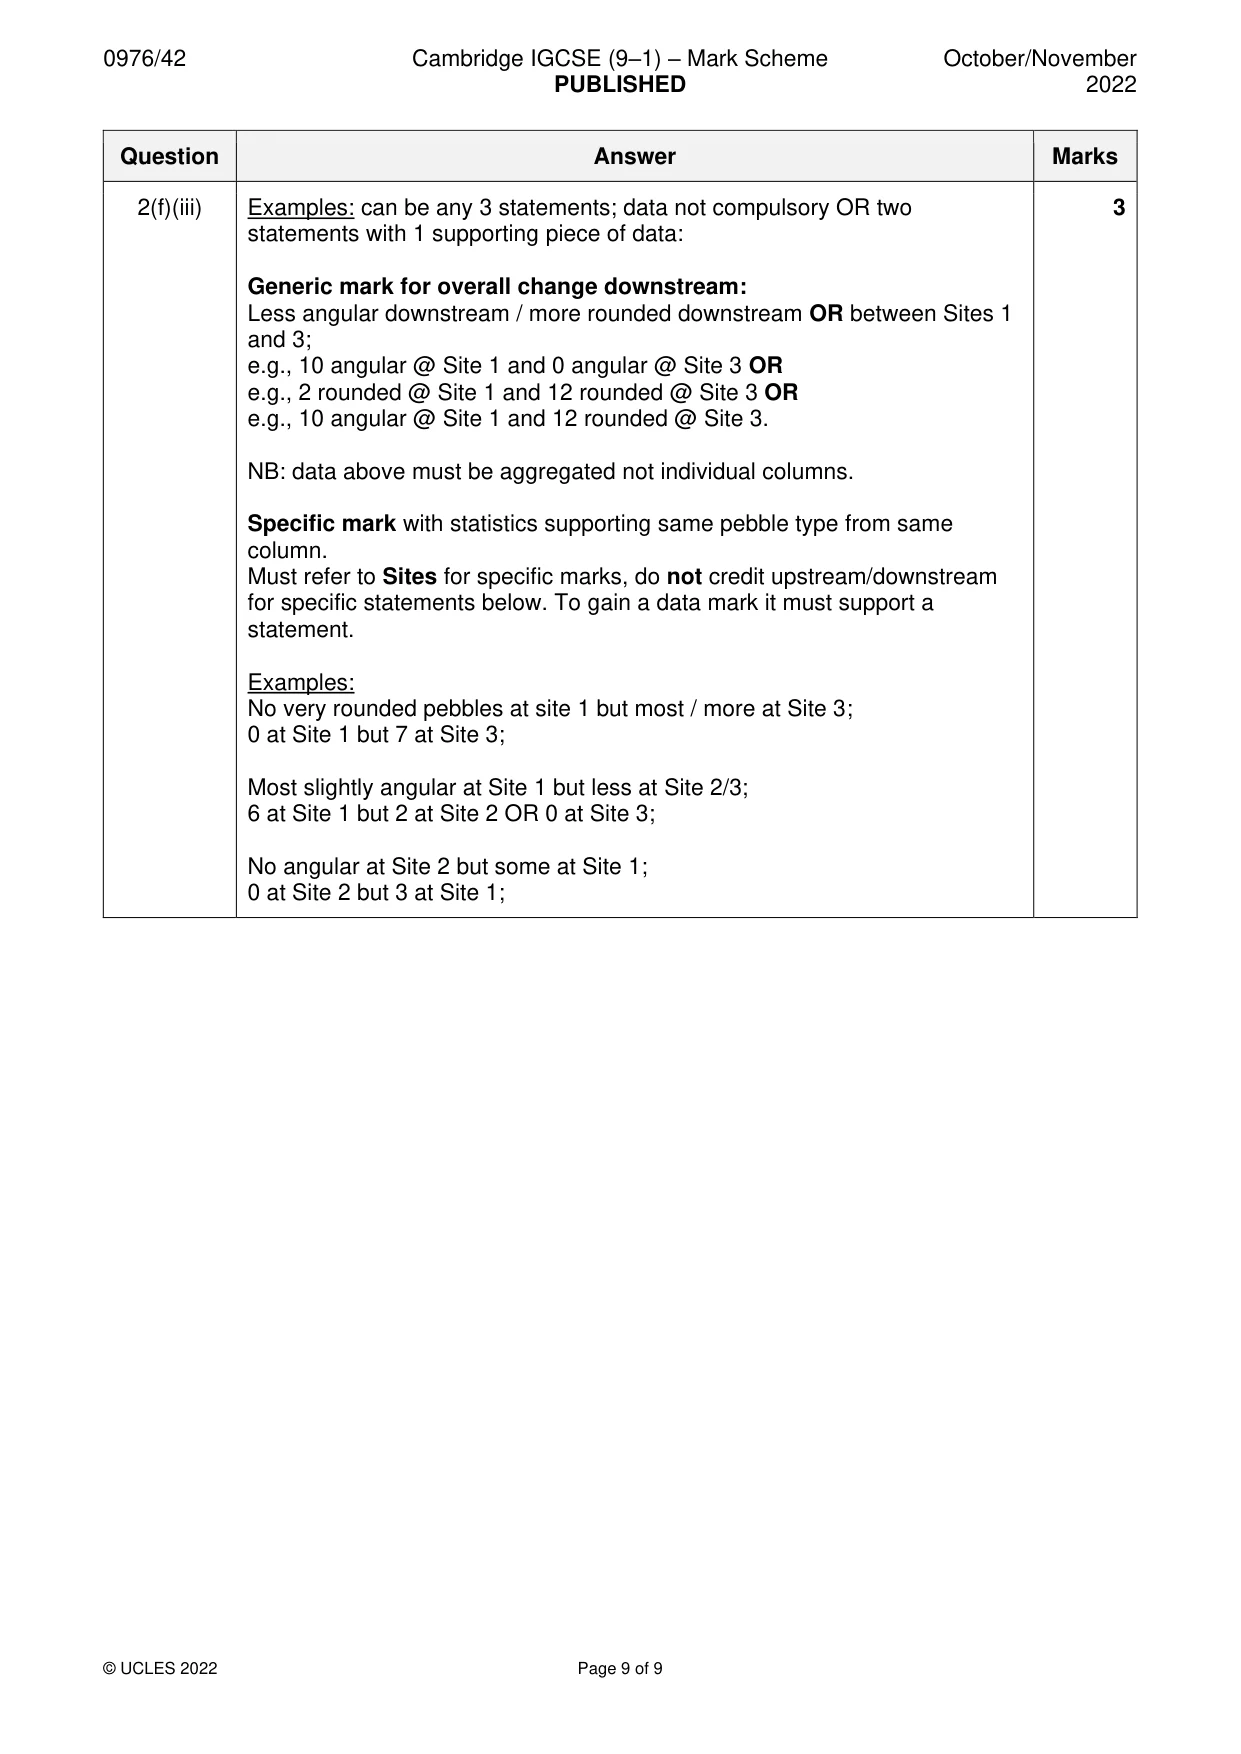
Mark scheme: 2(a) 1 Increase further downstream Decrease further downstream channel depth roughness of the channel bed discharge slope angle (gradient) load quantity Note: ignore any extra words in rows; credit the correct 3 answers in the correct columns. 2(b) 2 Risk Reason Hypothermia Slippery rocks on the riverbed and banks Cuts and wounds Spiders, snakes and mosquitoes live around the river Animal bites People throw rubbish into the river and pollute it Waterborne diseases River water becomes very cold in winter (Animal bites already completed) 3 correct = 2 marks 1 or 2 correct = 1 mark. 2(c) Examples: 3 Accessibility / easy to get to / not private / no obstructions / open land; Equal / similar / regular distance between sites; In different sections / stages of the river; Away from human impact / buildings / houses; Depth / width of river; Velocity / fast flowing / strength of current; Safety regarding dangerous animals / pollution / avoid rocky banks to avoid slipping / avoid slippery areas; Continuous flow / not near waterfalls / rapids; 2(d)(i) 2 1st Use the tape measure to measure a 10m section of the river. 2nd Mark the beginning and end of the measured section with a bamboo pole. 3rd Put an orange in the river at the first pole and start the stopwatch. 4th Stop the stopwatch when the orange reaches the second pole. 5th Record in a fieldwork notebook the time taken for the orange to travel 10m. NB: accept some paraphrasing but not initials / numbers/ letters as shorthand. 3 or 4 correct = 2 marks, 1 or 2 correct = 1 mark. 2(d)(ii) Number 7; 2 Rejected as anomaly / incorrect or inaccurate measurement / error in Timing; Replaced to give a more reliable / accurate average result / it makes a misleading average; Time too long compared to others; Too high compared to others; Too slow compared to others; Result stood out / not in line with others / out of range; NB: if wrong measurement number is given then no credit for reason unless it is 47 secs OR 0.21m/s which is correct number/amount of seconds/velocity for measurement 7. 2(d)(iii) Bar drawn to 0.38 m/sec. 1 2(d)(iv) Hypothesis is true between two sites – 1 mark reserve (HA); 3 Velocity increases from site 1 to site 2; From 0.29 m/sec to 0.38 m/sec / increased by 0.09 m/sec; Hypothesis conclusion is completely true / false = 0 XHa) If no hypothesis conclusion ^HA & credit evidence. 2(d)(v) Do their fieldwork at six sites along the river 1 2(e)(i) Callipers / pebbleometer / micrometre / screw gauge 1 2(e)(ii) Examples: 2 Pebbles selected may not be typical / representative of the pebbles at that site /anomaly; All pebbles may have been taken from same area of riverbed / not across channel / taken from same place / may be clustered; Student chooses particular pebbles / may be biased; 2(e)(iii) Plot X at 12.8cm above Site 3. 2 Plot average line at 8.3cm above Site 3. 2(e)(iv) No / results do not support hypothesis (HA); 3 Increase in size from site 1 to site 2/3 / size increases downstream; Credit 1 mark Reserve for any TWO of following sites that show increase e.g., site 1 average = 6.8cm to site 2 average = 8.2cm OR site 1 average = 6.8cm to site 3 average = 8.3cm. Yes / hypothesis is supported / partly supported = 0 (XHa) If no hypothesis conclusion ^HA & credit evidence. 2(f)(i) Examples: 2 Problem: Classification is subjective / based on student judgement / one person’s judgement; Pebble classes are very similar / hard to distinguish between classes; Solution: Other students use roundness scoring chart to check decision / compare results; 1 mark for problem & 1 mark for solution 2(f)(ii) Completion of divided bar graph for site 1 2 Plot: slightly angular = 6 @ 10, slightly rounded = 1, rounded = 1 @ 11. Must be plotted in order of key. 1 mark for two dividing lines at 10 & 11; 1 mark for correct shading. 2(f)(iii) Examples: can be any 3 statements; data not compulsory OR two 3 statements with 1 supporting piece of data: Generic mark for overall change downstream: Less angular downstream / more rounded downstream OR between Sites 1 and 3; e.g., 10 angular @ Site 1 and 0 angular @ Site 3 OR e.g., 2 rounded @ Site 1 and 12 rounded @ Site 3 OR e.g., 10 angular @ Site 1 and 12 rounded @ Site 3. NB: data above must be aggregated not individual columns. Specific mark with statistics supporting same pebble type from same column. Must refer to Sites for specific marks, do not credit upstream/downstream for specific statements below. To gain a data mark it must support a statement. Examples: No very rounded pebbles at site 1 but most / more at Site 3; 0 at Site 1 but 7 at Site 3; Most slightly angular at Site 1 but less at Site 2/3; 6 at Site 1 but 2 at Site 2 OR 0 at Site 3; No angular at Site 2 but some at Site 1; 0 at Site 2 but 3 at Site 1;
What was in this paper
The subtopics covered by these 2 questions, and how many questions each got. Open one in a new tab to see every Cambridge question on it.
What you needed in this session
Cambridge’s own grade thresholds for 2022 Oct/Nov, Paper 4 · Variant 2. A higher threshold means an easier paper — the bar moves with how the cohort did.