Cambridge IGCSE Geography (9-1) 0976 — 2023 May/June Paper 4 · Variant 2
0976/42/M/J/23 · 2 questions · 60 marks · ≈68 min
The question paper and its mark scheme, free to read here and free to download. This is Cambridge’s own paper, exactly as it was sat.
Question paper20 pages







Mark scheme8 pages
Answers below. Sit the paper first if you are practising.
Questions as text
Q1 · Students visited three beaches along the coast in their local area
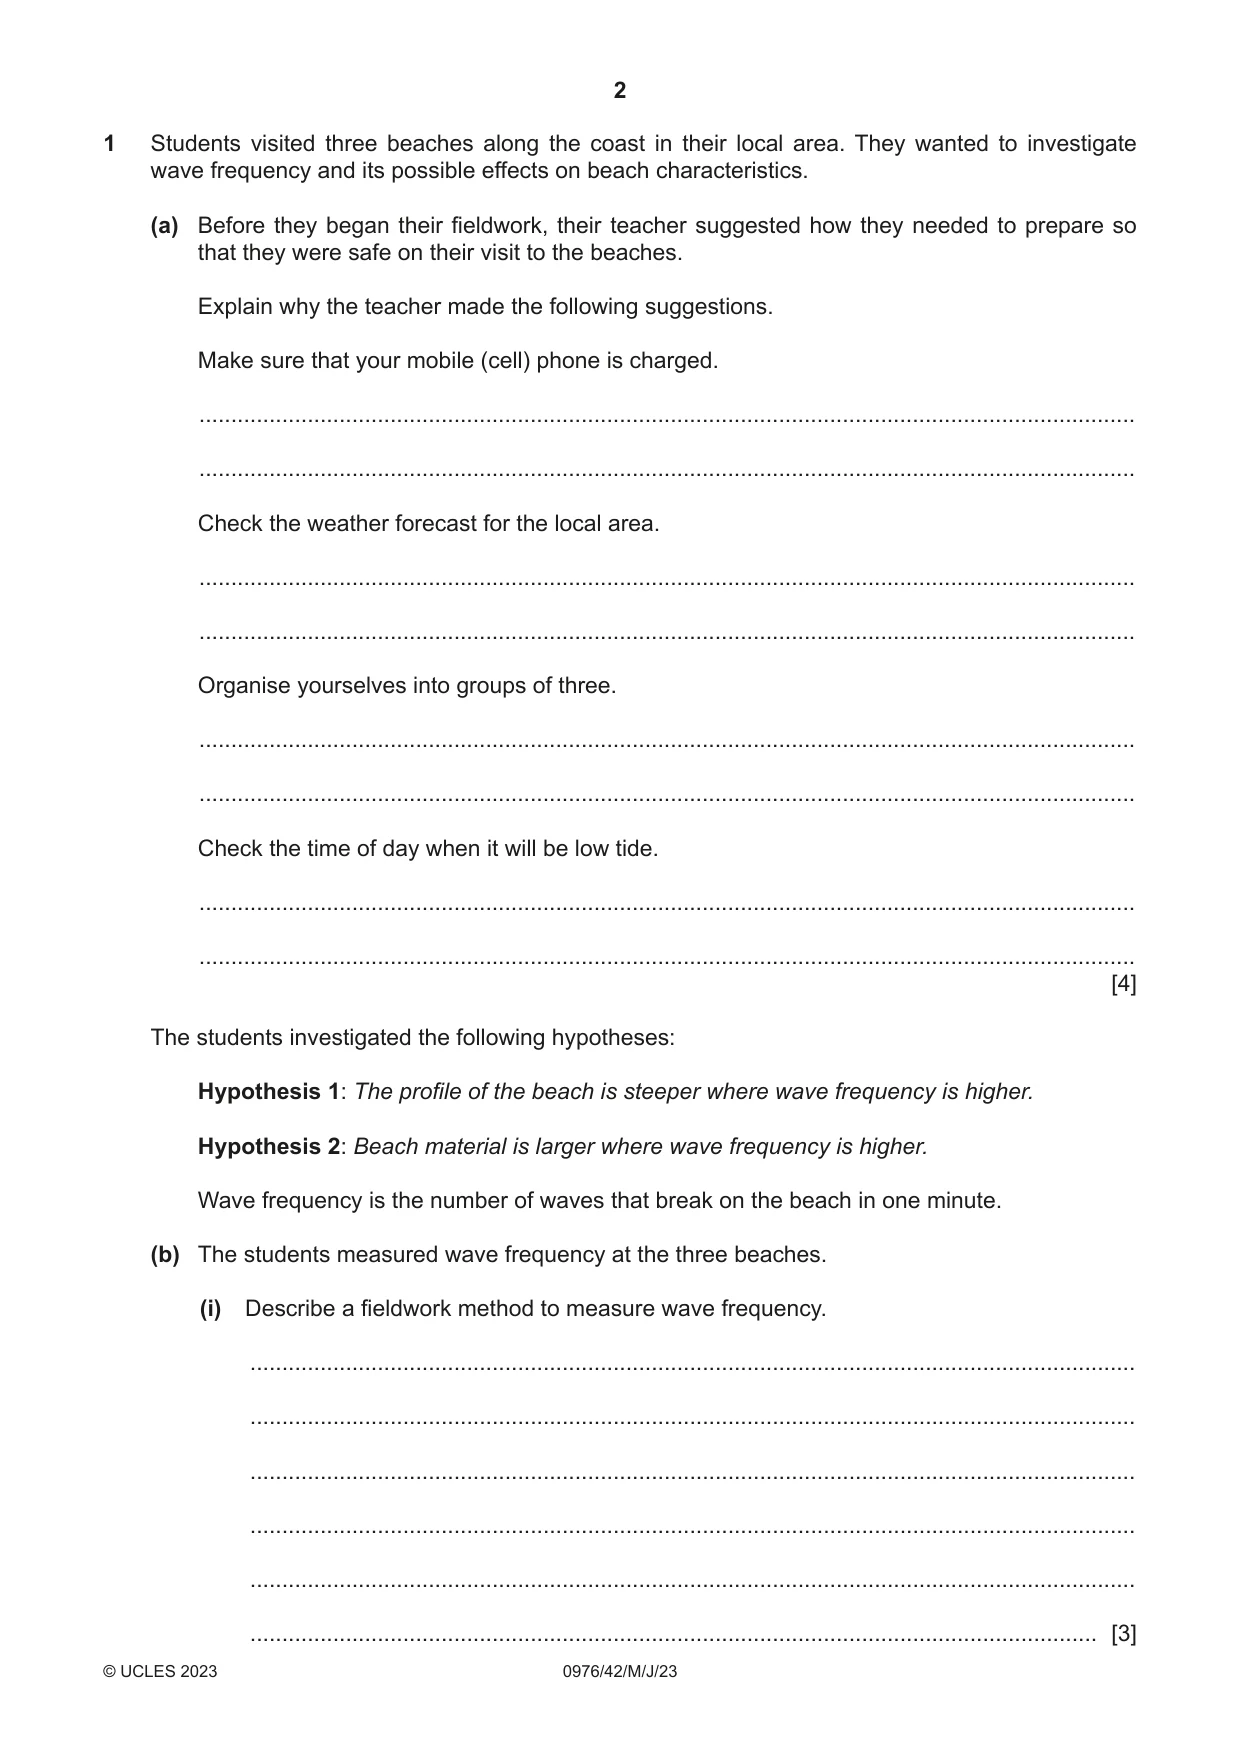
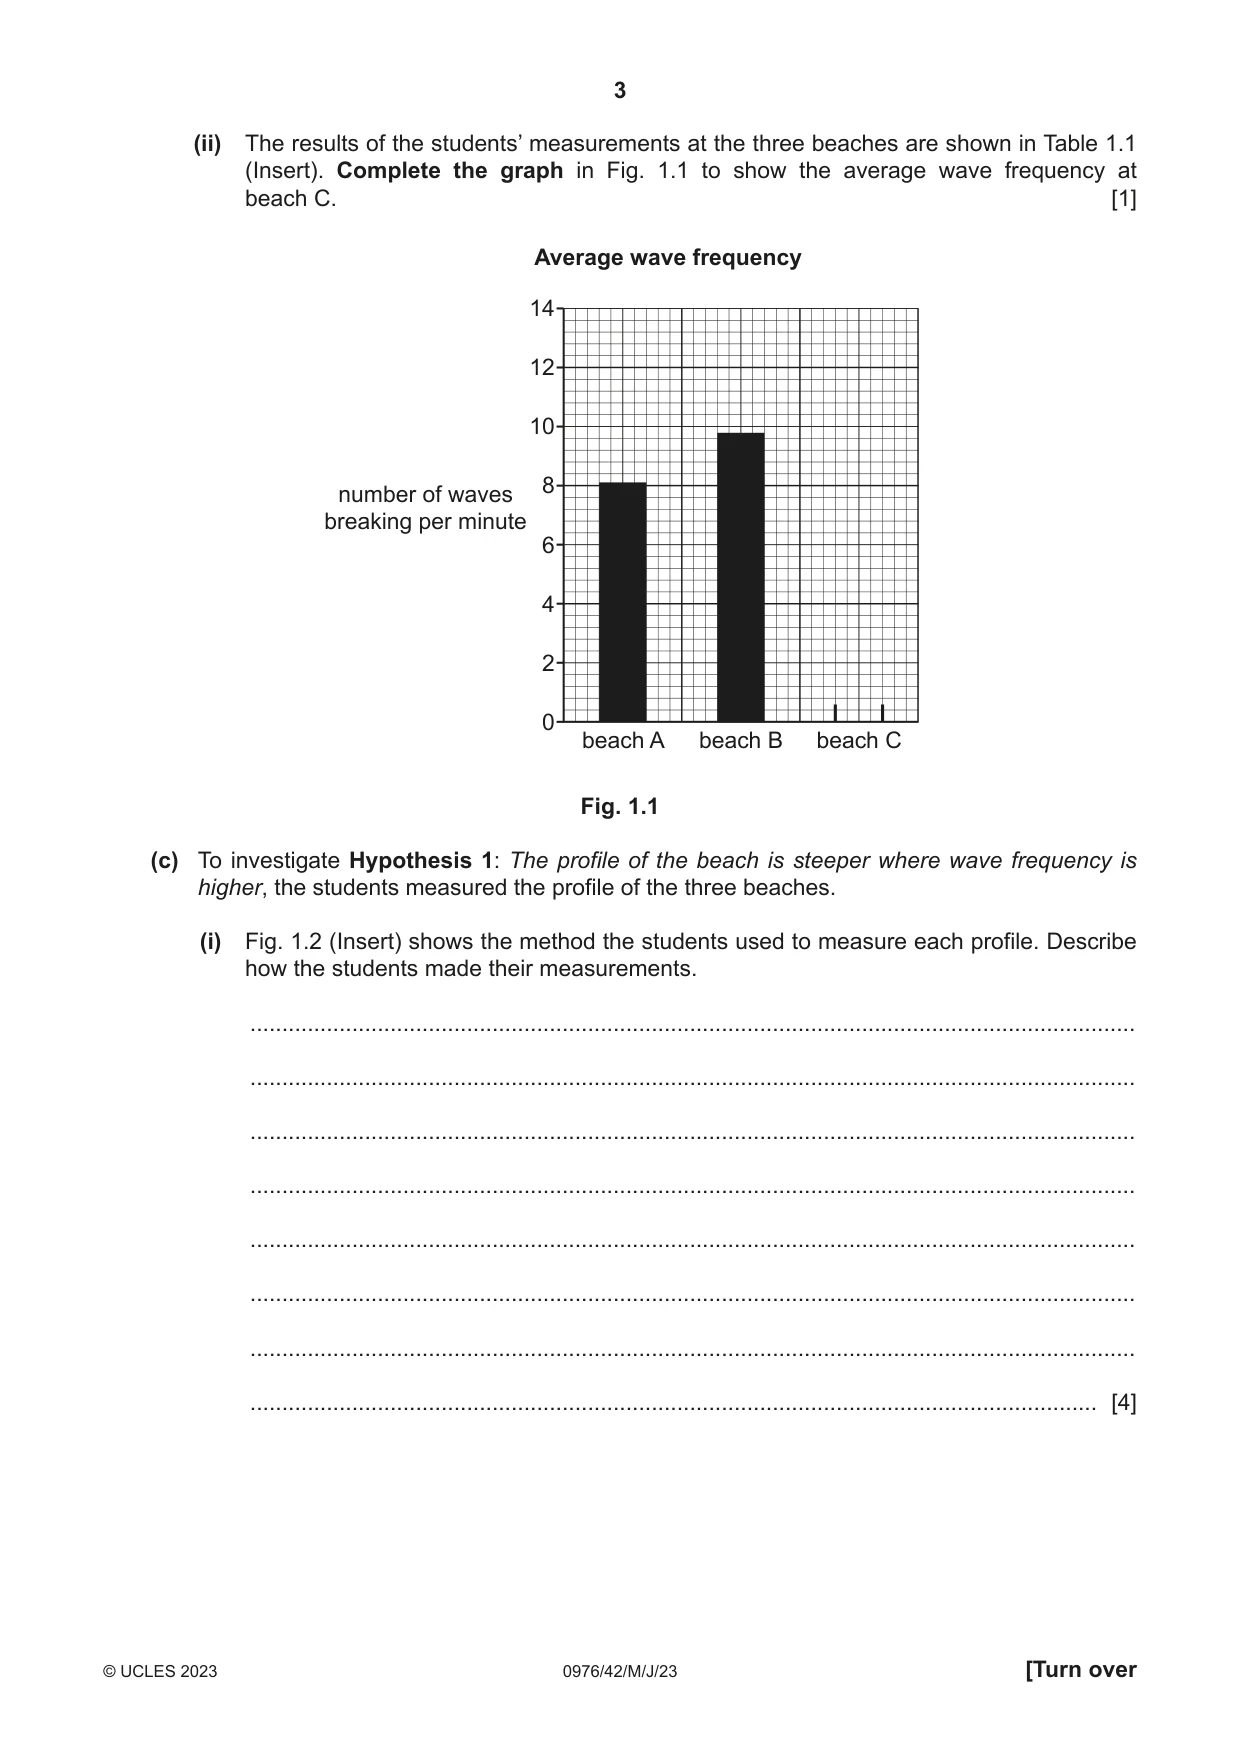
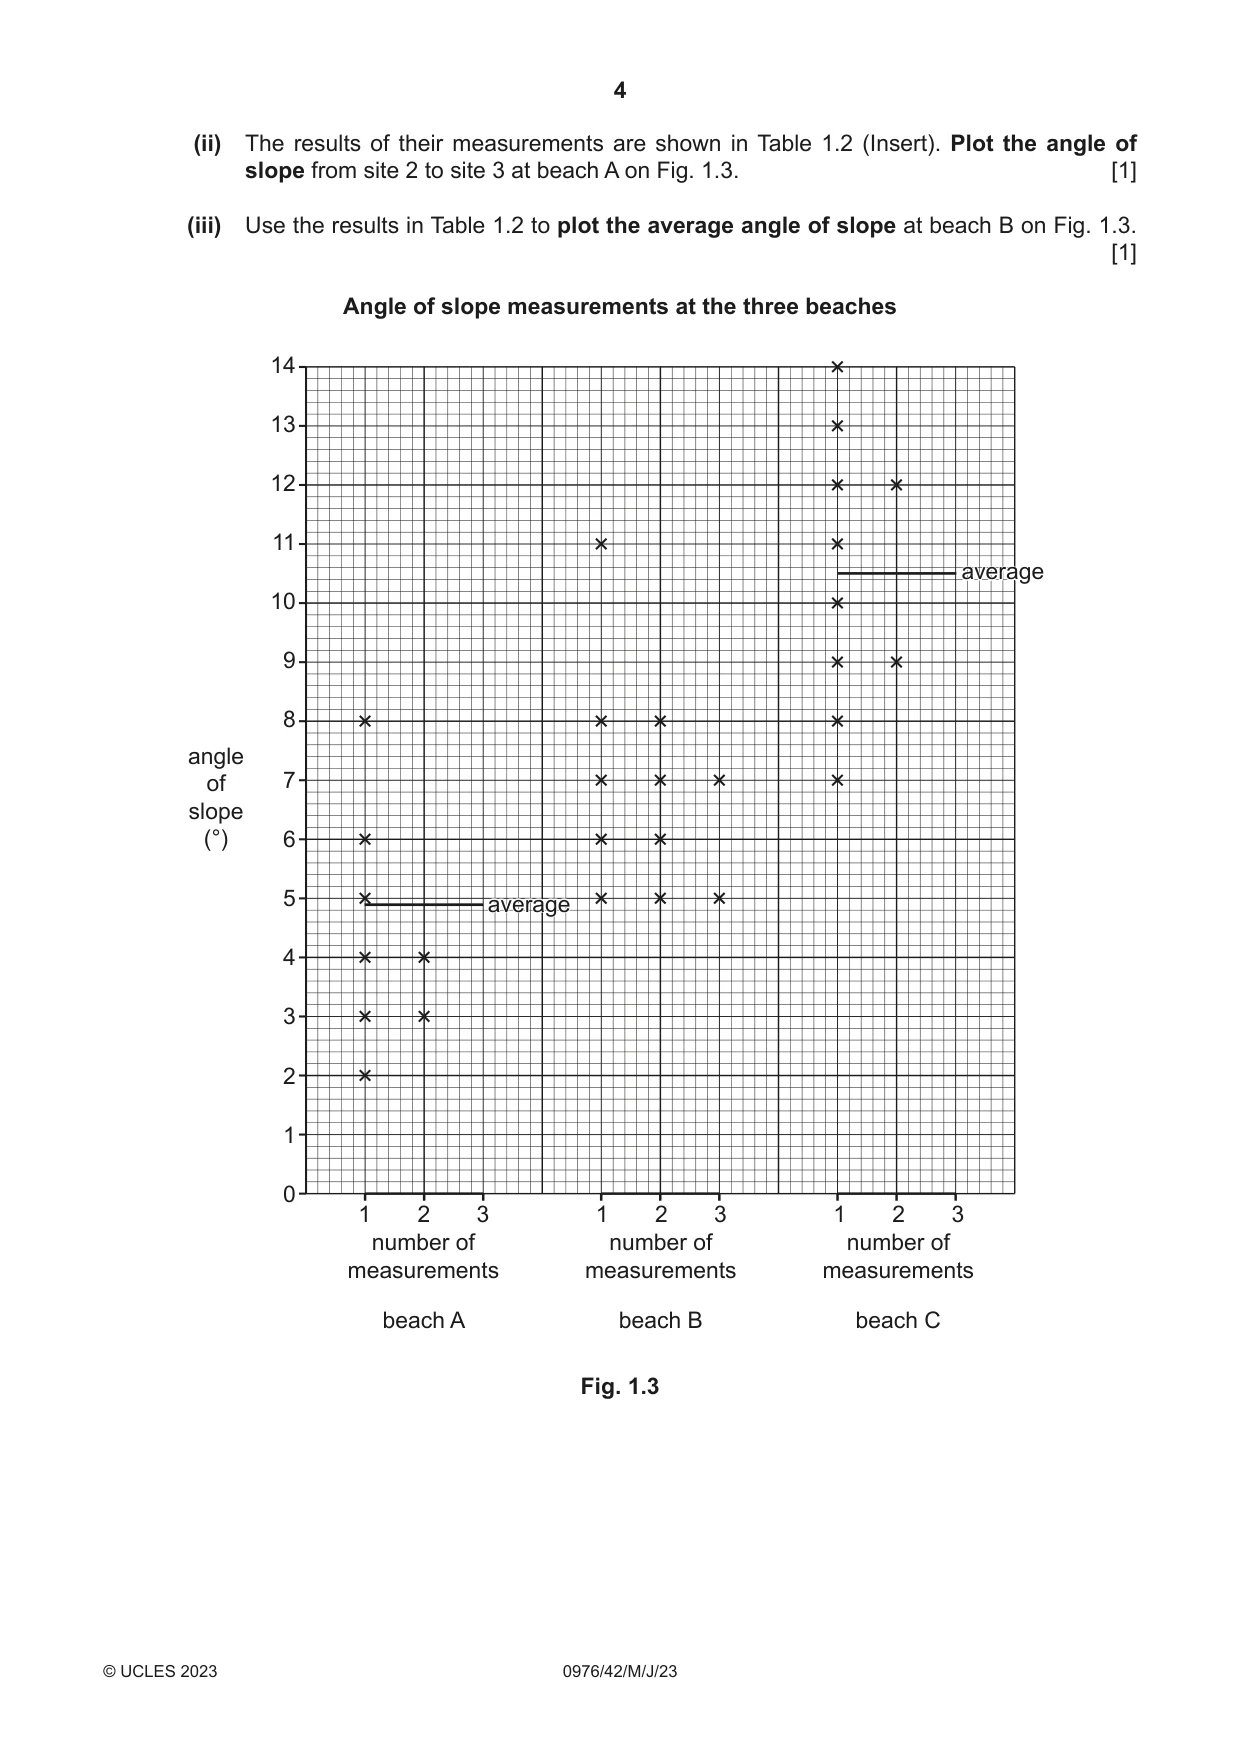
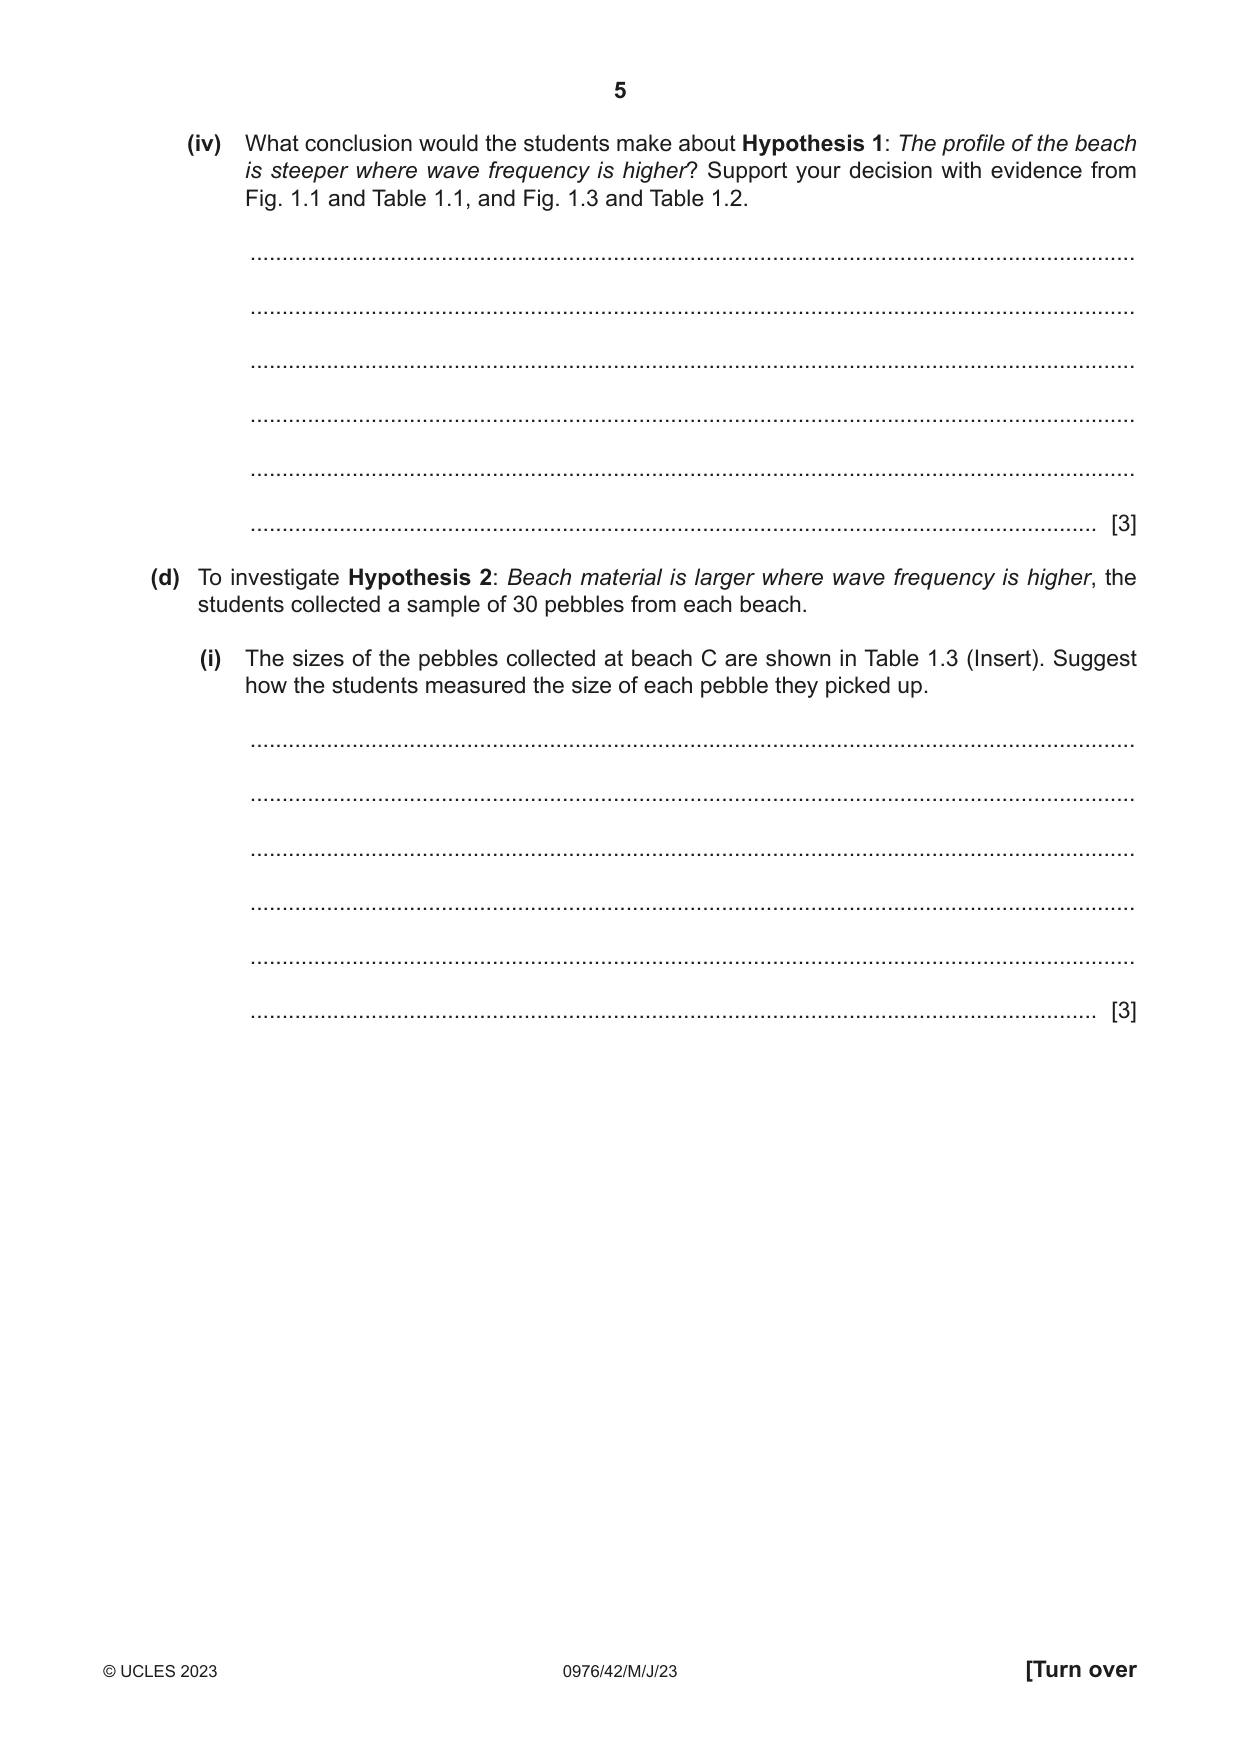
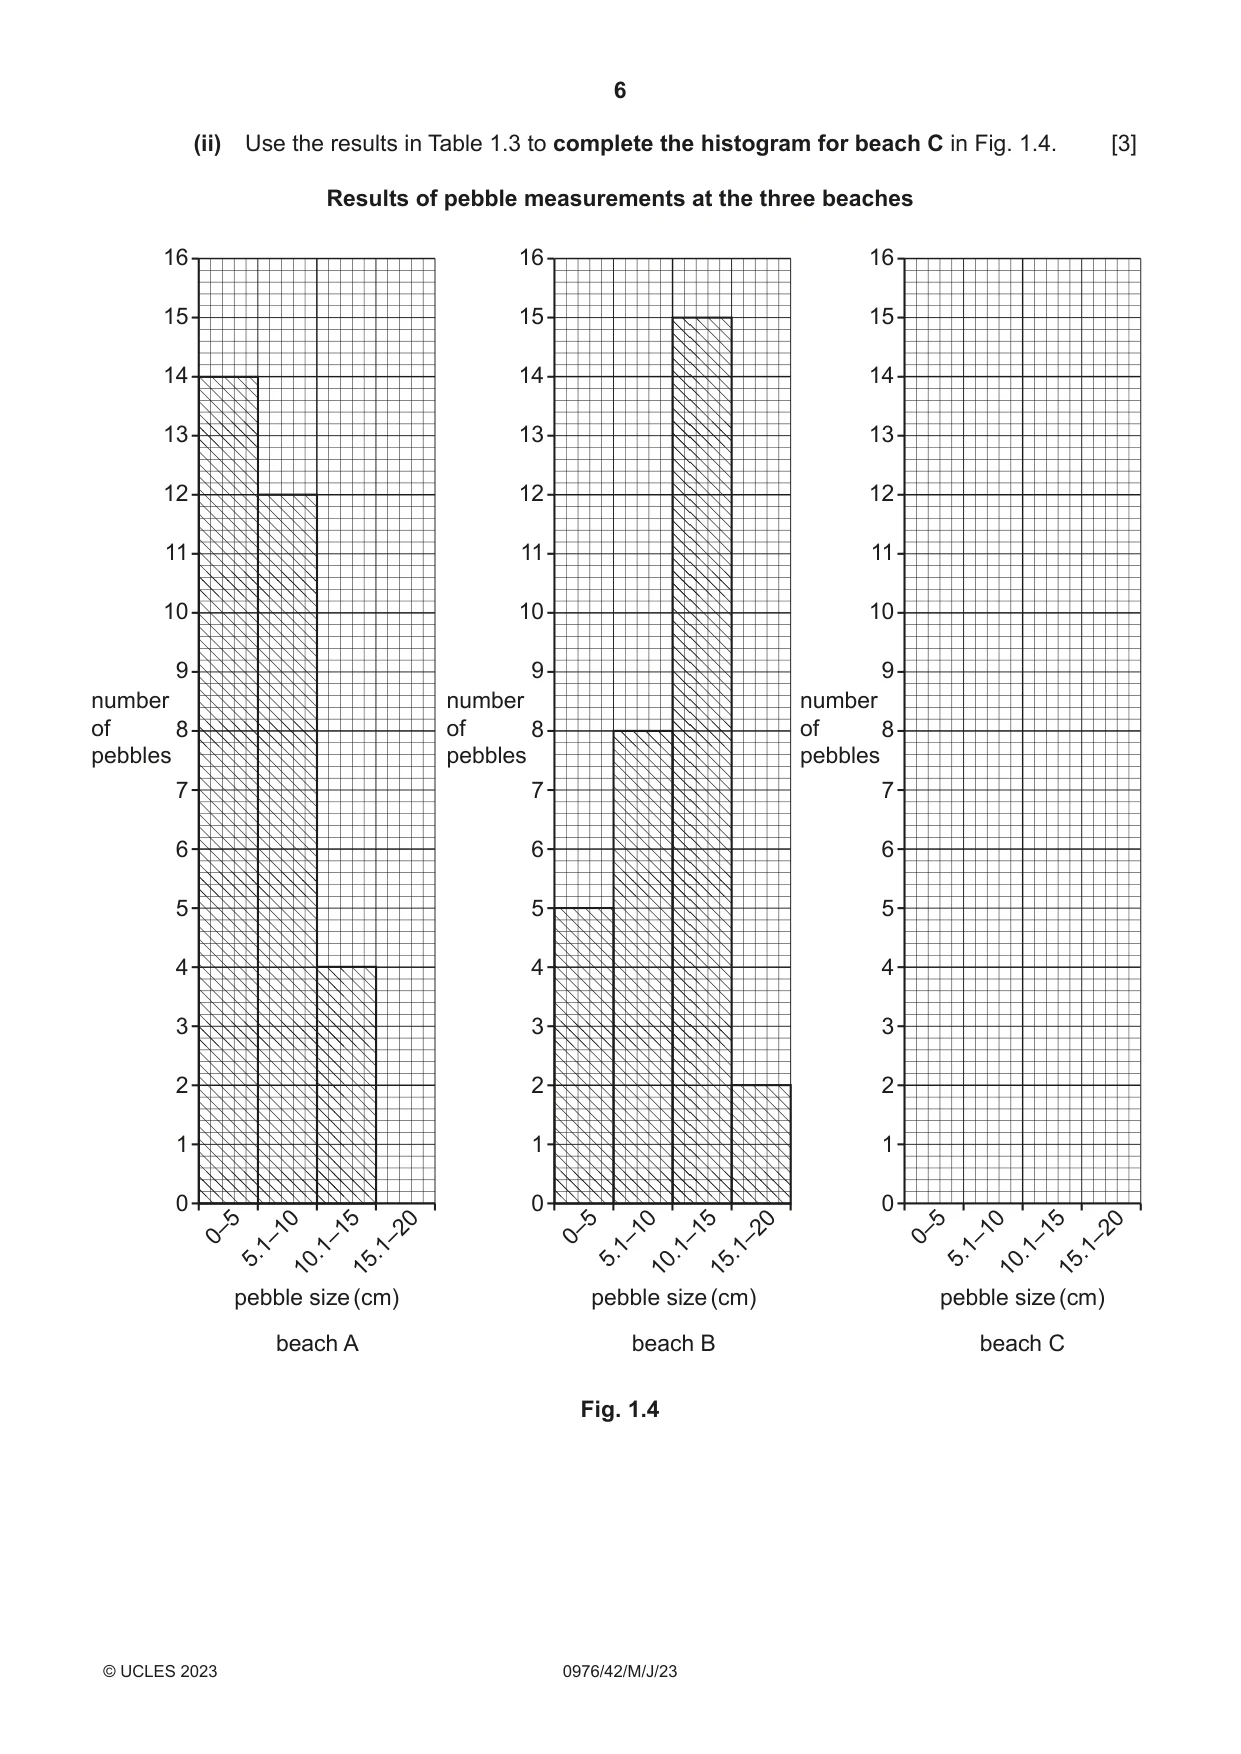
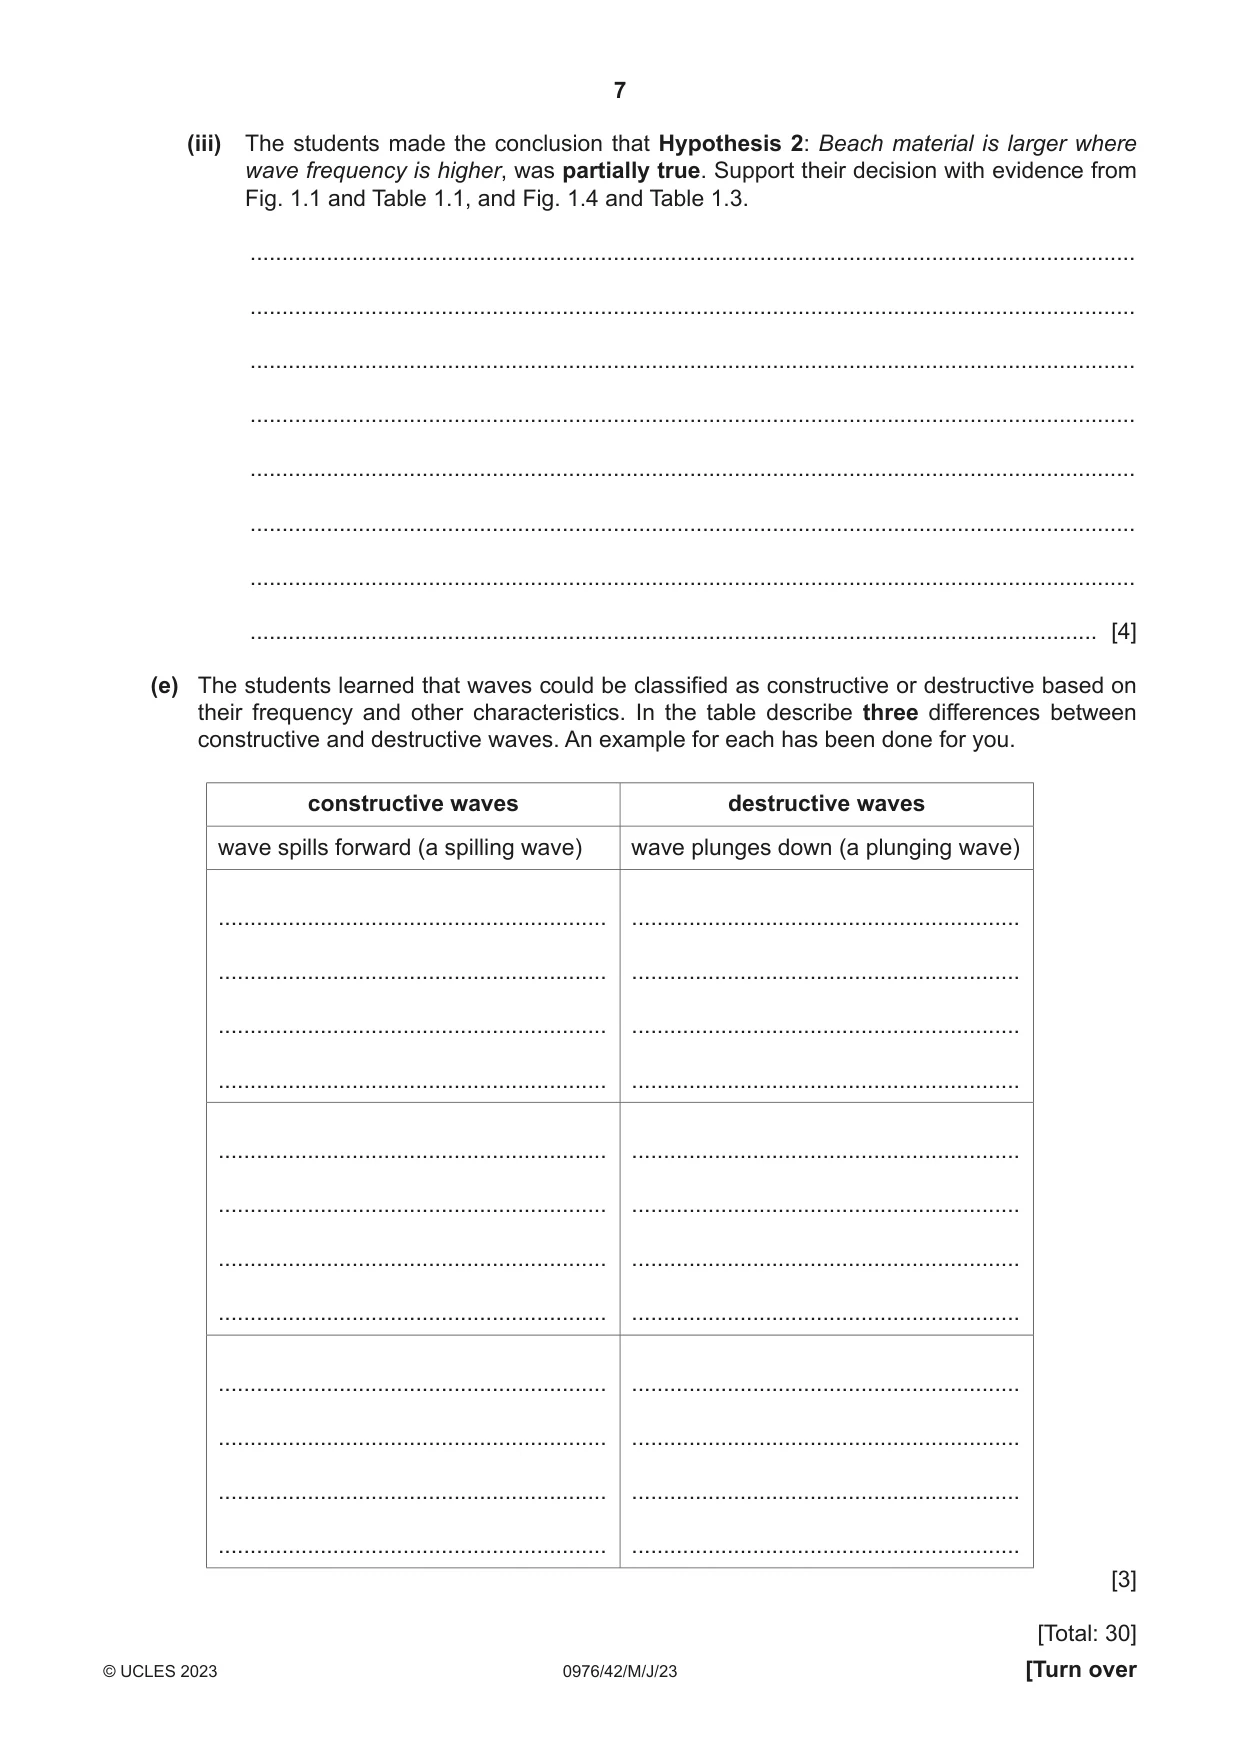
1 Students visited three beaches along the coast in their local area. They wanted to investigate wave frequency and its possible effects on beach characteristics. (a) Before they began their fieldwork, their teacher suggested how they needed to prepare so that they were safe on their visit to the beaches. Explain why the teacher made the following suggestions. Make sure that your mobile (cell) phone is charged. ................................................................................................................................................... ................................................................................................................................................... Check the weather forecast for the local area. ................................................................................................................................................... ................................................................................................................................................... Organise yourselves into groups of three. ................................................................................................................................................... ................................................................................................................................................... Check the time of day when it will be low tide. ................................................................................................................................................... ................................................................................................................................................... [4] The students investigated the following hypotheses: Hypothesis 1: The profile of the beach is steeper where wave frequency is higher. Hypothesis 2: Beach material is larger where wave frequency is higher. Wave frequency is the number of waves that break on the beach in one minute. (b) The students measured wave frequency at the three beaches. (i) Describe a fieldwork method to measure wave frequency. ........................................................................................................................................... ........................................................................................................................................... ........................................................................................................................................... ........................................................................................................................................... ........................................................................................................................................... ..................................................................................................................................... [3] (ii) The results of the students’ measurements at the three beaches are shown in Table 1.1 (Insert). Complete the graph in Fig. 1.1 to show the average wave frequency at beach C. [1] Average wave frequency 14 12 10 8 number of waves breaking per minute 6 4 2 0 beach A beach B beach C Fig. 1.1 (c) To investigate Hypothesis 1: The profile of the beach is steeper where wave frequency is higher, the students measured the profile of the three beaches. (i) Fig. 1.2 (Insert) shows the method the students used to measure each profile. Describe how the students made their measurements. ........................................................................................................................................... ........................................................................................................................................... ........................................................................................................................................... ........................................................................................................................................... ........................................................................................................................................... ........................................................................................................................................... ........................................................................................................................................... ..................................................................................................................................... [4] (ii) The results of their measurements are shown in Table 1.2 (Insert). Plot the angle of slope from site 2 to site 3 at beach A on Fig. 1.3. [1] (iii) Use the results in Table 1.2 to plot the average angle of slope at beach B on Fig. 1.3. [1] Angle of slope measurements at the three beaches 14 13 12 11 averageaverage 10 9 8 angle of 7 slope (°) 6 5 averageaverage 4 3 2 1 0 1 2 3 1 2 3 1 2 3 number of number of number of measurements measurements measurements beach A beach B beach C Fig. 1.3 (iv) What conclusion would the students make about Hypothesis 1: The profile of the beach is steeper where wave frequency is higher? Support your decision with evidence from Fig. 1.1 and Table 1.1, and Fig. 1.3 and Table 1.2. ........................................................................................................................................... ........................................................................................................................................... ........................................................................................................................................... ........................................................................................................................................... ........................................................................................................................................... ..................................................................................................................................... [3] (d) To investigate Hypothesis 2: Beach material is larger where wave frequency is higher, the students collected a sample of 30 pebbles from each beach. (i) The sizes of the pebbles collected at beach C are shown in Table 1.3 (Insert). Suggest how the students measured the size of each pebble they picked up. ........................................................................................................................................... ........................................................................................................................................... ........................................................................................................................................... ........................................................................................................................................... ........................................................................................................................................... ..................................................................................................................................... [3] (ii) Use the results in Table 1.3 to complete the histogram for beach C in Fig. 1.4. [3] Results of pebble measurements at the three beaches 16 16 16 15 15 15 14 14 14 13 13 13 12 12 12 11 11 11 10 10 10 9 9 9 number number number of 8 of 8 of 8 pebbles pebbles pebbles 7 7 7 6 6 6 5 5 5 4 4 4 3 3 3 2 2 2 1 1 1 0 0 0 0–55.1–1010.1–1515.1–20 0–55.1–1010.1–1515.1–20 0–55.1–1010.1–1515.1–20 pebble size (cm) pebble size (cm) pebble size (cm) beach A beach B beach C Fig. 1.4 (iii) The students made the conclusion that Hypothesis 2: Beach material is larger where wave frequency is higher, was partially true. Support their decision with evidence from Fig. 1.1 and Table 1.1, and Fig. 1.4 and Table 1.3. ........................................................................................................................................... ........................................................................................................................................... ........................................................................................................................................... ........................................................................................................................................... ........................................................................................................................................... ........................................................................................................................................... ........................................................................................................................................... ..................................................................................................................................... [4] (e) The students learned that waves could be classified as constructive or destructive based on their frequency and other characteristics. In the table describe three differences between constructive and destructive waves. An example for each has been done for you. constructive waves destructive waves wave spills forward (a spilling wave) wave plunges down (a plunging wave) ............................................................. ............................................................. ............................................................. ............................................................. ............................................................. ............................................................. ............................................................. ............................................................. ............................................................. ............................................................. ............................................................. ............................................................. ............................................................. ............................................................. ............................................................. ............................................................. ............................................................. ............................................................. ............................................................. ............................................................. ............................................................. ............................................................. ............................................................. ............................................................. [3] [Total: 30]
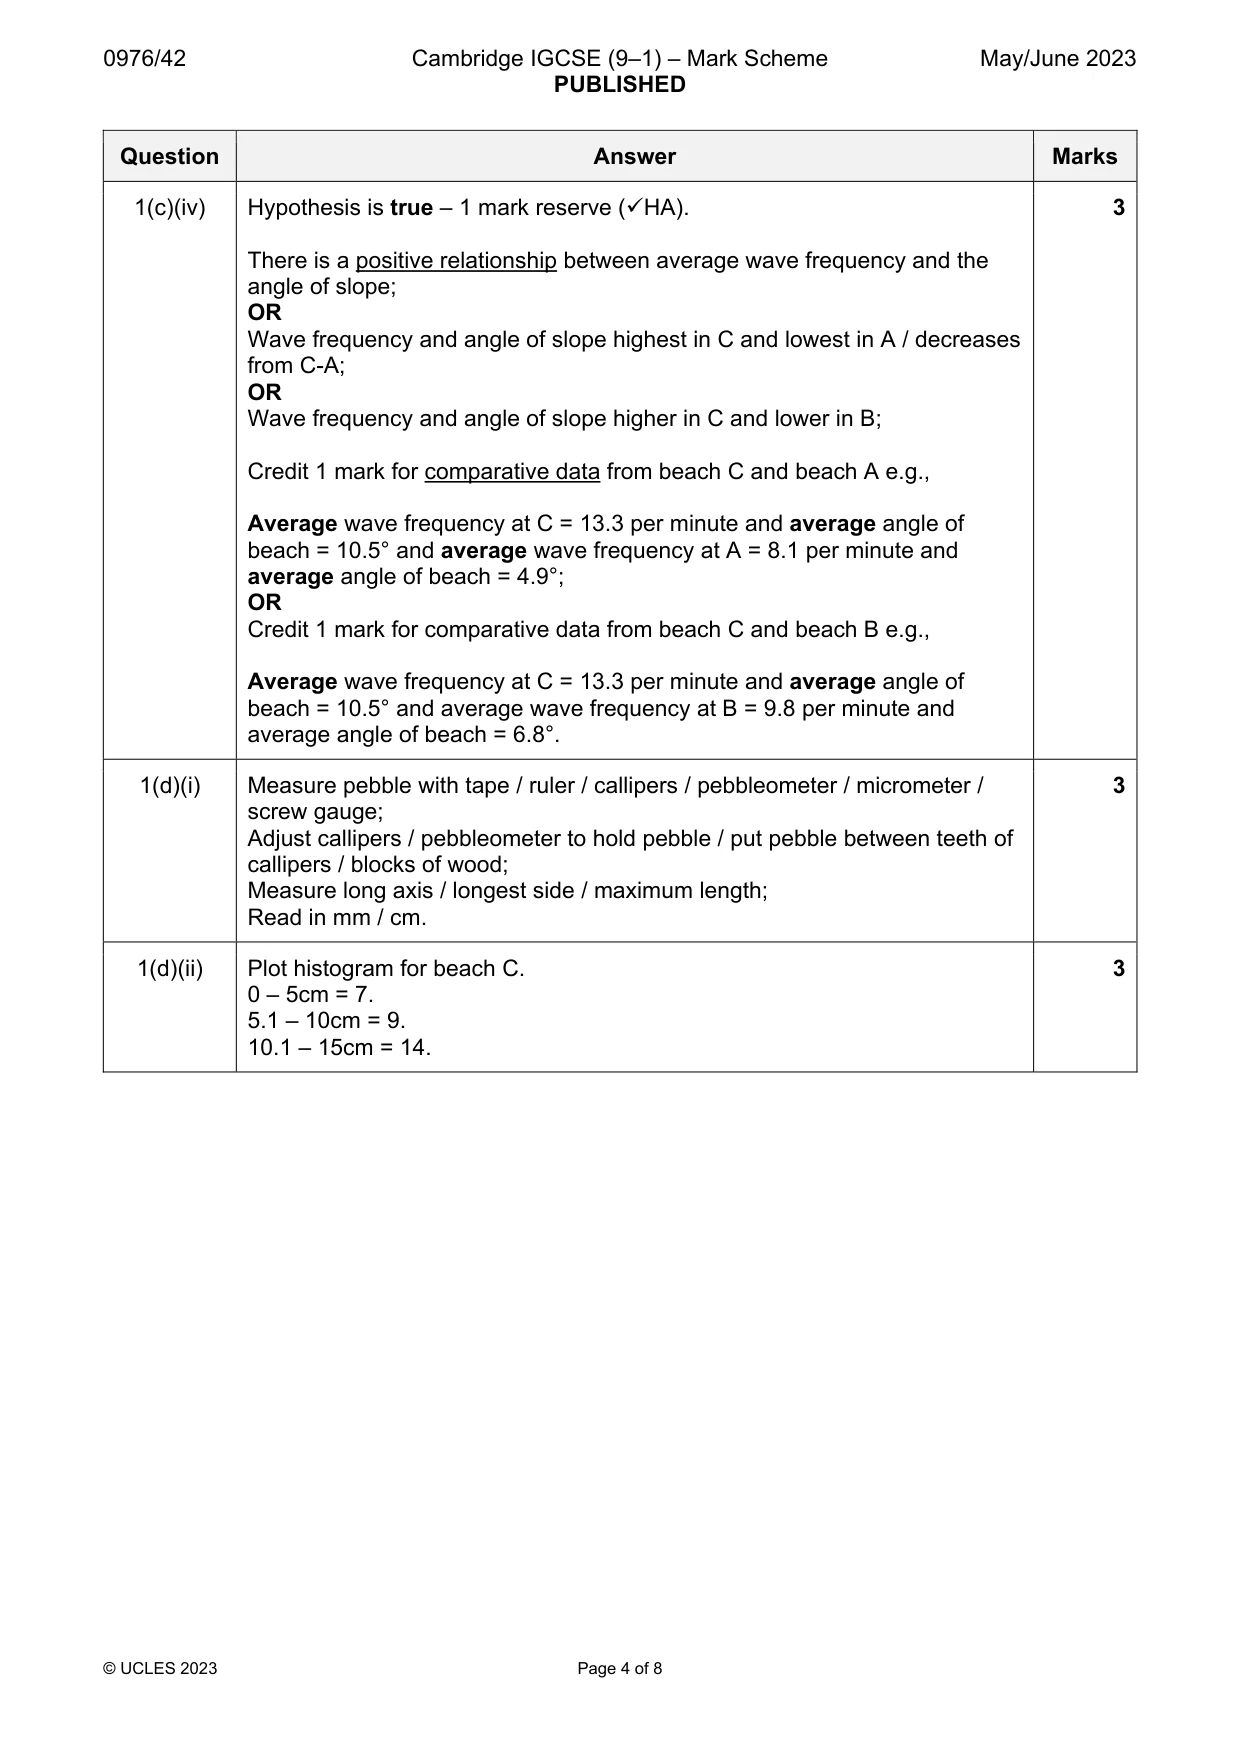
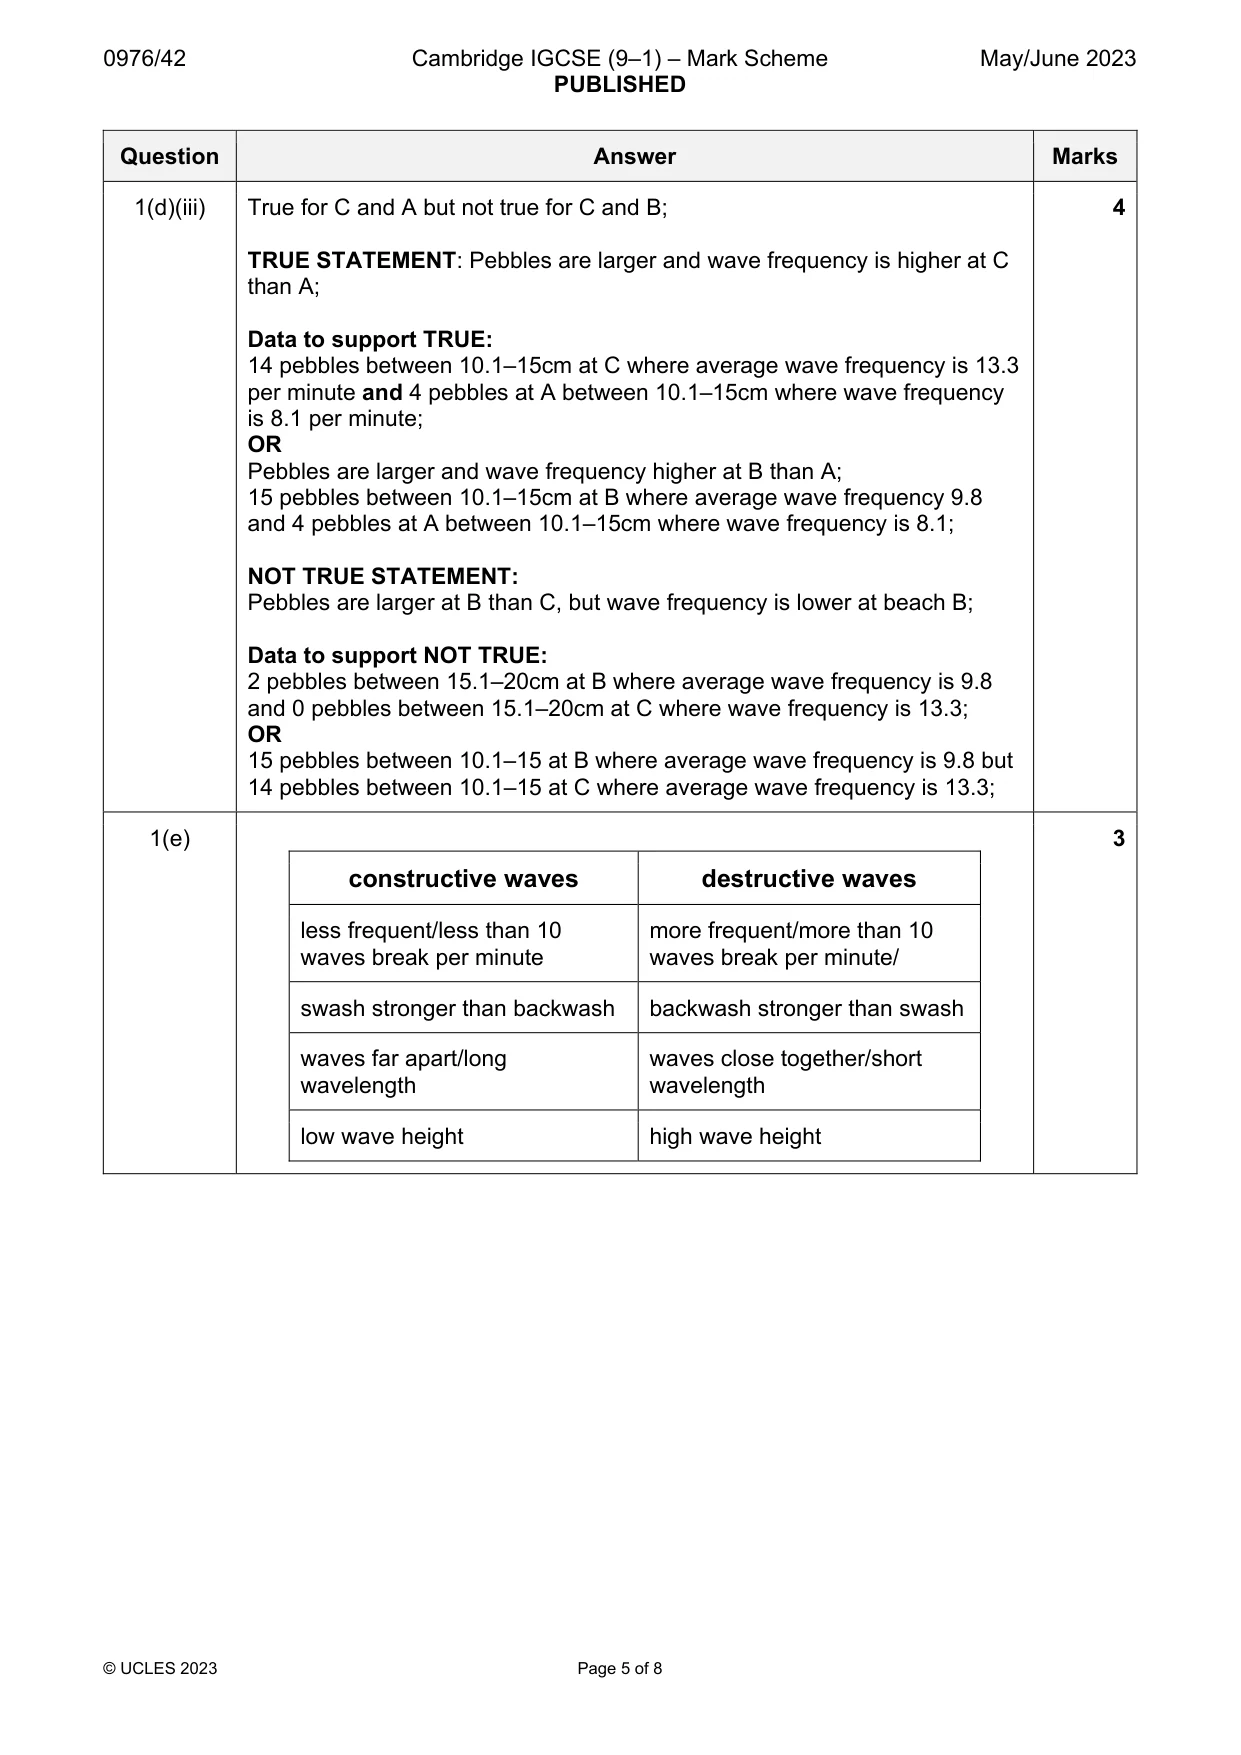
Mark scheme: Question Answer Marks 1(a) Make sure… Can communicate / call if in difficulty / call if separated or lost / 4 call in an emergency; Check the… To take appropriate / suitable / adequate clothing or example / to see if it is safe OR not dangerous to work / not to work OR postpone / reschedule if storm is forecast / take sunblock; Organise yourselves…Someone can get help if one gets into difficulty / one can stay with other while 3rd gets help; Check the… See when the sea would be safe to take measurements/ not get cut off by the tide / less dangerous at low tide / dangerous at high tide / avoid risk of drowning. 1(b)(i) Pick a rock / pole on beach / stand in sea / put pole in sea / put float in sea / 3 mark line on beach; Count number of waves breaking / hitting pole / passing person / crossing line OR count float going up & down; Use watch / stopwatch to time 1-5 minutes / fixed period of time; Repeat count / count for more time & calculate /work out average. 1(b)(ii) Draw bar for beach C at 13.3. 1 1(c)(i) Create transect line / measure from low water mark to back of beach /up the 4 beach; Put ranging poles at breaks of slope; Measure distance between poles / breaks of slope; Ranging poles are vertical; Ranging poles rest on surface / equal depth into beach material; Put string / rope / tape at same height between poles; Hold clinometer next to top / at agreed height on lowest ranging pole; Sight other ranging pole at top /agreed height /same height /along string; Read / measure angle / degrees with clinometer; Repeat up beach / move poles up beach / along profile to next site / break of slope. 1(c)(ii) Plot angle of slope at beach A – 9° above 1 measurement. 1 1(c)(iii) Plot average angle at beach B – 6.8°. 1 1(c)(iv) Hypothesis is true – 1 mark reserve (HA). 3 There is a positive relationship between average wave frequency and the angle of slope; OR Wave frequency and angle of slope highest in C and lowest in A / decreases from C-A; OR Wave frequency and angle of slope higher in C and lower in B; Credit 1 mark for comparative data from beach C and beach A e.g., Average wave frequency at C = 13.3 per minute and average angle of beach = 10.5° and average wave frequency at A = 8.1 per minute and average angle of beach = 4.9°; OR Credit 1 mark for comparative data from beach C and beach B e.g., Average wave frequency at C = 13.3 per minute and average angle of beach = 10.5° and average wave frequency at B = 9.8 per minute and average angle of beach = 6.8°. 1(d)(i) Measure pebble with tape / ruler / callipers / pebbleometer / micrometer / 3 screw gauge; Adjust callipers / pebbleometer to hold pebble / put pebble between teeth of callipers / blocks of wood; Measure long axis / longest side / maximum length; Read in mm / cm. 1(d)(ii) Plot histogram for beach C. 3 0 – 5cm = 7. 5.1 – 10cm = 9. 10.1 – 15cm = 14. 1(d)(iii) True for C and A but not true for C and B; 4 TRUE STATEMENT: Pebbles are larger and wave frequency is higher at C than A; Data to support TRUE: 14 pebbles between 10.1–15cm at C where average wave frequency is 13.3 per minute and 4 pebbles at A between 10.1–15cm where wave frequency is 8.1 per minute; OR Pebbles are larger and wave frequency higher at B than A; 15 pebbles between 10.1–15cm at B where average wave frequency 9.8 and 4 pebbles at A between 10.1–15cm where wave frequency is 8.1; NOT TRUE STATEMENT: Pebbles are larger at B than C, but wave frequency is lower at beach B; Data to support NOT TRUE: 2 pebbles between 15.1–20cm at B where average wave frequency is 9.8 and 0 pebbles between 15.1–20cm at C where wave frequency is 13.3; OR 15 pebbles between 10.1–15 at B where average wave frequency is 9.8 but 14 pebbles between 10.1–15 at C where average wave frequency is 13.3; 1(e) 3 constructive waves destructive waves less frequent/less than 10 more frequent/more than 10 waves break per minute waves break per minute/ swash stronger than backwash backwash stronger than swash waves far apart/long waves close together/short wavelength wavelength low wave height high wave height
Q2 · A student from the city of Biratnāgar in Nepal (an LEDC) visited the village of Chamaita…
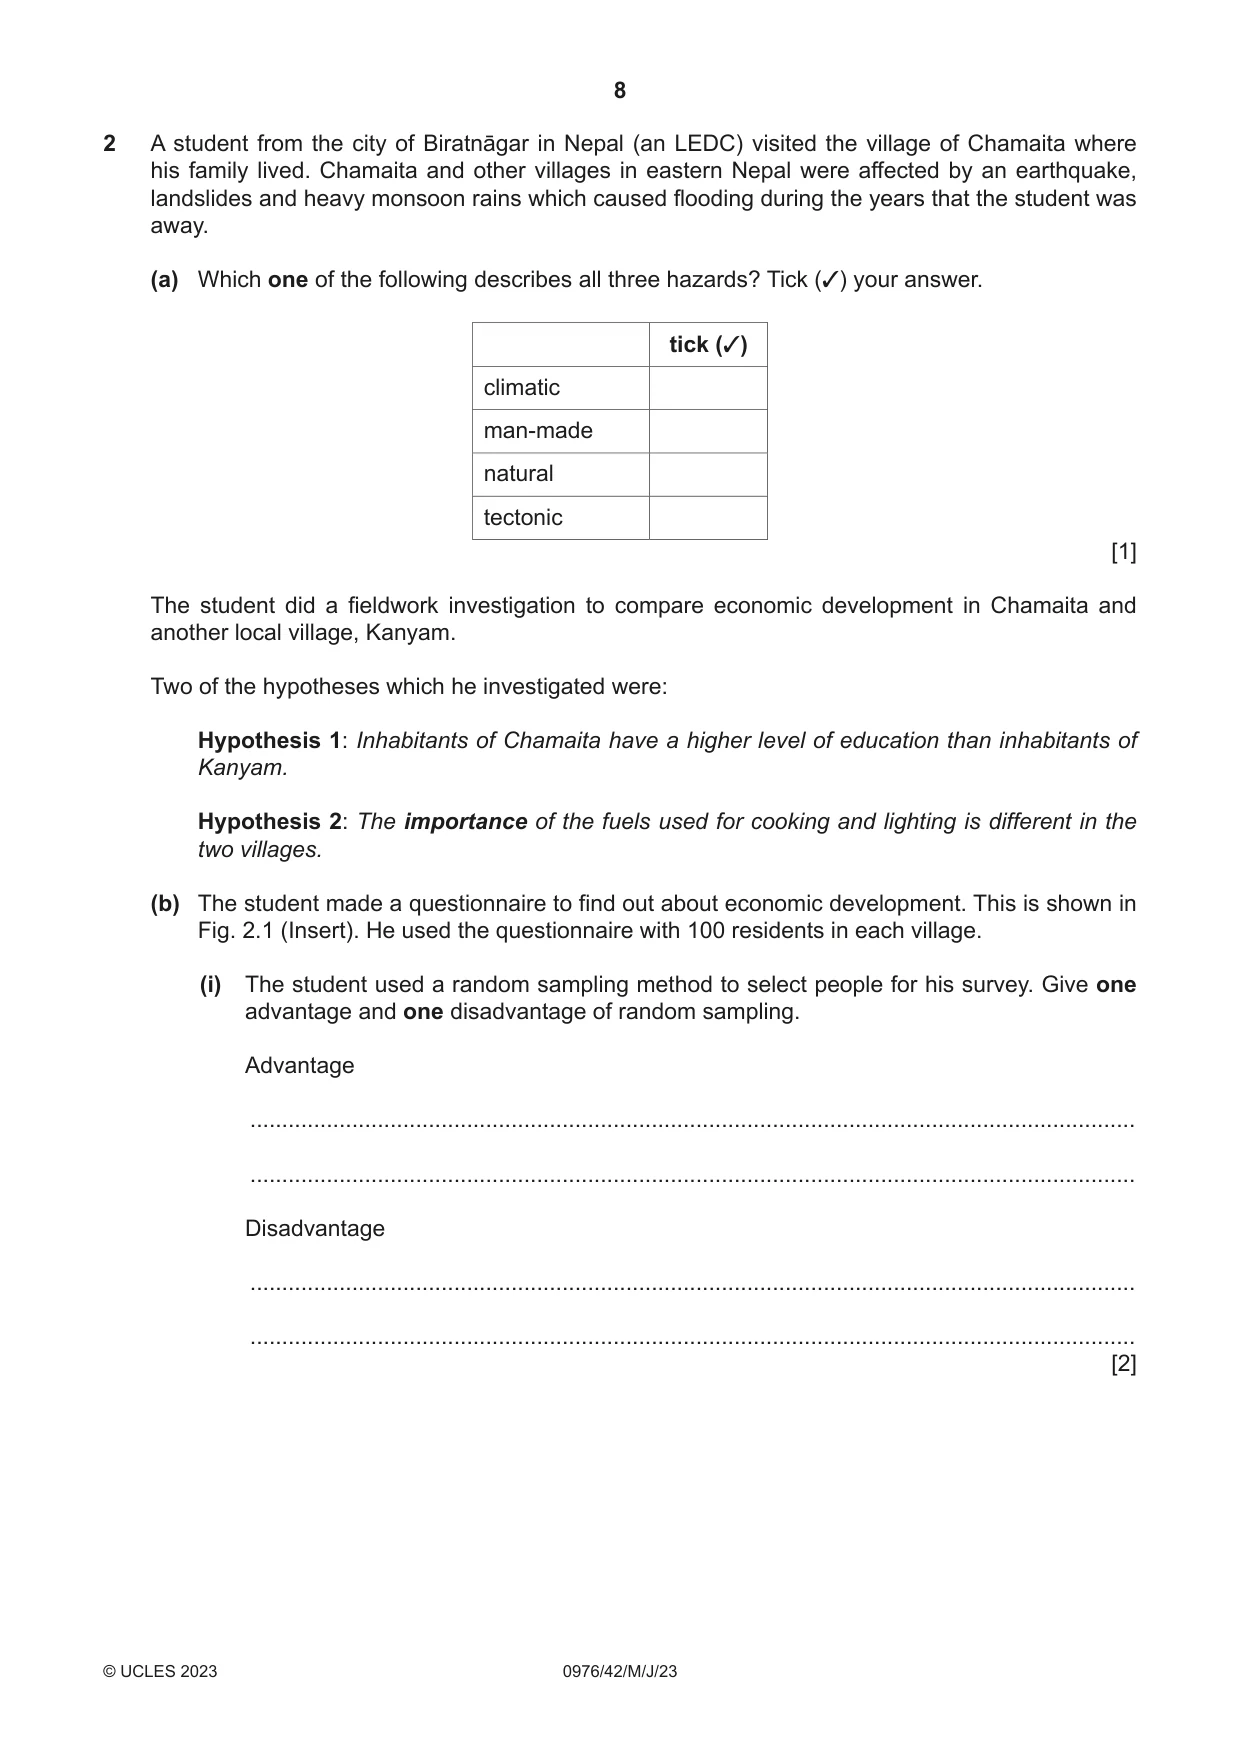
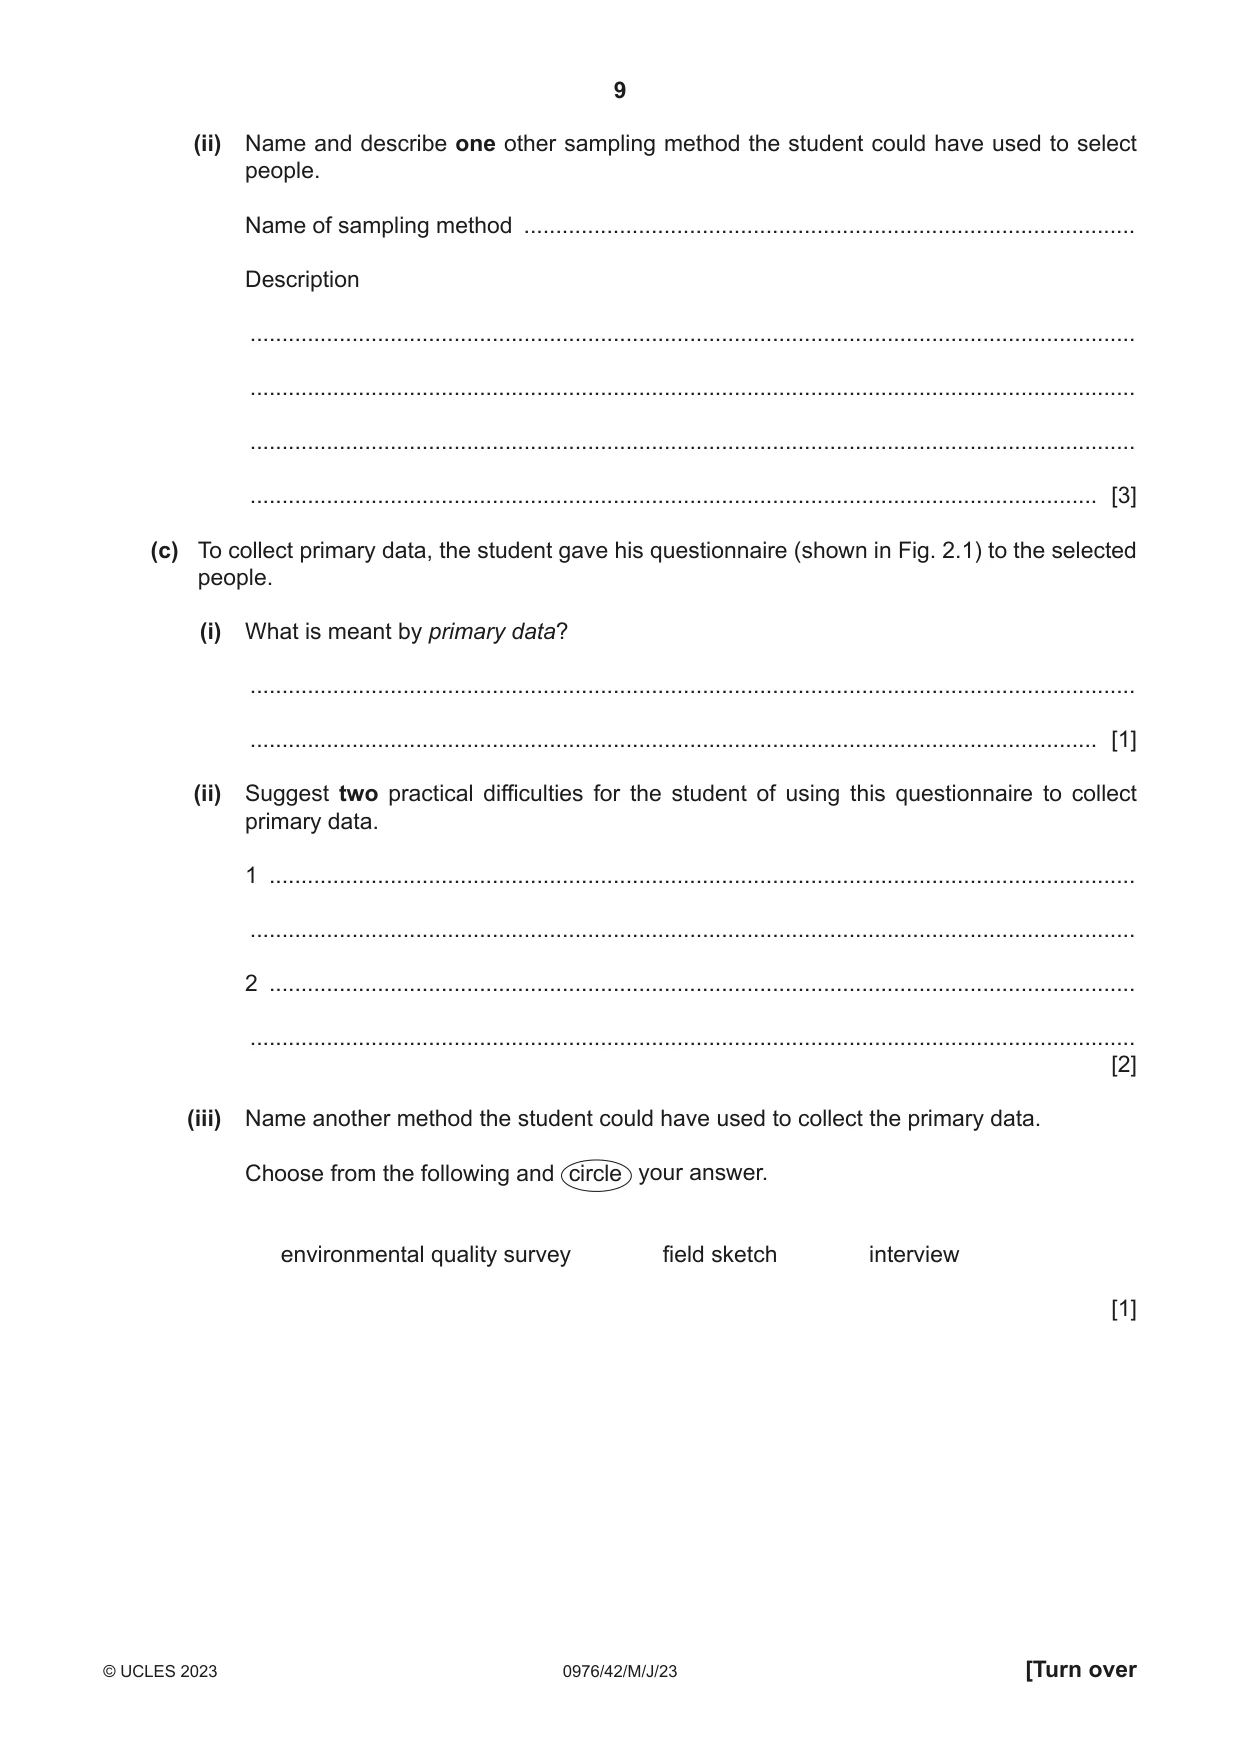
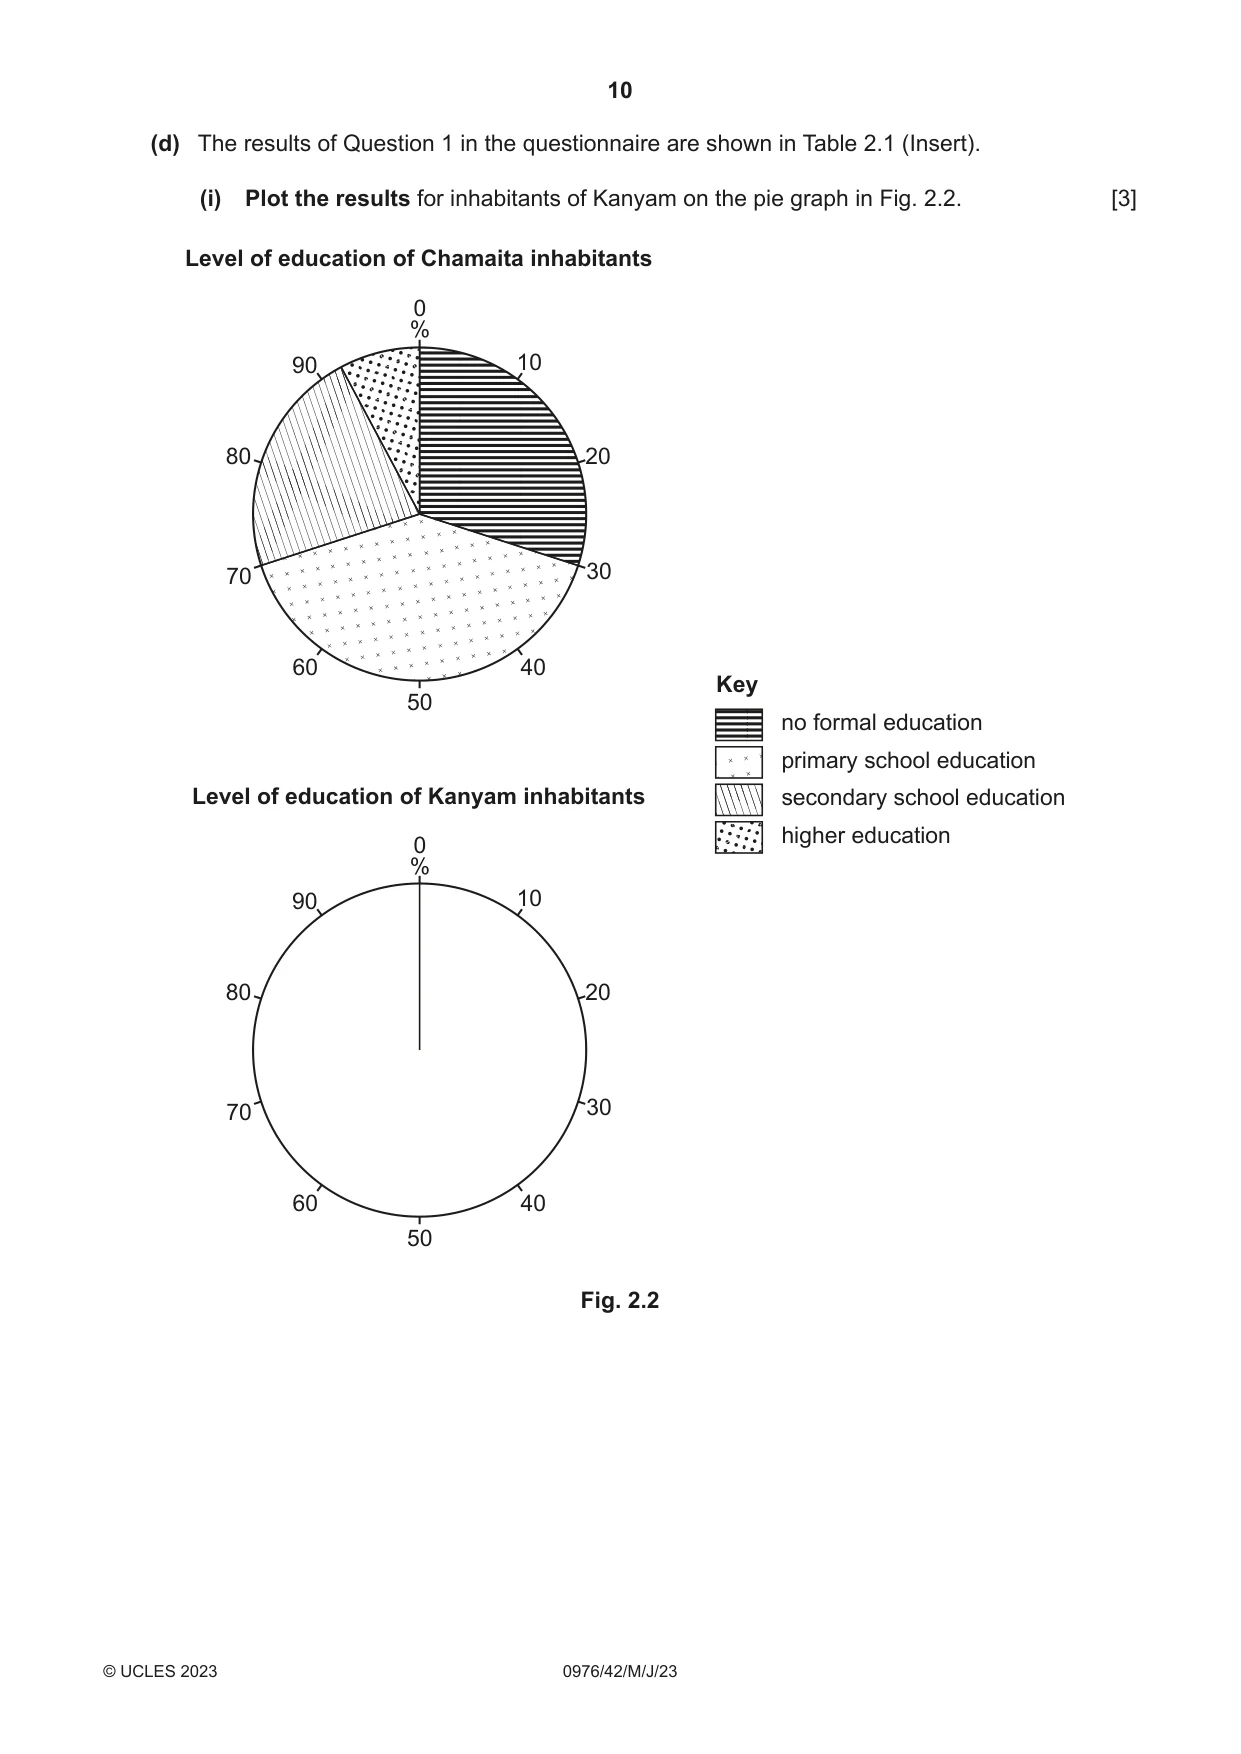
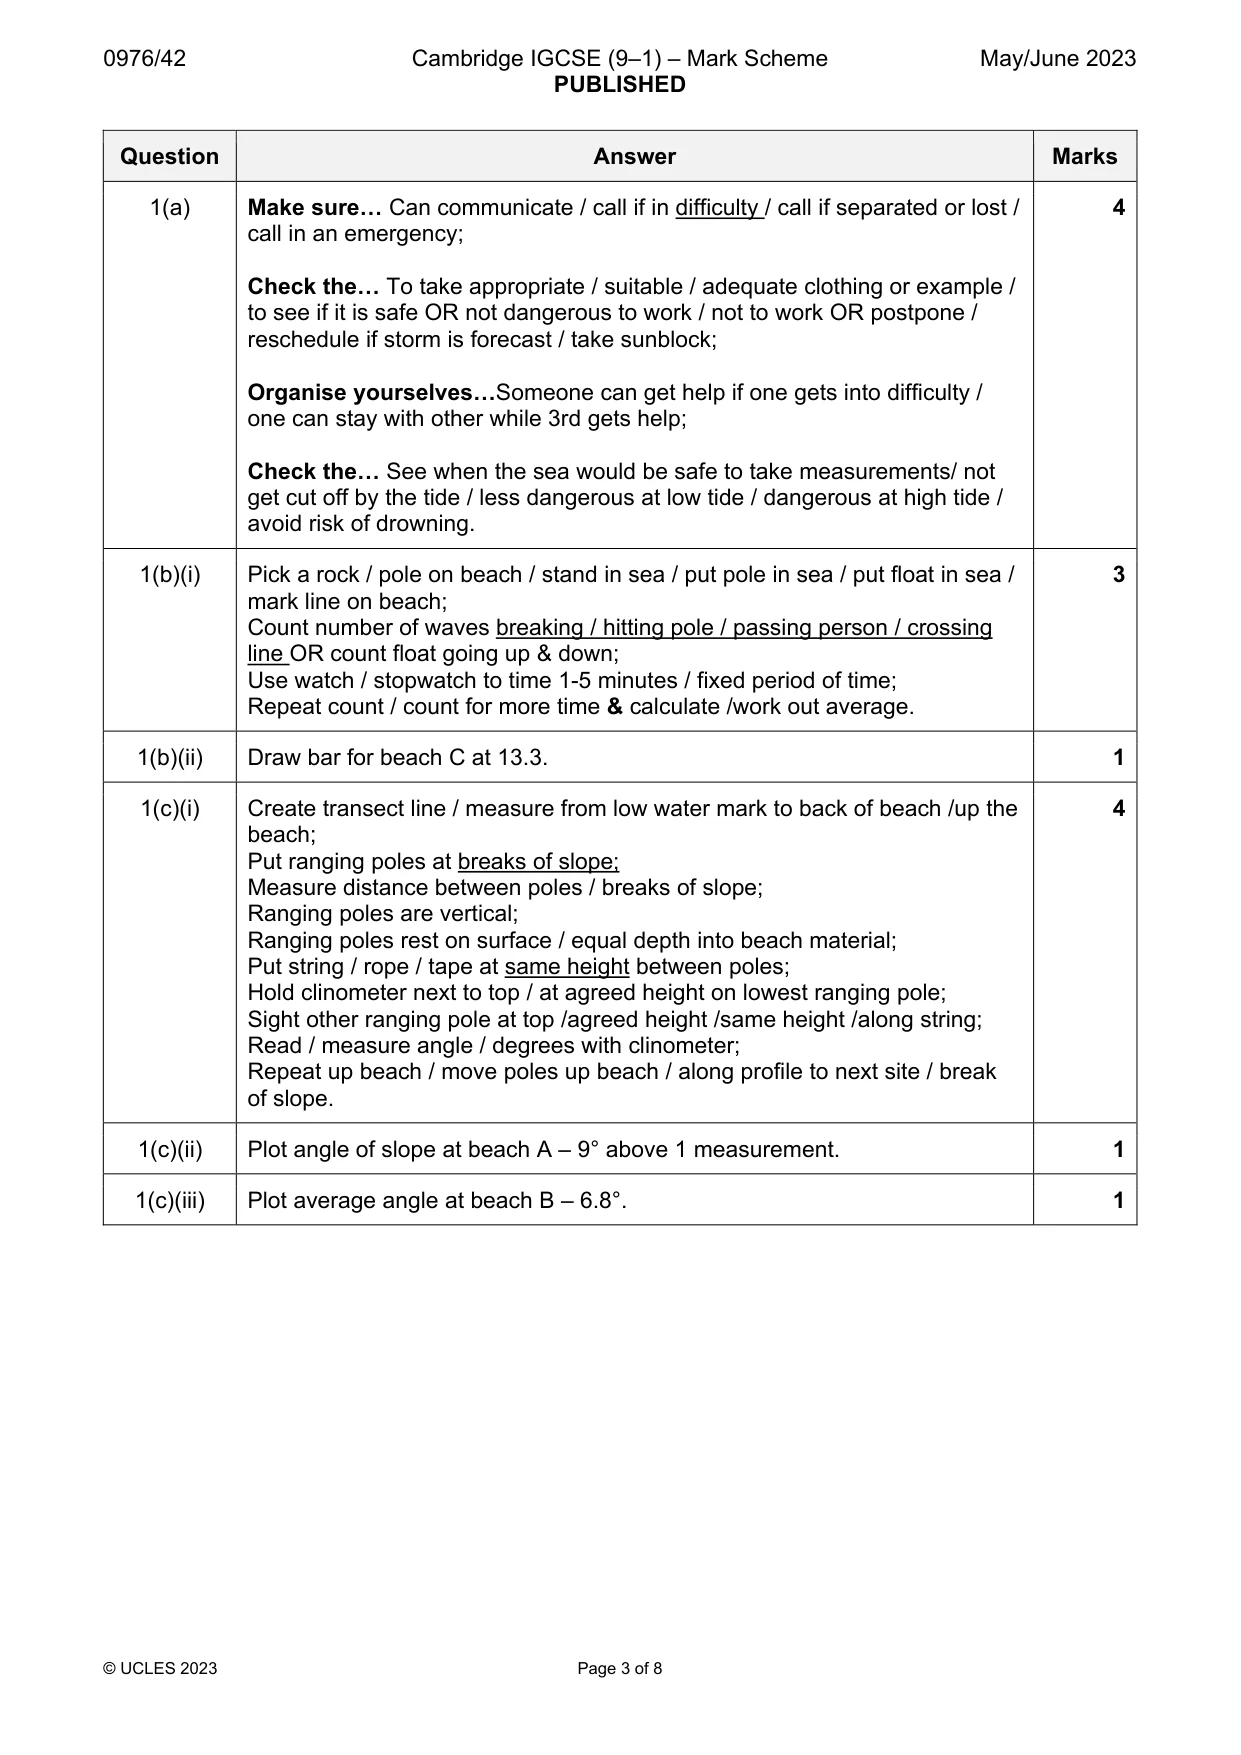
2 A student from the city of Biratnāgar in Nepal (an LEDC) visited the village of Chamaita where his family lived. Chamaita and other villages in eastern Nepal were affected by an earthquake, landslides and heavy monsoon rains which caused flooding during the years that the student was away. (a) Which one of the following describes all three hazards? Tick (3) your answer. tick (3) climatic man-made natural tectonic [1] The student did a fieldwork investigation to compare economic development in Chamaita and another local village, Kanyam. Two of the hypotheses which he investigated were: Hypothesis 1: Inhabitants of Chamaita have a higher level of education than inhabitants of Kanyam. Hypothesis 2: The importance of the fuels used for cooking and lighting is different in the two villages. (b) The student made a questionnaire to find out about economic development. This is shown in Fig. 2.1 (Insert). He used the questionnaire with 100 residents in each village. (i) The student used a random sampling method to select people for his survey. Give one advantage and one disadvantage of random sampling. Advantage ........................................................................................................................................... ........................................................................................................................................... Disadvantage ........................................................................................................................................... ........................................................................................................................................... [2] (ii) Name and describe one other sampling method the student could have used to select people. Name of sampling method ................................................................................................ Description ........................................................................................................................................... ........................................................................................................................................... ........................................................................................................................................... ..................................................................................................................................... [3] (c) To collect primary data, the student gave his questionnaire (shown in Fig. 2.1) to the selected people. (i) What is meant by primary data? ........................................................................................................................................... ..................................................................................................................................... [1] (ii) Suggest two practical difficulties for the student of using this questionnaire to collect primary data. 1 ........................................................................................................................................ ........................................................................................................................................... 2 ........................................................................................................................................ ........................................................................................................................................... [2] (iii) Name another method the student could have used to collect the primary data. Choose from the following and circle your answer. environmental quality survey field sketch interview [1] (d) The results of Question 1 in the questionnaire are shown in Table 2.1 (Insert). (i) Plot the results for inhabitants of Kanyam on the pie graph in Fig. 2.2. [3] Level of education of Chamaita inhabitants 0 % 90 10 80 20 70 30 60 40 Key 50 no formal education primary school education Level of education of Kanyam inhabitants secondary school education higher education 0 % 90 10 80 20 70 30 60 40 50 Fig. 2.2
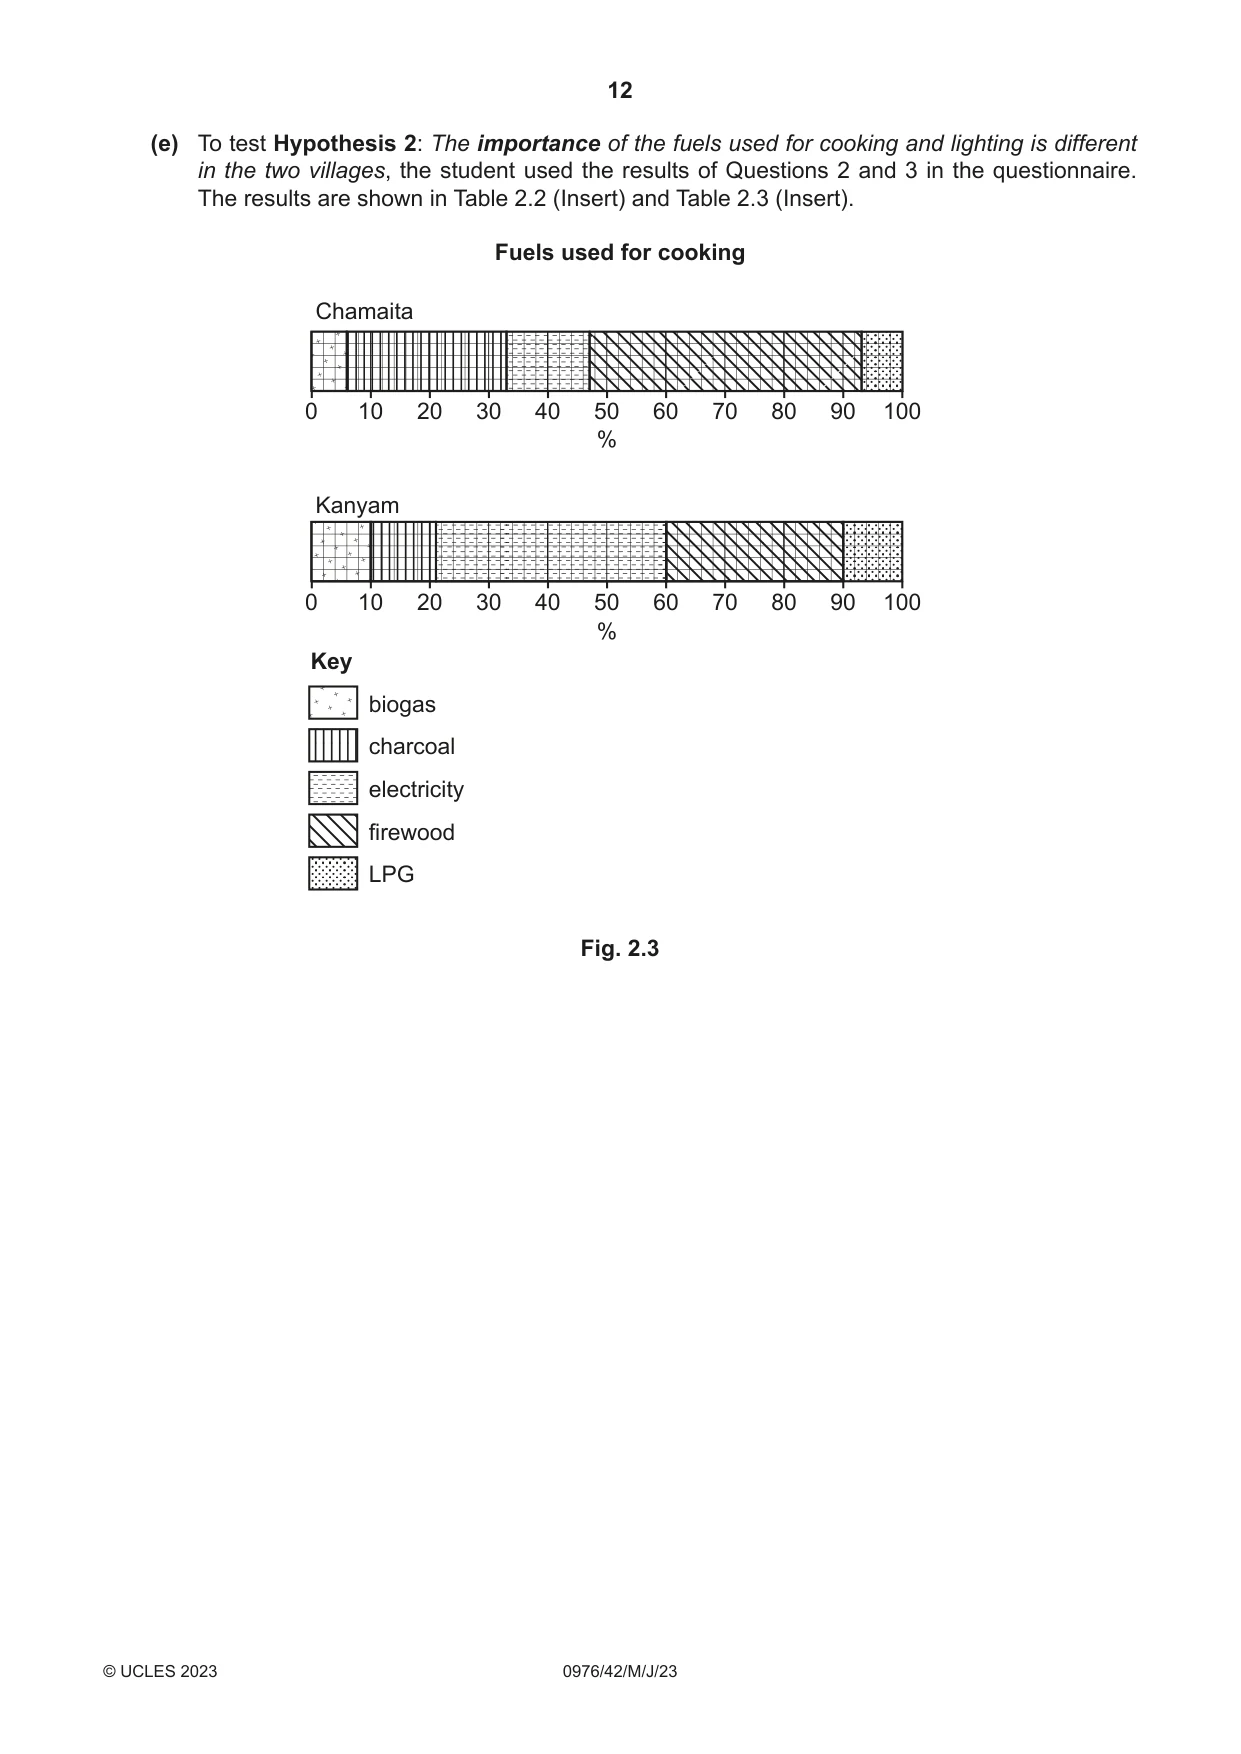
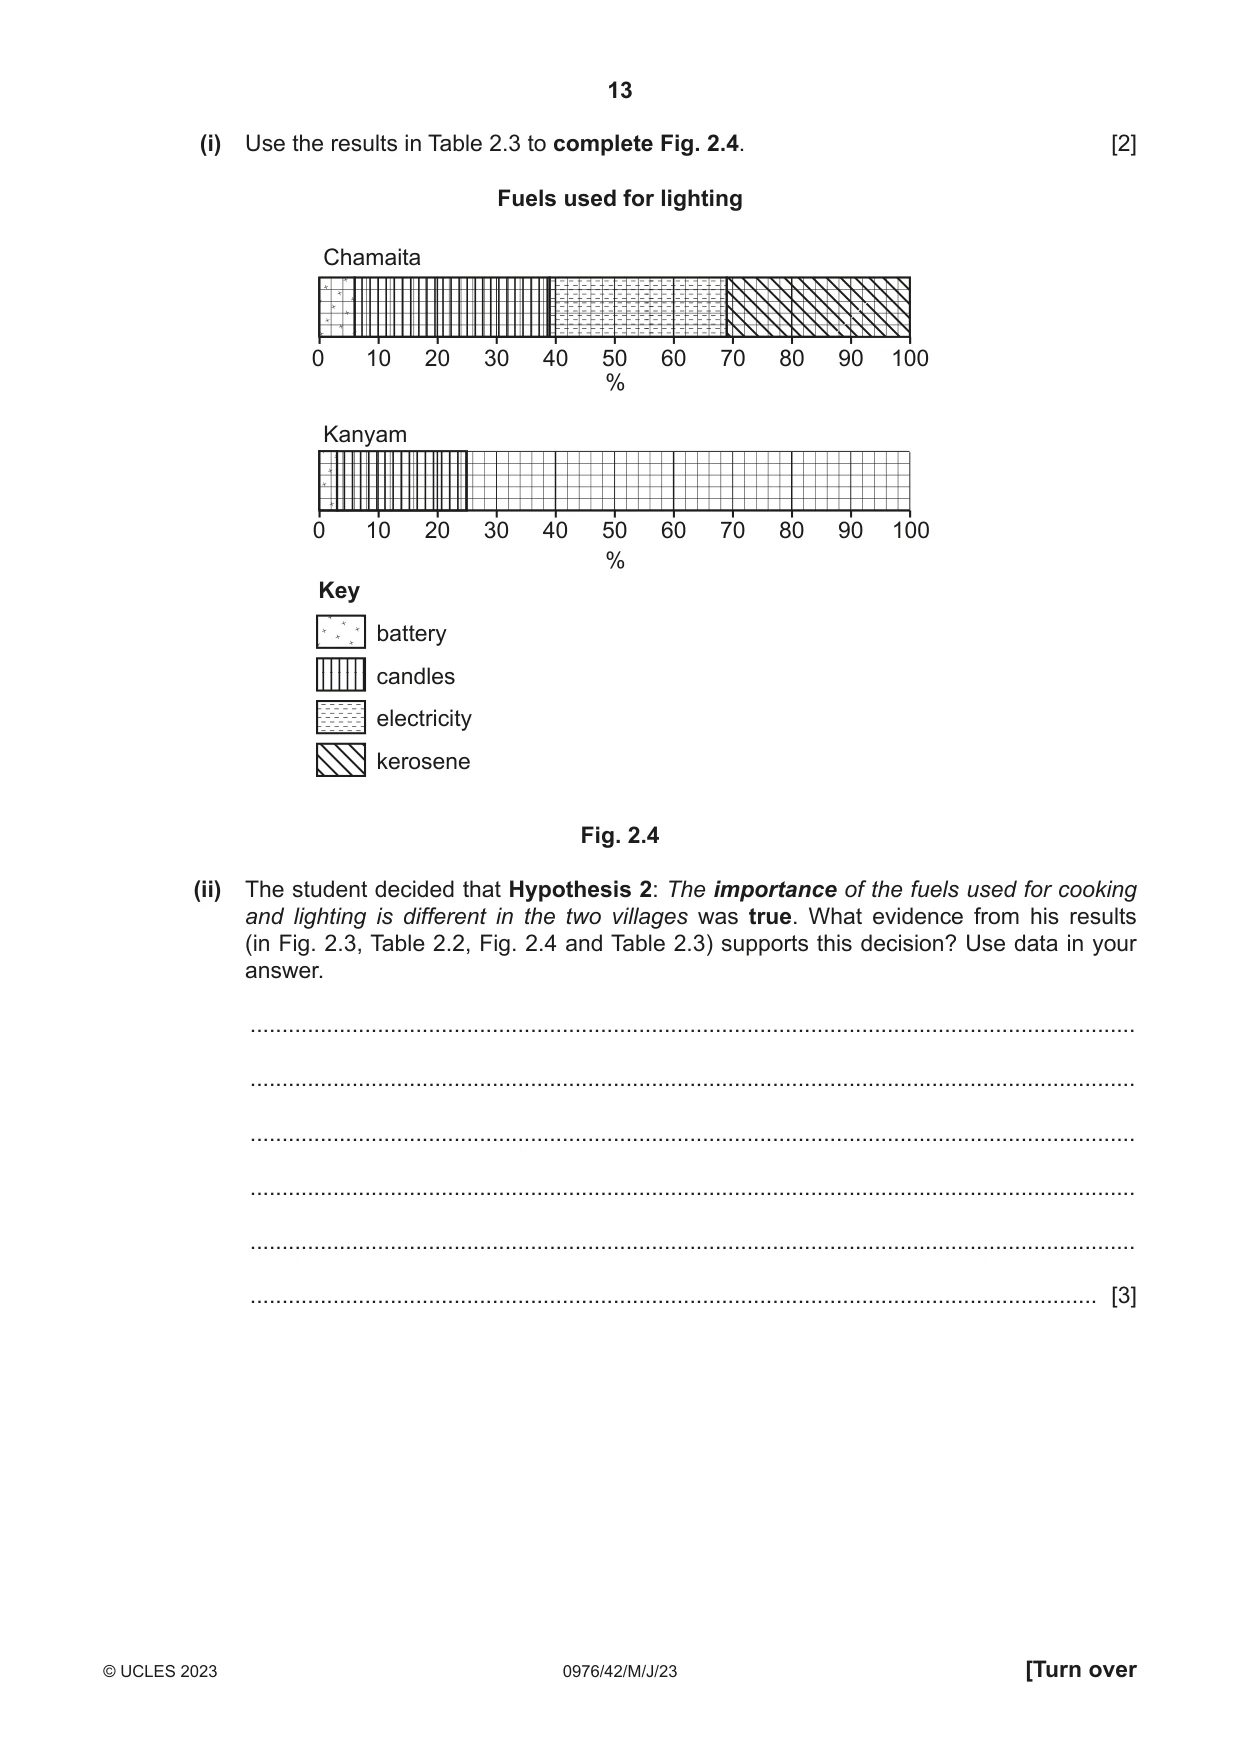
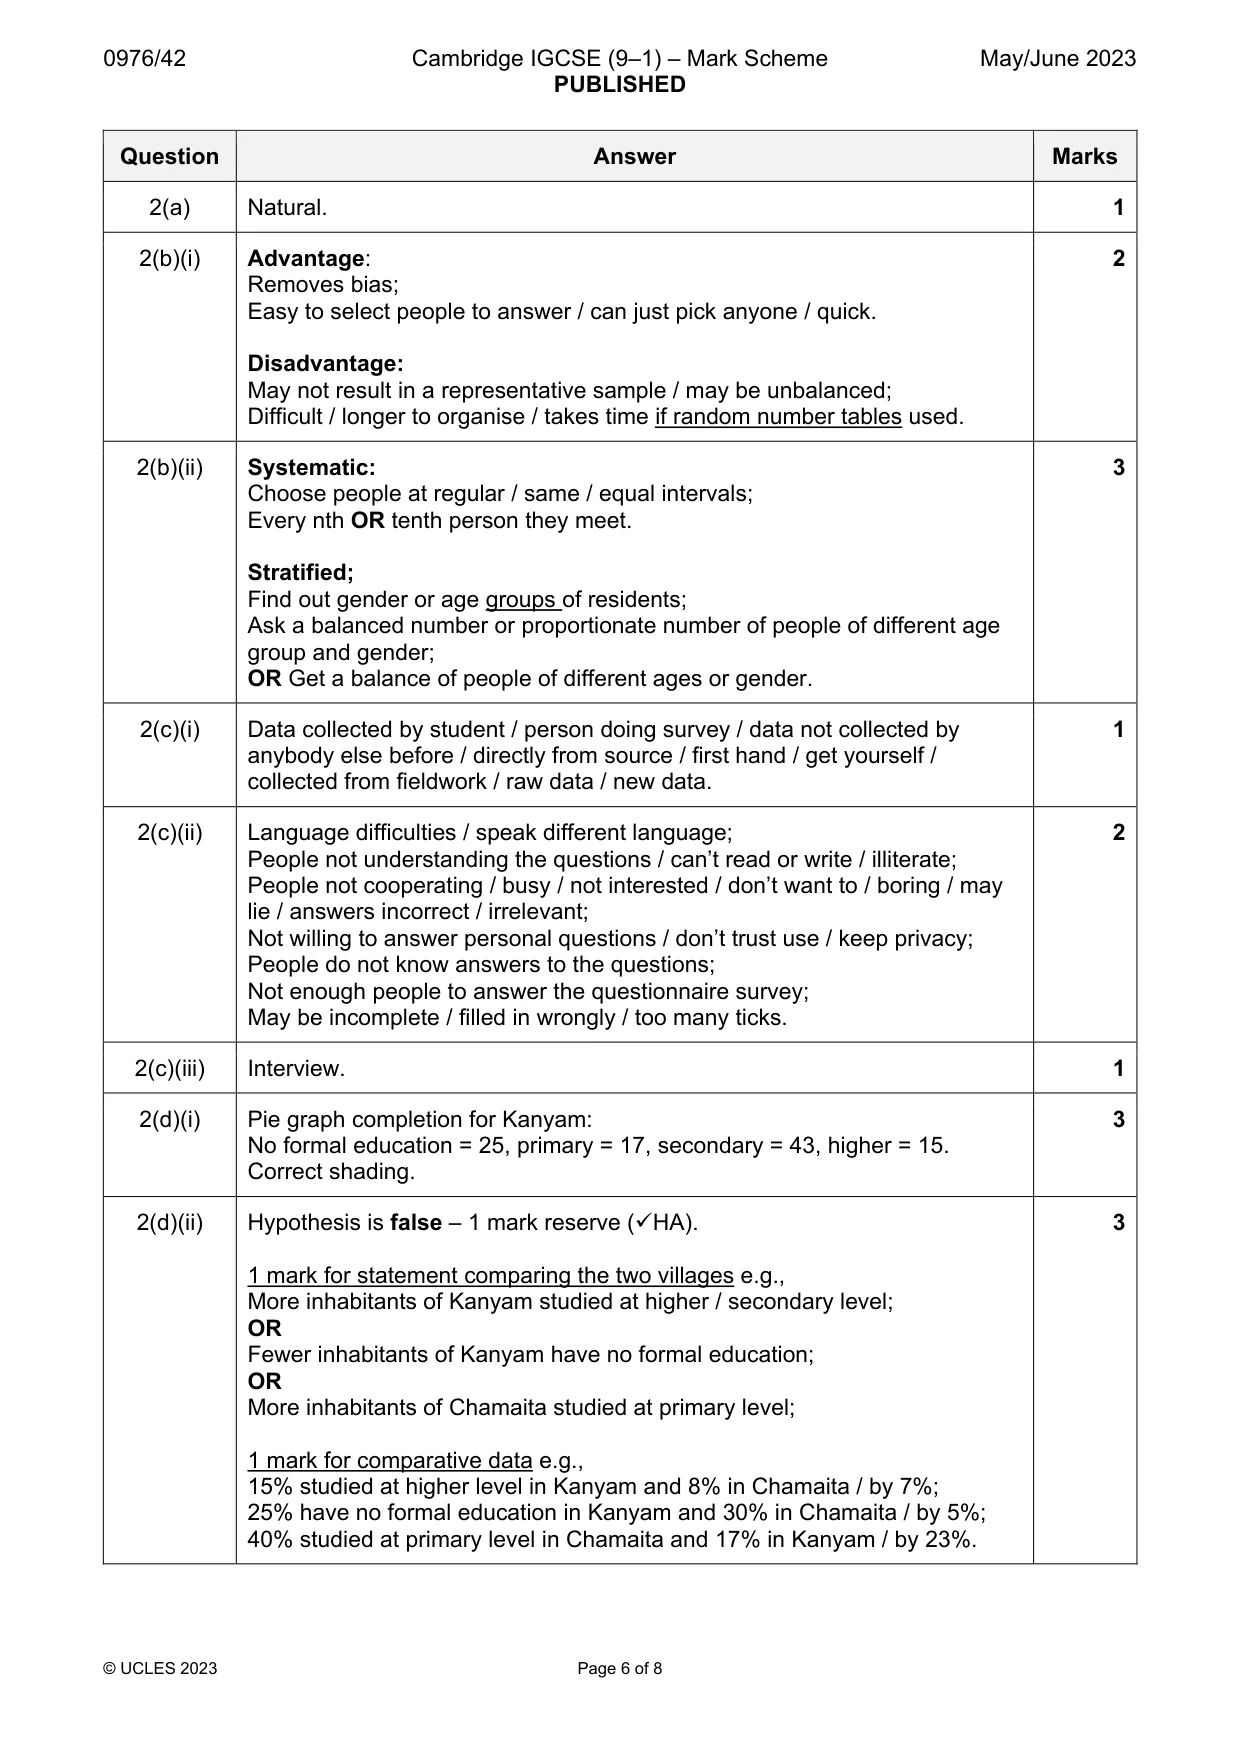
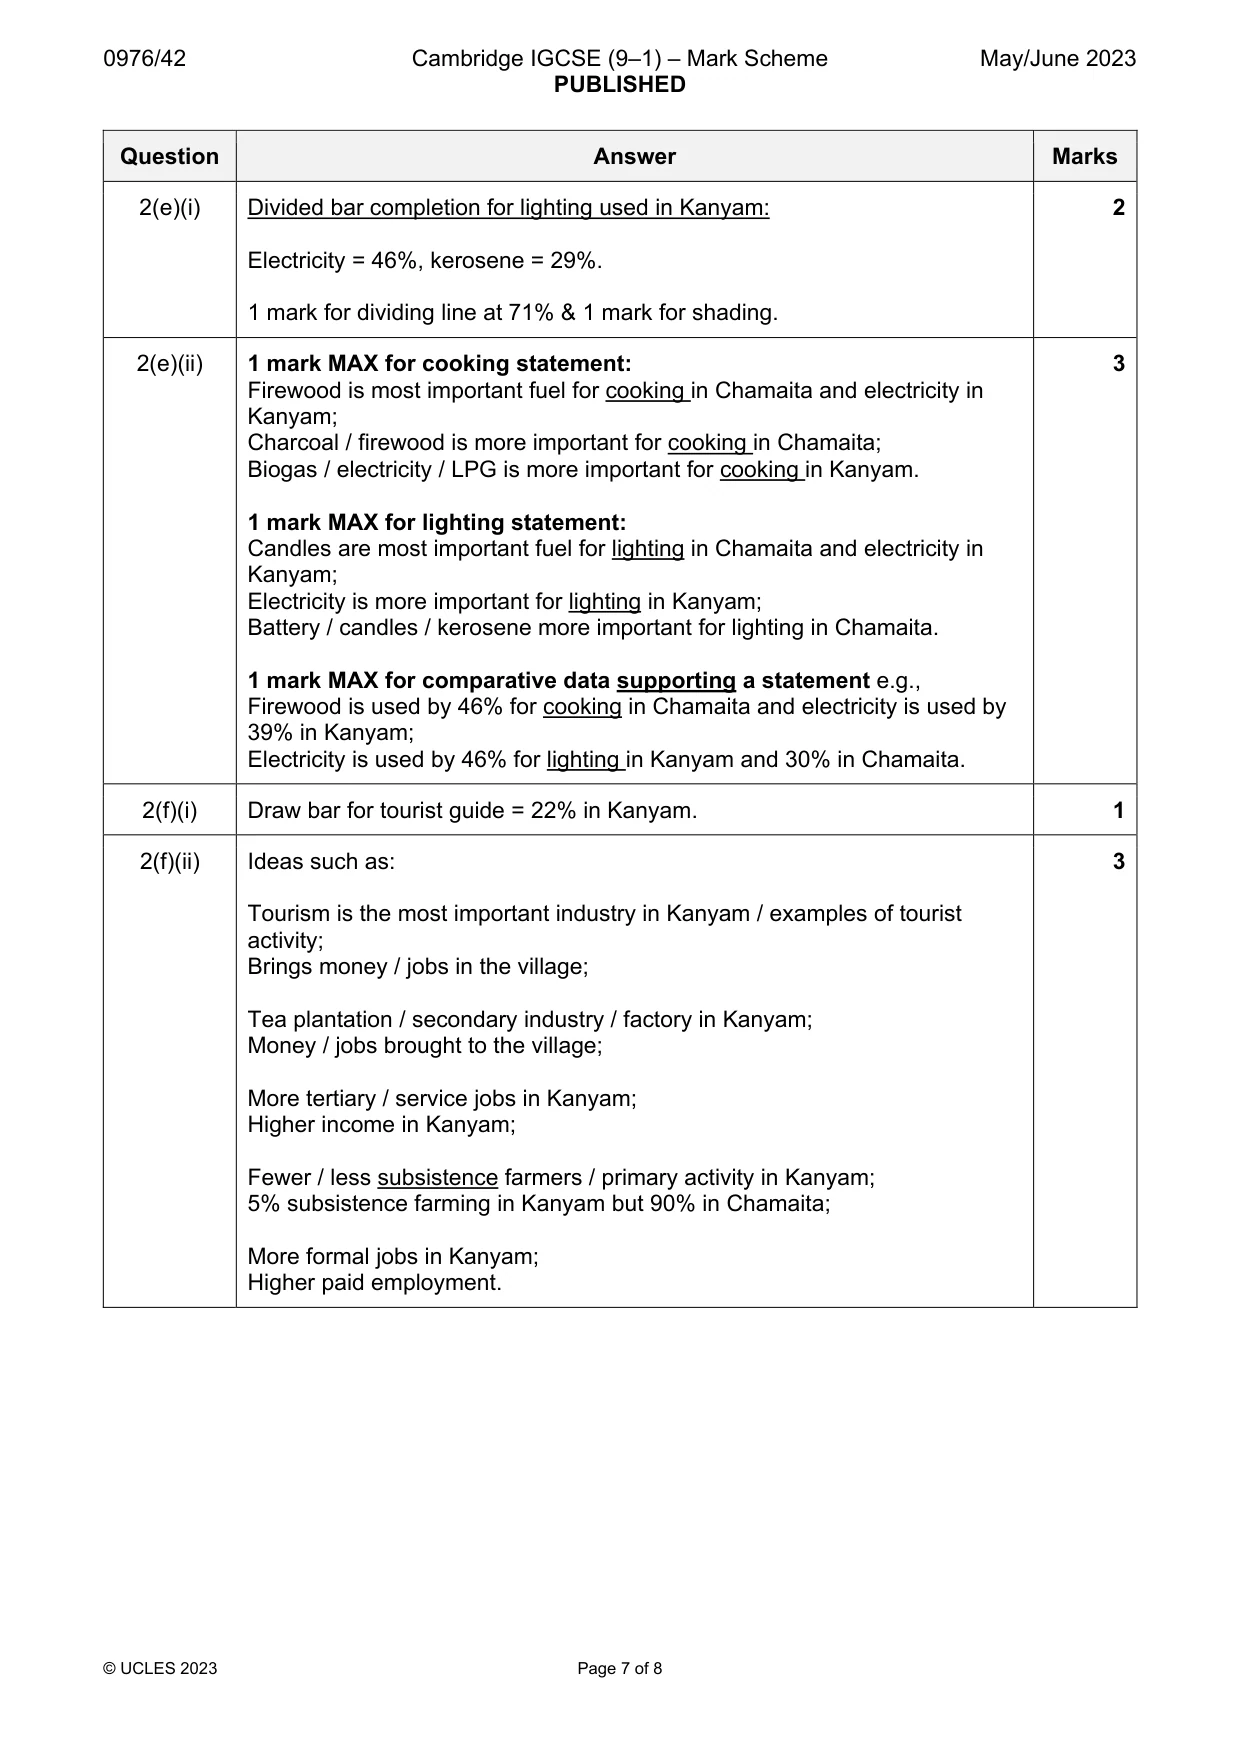
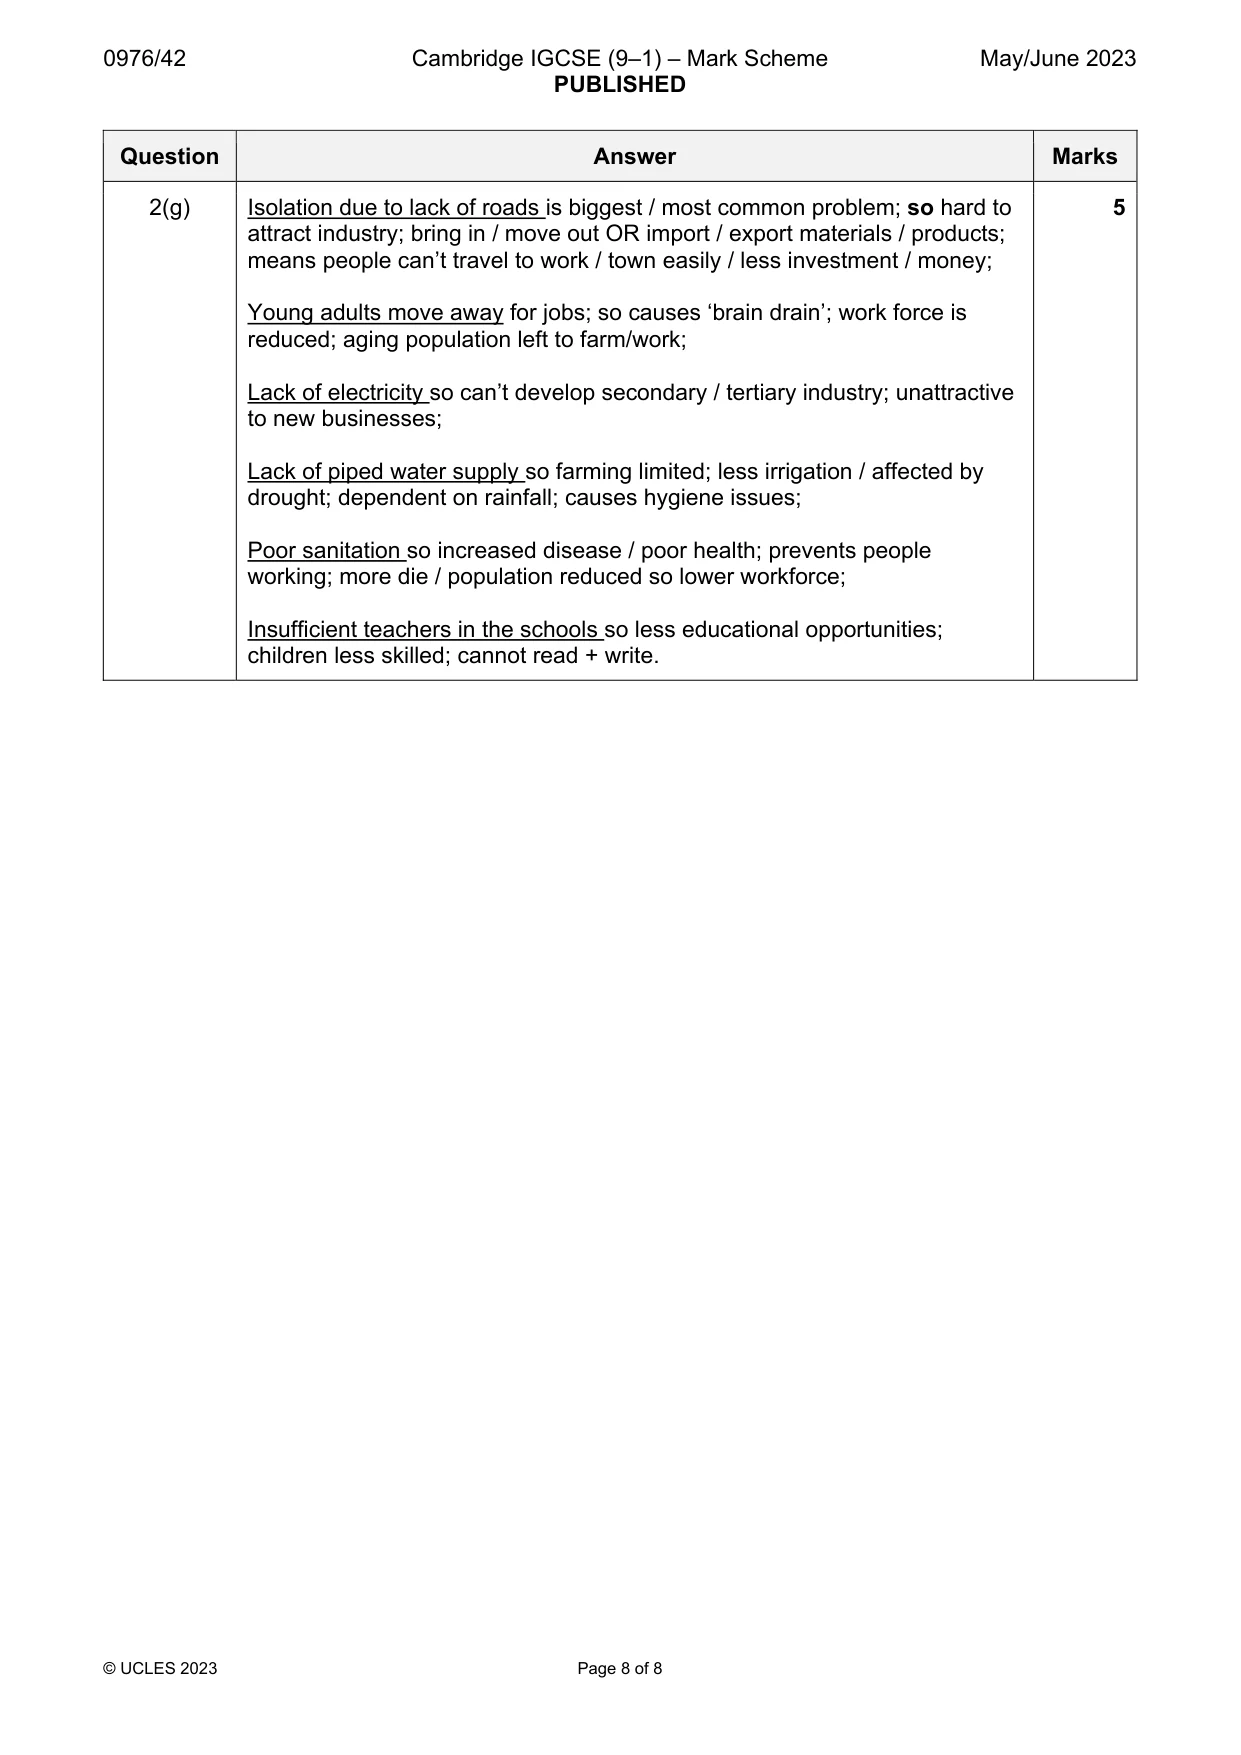
Mark scheme: 2(a) Natural. 1 2(b)(i) Advantage: 2 Removes bias; Easy to select people to answer / can just pick anyone / quick. Disadvantage: May not result in a representative sample / may be unbalanced; Difficult / longer to organise / takes time if random number tables used. 2(b)(ii) Systematic: 3 Choose people at regular / same / equal intervals; Every nth OR tenth person they meet. Stratified; Find out gender or age groups of residents; Ask a balanced number or proportionate number of people of different age group and gender; OR Get a balance of people of different ages or gender. 2(c)(i) Data collected by student / person doing survey / data not collected by 1 anybody else before / directly from source / first hand / get yourself / collected from fieldwork / raw data / new data. 2(c)(ii) Language difficulties / speak different language; 2 People not understanding the questions / can’t read or write / illiterate; People not cooperating / busy / not interested / don’t want to / boring / may lie / answers incorrect / irrelevant; Not willing to answer personal questions / don’t trust use / keep privacy; People do not know answers to the questions; Not enough people to answer the questionnaire survey; May be incomplete / filled in wrongly / too many ticks. 2(c)(iii) Interview. 1 2(d)(i) Pie graph completion for Kanyam: 3 No formal education = 25, primary = 17, secondary = 43, higher = 15. Correct shading. 2(d)(ii) Hypothesis is false – 1 mark reserve (HA). 3 1 mark for statement comparing the two villages e.g., More inhabitants of Kanyam studied at higher / secondary level; OR Fewer inhabitants of Kanyam have no formal education; OR More inhabitants of Chamaita studied at primary level; 1 mark for comparative data e.g., 15% studied at higher level in Kanyam and 8% in Chamaita / by 7%; 25% have no formal education in Kanyam and 30% in Chamaita / by 5%; 40% studied at primary level in Chamaita and 17% in Kanyam / by 23%. 2(e)(i) Divided bar completion for lighting used in Kanyam: 2 Electricity = 46%, kerosene = 29%. 1 mark for dividing line at 71% & 1 mark for shading. 2(e)(ii) 1 mark MAX for cooking statement: 3 Firewood is most important fuel for cooking in Chamaita and electricity in Kanyam; Charcoal / firewood is more important for cooking in Chamaita; Biogas / electricity / LPG is more important for cooking in Kanyam. 1 mark MAX for lighting statement: Candles are most important fuel for lighting in Chamaita and electricity in Kanyam; Electricity is more important for lighting in Kanyam; Battery / candles / kerosene more important for lighting in Chamaita. 1 mark MAX for comparative data supporting a statement e.g., Firewood is used by 46% for cooking in Chamaita and electricity is used by 39% in Kanyam; Electricity is used by 46% for lighting in Kanyam and 30% in Chamaita. 2(f)(i) Draw bar for tourist guide = 22% in Kanyam. 1 2(f)(ii) Ideas such as: 3 Tourism is the most important industry in Kanyam / examples of tourist activity; Brings money / jobs in the village; Tea plantation / secondary industry / factory in Kanyam; Money / jobs brought to the village; More tertiary / service jobs in Kanyam; Higher income in Kanyam; Fewer / less subsistence farmers / primary activity in Kanyam; 5% subsistence farming in Kanyam but 90% in Chamaita; More formal jobs in Kanyam; Higher paid employment. 2(g) Isolation due to lack of roads is biggest / most common problem; so hard to 5 attract industry; bring in / move out OR import / export materials / products; means people can’t travel to work / town easily / less investment / money; Young adults move away for jobs; so causes ‘brain drain’; work force is reduced; aging population left to farm/work; Lack of electricity so can’t develop secondary / tertiary industry; unattractive to new businesses; Lack of piped water supply so farming limited; less irrigation / affected by drought; dependent on rainfall; causes hygiene issues; Poor sanitation so increased disease / poor health; prevents people working; more die / population reduced so lower workforce; Insufficient teachers in the schools so less educational opportunities; children less skilled; cannot read + write.
What was in this paper
The subtopics covered by these 2 questions, and how many questions each got. Open one in a new tab to see every Cambridge question on it.
What you needed in this session
Cambridge’s own grade thresholds for 2023 May/June, Paper 4 · Variant 2. A higher threshold means an easier paper — the bar moves with how the cohort did.