Cambridge IGCSE Geography (9-1) 0976 — 2025 May/June Paper 4 · Variant 2
0976/42/M/J/25 · 2 questions · 60 marks · 90 min
The question paper and its mark scheme, free to read here and free to download. This is Cambridge’s own paper, exactly as it was sat.
Question paper16 pages


Mark scheme10 pages
Answers below. Sit the paper first if you are practising.
Questions as text
Q1 · Students who were studying the topic of weather used a variety of traditional instruments…
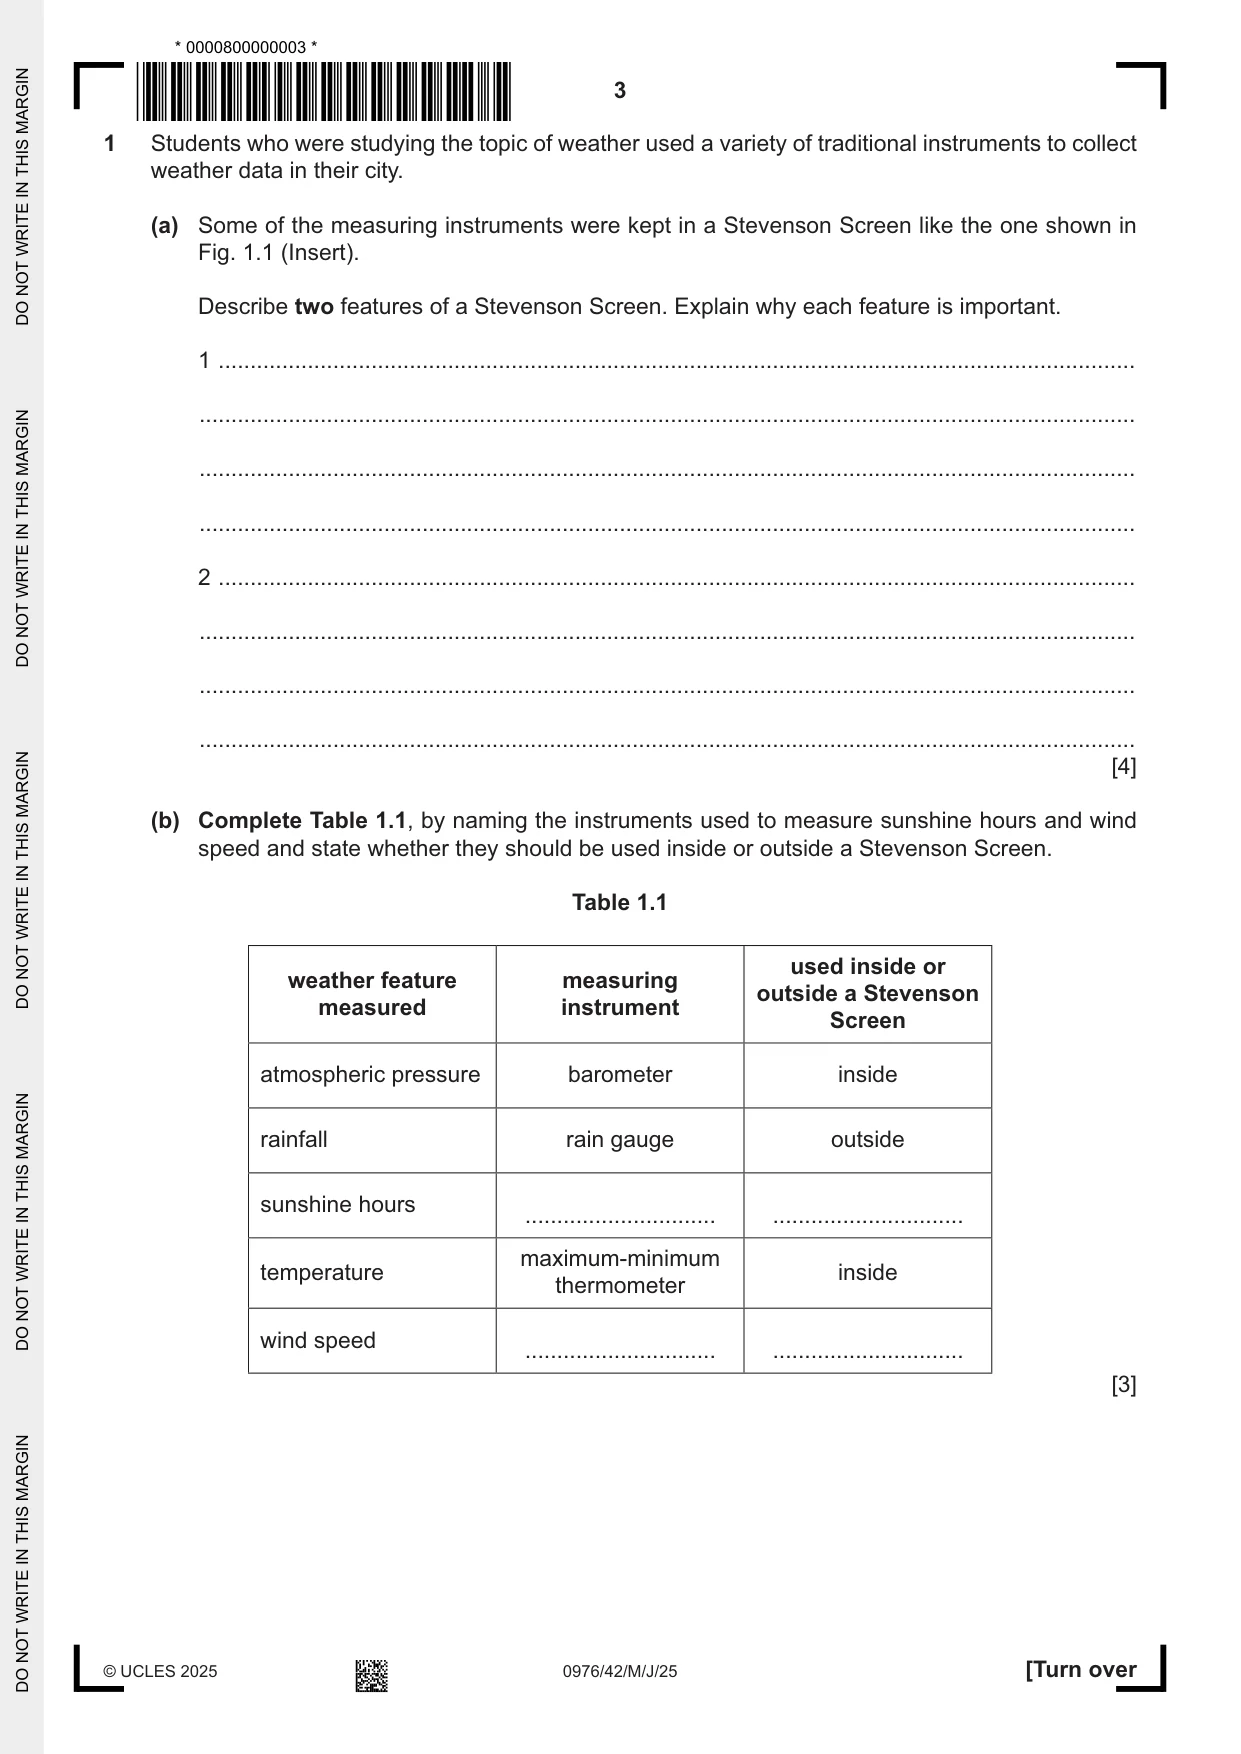
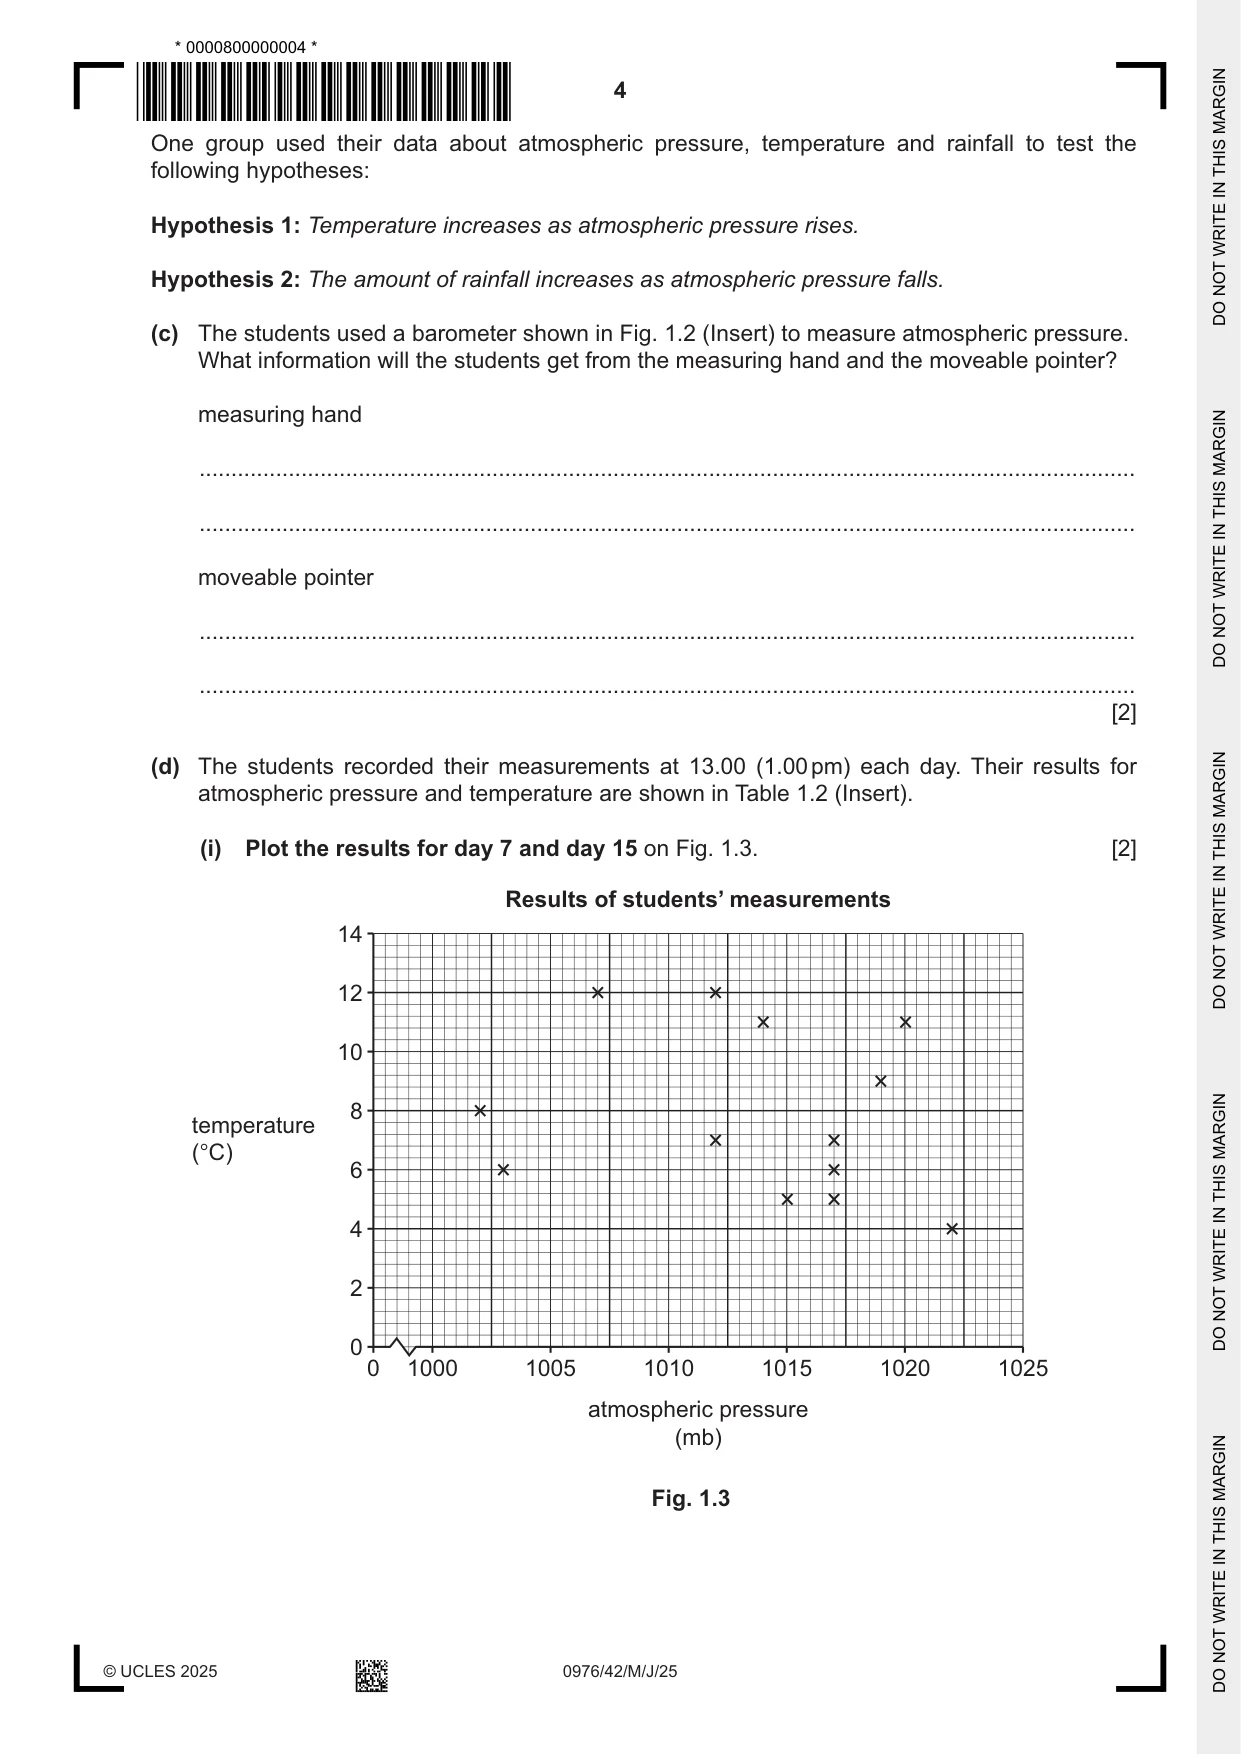
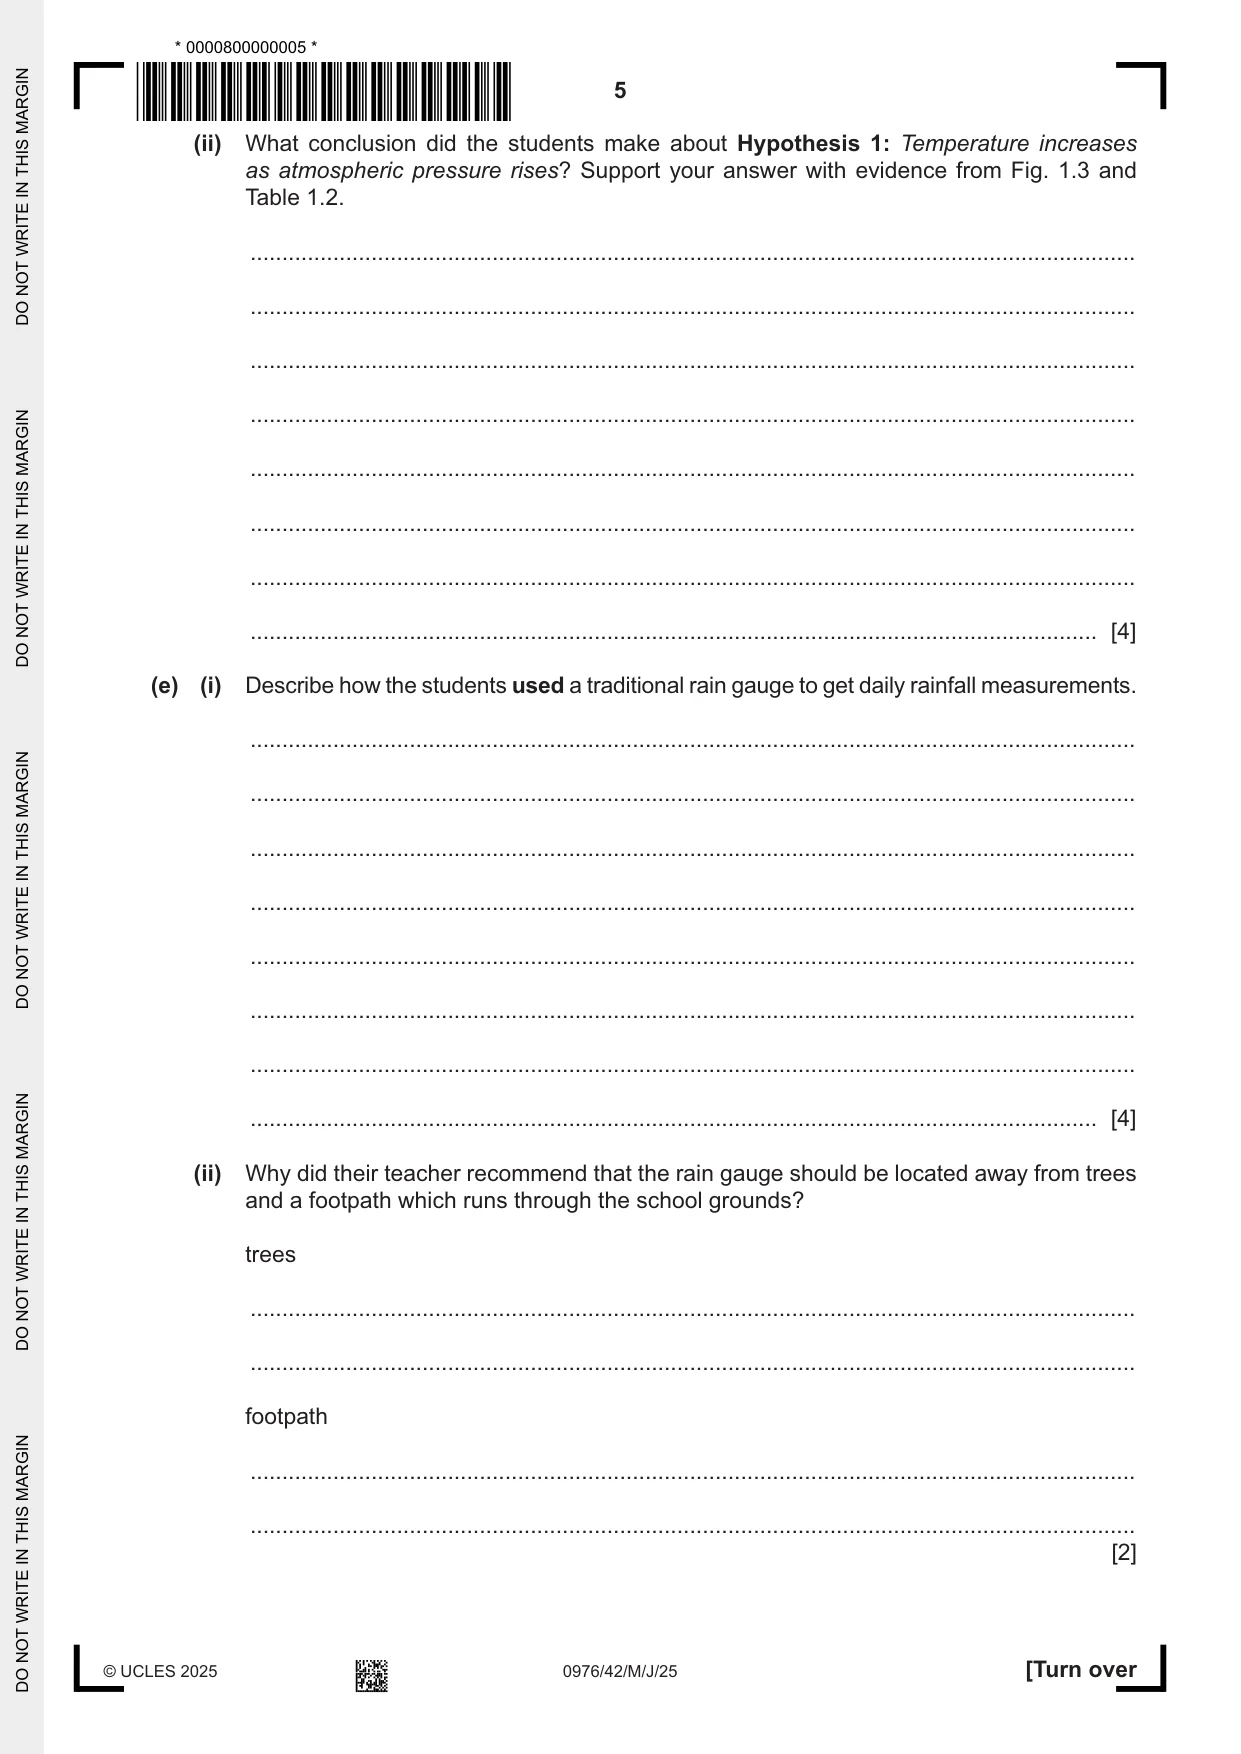
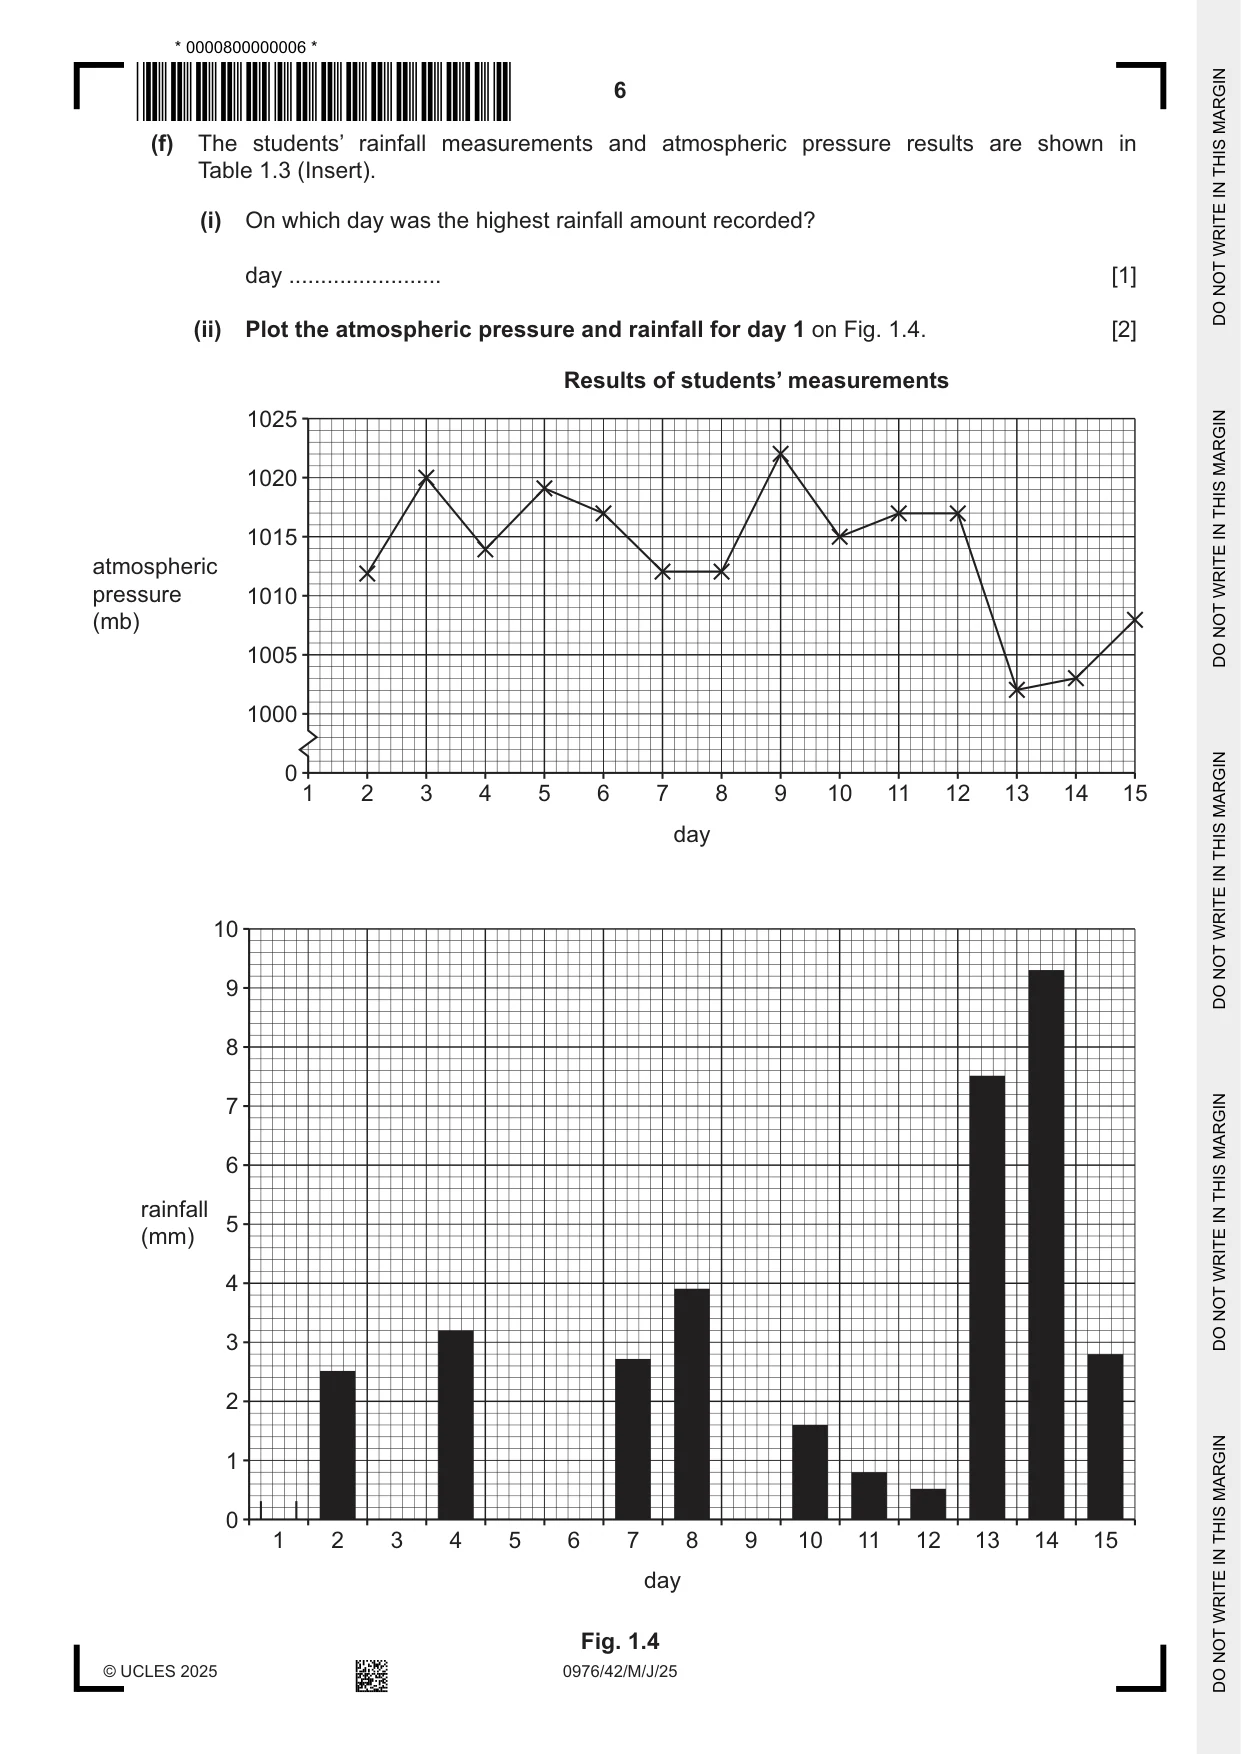
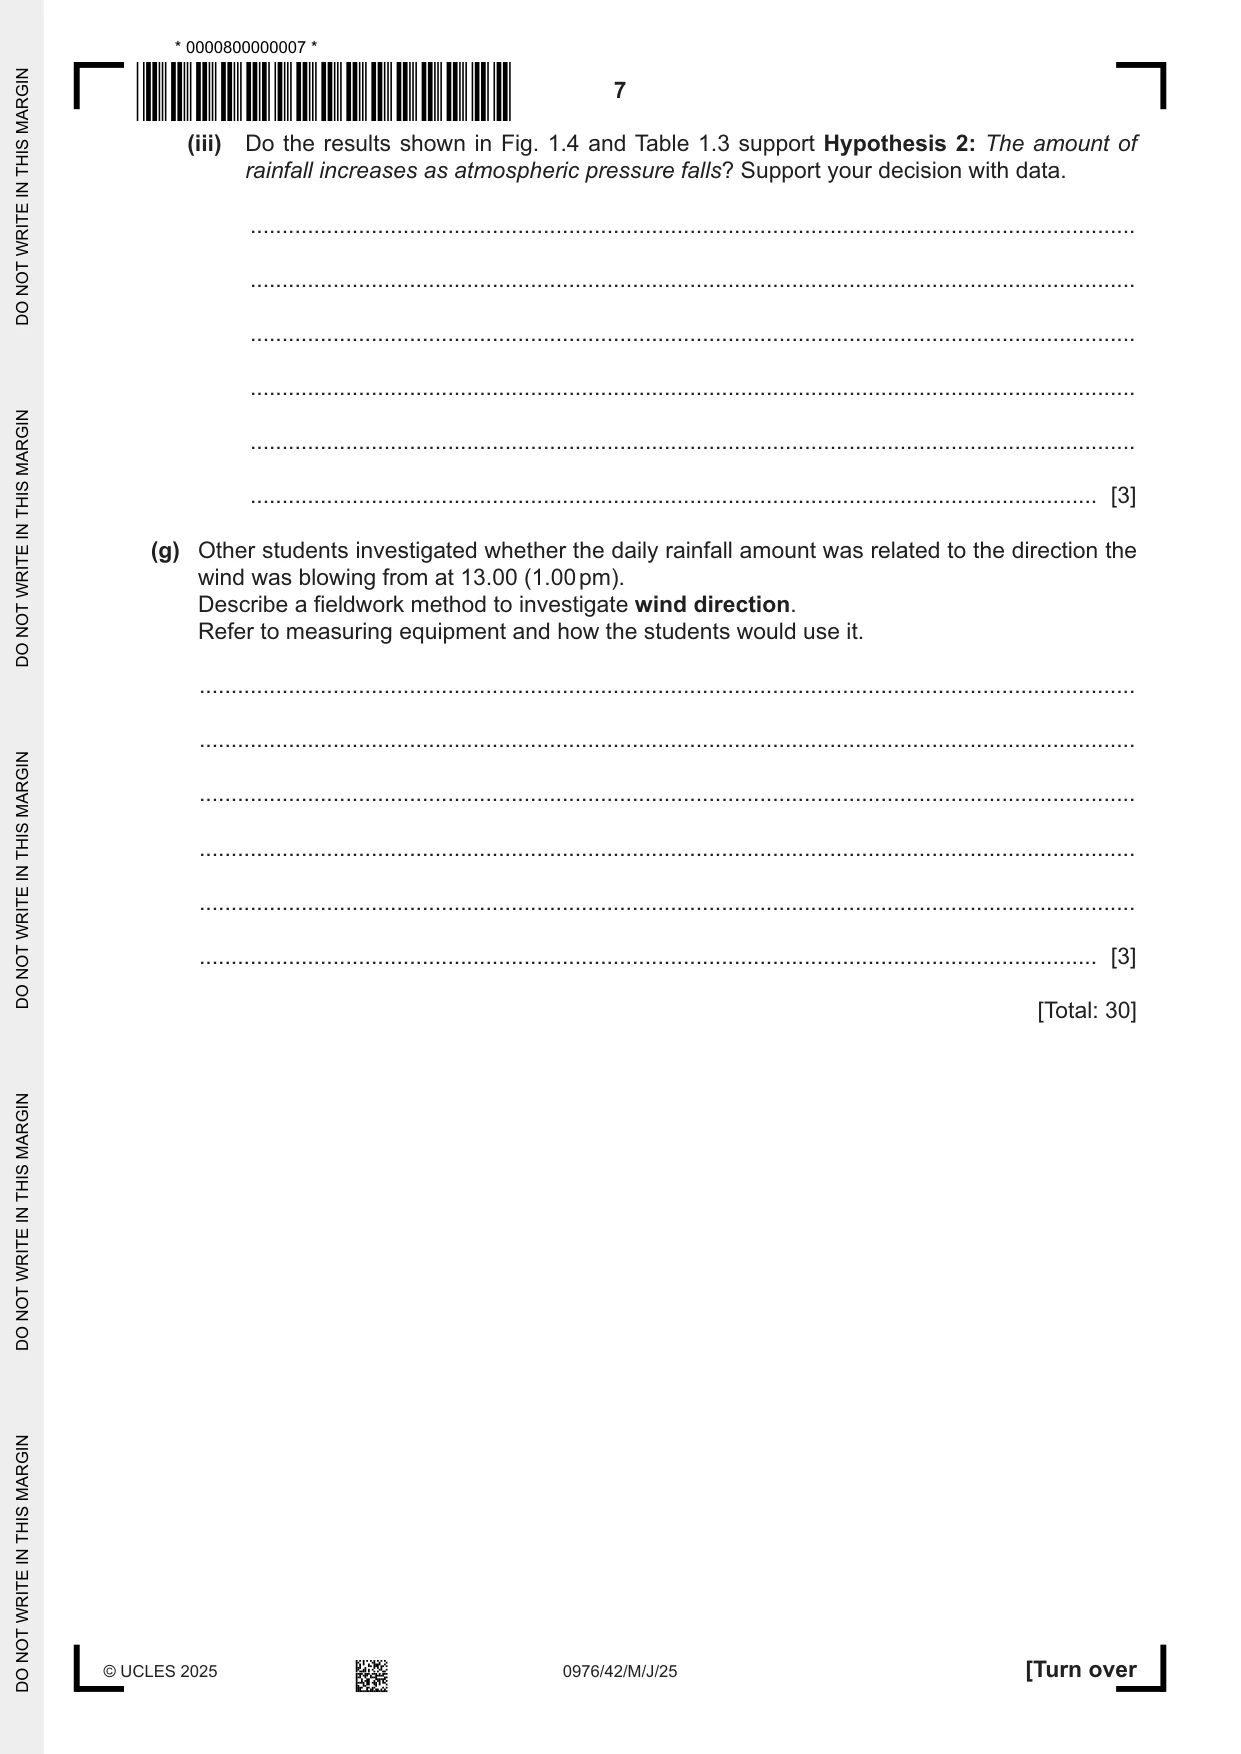
1 Students who were studying the topic of weather used a variety of traditional instruments to collect weather data in their city. (a) Some of the measuring instruments were kept in a Stevenson Screen like the one shown in Fig. 1.1 (Insert). Describe two features of a Stevenson Screen. Explain why each feature is important. 1 ................................................................................................................................................ ................................................................................................................................................... ................................................................................................................................................... ................................................................................................................................................... 2 ................................................................................................................................................ ................................................................................................................................................... ................................................................................................................................................... ................................................................................................................................................... [4] (b) Complete Table 1.1, by naming the instruments used to measure sunshine hours and wind speed and state whether they should be used inside or outside a Stevenson Screen. Table 1.1 used inside or weather feature measuring outside a Stevenson measured instrument Screen atmospheric pressure barometer inside rainfall rain gauge outside sunshine hours .............................. .............................. maximum-minimum temperature inside thermometer wind speed .............................. .............................. [3] One group used their data about atmospheric pressure, temperature and rainfall to test the following hypotheses: Hypothesis 1: Temperature increases as atmospheric pressure rises. Hypothesis 2: The amount of rainfall increases as atmospheric pressure falls. (c) The students used a barometer shown in Fig. 1.2 (Insert) to measure atmospheric pressure. What information will the students get from the measuring hand and the moveable pointer? measuring hand ................................................................................................................................................... ................................................................................................................................................... moveable pointer ................................................................................................................................................... ................................................................................................................................................... [2] (d) The students recorded their measurements at 13.00 (1.00 pm) each day. Their results for atmospheric pressure and temperature are shown in Table 1.2 (Insert). (i) Plot the results for day 7 and day 15 on Fig. 1.3. [2] Results of students’ measurements 14 12 10 8 temperature (°C) 6 4 2 0 0 1000 1005 1010 1015 1020 1025 atmospheric pressure (mb) Fig. 1.3 (ii) What conclusion did the students make about Hypothesis 1: Temperature increases as atmospheric pressure rises? Support your answer with evidence from Fig. 1.3 and Table 1.2. ........................................................................................................................................... ........................................................................................................................................... ........................................................................................................................................... ........................................................................................................................................... ........................................................................................................................................... ........................................................................................................................................... ........................................................................................................................................... ..................................................................................................................................... [4] (e) (i) Describe how the students used a traditional rain gauge to get daily rainfall measurements. ........................................................................................................................................... ........................................................................................................................................... ........................................................................................................................................... ........................................................................................................................................... ........................................................................................................................................... ........................................................................................................................................... ........................................................................................................................................... ..................................................................................................................................... [4] (ii) Why did their teacher recommend that the rain gauge should be located away from trees and a footpath which runs through the school grounds? trees ........................................................................................................................................... ........................................................................................................................................... footpath ........................................................................................................................................... ........................................................................................................................................... [2] (f) The students’ rainfall measurements and atmospheric pressure results are shown in Table 1.3 (Insert). (i) On which day was the highest rainfall amount recorded? day ........................ [1] (ii) Plot the atmospheric pressure and rainfall for day 1 on Fig. 1.4. [2] Results of students’ measurements 1025 1020 1015 atmospheric pressure 1010 (mb) 1005 1000 0 1 2 3 4 5 6 7 8 9 10 11 12 13 14 15 day 10 9 8 7 6 rainfall 5 (mm) 4 3 2 1 0 1 2 3 4 5 6 7 8 9 10 11 12 13 14 15 day Fig. 1.4 (iii) Do the results shown in Fig. 1.4 and Table 1.3 support Hypothesis 2: The amount of rainfall increases as atmospheric pressure falls? Support your decision with data. ........................................................................................................................................... ........................................................................................................................................... ........................................................................................................................................... ........................................................................................................................................... ........................................................................................................................................... ..................................................................................................................................... [3] (g) Other students investigated whether the daily rainfall amount was related to the direction the wind was blowing from at 13.00 (1.00 pm). Describe a fieldwork method to investigate wind direction. Refer to measuring equipment and how the students would use it. ................................................................................................................................................... ................................................................................................................................................... ................................................................................................................................................... ................................................................................................................................................... ................................................................................................................................................... ............................................................................................................................................. [3] [Total: 30]
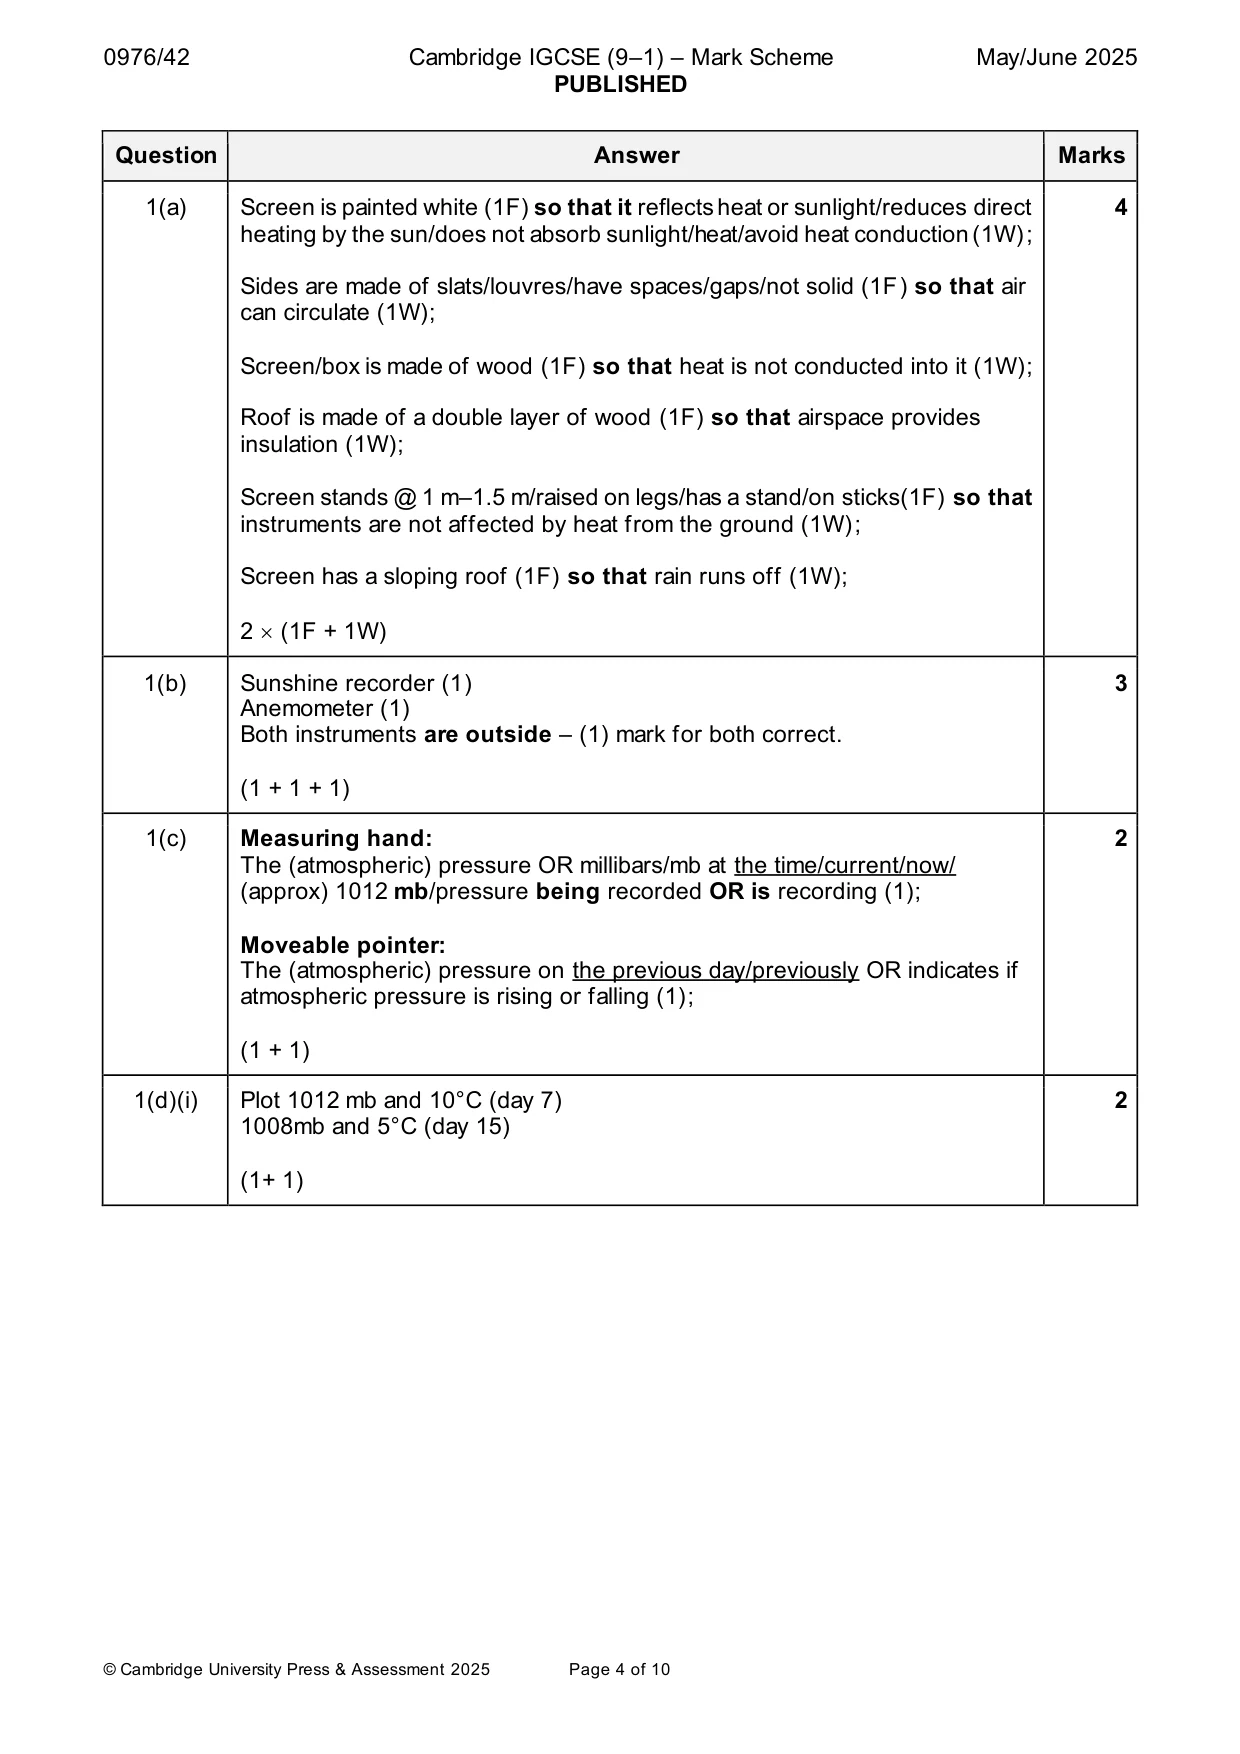
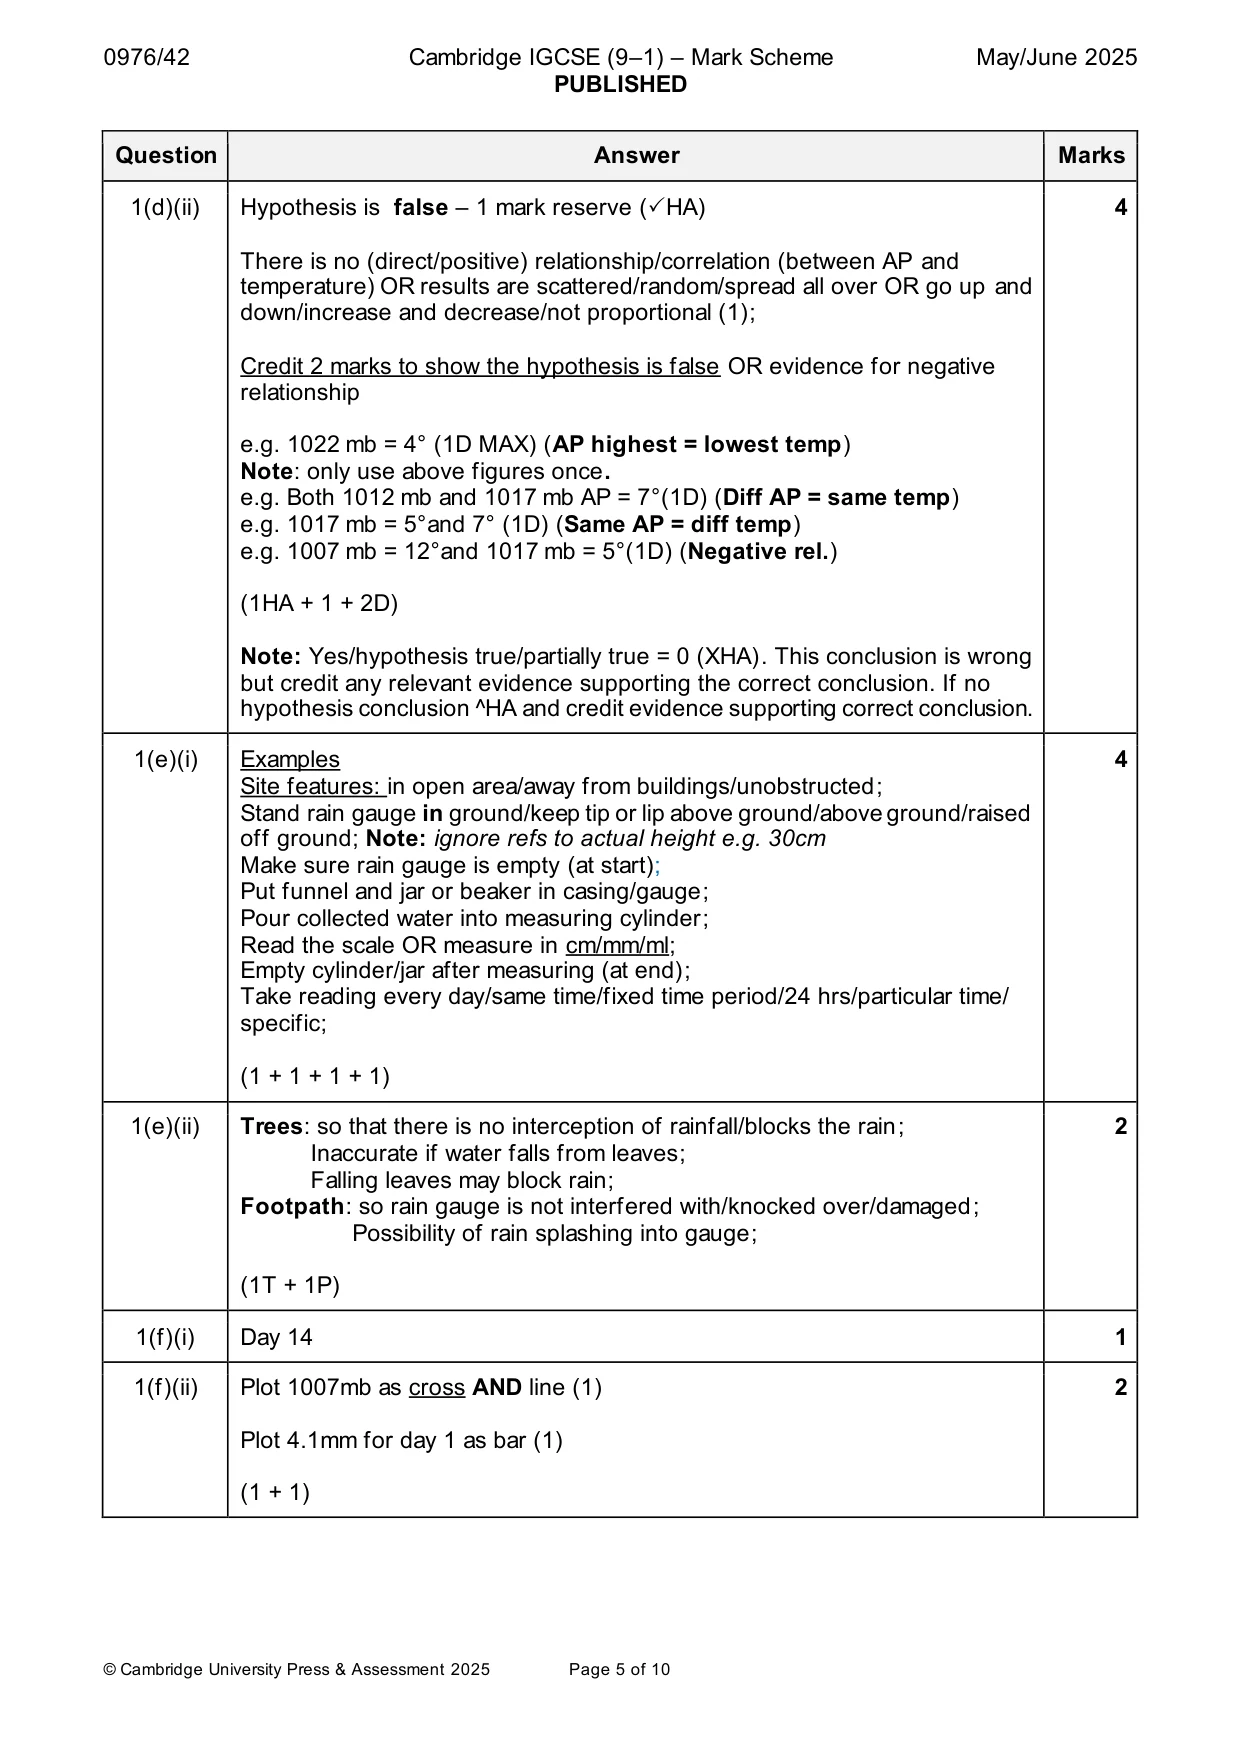
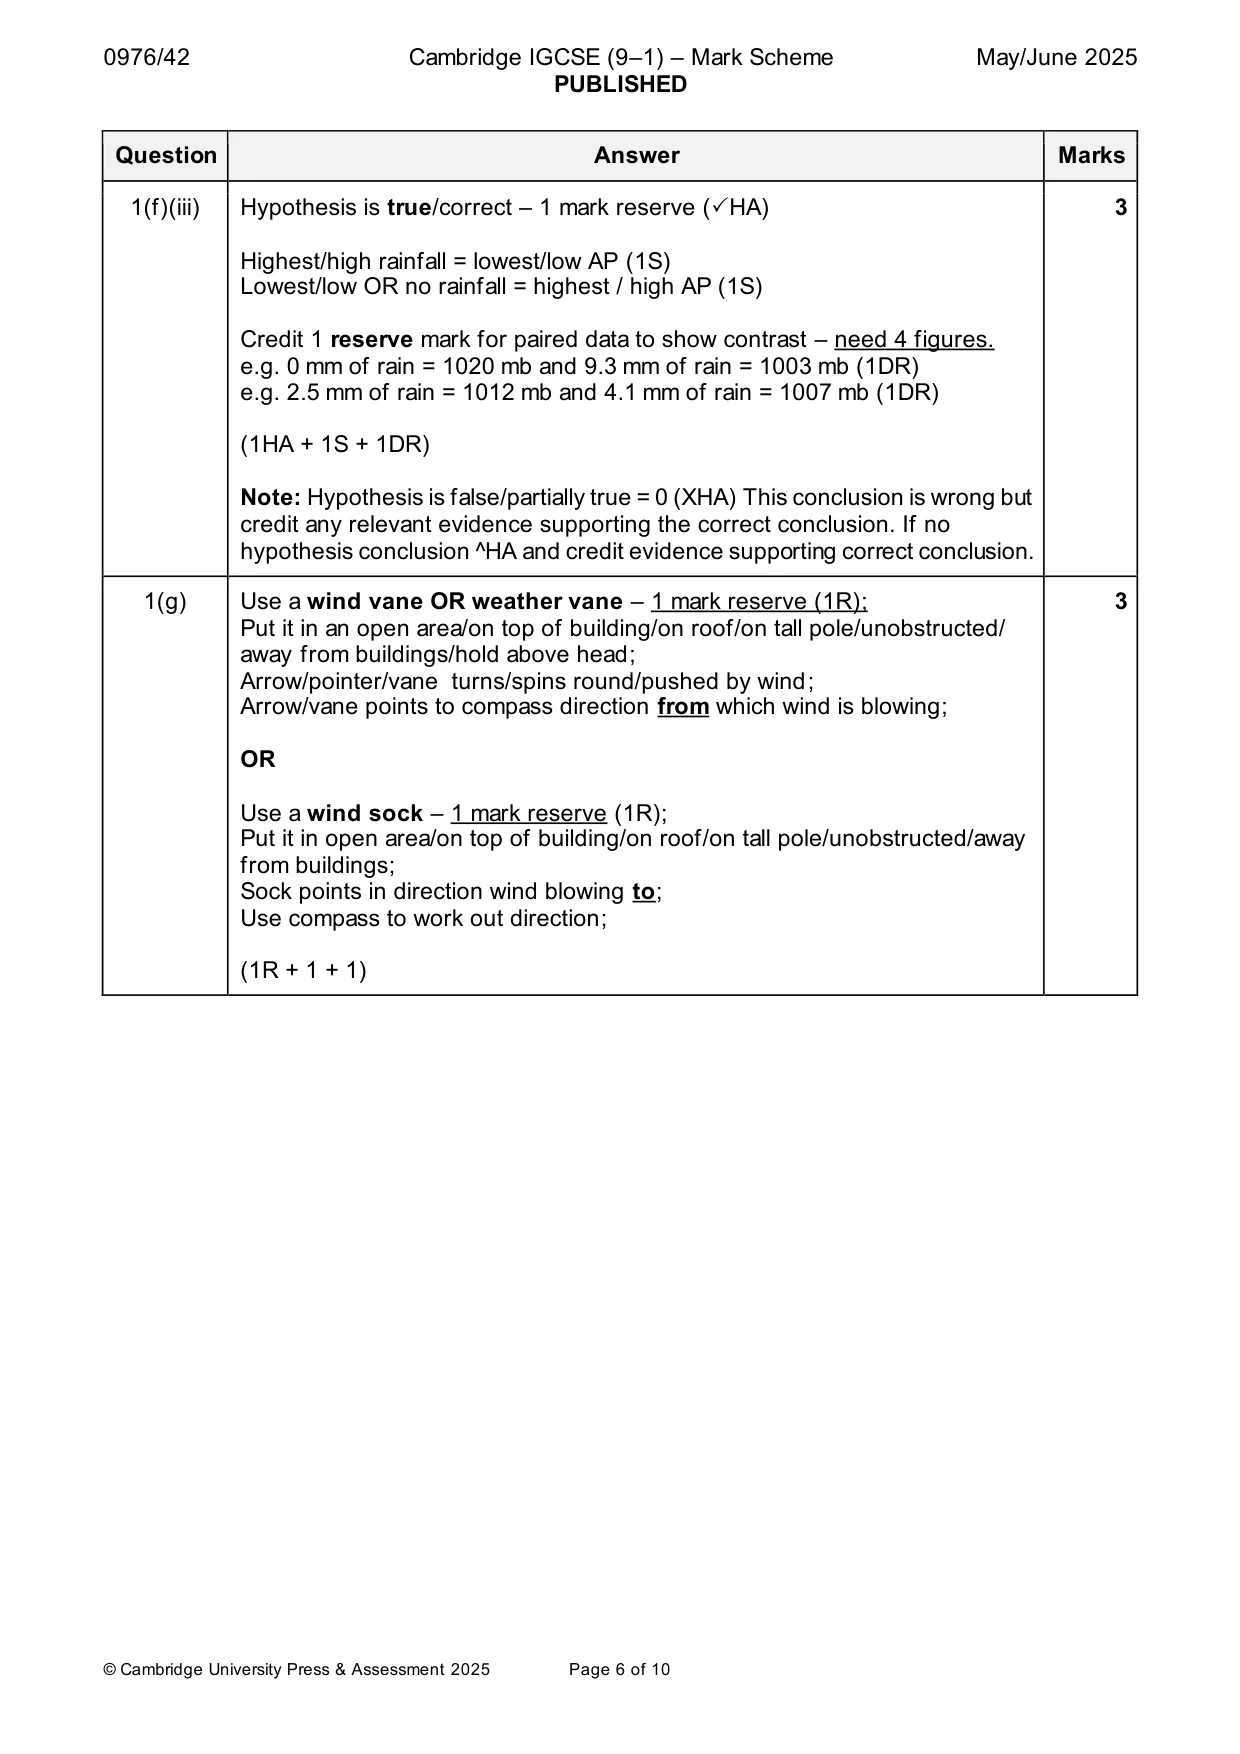
Mark scheme: Question Answer Marks 1(a) Screen is painted white (1F) so that it reflects heat or sunlight/reduces direct 4 heating by the sun/does not absorb sunlight/heat/avoid heat conduction (1W); Sides are made of slats/louvres/have spaces/gaps/not solid (1F) so that air can circulate (1W); Screen/box is made of wood (1F) so that heat is not conducted into it (1W); Roof is made of a double layer of wood (1F) so that airspace provides insulation (1W); Screen stands @ 1 m–1.5 m/raised on legs/has a stand/on sticks(1F) so that instruments are not affected by heat from the ground (1W); Screen has a sloping roof (1F) so that rain runs off (1W); 2 (1F + 1W) 1(b) Sunshine recorder (1) 3 Anemometer (1) Both instruments are outside – (1) mark for both correct. (1 + 1 + 1) 1(c) Measuring hand: 2 The (atmospheric) pressure OR millibars/mb at the time/current/now/ (approx) 1012 mb/pressure being recorded OR is recording (1); Moveable pointer: The (atmospheric) pressure on the previous day/previously OR indicates if atmospheric pressure is rising or falling (1); (1 + 1) 1(d)(i) Plot 1012 mb and 10°C (day 7) 2 1008mb and 5°C (day 15) (1+ 1) 1(d)(ii) Hypothesis is false – 1 mark reserve (HA) 4 There is no (direct/positive) relationship/correlation (between AP and temperature) OR results are scattered/random/spread all over OR go up and down/increase and decrease/not proportional (1); Credit 2 marks to show the hypothesis is false OR evidence for negative relationship e.g. 1022 mb = 4° (1D MAX) (AP highest = lowest temp) Note: only use above figures once. e.g. Both 1012 mb and 1017 mb AP = 7°(1D) (Diff AP = same temp) e.g. 1017 mb = 5°and 7° (1D) (Same AP = diff temp) e.g. 1007 mb = 12°and 1017 mb = 5°(1D) (Negative rel.) (1HA + 1 + 2D) Note: Yes/hypothesis true/partially true = 0 (XHA). This conclusion is wrong but credit any relevant evidence supporting the correct conclusion. If no hypothesis conclusion ^HA and credit evidence supporting correct conclusion. 1(e)(i) Examples 4 Site features: in open area/away from buildings/unobstructed; Stand rain gauge in ground/keep tip or lip above ground/above ground/raised off ground; Note: ignore refs to actual height e.g. 30cm Make sure rain gauge is empty (at start); Put funnel and jar or beaker in casing/gauge; Pour collected water into measuring cylinder; Read the scale OR measure in cm/mm/ml; Empty cylinder/jar after measuring (at end); Take reading every day/same time/fixed time period/24 hrs/particular time/ specific; (1 + 1 + 1 + 1) 1(e)(ii) Trees: so that there is no interception of rainfall/blocks the rain; 2 Inaccurate if water falls from leaves; Falling leaves may block rain; Footpath: so rain gauge is not interfered with/knocked over/damaged; Possibility of rain splashing into gauge; (1T + 1P) 1(f)(i) Day 14 1 1(f)(ii) Plot 1007mb as cross AND line (1) 2 Plot 4.1mm for day 1 as bar (1) (1 + 1) 1(f)(iii) Hypothesis is true/correct – 1 mark reserve (HA) 3 Highest/high rainfall = lowest/low AP (1S) Lowest/low OR no rainfall = highest / high AP (1S) Credit 1 reserve mark for paired data to show contrast – need 4 figures. e.g. 0 mm of rain = 1020 mb and 9.3 mm of rain = 1003 mb (1DR) e.g. 2.5 mm of rain = 1012 mb and 4.1 mm of rain = 1007 mb (1DR) (1HA + 1S + 1DR) Note: Hypothesis is false/partially true = 0 (XHA) This conclusion is wrong but credit any relevant evidence supporting the correct conclusion. If no hypothesis conclusion ^HA and credit evidence supporting correct conclusion. 1(g) Use a wind vane OR weather vane – 1 mark reserve (1R); 3 Put it in an open area/on top of building/on roof/on tall pole/unobstructed/ away from buildings/hold above head; Arrow/pointer/vane turns/spins round/pushed by wind; Arrow/vane points to compass direction from which wind is blowing; OR Use a wind sock – 1 mark reserve (1R); Put it in open area/on top of building/on roof/on tall pole/unobstructed/away from buildings; Sock points in direction wind blowing to; Use compass to work out direction; (1R + 1 + 1)
Q2 · Students in Tokyo, Japan (an MEDC in Asia), did fieldwork about the CBD of their city
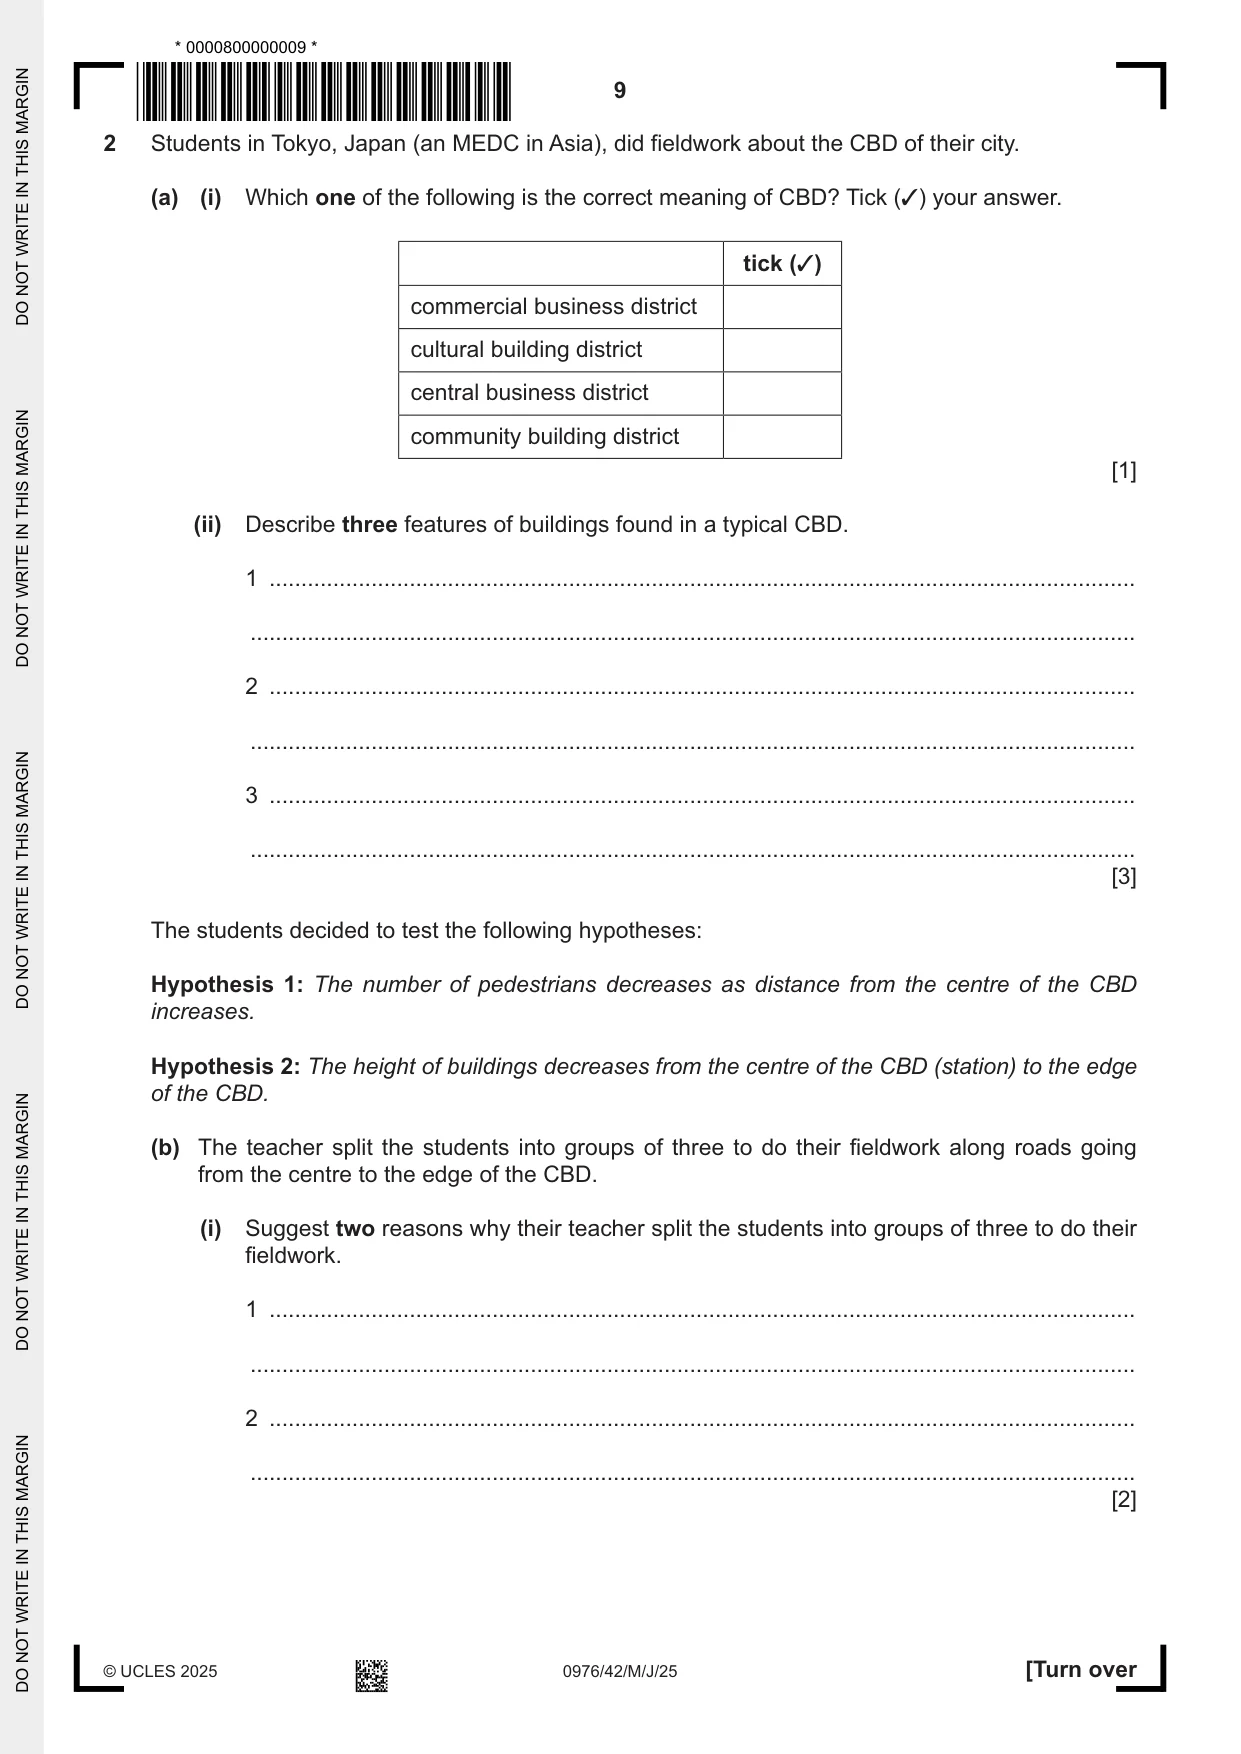
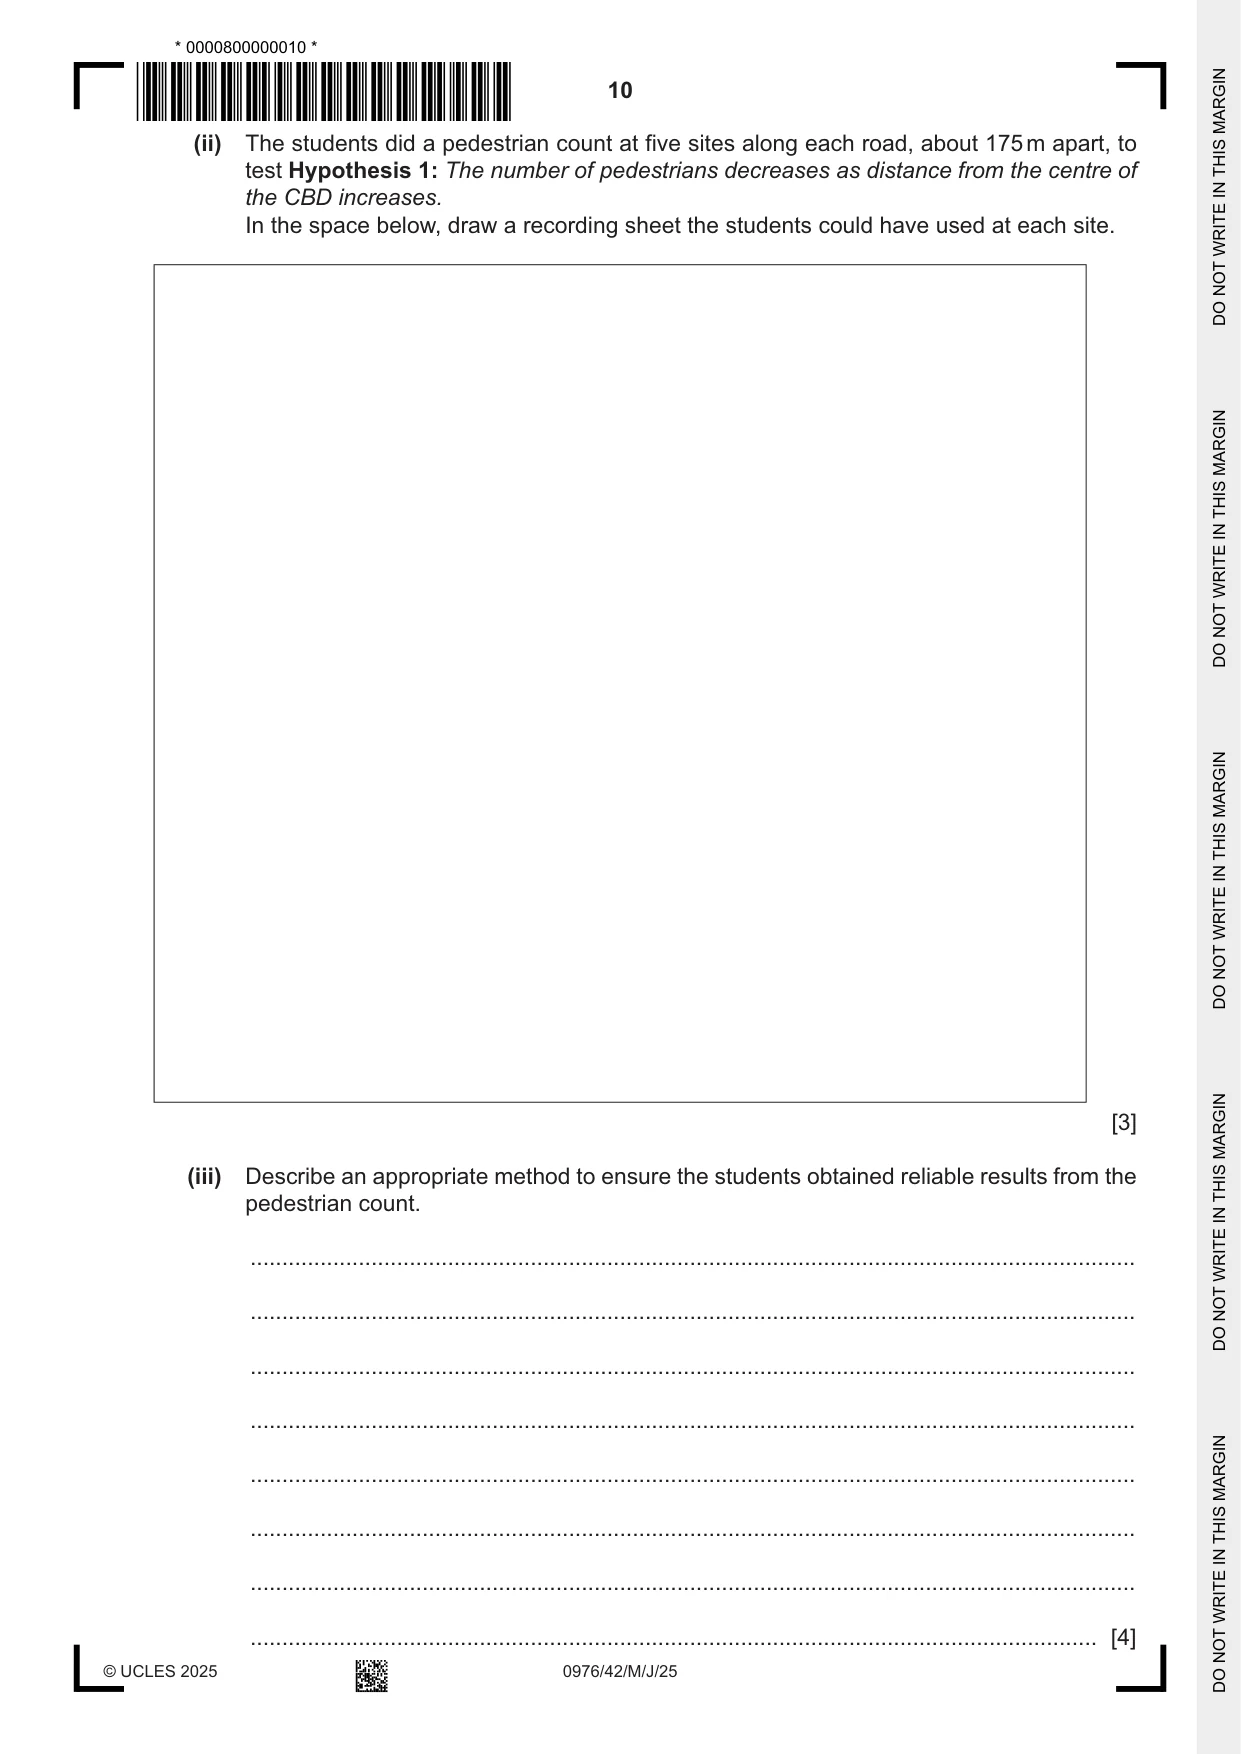
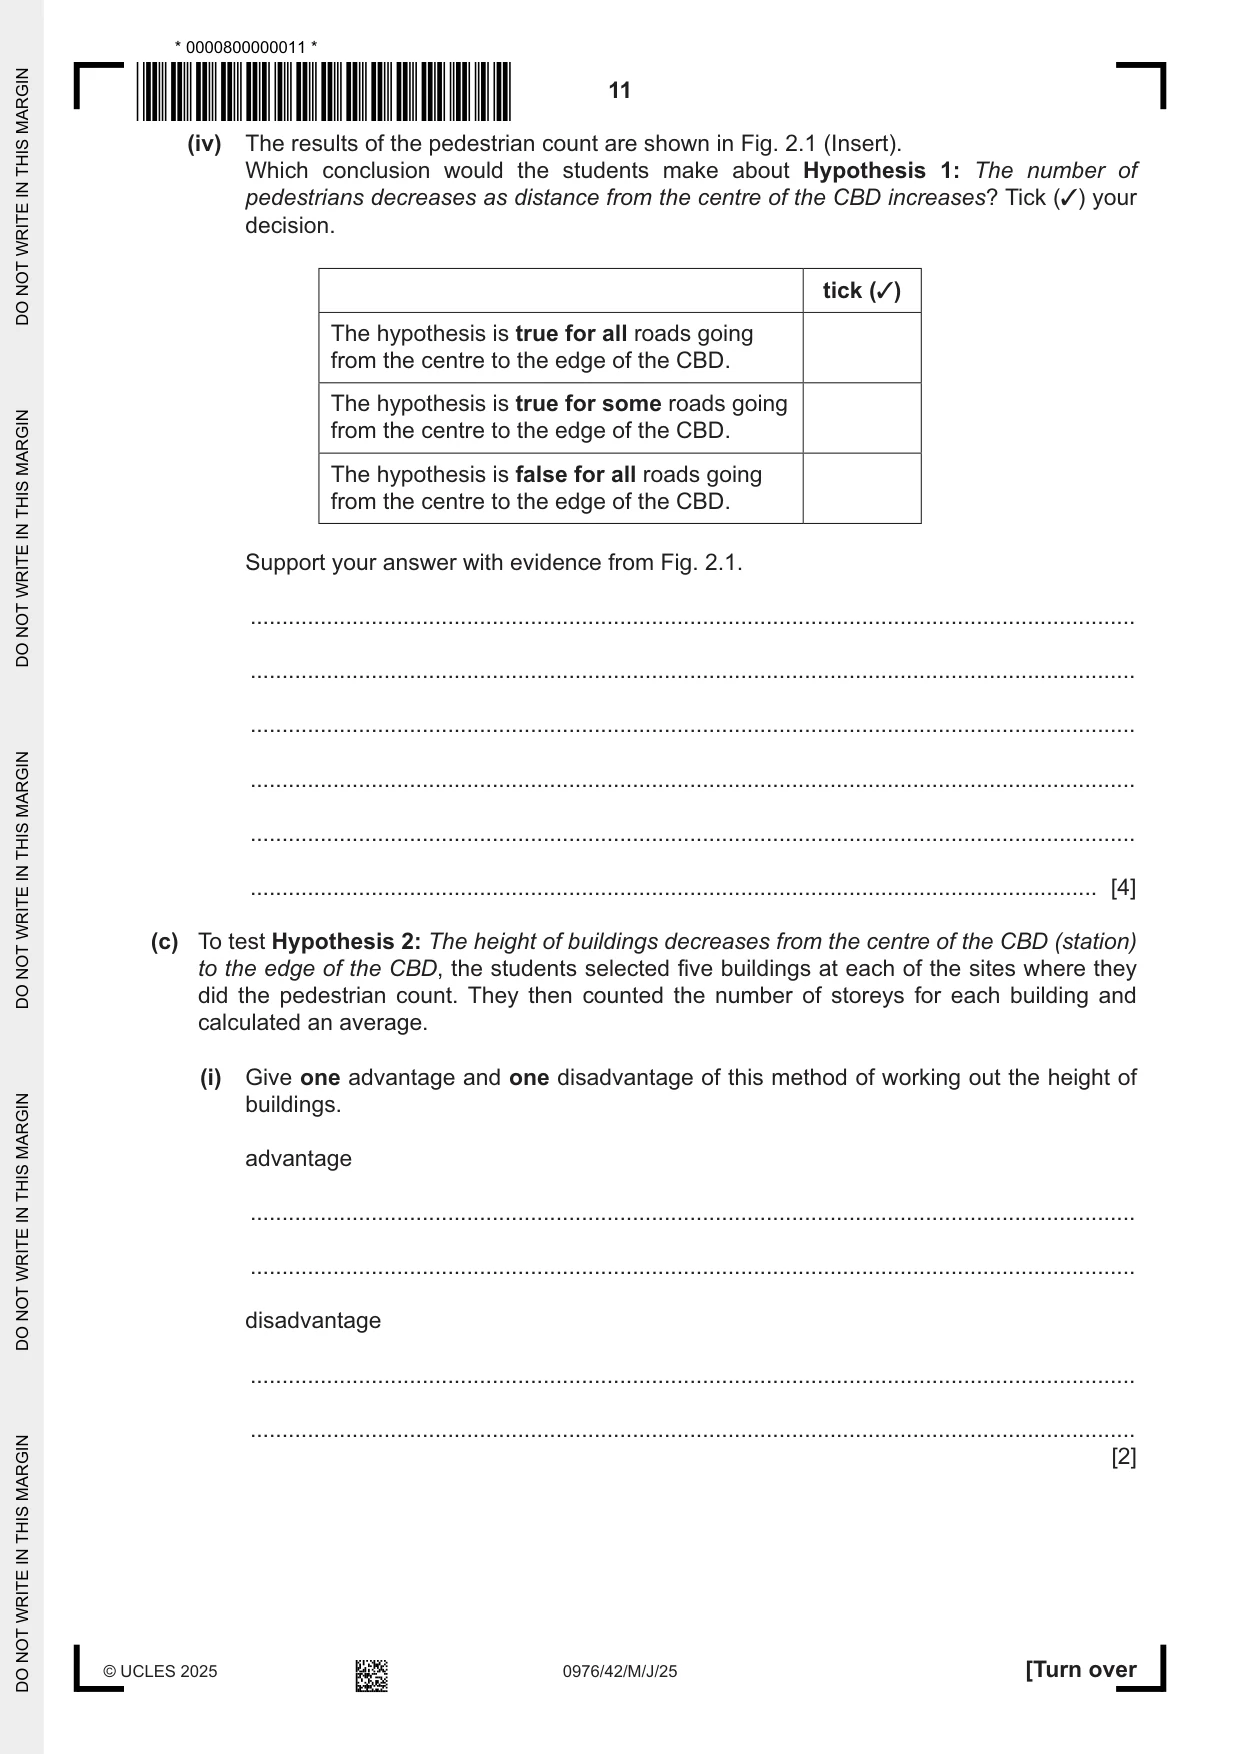
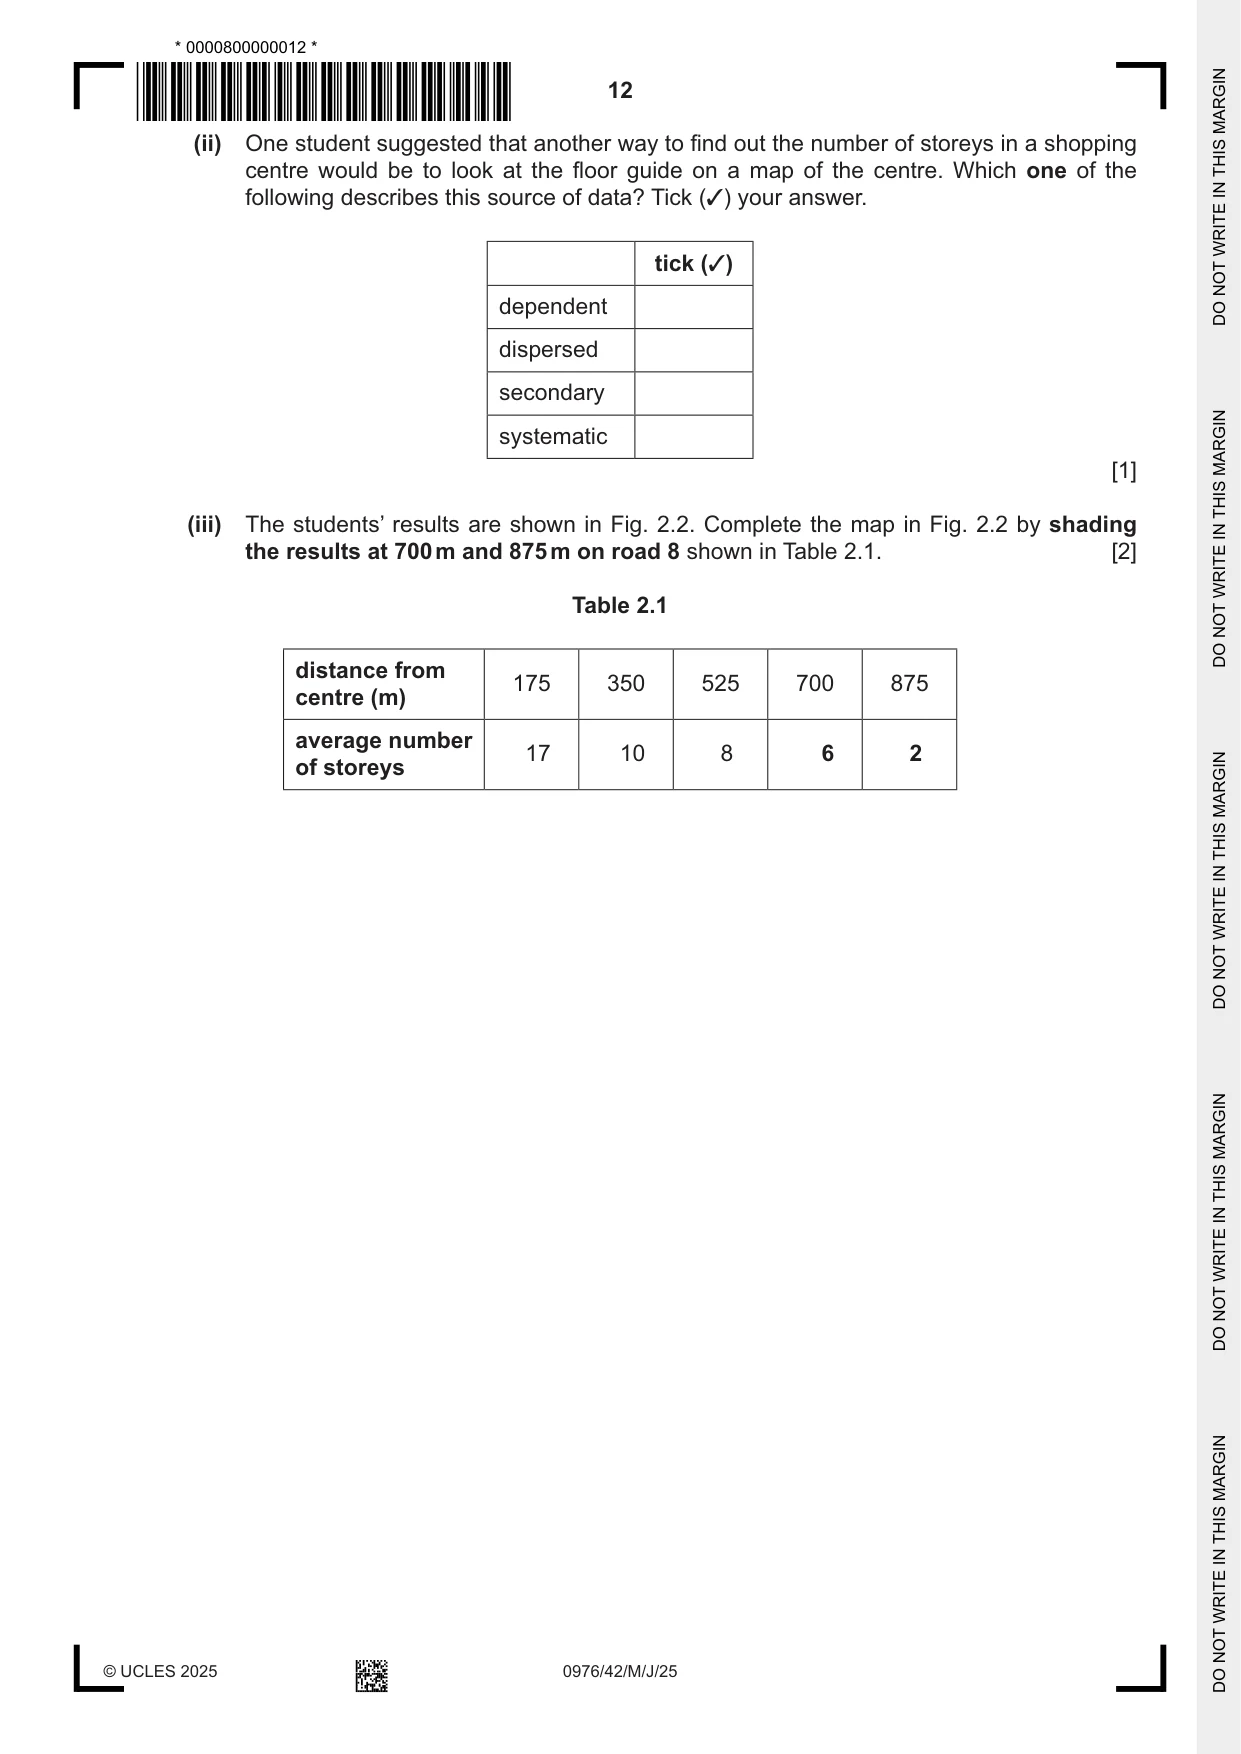
2 Students in Tokyo, Japan (an MEDC in Asia), did fieldwork about the CBD of their city. (a) (i) Which one of the following is the correct meaning of CBD? Tick (✓) your answer. tick (✓) commercial business district cultural building district central business district community building district [1] (ii) Describe three features of buildings found in a typical CBD. 1 ........................................................................................................................................ ........................................................................................................................................... 2 ........................................................................................................................................ ........................................................................................................................................... 3 ........................................................................................................................................ ........................................................................................................................................... [3] The students decided to test the following hypotheses: Hypothesis 1: The number of pedestrians decreases as distance from the centre of the CBD increases. Hypothesis 2: The height of buildings decreases from the centre of the CBD (station) to the edge of the CBD. (b) The teacher split the students into groups of three to do their fieldwork along roads going from the centre to the edge of the CBD. (i) Suggest two reasons why their teacher split the students into groups of three to do their fieldwork. 1 ........................................................................................................................................ ........................................................................................................................................... 2 ........................................................................................................................................ ........................................................................................................................................... [2] (ii) The students did a pedestrian count at five sites along each road, about 175 m apart, to test Hypothesis 1: The number of pedestrians decreases as distance from the centre of the CBD increases. In the space below, draw a recording sheet the students could have used at each site. [3] (iii) Describe an appropriate method to ensure the students obtained reliable results from the pedestrian count. ........................................................................................................................................... ........................................................................................................................................... ........................................................................................................................................... ........................................................................................................................................... ........................................................................................................................................... ........................................................................................................................................... ........................................................................................................................................... ..................................................................................................................................... [4] (iv) The results of the pedestrian count are shown in Fig. 2.1 (Insert). Which conclusion would the students make about Hypothesis 1: The number of pedestrians decreases as distance from the centre of the CBD increases? Tick (✓) your decision. tick (✓) The hypothesis is true for all roads going from the centre to the edge of the CBD. The hypothesis is true for some roads going from the centre to the edge of the CBD. The hypothesis is false for all roads going from the centre to the edge of the CBD. Support your answer with evidence from Fig. 2.1. ........................................................................................................................................... ........................................................................................................................................... ........................................................................................................................................... ........................................................................................................................................... ........................................................................................................................................... ..................................................................................................................................... [4] (c) To test Hypothesis 2: The height of buildings decreases from the centre of the CBD (station) to the edge of the CBD, the students selected five buildings at each of the sites where they did the pedestrian count. They then counted the number of storeys for each building and calculated an average. (i) Give one advantage and one disadvantage of this method of working out the height of buildings. advantage ........................................................................................................................................... ........................................................................................................................................... disadvantage ........................................................................................................................................... ........................................................................................................................................... [2]
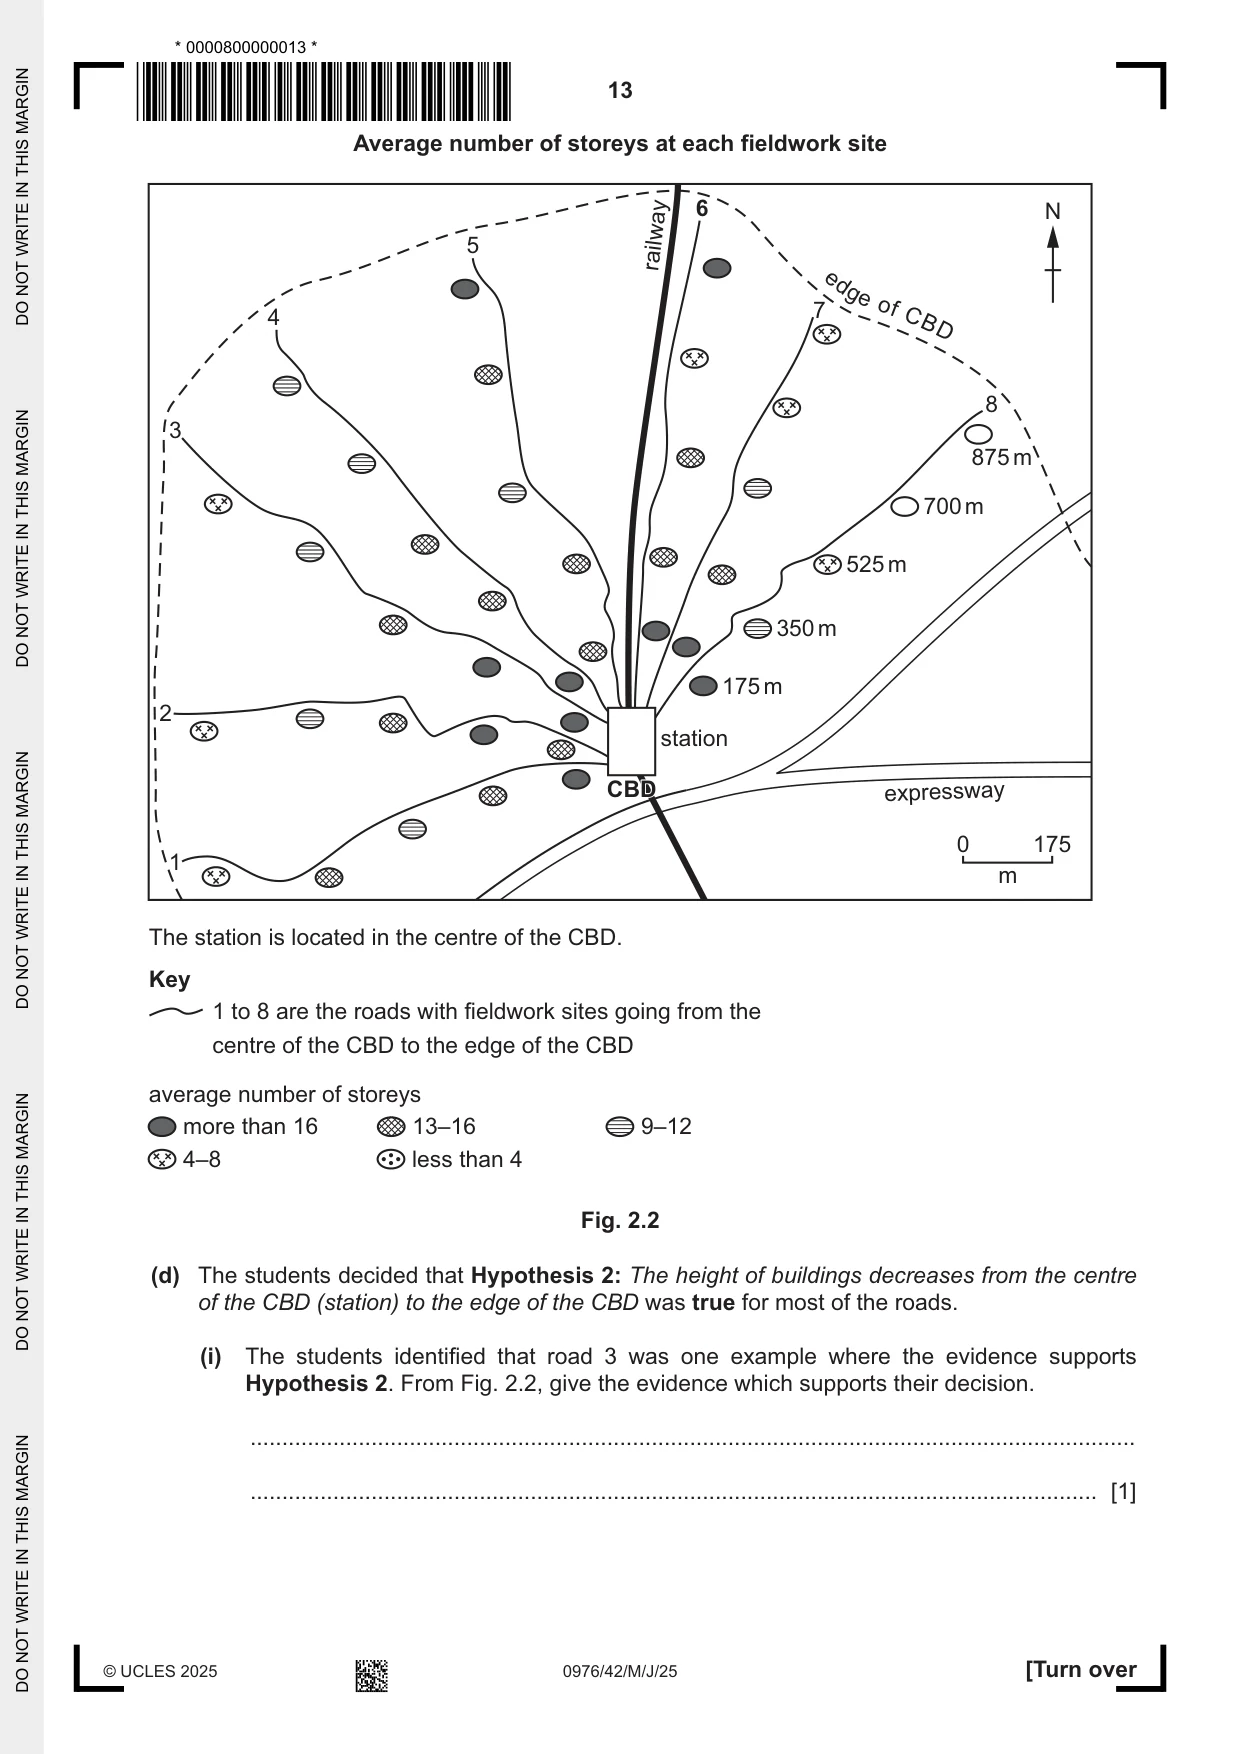
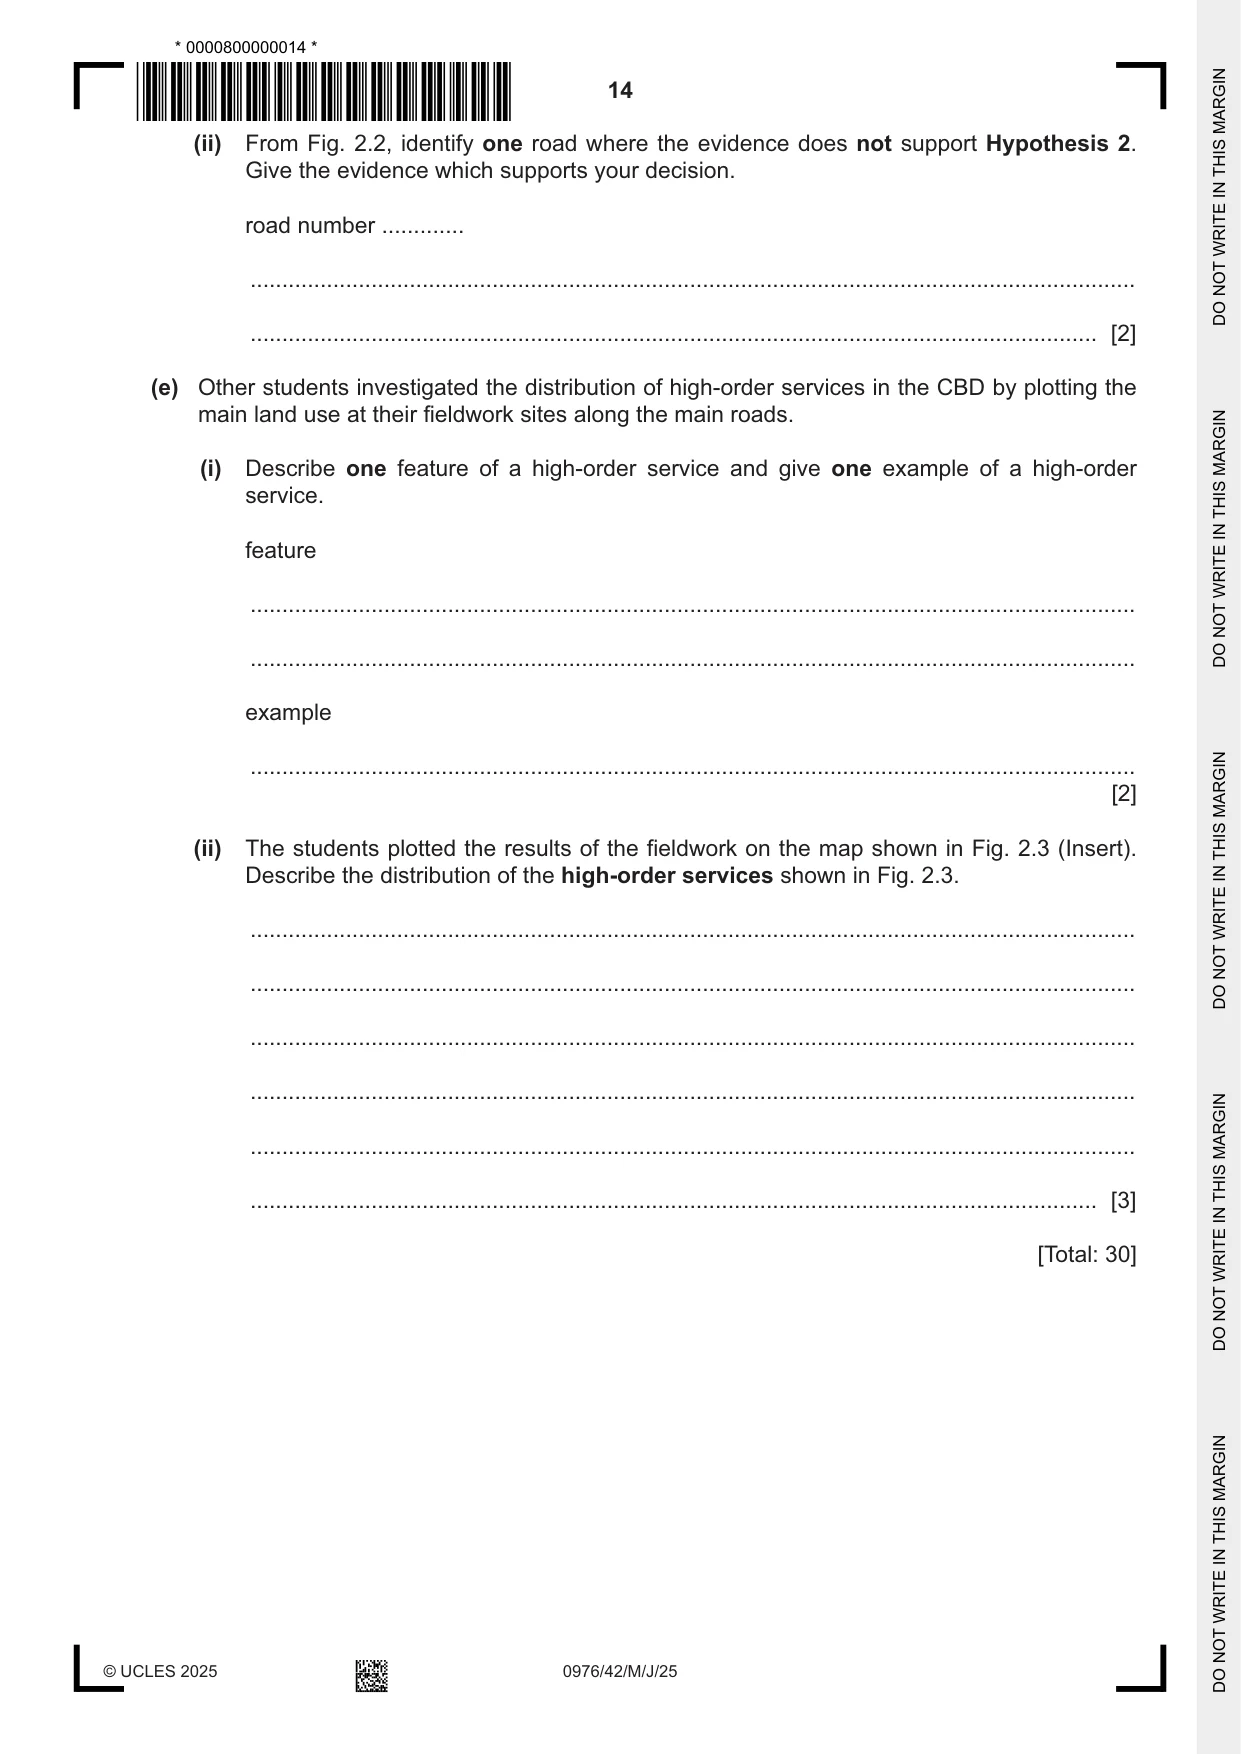
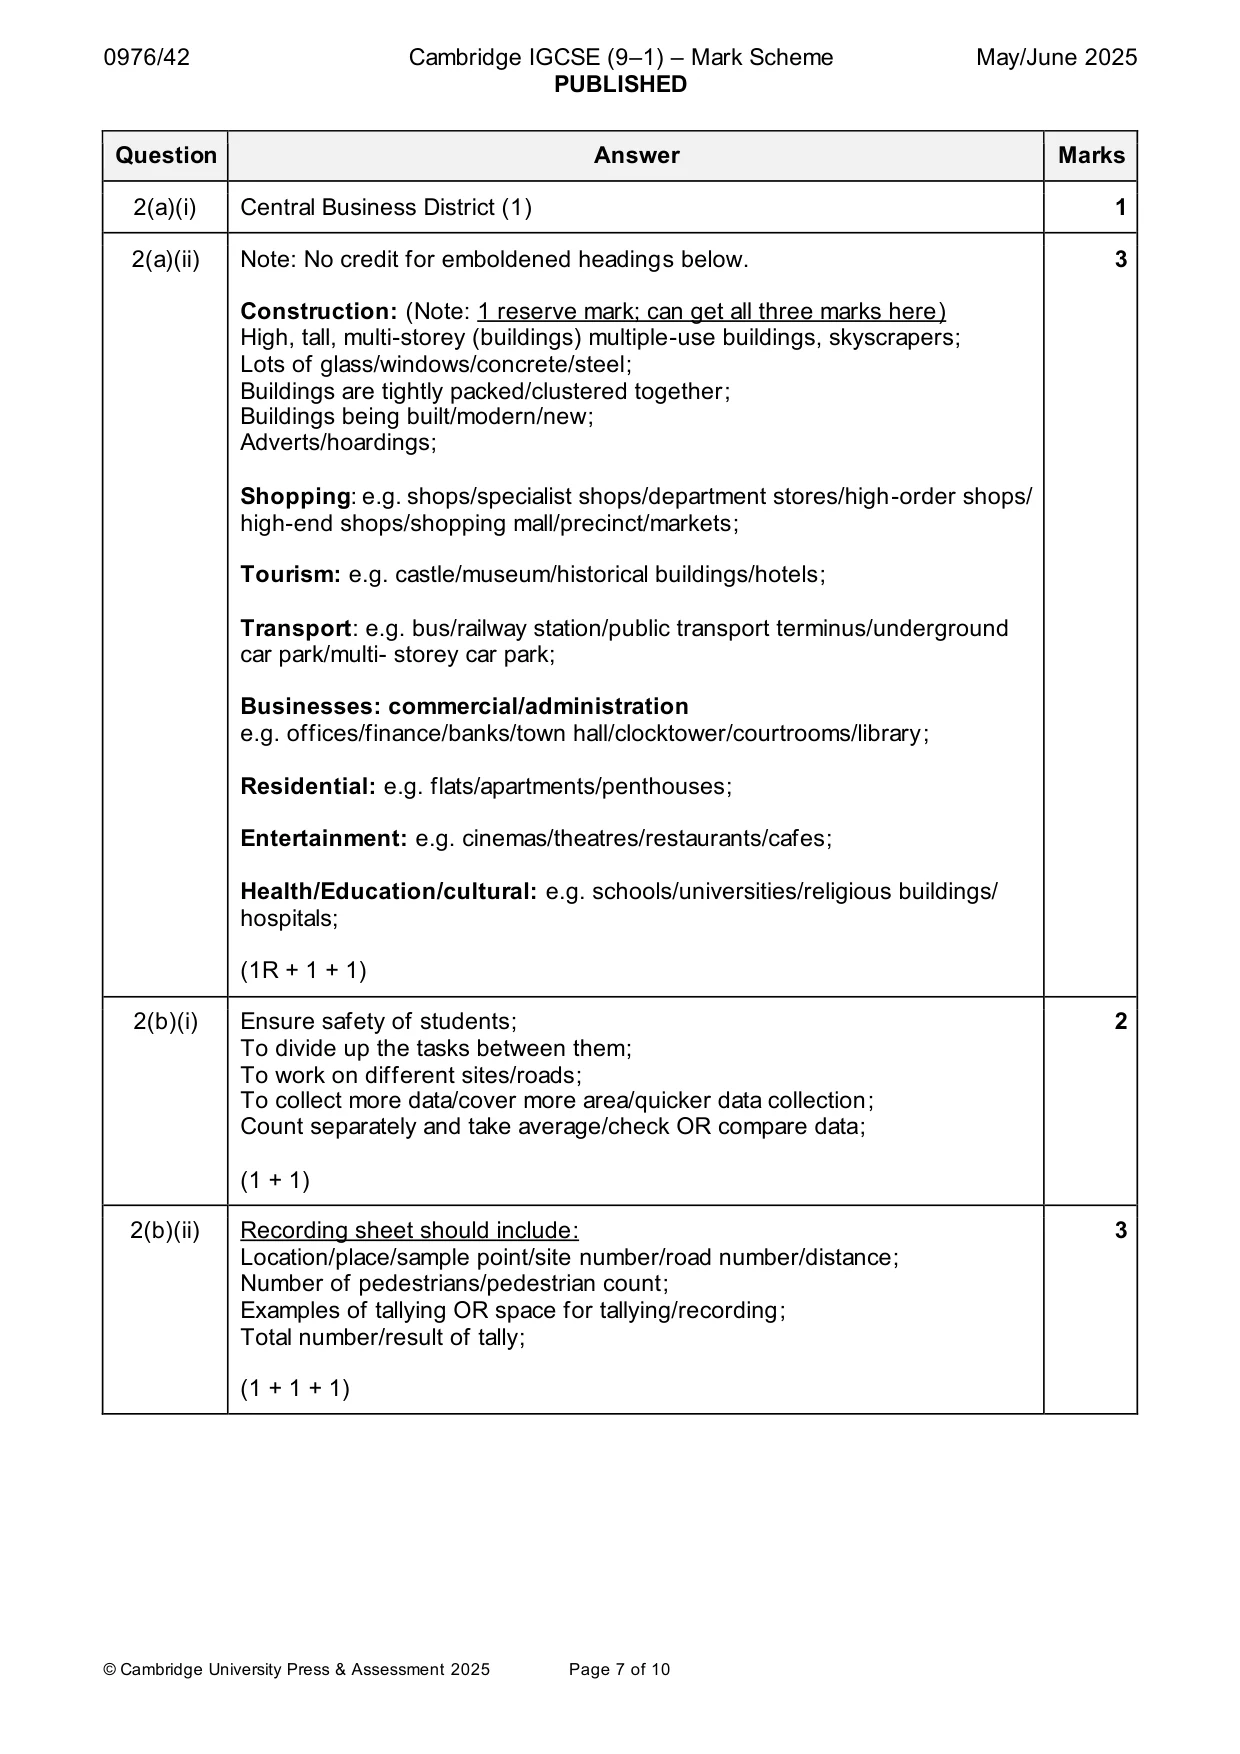
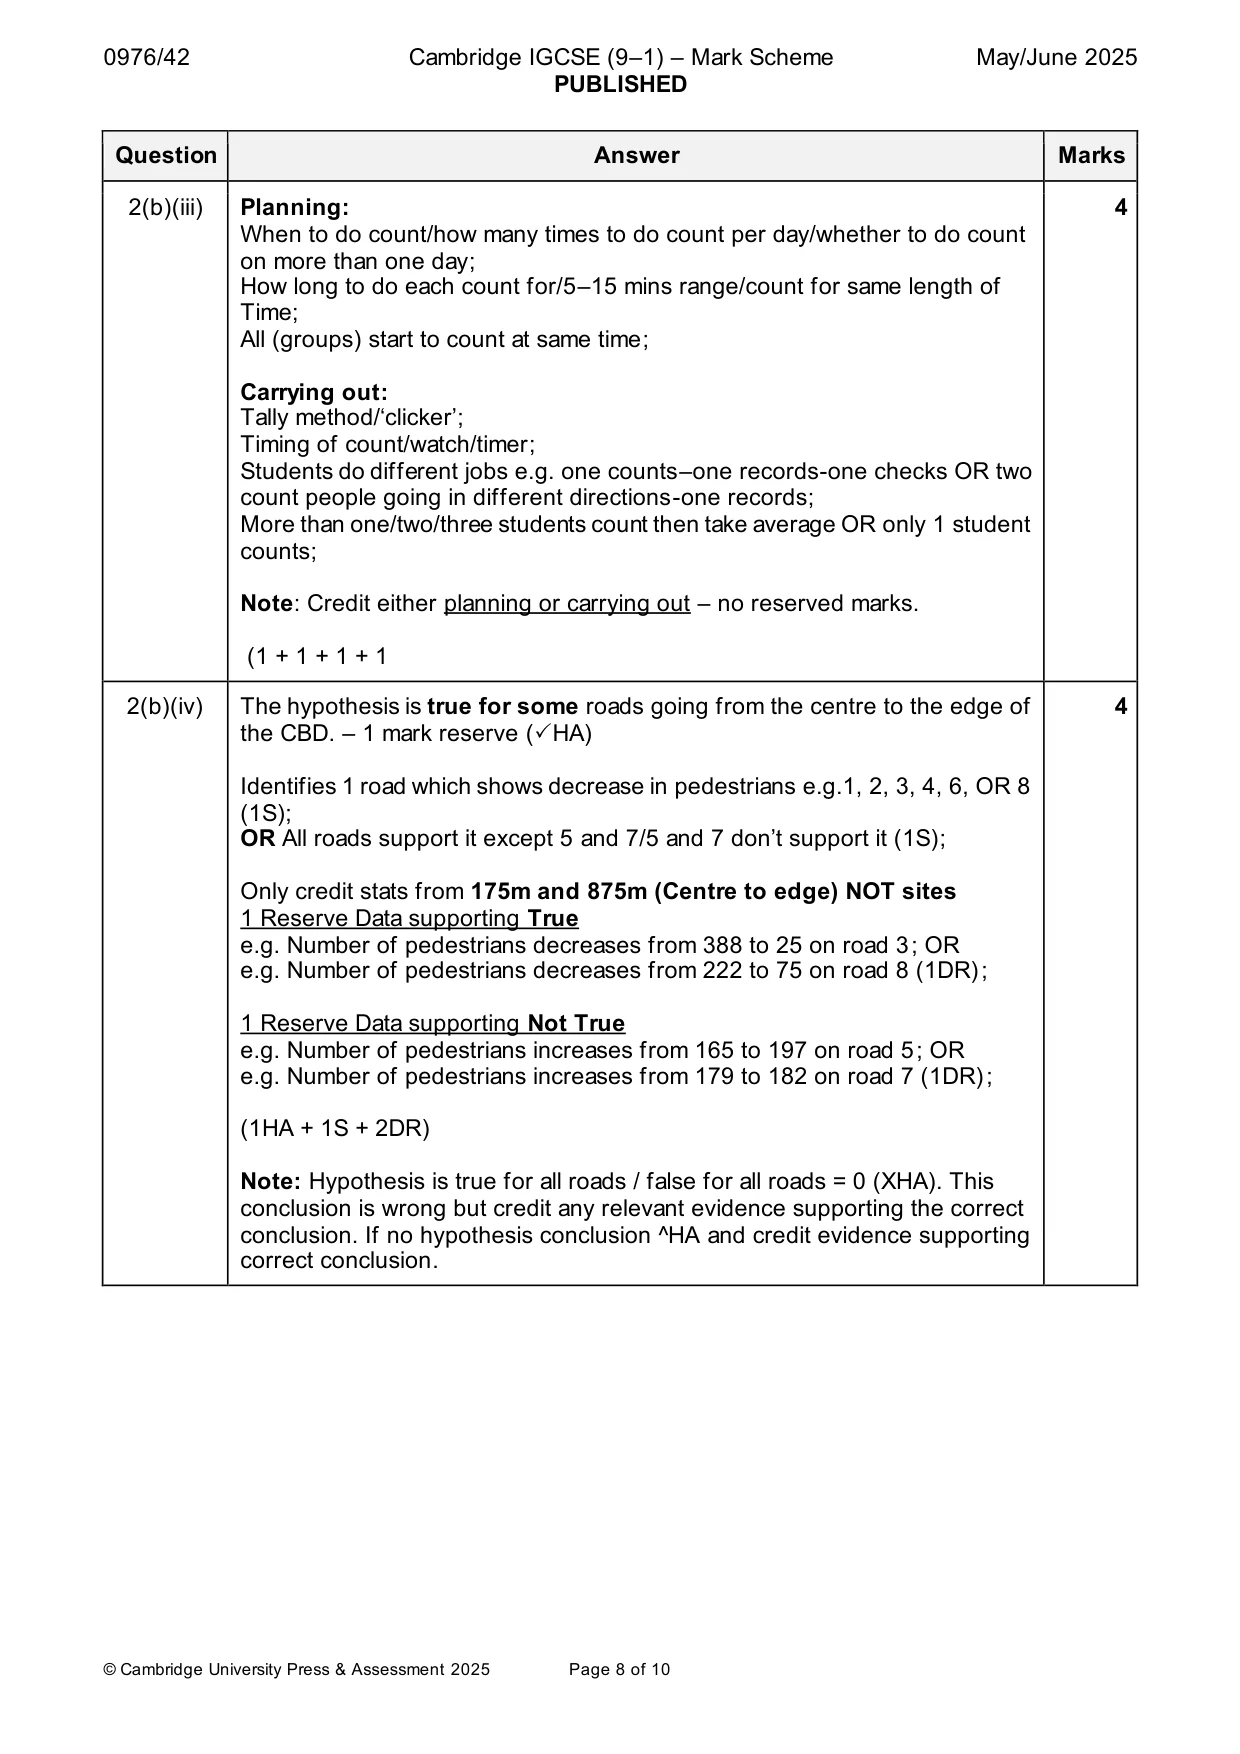
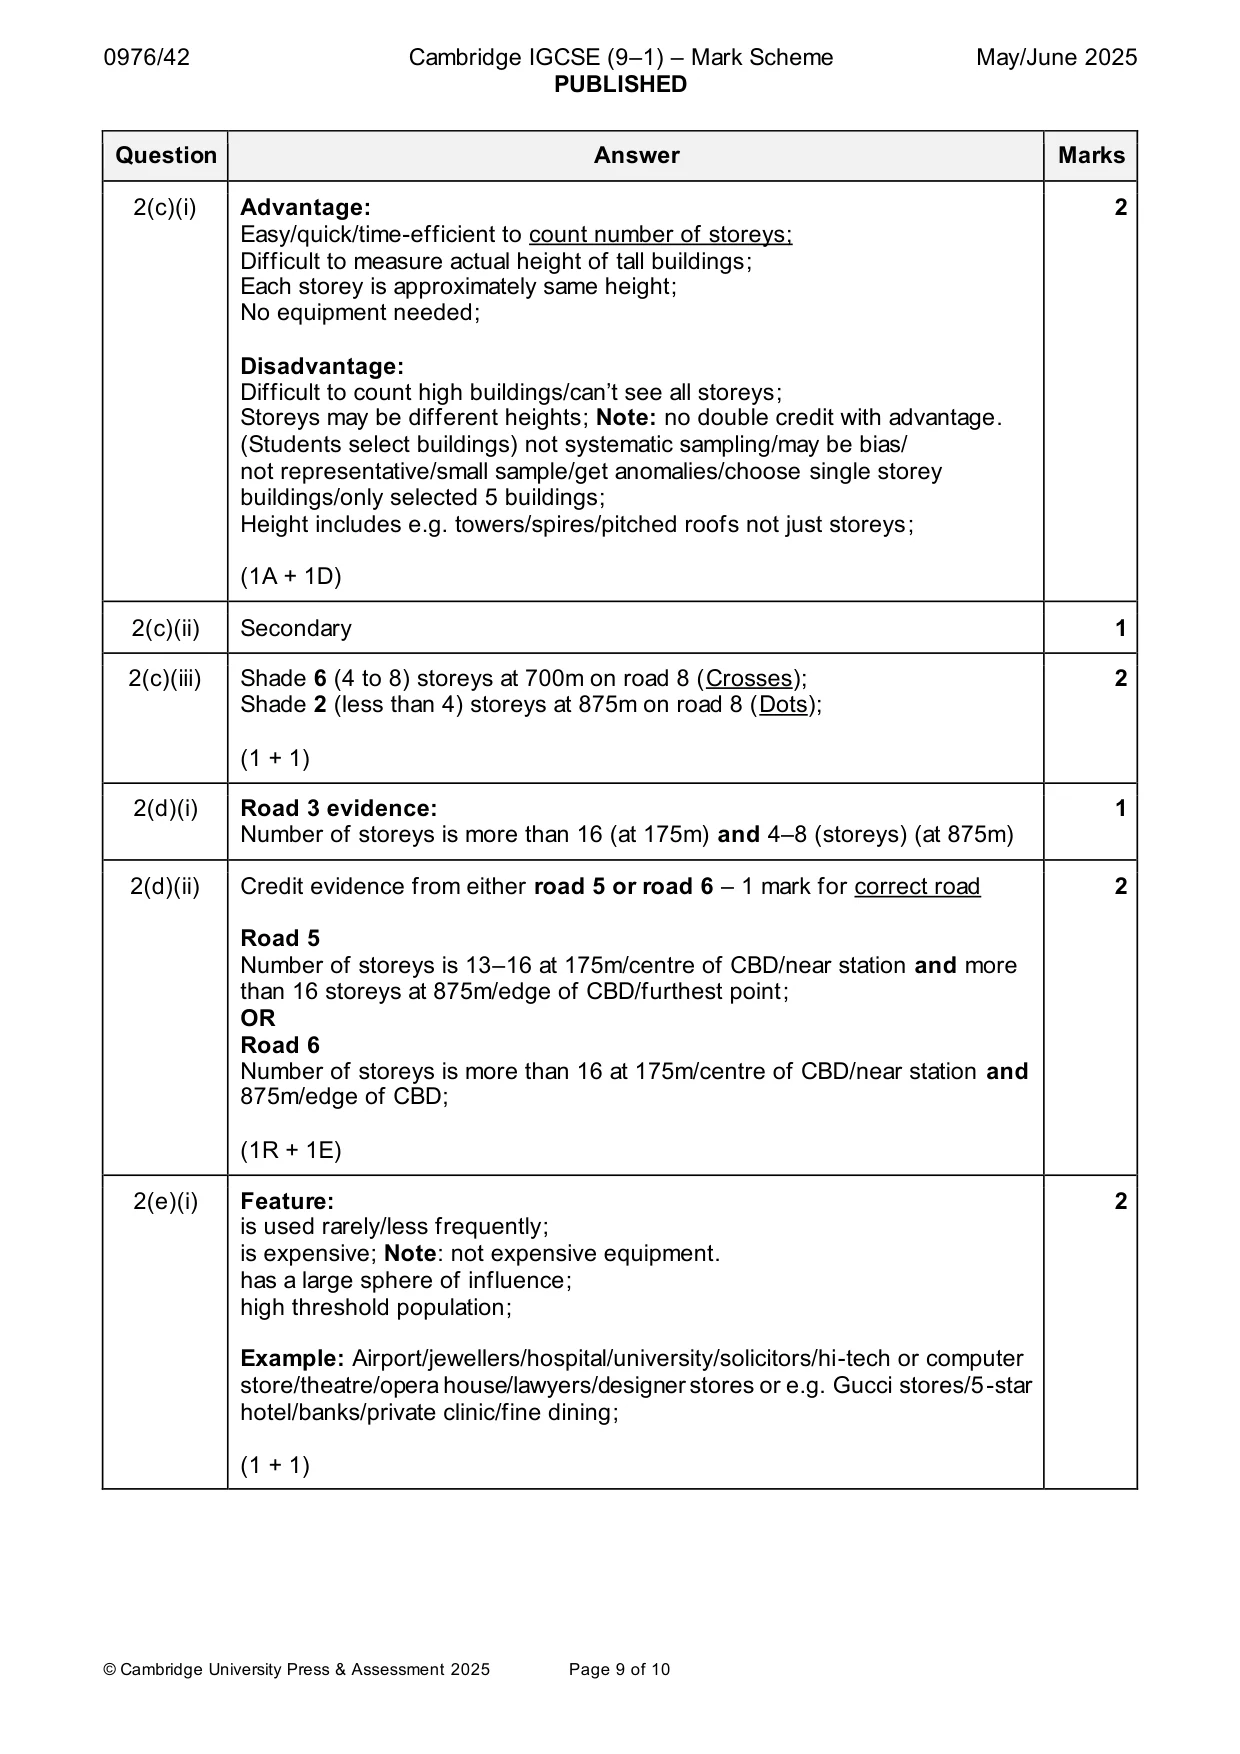
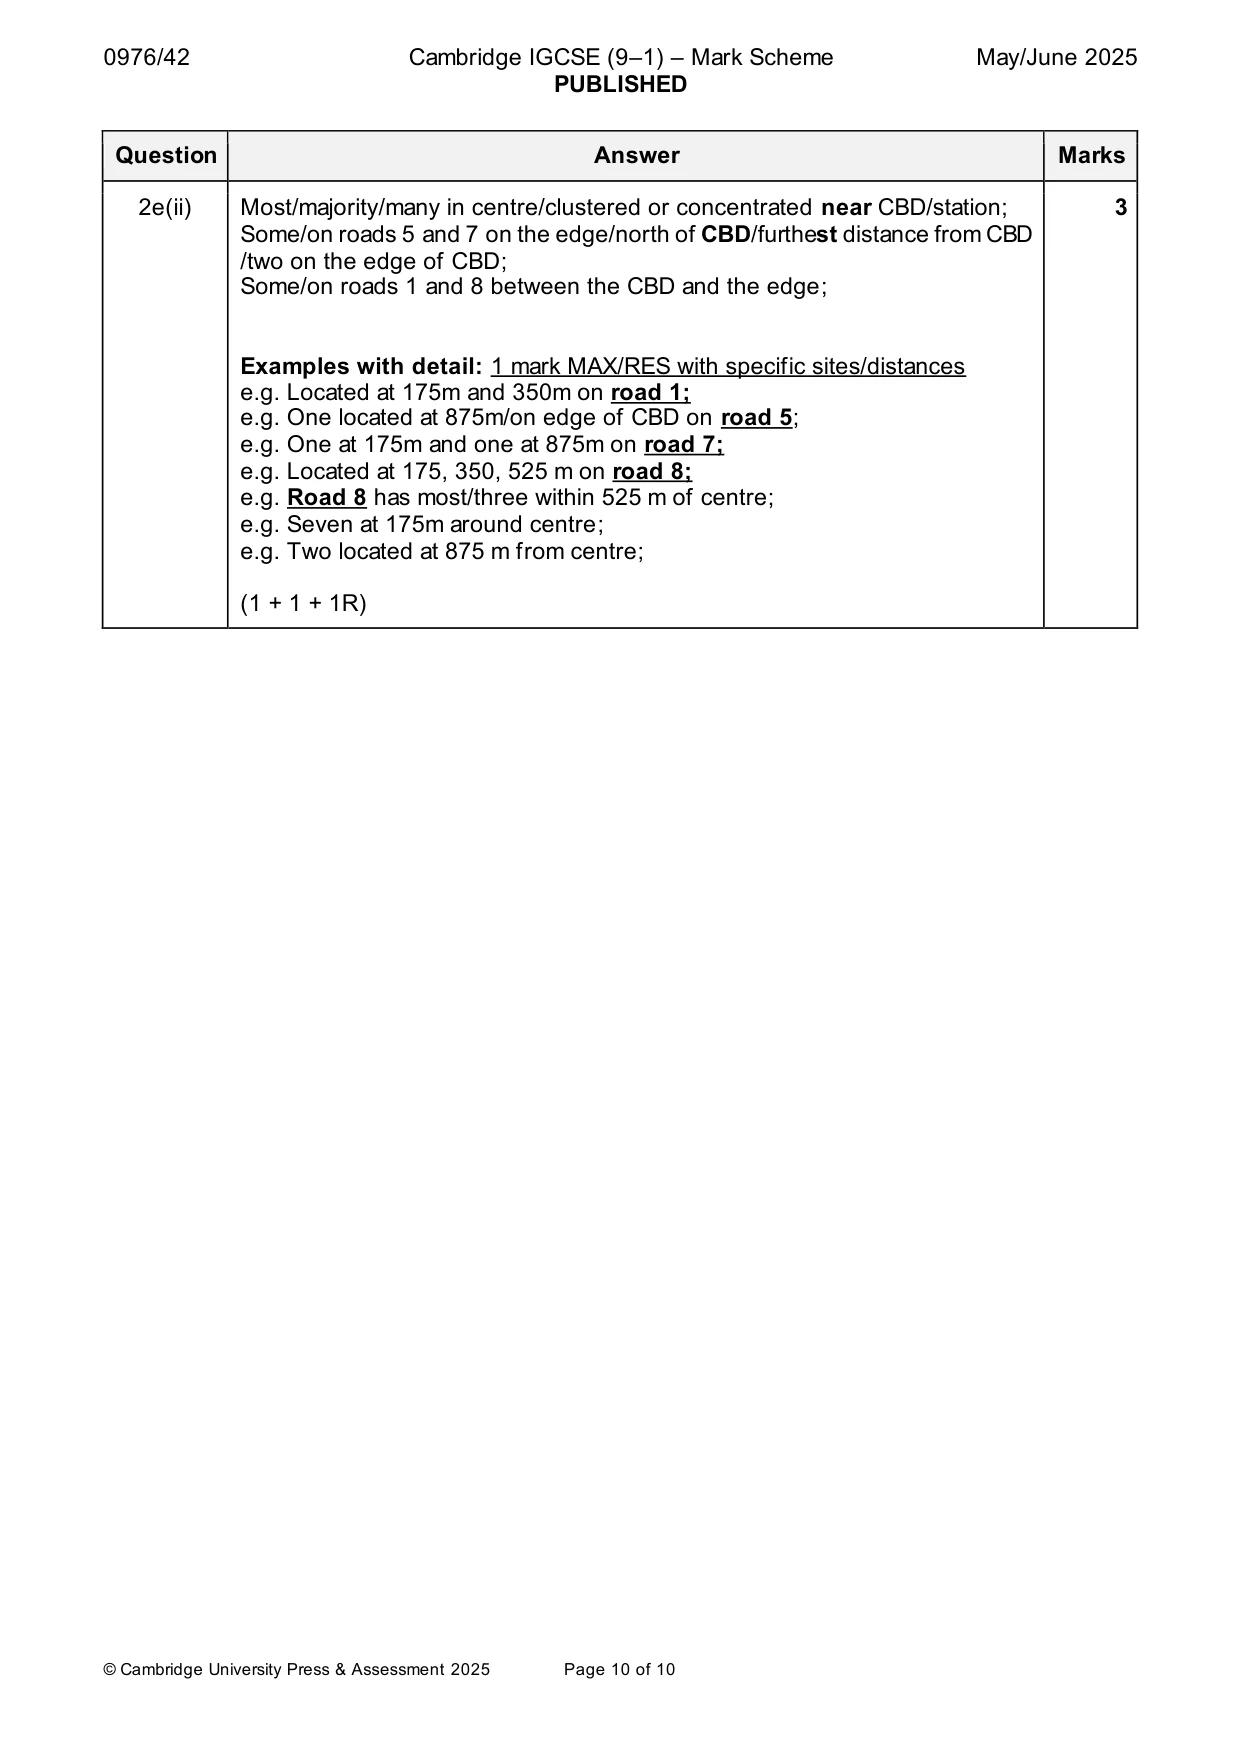
Mark scheme: 2(a)(i) Central Business District (1) 1 2(a)(ii) Note: No credit for emboldened headings below. 3 Construction: (Note: 1 reserve mark; can get all three marks here) High, tall, multi-storey (buildings) multiple-use buildings, skyscrapers; Lots of glass/windows/concrete/steel; Buildings are tightly packed/clustered together; Buildings being built/modern/new; Adverts/hoardings; Shopping: e.g. shops/specialist shops/department stores/high-order shops/ high-end shops/shopping mall/precinct/markets; Tourism: e.g. castle/museum/historical buildings/hotels; Transport: e.g. bus/railway station/public transport terminus/underground car park/multi- storey car park; Businesses: commercial/administration e.g. offices/finance/banks/town hall/clocktower/courtrooms/library; Residential: e.g. flats/apartments/penthouses; Entertainment: e.g. cinemas/theatres/restaurants/cafes; Health/Education/cultural: e.g. schools/universities/religious buildings/ hospitals; (1R + 1 + 1) 2(b)(i) Ensure safety of students; 2 To divide up the tasks between them; To work on different sites/roads; To collect more data/cover more area/quicker data collection; Count separately and take average/check OR compare data; (1 + 1) 2(b)(ii) Recording sheet should include: 3 Location/place/sample point/site number/road number/distance; Number of pedestrians/pedestrian count; Examples of tallying OR space for tallying/recording; Total number/result of tally; (1 + 1 + 1) 2(b)(iii) Planning: 4 When to do count/how many times to do count per day/whether to do count on more than one day; How long to do each count for/5–15 mins range/count for same length of Time; All (groups) start to count at same time; Carrying out: Tally method/‘clicker’; Timing of count/watch/timer; Students do different jobs e.g. one counts–one records-one checks OR two count people going in different directions-one records; More than one/two/three students count then take average OR only 1 student counts; Note: Credit either planning or carrying out – no reserved marks. (1 + 1 + 1 + 1 2(b)(iv) The hypothesis is true for some roads going from the centre to the edge of 4 the CBD. – 1 mark reserve (HA) Identifies 1 road which shows decrease in pedestrians e.g.1, 2, 3, 4, 6, OR 8 (1S); OR All roads support it except 5 and 7/5 and 7 don’t support it (1S); Only credit stats from 175m and 875m (Centre to edge) NOT sites 1 Reserve Data supporting True e.g. Number of pedestrians decreases from 388 to 25 on road 3; OR e.g. Number of pedestrians decreases from 222 to 75 on road 8 (1DR); 1 Reserve Data supporting Not True e.g. Number of pedestrians increases from 165 to 197 on road 5; OR e.g. Number of pedestrians increases from 179 to 182 on road 7 (1DR); (1HA + 1S + 2DR) Note: Hypothesis is true for all roads / false for all roads = 0 (XHA). This conclusion is wrong but credit any relevant evidence supporting the correct conclusion. If no hypothesis conclusion ^HA and credit evidence supporting correct conclusion. 2(c)(i) Advantage: 2 Easy/quick/time-efficient to count number of storeys; Difficult to measure actual height of tall buildings; Each storey is approximately same height; No equipment needed; Disadvantage: Difficult to count high buildings/can’t see all storeys; Storeys may be different heights; Note: no double credit with advantage. (Students select buildings) not systematic sampling/may be bias/ not representative/small sample/get anomalies/choose single storey buildings/only selected 5 buildings; Height includes e.g. towers/spires/pitched roofs not just storeys; (1A + 1D) 2(c)(ii) Secondary 1 2(c)(iii) Shade 6 (4 to 8) storeys at 700m on road 8 (Crosses); 2 Shade 2 (less than 4) storeys at 875m on road 8 (Dots); (1 + 1) 2(d)(i) Road 3 evidence: 1 Number of storeys is more than 16 (at 175m) and 4–8 (storeys) (at 875m) 2(d)(ii) Credit evidence from either road 5 or road 6 – 1 mark for correct road 2 Road 5 Number of storeys is 13–16 at 175m/centre of CBD/near station and more than 16 storeys at 875m/edge of CBD/furthest point; OR Road 6 Number of storeys is more than 16 at 175m/centre of CBD/near station and 875m/edge of CBD; (1R + 1E) 2(e)(i) Feature: 2 is used rarely/less frequently; is expensive; Note: not expensive equipment. has a large sphere of influence; high threshold population; Example: Airport/jewellers/hospital/university/solicitors/hi-tech or computer store/theatre/opera house/lawyers/designer stores or e.g. Gucci stores/5-star hotel/banks/private clinic/fine dining; (1 + 1) 2e(ii) Most/majority/many in centre/clustered or concentrated near CBD/station; 3 Some/on roads 5 and 7 on the edge/north of CBD/furthest distance from CBD /two on the edge of CBD; Some/on roads 1 and 8 between the CBD and the edge; Examples with detail: 1 mark MAX/RES with specific sites/distances e.g. Located at 175m and 350m on road 1; e.g. One located at 875m/on edge of CBD on road 5; e.g. One at 175m and one at 875m on road 7; e.g. Located at 175, 350, 525 m on road 8; e.g. Road 8 has most/three within 525 m of centre; e.g. Seven at 175m around centre; e.g. Two located at 875 m from centre; (1 + 1 + 1R)
What was in this paper
The subtopics covered by these 2 questions, and how many questions each got. Open one in a new tab to see every Cambridge question on it.
What you needed in this session
Cambridge’s own grade thresholds for 2025 May/June, Paper 4 · Variant 2. A higher threshold means an easier paper — the bar moves with how the cohort did.