Cambridge IGCSE Geography (9-1) 0976 — 2023 Oct/Nov Paper 4 · Variant 2
0976/42/O/N/23 · 2 questions · 60 marks · ≈68 min
The question paper and its mark scheme, free to read here and free to download. This is Cambridge’s own paper, exactly as it was sat.
Question paper20 pages

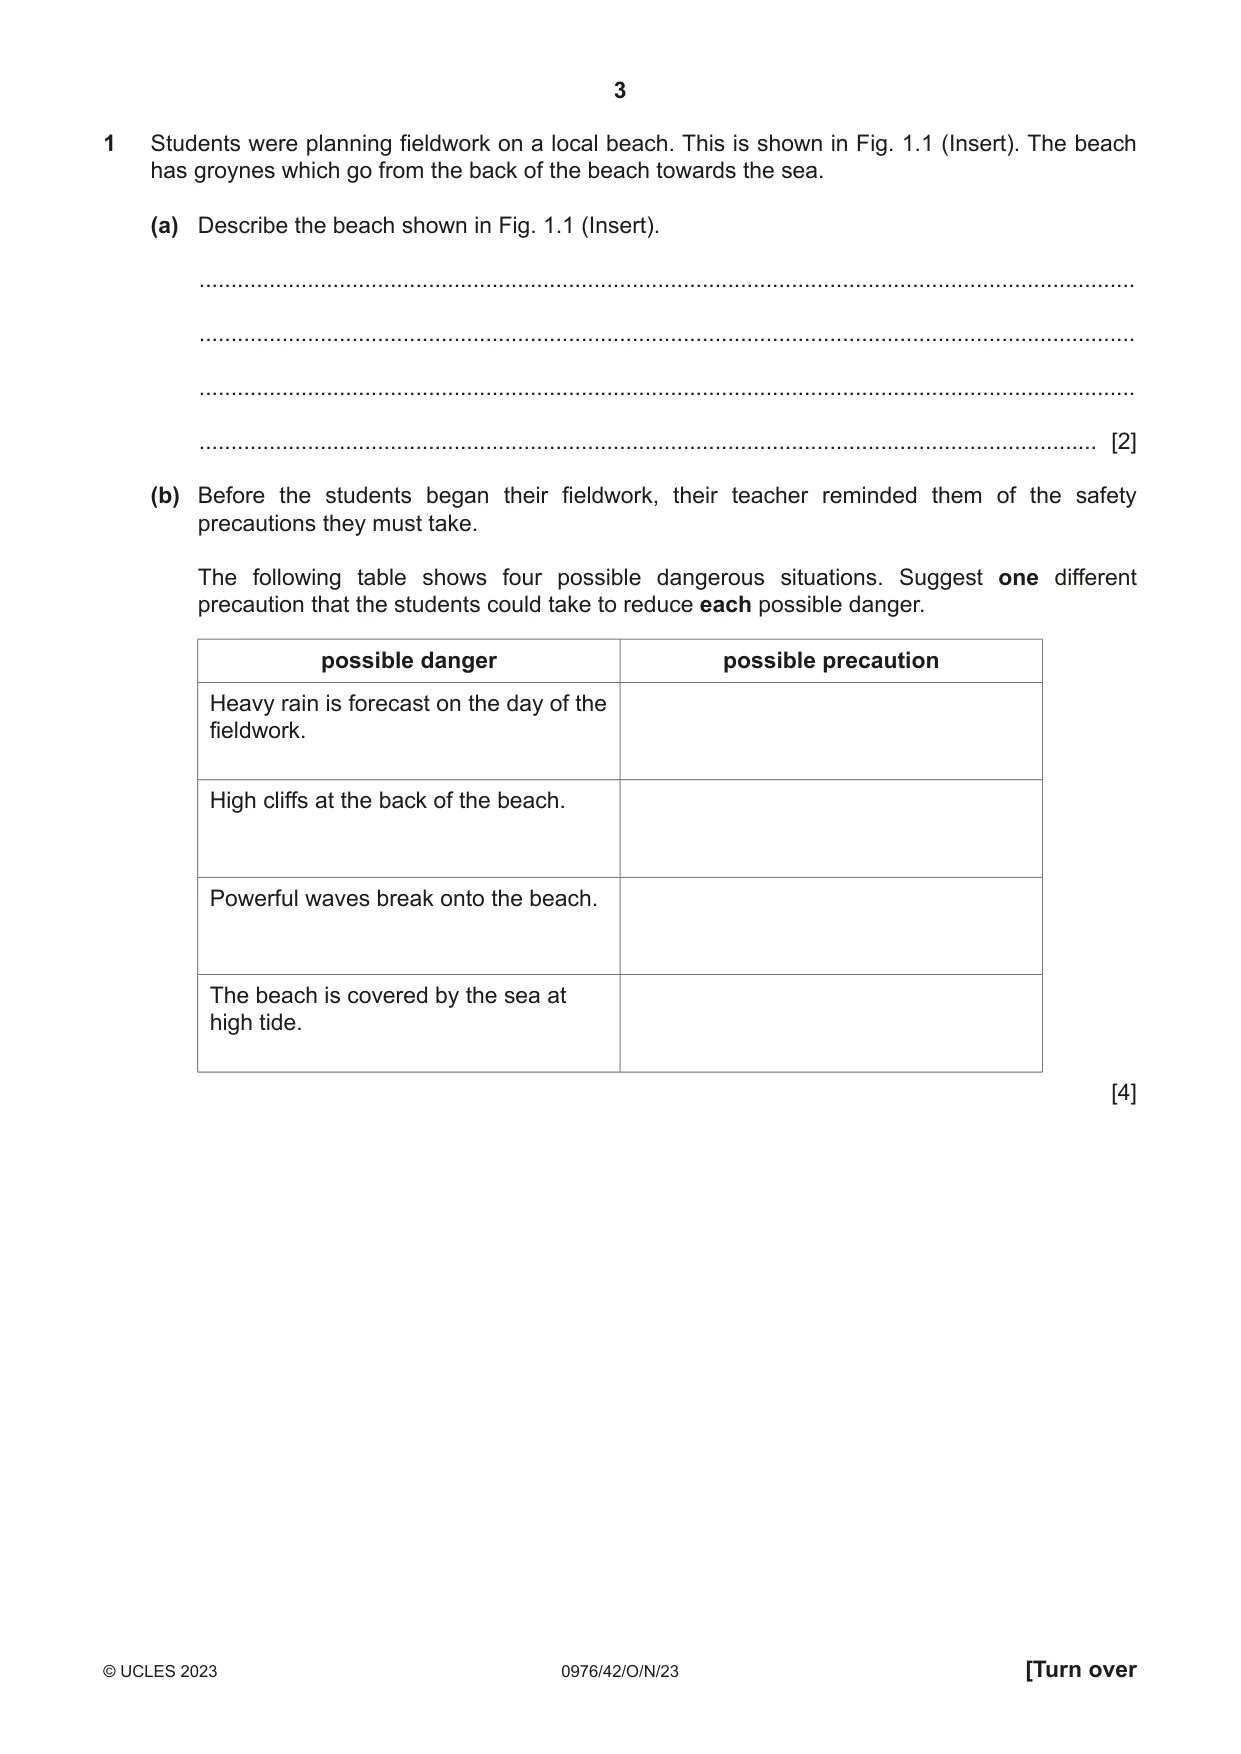
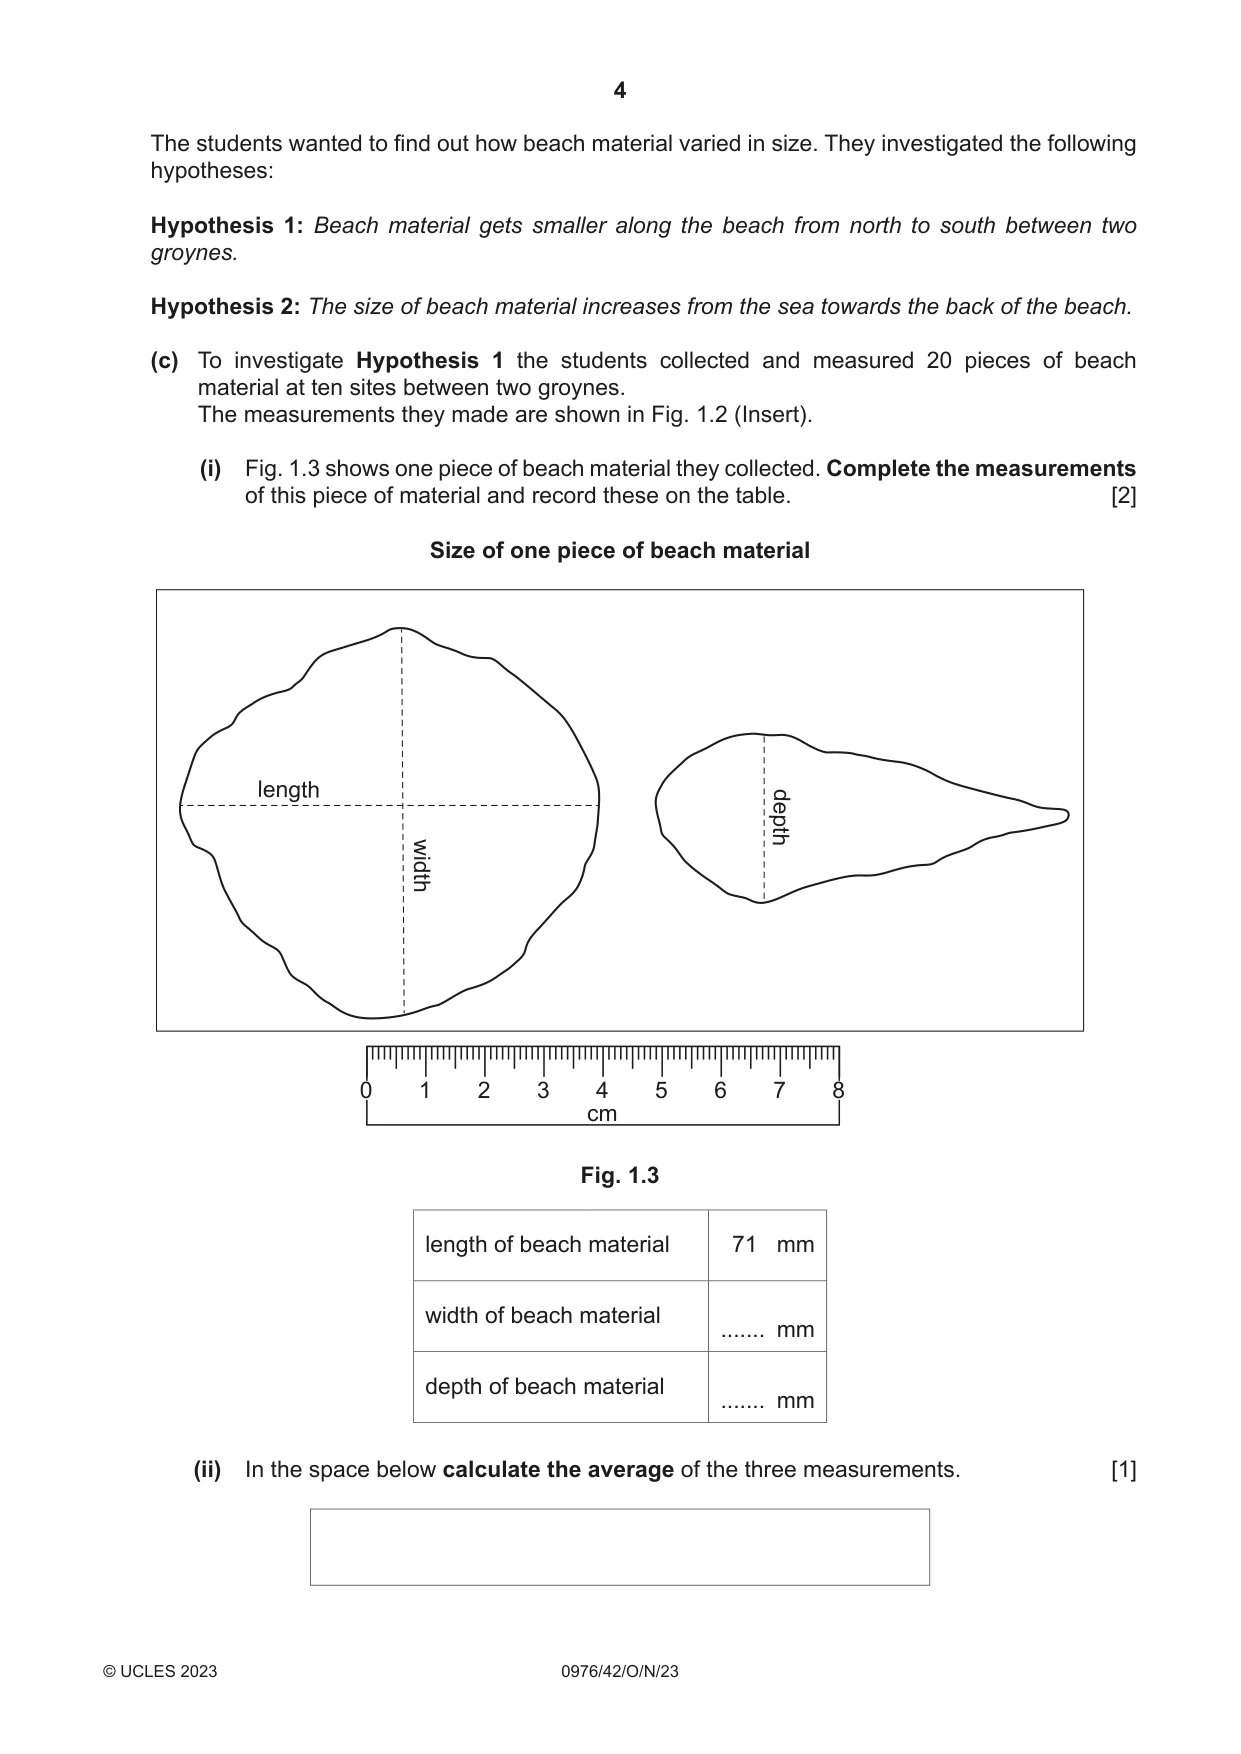
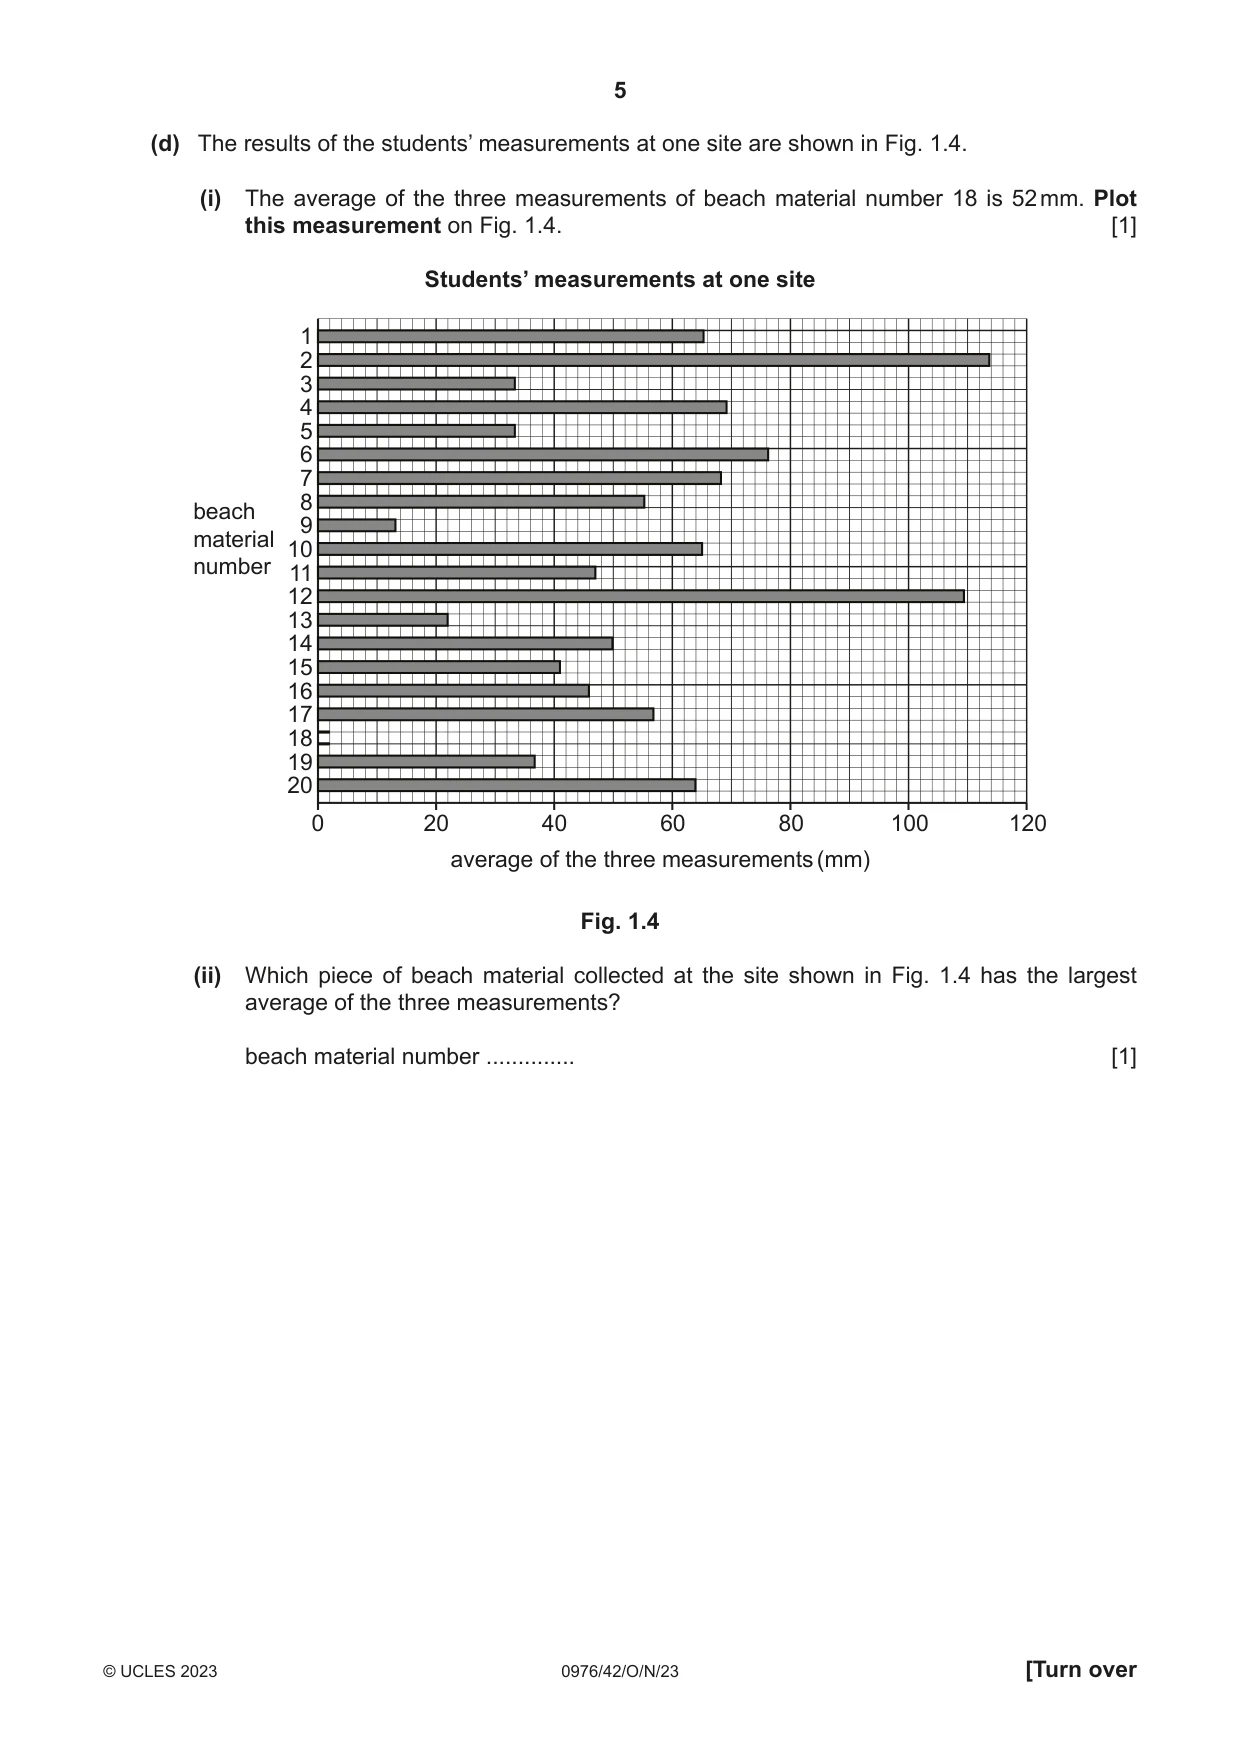





Mark scheme9 pages
Answers below. Sit the paper first if you are practising.
Questions as text
Q1 · Students were planning fieldwork on a local beach
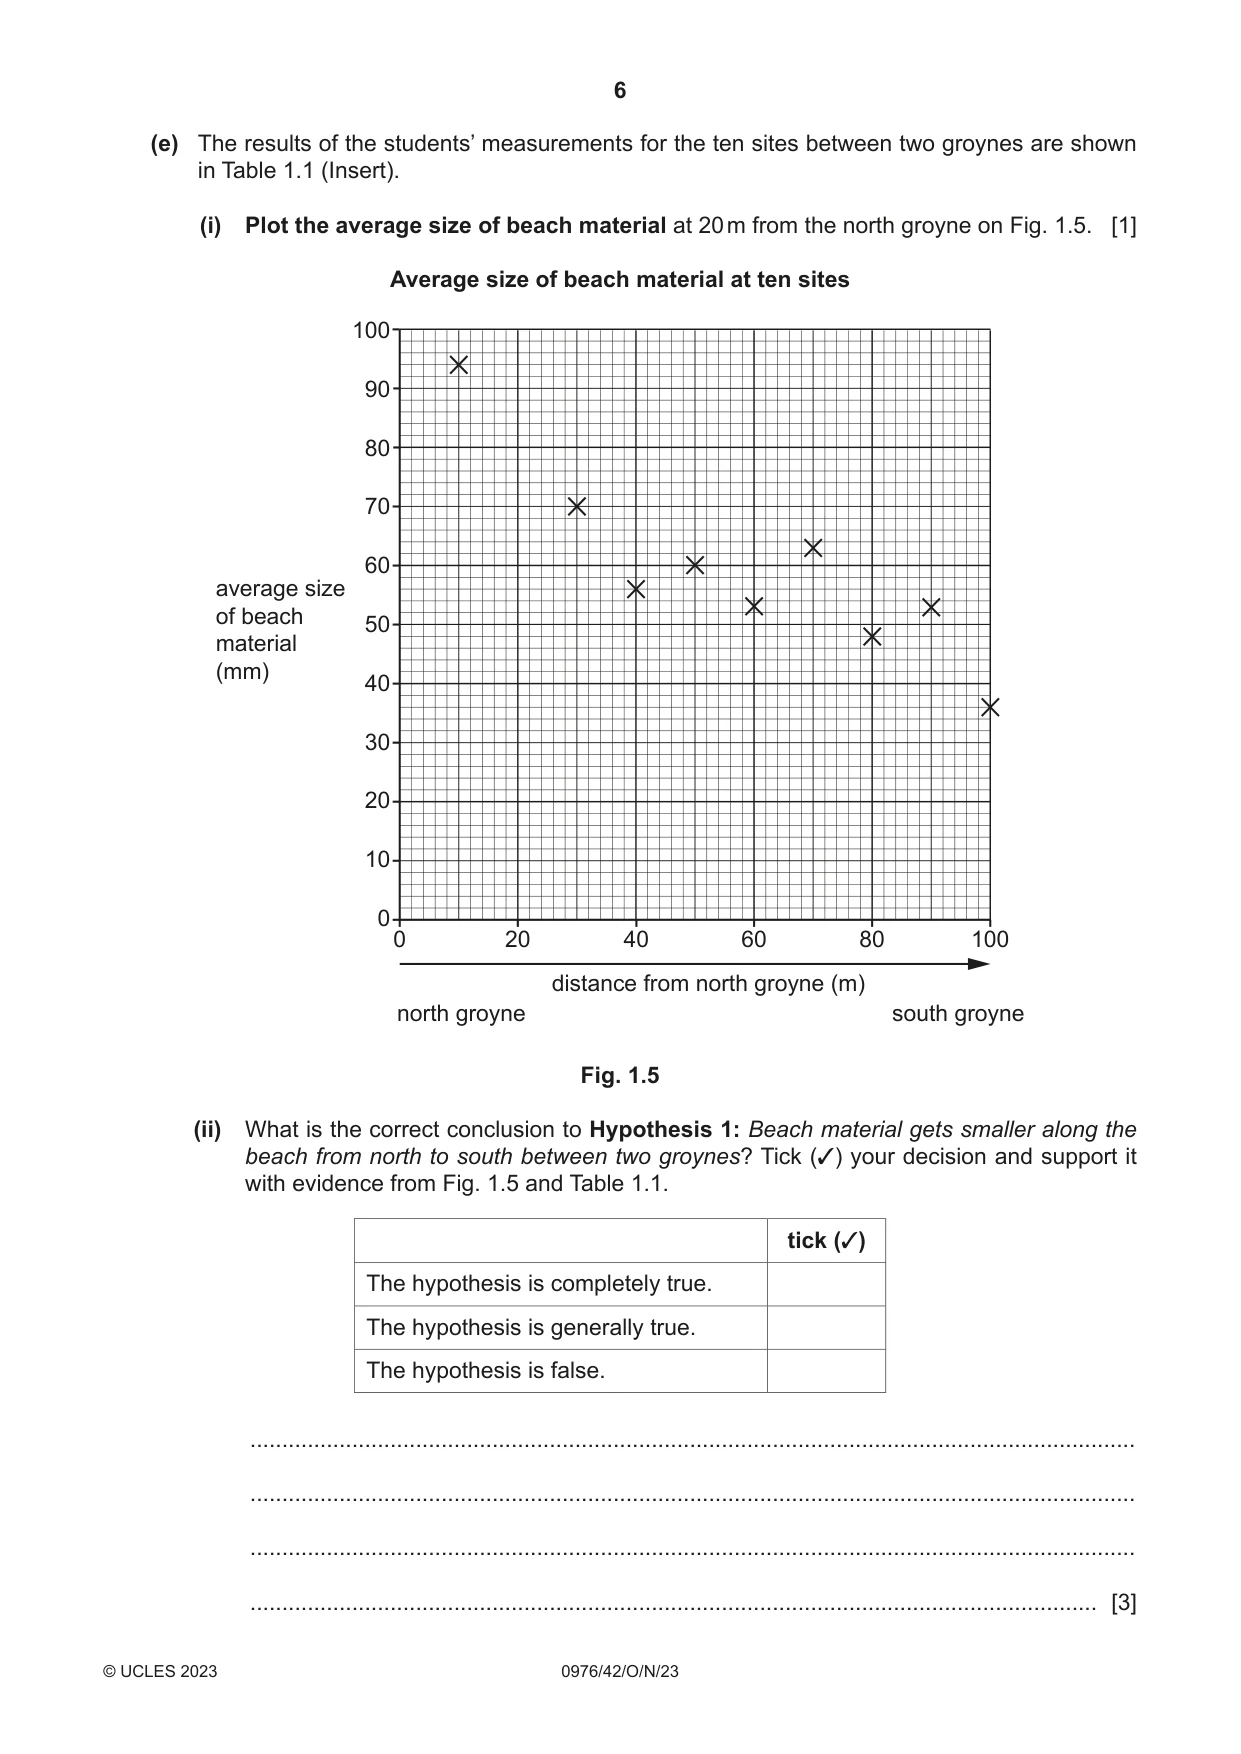
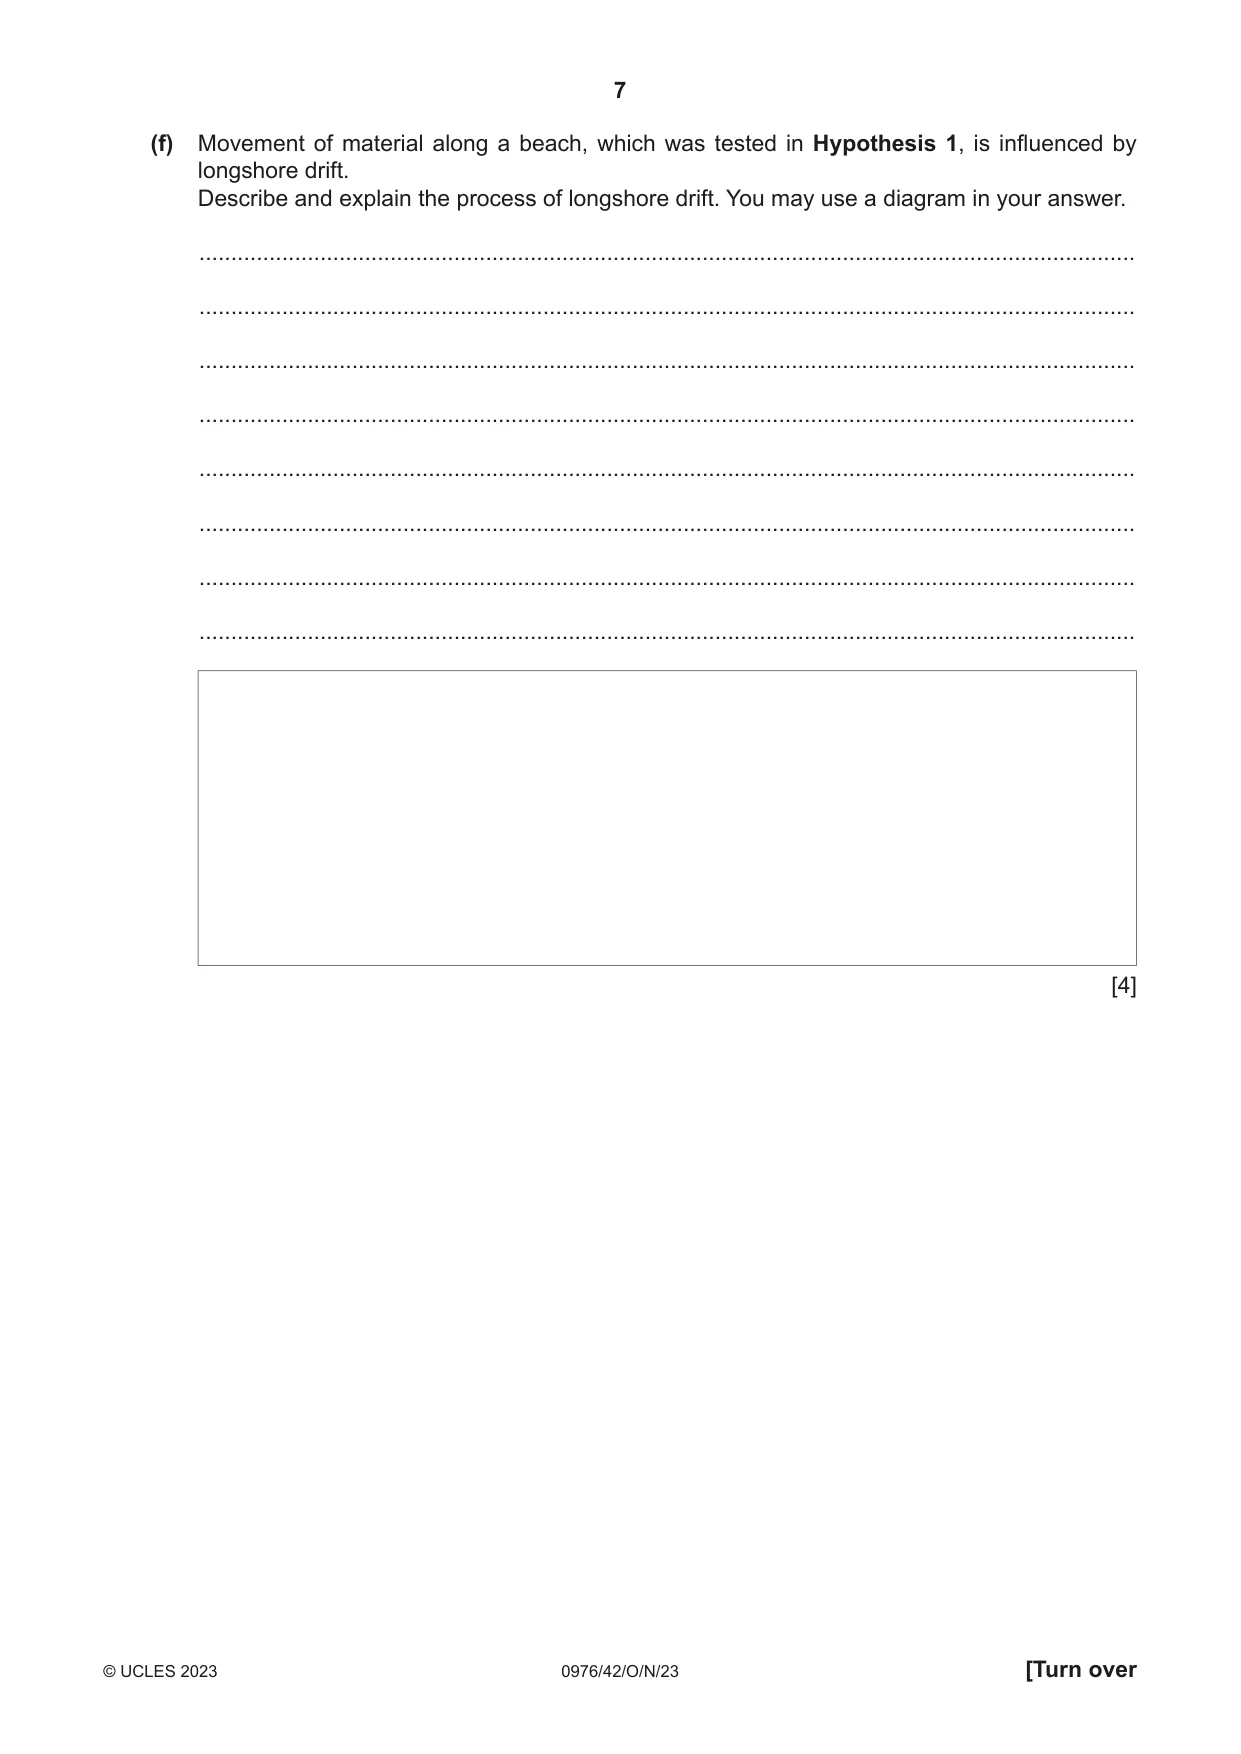
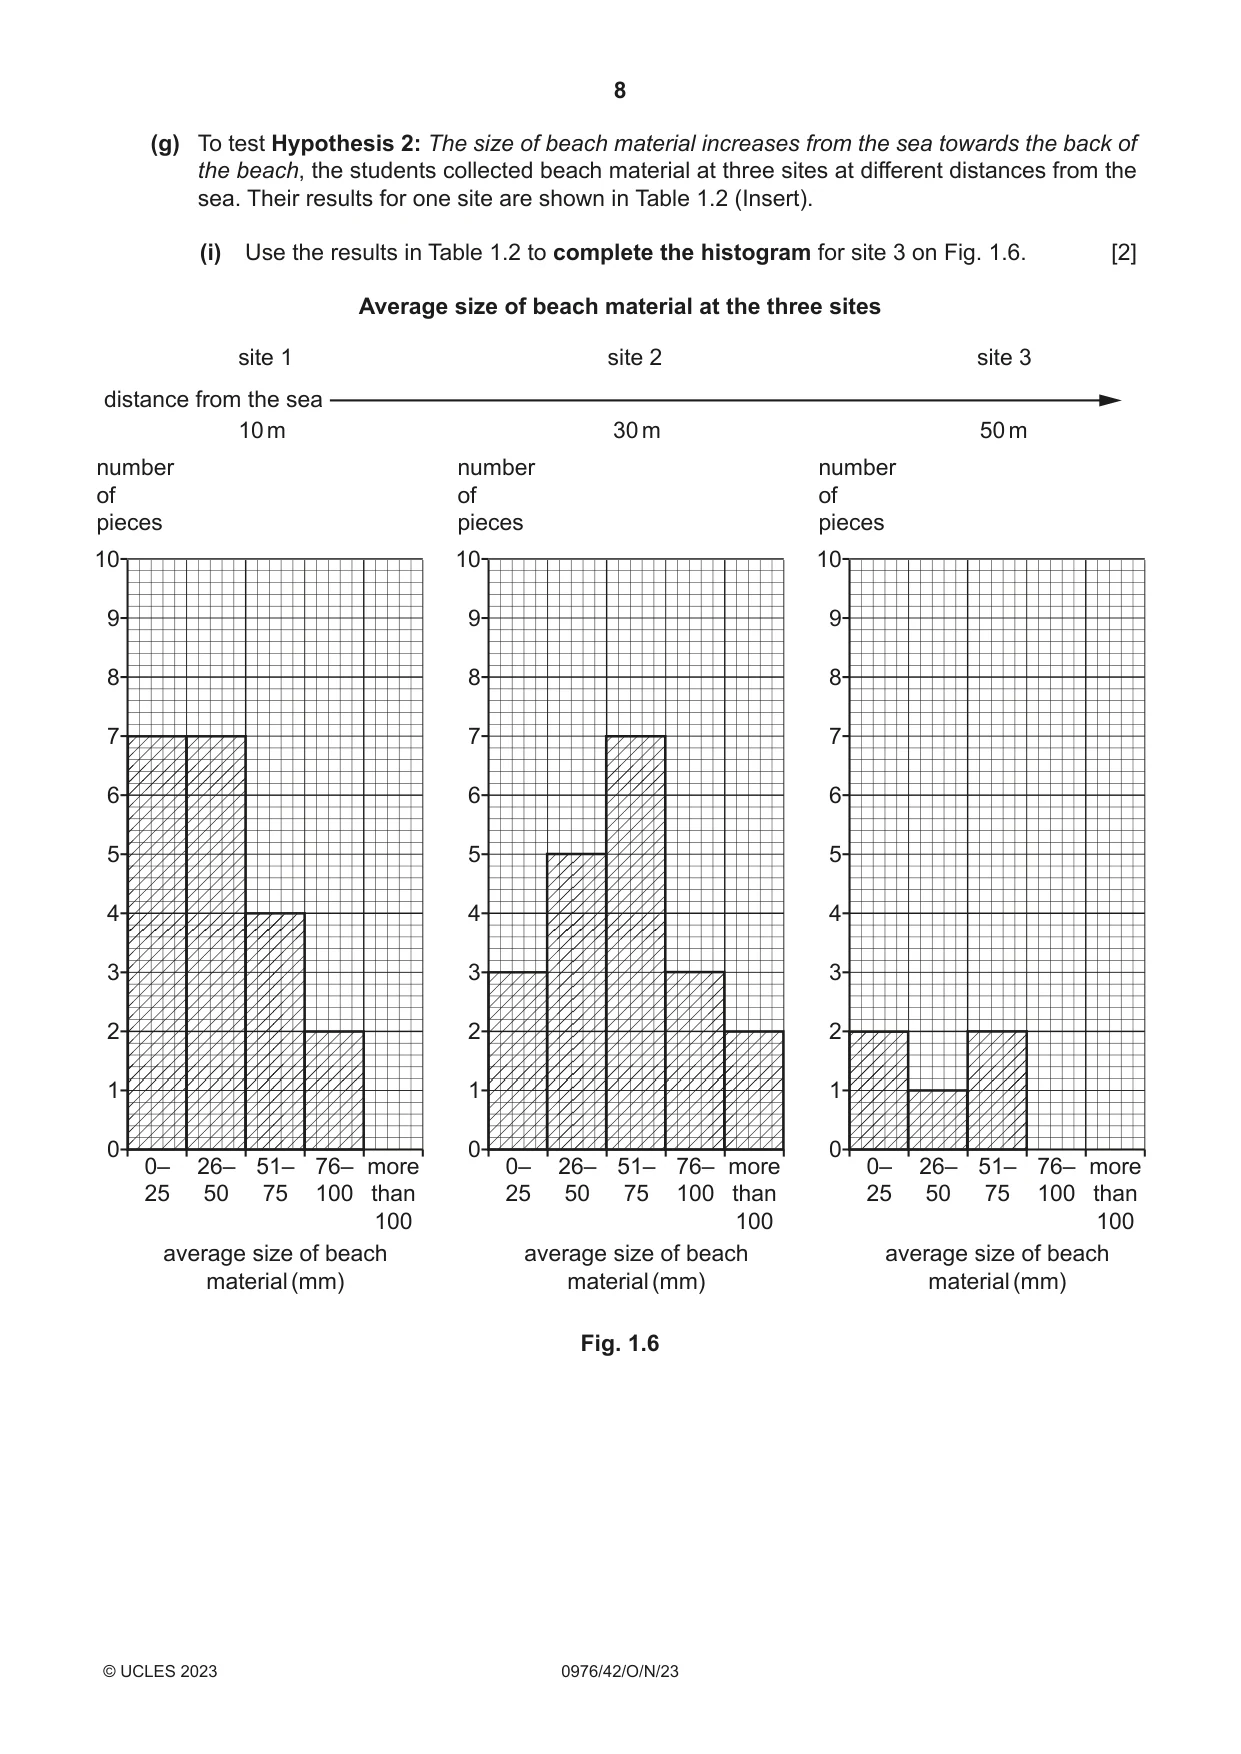
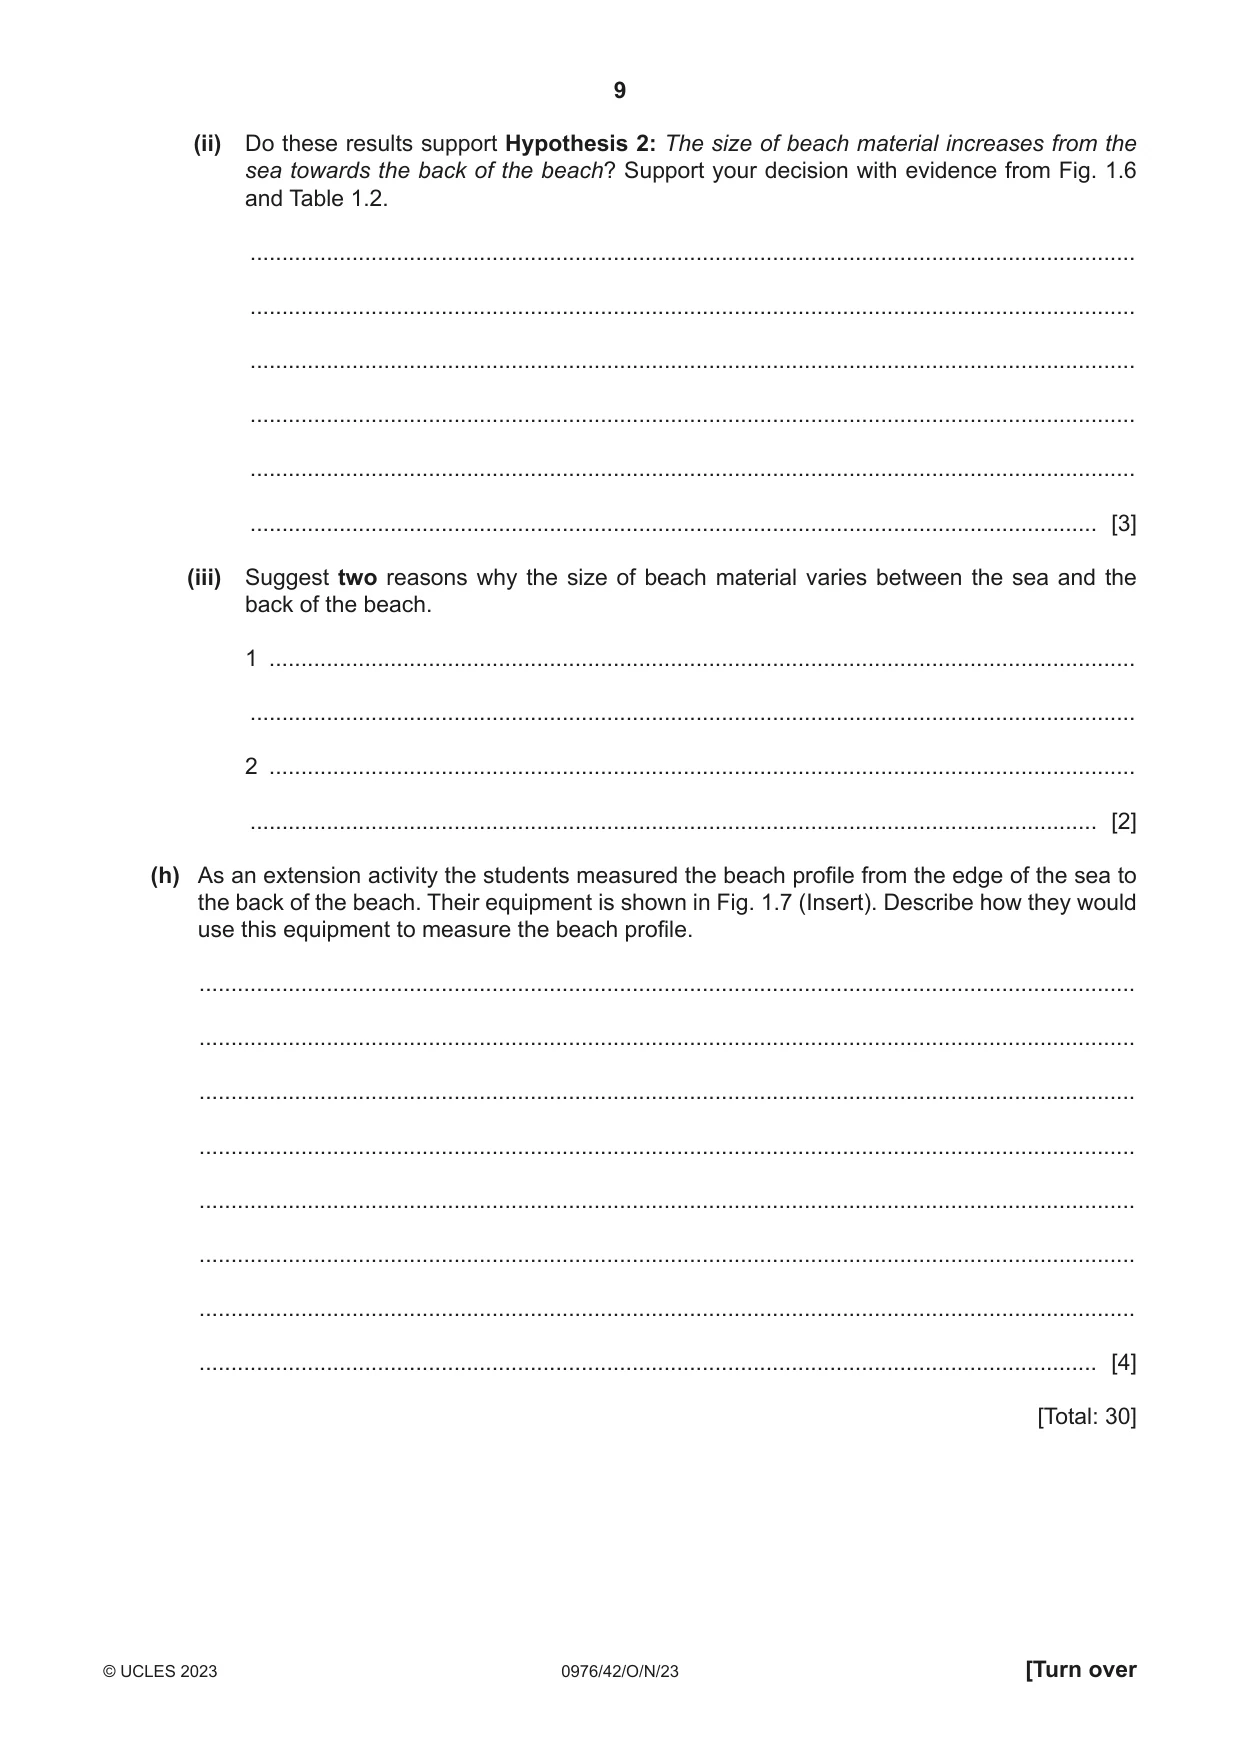
1 Students were planning fieldwork on a local beach. This is shown in Fig. 1.1 (Insert). The beach has groynes which go from the back of the beach towards the sea. (a) Describe the beach shown in Fig. 1.1 (Insert). ................................................................................................................................................... ................................................................................................................................................... ................................................................................................................................................... ............................................................................................................................................. [2] (b) Before the students began their fieldwork, their teacher reminded them of the safety precautions they must take. The following table shows four possible dangerous situations. Suggest one different precaution that the students could take to reduce each possible danger. possible danger possible precaution Heavy rain is forecast on the day of the fieldwork. High cliffs at the back of the beach. Powerful waves break onto the beach. The beach is covered by the sea at high tide. [4] The students wanted to find out how beach material varied in size. They investigated the following hypotheses: Hypothesis 1: Beach material gets smaller along the beach from north to south between two groynes. Hypothesis 2: The size of beach material increases from the sea towards the back of the beach. (c) To investigate Hypothesis 1 the students collected and measured 20 pieces of beach material at ten sites between two groynes. The measurements they made are shown in Fig. 1.2 (Insert). (i) Fig. 1.3 shows one piece of beach material they collected. Complete the measurements of this piece of material and record these on the table. [2] Size of one piece of beach material length depth width 0 1 2 3 4 5 6 7 8 cm Fig. 1.3 length of beach material 71 mm width of beach material ....... mm depth of beach material ....... mm (ii) In the space below calculate the average of the three measurements. [1] (d) The results of the students’ measurements at one site are shown in Fig. 1.4. (i) The average of the three measurements of beach material number 18 is 52 mm. Plot this measurement on Fig. 1.4. [1] Students’ measurements at one site 1 2 3 4 5 6 7 8 beach 9 material 10 number 11 12 13 14 15 16 17 18 19 20 0 20 40 60 80 100 120 average of the three measurements (mm) Fig. 1.4 (ii) Which piece of beach material collected at the site shown in Fig. 1.4 has the largest average of the three measurements? beach material number .............. [1] (e) The results of the students’ measurements for the ten sites between two groynes are shown in Table 1.1 (Insert). (i) Plot the average size of beach material at 20 m from the north groyne on Fig. 1.5. [1] Average size of beach material at ten sites 100 90 80 70 60 average size of beach 50 material (mm) 40 30 20 10 0 0 20 40 60 80 100 distance from north groyne (m) north groyne south groyne Fig. 1.5 (ii) What is the correct conclusion to Hypothesis 1: Beach material gets smaller along the beach from north to south between two groynes? Tick (✓) your decision and support it with evidence from Fig. 1.5 and Table 1.1. tick (✓) The hypothesis is completely true. The hypothesis is generally true. The hypothesis is false. ........................................................................................................................................... ........................................................................................................................................... ........................................................................................................................................... ..................................................................................................................................... [3] (f) Movement of material along a beach, which was tested in Hypothesis 1, is influenced by longshore drift. Describe and explain the process of longshore drift. You may use a diagram in your answer. ................................................................................................................................................... ................................................................................................................................................... ................................................................................................................................................... ................................................................................................................................................... ................................................................................................................................................... ................................................................................................................................................... ................................................................................................................................................... ................................................................................................................................................... [4] (g) To test Hypothesis 2: The size of beach material increases from the sea towards the back of the beach, the students collected beach material at three sites at different distances from the sea. Their results for one site are shown in Table 1.2 (Insert). (i) Use the results in Table 1.2 to complete the histogram for site 3 on Fig. 1.6. [2] Average size of beach material at the three sites site 1 site 2 site 3 distance from the sea 10 m 30 m 50 m number number number of of of pieces pieces pieces 10 10 10 9 9 9 8 8 8 7 7 7 6 6 6 5 5 5 4 4 4 3 3 3 2 2 2 1 1 1 0 0 0 0– 26– 51– 76– more 0– 26– 51– 76– more 0– 26– 51– 76– more 25 50 75 100 than 25 50 75 100 than 25 50 75 100 than 100 100 100 average size of beach average size of beach average size of beach material (mm) material (mm) material (mm) Fig. 1.6 (ii) Do these results support Hypothesis 2: The size of beach material increases from the sea towards the back of the beach? Support your decision with evidence from Fig. 1.6 and Table 1.2. ........................................................................................................................................... ........................................................................................................................................... ........................................................................................................................................... ........................................................................................................................................... ........................................................................................................................................... ..................................................................................................................................... [3] (iii) Suggest two reasons why the size of beach material varies between the sea and the back of the beach. 1 ........................................................................................................................................ ........................................................................................................................................... 2 ........................................................................................................................................ ..................................................................................................................................... [2] (h) As an extension activity the students measured the beach profile from the edge of the sea to the back of the beach. Their equipment is shown in Fig. 1.7 (Insert). Describe how they would use this equipment to measure the beach profile. ................................................................................................................................................... ................................................................................................................................................... ................................................................................................................................................... ................................................................................................................................................... ................................................................................................................................................... ................................................................................................................................................... ................................................................................................................................................... ............................................................................................................................................. [4] [Total: 30]
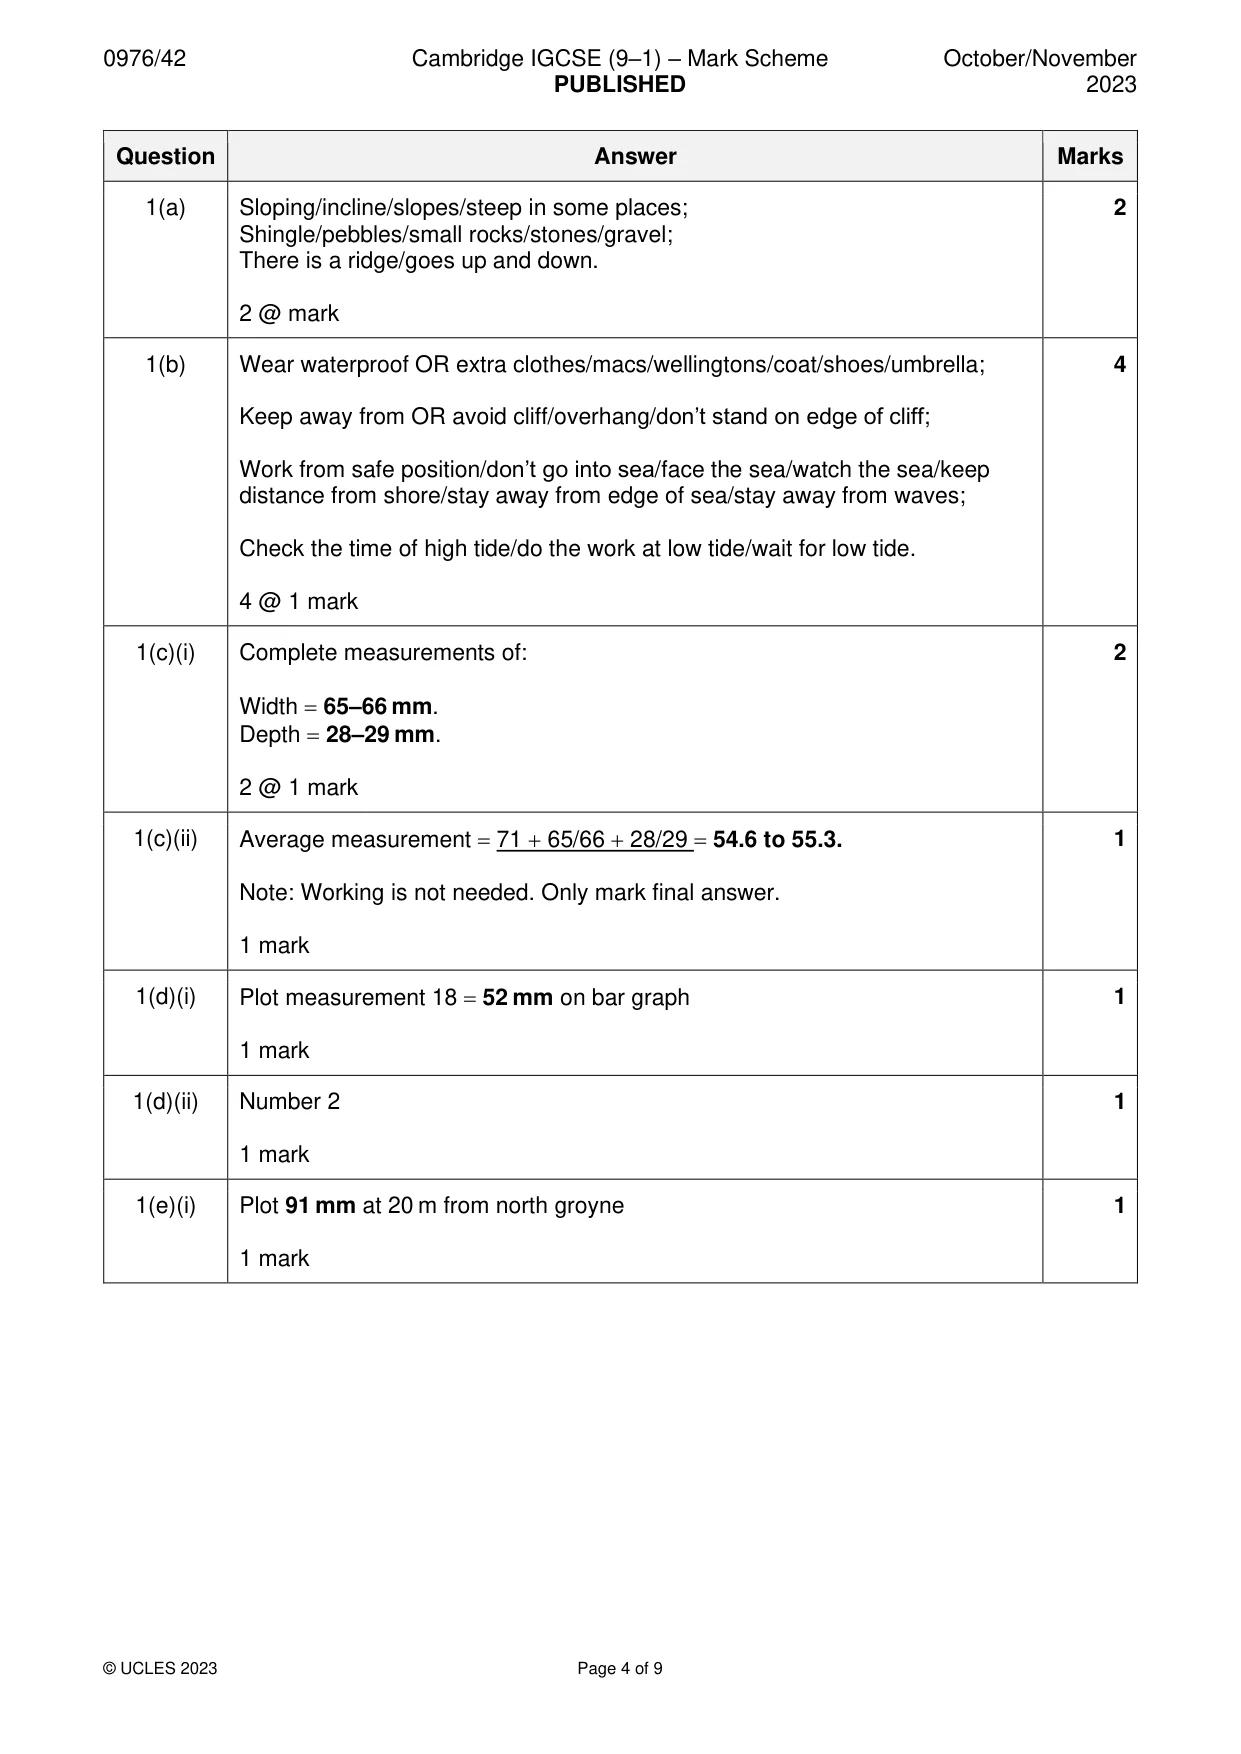
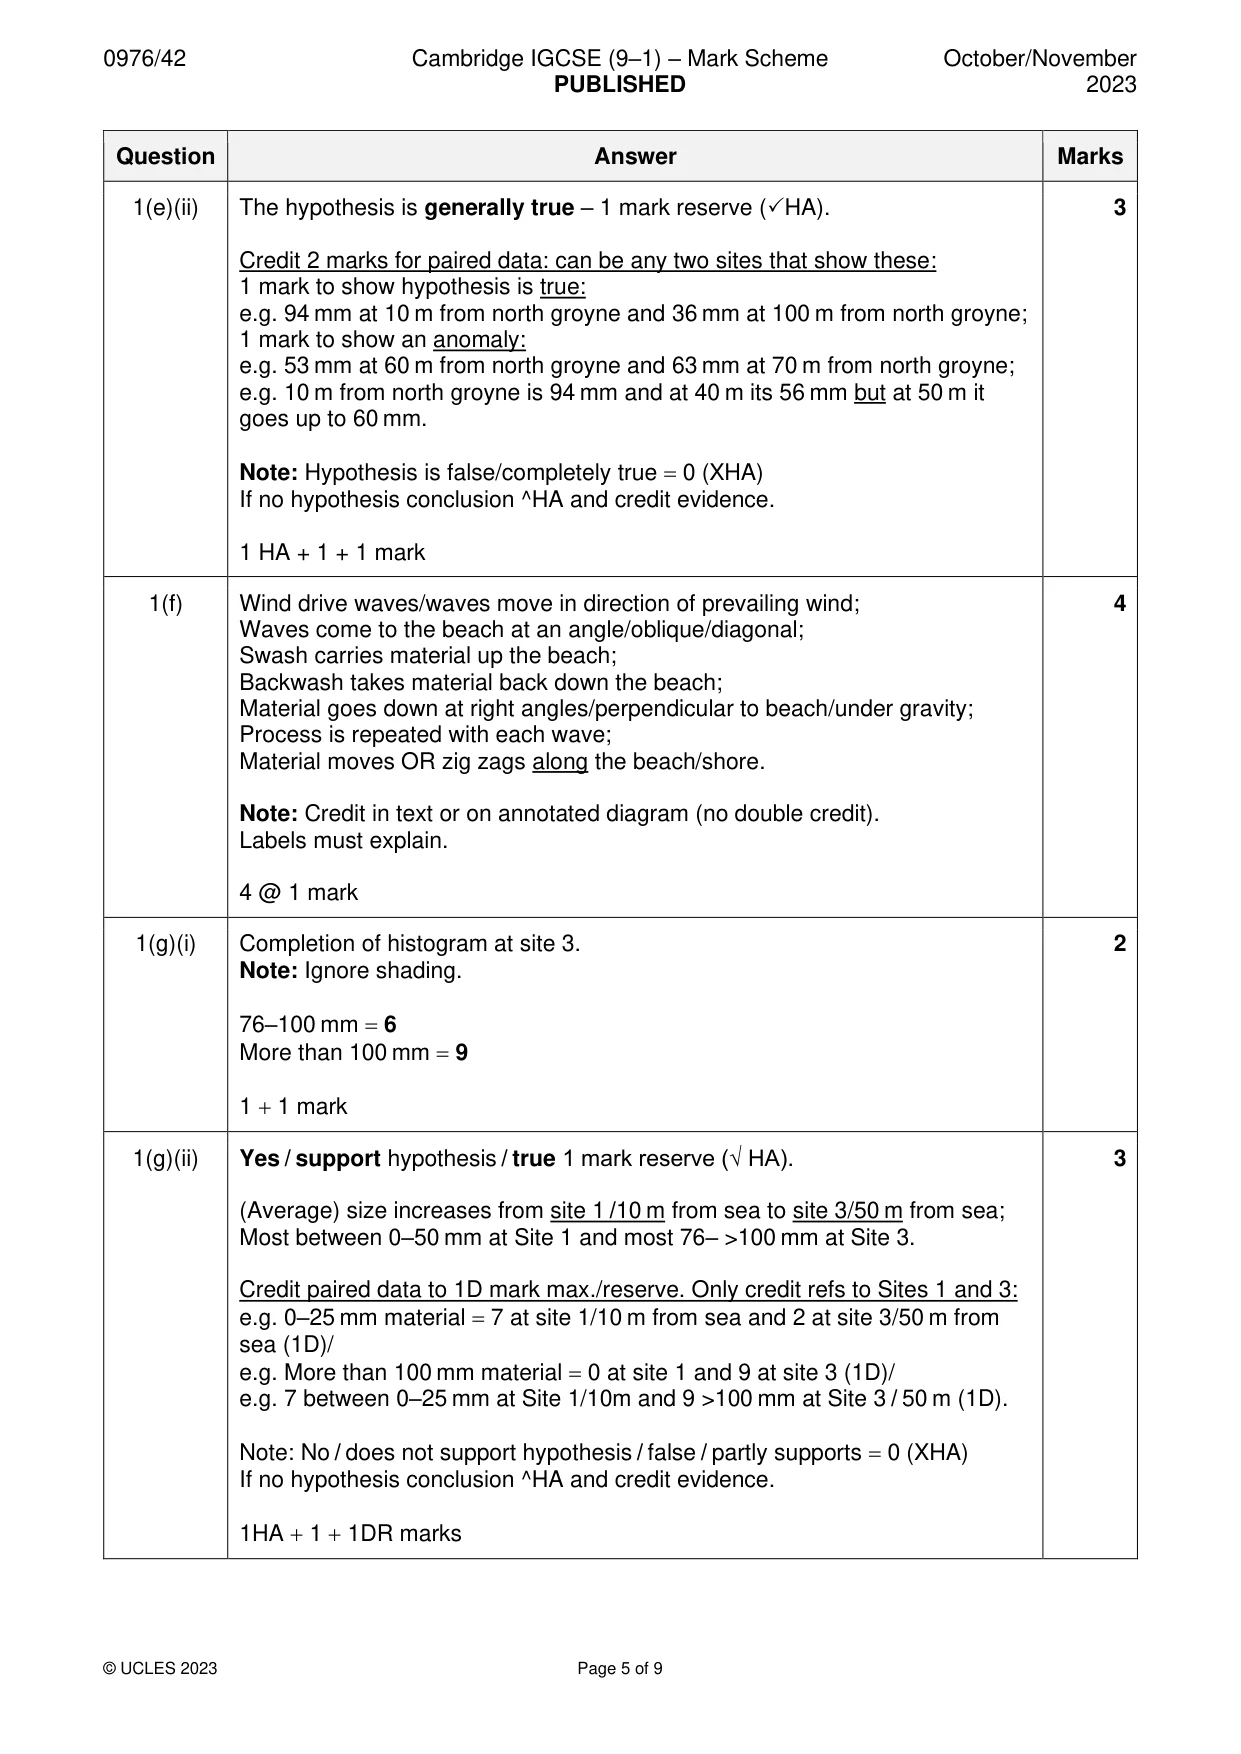
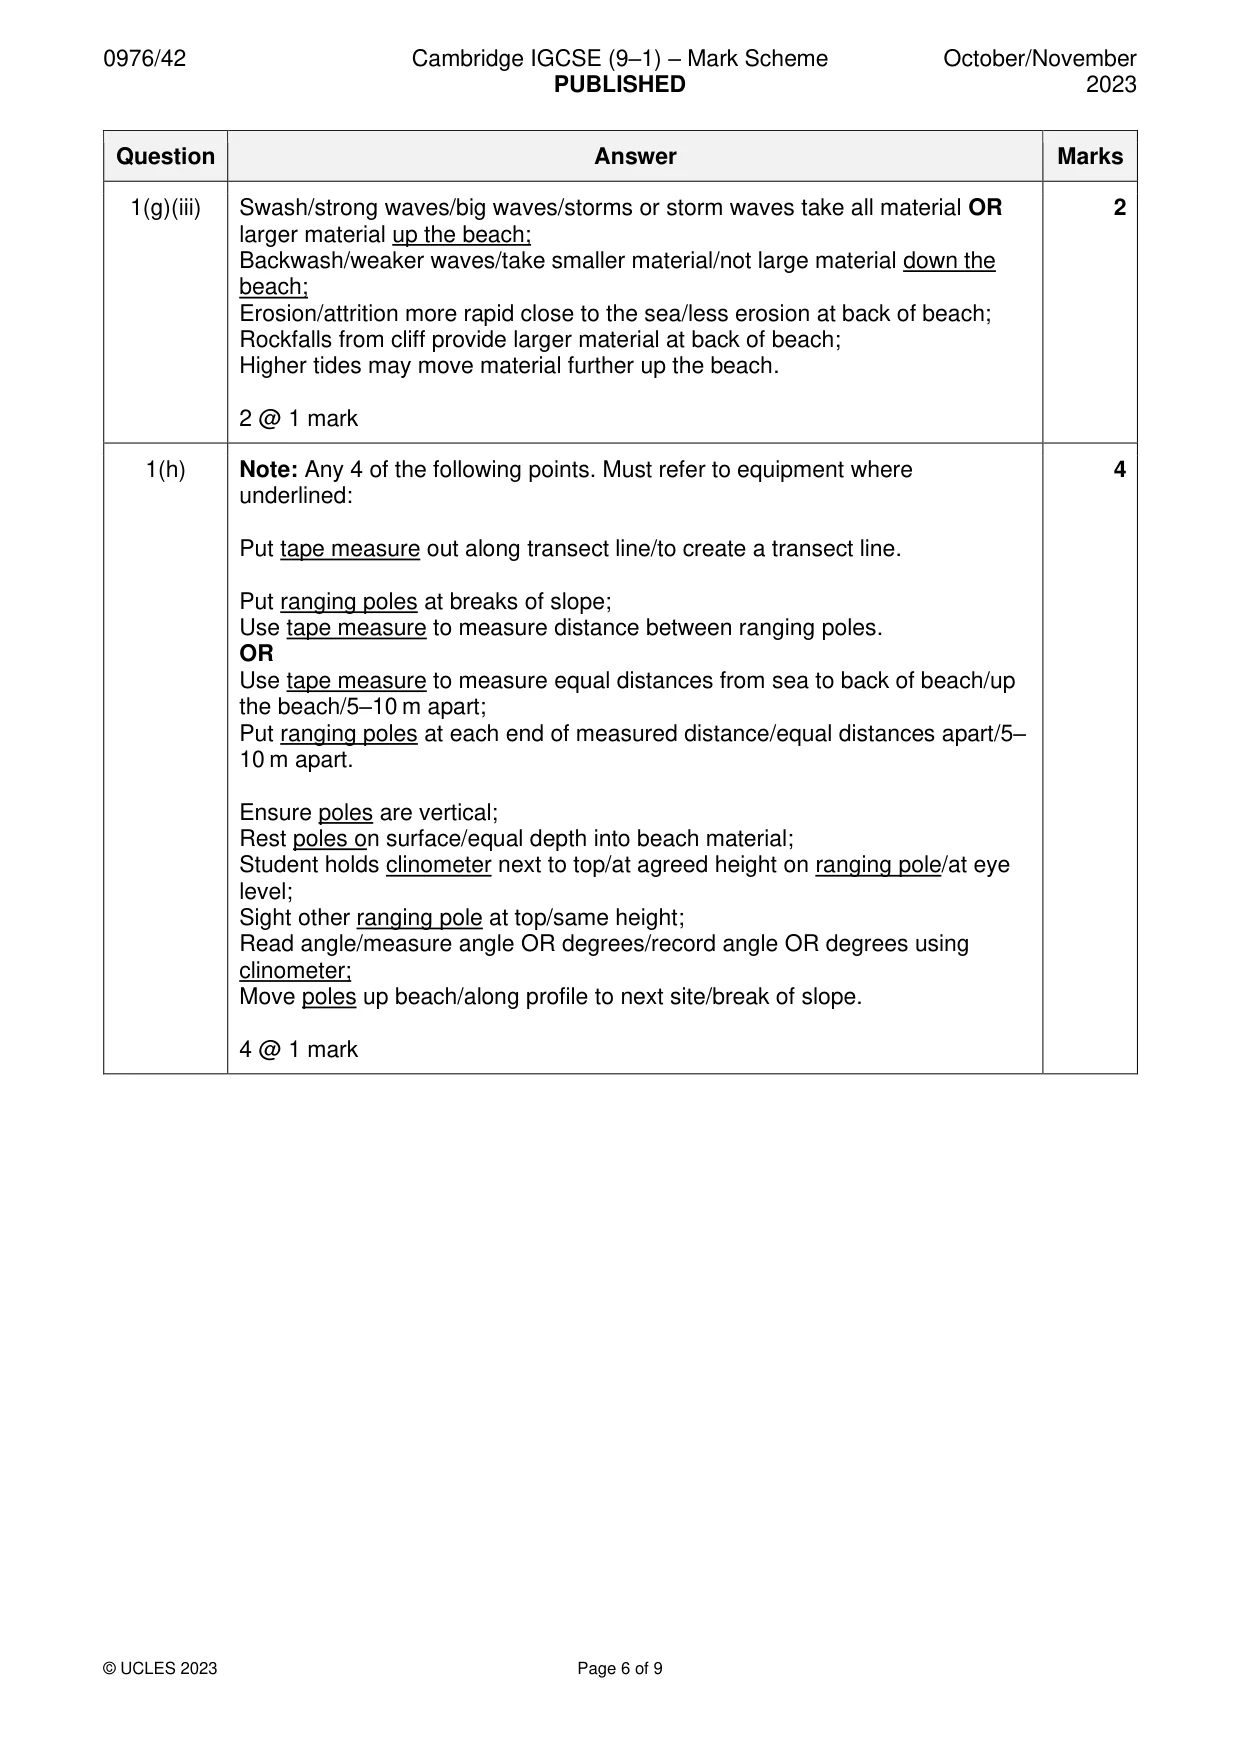
Mark scheme: Question Answer Marks 1(a) Sloping/incline/slopes/steep in some places; 2 Shingle/pebbles/small rocks/stones/gravel; There is a ridge/goes up and down. 2 @ mark 1(b) Wear waterproof OR extra clothes/macs/wellingtons/coat/shoes/umbrella; 4 Keep away from OR avoid cliff/overhang/don’t stand on edge of cliff; Work from safe position/don’t go into sea/face the sea/watch the sea/keep distance from shore/stay away from edge of sea/stay away from waves; Check the time of high tide/do the work at low tide/wait for low tide. 4 @ 1 mark 1(c)(i) Complete measurements of: 2 Width = 65–66 mm. Depth = 28–29 mm. 2 @ 1 mark 1(c)(ii) Average measurement = 71 + 65/66 + 28/29 = 54.6 to 55.3. 1 Note: Working is not needed. Only mark final answer. 1 mark 1(d)(i) Plot measurement 18 = 52 mm on bar graph 1 1 mark 1(d)(ii) Number 2 1 1 mark 1(e)(i) Plot 91 mm at 20 m from north groyne 1 1 mark 1(e)(ii) The hypothesis is generally true – 1 mark reserve (HA). 3 Credit 2 marks for paired data: can be any two sites that show these: 1 mark to show hypothesis is true: e.g. 94 mm at 10 m from north groyne and 36 mm at 100 m from north groyne; 1 mark to show an anomaly: e.g. 53 mm at 60 m from north groyne and 63 mm at 70 m from north groyne; e.g. 10 m from north groyne is 94 mm and at 40 m its 56 mm but at 50 m it goes up to 60 mm. Note: Hypothesis is false/completely true = 0 (XHA) If no hypothesis conclusion ^HA and credit evidence. 1 HA + 1 + 1 mark 1(f) Wind drive waves/waves move in direction of prevailing wind; 4 Waves come to the beach at an angle/oblique/diagonal; Swash carries material up the beach; Backwash takes material back down the beach; Material goes down at right angles/perpendicular to beach/under gravity; Process is repeated with each wave; Material moves OR zig zags along the beach/shore. Note: Credit in text or on annotated diagram (no double credit). Labels must explain. 4 @ 1 mark 1(g)(i) Completion of histogram at site 3. 2 Note: Ignore shading. 76–100 mm = 6 More than 100 mm = 9 1 + 1 mark 1(g)(ii) Yes / support hypothesis / true 1 mark reserve (√ HA). 3 (Average) size increases from site 1 /10 m from sea to site 3/50 m from sea; Most between 0–50 mm at Site 1 and most 76– >100 mm at Site 3. Credit paired data to 1D mark max./reserve. Only credit refs to Sites 1 and 3: e.g. 0–25 mm material = 7 at site 1/10 m from sea and 2 at site 3/50 m from sea (1D)/ e.g. More than 100 mm material = 0 at site 1 and 9 at site 3 (1D)/ e.g. 7 between 0–25 mm at Site 1/10m and 9 >100 mm at Site 3 / 50 m (1D). Note: No / does not support hypothesis / false / partly supports = 0 (XHA) If no hypothesis conclusion ^HA and credit evidence. 1HA + 1 + 1DR marks 1(g)(iii) Swash/strong waves/big waves/storms or storm waves take all material OR 2 larger material up the beach; Backwash/weaker waves/take smaller material/not large material down the beach; Erosion/attrition more rapid close to the sea/less erosion at back of beach; Rockfalls from cliff provide larger material at back of beach; Higher tides may move material further up the beach. 2 @ 1 mark 1(h) Note: Any 4 of the following points. Must refer to equipment where 4 underlined: Put tape measure out along transect line/to create a transect line. Put ranging poles at breaks of slope; Use tape measure to measure distance between ranging poles. OR Use tape measure to measure equal distances from sea to back of beach/up the beach/5–10 m apart; Put ranging poles at each end of measured distance/equal distances apart/5– 10 m apart. Ensure poles are vertical; Rest poles on surface/equal depth into beach material; Student holds clinometer next to top/at agreed height on ranging pole/at eye level; Sight other ranging pole at top/same height; Read angle/measure angle OR degrees/record angle OR degrees using clinometer; Move poles up beach/along profile to next site/break of slope. 4 @ 1 mark
Q2 · Students who live in the Peak District, a rural area in northern England, did some…
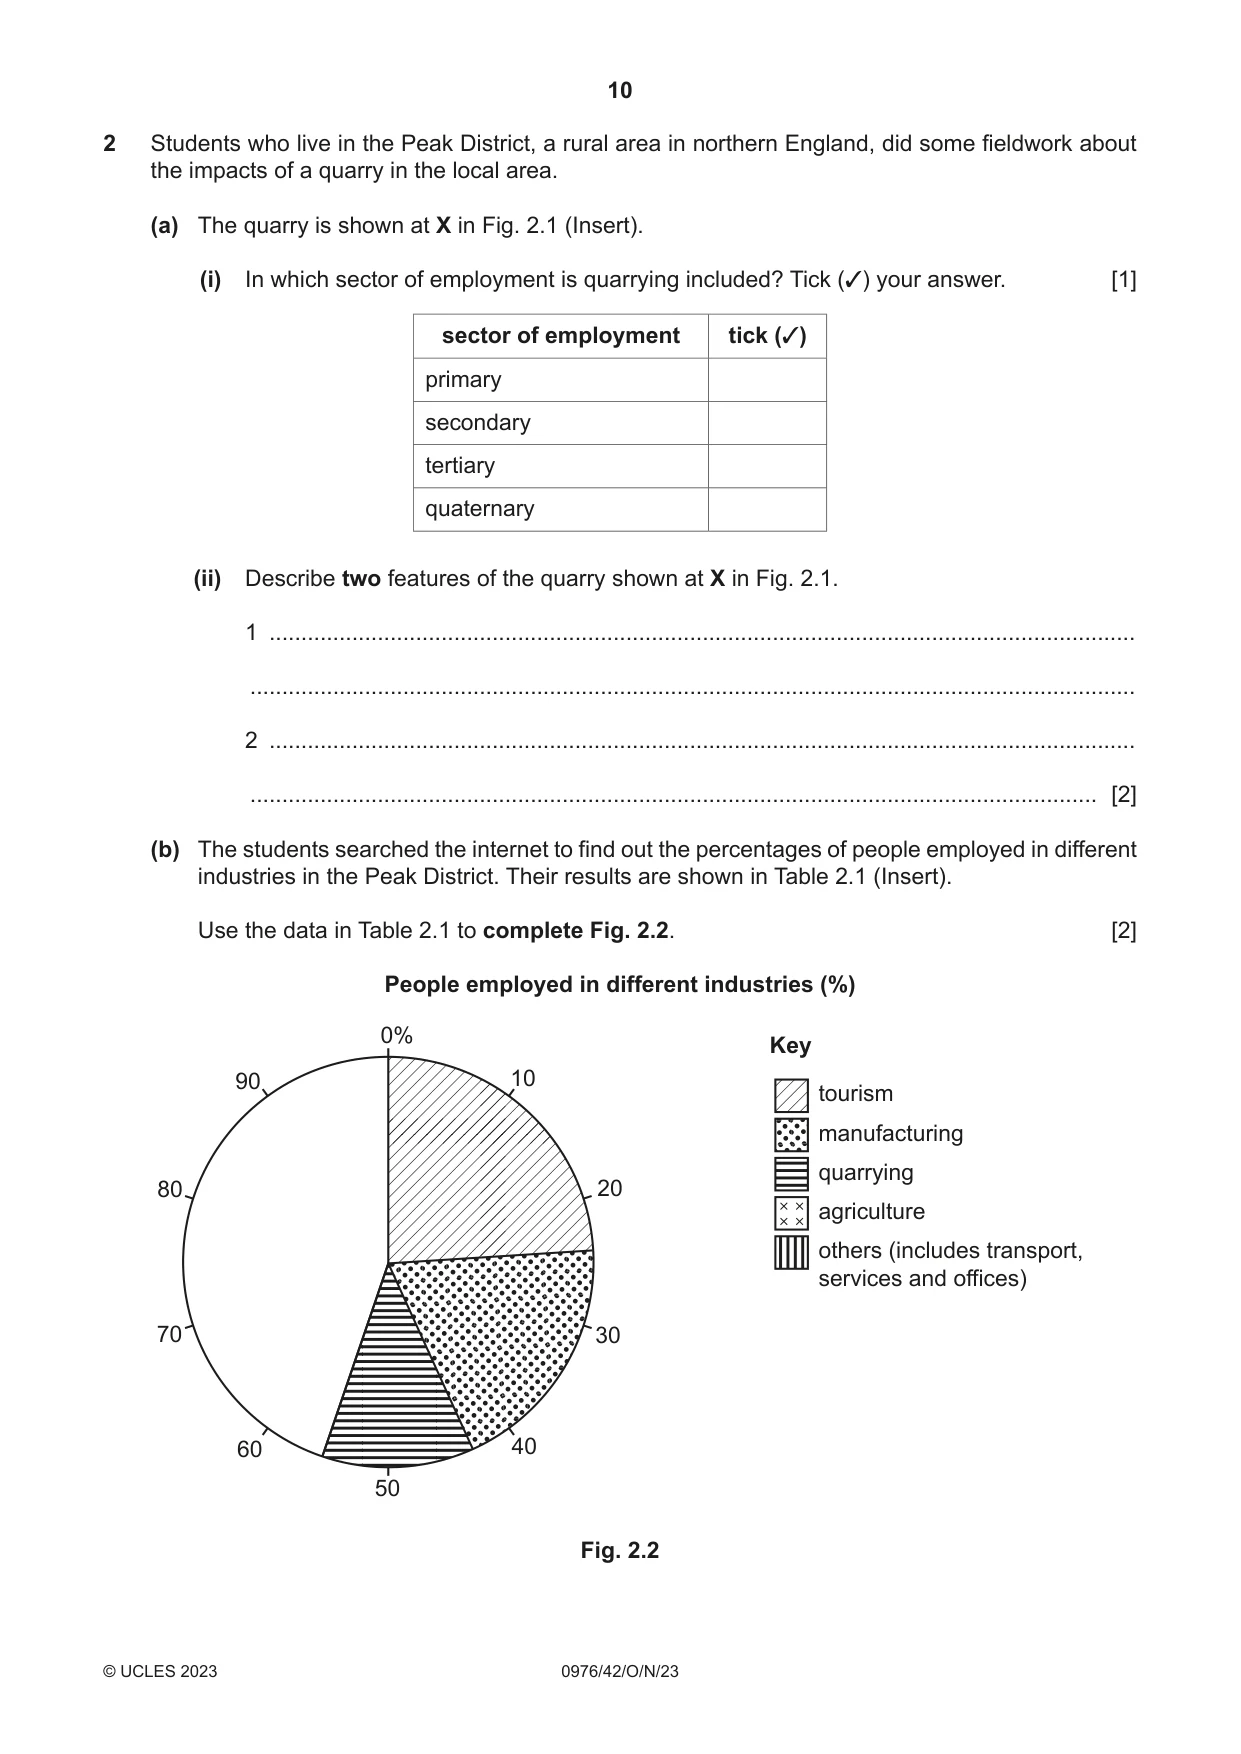
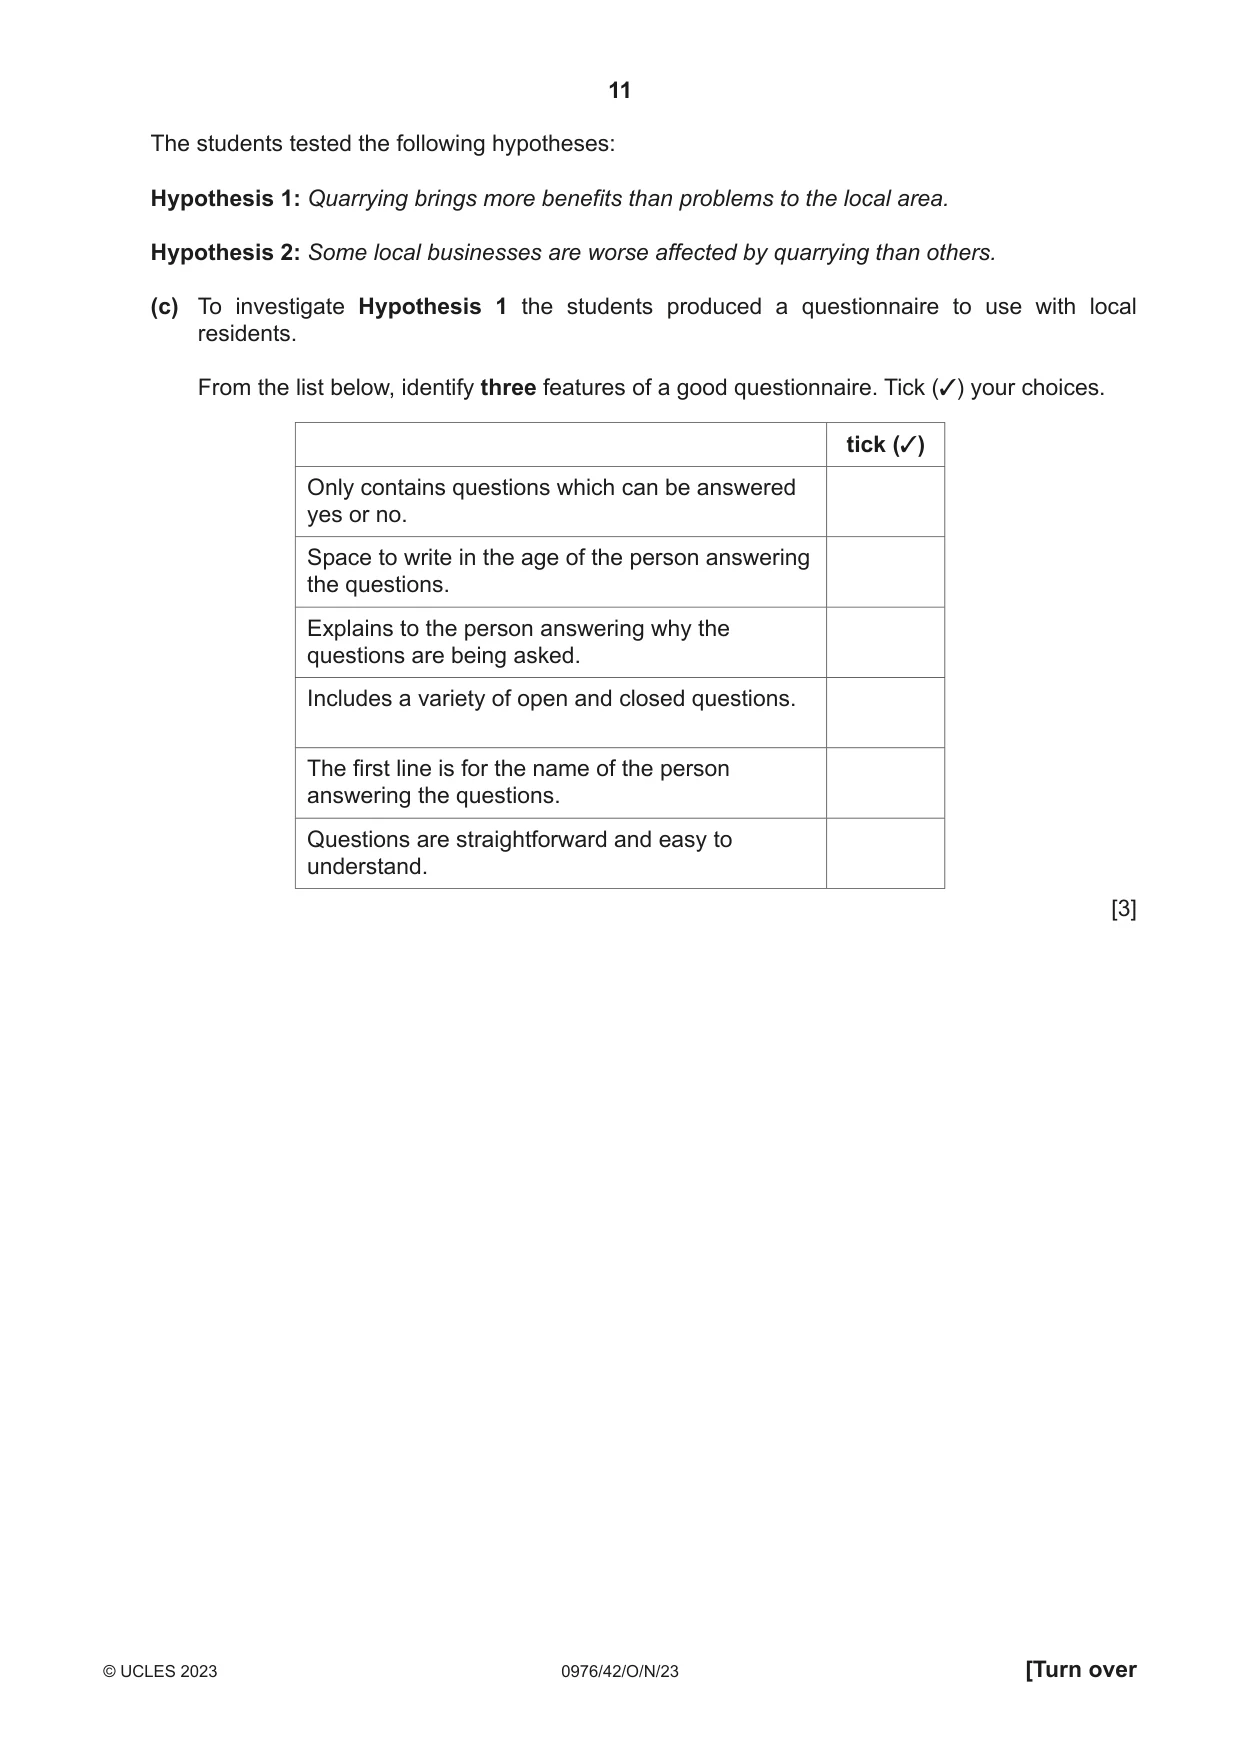
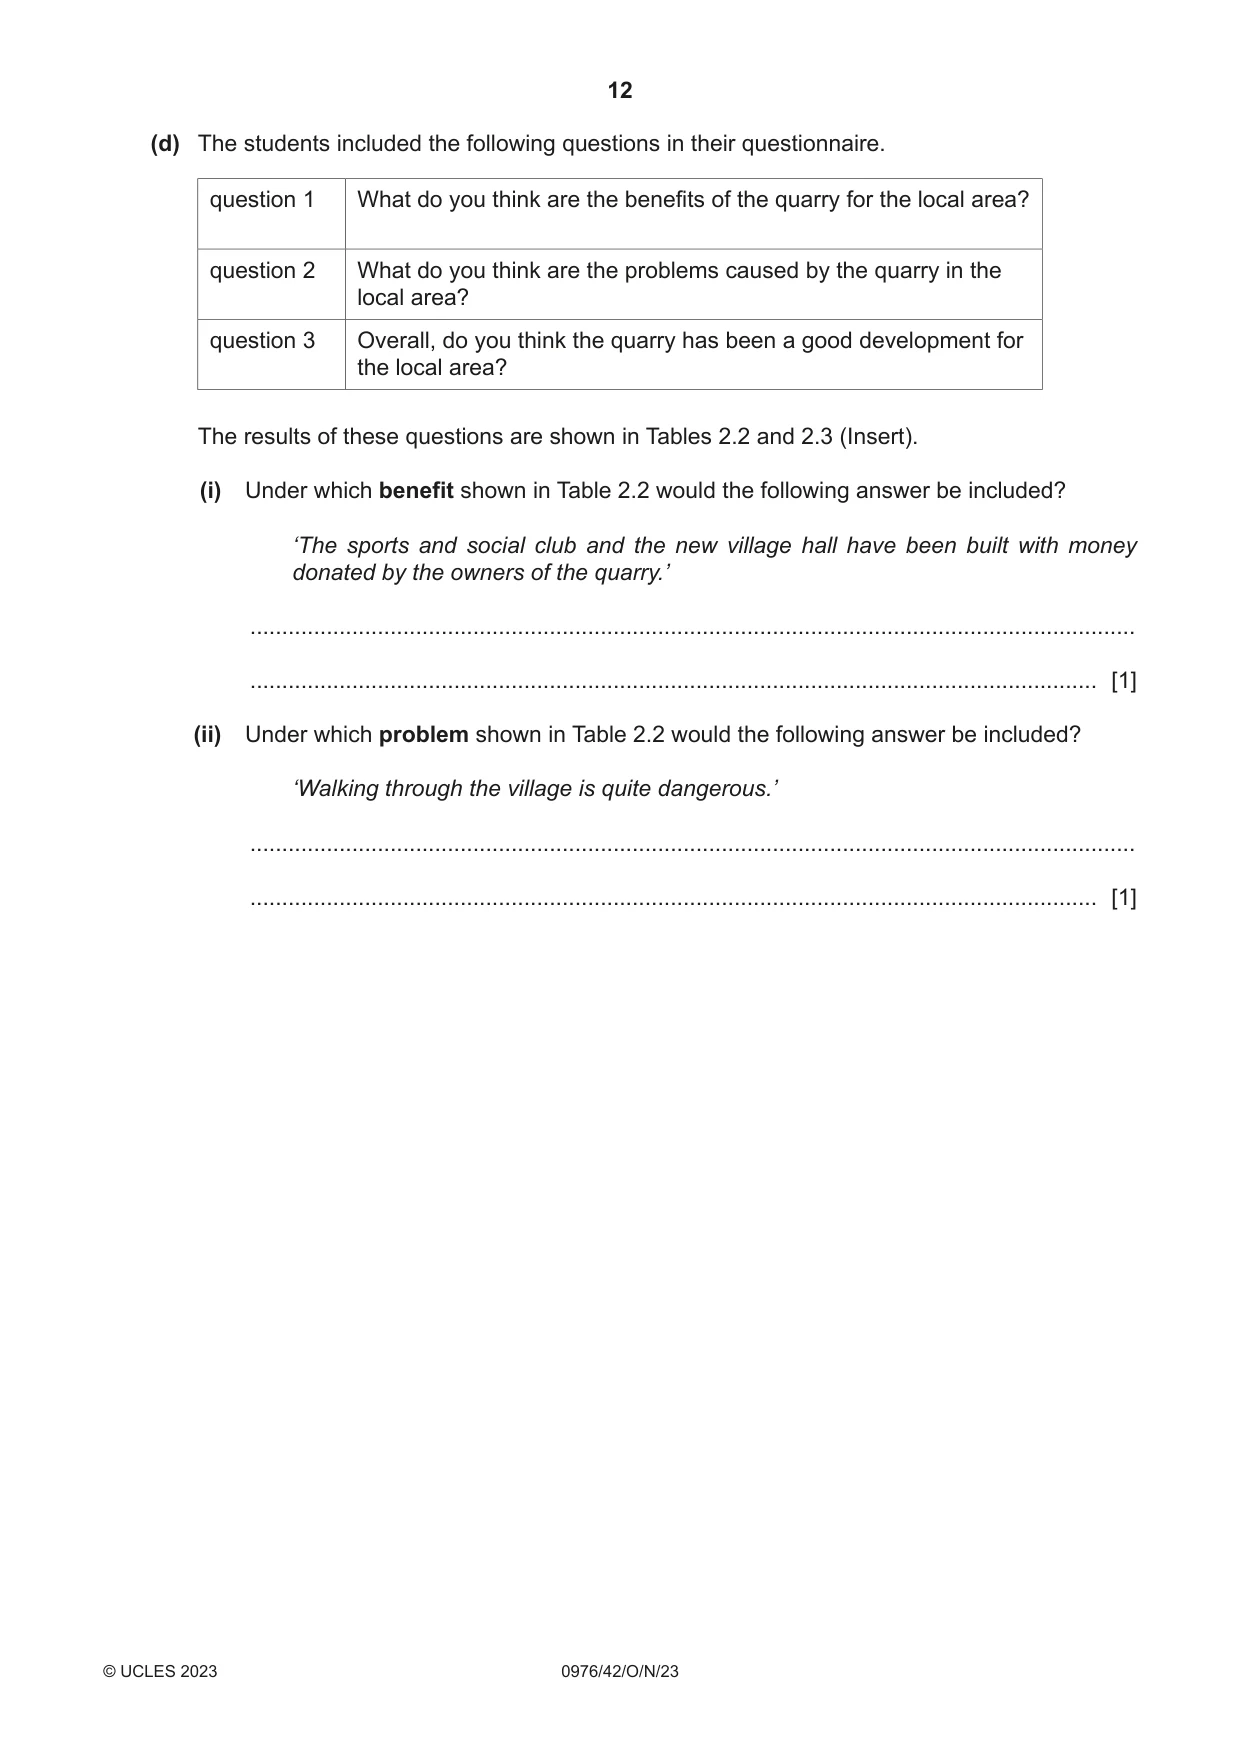
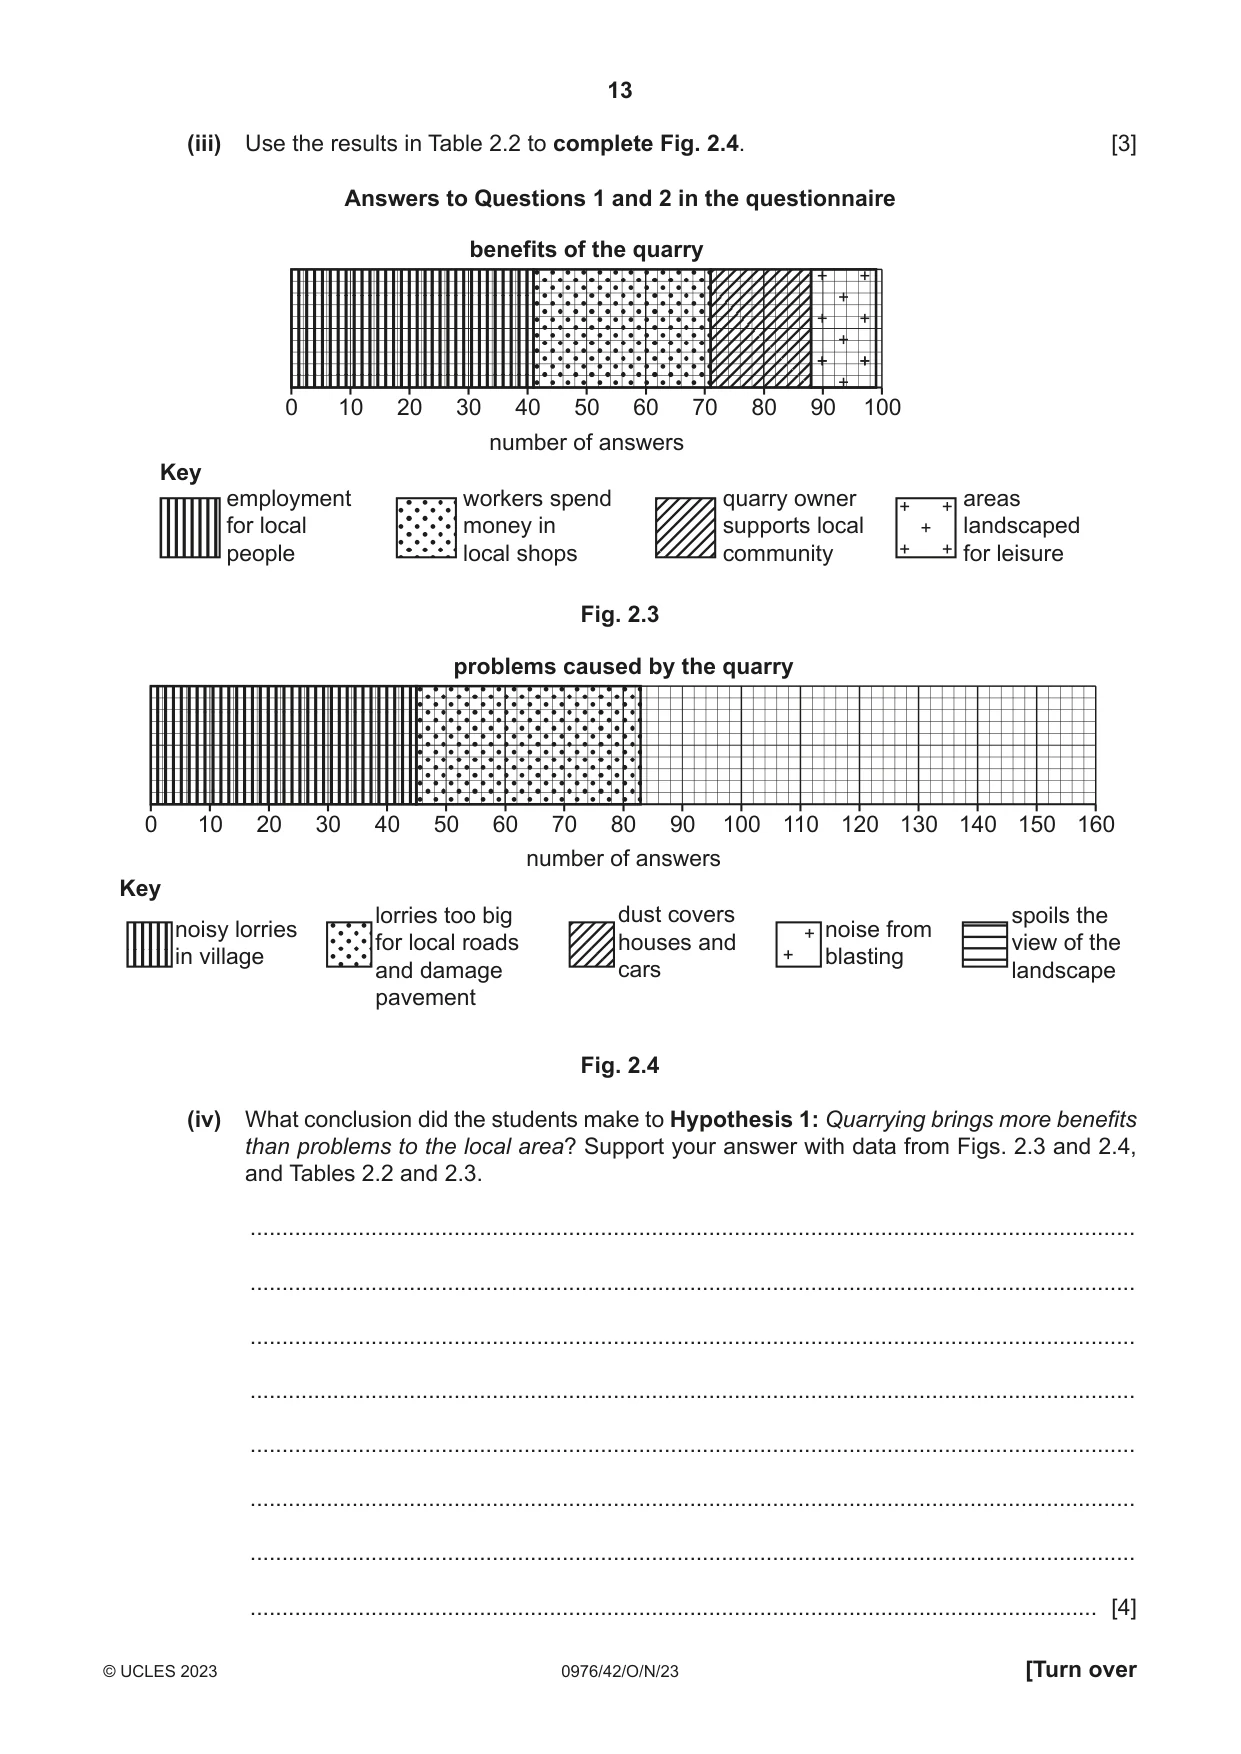
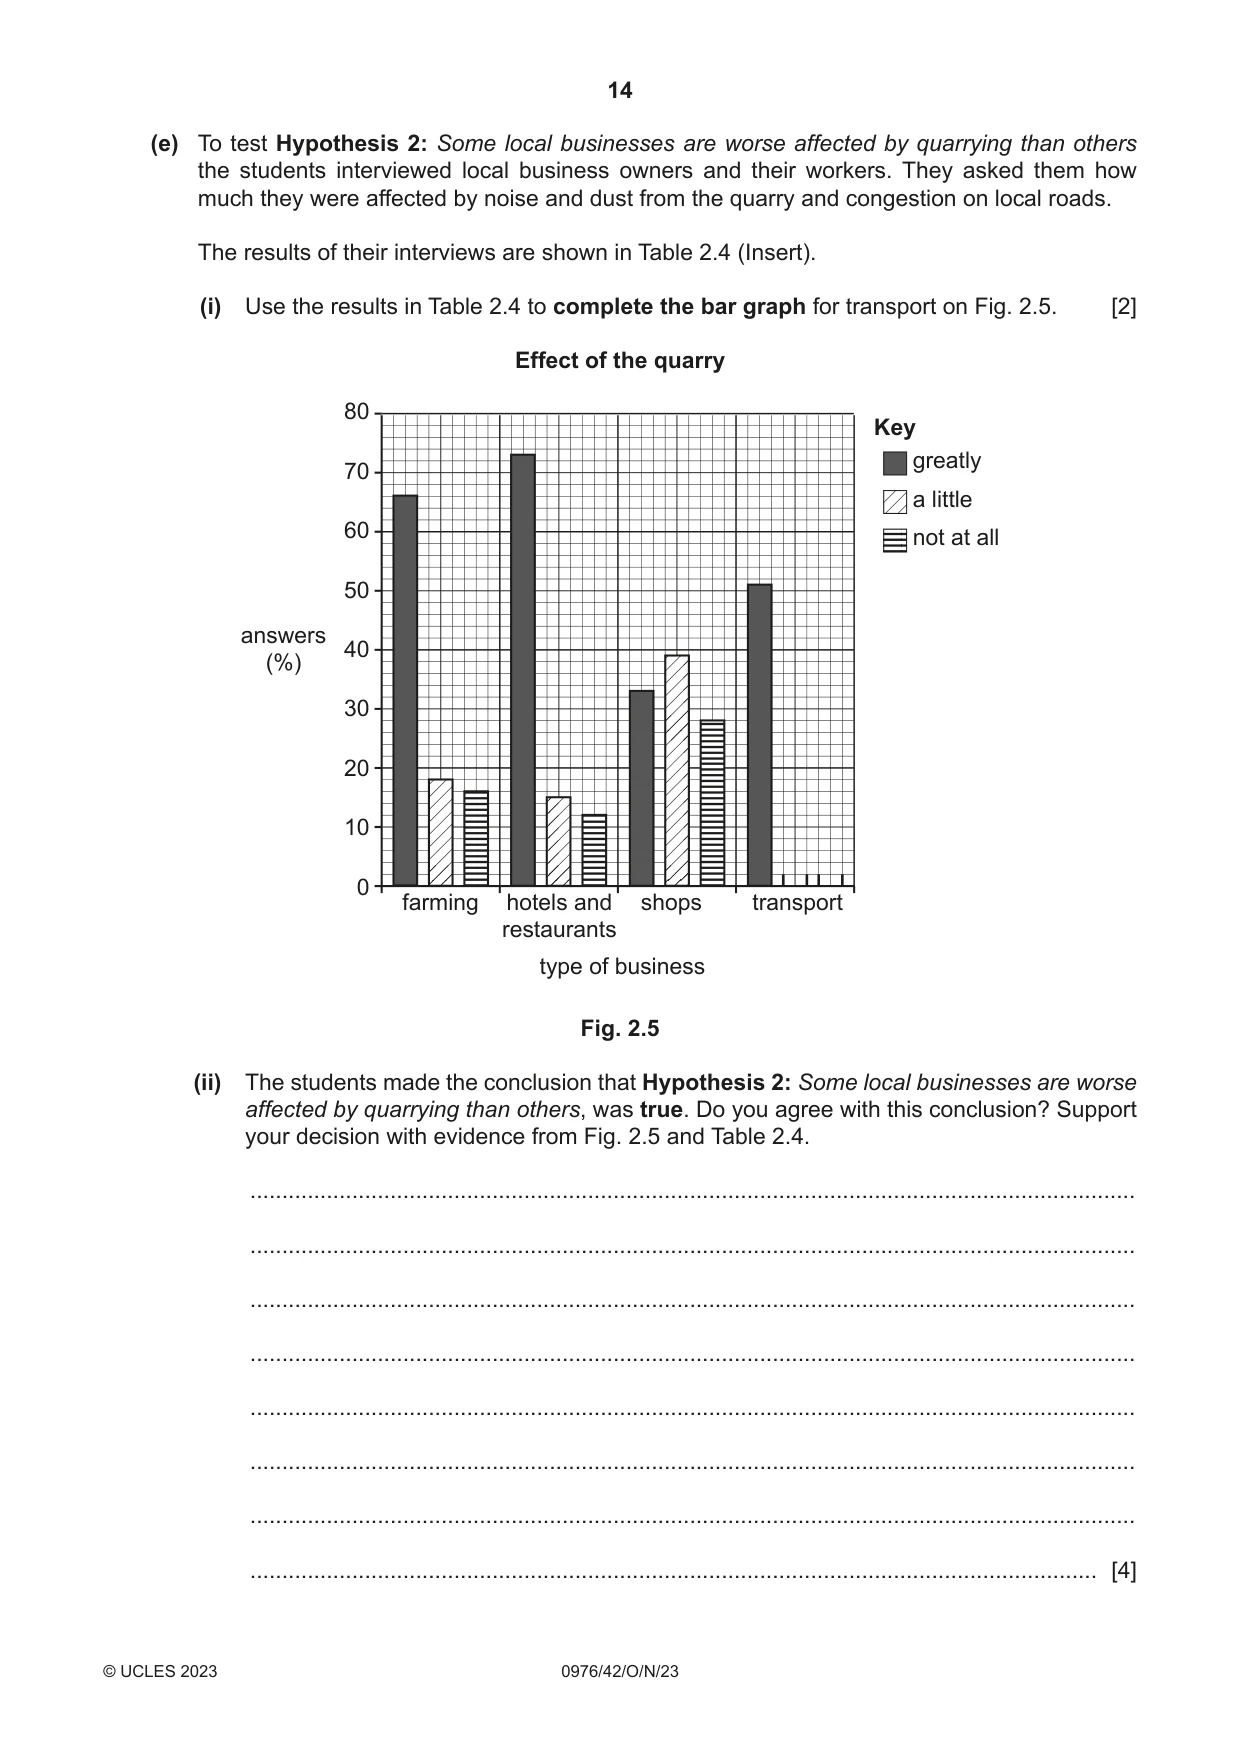
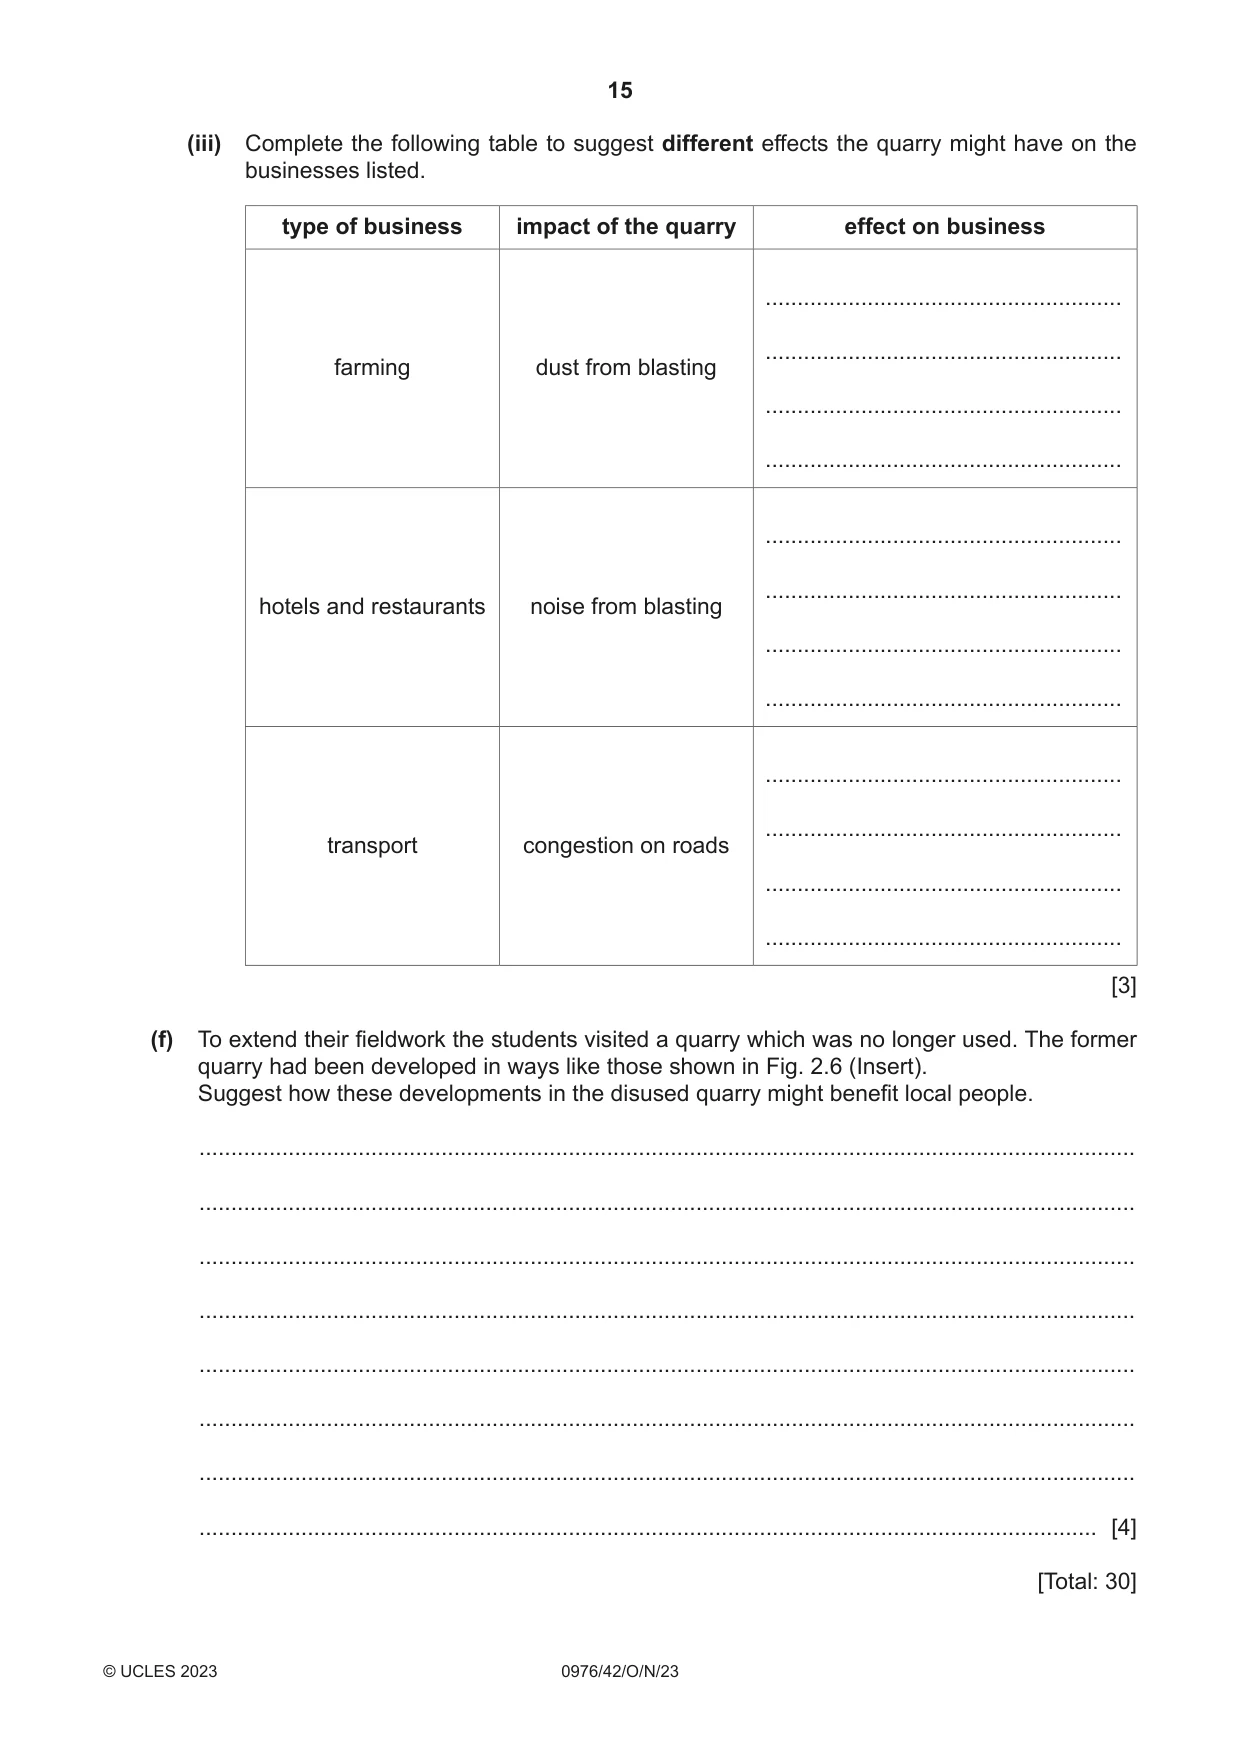
2 Students who live in the Peak District, a rural area in northern England, did some fieldwork about the impacts of a quarry in the local area. (a) The quarry is shown at X in Fig. 2.1 (Insert). (i) In which sector of employment is quarrying included? Tick (✓) your answer. [1] sector of employment tick (✓) primary secondary tertiary quaternary (ii) Describe two features of the quarry shown at X in Fig. 2.1. 1 ........................................................................................................................................ ........................................................................................................................................... 2 ........................................................................................................................................ ..................................................................................................................................... [2] (b) The students searched the internet to find out the percentages of people employed in different industries in the Peak District. Their results are shown in Table 2.1 (Insert). Use the data in Table 2.1 to complete Fig. 2.2. [2] People employed in different industries (%) 0% Key 90 10 tourism manufacturing quarrying 80 20 agriculture others (includes transport, services and offices) 70 30 60 40 50 Fig. 2.2 The students tested the following hypotheses: Hypothesis 1: Quarrying brings more benefits than problems to the local area. Hypothesis 2: Some local businesses are worse affected by quarrying than others. (c) To investigate Hypothesis 1 the students produced a questionnaire to use with local residents. From the list below, identify three features of a good questionnaire. Tick (✓) your choices. tick (✓) Only contains questions which can be answered yes or no. Space to write in the age of the person answering the questions. Explains to the person answering why the questions are being asked. Includes a variety of open and closed questions. The first line is for the name of the person answering the questions. Questions are straightforward and easy to understand. [3] (d) The students included the following questions in their questionnaire. question 1 What do you think are the benefits of the quarry for the local area? question 2 What do you think are the problems caused by the quarry in the local area? question 3 Overall, do you think the quarry has been a good development for the local area? The results of these questions are shown in Tables 2.2 and 2.3 (Insert). (i) Under which benefit shown in Table 2.2 would the following answer be included? ‘The sports and social club and the new village hall have been built with money donated by the owners of the quarry.’ ........................................................................................................................................... ..................................................................................................................................... [1] (ii) Under which problem shown in Table 2.2 would the following answer be included? ‘Walking through the village is quite dangerous.’ ........................................................................................................................................... ..................................................................................................................................... [1]
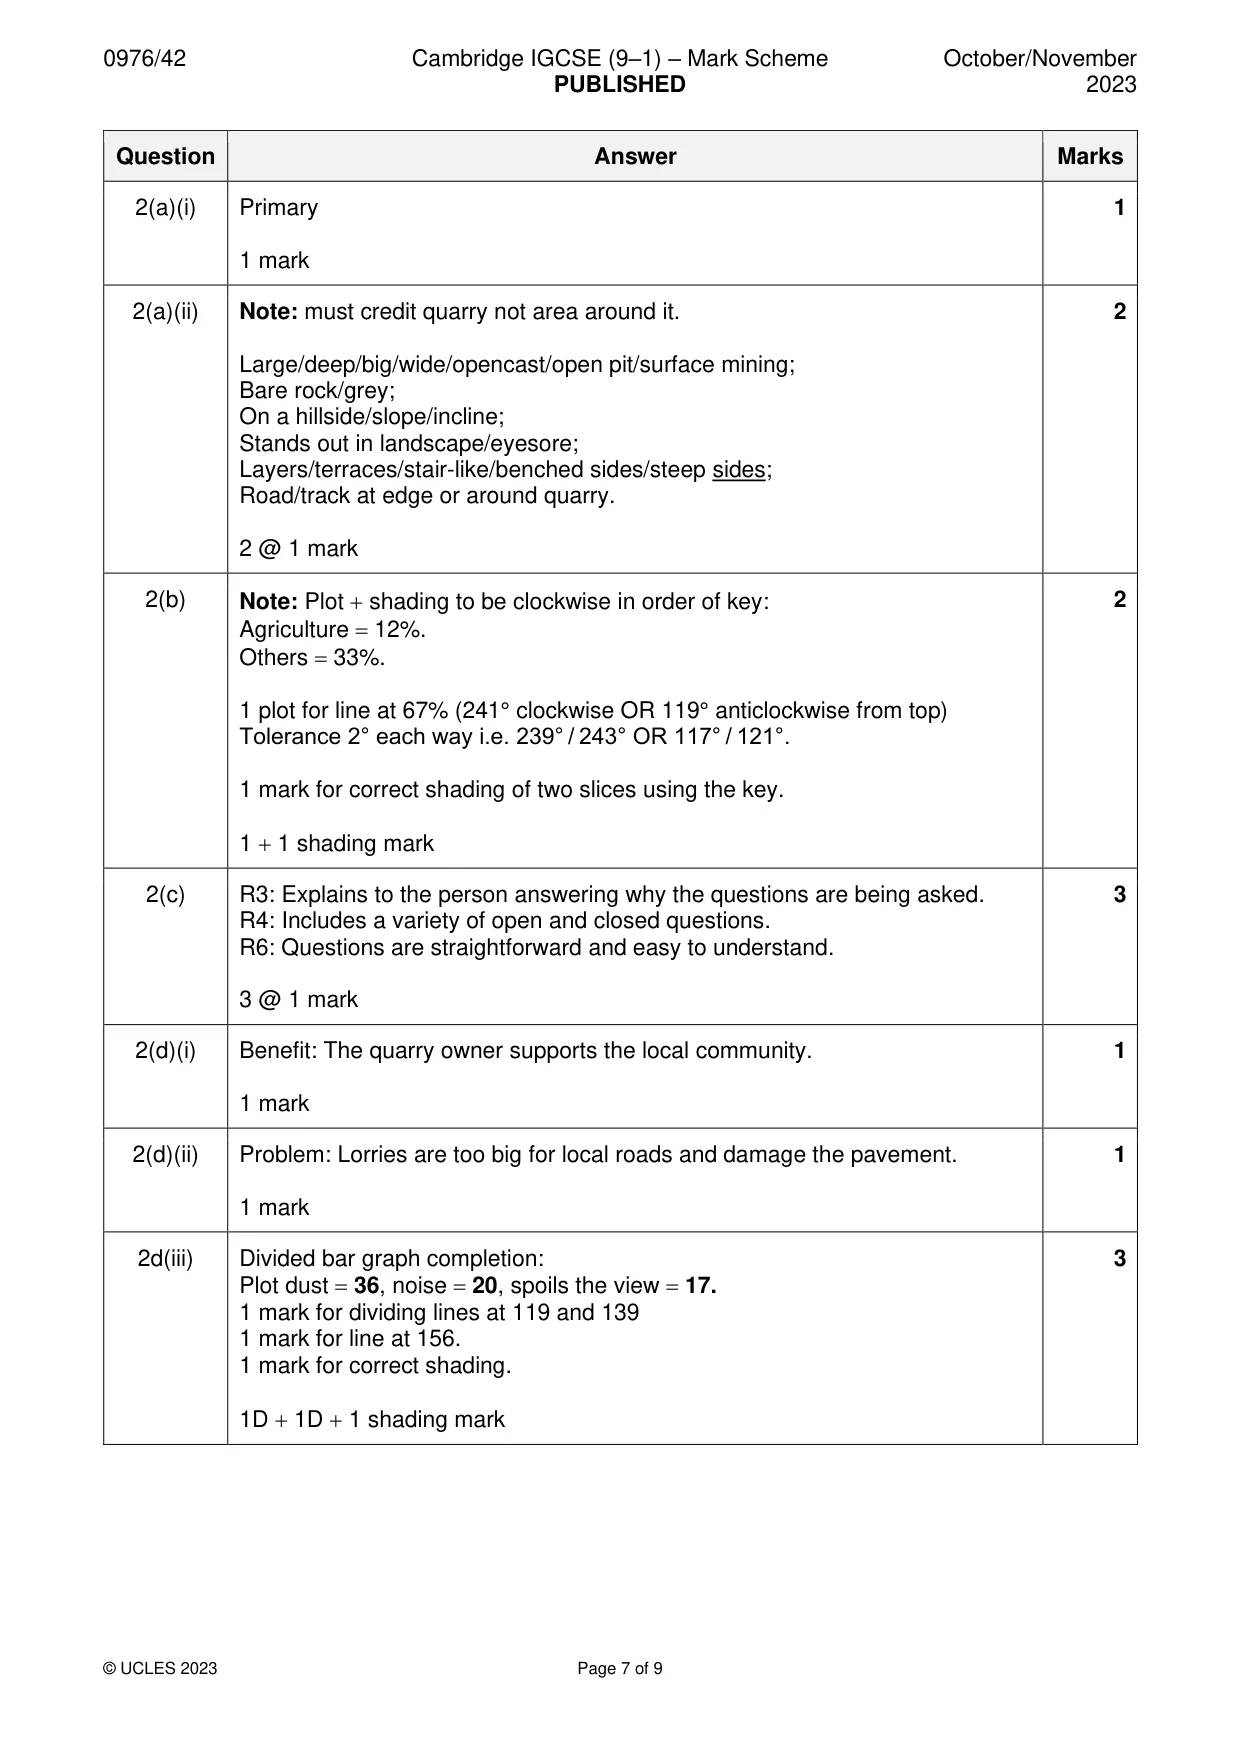
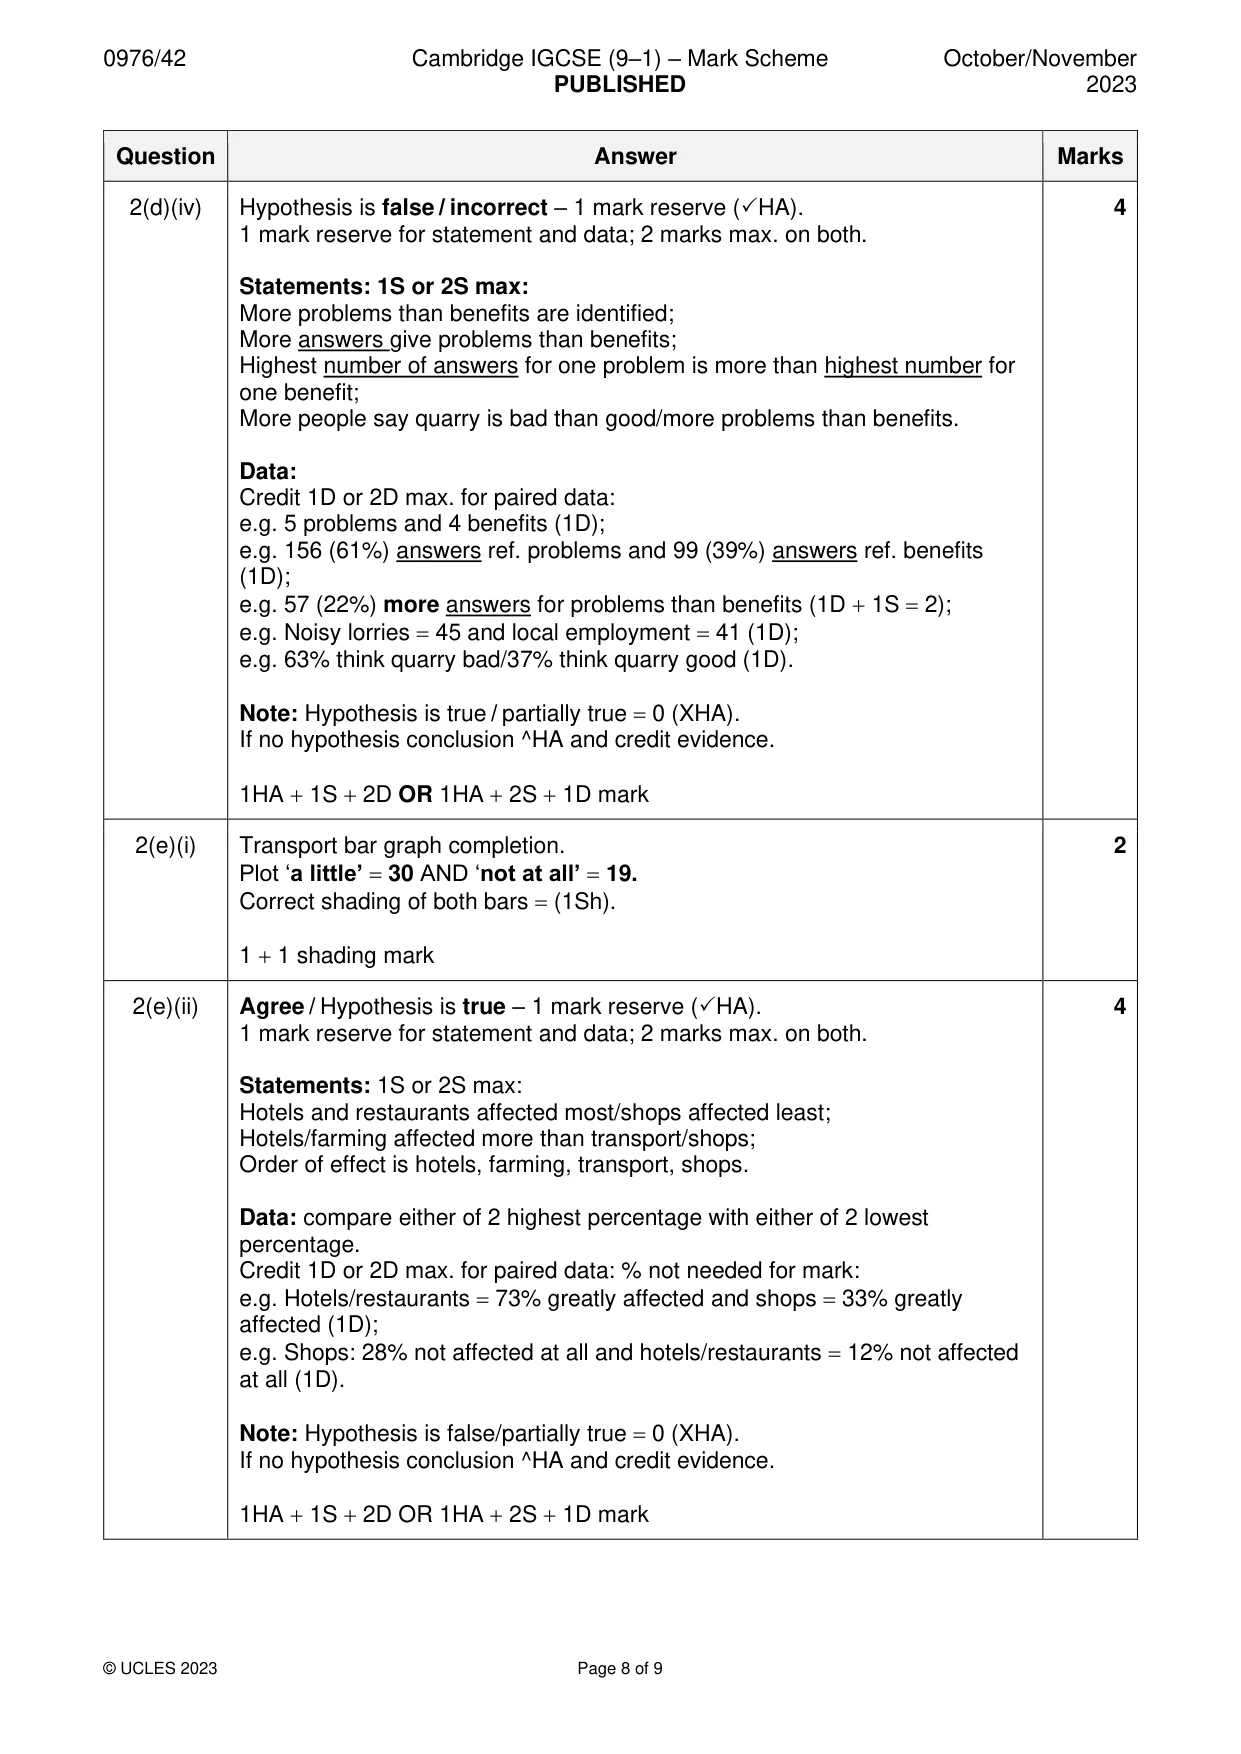
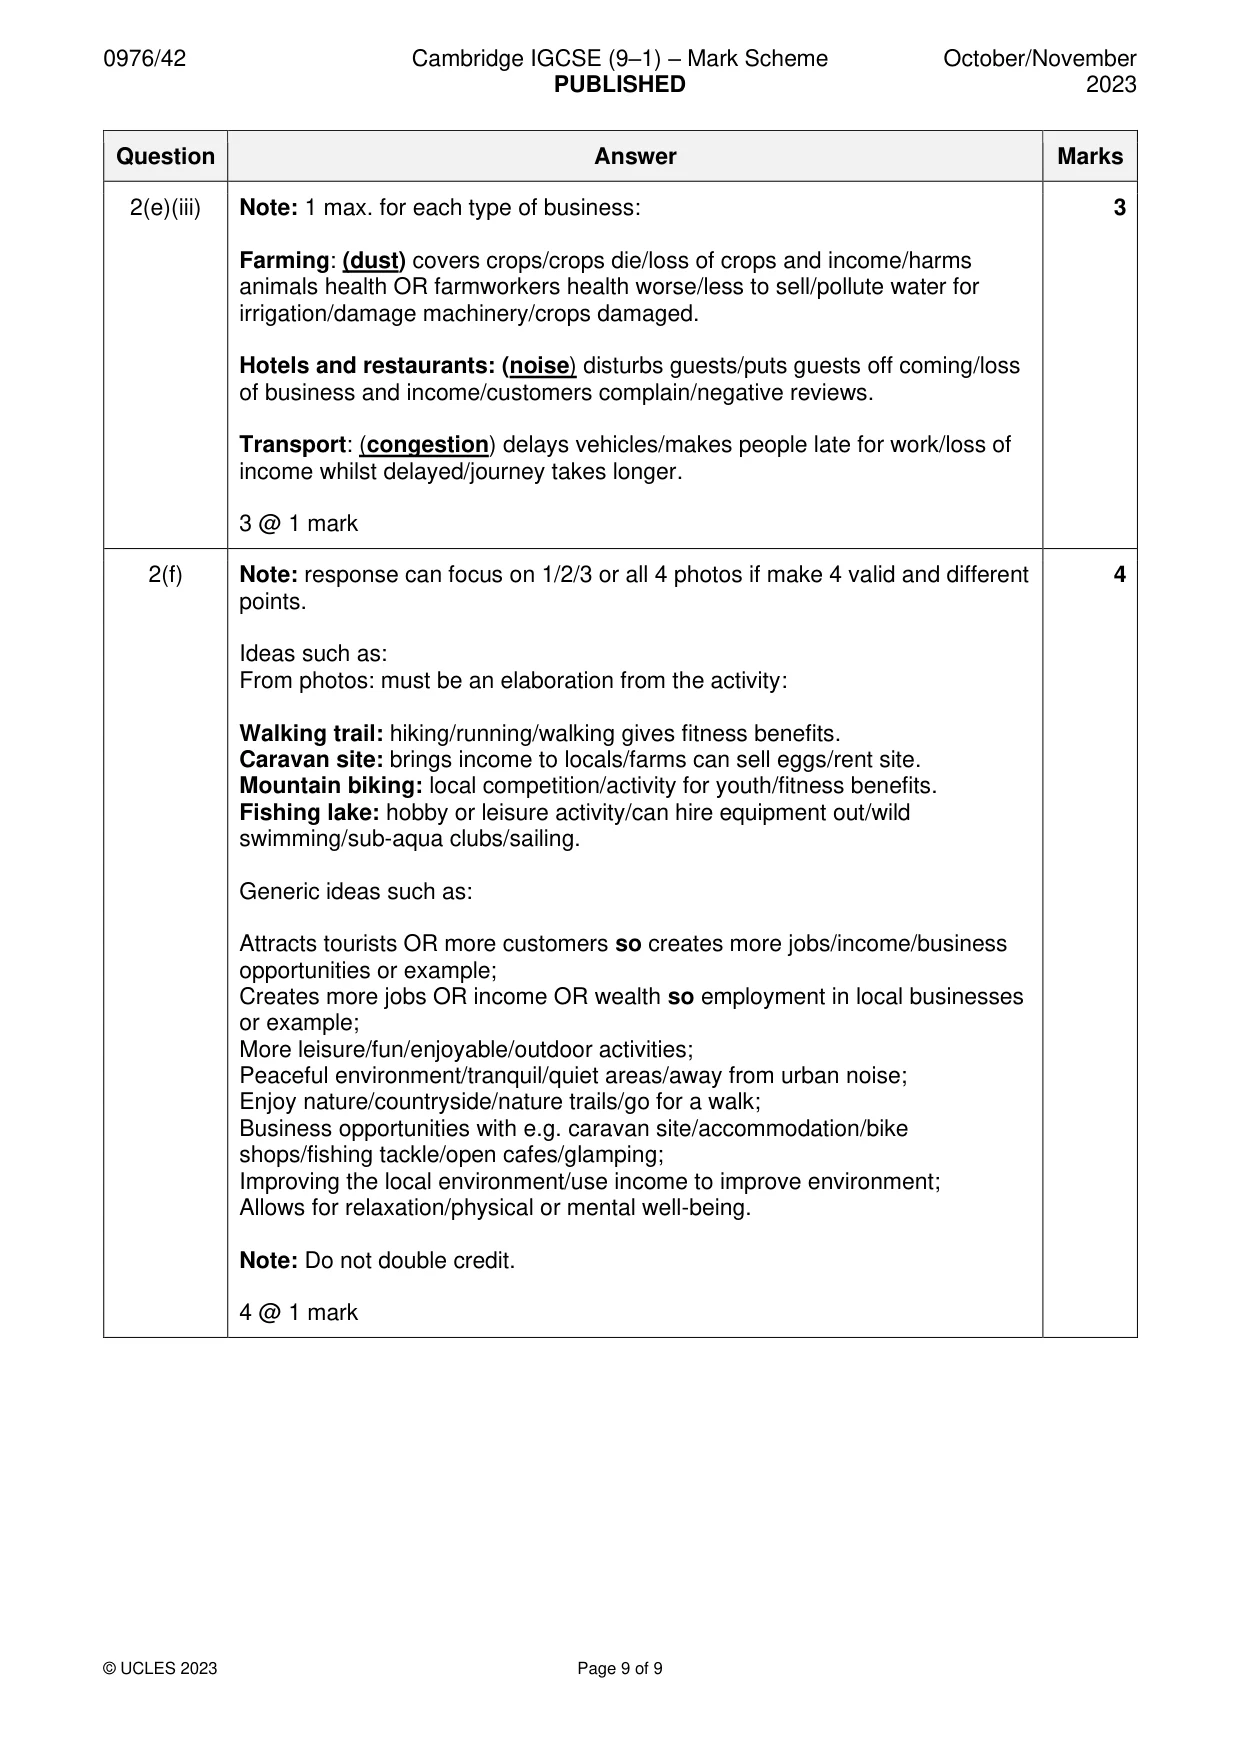
Mark scheme: 2(a)(i) Primary 1 1 mark 2(a)(ii) Note: must credit quarry not area around it. 2 Large/deep/big/wide/opencast/open pit/surface mining; Bare rock/grey; On a hillside/slope/incline; Stands out in landscape/eyesore; Layers/terraces/stair-like/benched sides/steep sides; Road/track at edge or around quarry. 2 @ 1 mark 2(b) Note: Plot + shading to be clockwise in order of key: 2 Agriculture = 12%. Others = 33%. 1 plot for line at 67% (241° clockwise OR 119° anticlockwise from top) Tolerance 2° each way i.e. 239° / 243° OR 117° / 121°. 1 mark for correct shading of two slices using the key. 1 + 1 shading mark 2(c) R3: Explains to the person answering why the questions are being asked. 3 R4: Includes a variety of open and closed questions. R6: Questions are straightforward and easy to understand. 3 @ 1 mark 2(d)(i) Benefit: The quarry owner supports the local community. 1 1 mark 2(d)(ii) Problem: Lorries are too big for local roads and damage the pavement. 1 1 mark 2d(iii) Divided bar graph completion: 3 Plot dust = 36, noise = 20, spoils the view = 17. 1 mark for dividing lines at 119 and 139 1 mark for line at 156. 1 mark for correct shading. 1D + 1D + 1 shading mark 2(d)(iv) Hypothesis is false / incorrect – 1 mark reserve (HA). 4 1 mark reserve for statement and data; 2 marks max. on both. Statements: 1S or 2S max: More problems than benefits are identified; More answers give problems than benefits; Highest number of answers for one problem is more than highest number for one benefit; More people say quarry is bad than good/more problems than benefits. Data: Credit 1D or 2D max. for paired data: e.g. 5 problems and 4 benefits (1D); e.g. 156 (61%) answers ref. problems and 99 (39%) answers ref. benefits (1D); e.g. 57 (22%) more answers for problems than benefits (1D + 1S = 2); e.g. Noisy lorries = 45 and local employment = 41 (1D); e.g. 63% think quarry bad/37% think quarry good (1D). Note: Hypothesis is true / partially true = 0 (XHA). If no hypothesis conclusion ^HA and credit evidence. 1HA + 1S + 2D OR 1HA + 2S + 1D mark 2(e)(i) Transport bar graph completion. 2 Plot ‘a little’ = 30 AND ‘not at all’ = 19. Correct shading of both bars = (1Sh). 1 + 1 shading mark 2(e)(ii) Agree / Hypothesis is true – 1 mark reserve (HA). 4 1 mark reserve for statement and data; 2 marks max. on both. Statements: 1S or 2S max: Hotels and restaurants affected most/shops affected least; Hotels/farming affected more than transport/shops; Order of effect is hotels, farming, transport, shops. Data: compare either of 2 highest percentage with either of 2 lowest percentage. Credit 1D or 2D max. for paired data: % not needed for mark: e.g. Hotels/restaurants = 73% greatly affected and shops = 33% greatly affected (1D); e.g. Shops: 28% not affected at all and hotels/restaurants = 12% not affected at all (1D). Note: Hypothesis is false/partially true = 0 (XHA). If no hypothesis conclusion ^HA and credit evidence. 1HA + 1S + 2D OR 1HA + 2S + 1D mark 2(e)(iii) Note: 1 max. for each type of business: 3 Farming: (dust) covers crops/crops die/loss of crops and income/harms animals health OR farmworkers health worse/less to sell/pollute water for irrigation/damage machinery/crops damaged. Hotels and restaurants: (noise) disturbs guests/puts guests off coming/loss of business and income/customers complain/negative reviews. Transport: (congestion) delays vehicles/makes people late for work/loss of income whilst delayed/journey takes longer. 3 @ 1 mark 2(f) Note: response can focus on 1/2/3 or all 4 photos if make 4 valid and different 4 points. Ideas such as: From photos: must be an elaboration from the activity: Walking trail: hiking/running/walking gives fitness benefits. Caravan site: brings income to locals/farms can sell eggs/rent site. Mountain biking: local competition/activity for youth/fitness benefits. Fishing lake: hobby or leisure activity/can hire equipment out/wild swimming/sub-aqua clubs/sailing. Generic ideas such as: Attracts tourists OR more customers so creates more jobs/income/business opportunities or example; Creates more jobs OR income OR wealth so employment in local businesses or example; More leisure/fun/enjoyable/outdoor activities; Peaceful environment/tranquil/quiet areas/away from urban noise; Enjoy nature/countryside/nature trails/go for a walk; Business opportunities with e.g. caravan site/accommodation/bike shops/fishing tackle/open cafes/glamping; Improving the local environment/use income to improve environment; Allows for relaxation/physical or mental well-being. Note: Do not double credit. 4 @ 1 mark
What was in this paper
The subtopics covered by these 2 questions, and how many questions each got. Open one in a new tab to see every Cambridge question on it.
What you needed in this session
Cambridge’s own grade thresholds for 2023 Oct/Nov, Paper 4 · Variant 2. A higher threshold means an easier paper — the bar moves with how the cohort did.