Cambridge IGCSE Geography (9-1) 0976 — 2021 Oct/Nov Paper 4 · Variant 2
0976/42/O/N/21 · 2 questions · 60 marks · ≈68 min
The question paper and its mark scheme, free to read here and free to download. This is Cambridge’s own paper, exactly as it was sat.
Question paper20 pages




Mark scheme11 pages
Answers below. Sit the paper first if you are practising.
Questions as text
Q1 · Students in Malta, an island in the Mediterranean Sea, were studying tourism
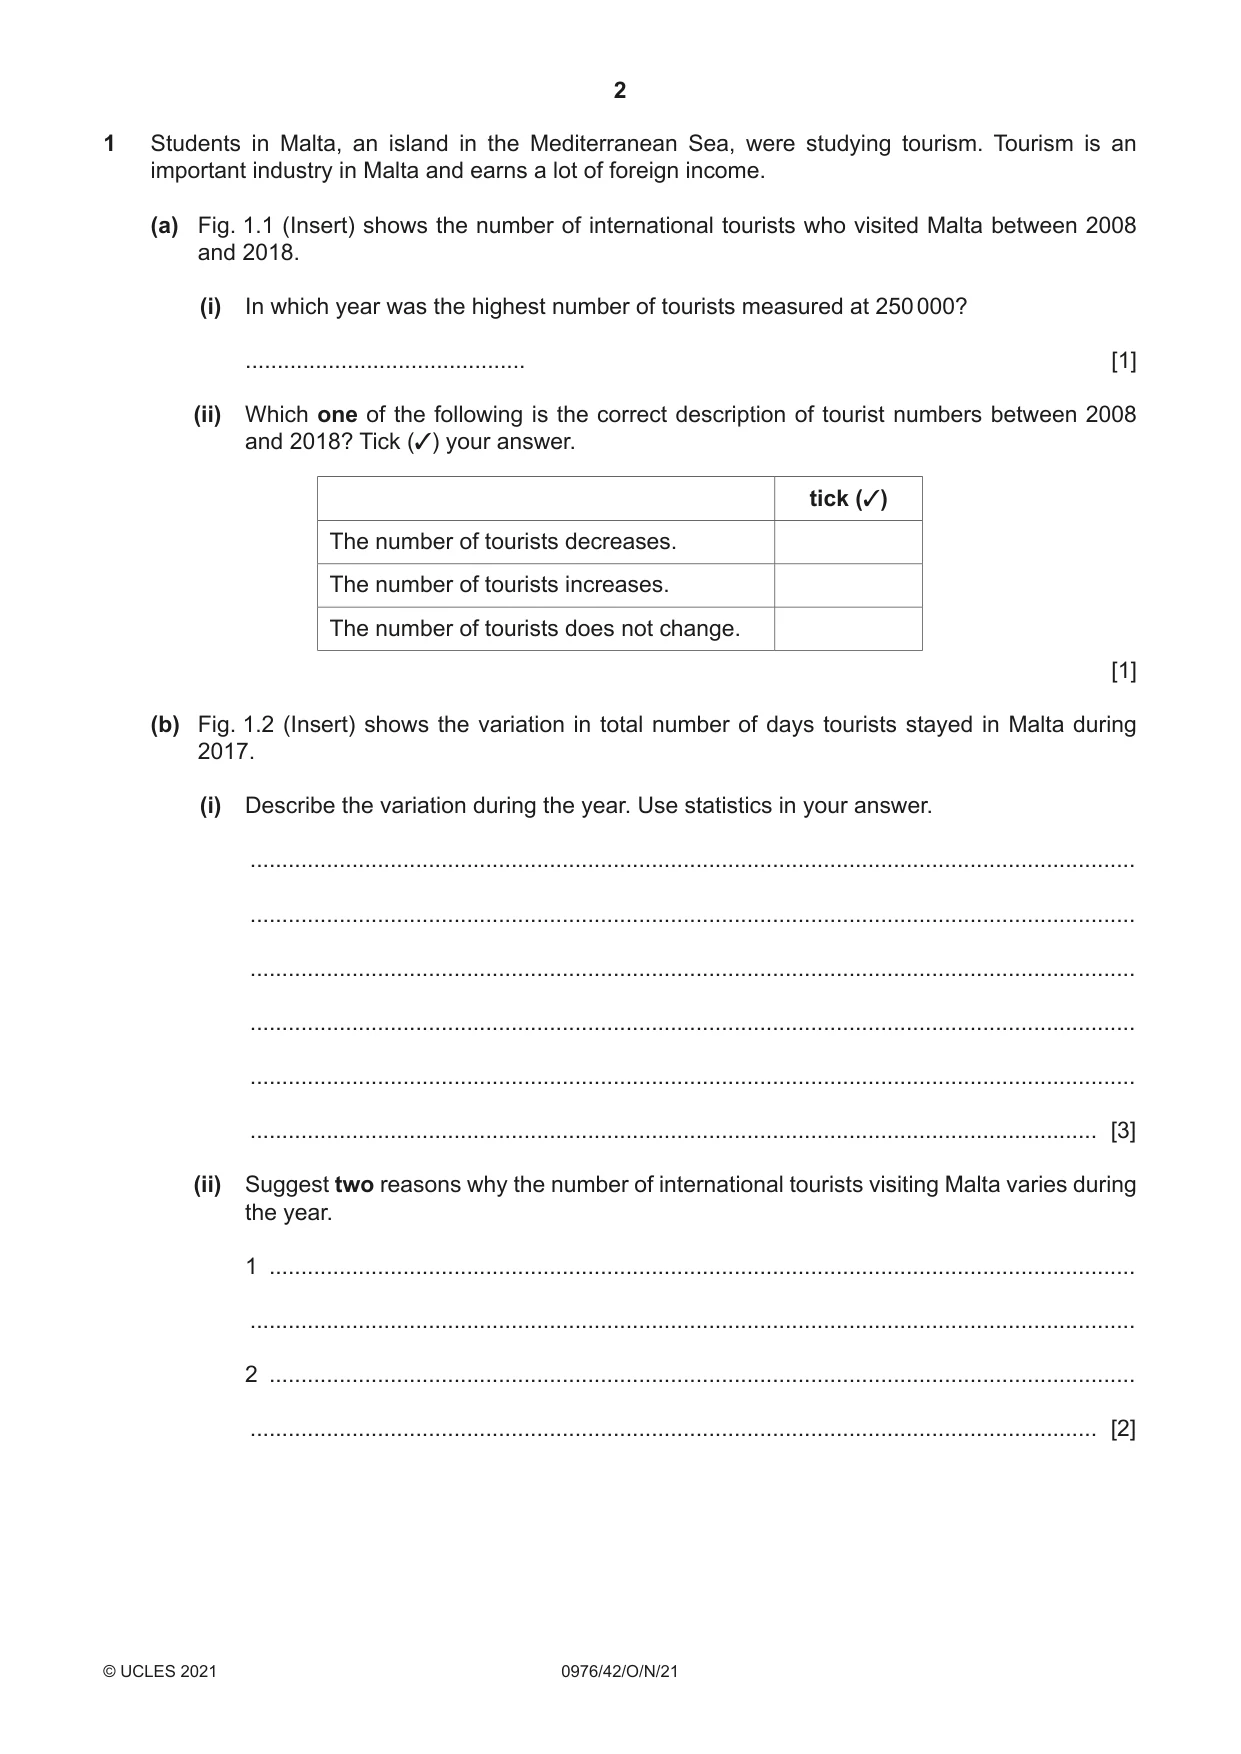
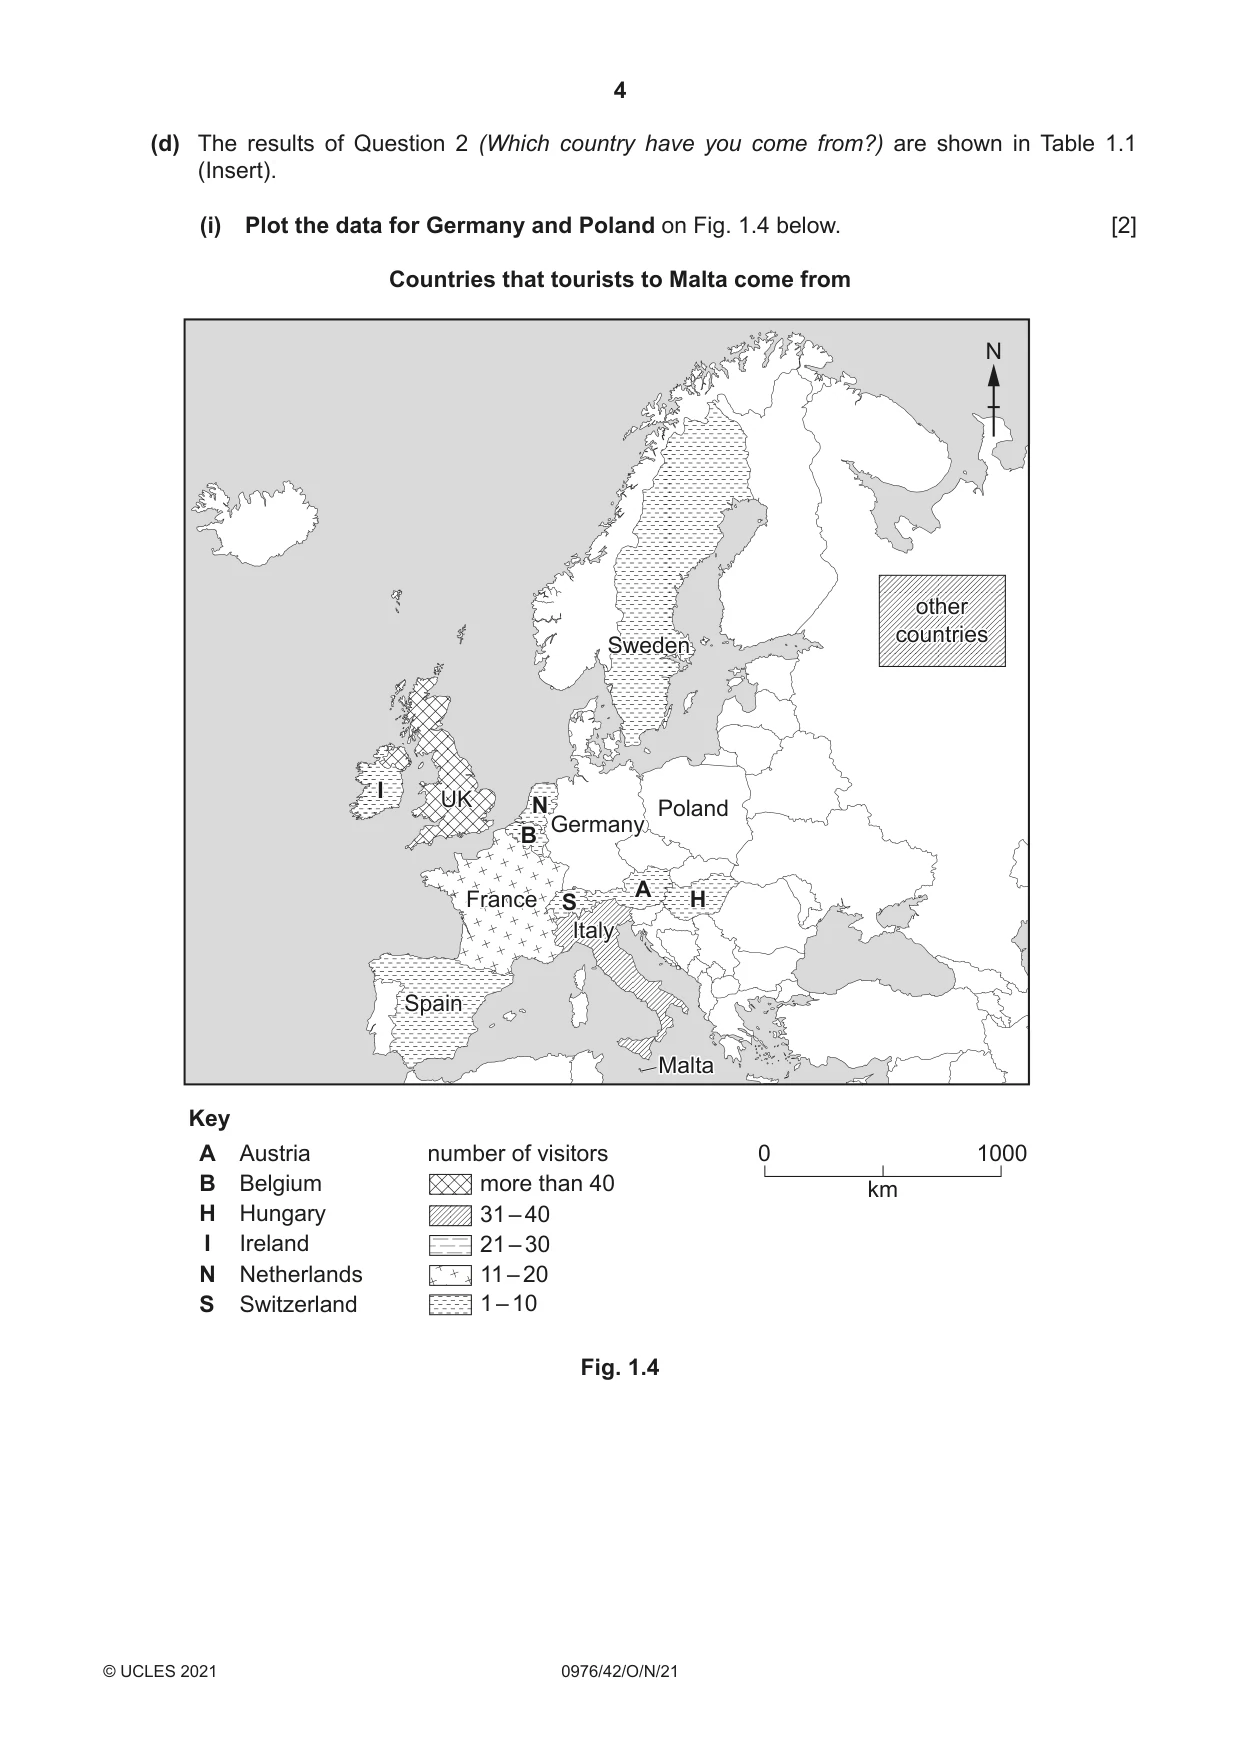
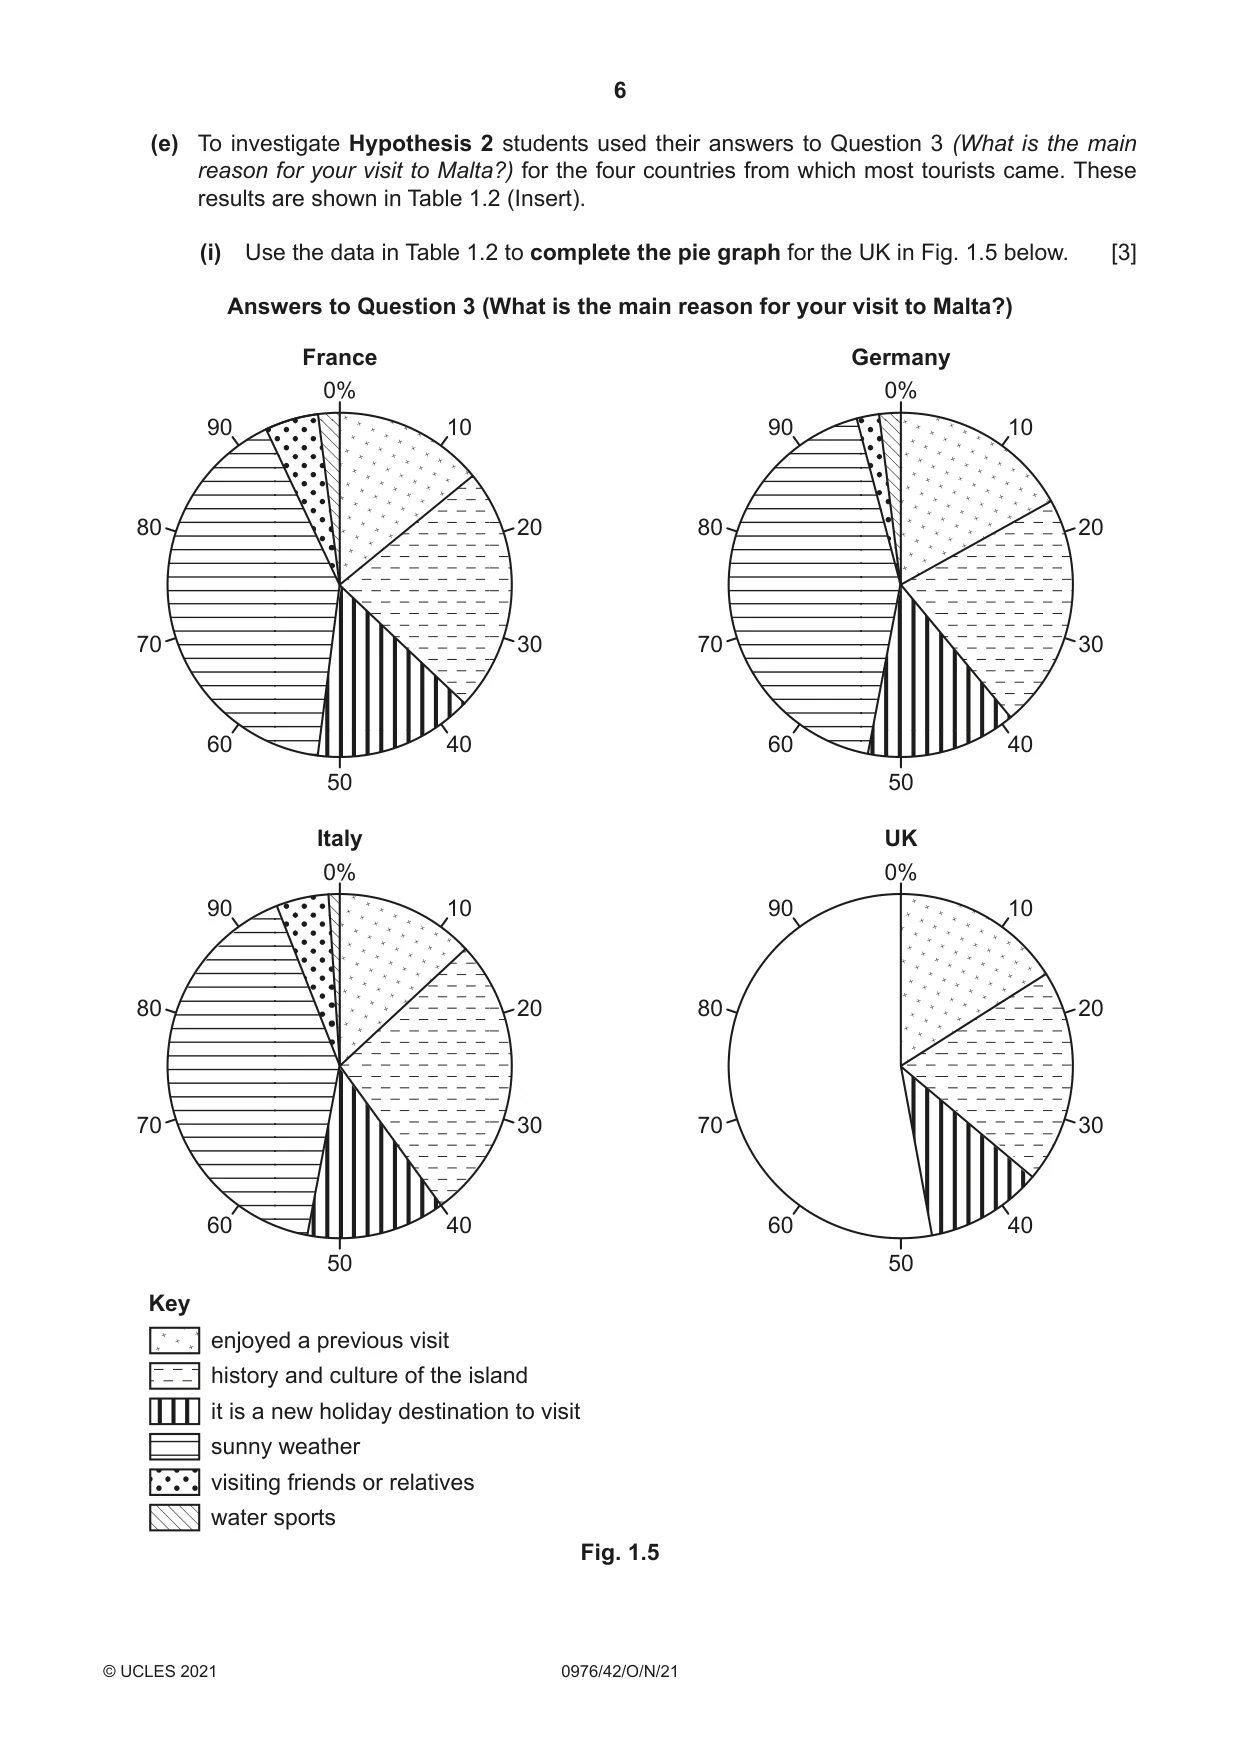
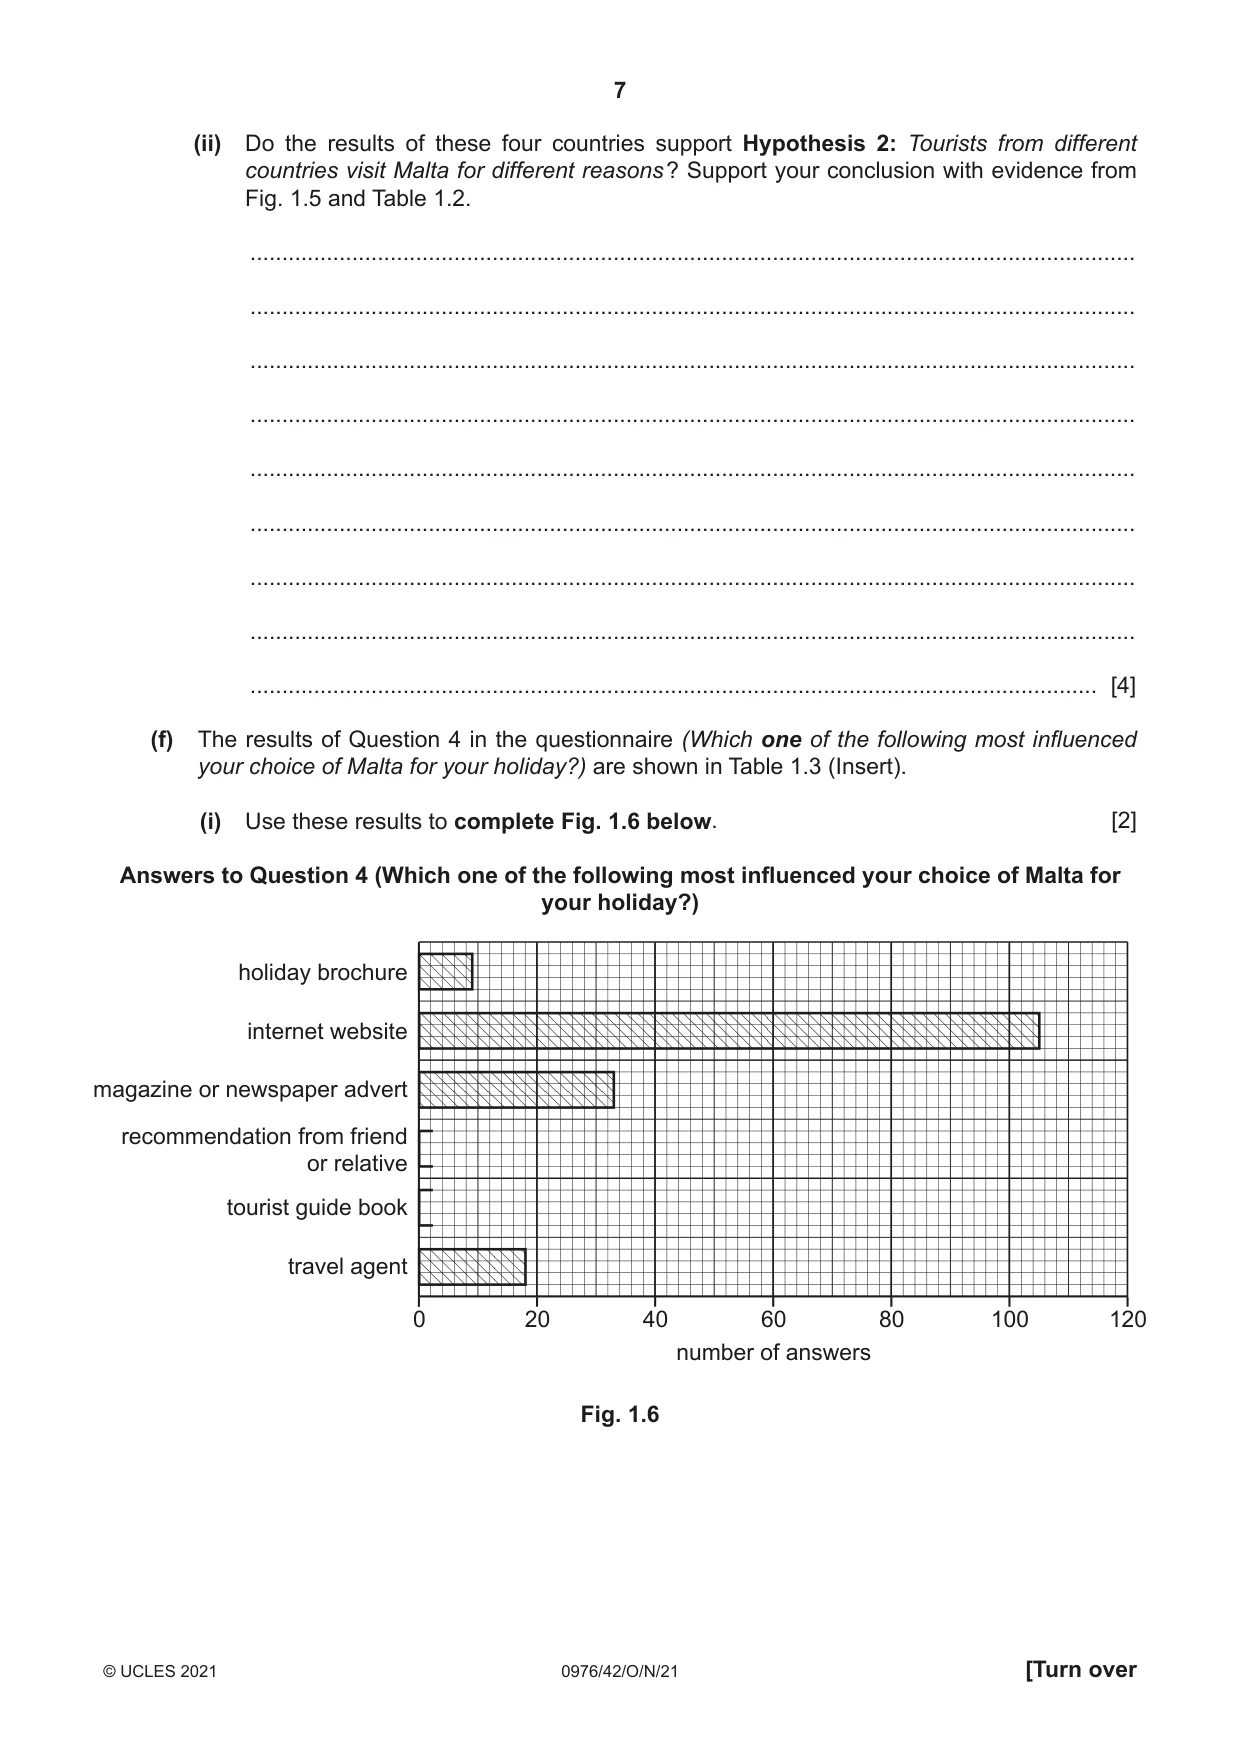
1 Students in Malta, an island in the Mediterranean Sea, were studying tourism. Tourism is an important industry in Malta and earns a lot of foreign income. (a) Fig. 1.1 (Insert) shows the number of international tourists who visited Malta between 2008 and 2018. (i) In which year was the highest number of tourists measured at 250 000? ............................................ [1] (ii) Which one of the following is the correct description of tourist numbers between 2008 and 2018? Tick (3) your answer. tick (3) The number of tourists decreases. The number of tourists increases. The number of tourists does not change. [1] (b) Fig. 1.2 (Insert) shows the variation in total number of days tourists stayed in Malta during 2017. (i) Describe the variation during the year. Use statistics in your answer. ........................................................................................................................................... ........................................................................................................................................... ........................................................................................................................................... ........................................................................................................................................... ........................................................................................................................................... ..................................................................................................................................... [3] (ii) Suggest two reasons why the number of international tourists visiting Malta varies during the year. 1 ........................................................................................................................................ ........................................................................................................................................... 2 ........................................................................................................................................ ..................................................................................................................................... [2] The students decided to test the following hypotheses: Hypothesis 1: More tourists to Malta come from the UK than from any other country. Hypothesis 2: Tourists from different countries visit Malta for different reasons. (c) To investigate their hypotheses the students produced a questionnaire. This is shown in Fig. 1.3 (Insert). Name a sampling method which the students could have used to get their answers to the questionnaire. ............................................ Describe this sampling method. ................................................................................................................................................... ................................................................................................................................................... ................................................................................................................................................... ............................................................................................................................................. [3] (d) The results of Question 2 (Which country have you come from?) are shown in Table 1.1 (Insert). (i) Plot the data for Germany and Poland on Fig. 1.4 below. [2] Countries that tourists to Malta come from N otherother countriescountries SwedenSweden II UKUK NN PolandPoland GermanyGermany BB AA FranceFrance SS HH ItalyItaly SpainSpain MaltaMalta Key A Austria number of visitors 0 1000 B Belgium more than 40 km H Hungary 31 – 40 I Ireland 21 – 30 N Netherlands 11 – 20 S Switzerland 1 – 10 Fig. 1.4 (ii) What conclusion would the students make to Hypothesis 1: More tourists to Malta come from the UK than from any other country? Support your decision with evidence from Fig. 1.4 and Table 1.1. ........................................................................................................................................... ........................................................................................................................................... ........................................................................................................................................... ........................................................................................................................................... ........................................................................................................................................... ..................................................................................................................................... [3] (e) To investigate Hypothesis 2 students used their answers to Question 3 (What is the main reason for your visit to Malta?) for the four countries from which most tourists came. These results are shown in Table 1.2 (Insert). (i) Use the data in Table 1.2 to complete the pie graph for the UK in Fig. 1.5 below. [3] Answers to Question 3 (What is the main reason for your visit to Malta?) France Germany 0% 0% 90 10 90 10 80 20 80 20 70 30 70 30 60 40 60 40 50 50 Italy UK 0% 0% 90 10 90 10 80 20 80 20 70 30 70 30 60 40 60 40 50 50 Key enjoyed a previous visit history and culture of the island it is a new holiday destination to visit sunny weather visiting friends or relatives water sports Fig. 1.5 (ii) Do the results of these four countries support Hypothesis 2: Tourists from different countries visit Malta for different reasons ? Support your conclusion with evidence from Fig. 1.5 and Table 1.2. ........................................................................................................................................... ........................................................................................................................................... ........................................................................................................................................... ........................................................................................................................................... ........................................................................................................................................... ........................................................................................................................................... ........................................................................................................................................... ........................................................................................................................................... ..................................................................................................................................... [4] (f) The results of Question 4 in the questionnaire (Which one of the following most influenced your choice of Malta for your holiday?) are shown in Table 1.3 (Insert). (i) Use these results to complete Fig. 1.6 below. [2] Answers to Question 4 (Which one of the following most influenced your choice of Malta for your holiday?) holiday brochure internet website magazine or newspaper advert recommendation from friend or relative tourist guide book travel agent 0 20 40 60 80 100 120 number of answers Fig. 1.6 (ii) Suggest how the Malta Tourism Authority could use the information in Fig. 1.6 and Table 1.3 to increase the number of tourists visiting Malta. ........................................................................................................................................... ........................................................................................................................................... ........................................................................................................................................... ..................................................................................................................................... [2] (g) Describe two likely benefits and two likely disadvantages of tourism for the local people in Malta. Benefits 1 ................................................................................................................................................ ................................................................................................................................................... 2 ................................................................................................................................................ ................................................................................................................................................... Disadvantages 1 ................................................................................................................................................ ................................................................................................................................................... 2 ................................................................................................................................................ ............................................................................................................................................. [4] [Total: 30]
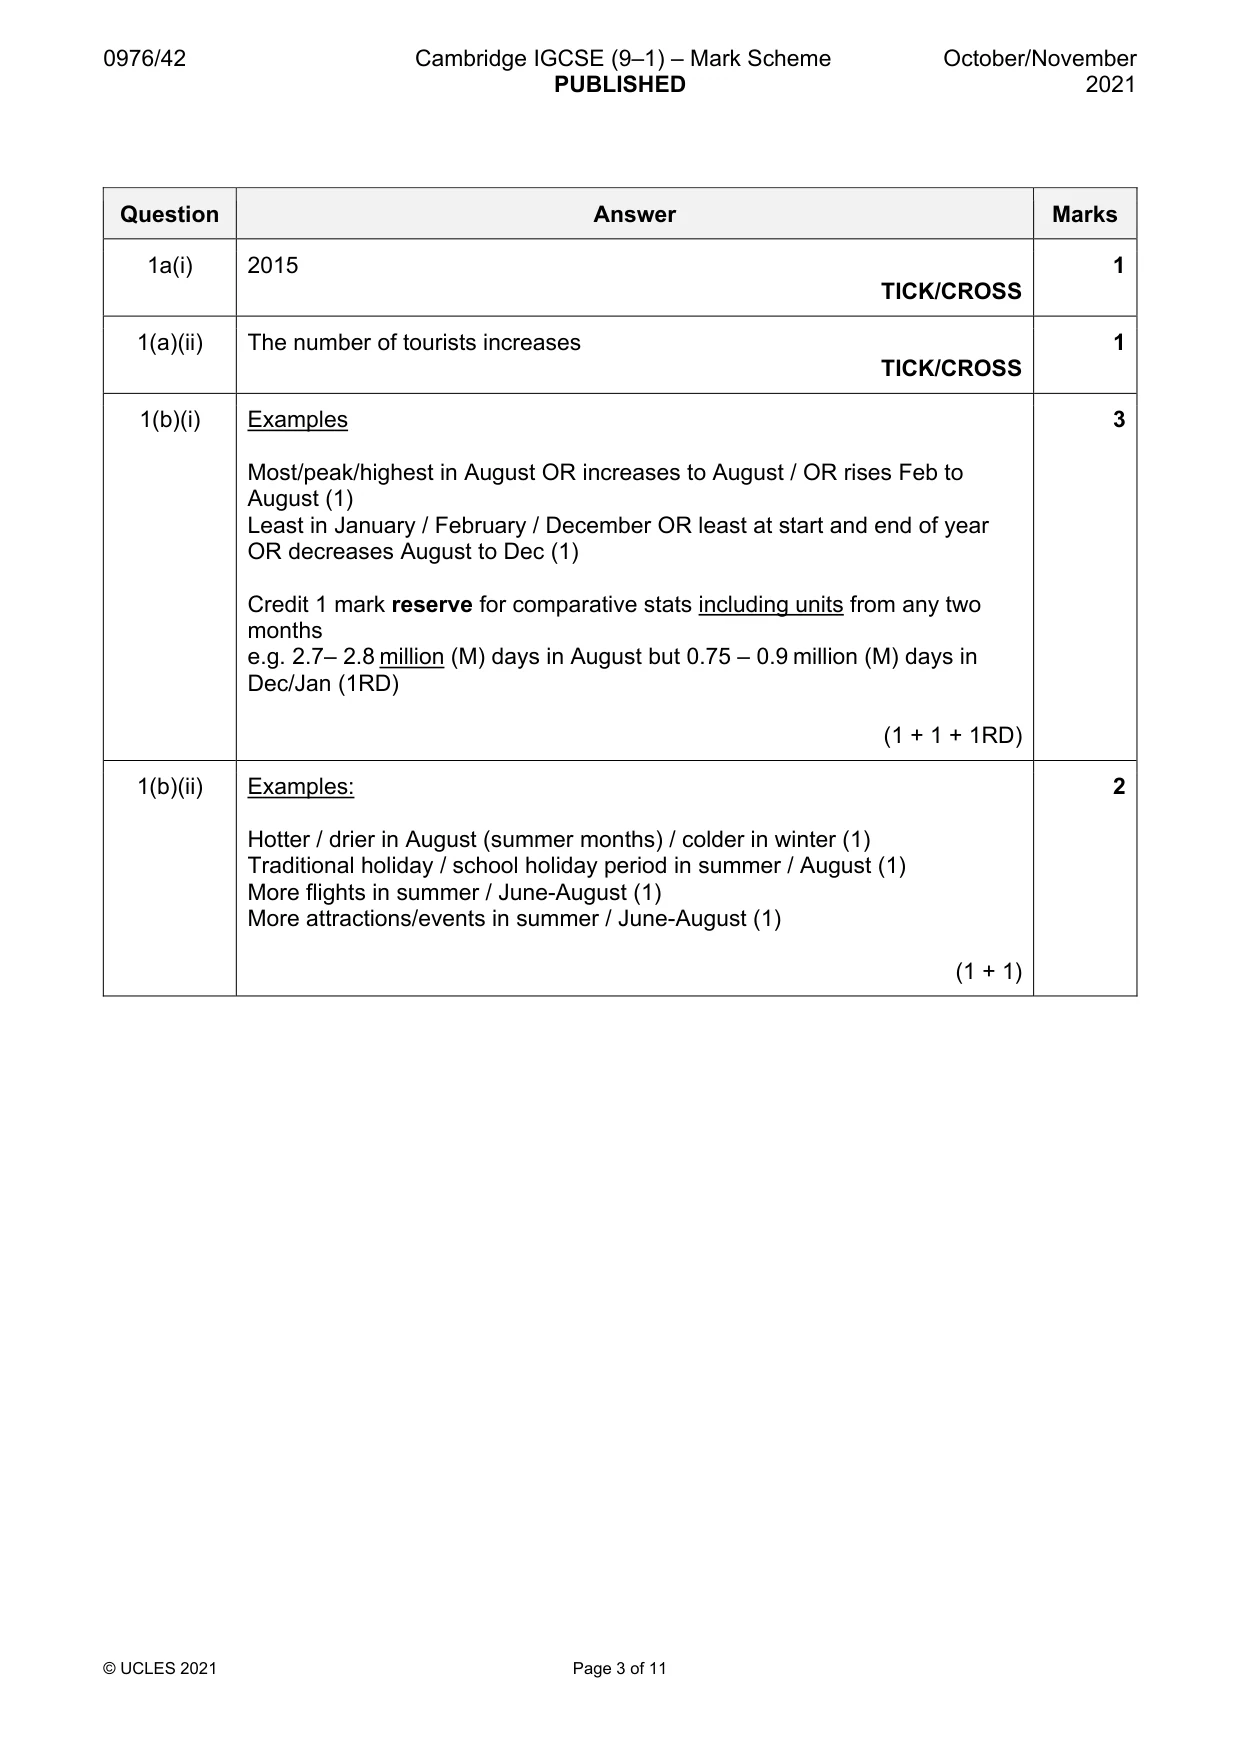
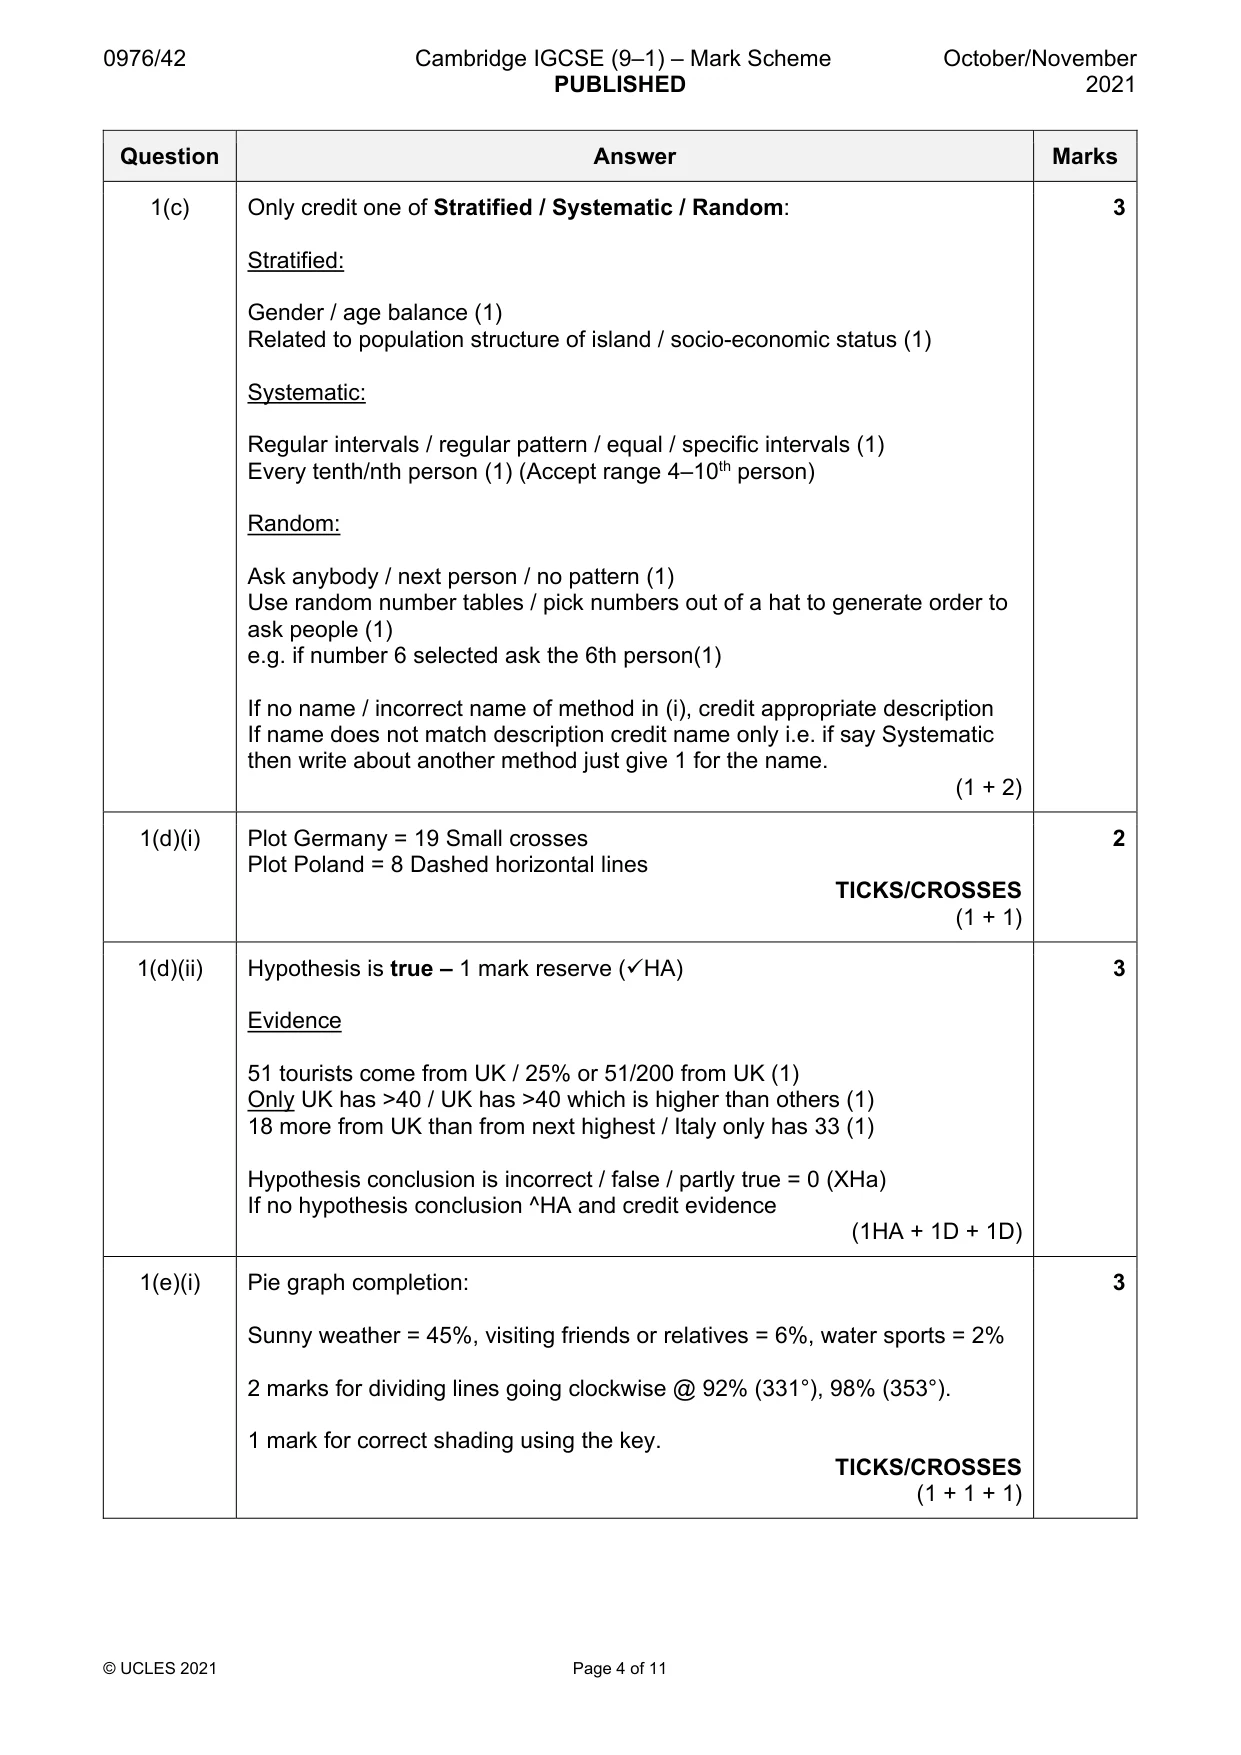
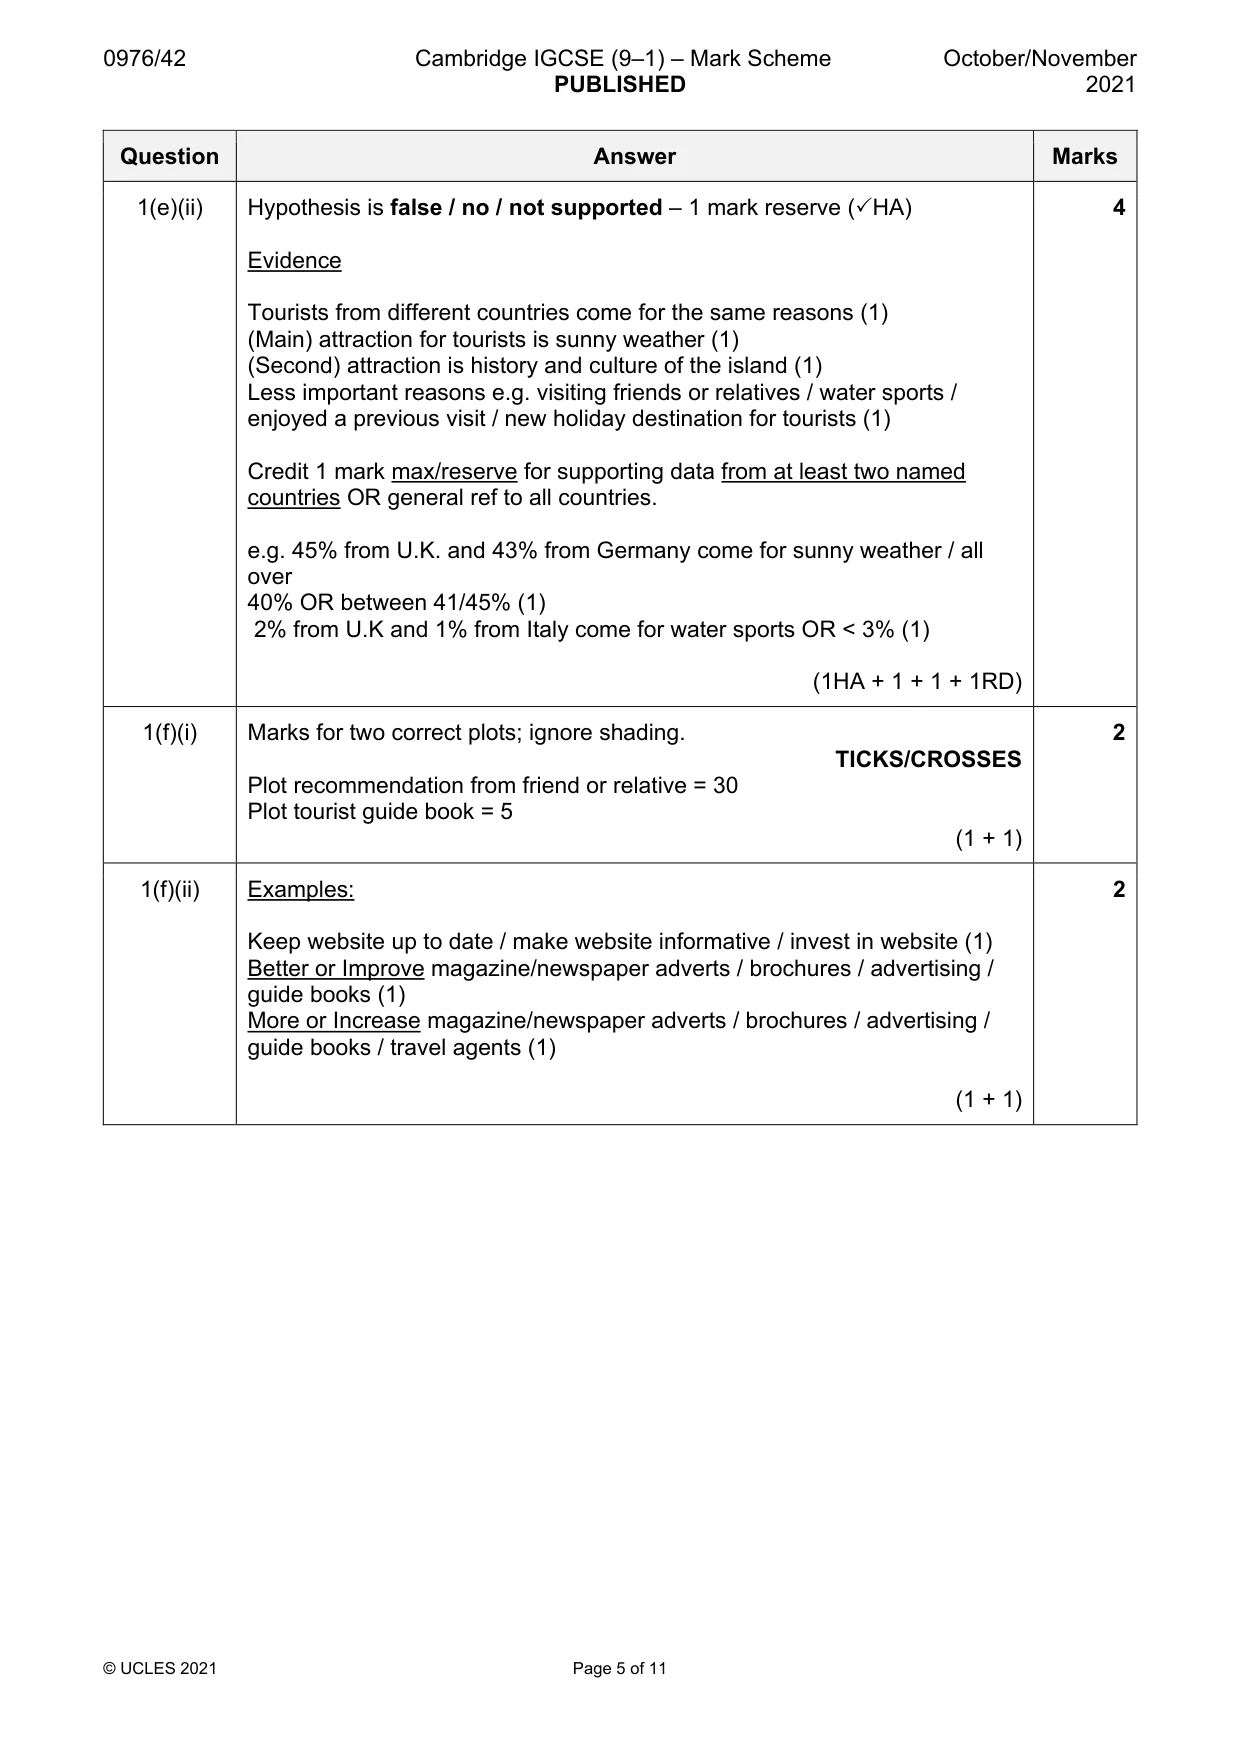
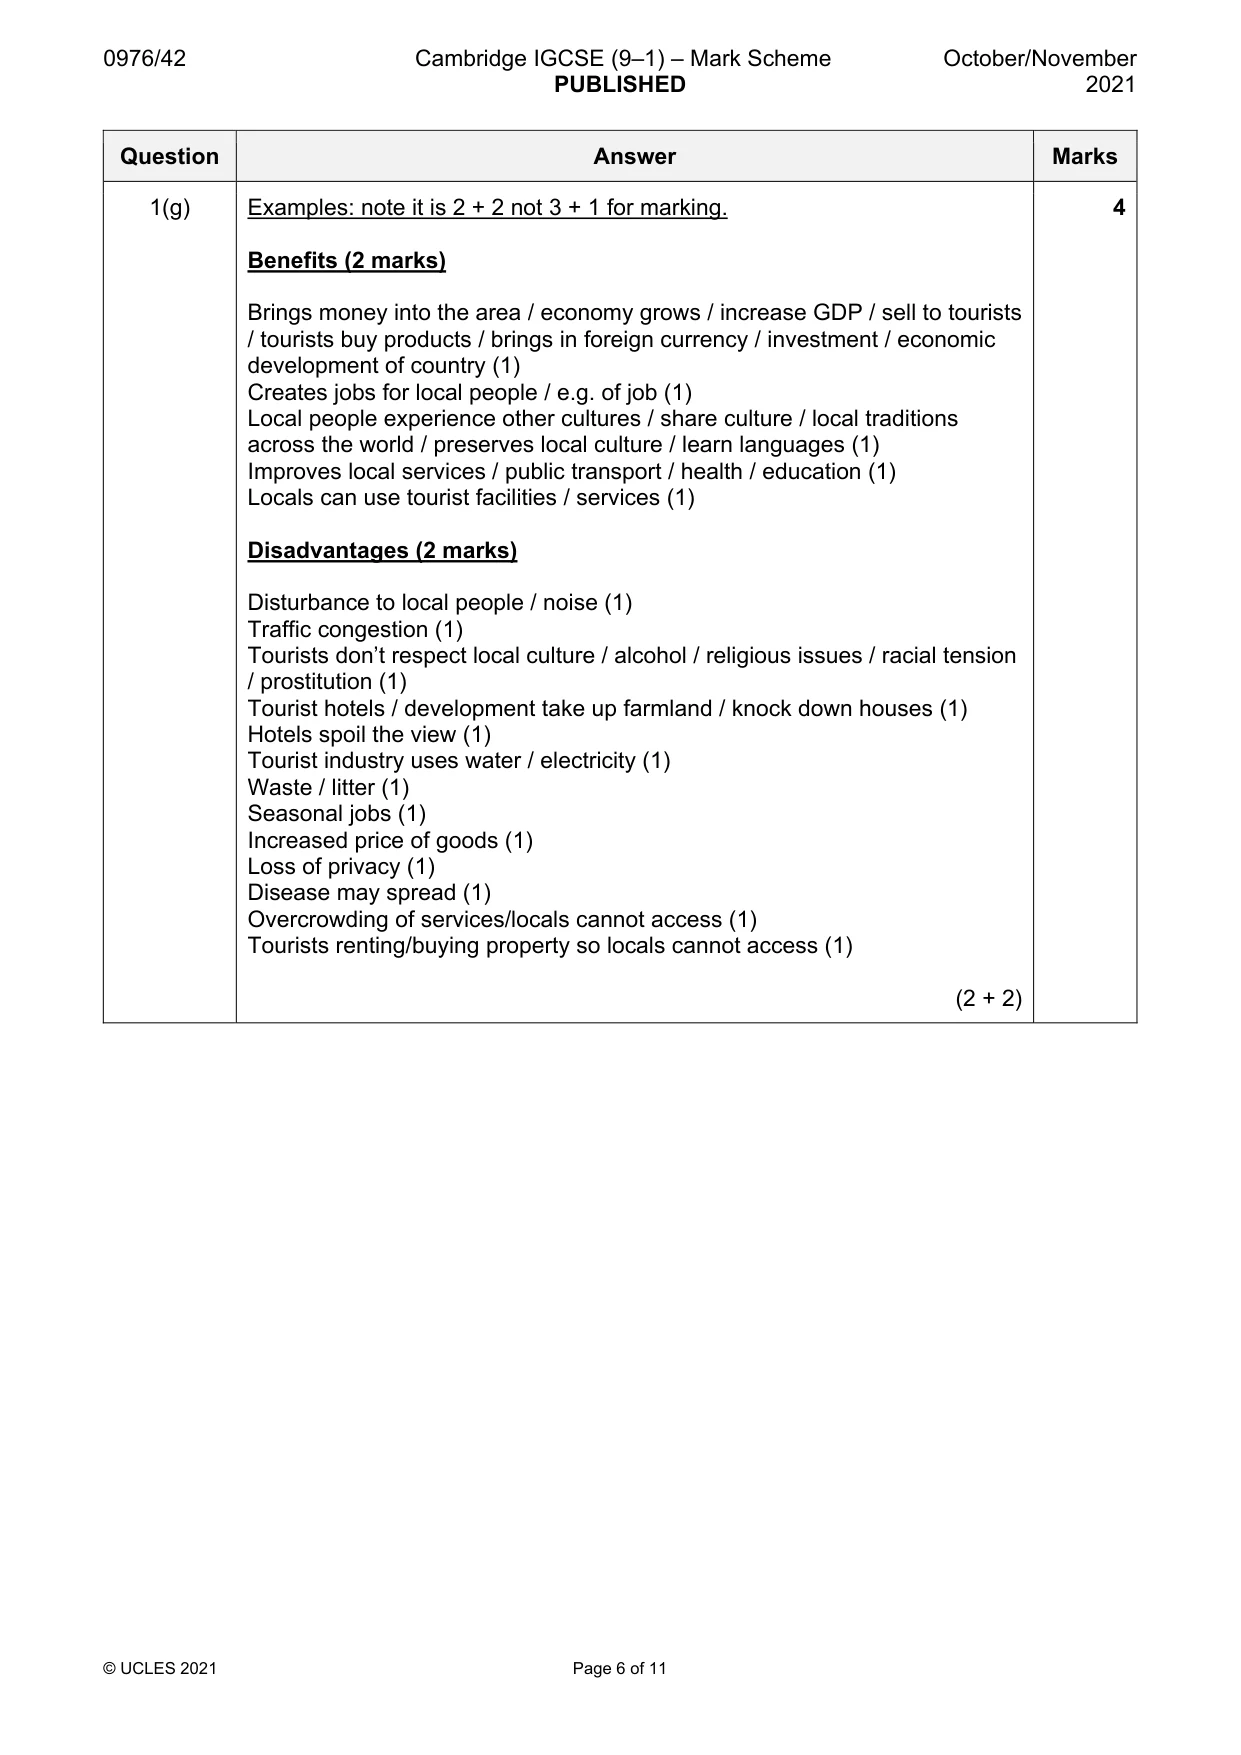
Mark scheme: Question Answer Marks 1a(i) 2015 1 TICK/CROSS 1(a)(ii) The number of tourists increases 1 TICK/CROSS 1(b)(i) Examples 3 Most/peak/highest in August OR increases to August / OR rises Feb to August (1) Least in January / February / December OR least at start and end of year OR decreases August to Dec (1) Credit 1 mark reserve for comparative stats including units from any two months e.g. 2.7– 2.8 million (M) days in August but 0.75 – 0.9 million (M) days in Dec/Jan (1RD) (1 + 1 + 1RD) 1(b)(ii) Examples: 2 Hotter / drier in August (summer months) / colder in winter (1) Traditional holiday / school holiday period in summer / August (1) More flights in summer / June-August (1) More attractions/events in summer / June-August (1) (1 + 1) 1(c) Only credit one of Stratified / Systematic / Random: 3 Stratified: Gender / age balance (1) Related to population structure of island / socio-economic status (1) Systematic: Regular intervals / regular pattern / equal / specific intervals (1) Every tenth/nth person (1) (Accept range 4–10th person) Random: Ask anybody / next person / no pattern (1) Use random number tables / pick numbers out of a hat to generate order to ask people (1) e.g. if number 6 selected ask the 6th person(1) If no name / incorrect name of method in (i), credit appropriate description If name does not match description credit name only i.e. if say Systematic then write about another method just give 1 for the name. (1 + 2) 1(d)(i) Plot Germany = 19 Small crosses 2 Plot Poland = 8 Dashed horizontal lines TICKS/CROSSES (1 + 1) 1(d)(ii) Hypothesis is true – 1 mark reserve (HA) 3 Evidence 51 tourists come from UK / 25% or 51/200 from UK (1) Only UK has >40 / UK has >40 which is higher than others (1) 18 more from UK than from next highest / Italy only has 33 (1) Hypothesis conclusion is incorrect / false / partly true = 0 (XHa) If no hypothesis conclusion ^HA and credit evidence (1HA + 1D + 1D) 1(e)(i) Pie graph completion: 3 Sunny weather = 45%, visiting friends or relatives = 6%, water sports = 2% 2 marks for dividing lines going clockwise @ 92% (331°), 98% (353°). 1 mark for correct shading using the key. TICKS/CROSSES (1 + 1 + 1) 1(e)(ii) Hypothesis is false / no / not supported – 1 mark reserve (HA) 4 Evidence Tourists from different countries come for the same reasons (1) (Main) attraction for tourists is sunny weather (1) (Second) attraction is history and culture of the island (1) Less important reasons e.g. visiting friends or relatives / water sports / enjoyed a previous visit / new holiday destination for tourists (1) Credit 1 mark max/reserve for supporting data from at least two named countries OR general ref to all countries. e.g. 45% from U.K. and 43% from Germany come for sunny weather / all over 40% OR between 41/45% (1) 2% from U.K and 1% from Italy come for water sports OR < 3% (1) (1HA + 1 + 1 + 1RD) 1(f)(i) Marks for two correct plots; ignore shading. 2 TICKS/CROSSES Plot recommendation from friend or relative = 30 Plot tourist guide book = 5 (1 + 1) 1(f)(ii) Examples: 2 Keep website up to date / make website informative / invest in website (1) Better or Improve magazine/newspaper adverts / brochures / advertising / guide books (1) More or Increase magazine/newspaper adverts / brochures / advertising / guide books / travel agents (1) (1 + 1) 1(g) Examples: note it is 2 + 2 not 3 + 1 for marking. 4 Benefits (2 marks) Brings money into the area / economy grows / increase GDP / sell to tourists / tourists buy products / brings in foreign currency / investment / economic development of country (1) Creates jobs for local people / e.g. of job (1) Local people experience other cultures / share culture / local traditions across the world / preserves local culture / learn languages (1) Improves local services / public transport / health / education (1) Locals can use tourist facilities / services (1) Disadvantages (2 marks) Disturbance to local people / noise (1) Traffic congestion (1) Tourists don’t respect local culture / alcohol / religious issues / racial tension / prostitution (1) Tourist hotels / development take up farmland / knock down houses (1) Hotels spoil the view (1) Tourist industry uses water / electricity (1) Waste / litter (1) Seasonal jobs (1) Increased price of goods (1) Loss of privacy (1) Disease may spread (1) Overcrowding of services/locals cannot access (1) Tourists renting/buying property so locals cannot access (1) (2 + 2)
Q2 · Students in Wisconsin, USA, took part in a community project to test if the local river…
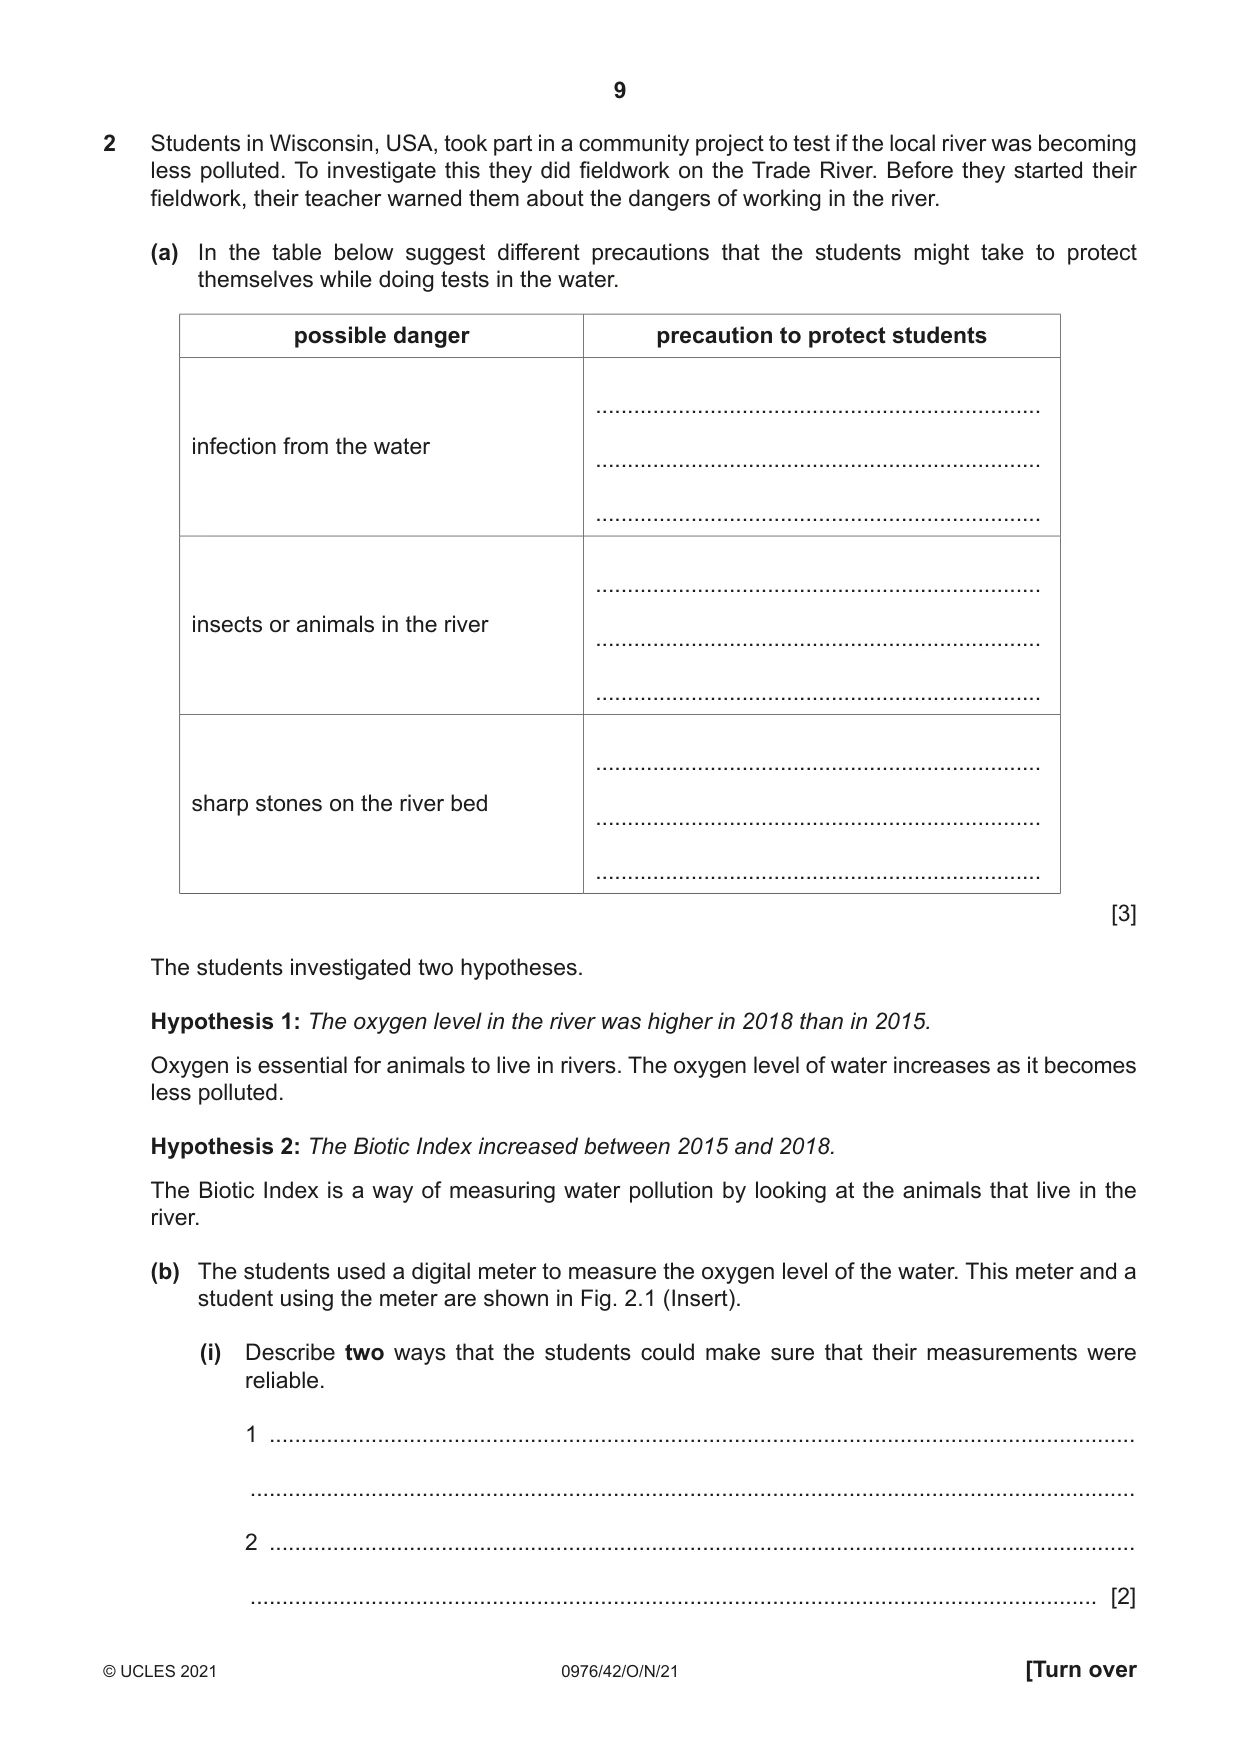
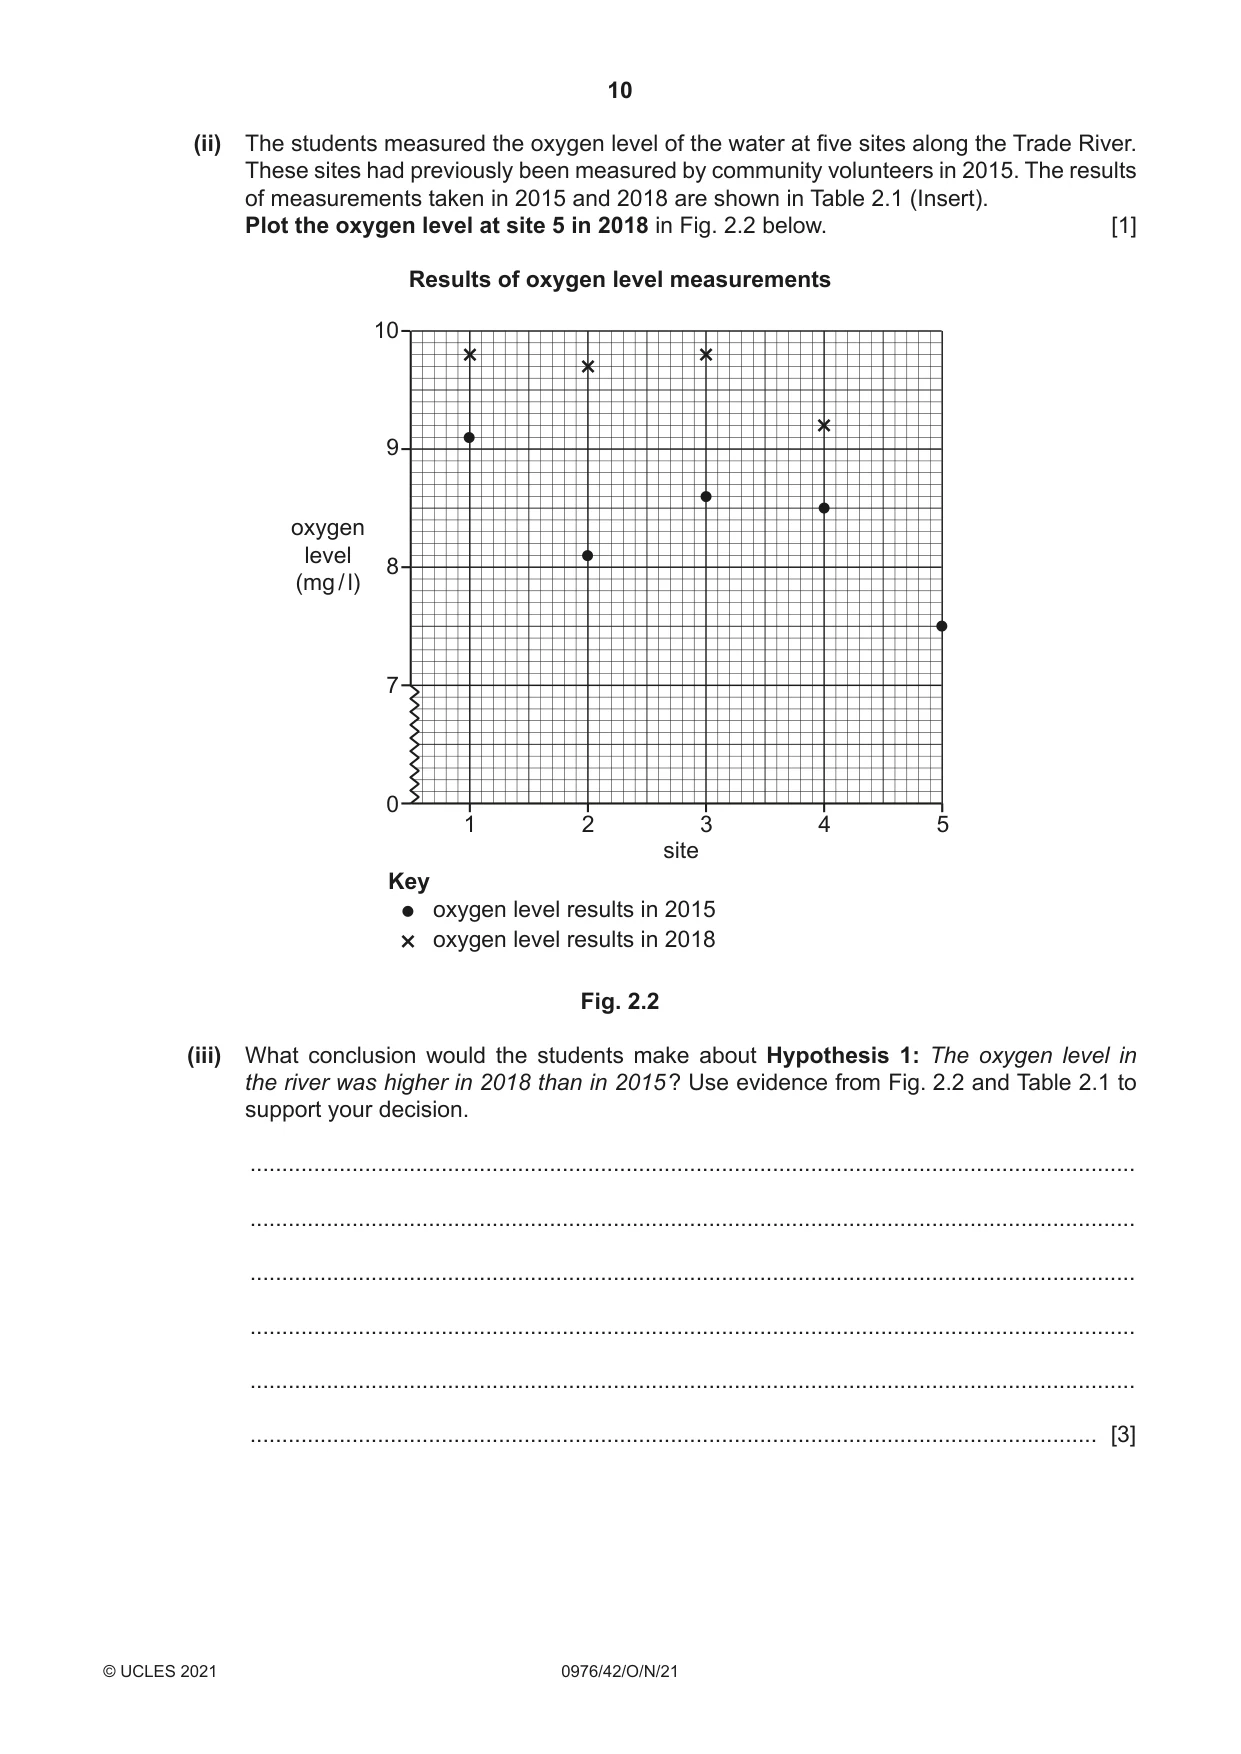
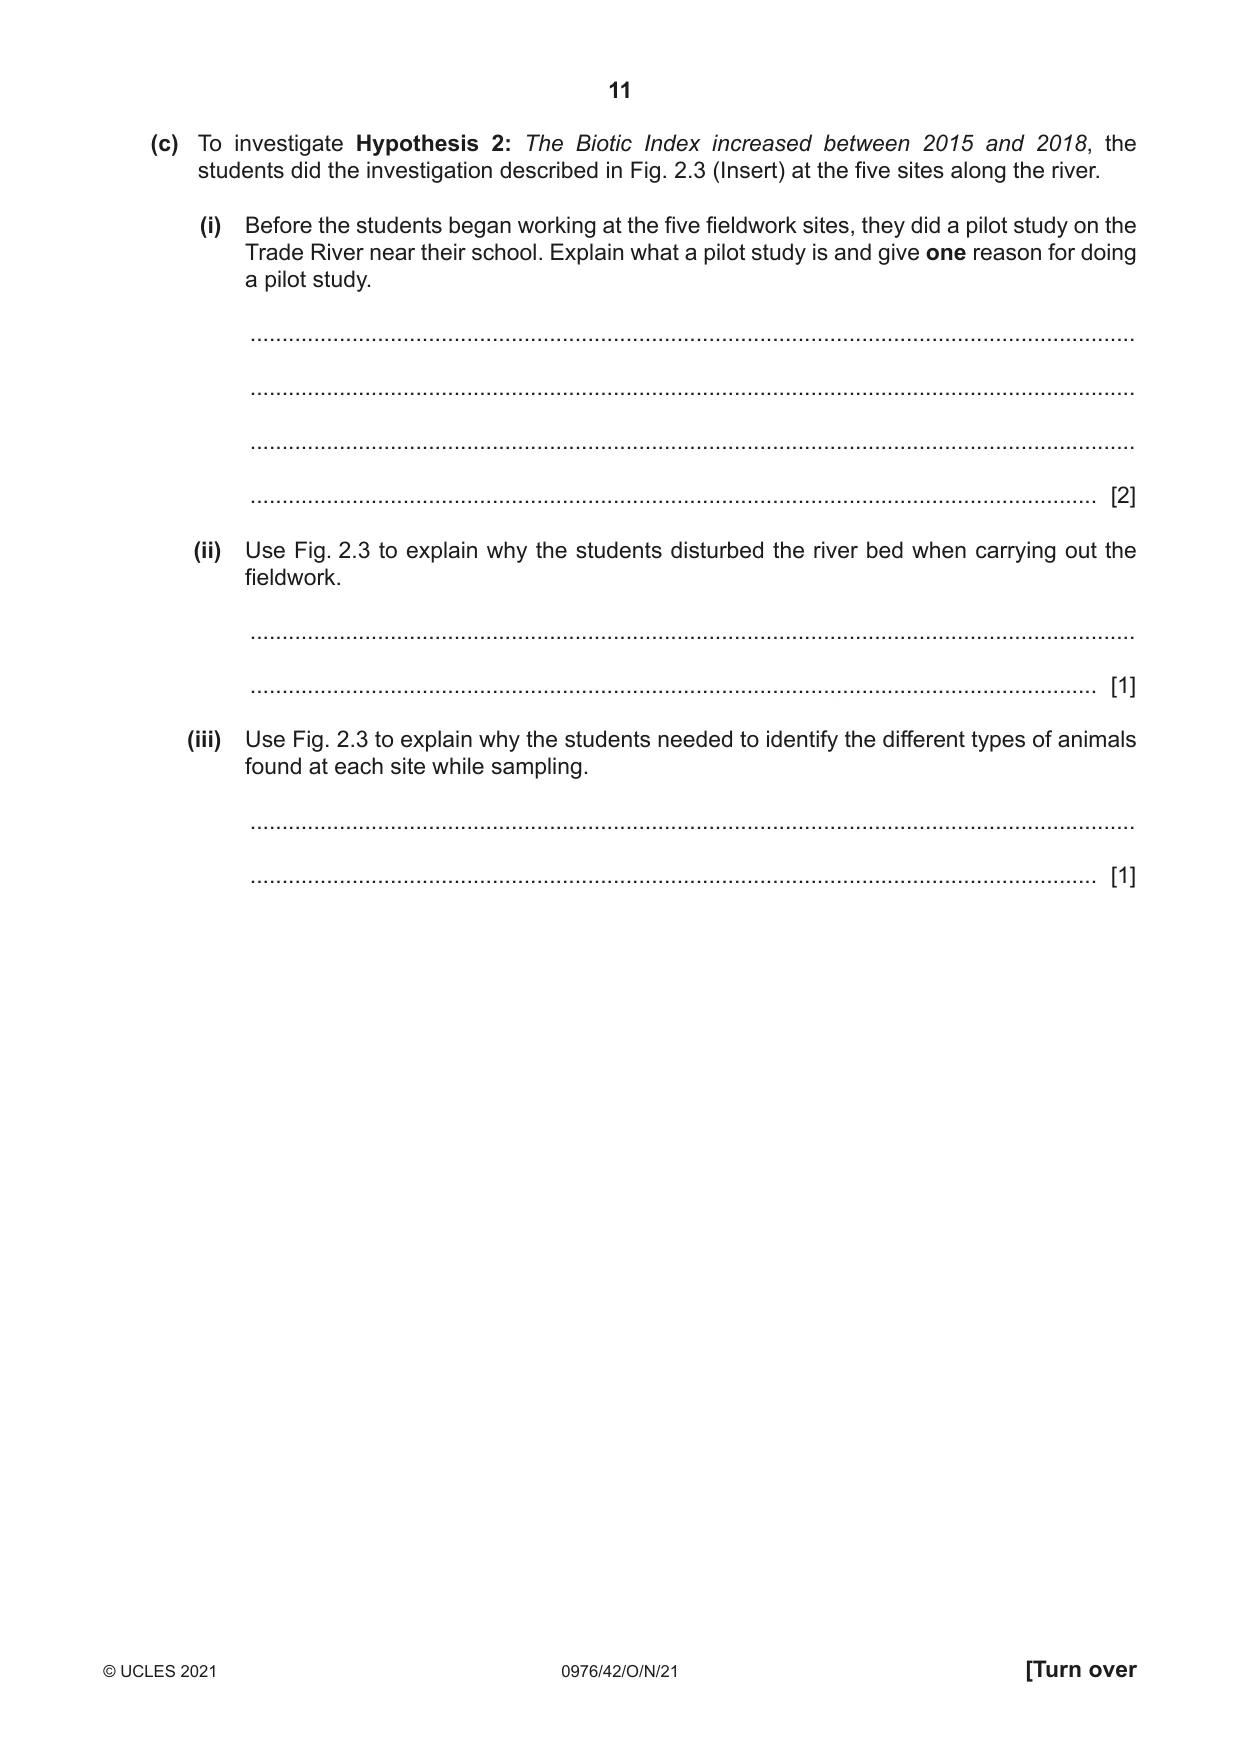
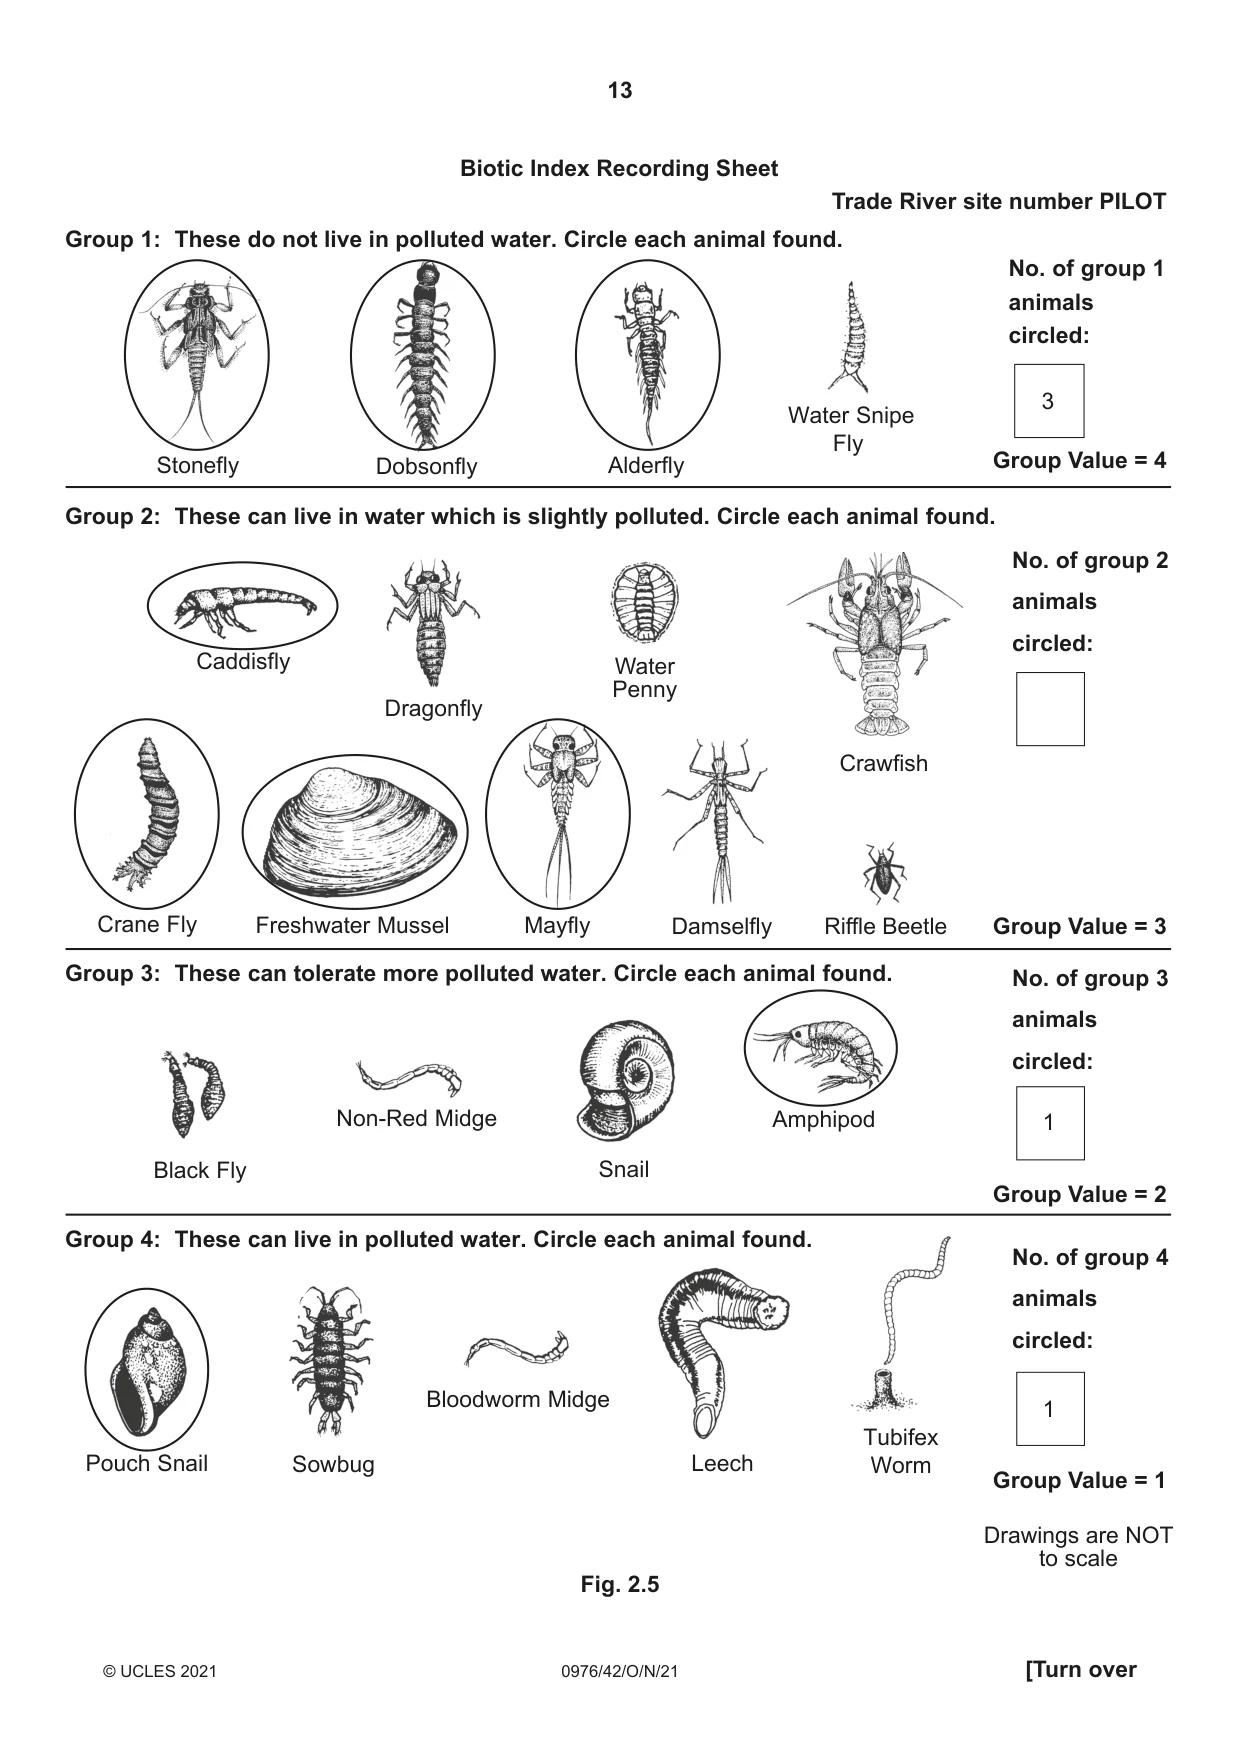
2 Students in Wisconsin, USA, took part in a community project to test if the local river was becoming less polluted. To investigate this they did fieldwork on the Trade River. Before they started their fieldwork, their teacher warned them about the dangers of working in the river. (a) In the table below suggest different precautions that the students might take to protect themselves while doing tests in the water. possible danger precaution to protect students ...................................................................... infection from the water ...................................................................... ...................................................................... ...................................................................... insects or animals in the river ...................................................................... ...................................................................... ...................................................................... sharp stones on the river bed ...................................................................... ...................................................................... [3] The students investigated two hypotheses. Hypothesis 1: The oxygen level in the river was higher in 2018 than in 2015. Oxygen is essential for animals to live in rivers. The oxygen level of water increases as it becomes less polluted. Hypothesis 2: The Biotic Index increased between 2015 and 2018. The Biotic Index is a way of measuring water pollution by looking at the animals that live in the river. (b) The students used a digital meter to measure the oxygen level of the water. This meter and a student using the meter are shown in Fig. 2.1 (Insert). (i) Describe two ways that the students could make sure that their measurements were reliable. 1 ........................................................................................................................................ ........................................................................................................................................... 2 ........................................................................................................................................ ..................................................................................................................................... [2] (ii) The students measured the oxygen level of the water at five sites along the Trade River. These sites had previously been measured by community volunteers in 2015. The results of measurements taken in 2015 and 2018 are shown in Table 2.1 (Insert). Plot the oxygen level at site 5 in 2018 in Fig. 2.2 below. [1] Results of oxygen level measurements 10 9 oxygen level 8 (mg / l) 7 0 1 2 3 4 5 site Key oxygen level results in 2015 oxygen level results in 2018 Fig. 2.2 (iii) What conclusion would the students make about Hypothesis 1: The oxygen level in the river was higher in 2018 than in 2015 ? Use evidence from Fig. 2.2 and Table 2.1 to support your decision. ........................................................................................................................................... ........................................................................................................................................... ........................................................................................................................................... ........................................................................................................................................... ........................................................................................................................................... ..................................................................................................................................... [3] (c) To investigate Hypothesis 2: The Biotic Index increased between 2015 and 2018, the students did the investigation described in Fig. 2.3 (Insert) at the five sites along the river. (i) Before the students began working at the five fieldwork sites, they did a pilot study on the Trade River near their school. Explain what a pilot study is and give one reason for doing a pilot study. ........................................................................................................................................... ........................................................................................................................................... ........................................................................................................................................... ..................................................................................................................................... [2] (ii) Use Fig. 2.3 to explain why the students disturbed the river bed when carrying out the fieldwork. ........................................................................................................................................... ..................................................................................................................................... [1] (iii) Use Fig. 2.3 to explain why the students needed to identify the different types of animals found at each site while sampling. ........................................................................................................................................... ..................................................................................................................................... [1]
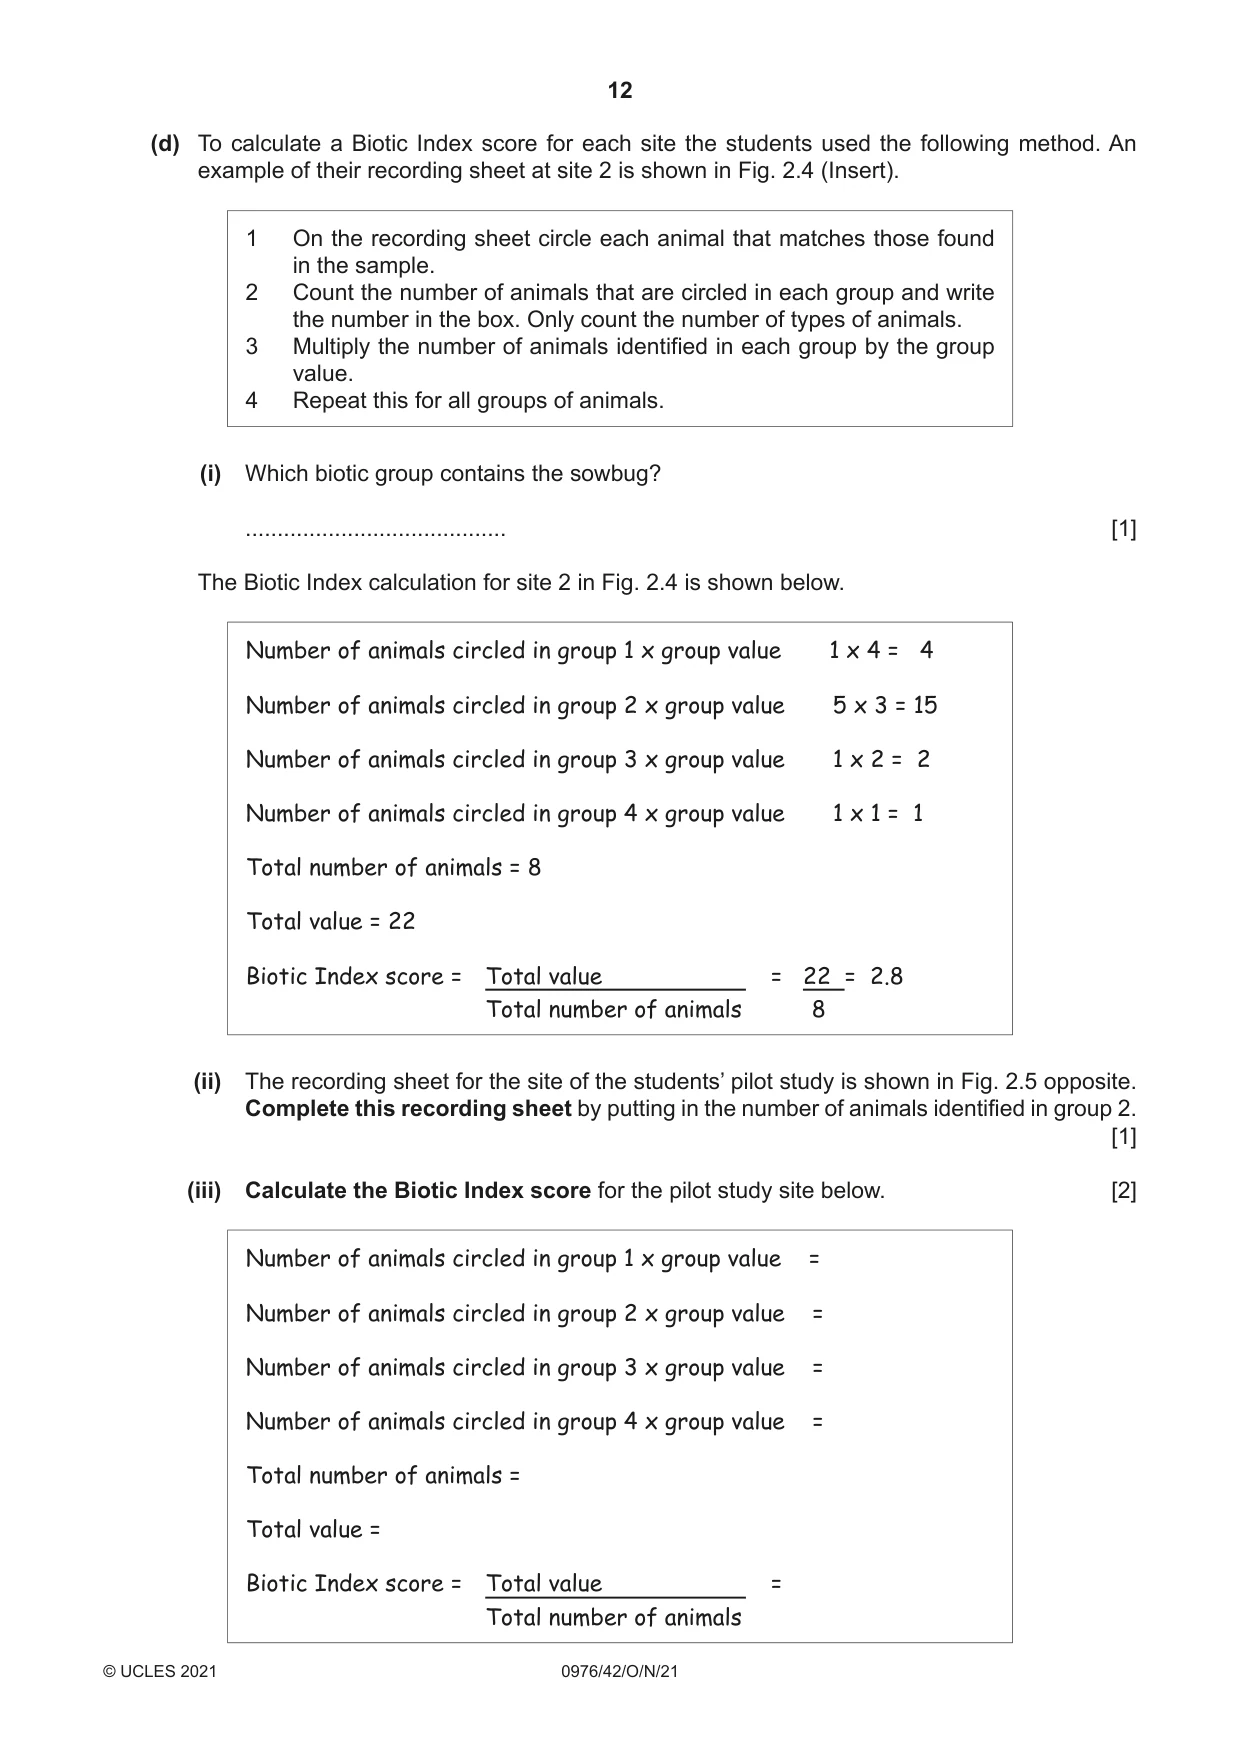
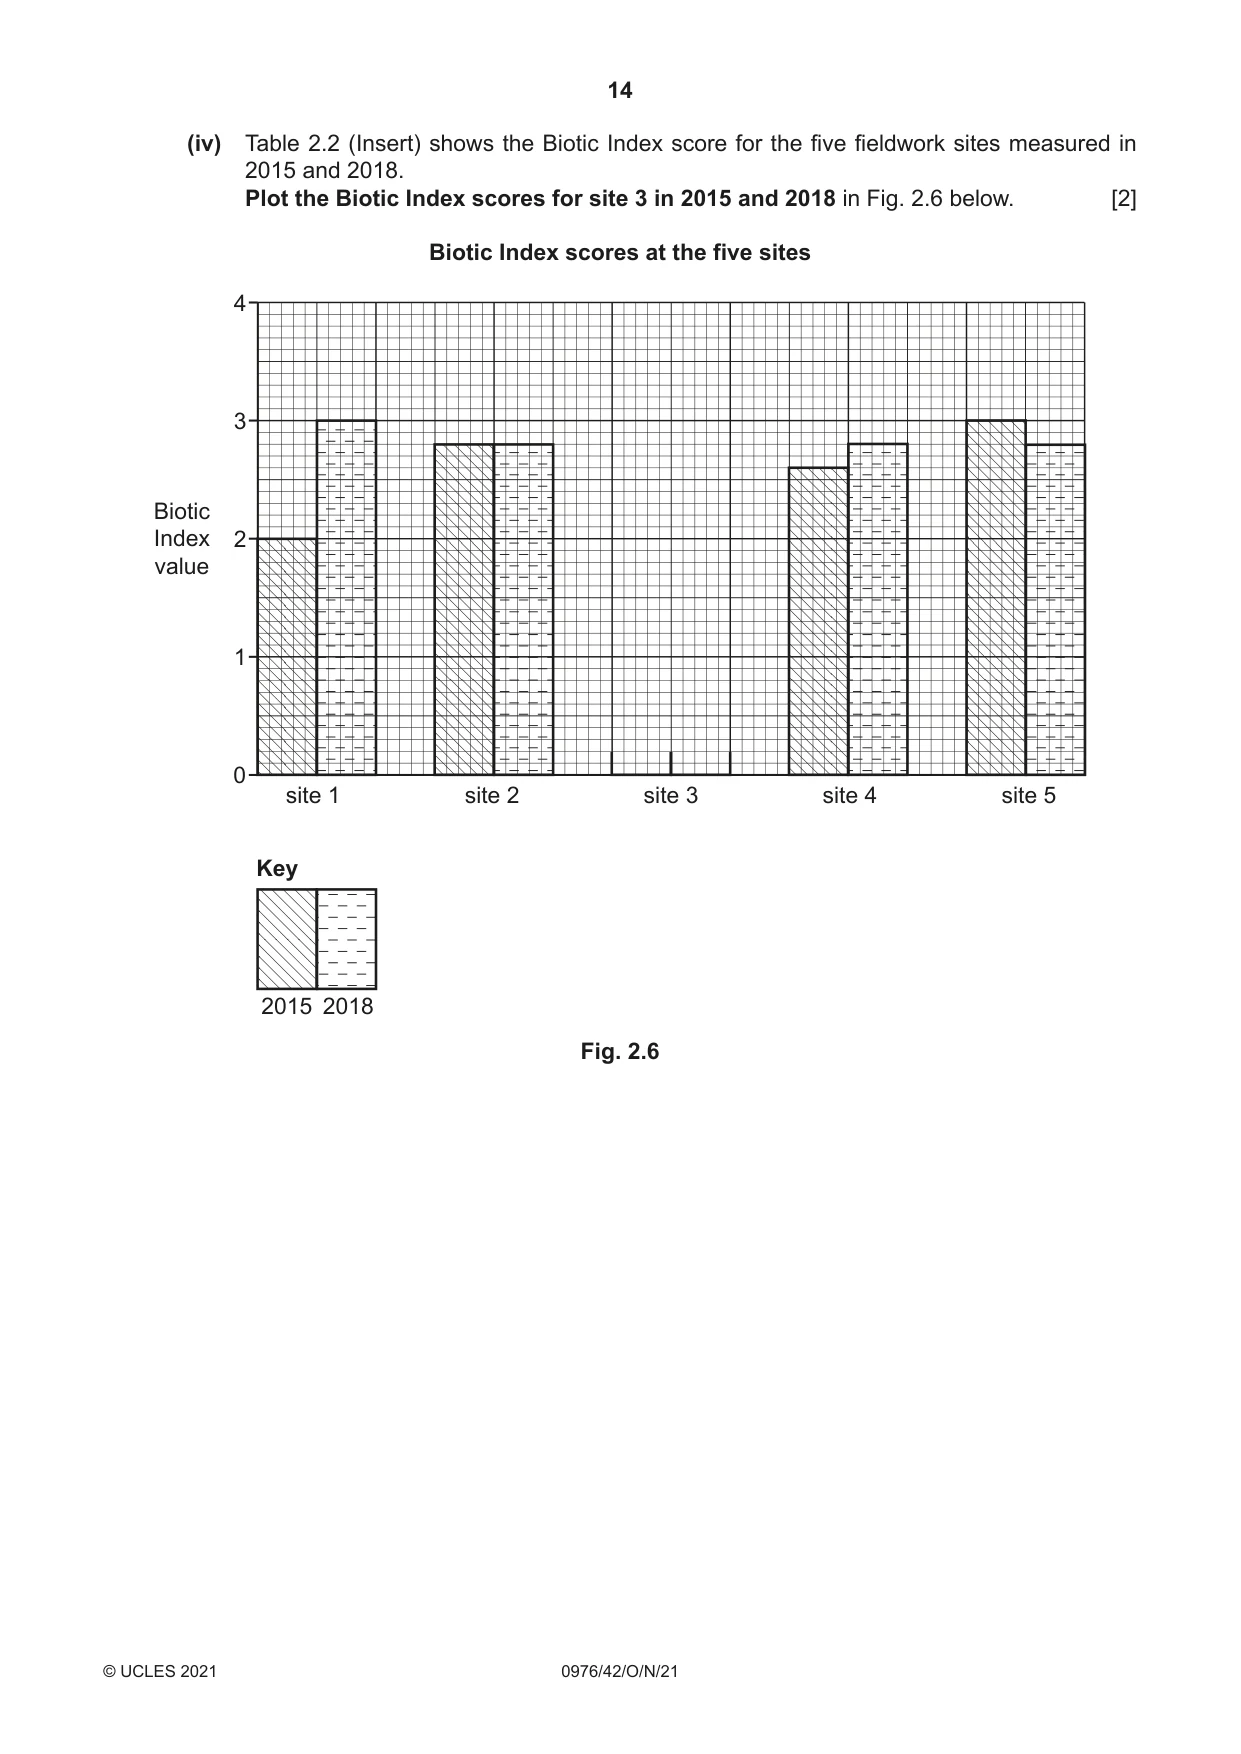
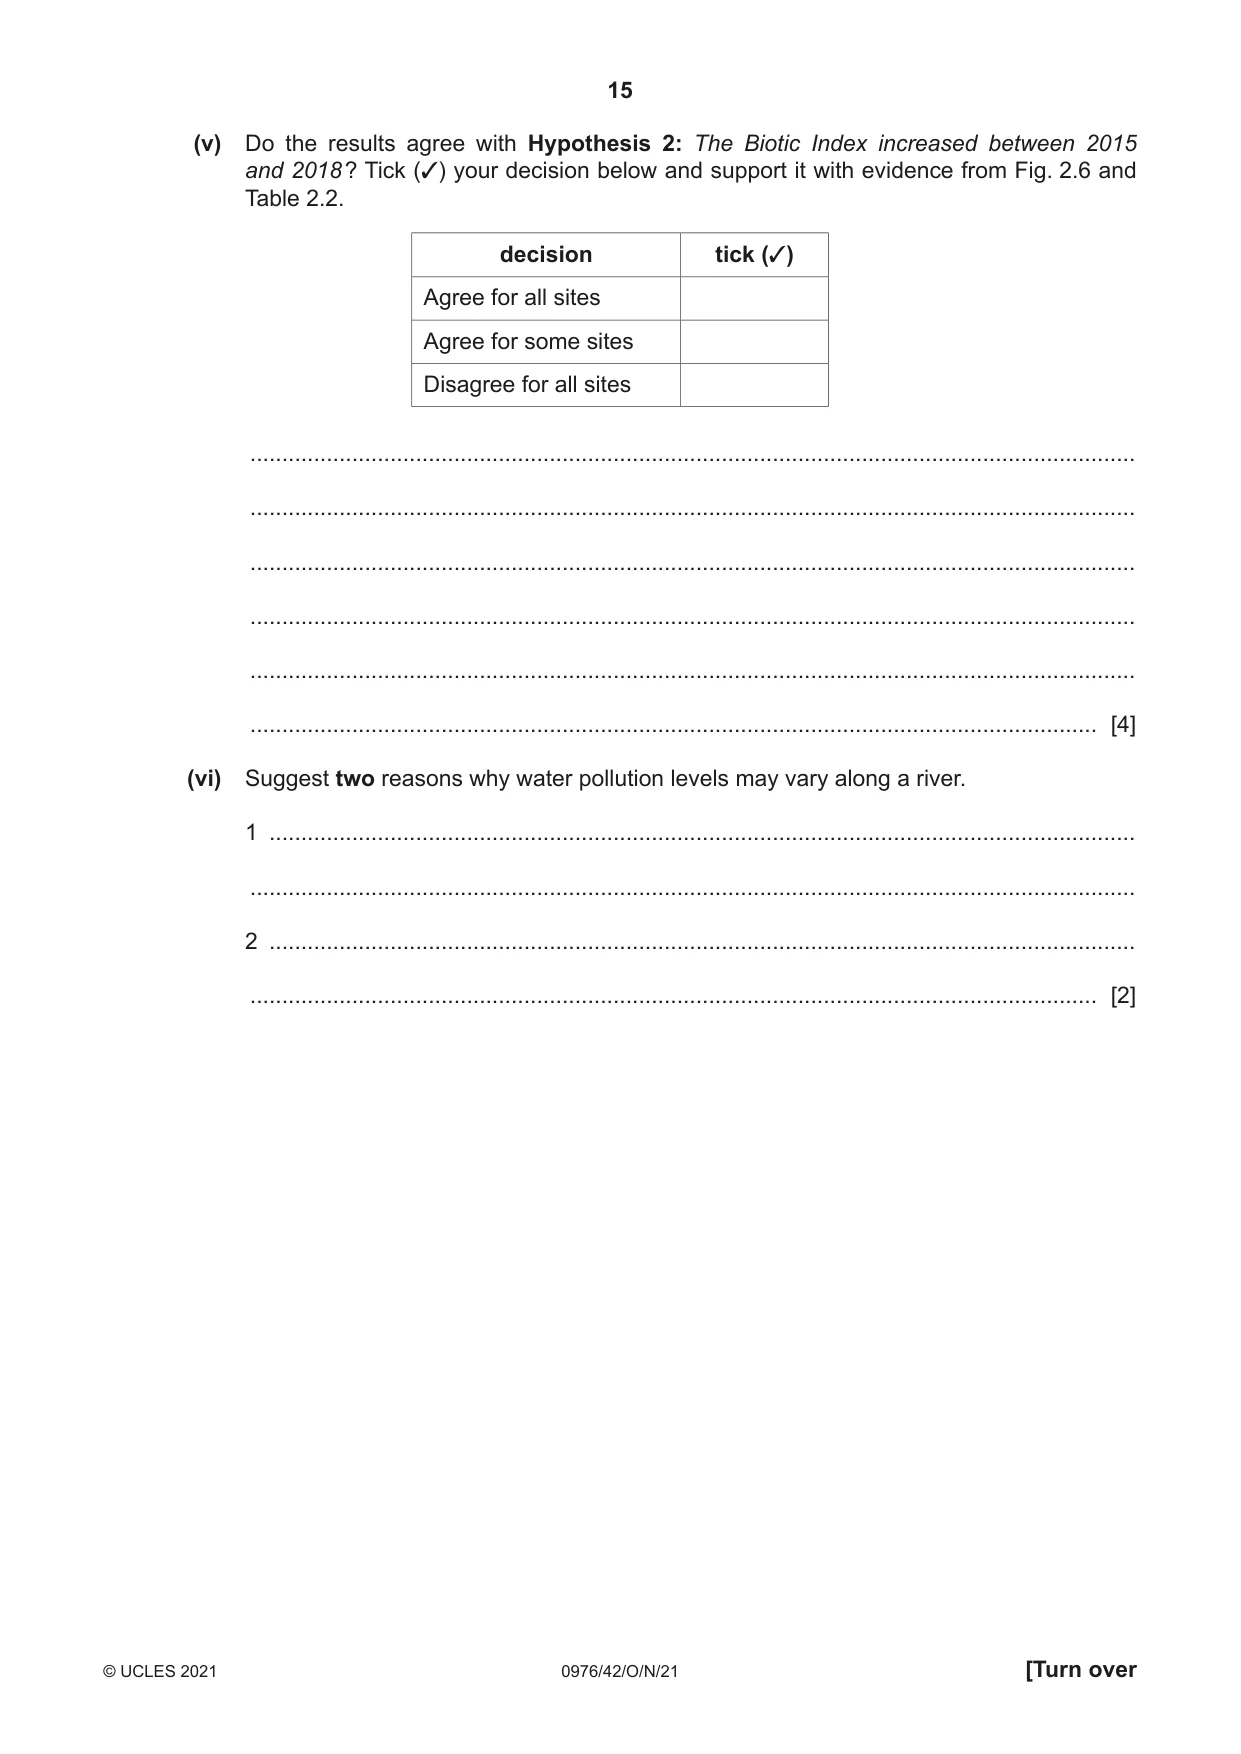
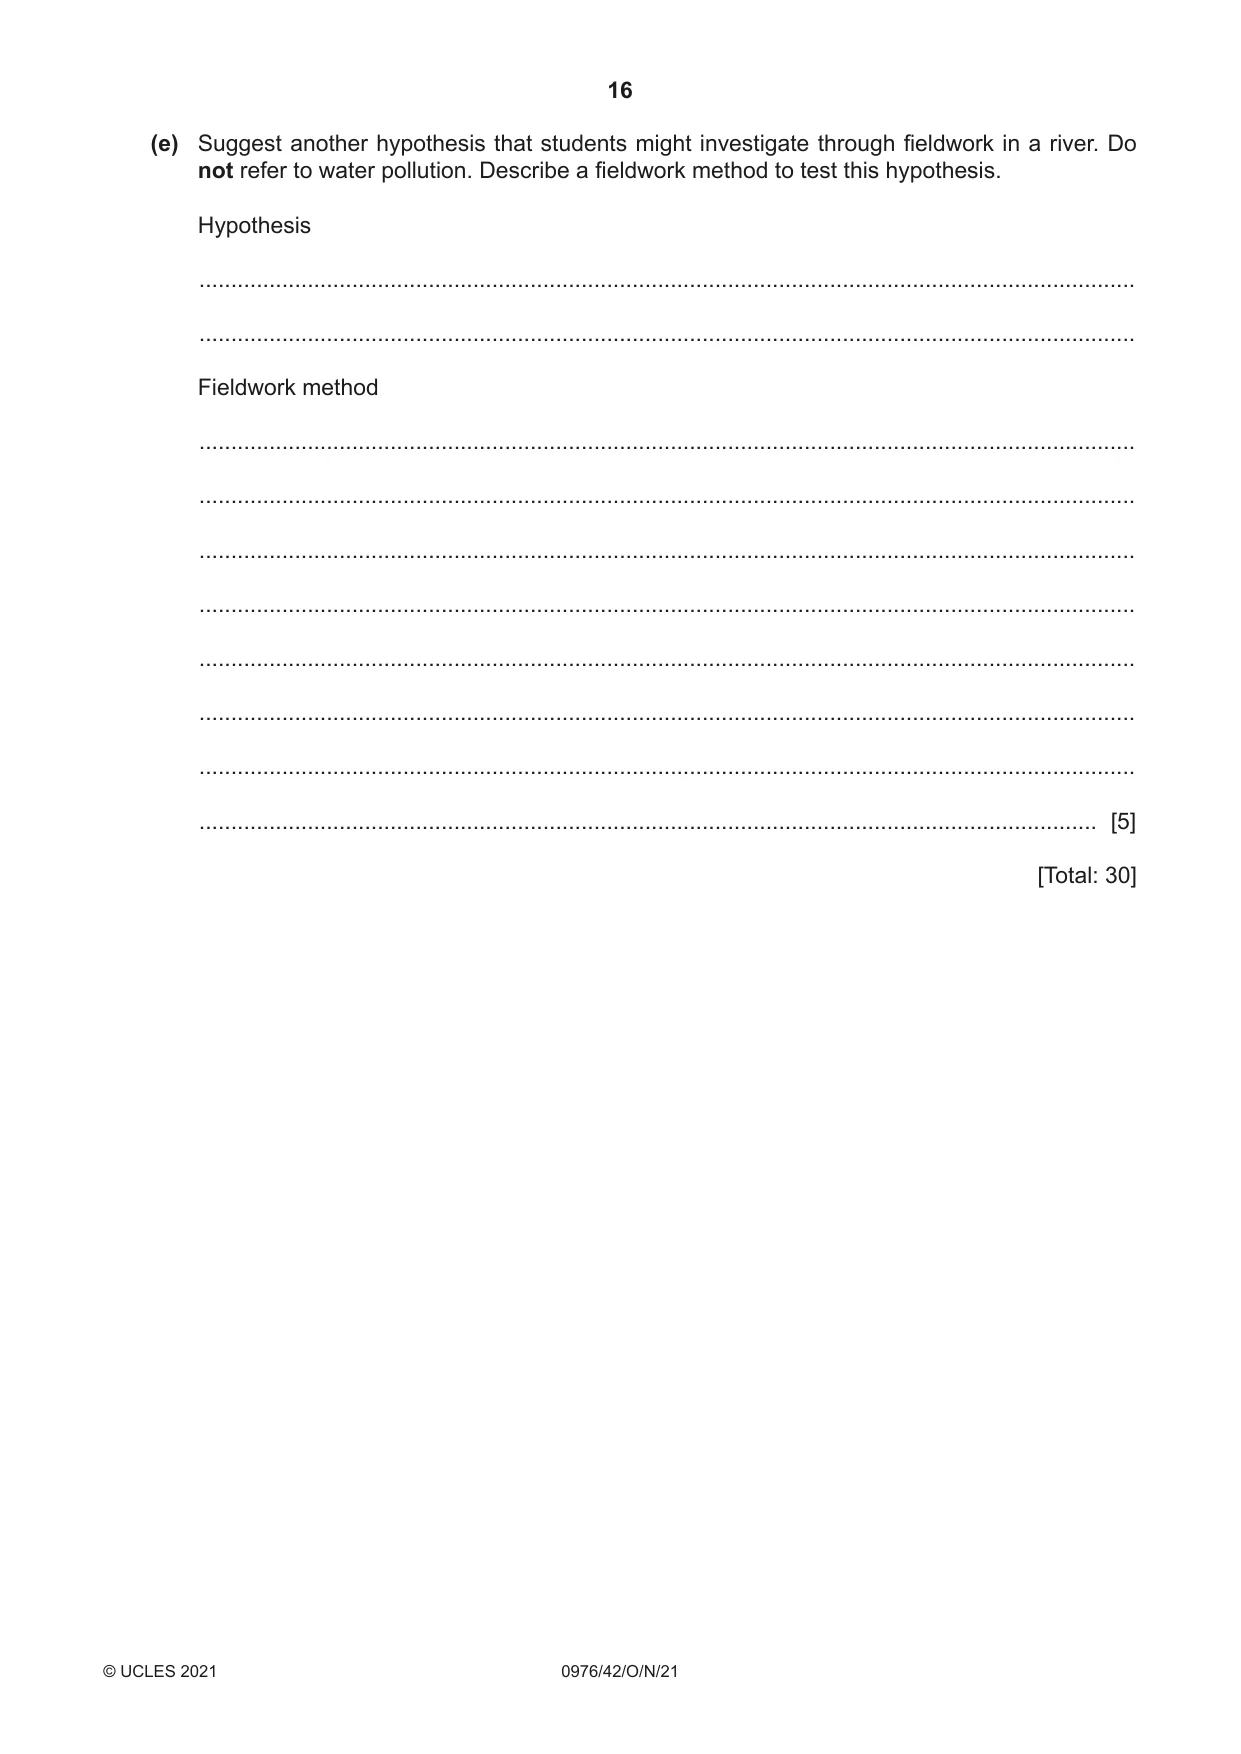
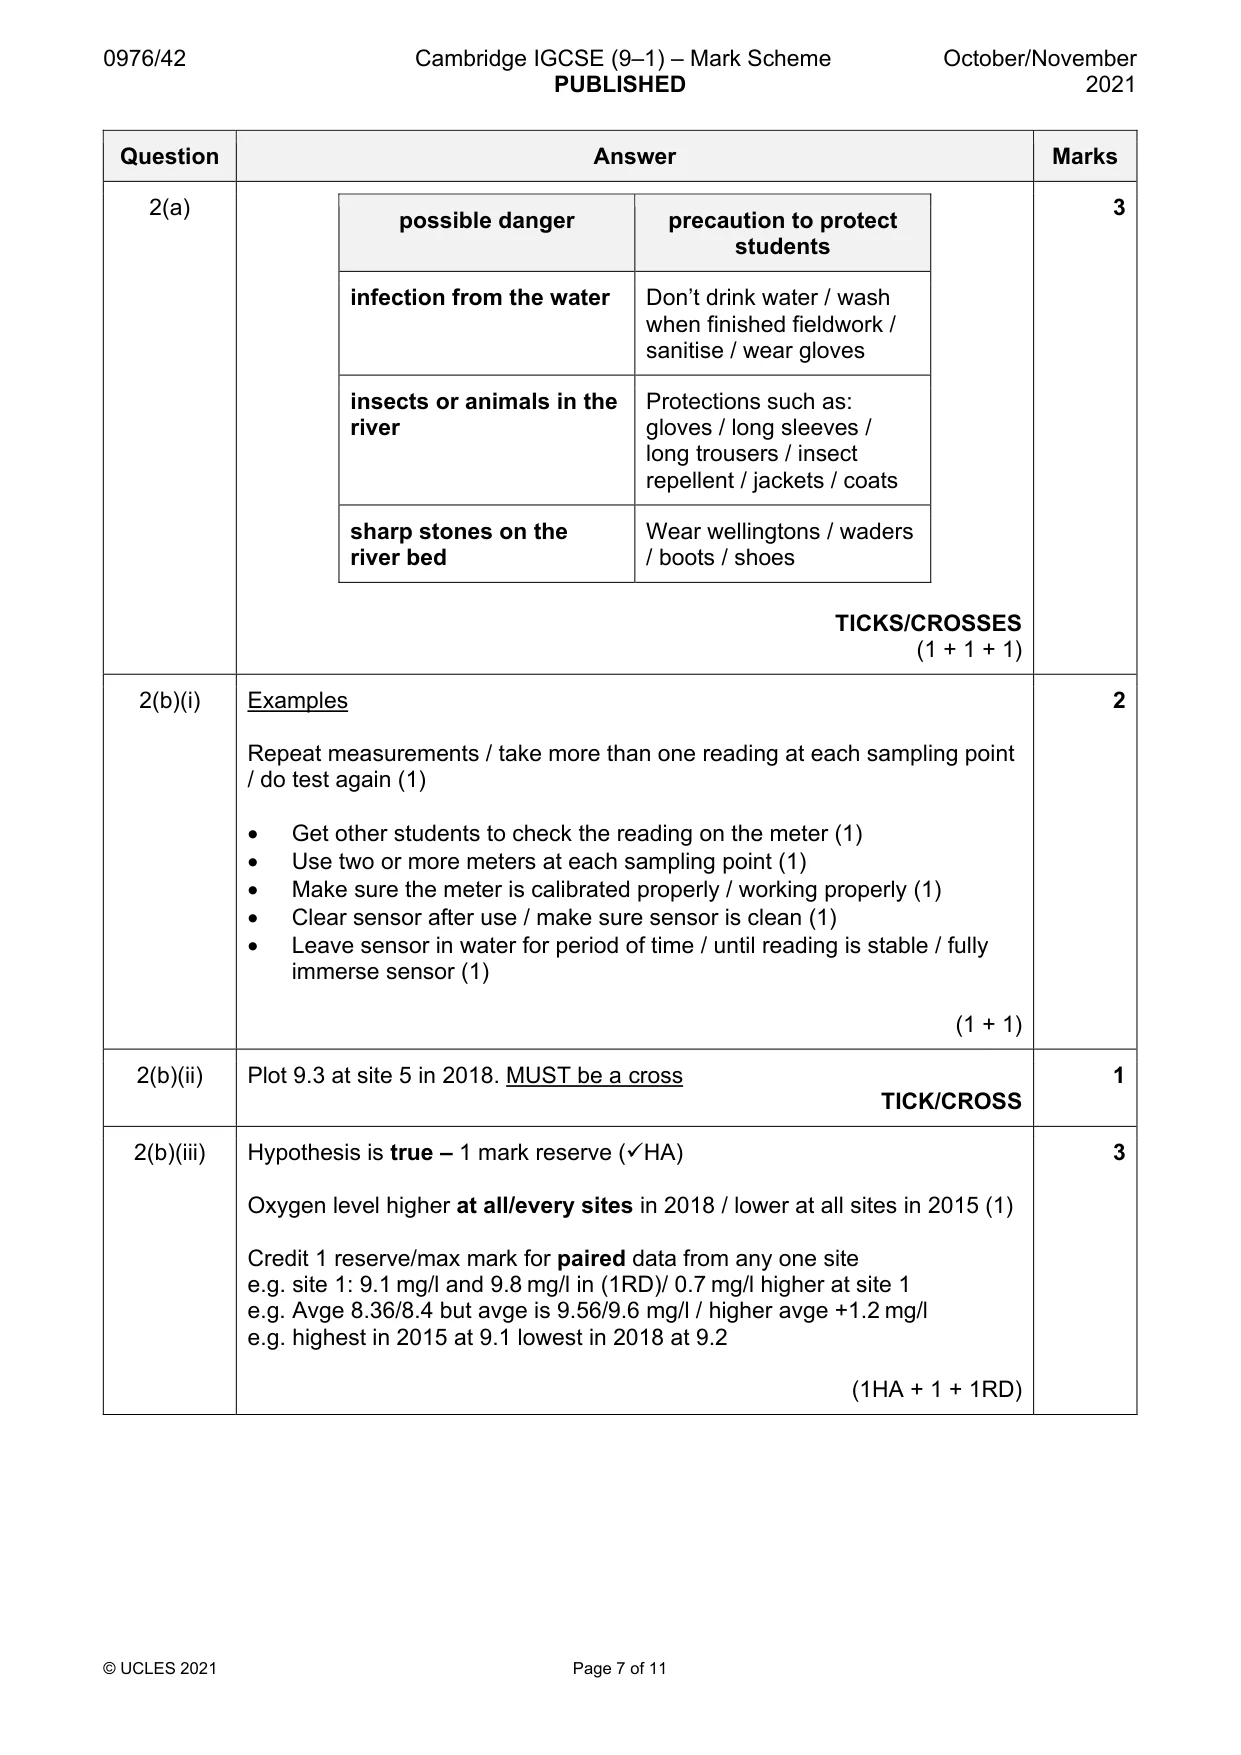
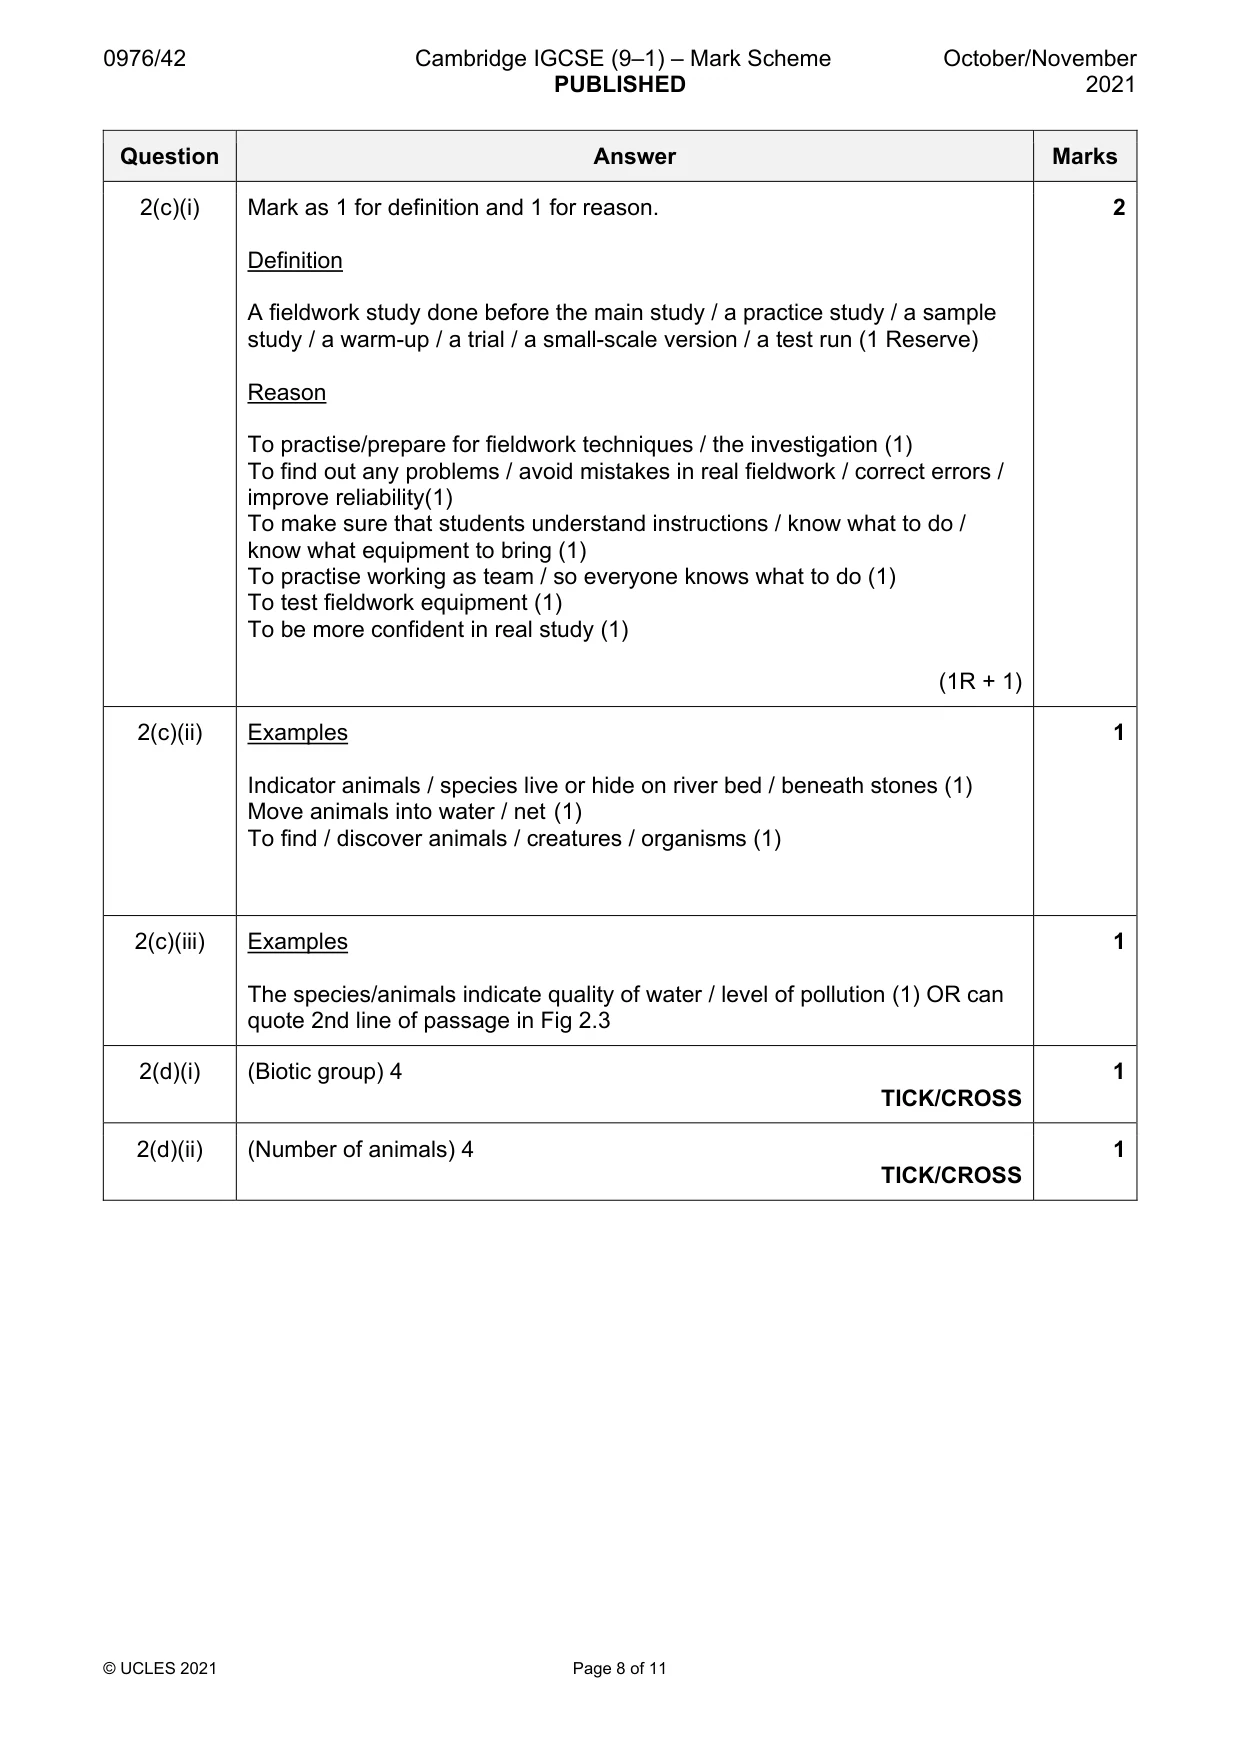
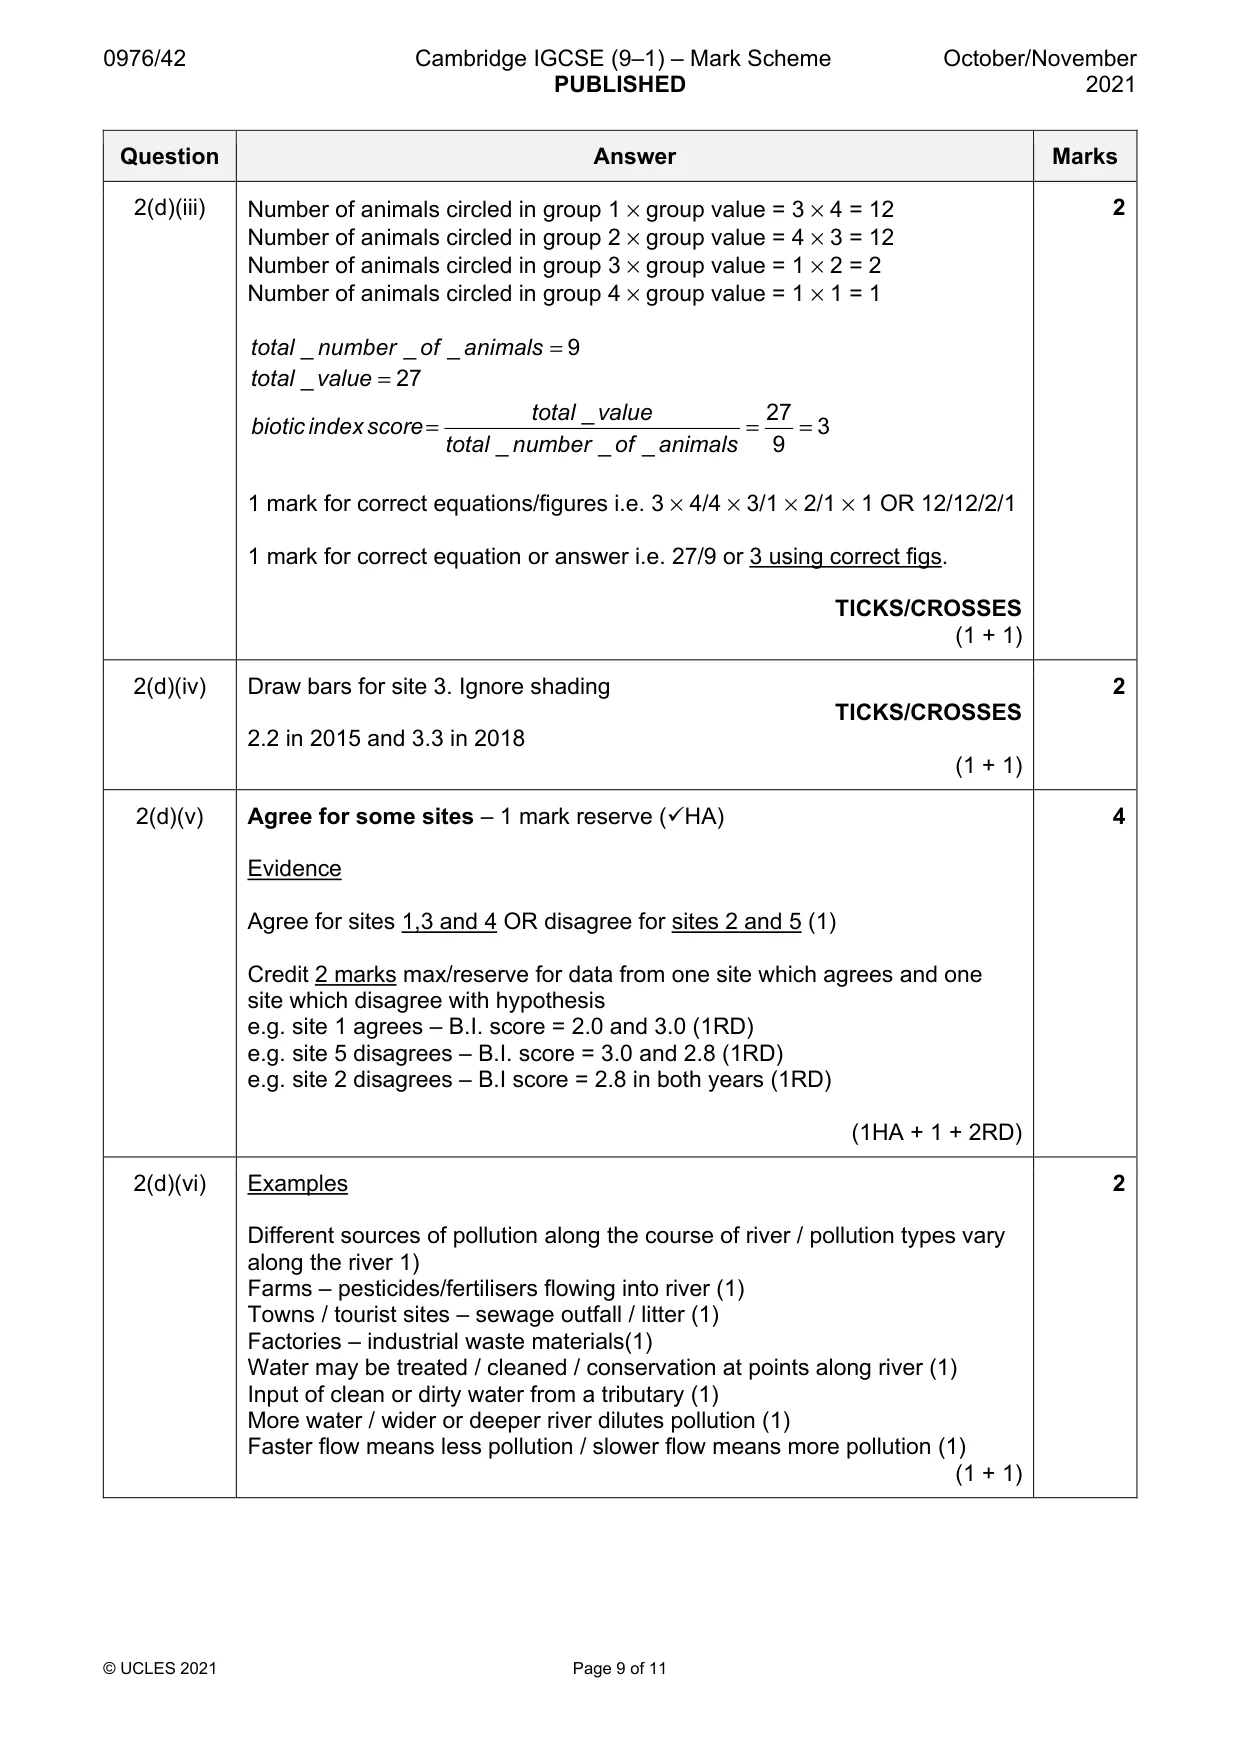
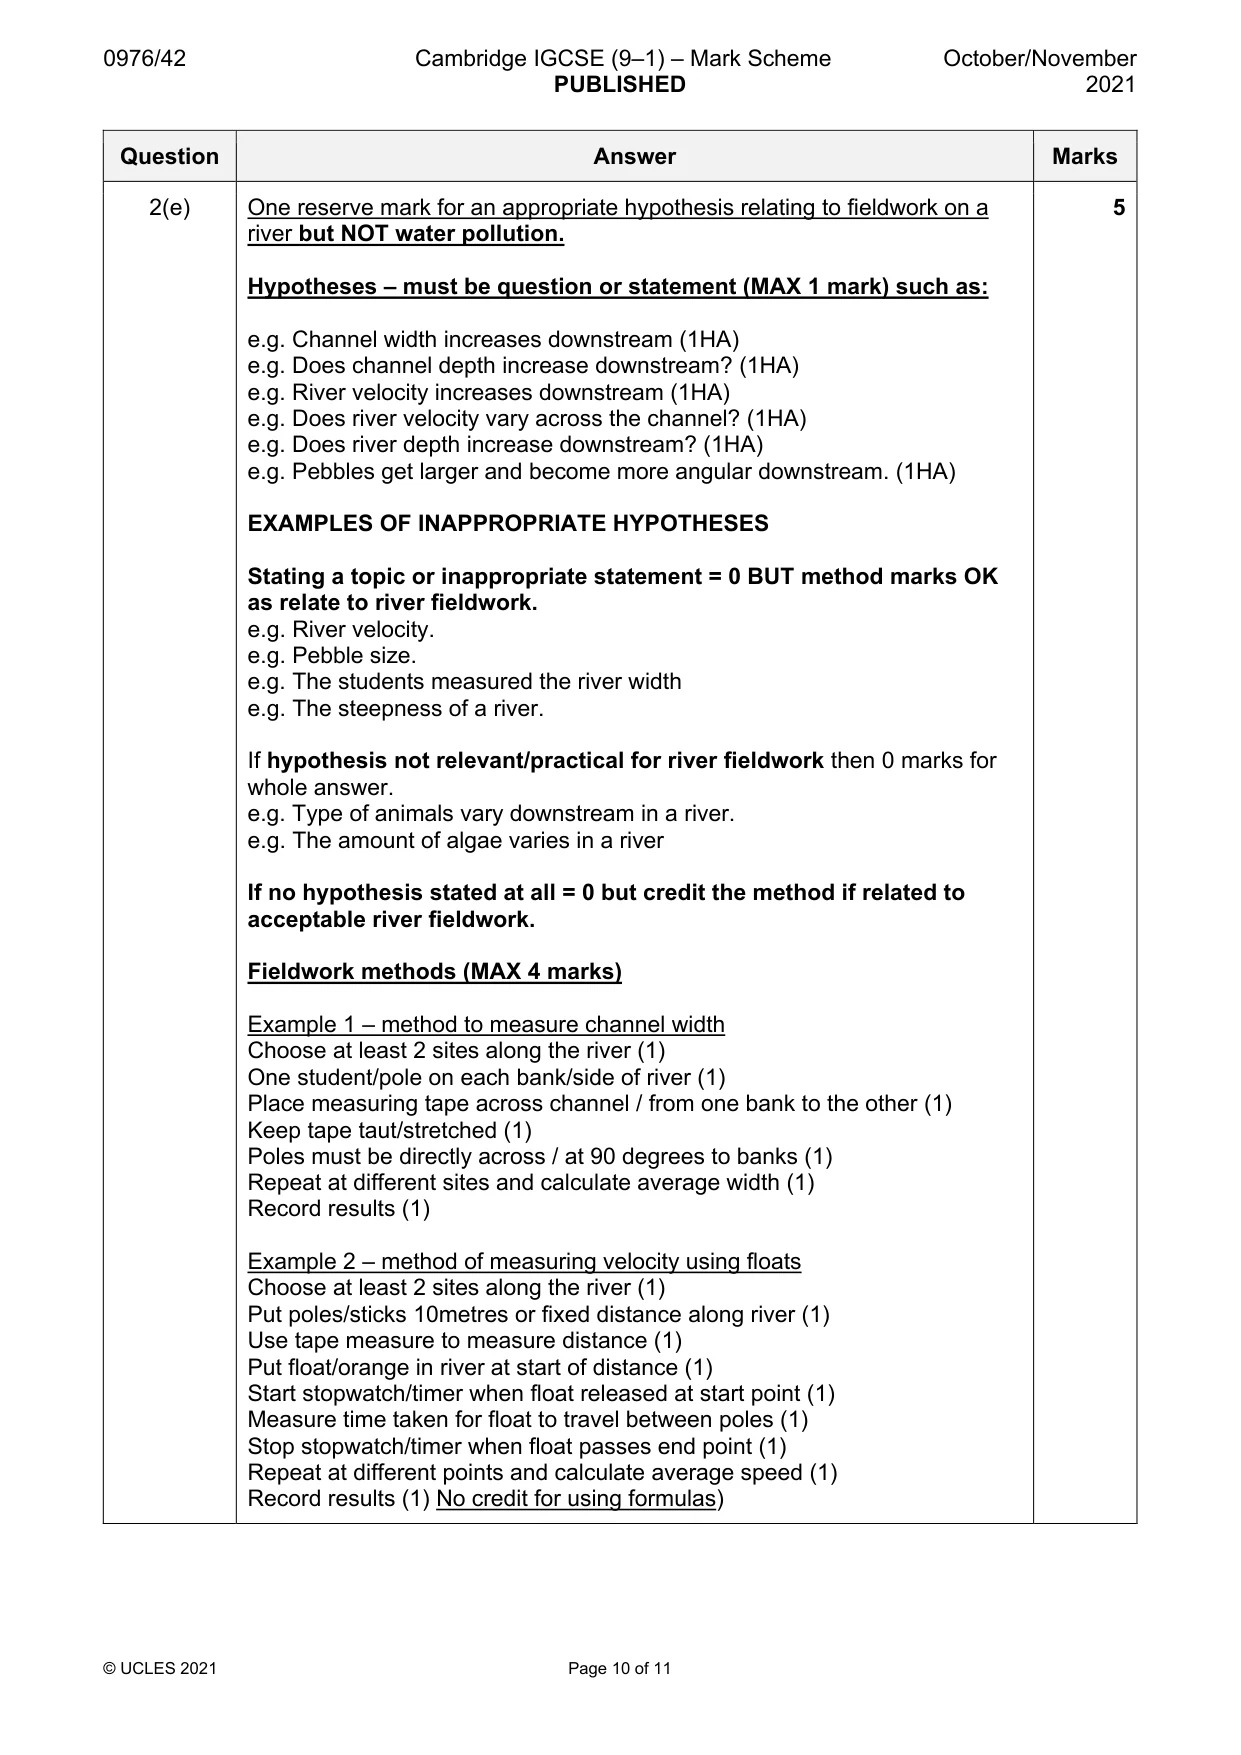
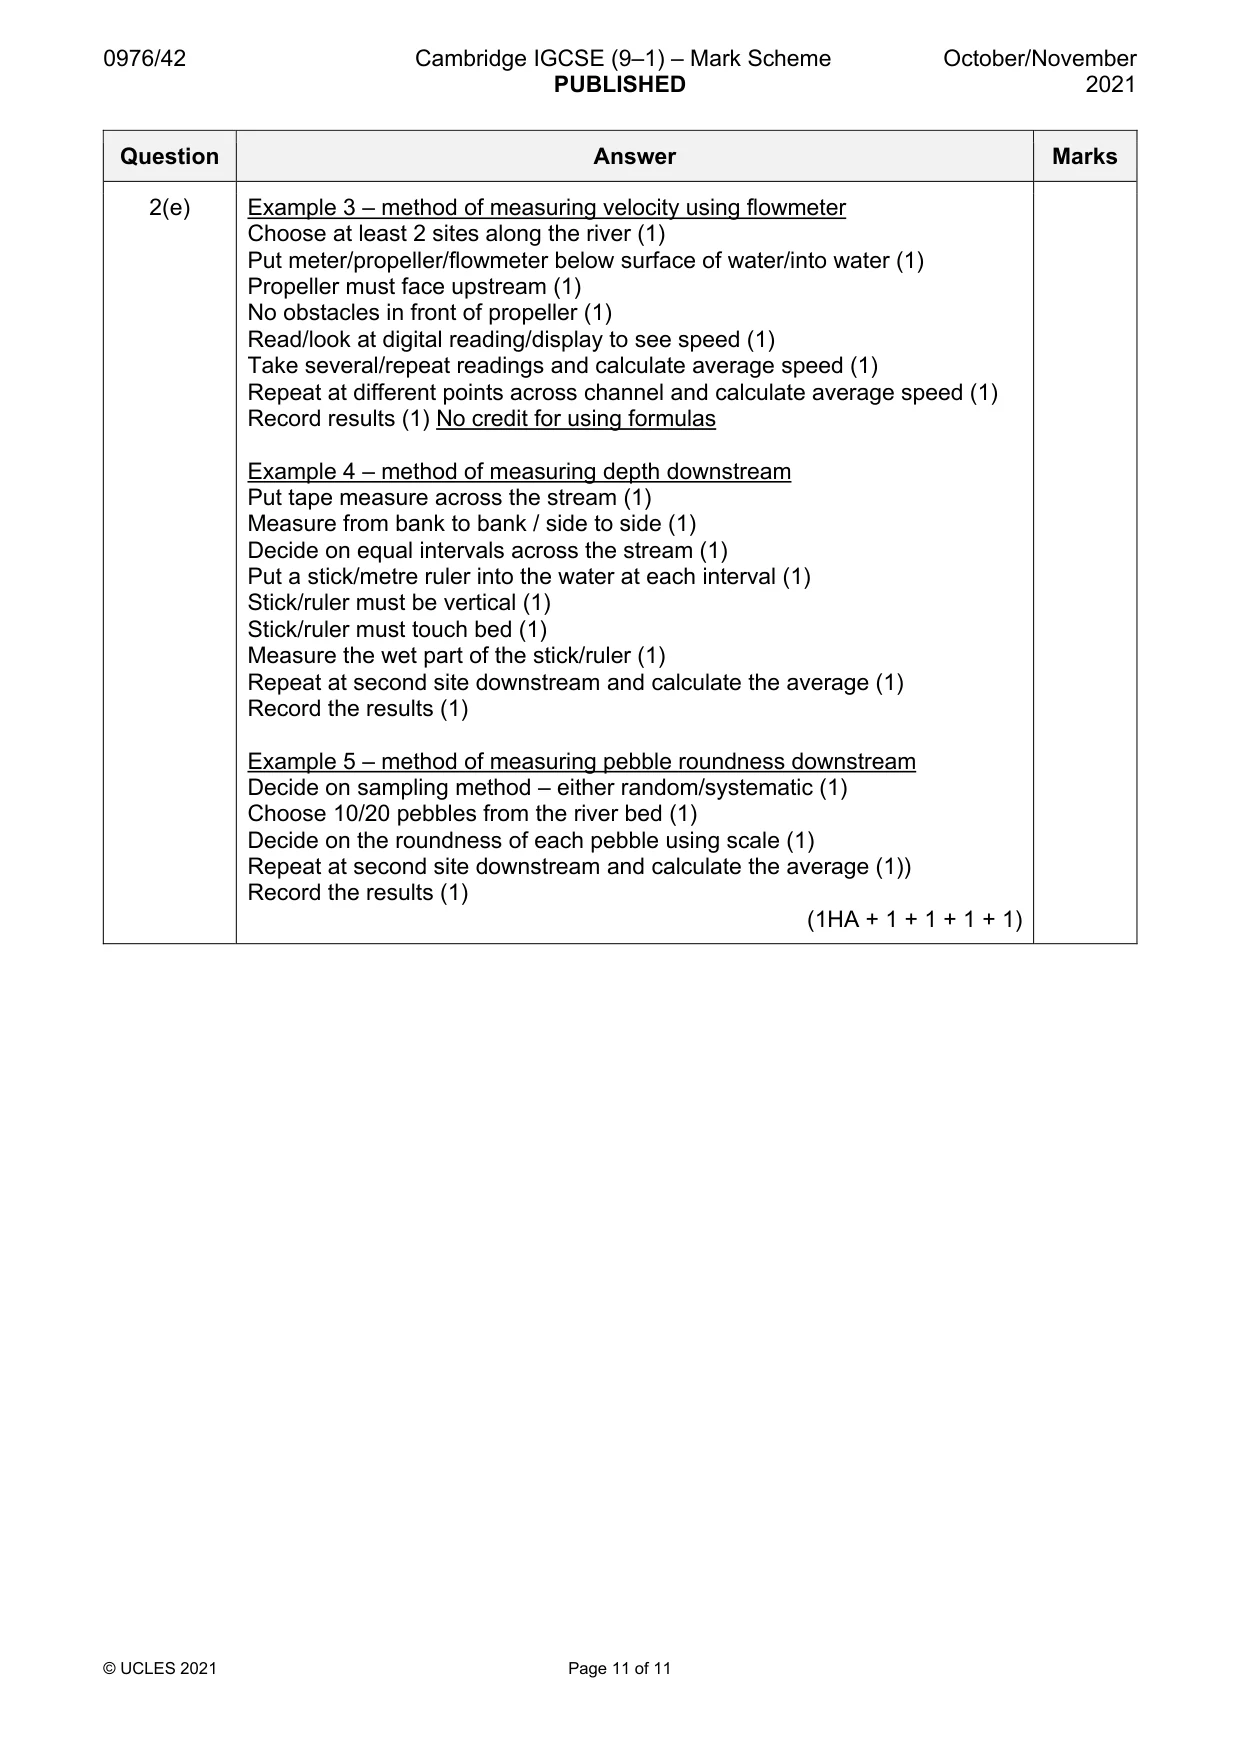
Mark scheme: 2(a) 3 possible danger precaution to protect students infection from the water Don’t drink water / wash when finished fieldwork / sanitise / wear gloves insects or animals in the Protections such as: river gloves / long sleeves / long trousers / insect repellent / jackets / coats sharp stones on the Wear wellingtons / waders river bed / boots / shoes TICKS/CROSSES (1 + 1 + 1) 2(b)(i) Examples 2 Repeat measurements / take more than one reading at each sampling point / do test again (1) • Get other students to check the reading on the meter (1) • Use two or more meters at each sampling point (1) • Make sure the meter is calibrated properly / working properly (1) • Clear sensor after use / make sure sensor is clean (1) • Leave sensor in water for period of time / until reading is stable / fully immerse sensor (1) (1 + 1) 2(b)(ii) Plot 9.3 at site 5 in 2018. MUST be a cross 1 TICK/CROSS 2(b)(iii) Hypothesis is true – 1 mark reserve (HA) 3 Oxygen level higher at all/every sites in 2018 / lower at all sites in 2015 (1) Credit 1 reserve/max mark for paired data from any one site e.g. site 1: 9.1 mg/l and 9.8 mg/l in (1RD)/ 0.7 mg/l higher at site 1 e.g. Avge 8.36/8.4 but avge is 9.56/9.6 mg/l / higher avge +1.2 mg/l e.g. highest in 2015 at 9.1 lowest in 2018 at 9.2 (1HA + 1 + 1RD) 2(c)(i) Mark as 1 for definition and 1 for reason. 2 Definition A fieldwork study done before the main study / a practice study / a sample study / a warm-up / a trial / a small-scale version / a test run (1 Reserve) Reason To practise/prepare for fieldwork techniques / the investigation (1) To find out any problems / avoid mistakes in real fieldwork / correct errors / improve reliability(1) To make sure that students understand instructions / know what to do / know what equipment to bring (1) To practise working as team / so everyone knows what to do (1) To test fieldwork equipment (1) To be more confident in real study (1) (1R + 1) 2(c)(ii) Examples 1 Indicator animals / species live or hide on river bed / beneath stones (1) Move animals into water / net (1) To find / discover animals / creatures / organisms (1) 2(c)(iii) Examples 1 The species/animals indicate quality of water / level of pollution (1) OR can quote 2nd line of passage in Fig 2.3 2(d)(i) (Biotic group) 4 1 TICK/CROSS 2(d)(ii) (Number of animals) 4 1 TICK/CROSS 2(d)(iii) Number of animals circled in group 1 × group value = 3 × 4 = 12 2 Number of animals circled in group 2 × group value = 4 × 3 = 12 Number of animals circled in group 3 × group value = 1 × 2 = 2 Number of animals circled in group 4 × group value = 1 × 1 = 1 total _ number _ of _ animals = 9 total _ value = 27 total _ value 27 biotic indexscore = = = 3 total _ number _ of _ animals 9 1 mark for correct equations/figures i.e. 3 × 4/4 × 3/1 × 2/1 × 1 OR 12/12/2/1 1 mark for correct equation or answer i.e. 27/9 or 3 using correct figs. TICKS/CROSSES (1 + 1) 2(d)(iv) Draw bars for site 3. Ignore shading 2 TICKS/CROSSES 2.2 in 2015 and 3.3 in 2018 (1 + 1) 2(d)(v) Agree for some sites – 1 mark reserve (HA) 4 Evidence Agree for sites 1,3 and 4 OR disagree for sites 2 and 5 (1) Credit 2 marks max/reserve for data from one site which agrees and one site which disagree with hypothesis e.g. site 1 agrees – B.I. score = 2.0 and 3.0 (1RD) e.g. site 5 disagrees – B.I. score = 3.0 and 2.8 (1RD) e.g. site 2 disagrees – B.I score = 2.8 in both years (1RD) (1HA + 1 + 2RD) 2(d)(vi) Examples 2 Different sources of pollution along the course of river / pollution types vary along the river 1) Farms – pesticides/fertilisers flowing into river (1) Towns / tourist sites – sewage outfall / litter (1) Factories – industrial waste materials(1) Water may be treated / cleaned / conservation at points along river (1) Input of clean or dirty water from a tributary (1) More water / wider or deeper river dilutes pollution (1) Faster flow means less pollution / slower flow means more pollution (1) (1 + 1) 2(e) One reserve mark for an appropriate hypothesis relating to fieldwork on a 5 river but NOT water pollution. Hypotheses – must be question or statement (MAX 1 mark) such as: e.g. Channel width increases downstream (1HA) e.g. Does channel depth increase downstream? (1HA) e.g. River velocity increases downstream (1HA) e.g. Does river velocity vary across the channel? (1HA) e.g. Does river depth increase downstream? (1HA) e.g. Pebbles get larger and become more angular downstream. (1HA) EXAMPLES OF INAPPROPRIATE HYPOTHESES Stating a topic or inappropriate statement = 0 BUT method marks OK as relate to river fieldwork. e.g. River velocity. e.g. Pebble size. e.g. The students measured the river width e.g. The steepness of a river. If hypothesis not relevant/practical for river fieldwork then 0 marks for whole answer. e.g. Type of animals vary downstream in a river. e.g. The amount of algae varies in a river If no hypothesis stated at all = 0 but credit the method if related to acceptable river fieldwork. Fieldwork methods (MAX 4 marks) Example 1 – method to measure channel width Choose at least 2 sites along the river (1) One student/pole on each bank/side of river (1) Place measuring tape across channel / from one bank to the other (1) Keep tape taut/stretched (1) Poles must be directly across / at 90 degrees to banks (1) Repeat at different sites and calculate average width (1) Record results (1) Example 2 – method of measuring velocity using floats Choose at least 2 sites along the river (1) Put poles/sticks 10metres or fixed distance along river (1) Use tape measure to measure distance (1) Put float/orange in river at start of distance (1) Start stopwatch/timer when float released at start point (1) Measure time taken for float to travel between poles (1) Stop stopwatch/timer when float passes end point (1) Repeat at different points and calculate average speed (1) Record results (1) No credit for using formulas) 2(e) Example 3 – method of measuring velocity using flowmeter Choose at least 2 sites along the river (1) Put meter/propeller/flowmeter below surface of water/into water (1) Propeller must face upstream (1) No obstacles in front of propeller (1) Read/look at digital reading/display to see speed (1) Take several/repeat readings and calculate average speed (1) Repeat at different points across channel and calculate average speed (1) Record results (1) No credit for using formulas Example 4 – method of measuring depth downstream Put tape measure across the stream (1) Measure from bank to bank / side to side (1) Decide on equal intervals across the stream (1) Put a stick/metre ruler into the water at each interval (1) Stick/ruler must be vertical (1) Stick/ruler must touch bed (1) Measure the wet part of the stick/ruler (1) Repeat at second site downstream and calculate the average (1) Record the results (1) Example 5 – method of measuring pebble roundness downstream Decide on sampling method – either random/systematic (1) Choose 10/20 pebbles from the river bed (1) Decide on the roundness of each pebble using scale (1) Repeat at second site downstream and calculate the average (1)) Record the results (1) (1HA + 1 + 1 + 1 + 1)
What was in this paper
The subtopics covered by these 2 questions, and how many questions each got. Open one in a new tab to see every Cambridge question on it.
What you needed in this session
Cambridge’s own grade thresholds for 2021 Oct/Nov, Paper 4 · Variant 2. A higher threshold means an easier paper — the bar moves with how the cohort did.