Cambridge IGCSE Geography (9-1) 0976 — 2021 May/June Paper 4 · Variant 2
0976/42/M/J/21 · 2 questions · 60 marks · ≈68 min
The question paper and its mark scheme, free to read here and free to download. This is Cambridge’s own paper, exactly as it was sat.
Question paper16 pages




Mark scheme10 pages
Answers below. Sit the paper first if you are practising.
Questions as text
Q1 · A student who was studying weather did fieldwork to measure and record rainfall at her…
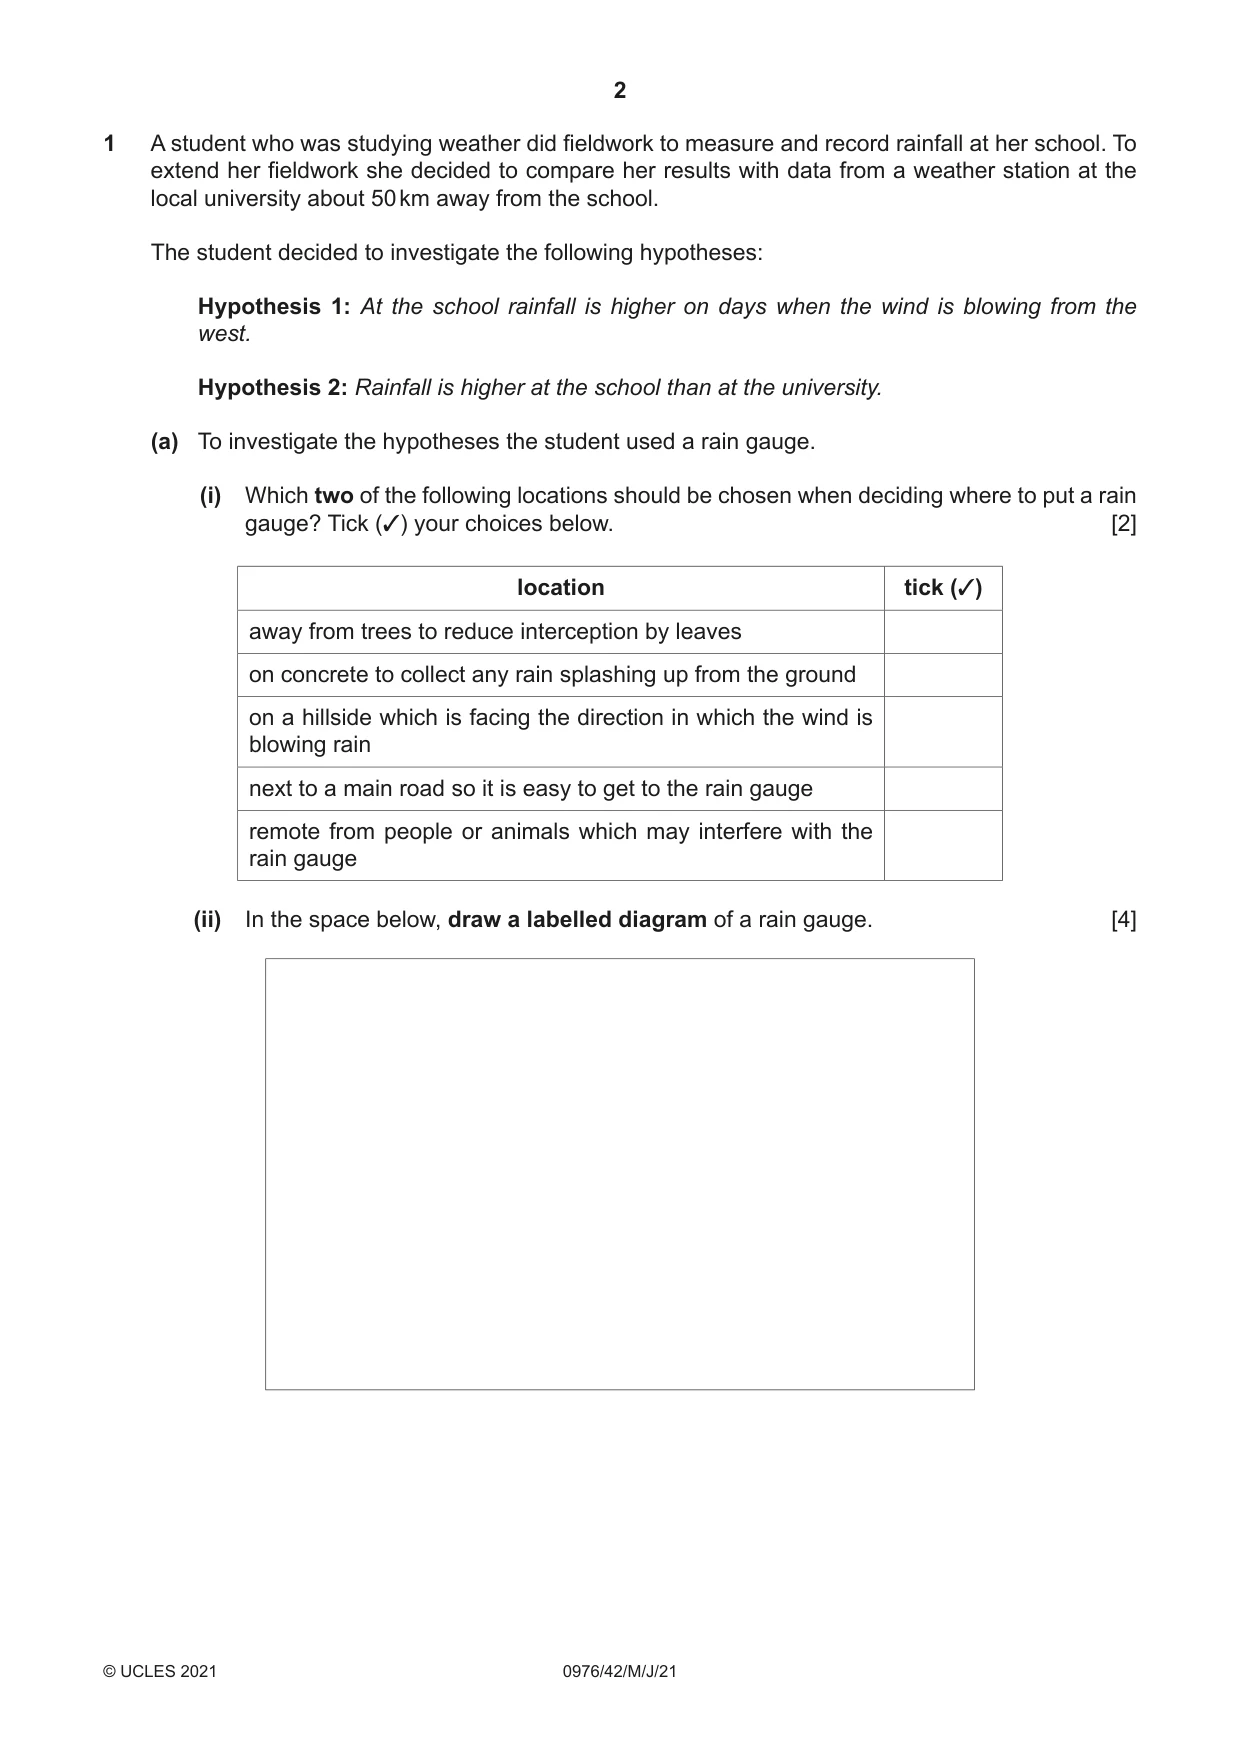
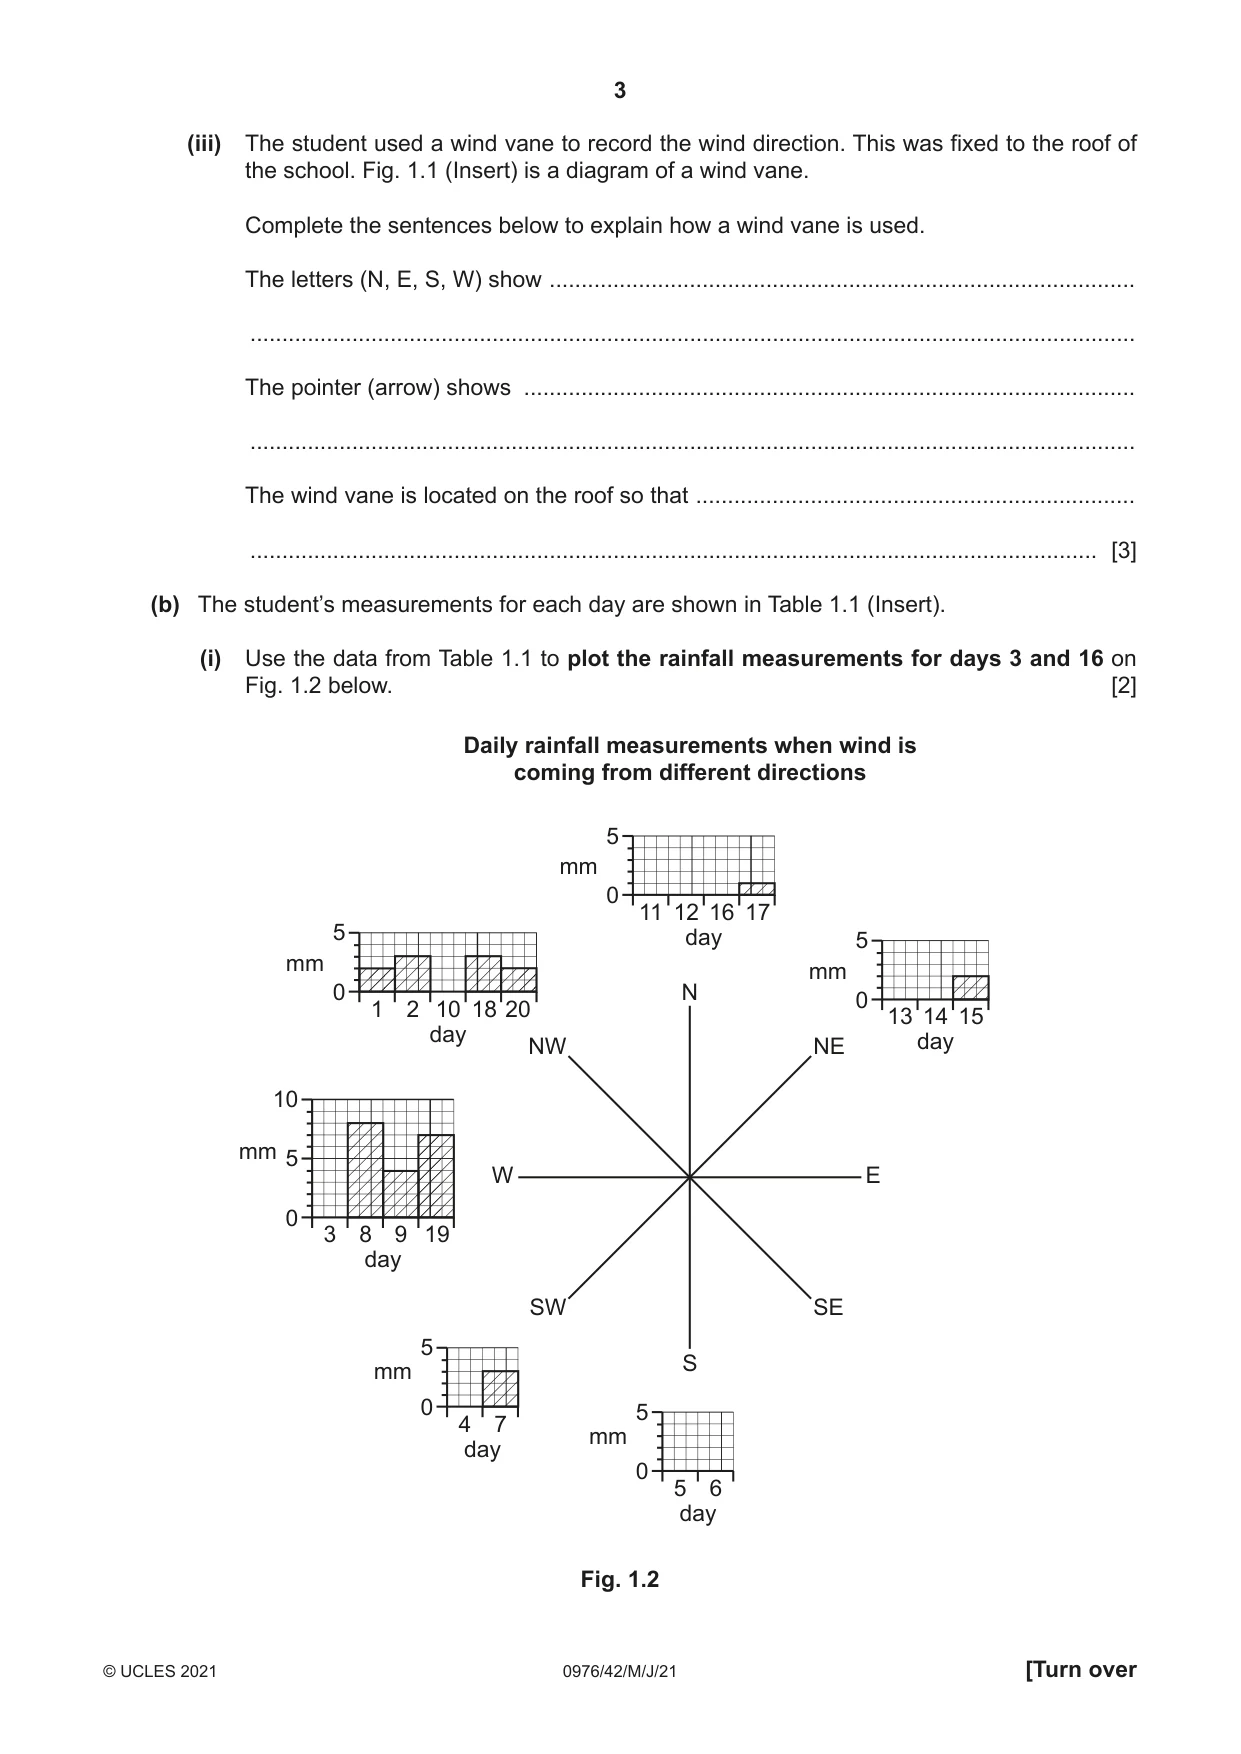
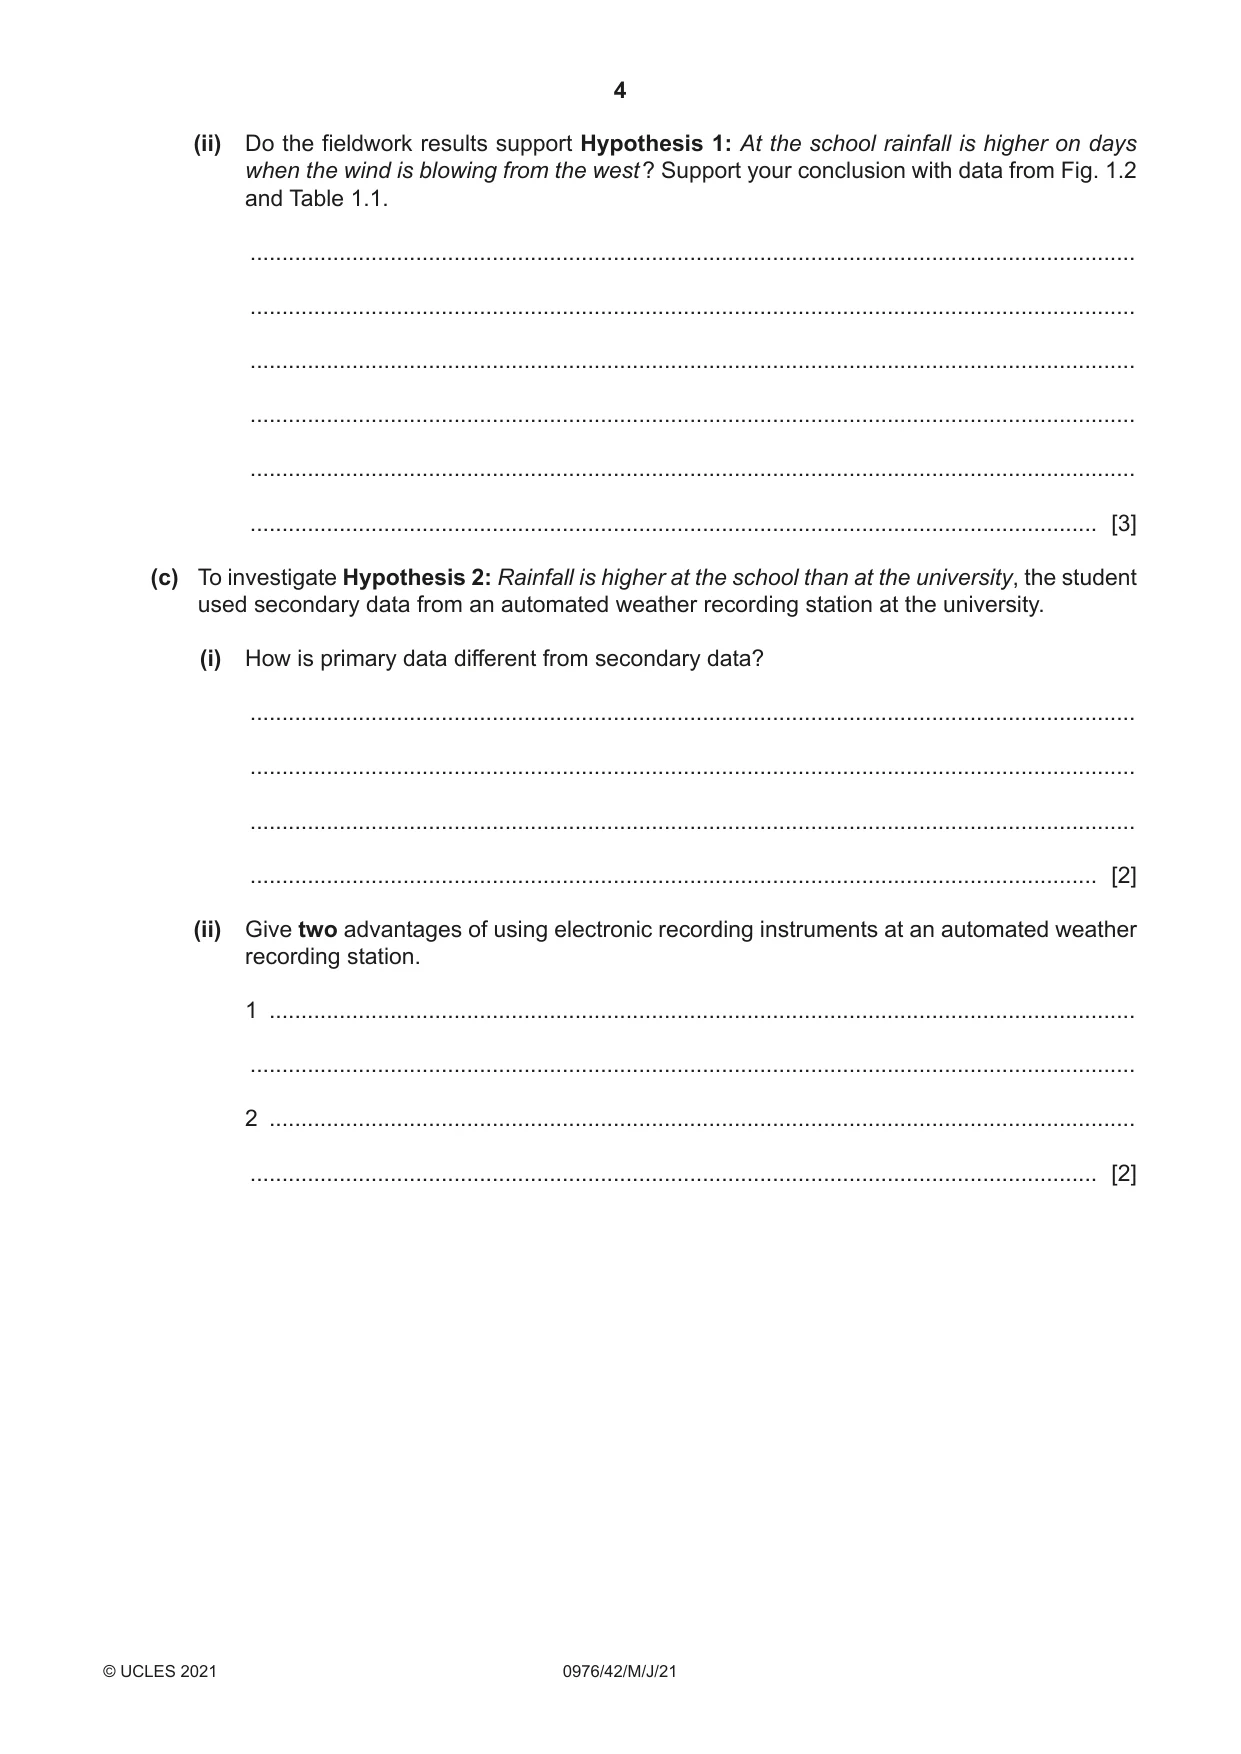
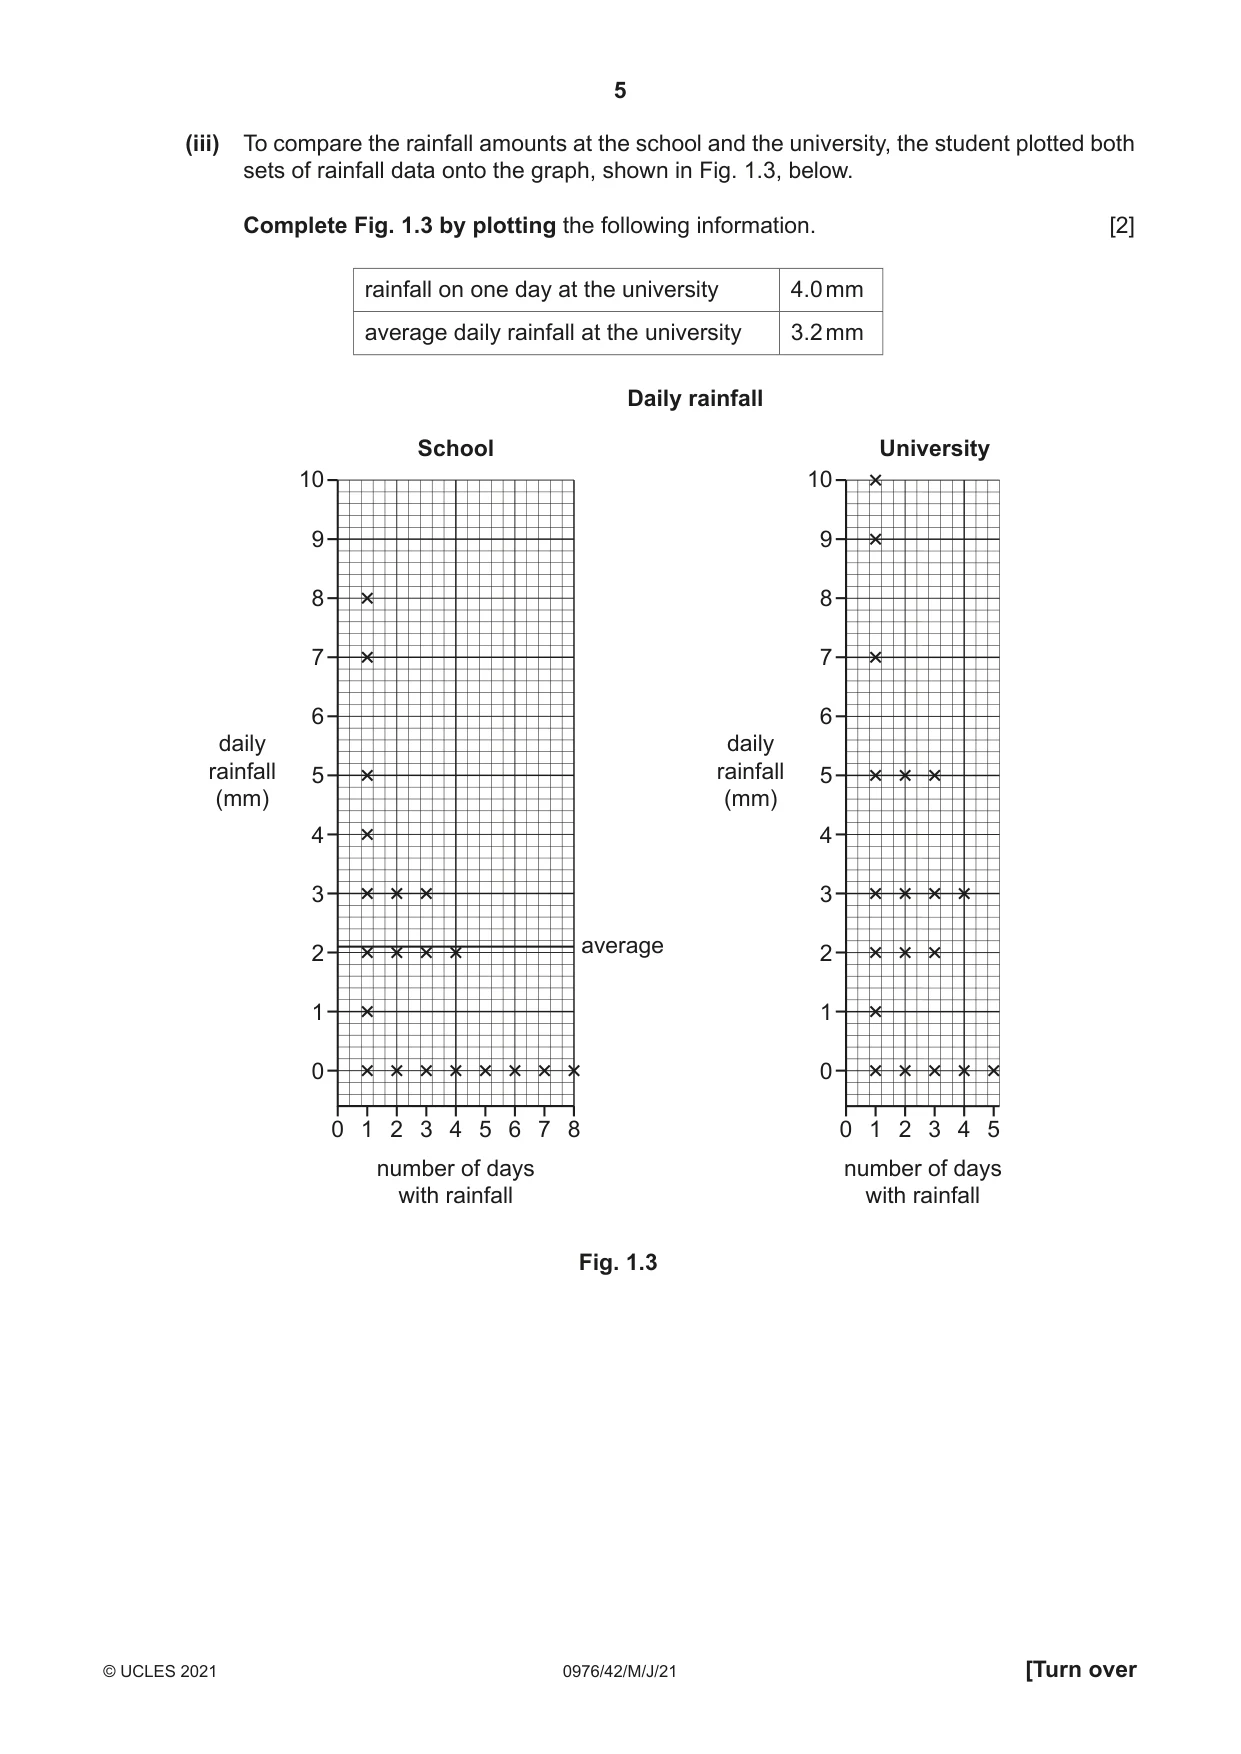
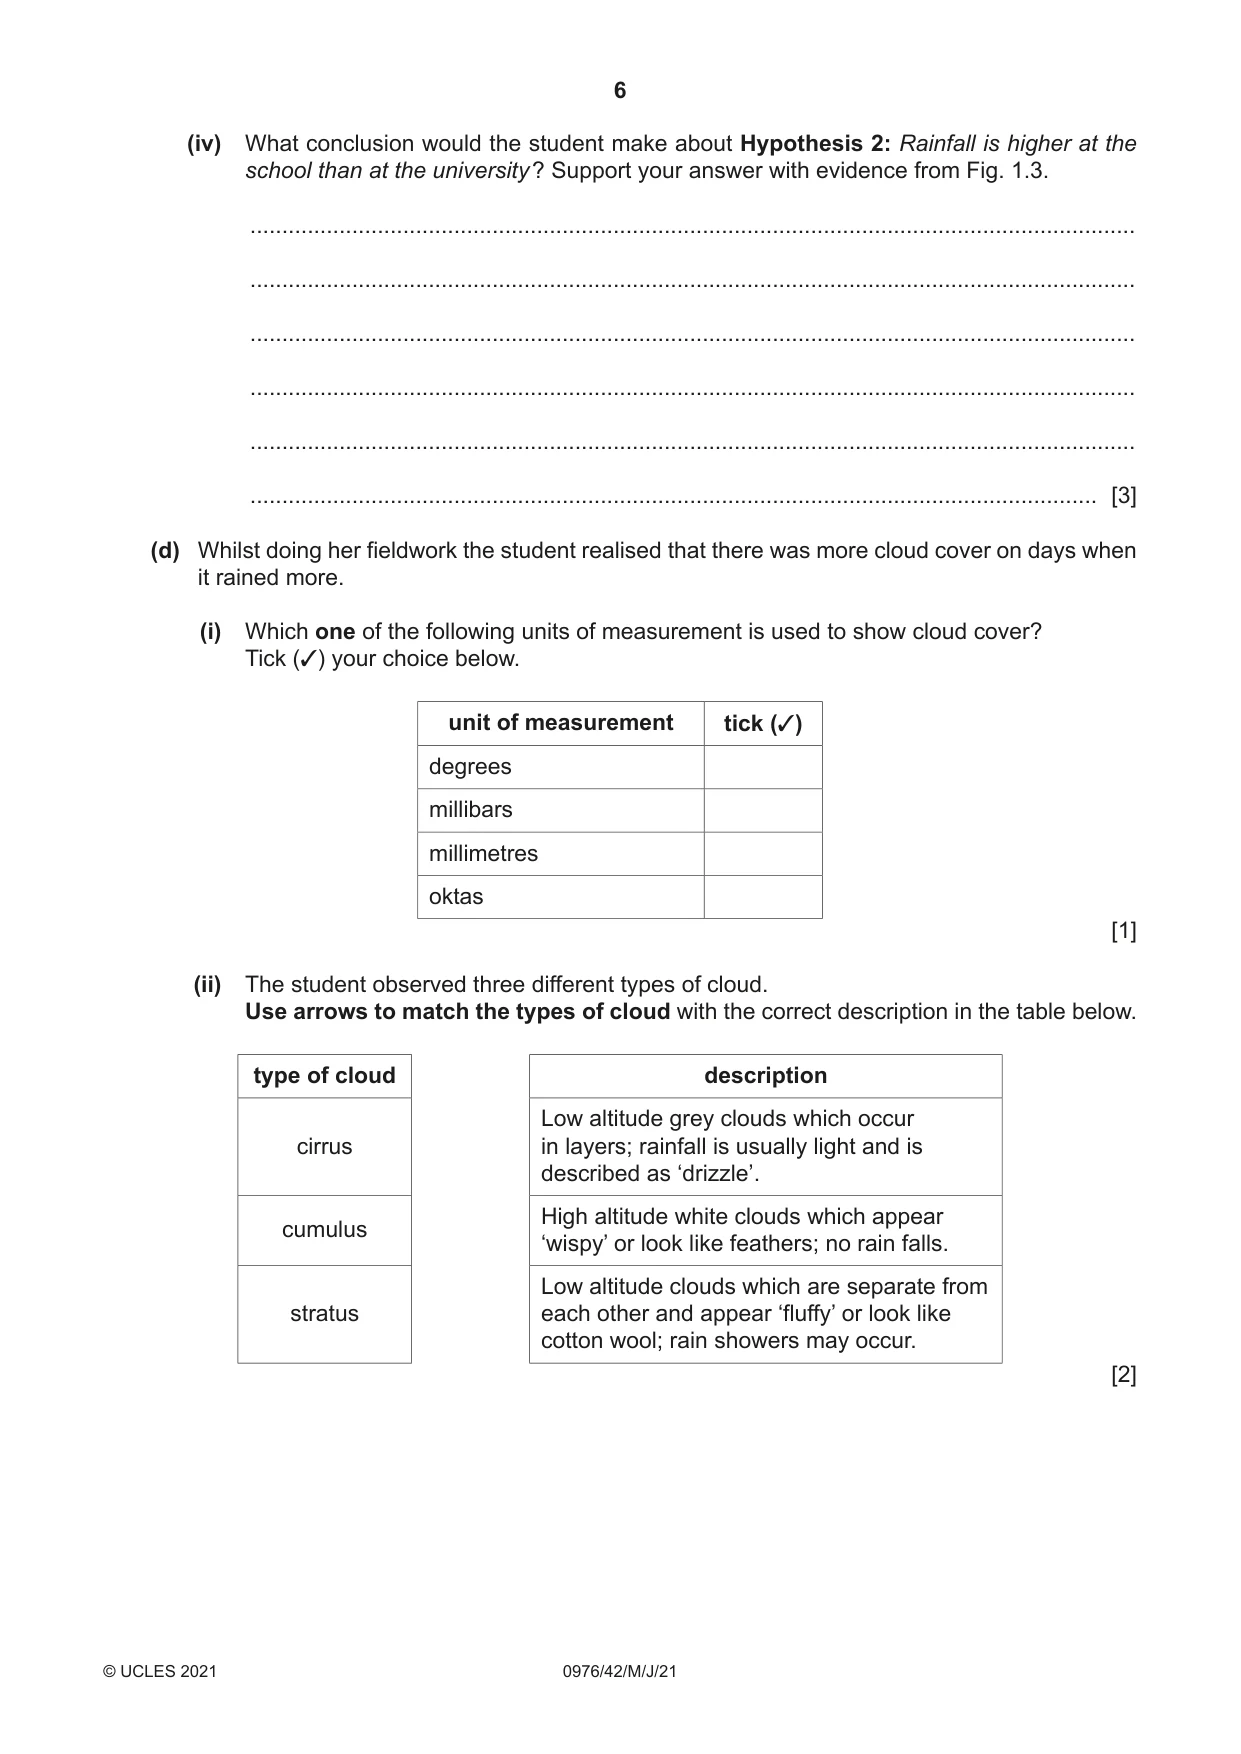
1 A student who was studying weather did fieldwork to measure and record rainfall at her school. To extend her fieldwork she decided to compare her results with data from a weather station at the local university about 50 km away from the school. The student decided to investigate the following hypotheses: Hypothesis 1: At the school rainfall is higher on days when the wind is blowing from the west. Hypothesis 2: Rainfall is higher at the school than at the university. (a) To investigate the hypotheses the student used a rain gauge. (i) Which two of the following locations should be chosen when deciding where to put a rain gauge? Tick (3) your choices below. [2] location tick (3) away from trees to reduce interception by leaves on concrete to collect any rain splashing up from the ground on a hillside which is facing the direction in which the wind is blowing rain next to a main road so it is easy to get to the rain gauge remote from people or animals which may interfere with the rain gauge (ii) In the space below, draw a labelled diagram of a rain gauge. [4] (iii) The student used a wind vane to record the wind direction. This was fixed to the roof of the school. Fig. 1.1 (Insert) is a diagram of a wind vane. Complete the sentences below to explain how a wind vane is used. The letters (N, E, S, W) show ............................................................................................ ........................................................................................................................................... The pointer (arrow) shows ................................................................................................ ........................................................................................................................................... The wind vane is located on the roof so that ..................................................................... ..................................................................................................................................... [3] (b) The student’s measurements for each day are shown in Table 1.1 (Insert). (i) Use the data from Table 1.1 to plot the rainfall measurements for days 3 and 16 on Fig. 1.2 below. [2] Daily rainfall measurements when wind is coming from different directions 5 mm 0 11 12 16 17 5 day 5 mm mm 0 N 0 1 2 10 18 20 13 14 15 day NW NE day 10 mm 5 W E 0 3 8 9 19 day SW SE 5 S mm 0 5 4 7 mm day 0 5 6 day Fig. 1.2 (ii) Do the fieldwork results support Hypothesis 1: At the school rainfall is higher on days when the wind is blowing from the west ? Support your conclusion with data from Fig. 1.2 and Table 1.1. ........................................................................................................................................... ........................................................................................................................................... ........................................................................................................................................... ........................................................................................................................................... ........................................................................................................................................... ..................................................................................................................................... [3] (c) To investigate Hypothesis 2: Rainfall is higher at the school than at the university, the student used secondary data from an automated weather recording station at the university. (i) How is primary data different from secondary data? ........................................................................................................................................... ........................................................................................................................................... ........................................................................................................................................... ..................................................................................................................................... [2] (ii) Give two advantages of using electronic recording instruments at an automated weather recording station. 1 ........................................................................................................................................ ........................................................................................................................................... 2 ........................................................................................................................................ ..................................................................................................................................... [2] (iii) To compare the rainfall amounts at the school and the university, the student plotted both sets of rainfall data onto the graph, shown in Fig. 1.3, below. Complete Fig. 1.3 by plotting the following information. [2] rainfall on one day at the university 4.0 mm average daily rainfall at the university 3.2 mm Daily rainfall School University 10 10 9 9 8 8 7 7 6 6 daily daily rainfall 5 rainfall 5 (mm) (mm) 4 4 3 3 average 2 2 1 1 0 0 0 1 2 3 4 5 6 7 8 0 1 2 3 4 5 number of days number of days with rainfall with rainfall Fig. 1.3 (iv) What conclusion would the student make about Hypothesis 2: Rainfall is higher at the school than at the university ? Support your answer with evidence from Fig. 1.3. ........................................................................................................................................... ........................................................................................................................................... ........................................................................................................................................... ........................................................................................................................................... ........................................................................................................................................... ..................................................................................................................................... [3] (d) Whilst doing her fieldwork the student realised that there was more cloud cover on days when it rained more. (i) Which one of the following units of measurement is used to show cloud cover? Tick (3) your choice below. unit of measurement tick (3) degrees millibars millimetres oktas [1] (ii) The student observed three different types of cloud. Use arrows to match the types of cloud with the correct description in the table below. type of cloud description Low altitude grey clouds which occur cirrus in layers; rainfall is usually light and is described as ‘drizzle’. High altitude white clouds which appear cumulus ‘wispy’ or look like feathers; no rain falls. Low altitude clouds which are separate from stratus each other and appear ‘fluffy’ or look like cotton wool; rain showers may occur. [2] (e) To extend her fieldwork the student used a sunshine recorder to measure the amount of sunlight on each day. Fig. 1.4 (Insert) shows a sunshine recorder. Describe how a sunshine recorder is used. ................................................................................................................................................... ................................................................................................................................................... ................................................................................................................................................... ................................................................................................................................................... ................................................................................................................................................... ................................................................................................................................................... ................................................................................................................................................... ............................................................................................................................................. [4] [Total: 30]
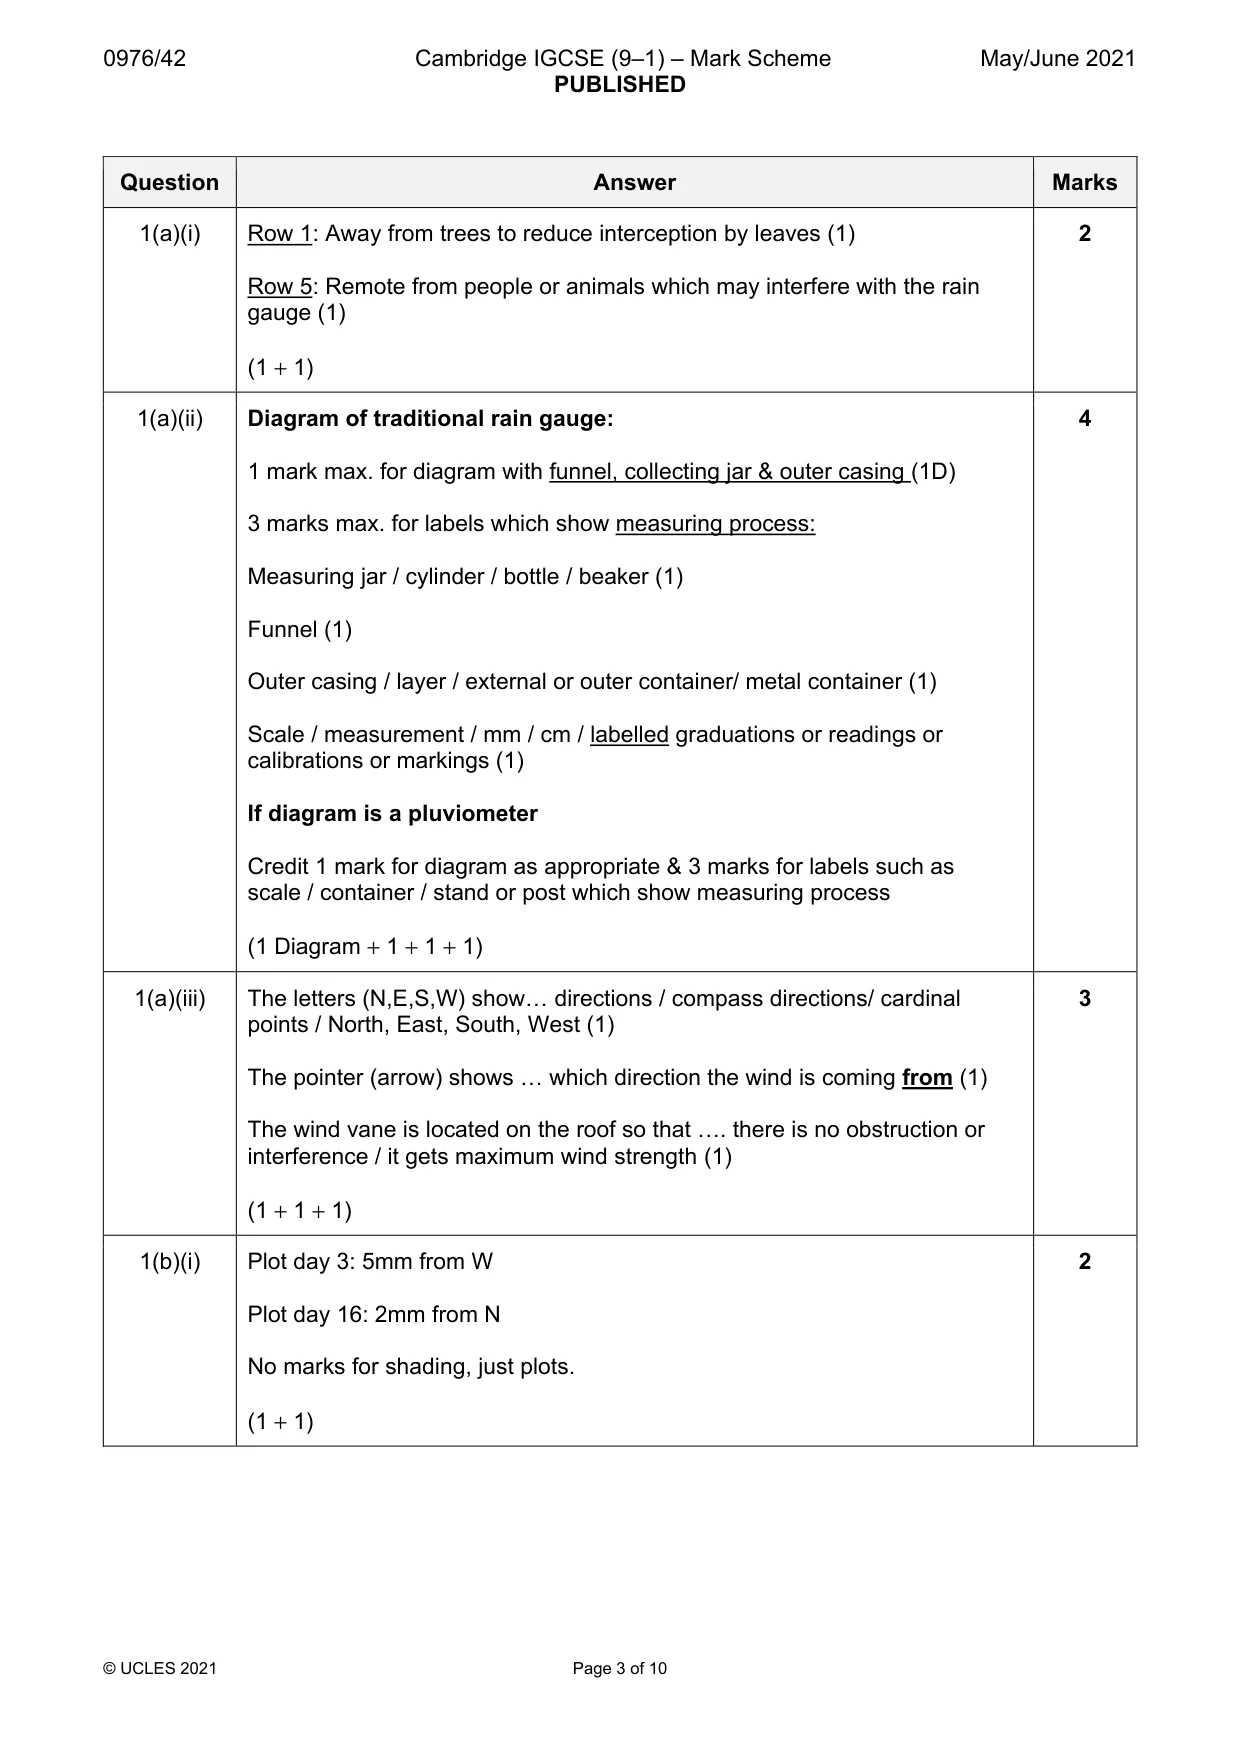
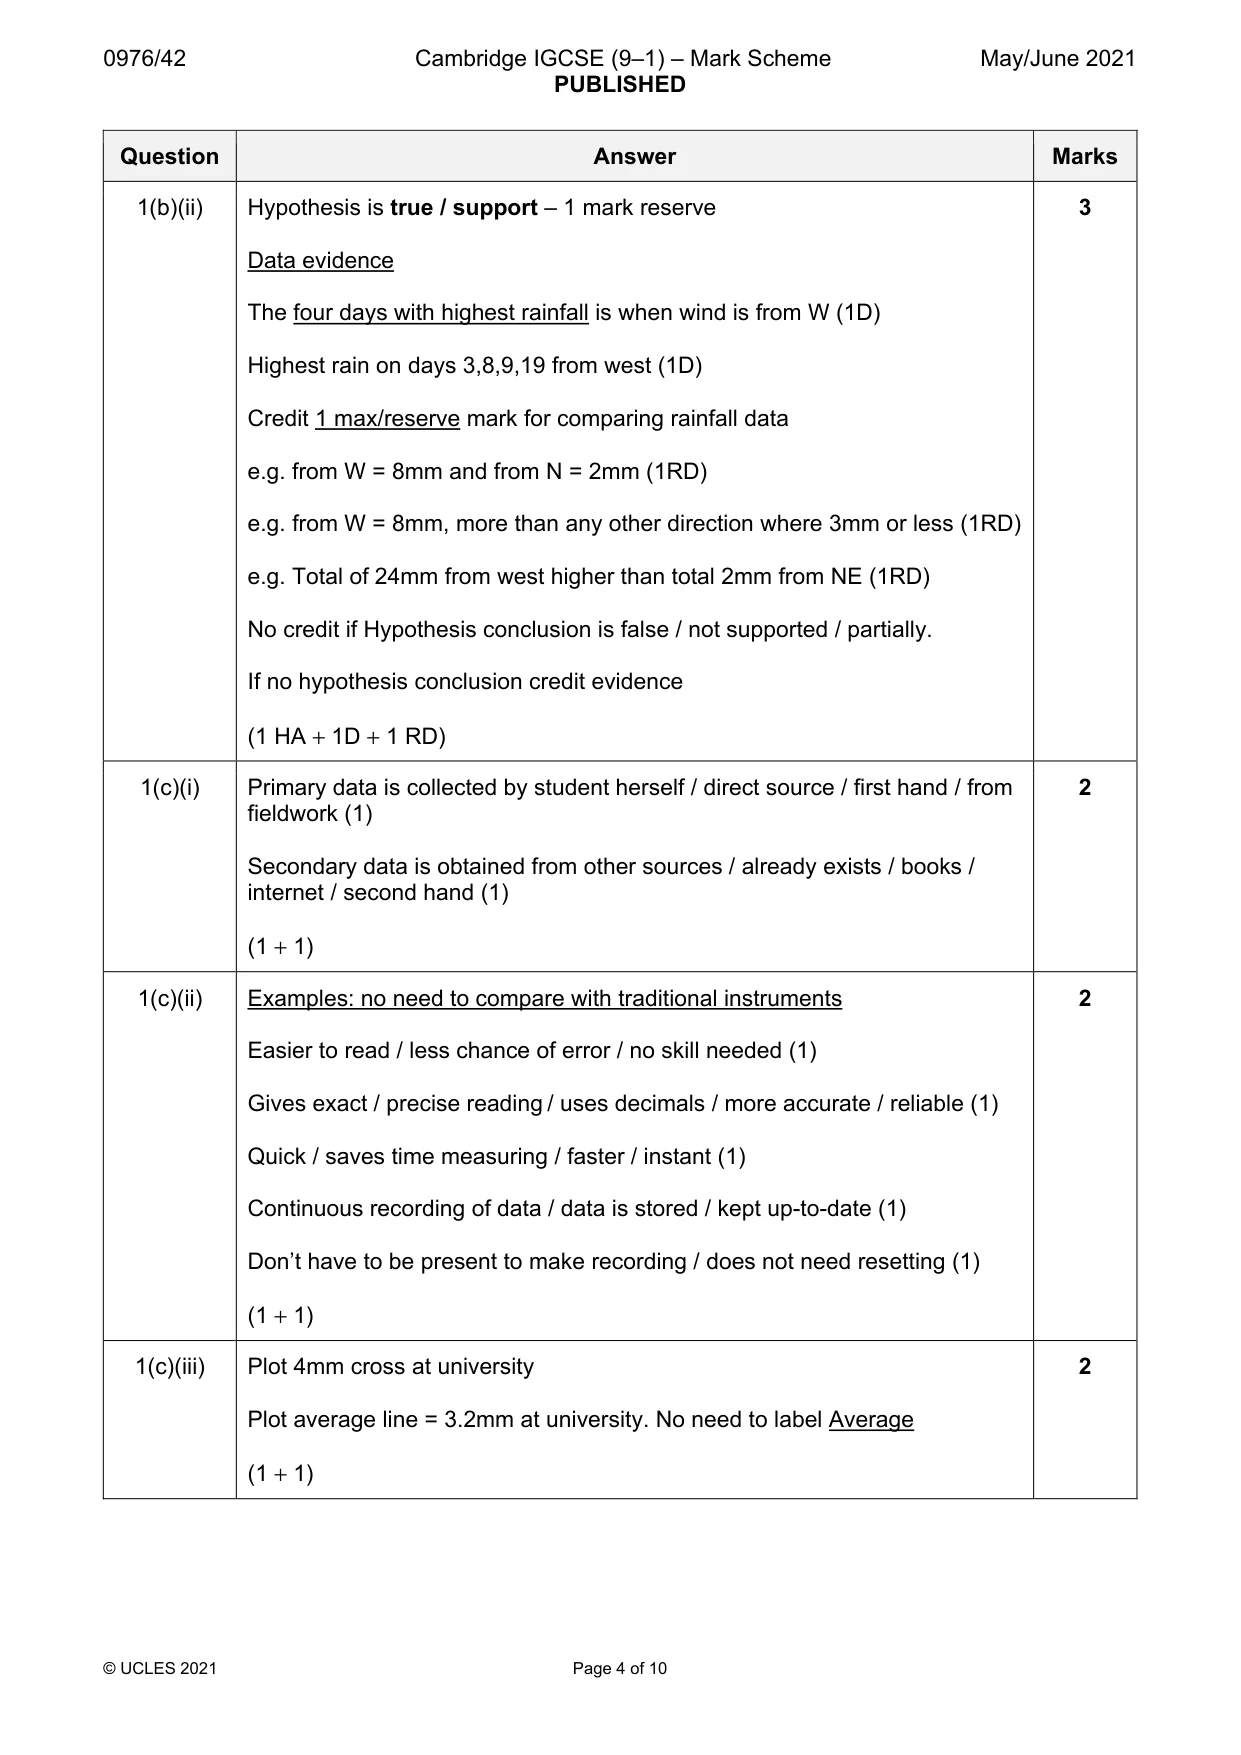
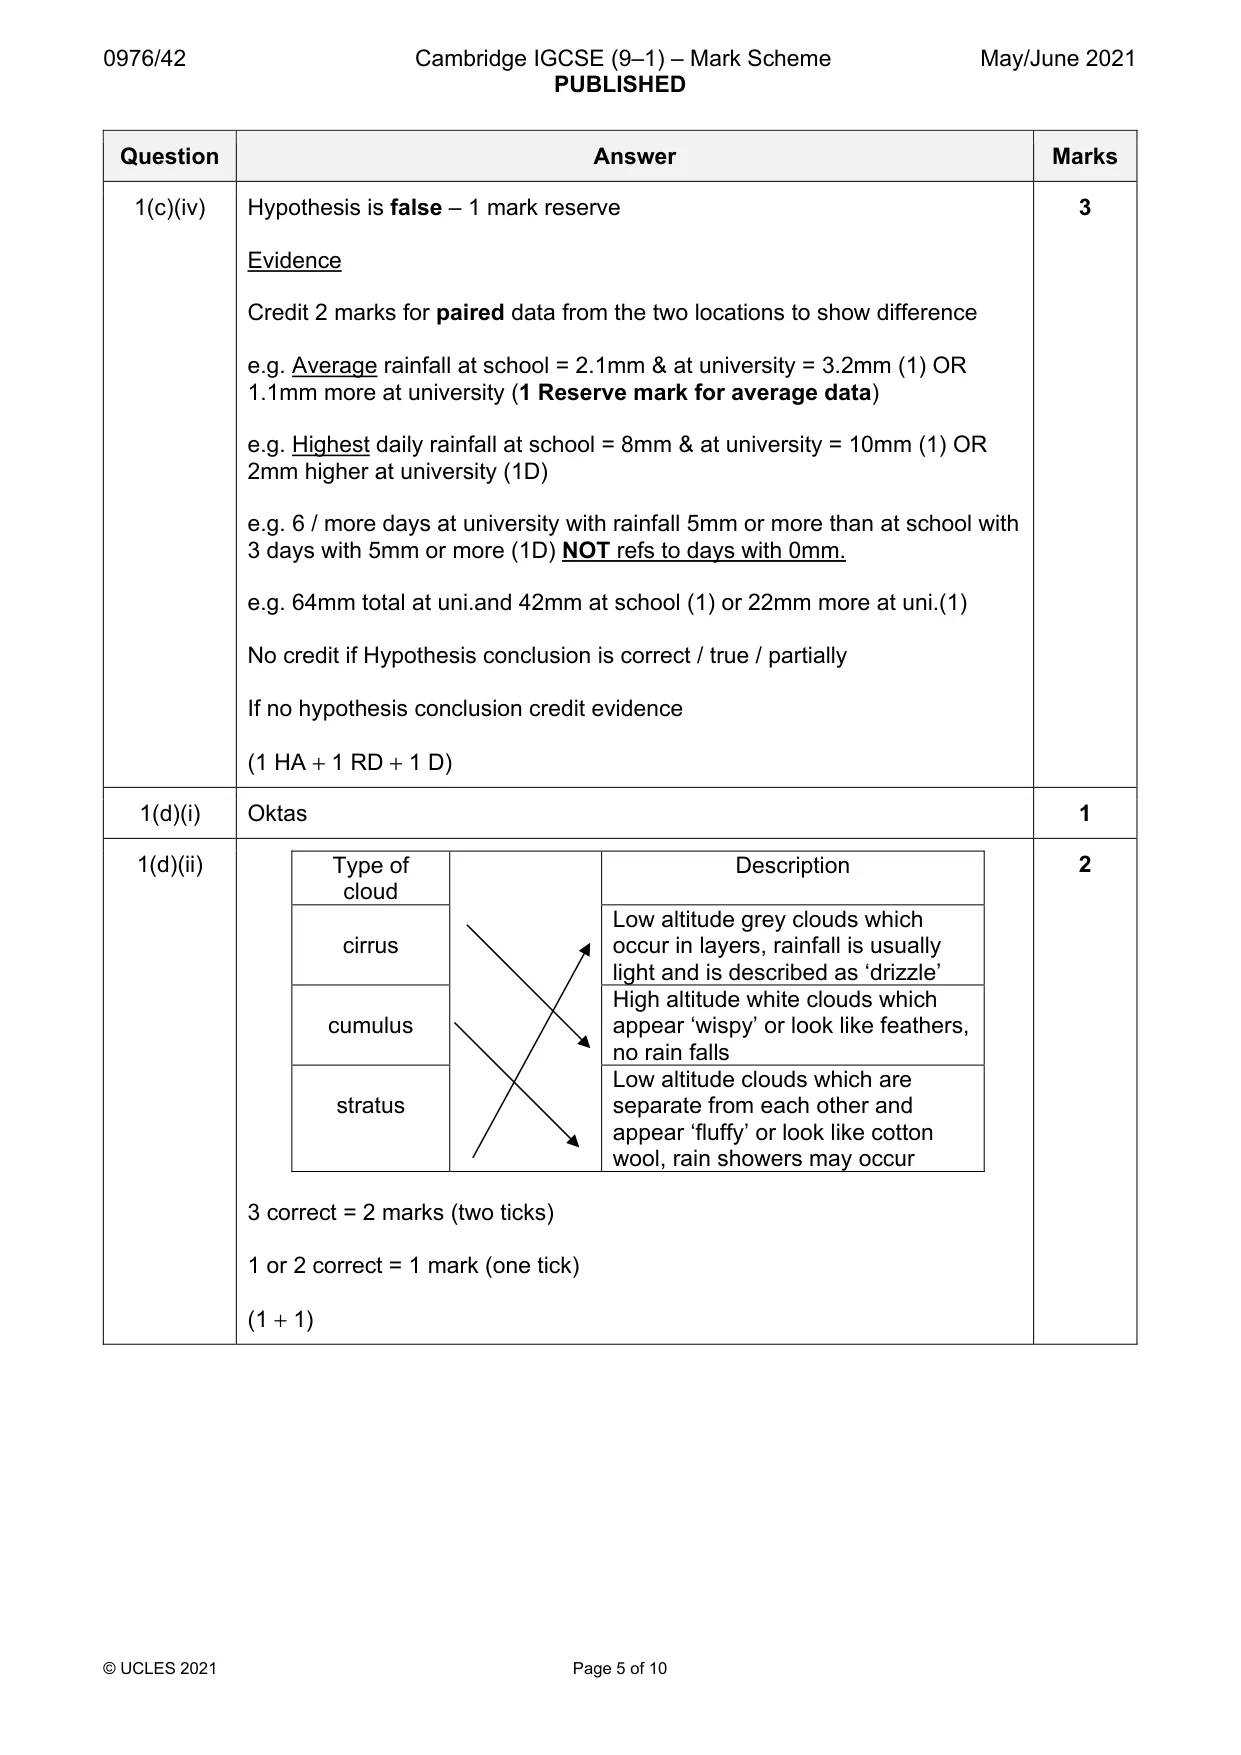
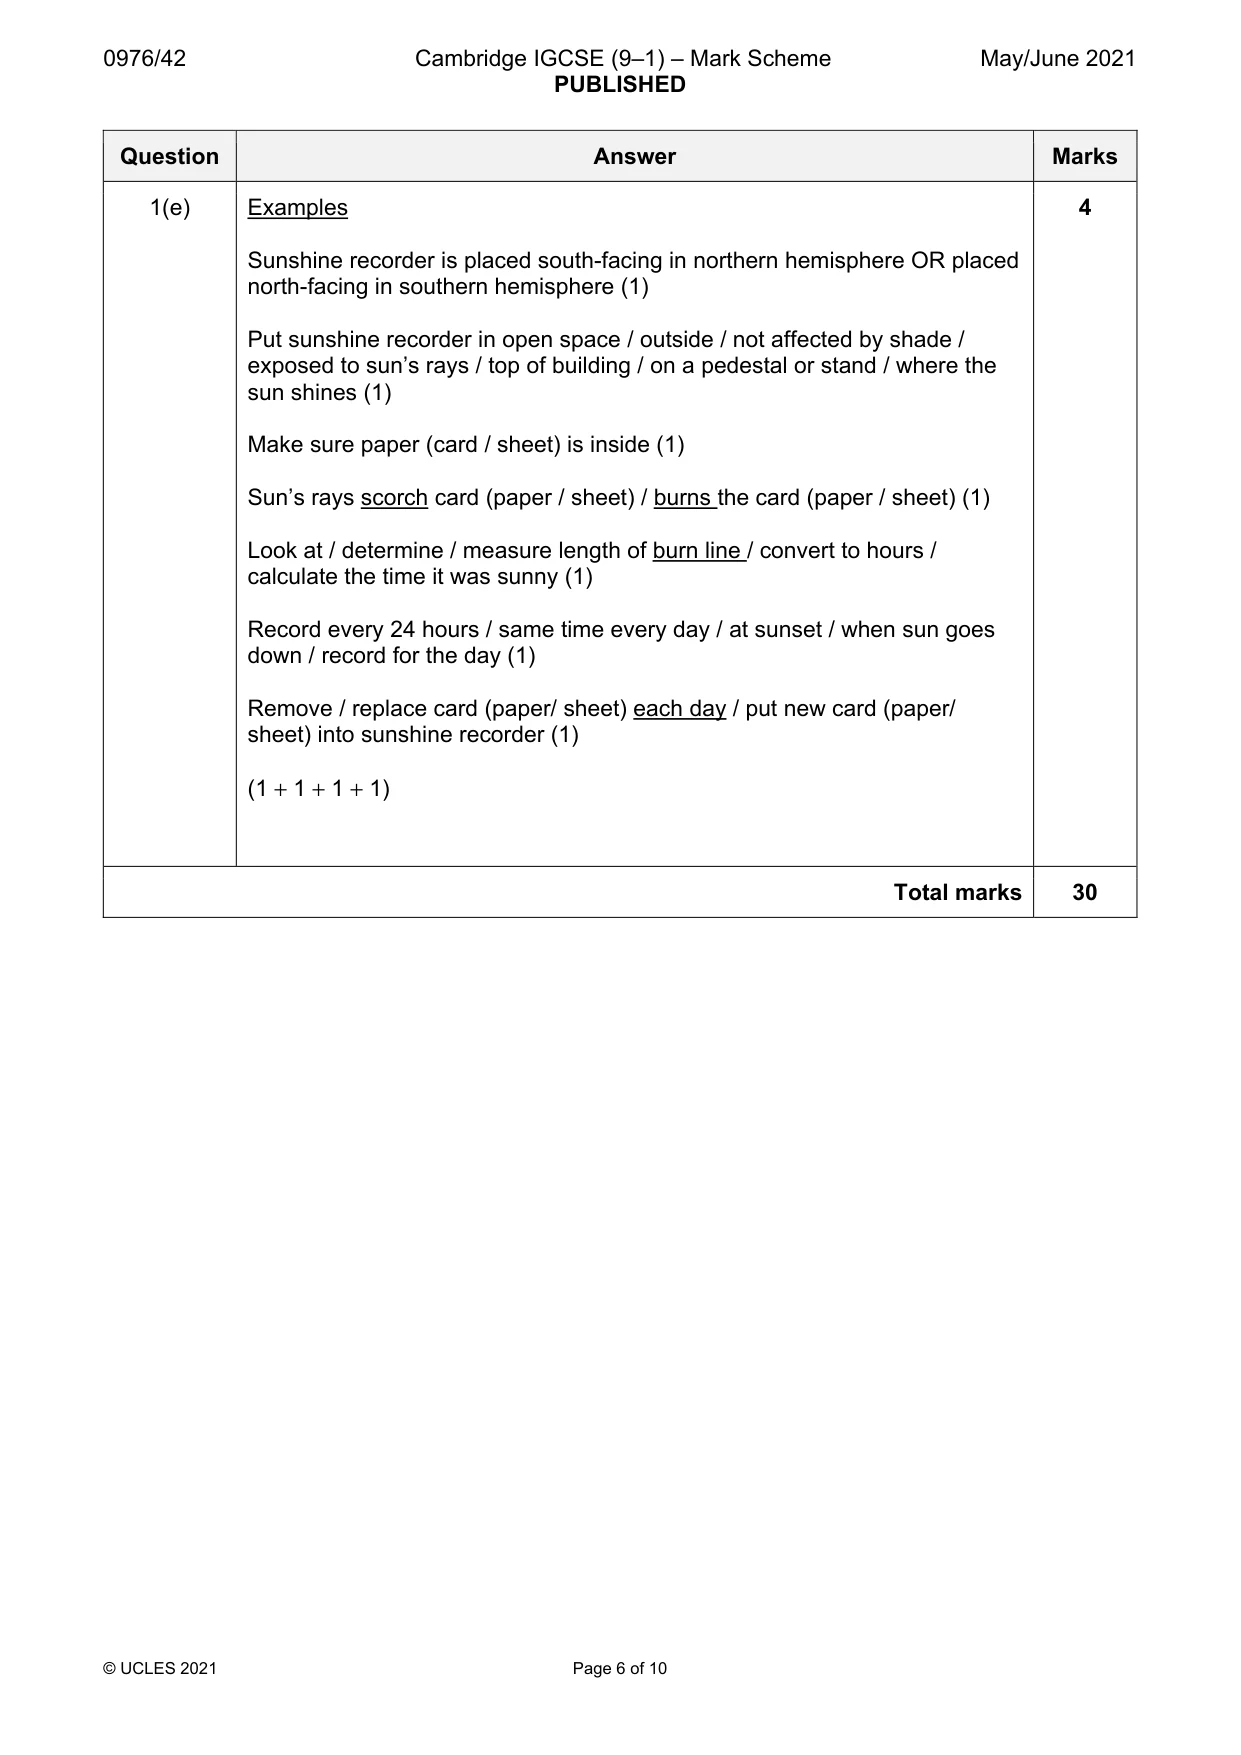
Mark scheme: Question Answer Marks 1(a)(i) Row 1: Away from trees to reduce interception by leaves (1) 2 Row 5: Remote from people or animals which may interfere with the rain gauge (1) (1 + 1) 1(a)(ii) Diagram of traditional rain gauge: 4 1 mark max. for diagram with funnel, collecting jar & outer casing (1D) 3 marks max. for labels which show measuring process: Measuring jar / cylinder / bottle / beaker (1) Funnel (1) Outer casing / layer / external or outer container/ metal container (1) Scale / measurement / mm / cm / labelled graduations or readings or calibrations or markings (1) If diagram is a pluviometer Credit 1 mark for diagram as appropriate & 3 marks for labels such as scale / container / stand or post which show measuring process (1 Diagram + 1 + 1 + 1) 1(a)(iii) The letters (N,E,S,W) show… directions / compass directions/ cardinal 3 points / North, East, South, West (1) The pointer (arrow) shows … which direction the wind is coming from (1) The wind vane is located on the roof so that …. there is no obstruction or interference / it gets maximum wind strength (1) (1 + 1 + 1) 1(b)(i) Plot day 3: 5mm from W 2 Plot day 16: 2mm from N No marks for shading, just plots. (1 + 1) 1(b)(ii) Hypothesis is true / support – 1 mark reserve 3 Data evidence The four days with highest rainfall is when wind is from W (1D) Highest rain on days 3,8,9,19 from west (1D) Credit 1 max/reserve mark for comparing rainfall data e.g. from W = 8mm and from N = 2mm (1RD) e.g. from W = 8mm, more than any other direction where 3mm or less (1RD) e.g. Total of 24mm from west higher than total 2mm from NE (1RD) No credit if Hypothesis conclusion is false / not supported / partially. If no hypothesis conclusion credit evidence (1 HA + 1D + 1 RD) 1(c)(i) Primary data is collected by student herself / direct source / first hand / from 2 fieldwork (1) Secondary data is obtained from other sources / already exists / books / internet / second hand (1) (1 + 1) 1(c)(ii) Examples: no need to compare with traditional instruments 2 Easier to read / less chance of error / no skill needed (1) Gives exact / precise reading / uses decimals / more accurate / reliable (1) Quick / saves time measuring / faster / instant (1) Continuous recording of data / data is stored / kept up-to-date (1) Don’t have to be present to make recording / does not need resetting (1) (1 + 1) 1(c)(iii) Plot 4mm cross at university 2 Plot average line = 3.2mm at university. No need to label Average (1 + 1) 1(c)(iv) Hypothesis is false – 1 mark reserve 3 Evidence Credit 2 marks for paired data from the two locations to show difference e.g. Average rainfall at school = 2.1mm & at university = 3.2mm (1) OR 1.1mm more at university (1 Reserve mark for average data) e.g. Highest daily rainfall at school = 8mm & at university = 10mm (1) OR 2mm higher at university (1D) e.g. 6 / more days at university with rainfall 5mm or more than at school with 3 days with 5mm or more (1D) NOT refs to days with 0mm. e.g. 64mm total at uni.and 42mm at school (1) or 22mm more at uni.(1) No credit if Hypothesis conclusion is correct / true / partially If no hypothesis conclusion credit evidence (1 HA + 1 RD + 1 D) 1(d)(i) Oktas 1 1(d)(ii) Type of Description 2 cloud Low altitude grey clouds which cirrus occur in layers, rainfall is usually light and is described as ‘drizzle’ High altitude white clouds which cumulus appear ‘wispy’ or look like feathers, no rain falls Low altitude clouds which are stratus separate from each other and appear ‘fluffy’ or look like cotton wool, rain showers may occur 3 correct = 2 marks (two ticks) 1 or 2 correct = 1 mark (one tick) (1 + 1) 1(e) Examples 4 Sunshine recorder is placed south-facing in northern hemisphere OR placed north-facing in southern hemisphere (1) Put sunshine recorder in open space / outside / not affected by shade / exposed to sun’s rays / top of building / on a pedestal or stand / where the sun shines (1) Make sure paper (card / sheet) is inside (1) Sun’s rays scorch card (paper / sheet) / burns the card (paper / sheet) (1) Look at / determine / measure length of burn line / convert to hours / calculate the time it was sunny (1) Record every 24 hours / same time every day / at sunset / when sun goes down / record for the day (1) Remove / replace card (paper/ sheet) each day / put new card (paper/ sheet) into sunshine recorder (1) (1 + 1 + 1 + 1) Total marks 30
Q2 · Students from an international school in Singapore, a country in Southeast Asia, were…
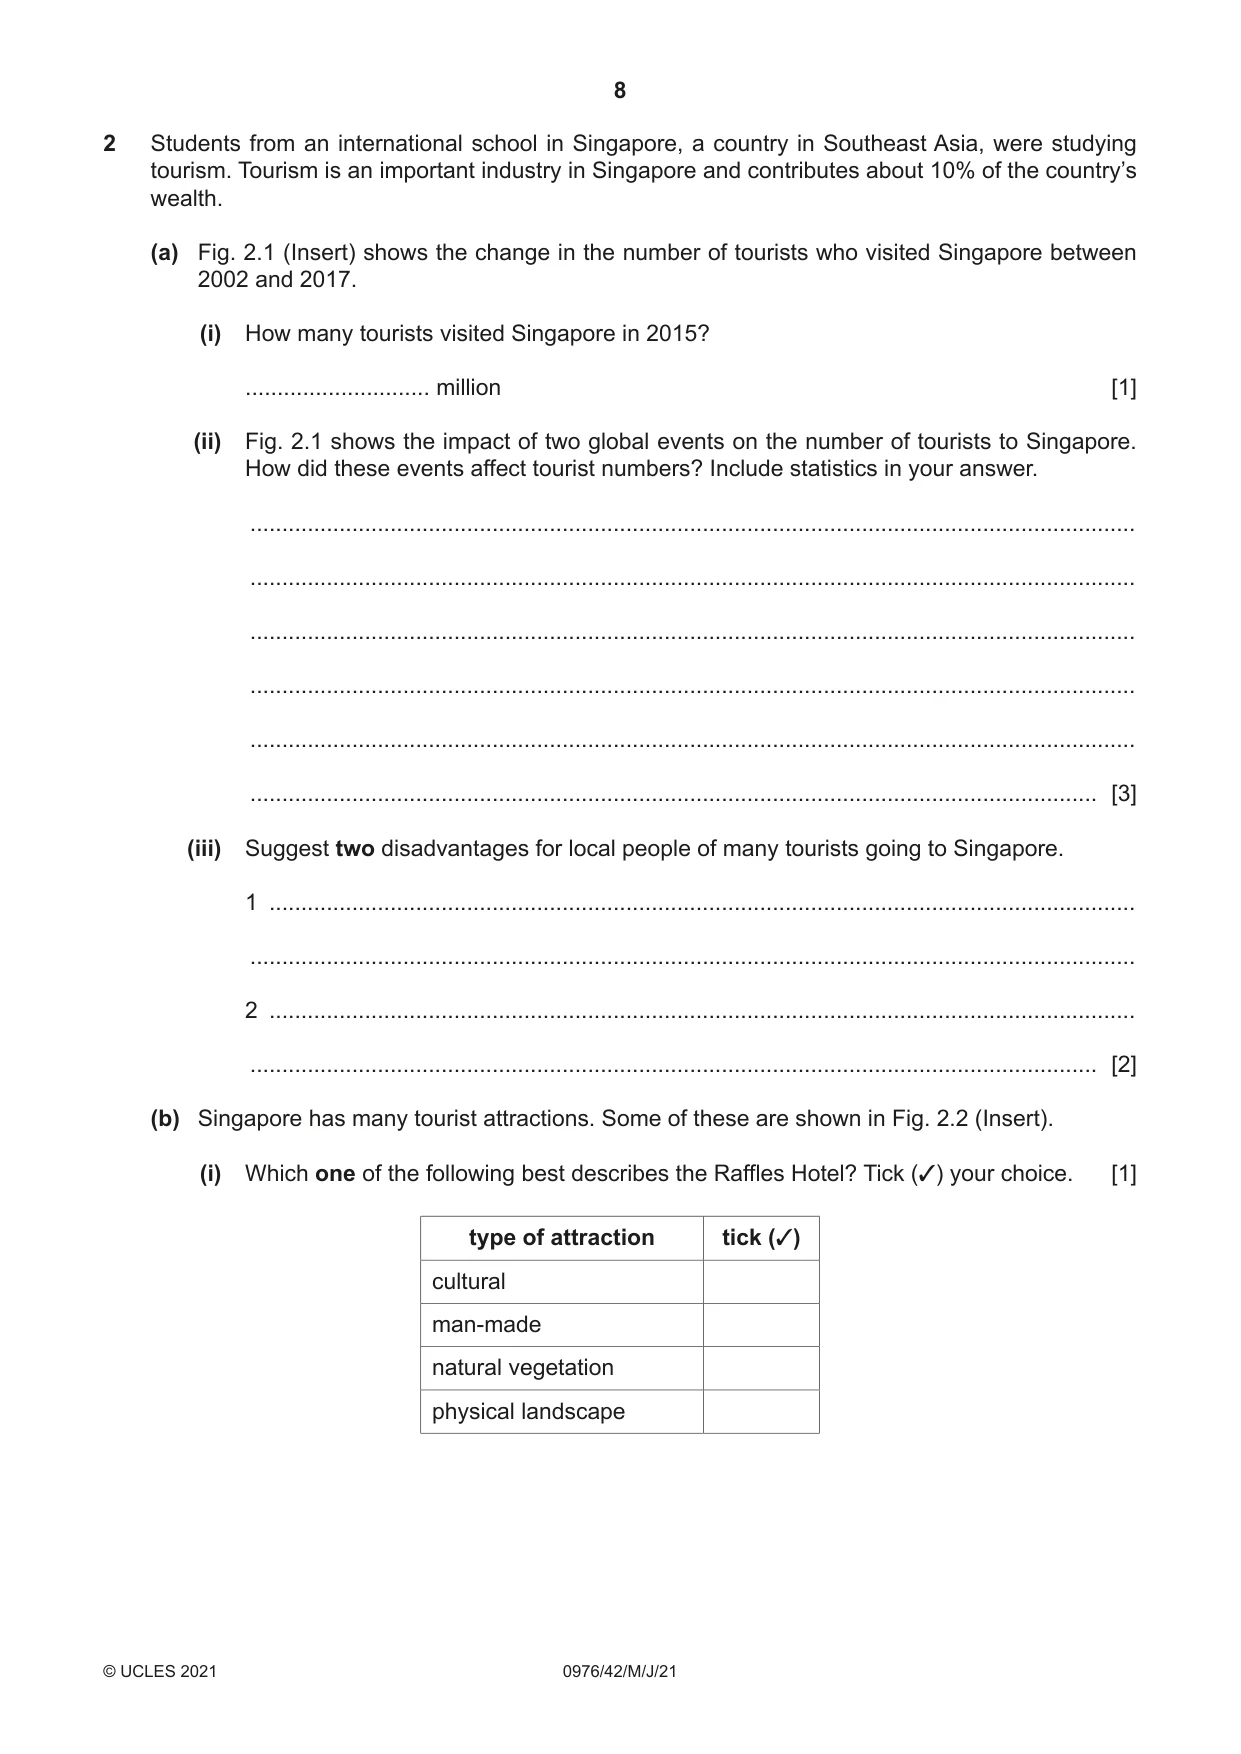
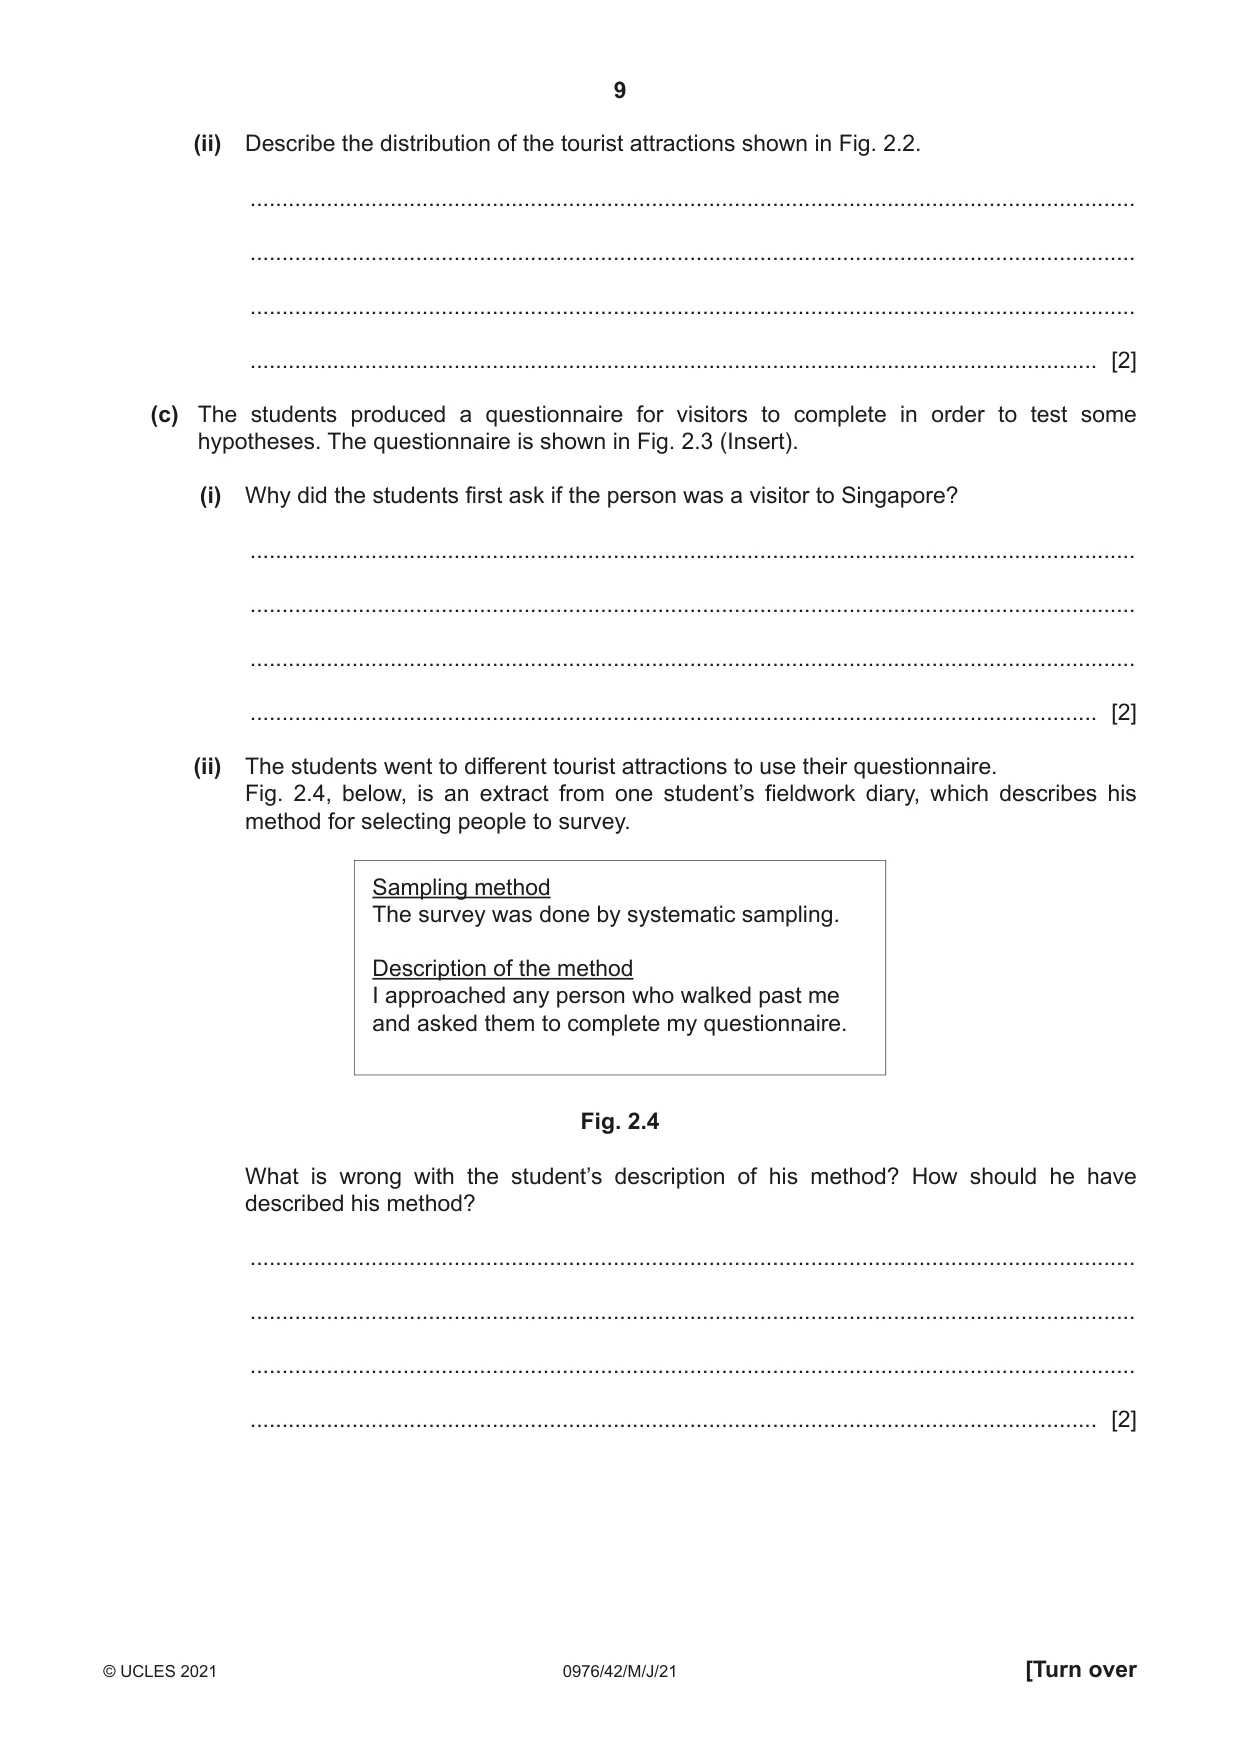
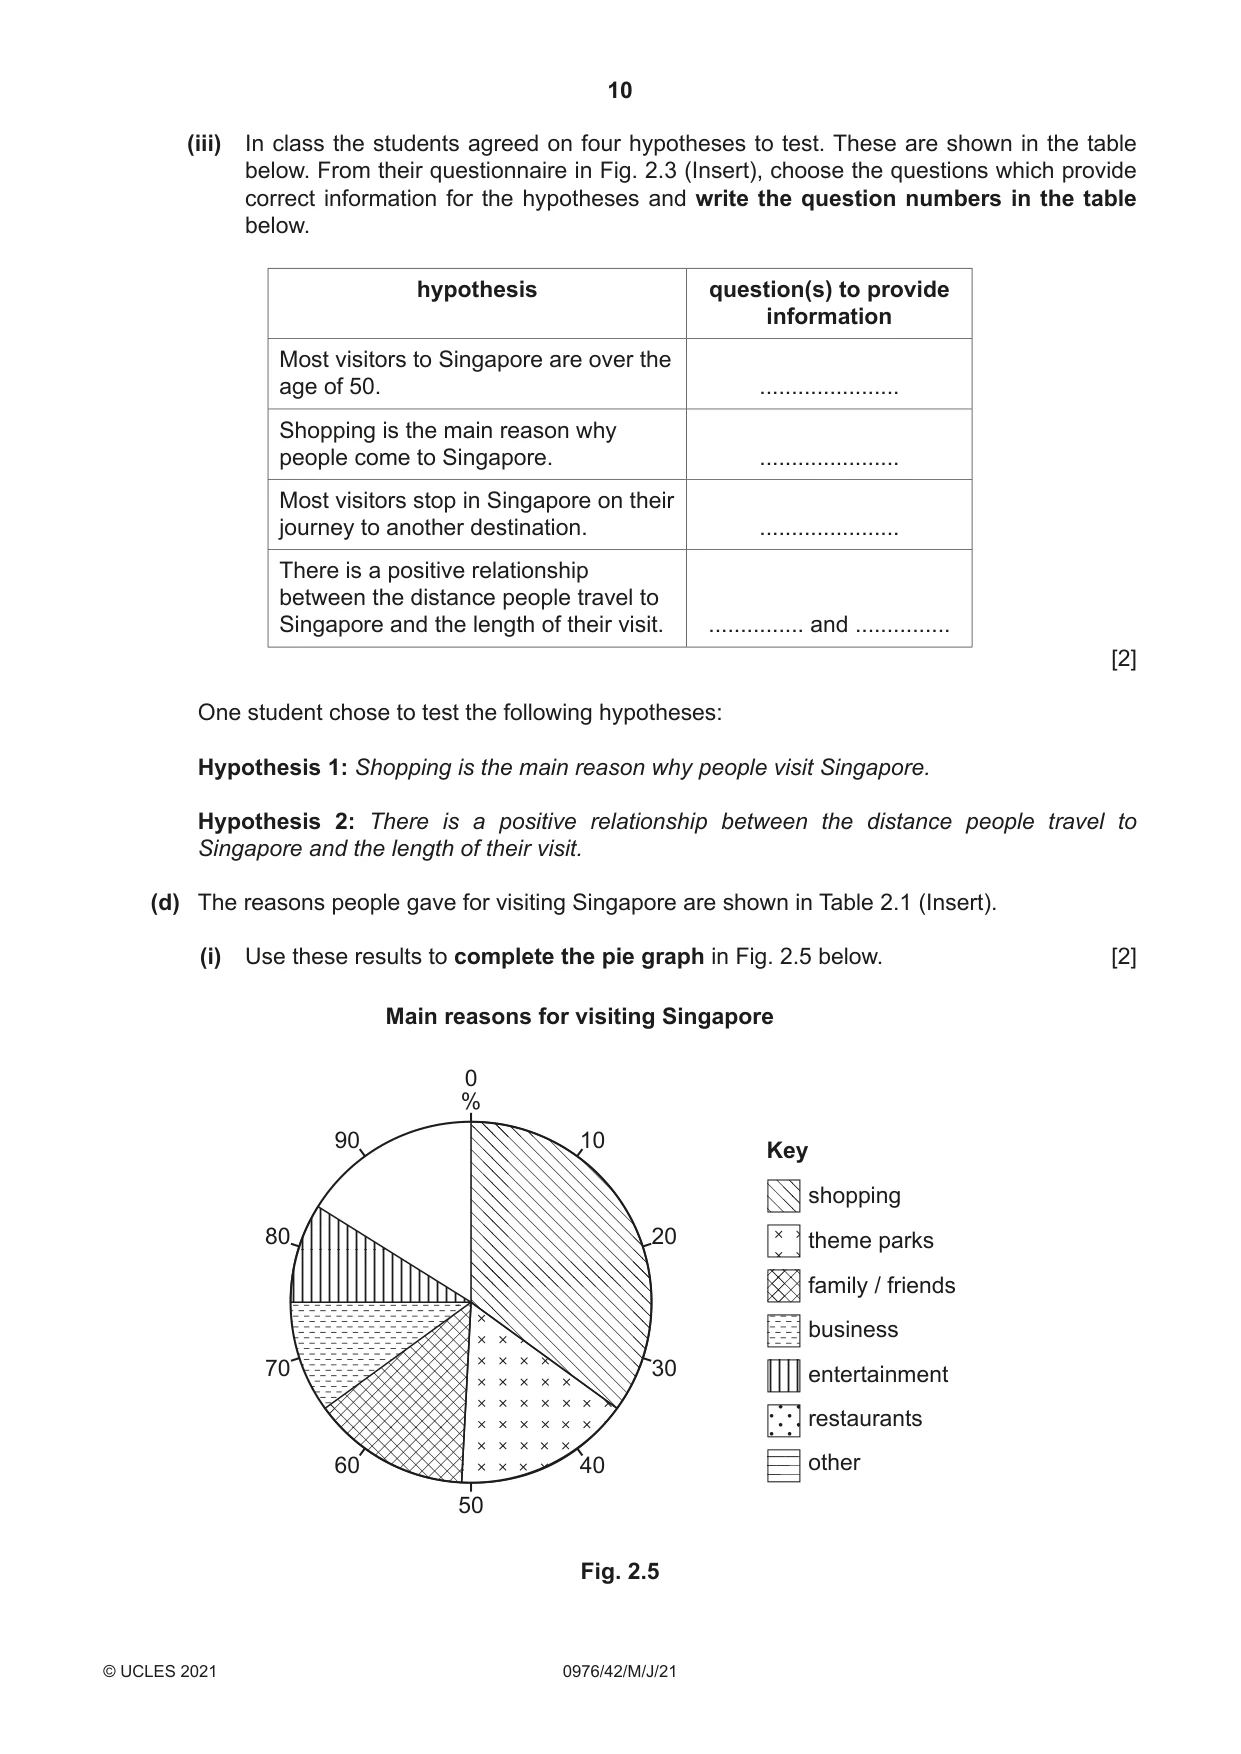
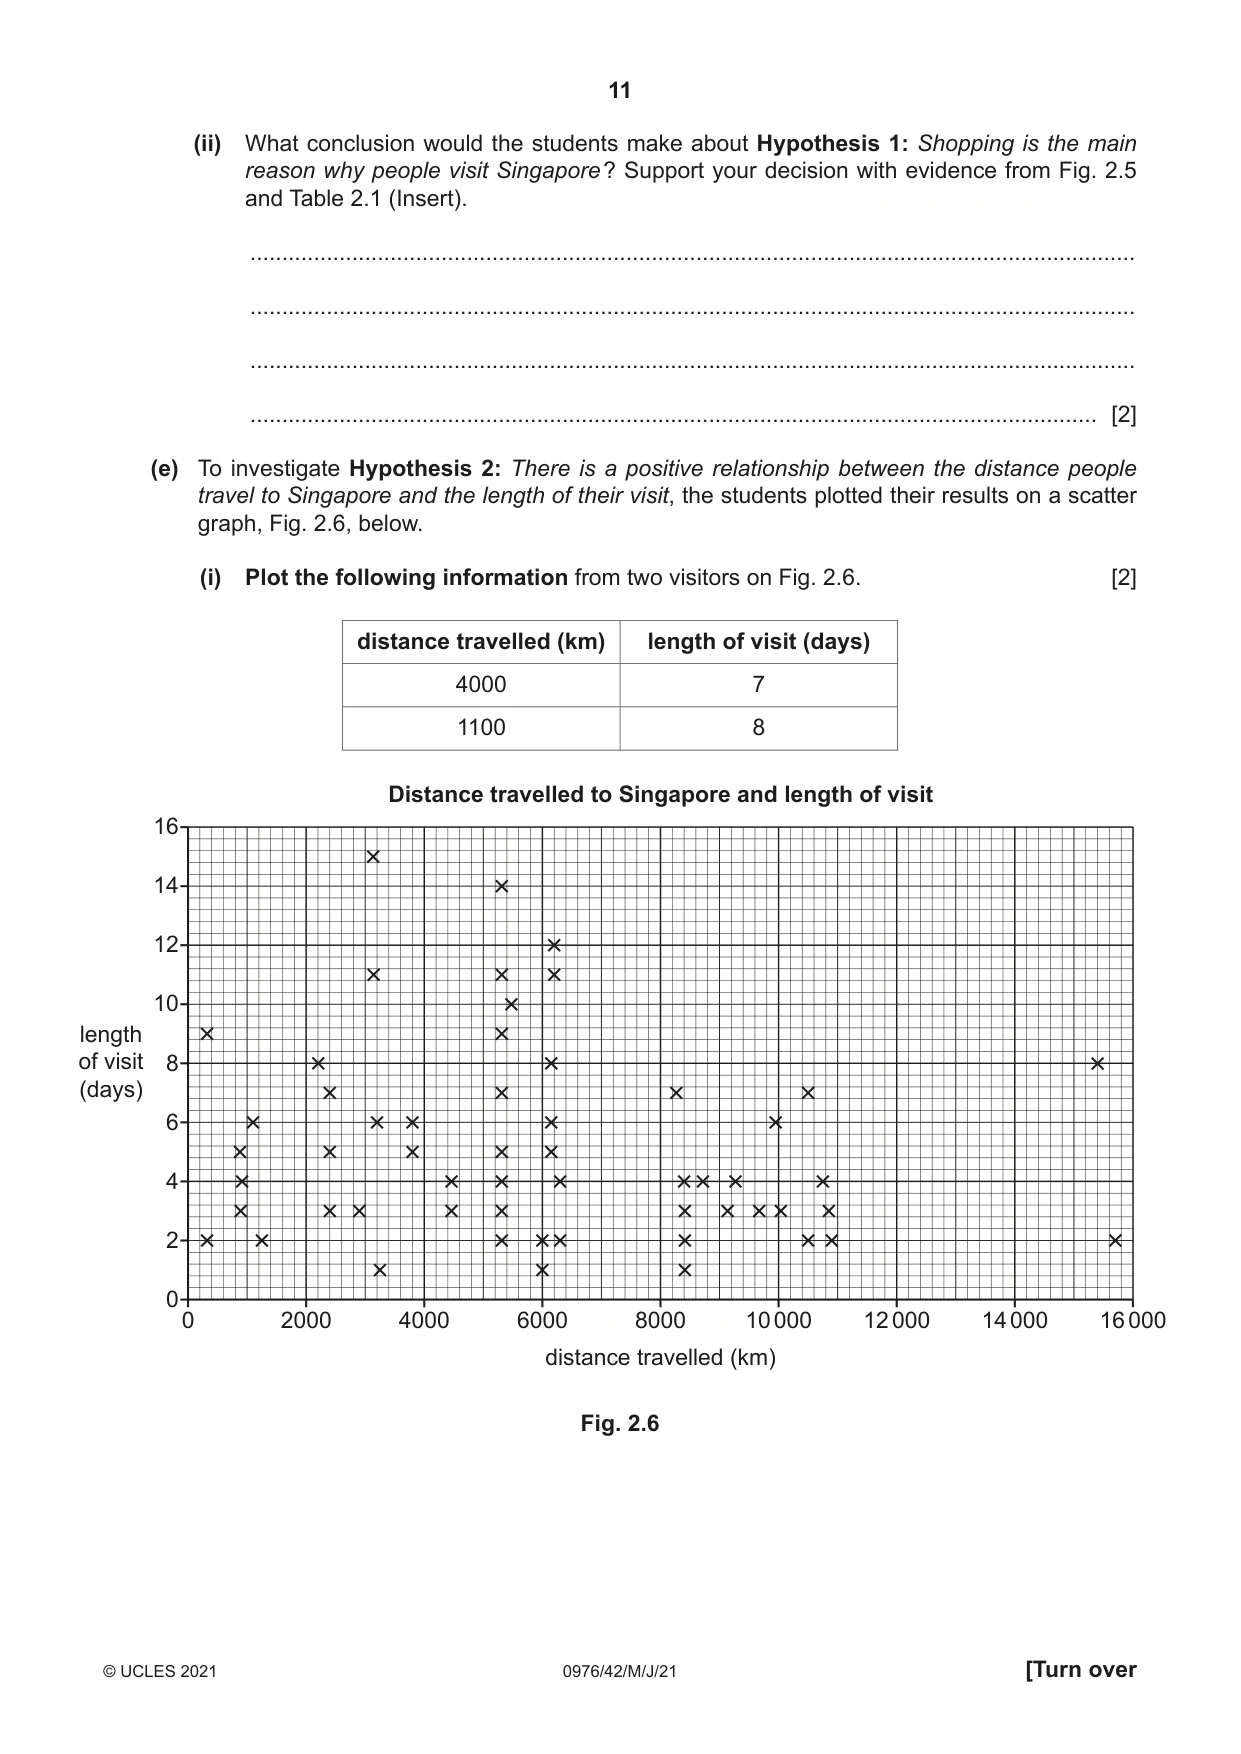
2 Students from an international school in Singapore, a country in Southeast Asia, were studying tourism. Tourism is an important industry in Singapore and contributes about 10% of the country’s wealth. (a) Fig. 2.1 (Insert) shows the change in the number of tourists who visited Singapore between 2002 and 2017. (i) How many tourists visited Singapore in 2015? ............................. million [1] (ii) Fig. 2.1 shows the impact of two global events on the number of tourists to Singapore. How did these events affect tourist numbers? Include statistics in your answer. ........................................................................................................................................... ........................................................................................................................................... ........................................................................................................................................... ........................................................................................................................................... ........................................................................................................................................... ..................................................................................................................................... [3] (iii) Suggest two disadvantages for local people of many tourists going to Singapore. 1 ........................................................................................................................................ ........................................................................................................................................... 2 ........................................................................................................................................ ..................................................................................................................................... [2] (b) Singapore has many tourist attractions. Some of these are shown in Fig. 2.2 (Insert). (i) Which one of the following best describes the Raffles Hotel? Tick (3) your choice. [1] type of attraction tick (3) cultural man-made natural vegetation physical landscape (ii) Describe the distribution of the tourist attractions shown in Fig. 2.2. ........................................................................................................................................... ........................................................................................................................................... ........................................................................................................................................... ..................................................................................................................................... [2] (c) The students produced a questionnaire for visitors to complete in order to test some hypotheses. The questionnaire is shown in Fig. 2.3 (Insert). (i) Why did the students first ask if the person was a visitor to Singapore? ........................................................................................................................................... ........................................................................................................................................... ........................................................................................................................................... ..................................................................................................................................... [2] (ii) The students went to different tourist attractions to use their questionnaire. Fig. 2.4, below, is an extract from one student’s fieldwork diary, which describes his method for selecting people to survey. Sampling method The survey was done by systematic sampling. Description of the method I approached any person who walked past me and asked them to complete my questionnaire. Fig. 2.4 What is wrong with the student’s description of his method? How should he have described his method? ........................................................................................................................................... ........................................................................................................................................... ........................................................................................................................................... ..................................................................................................................................... [2] (iii) In class the students agreed on four hypotheses to test. These are shown in the table below. From their questionnaire in Fig. 2.3 (Insert), choose the questions which provide correct information for the hypotheses and write the question numbers in the table below. hypothesis question(s) to provide information Most visitors to Singapore are over the age of 50. ...................... Shopping is the main reason why people come to Singapore. ...................... Most visitors stop in Singapore on their journey to another destination. ...................... There is a positive relationship between the distance people travel to Singapore and the length of their visit. ............... and ............... [2] One student chose to test the following hypotheses: Hypothesis 1: Shopping is the main reason why people visit Singapore. Hypothesis 2: There is a positive relationship between the distance people travel to Singapore and the length of their visit. (d) The reasons people gave for visiting Singapore are shown in Table 2.1 (Insert). (i) Use these results to complete the pie graph in Fig. 2.5 below. [2] Main reasons for visiting Singapore 0 % 90 10 Key shopping 80 20 theme parks family / friends business 70 30 entertainment restaurants 60 40 other 50 Fig. 2.5
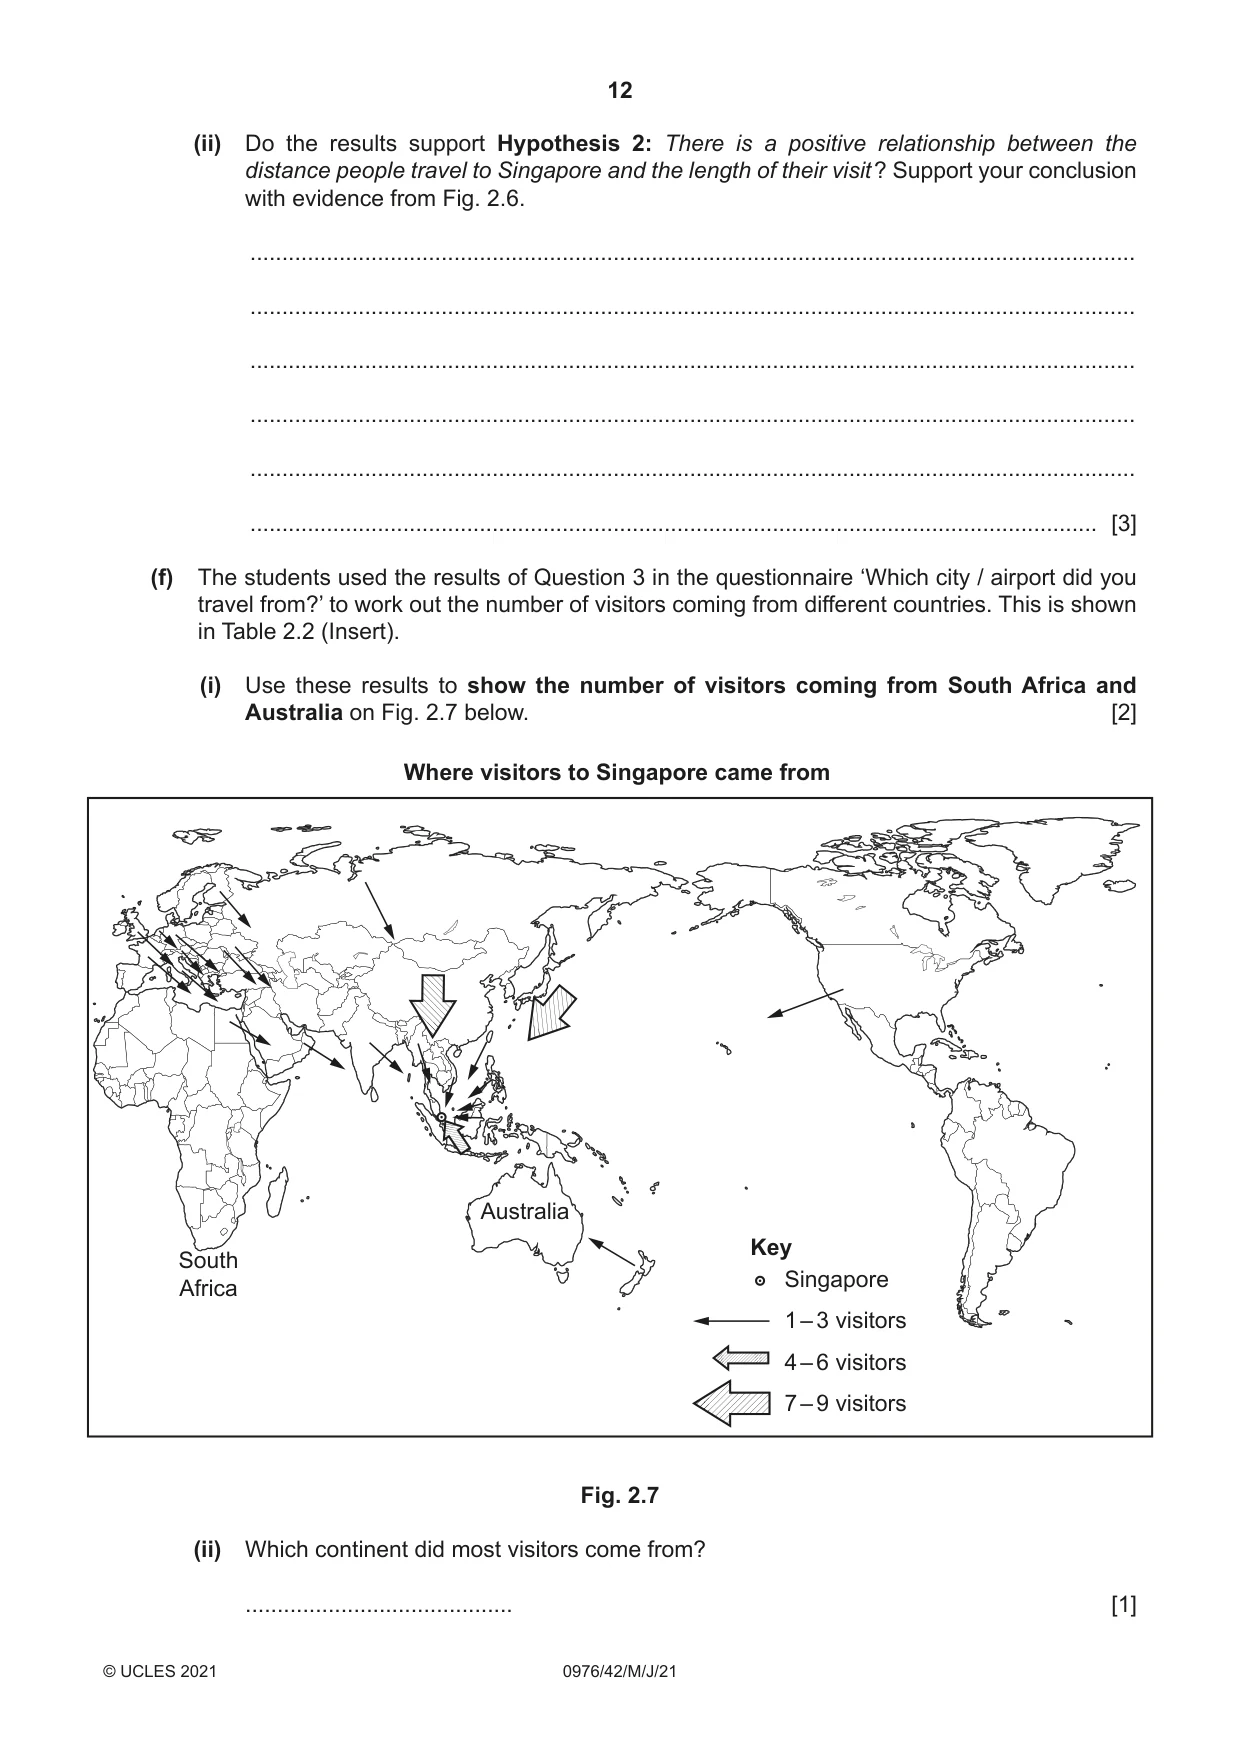
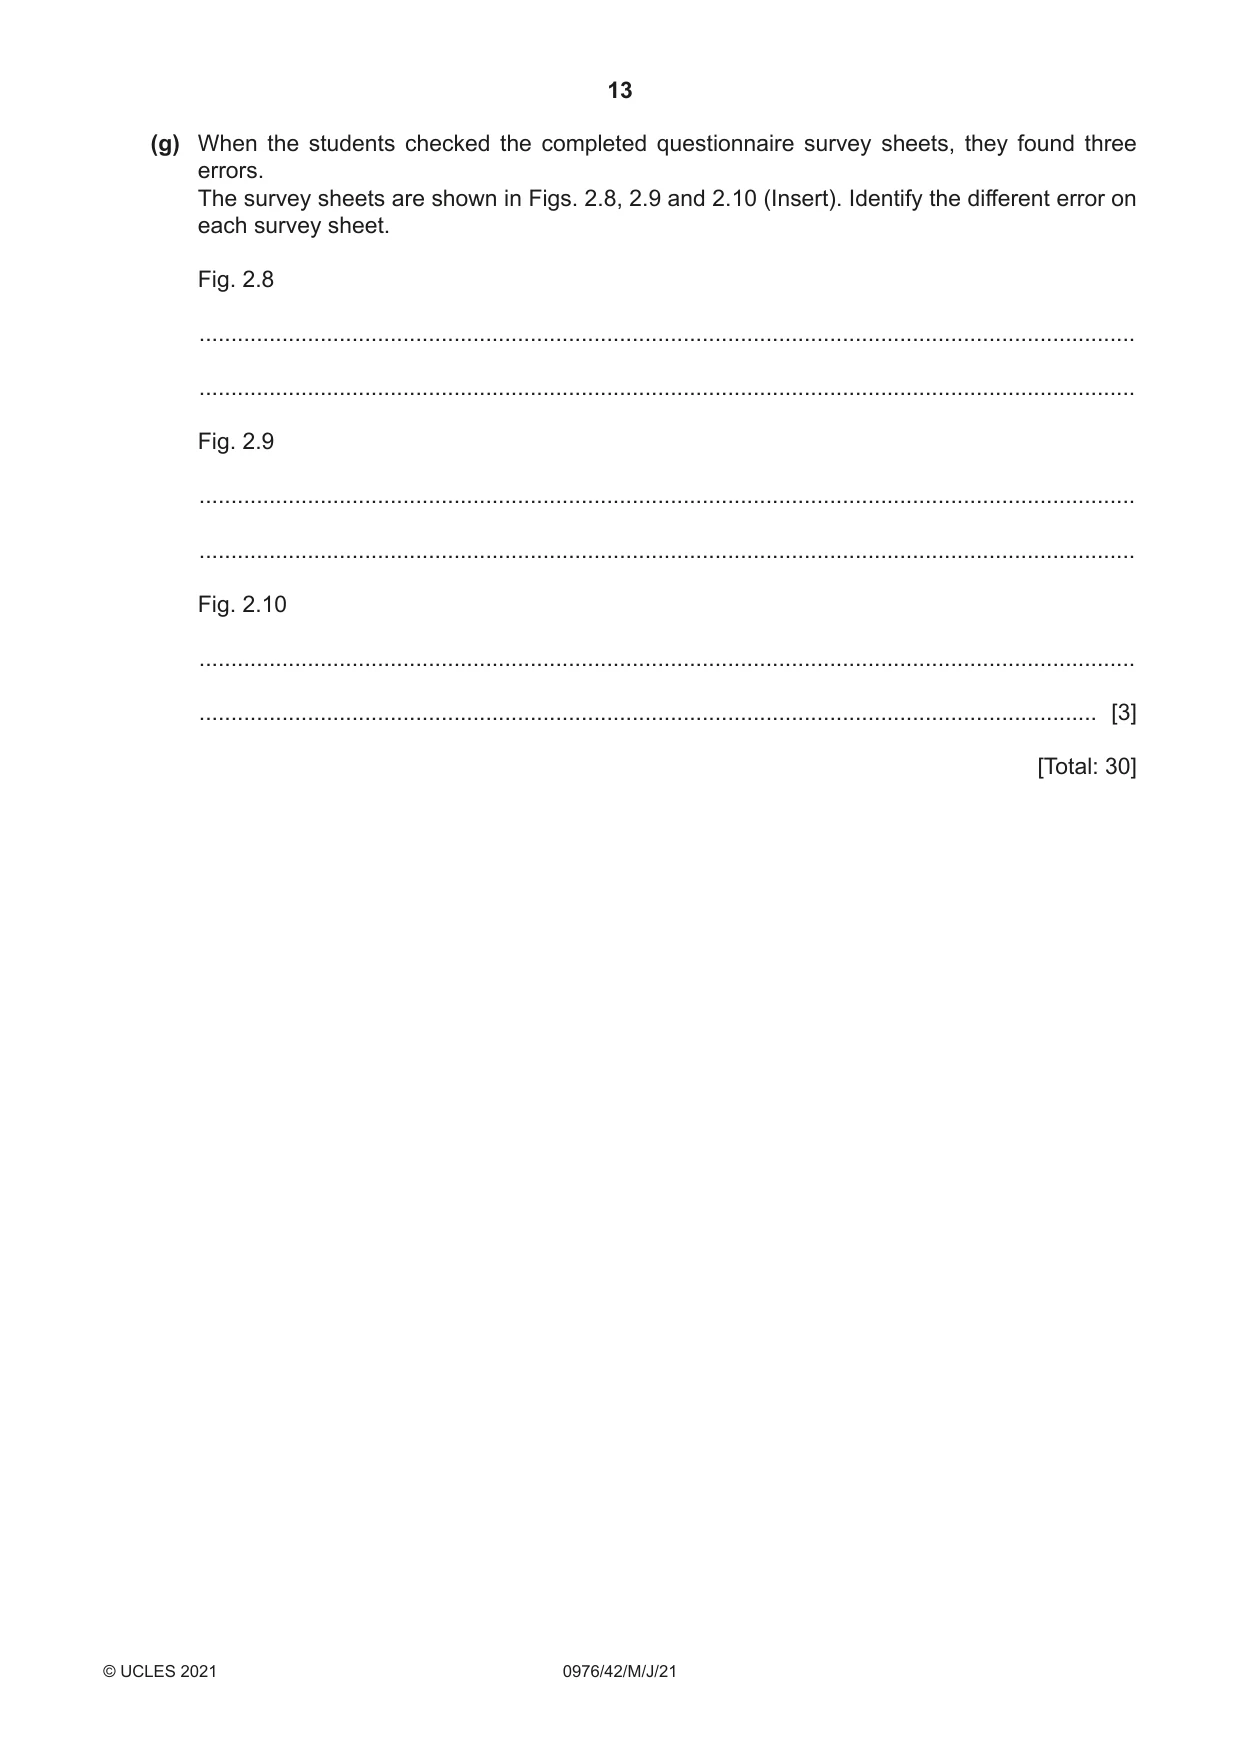
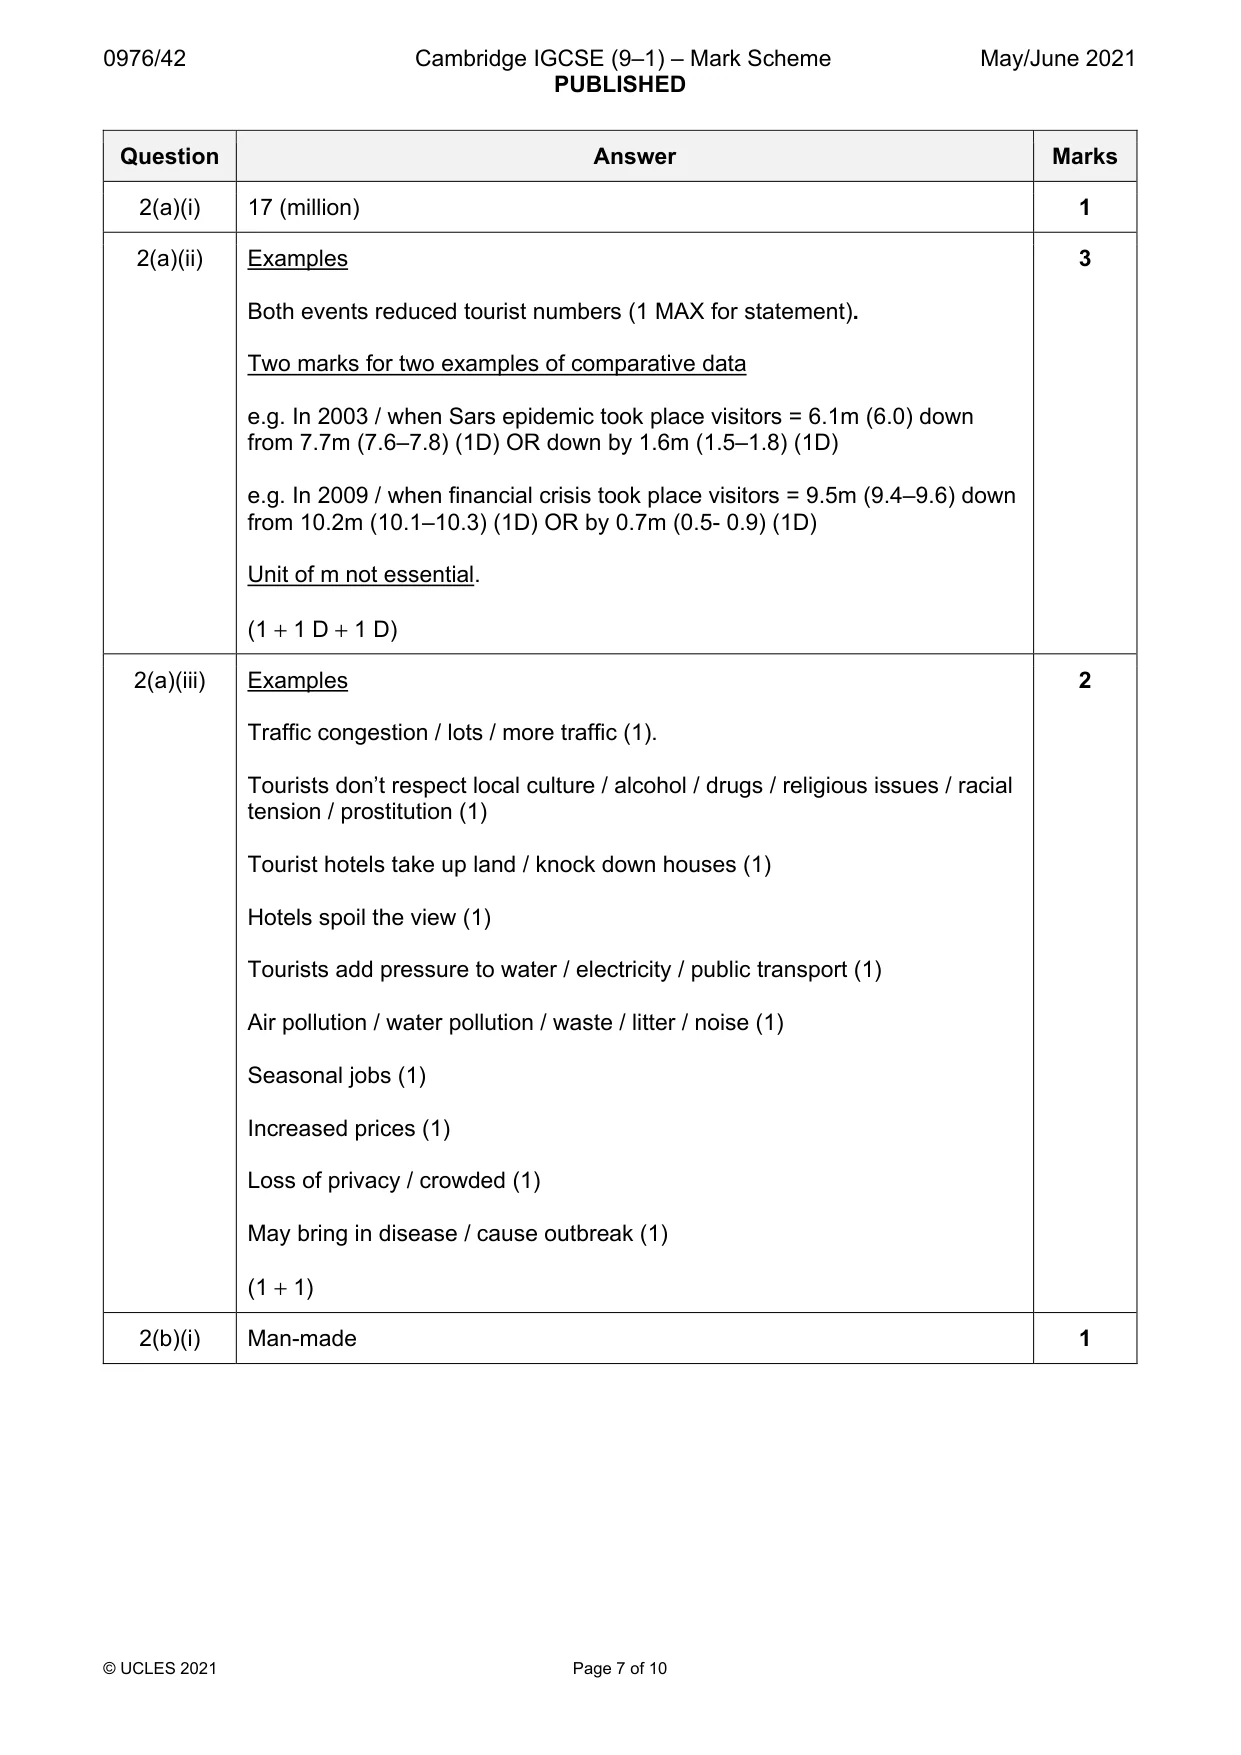
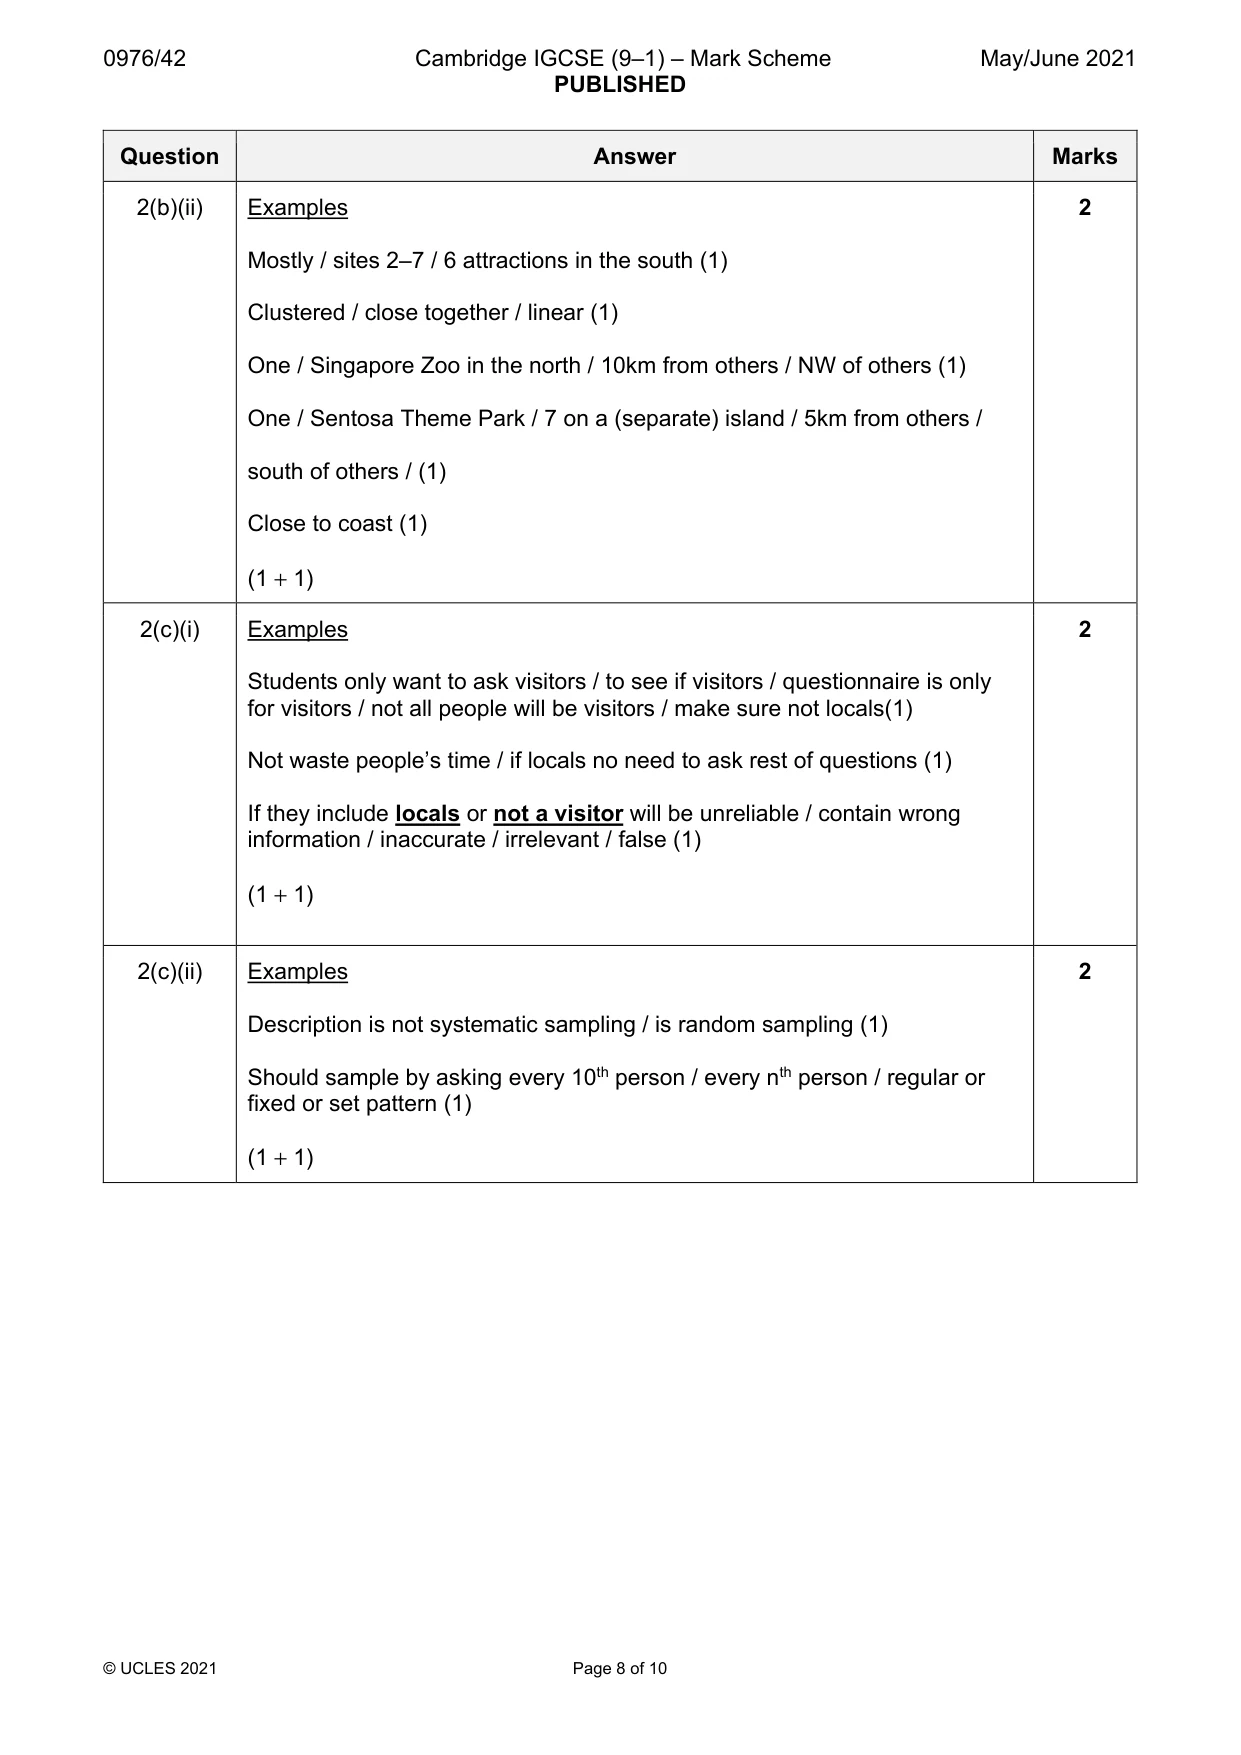
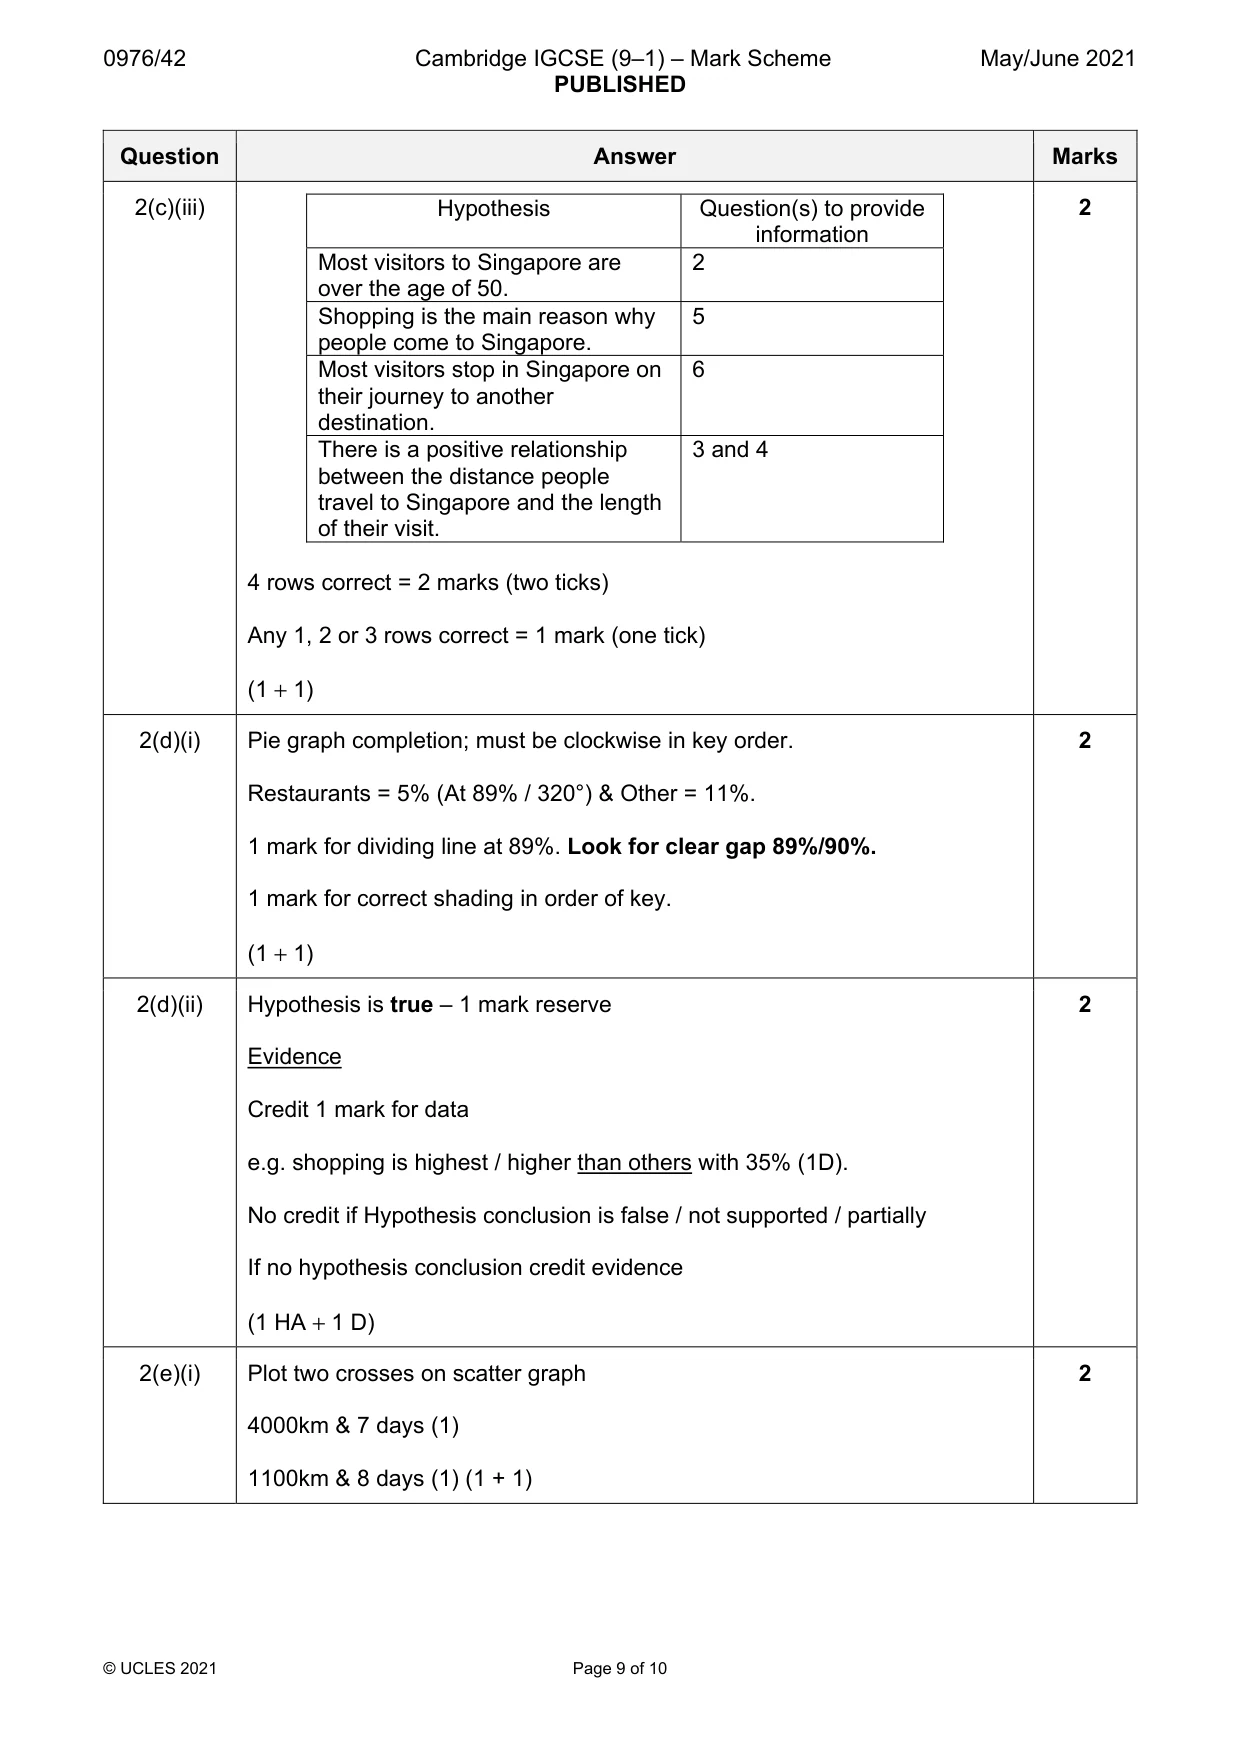
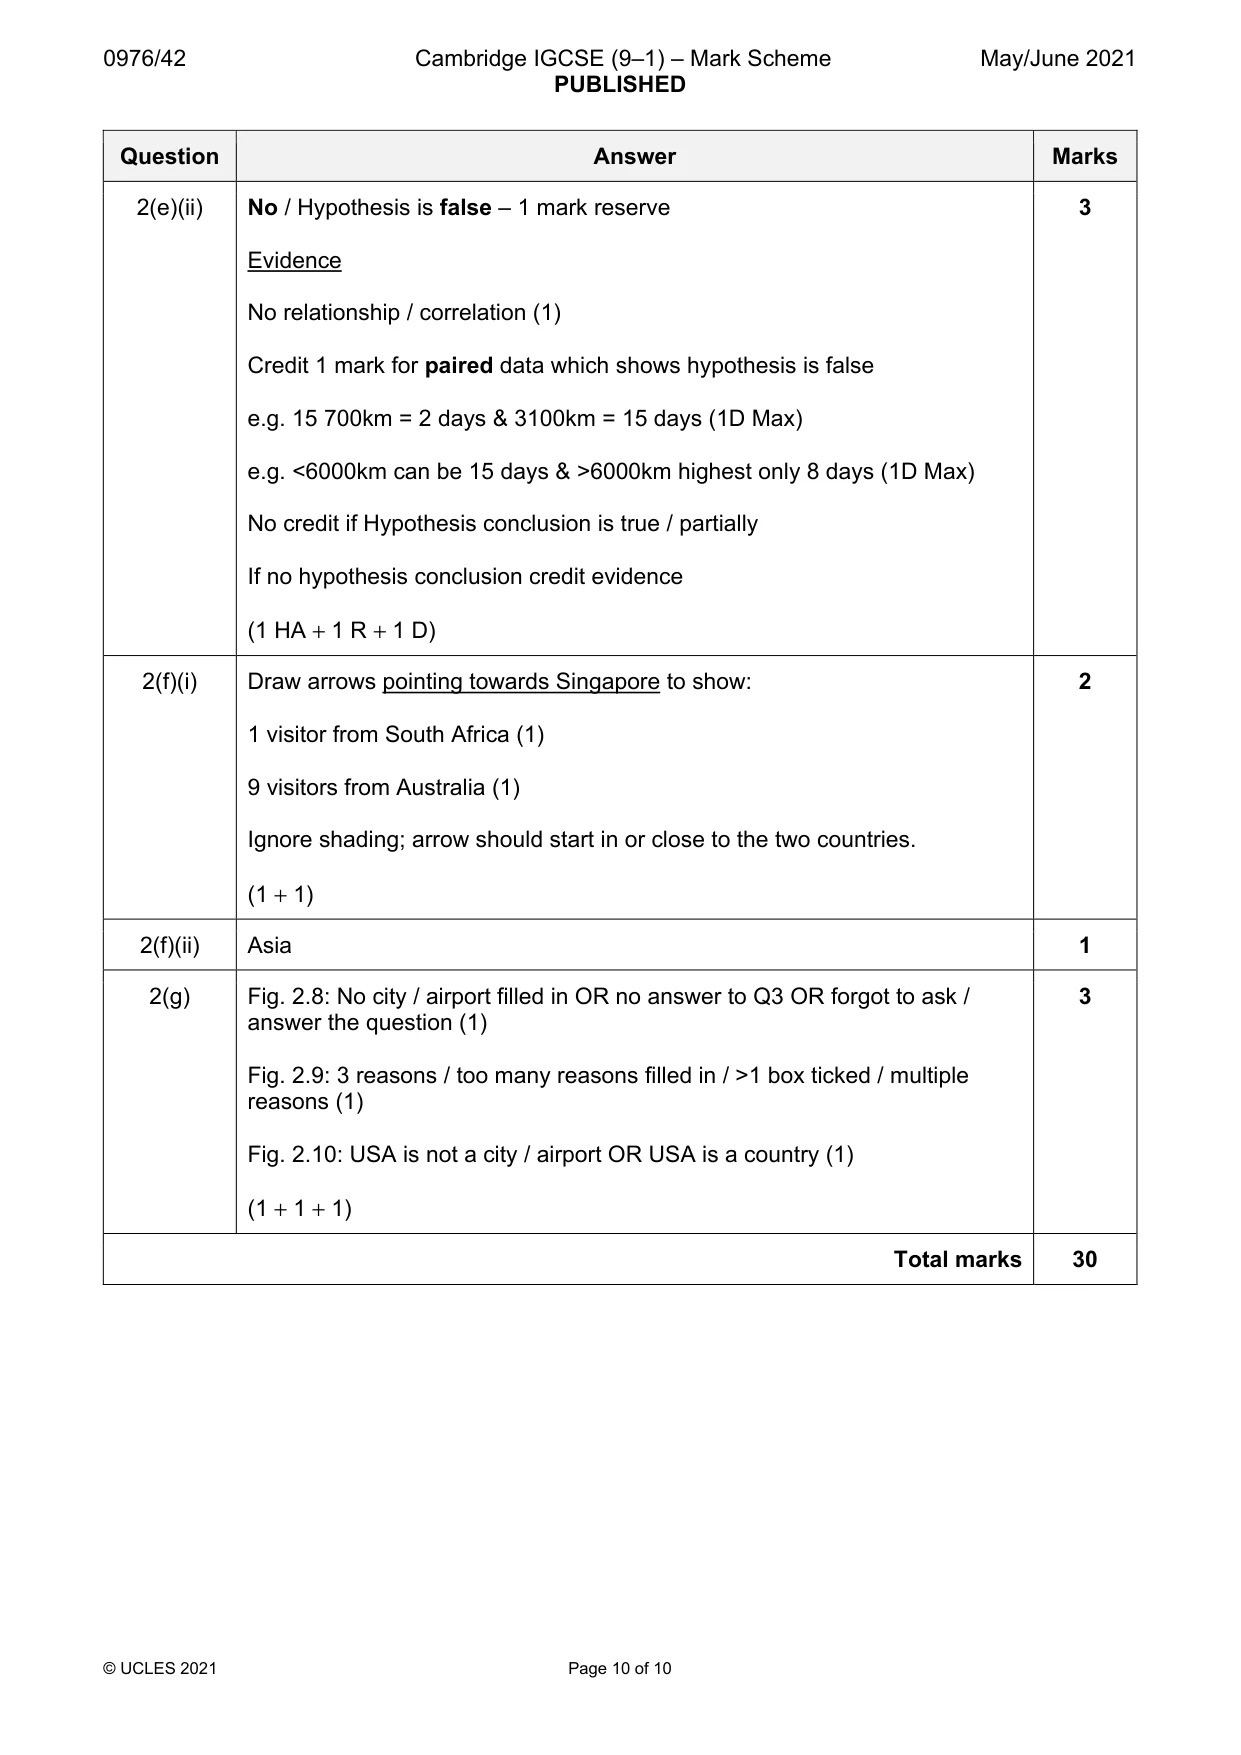
Mark scheme: 2(a)(i) 17 (million) 1 2(a)(ii) Examples 3 Both events reduced tourist numbers (1 MAX for statement). Two marks for two examples of comparative data e.g. In 2003 / when Sars epidemic took place visitors = 6.1m (6.0) down from 7.7m (7.6–7.8) (1D) OR down by 1.6m (1.5–1.8) (1D) e.g. In 2009 / when financial crisis took place visitors = 9.5m (9.4–9.6) down from 10.2m (10.1–10.3) (1D) OR by 0.7m (0.5- 0.9) (1D) Unit of m not essential. (1 + 1 D + 1 D) 2(a)(iii) Examples 2 Traffic congestion / lots / more traffic (1). Tourists don’t respect local culture / alcohol / drugs / religious issues / racial tension / prostitution (1) Tourist hotels take up land / knock down houses (1) Hotels spoil the view (1) Tourists add pressure to water / electricity / public transport (1) Air pollution / water pollution / waste / litter / noise (1) Seasonal jobs (1) Increased prices (1) Loss of privacy / crowded (1) May bring in disease / cause outbreak (1) (1 + 1) 2(b)(i) Man-made 1 2(b)(ii) Examples 2 Mostly / sites 2–7 / 6 attractions in the south (1) Clustered / close together / linear (1) One / Singapore Zoo in the north / 10km from others / NW of others (1) One / Sentosa Theme Park / 7 on a (separate) island / 5km from others / south of others / (1) Close to coast (1) (1 + 1) 2(c)(i) Examples 2 Students only want to ask visitors / to see if visitors / questionnaire is only for visitors / not all people will be visitors / make sure not locals(1) Not waste people’s time / if locals no need to ask rest of questions (1) If they include locals or not a visitor will be unreliable / contain wrong information / inaccurate / irrelevant / false (1) (1 + 1) 2(c)(ii) Examples 2 Description is not systematic sampling / is random sampling (1) Should sample by asking every 10th person / every nth person / regular or fixed or set pattern (1) (1 + 1) 2(c)(iii) Hypothesis Question(s) to provide 2 information Most visitors to Singapore are 2 over the age of 50. Shopping is the main reason why 5 people come to Singapore. Most visitors stop in Singapore on 6 their journey to another destination. There is a positive relationship 3 and 4 between the distance people travel to Singapore and the length of their visit. 4 rows correct = 2 marks (two ticks) Any 1, 2 or 3 rows correct = 1 mark (one tick) (1 + 1) 2(d)(i) Pie graph completion; must be clockwise in key order. 2 Restaurants = 5% (At 89% / 320°) & Other = 11%. 1 mark for dividing line at 89%. Look for clear gap 89%/90%. 1 mark for correct shading in order of key. (1 + 1) 2(d)(ii) Hypothesis is true – 1 mark reserve 2 Evidence Credit 1 mark for data e.g. shopping is highest / higher than others with 35% (1D). No credit if Hypothesis conclusion is false / not supported / partially If no hypothesis conclusion credit evidence (1 HA + 1 D) 2(e)(i) Plot two crosses on scatter graph 2 4000km & 7 days (1) 1100km & 8 days (1) (1 + 1) 2(e)(ii) No / Hypothesis is false – 1 mark reserve 3 Evidence No relationship / correlation (1) Credit 1 mark for paired data which shows hypothesis is false e.g. 15 700km = 2 days & 3100km = 15 days (1D Max) e.g. <6000km can be 15 days & >6000km highest only 8 days (1D Max) No credit if Hypothesis conclusion is true / partially If no hypothesis conclusion credit evidence (1 HA + 1 R + 1 D) 2(f)(i) Draw arrows pointing towards Singapore to show: 2 1 visitor from South Africa (1) 9 visitors from Australia (1) Ignore shading; arrow should start in or close to the two countries. (1 + 1) 2(f)(ii) Asia 1 2(g) Fig. 2.8: No city / airport filled in OR no answer to Q3 OR forgot to ask / 3 answer the question (1) Fig. 2.9: 3 reasons / too many reasons filled in / >1 box ticked / multiple reasons (1) Fig. 2.10: USA is not a city / airport OR USA is a country (1) (1 + 1 + 1) Total marks 30
What was in this paper
The subtopics covered by these 2 questions, and how many questions each got. Open one in a new tab to see every Cambridge question on it.
What you needed in this session
Cambridge’s own grade thresholds for 2021 May/June, Paper 4 · Variant 2. A higher threshold means an easier paper — the bar moves with how the cohort did.