Cambridge IGCSE Geography (9-1) 0976 — 2020 May/June Paper 4 · Variant 2
0976/42/M/J/20 · 2 questions · 44 marks · ≈50 min
The question paper and its mark scheme, free to read here and free to download. This is Cambridge’s own paper, exactly as it was sat.
Question paper16 pages



Mark scheme7 pages
Answers below. Sit the paper first if you are practising.
Questions as text
Q1 · Charity workers were doing research into differences in the health of families in…
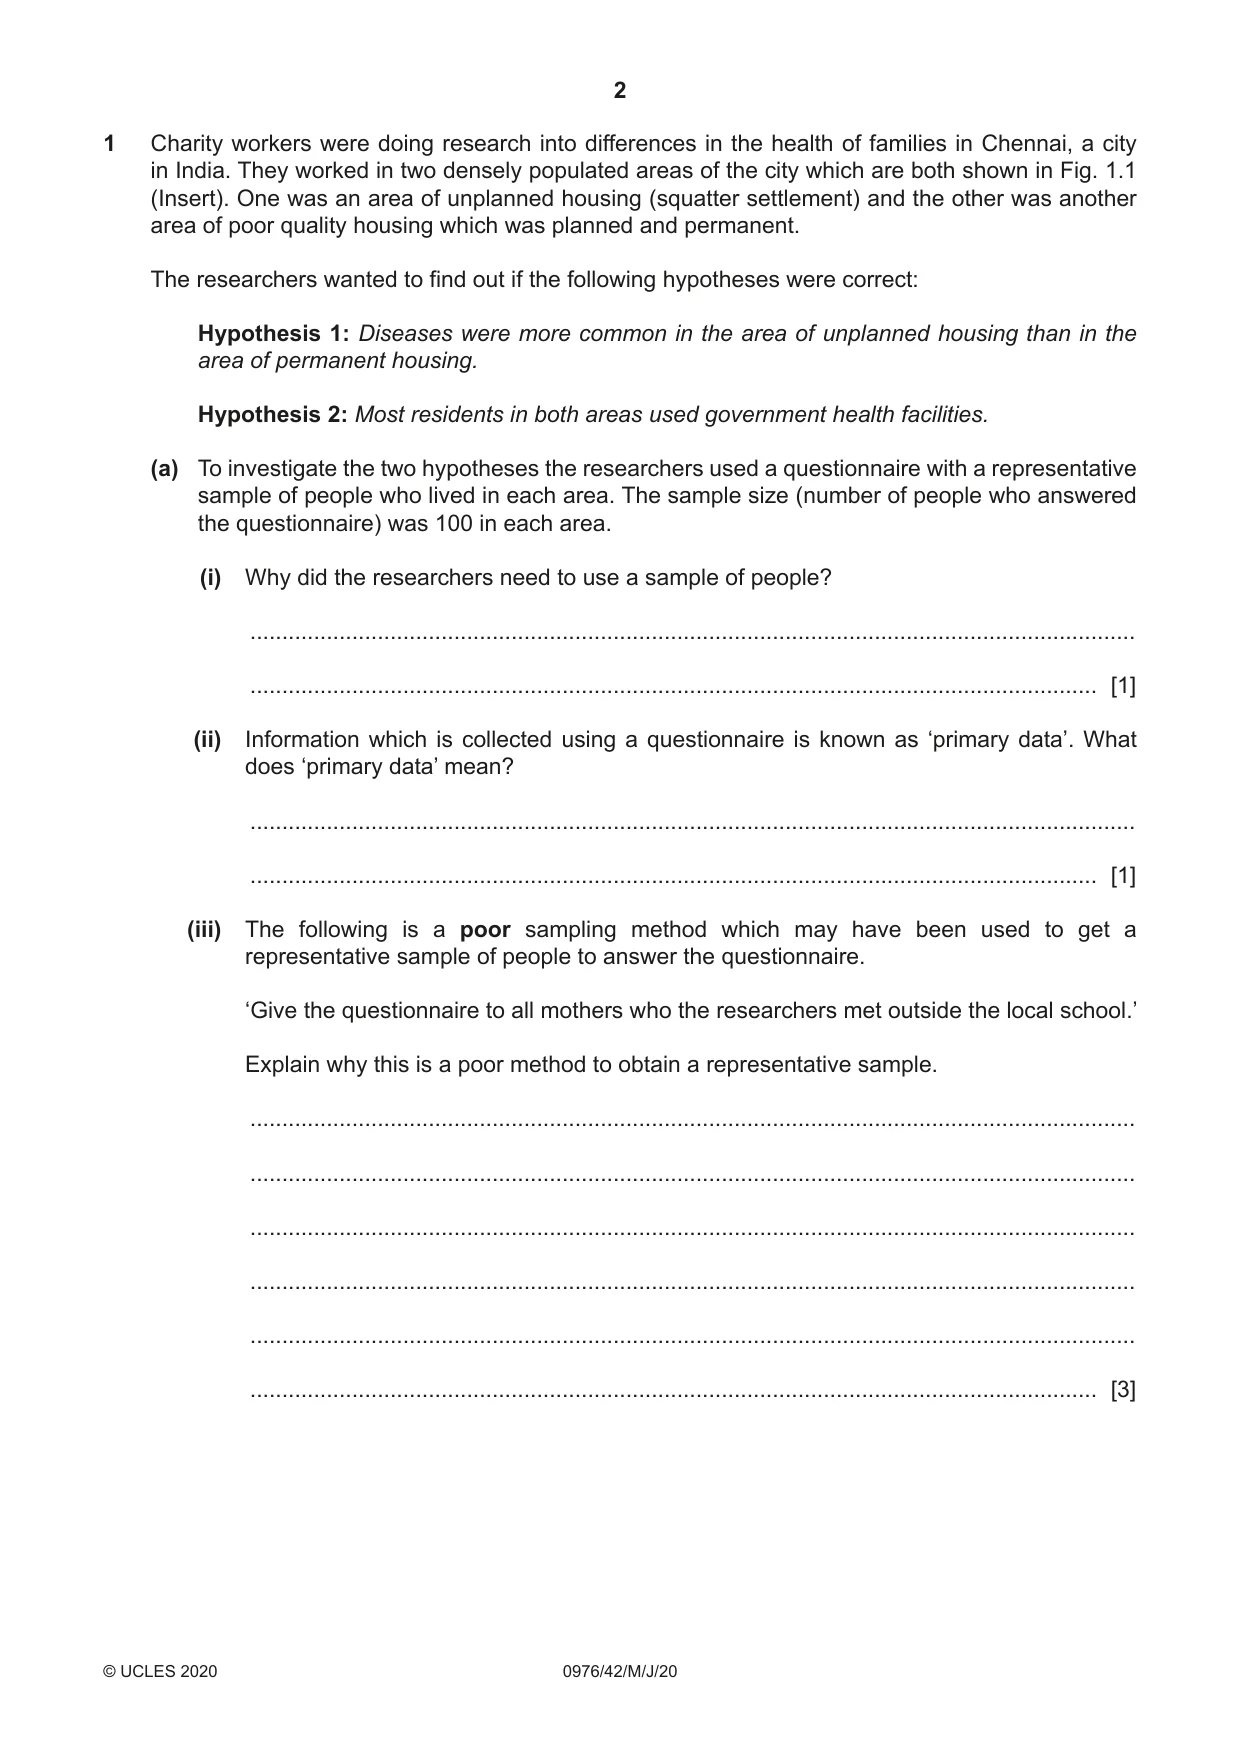
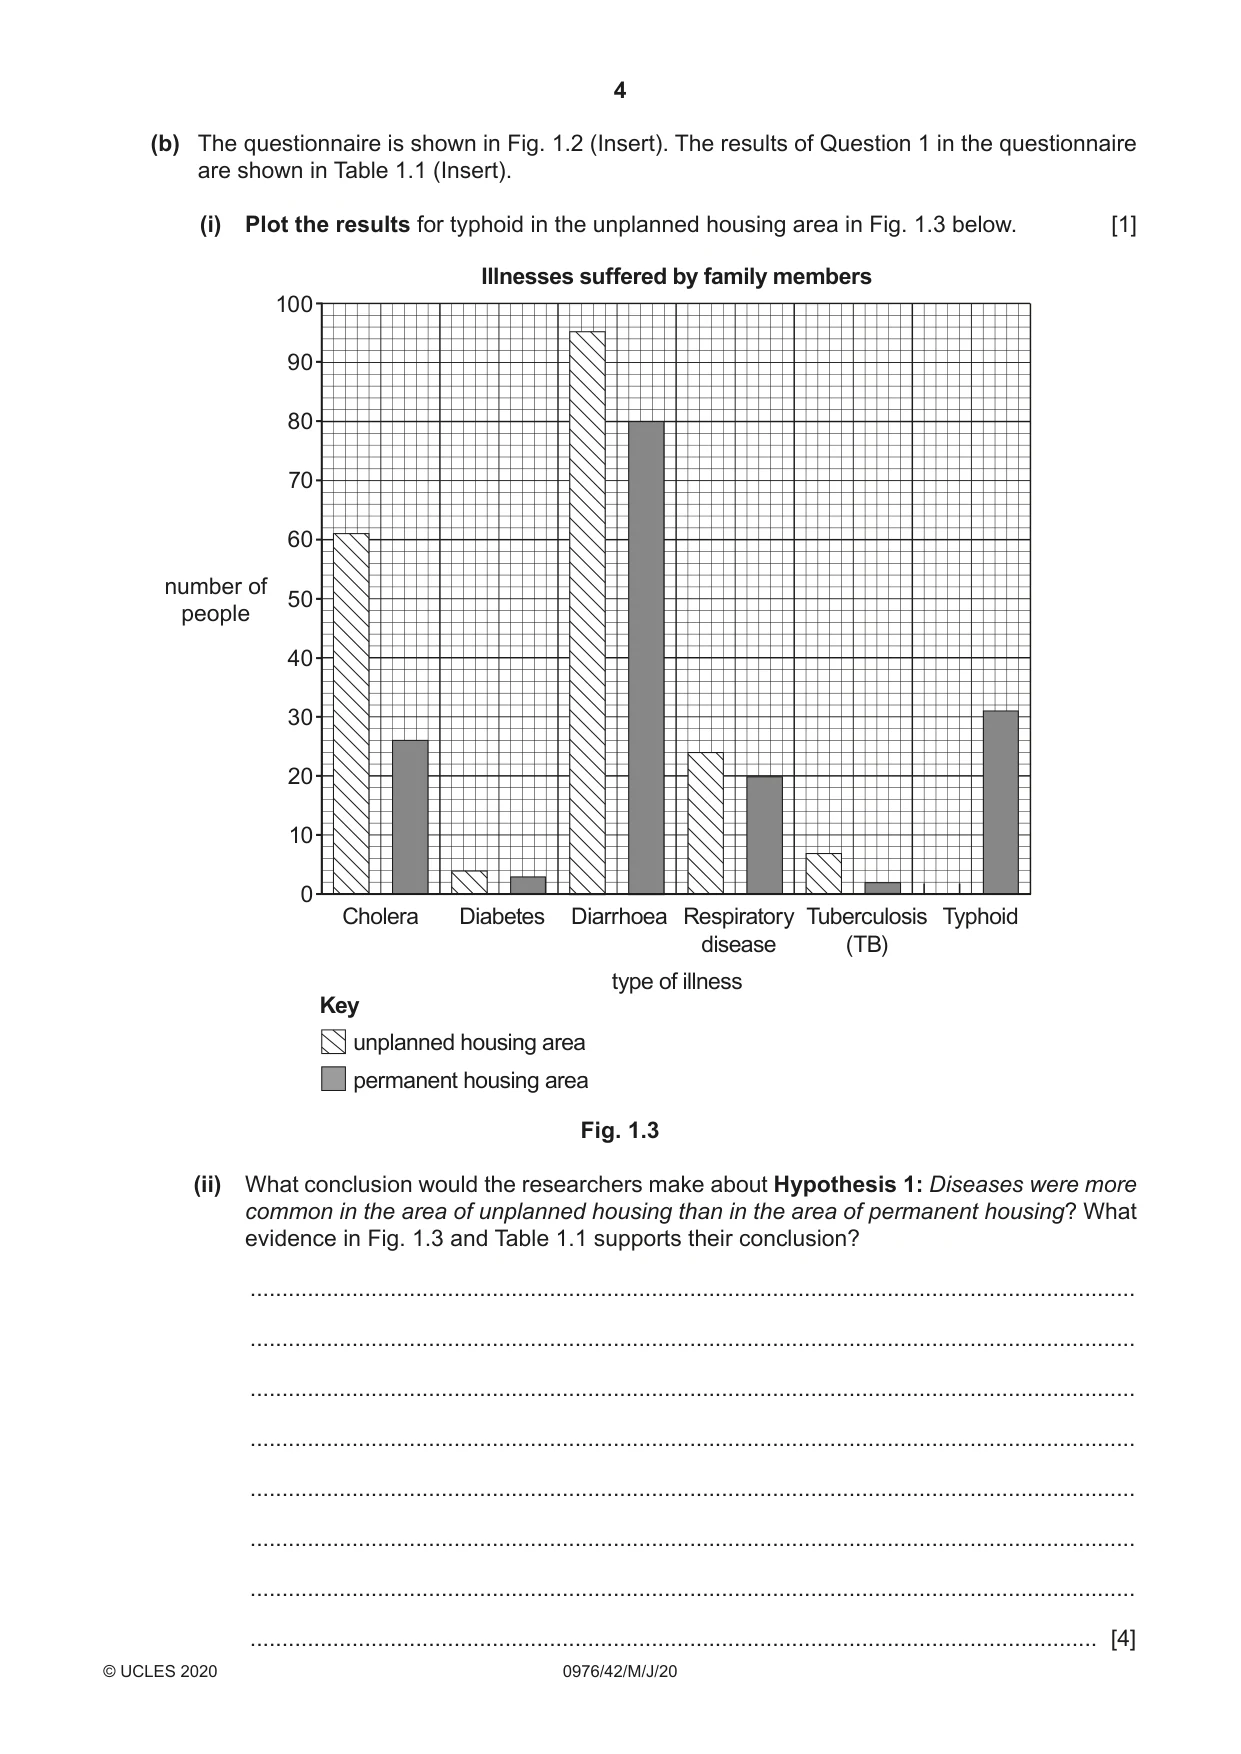
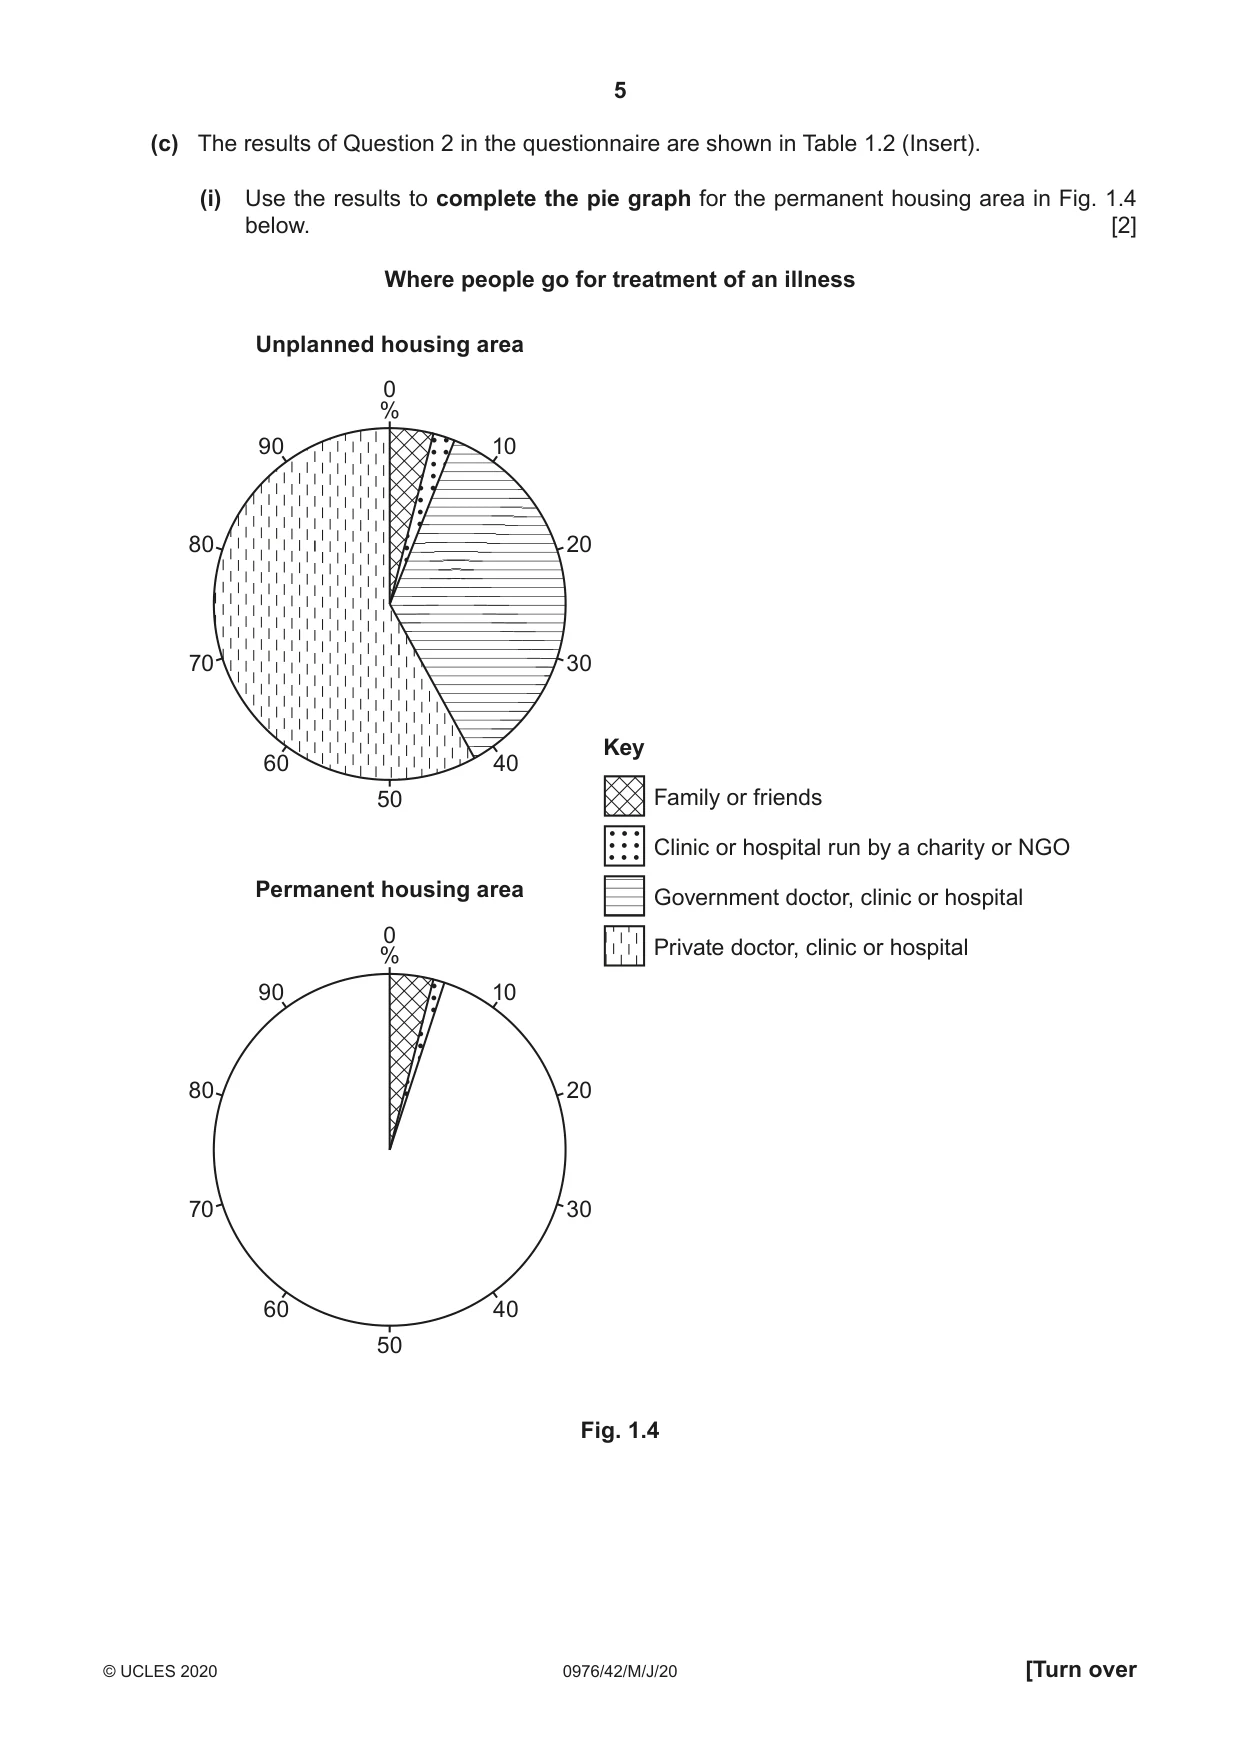
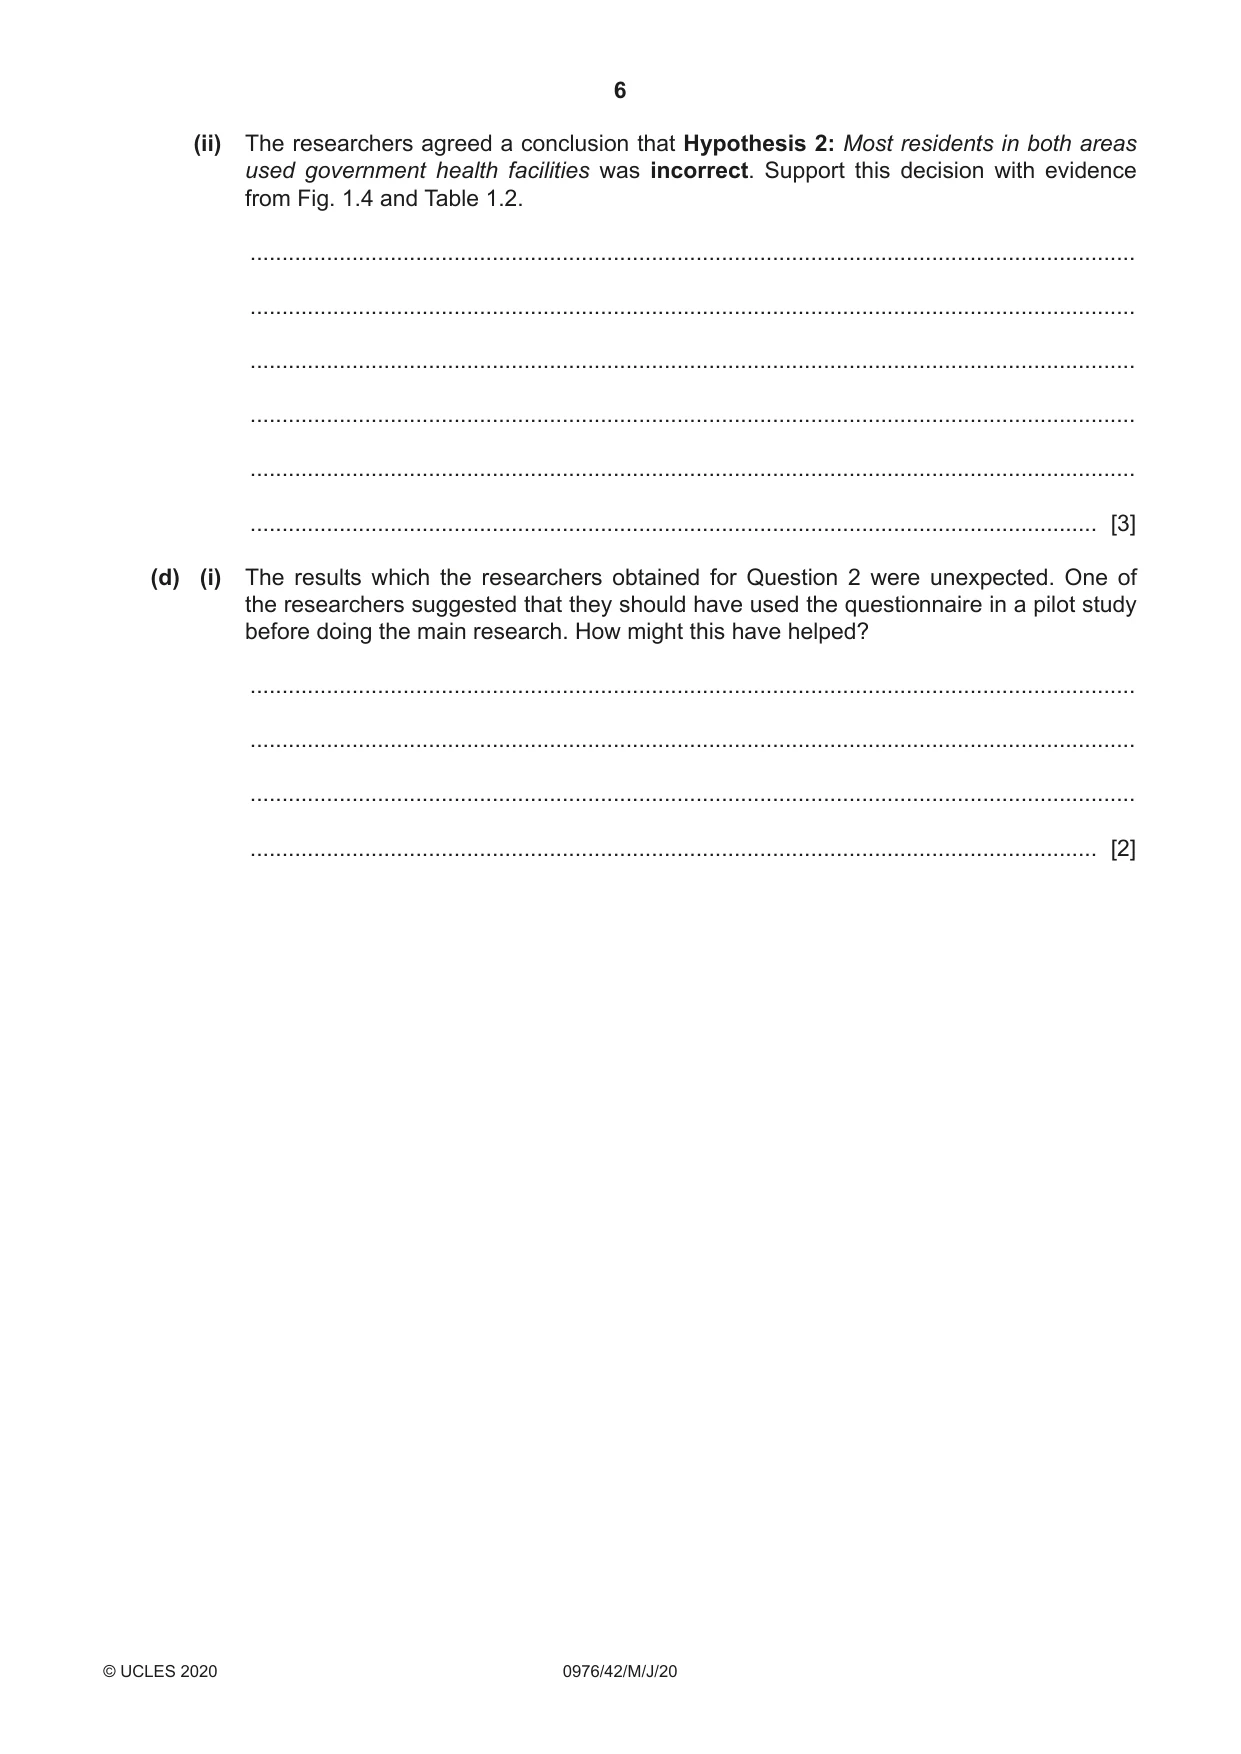
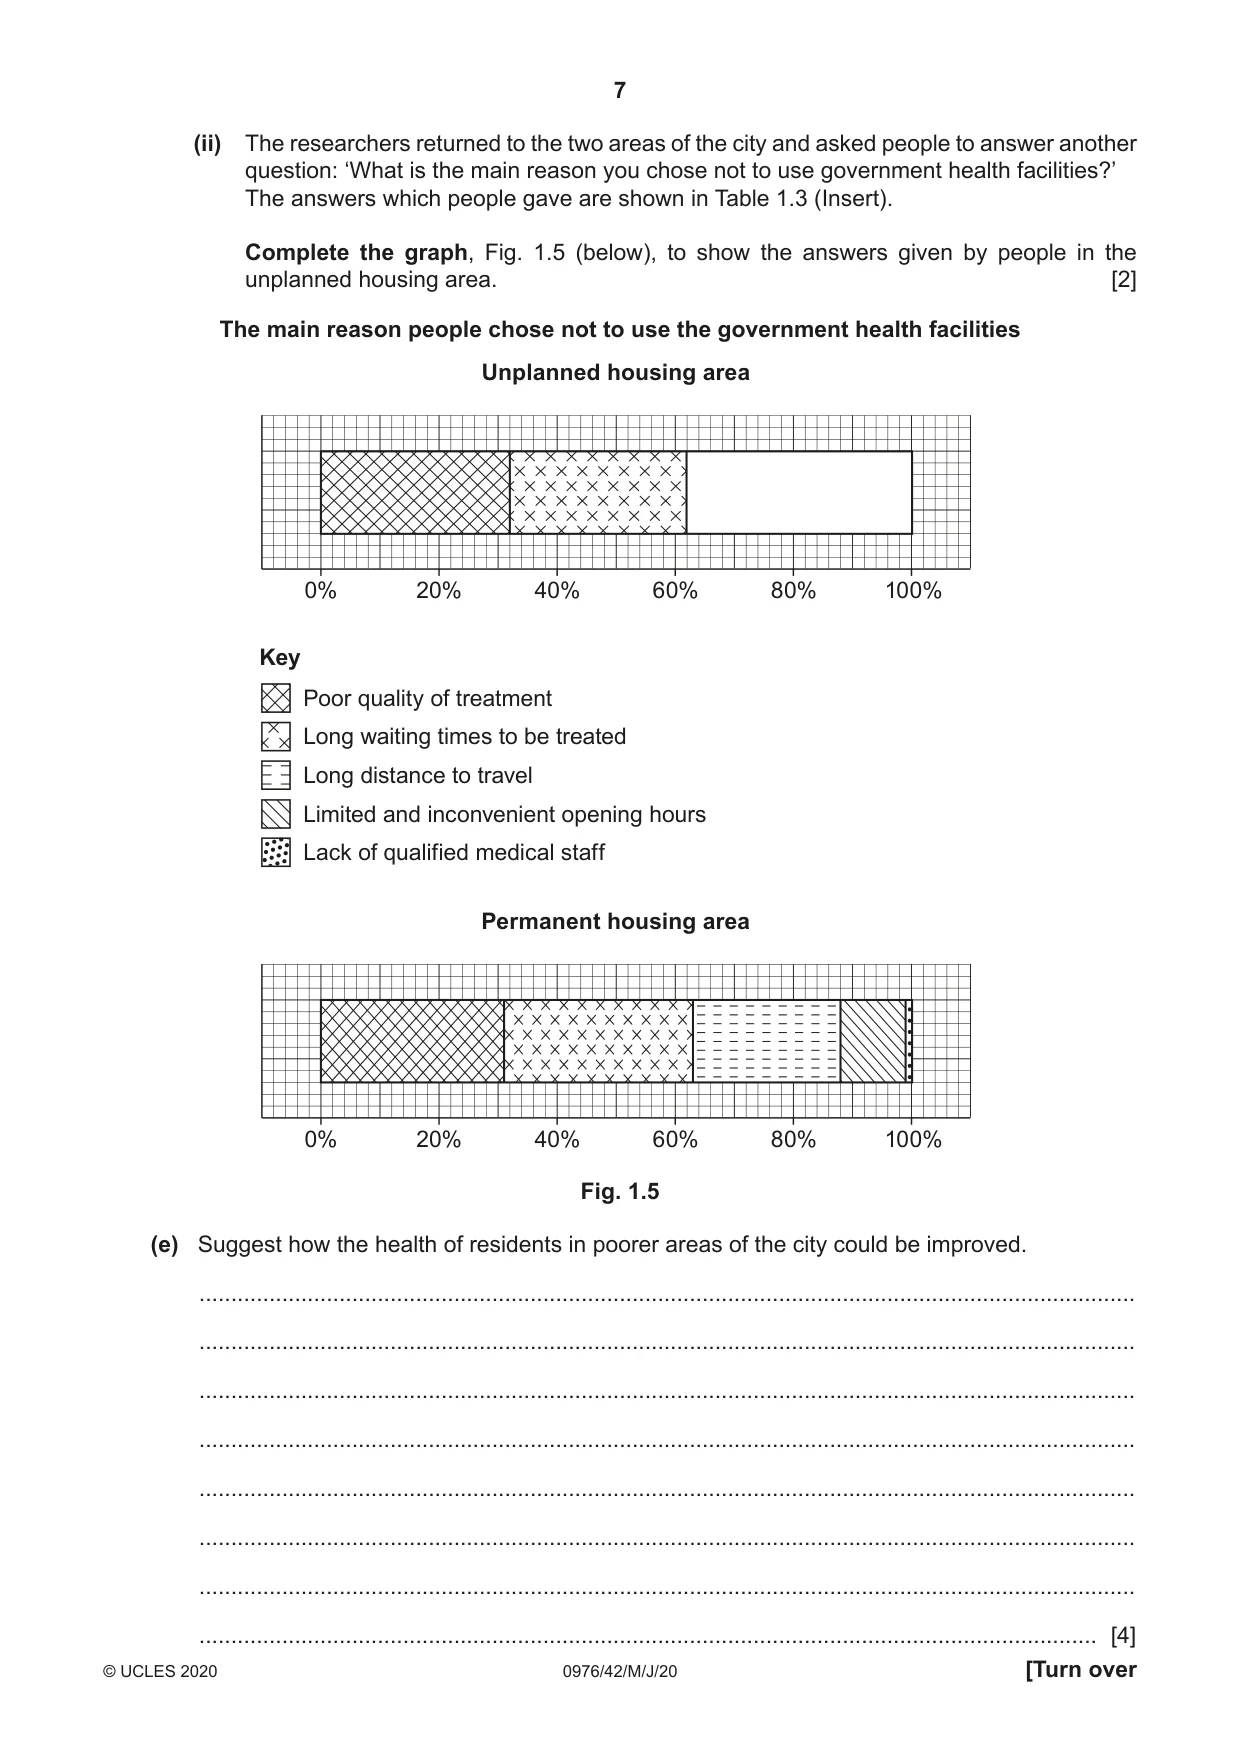
1 Charity workers were doing research into differences in the health of families in Chennai, a city in India. They worked in two densely populated areas of the city which are both shown in Fig. 1.1 (Insert). One was an area of unplanned housing (squatter settlement) and the other was another area of poor quality housing which was planned and permanent. The researchers wanted to find out if the following hypotheses were correct: Hypothesis 1: Diseases were more common in the area of unplanned housing than in the area of permanent housing. Hypothesis 2: Most residents in both areas used government health facilities. (a) To investigate the two hypotheses the researchers used a questionnaire with a representative sample of people who lived in each area. The sample size (number of people who answered the questionnaire) was 100 in each area. (i) Why did the researchers need to use a sample of people? ........................................................................................................................................... ..................................................................................................................................... [1] (ii) Information which is collected using a questionnaire is known as ‘primary data’. What does ‘primary data’ mean? ........................................................................................................................................... ..................................................................................................................................... [1] (iii) The following is a poor sampling method which may have been used to get a representative sample of people to answer the questionnaire. ‘Give the questionnaire to all mothers who the researchers met outside the local school.’ Explain why this is a poor method to obtain a representative sample. ........................................................................................................................................... ........................................................................................................................................... ........................................................................................................................................... ........................................................................................................................................... ........................................................................................................................................... ..................................................................................................................................... [3] (iv) Describe a good sampling method which the researchers could use to choose a representative sample of people to answer the questionnaire. Explain why this would be a good method to use. ........................................................................................................................................... ........................................................................................................................................... ........................................................................................................................................... ........................................................................................................................................... ........................................................................................................................................... ..................................................................................................................................... [3] (b) The questionnaire is shown in Fig. 1.2 (Insert). The results of Question 1 in the questionnaire are shown in Table 1.1 (Insert). (i) Plot the results for typhoid in the unplanned housing area in Fig. 1.3 below. [1] Illnesses suffered by family members 100 90 80 70 60 number of 50 people 40 30 20 10 0 Cholera Diabetes Diarrhoea Respiratory Tuberculosis Typhoid disease (TB) type of illness Key unplanned housing area permanent housing area Fig. 1.3 (ii) What conclusion would the researchers make about Hypothesis 1: Diseases were more common in the area of unplanned housing than in the area of permanent housing? What evidence in Fig. 1.3 and Table 1.1 supports their conclusion? ........................................................................................................................................... ........................................................................................................................................... ........................................................................................................................................... ........................................................................................................................................... ........................................................................................................................................... ........................................................................................................................................... ........................................................................................................................................... ..................................................................................................................................... [4] (c) The results of Question 2 in the questionnaire are shown in Table 1.2 (Insert). (i) Use the results to complete the pie graph for the permanent housing area in Fig. 1.4 below. [2] Where people go for treatment of an illness Unplanned housing area 0 % 90 10 80 20 70 30 Key 60 40 50 Family or friends Clinic or hospital run by a charity or NGO Permanent housing area Government doctor, clinic or hospital 0 Private doctor, clinic or hospital % 90 10 80 20 70 30 60 40 50 Fig. 1.4 (ii) The researchers agreed a conclusion that Hypothesis 2: Most residents in both areas used government health facilities was incorrect. Support this decision with evidence from Fig. 1.4 and Table 1.2. ........................................................................................................................................... ........................................................................................................................................... ........................................................................................................................................... ........................................................................................................................................... ........................................................................................................................................... ..................................................................................................................................... [3] (d) (i) The results which the researchers obtained for Question 2 were unexpected. One of the researchers suggested that they should have used the questionnaire in a pilot study before doing the main research. How might this have helped? ........................................................................................................................................... ........................................................................................................................................... ........................................................................................................................................... ..................................................................................................................................... [2] (ii) The researchers returned to the two areas of the city and asked people to answer another question: ‘What is the main reason you chose not to use government health facilities?’ The answers which people gave are shown in Table 1.3 (Insert). Complete the graph, Fig. 1.5 (below), to show the answers given by people in the unplanned housing area. [2] The main reason people chose not to use the government health facilities Unplanned housing area 0% 20% 40% 60% 80% 100% Key Poor quality of treatment Long waiting times to be treated Long distance to travel Limited and inconvenient opening hours Lack of qualified medical staff Permanent housing area 0% 20% 40% 60% 80% 100% Fig. 1.5 (e) Suggest how the health of residents in poorer areas of the city could be improved. ................................................................................................................................................... ................................................................................................................................................... ................................................................................................................................................... ................................................................................................................................................... ................................................................................................................................................... ................................................................................................................................................... ................................................................................................................................................... ............................................................................................................................................. [4] (f) The researchers wanted to extend their study by investigating housing conditions in the two areas. Describe how they could collect information about housing conditions. Do not include a questionnaire in your answer. ................................................................................................................................................... ................................................................................................................................................... ................................................................................................................................................... ................................................................................................................................................... ................................................................................................................................................... ................................................................................................................................................... ................................................................................................................................................... ............................................................................................................................................. [4] [Total: 30]
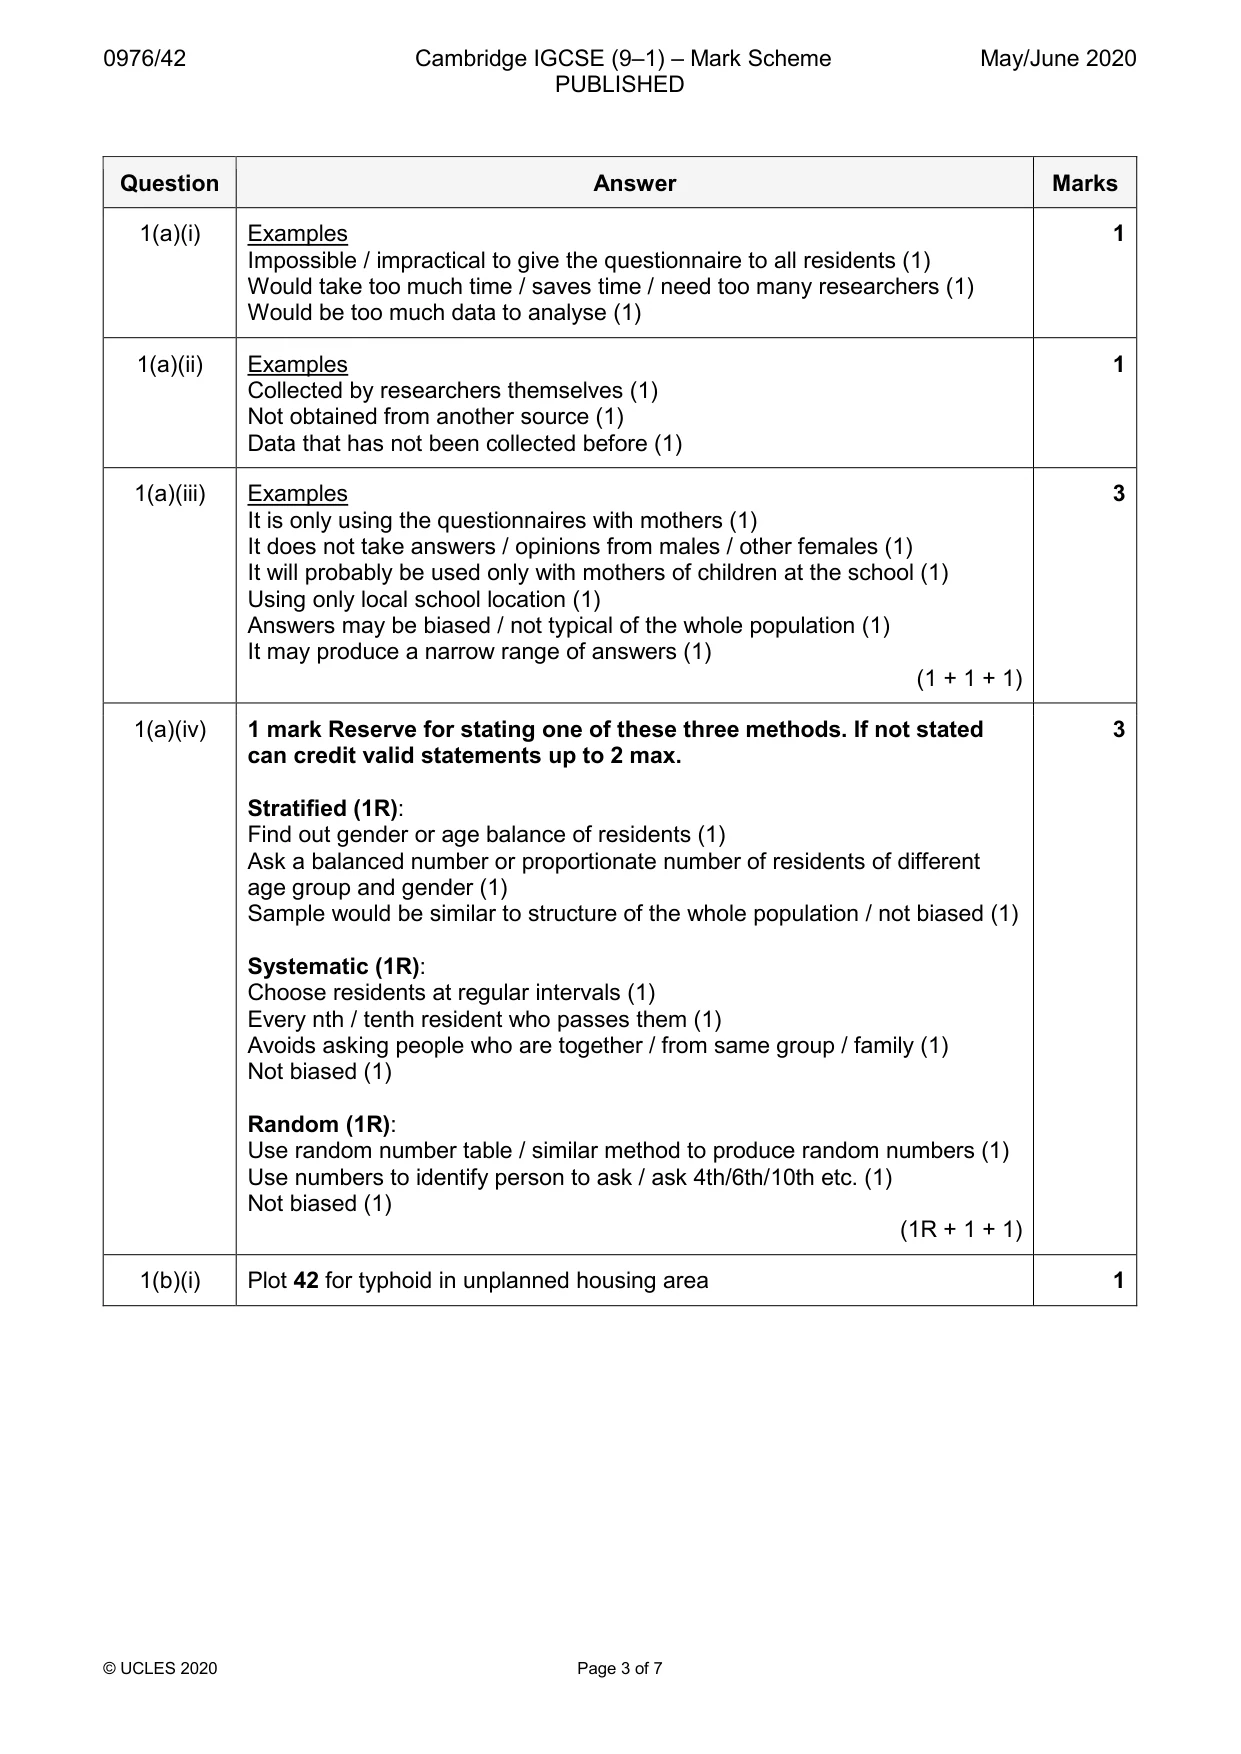
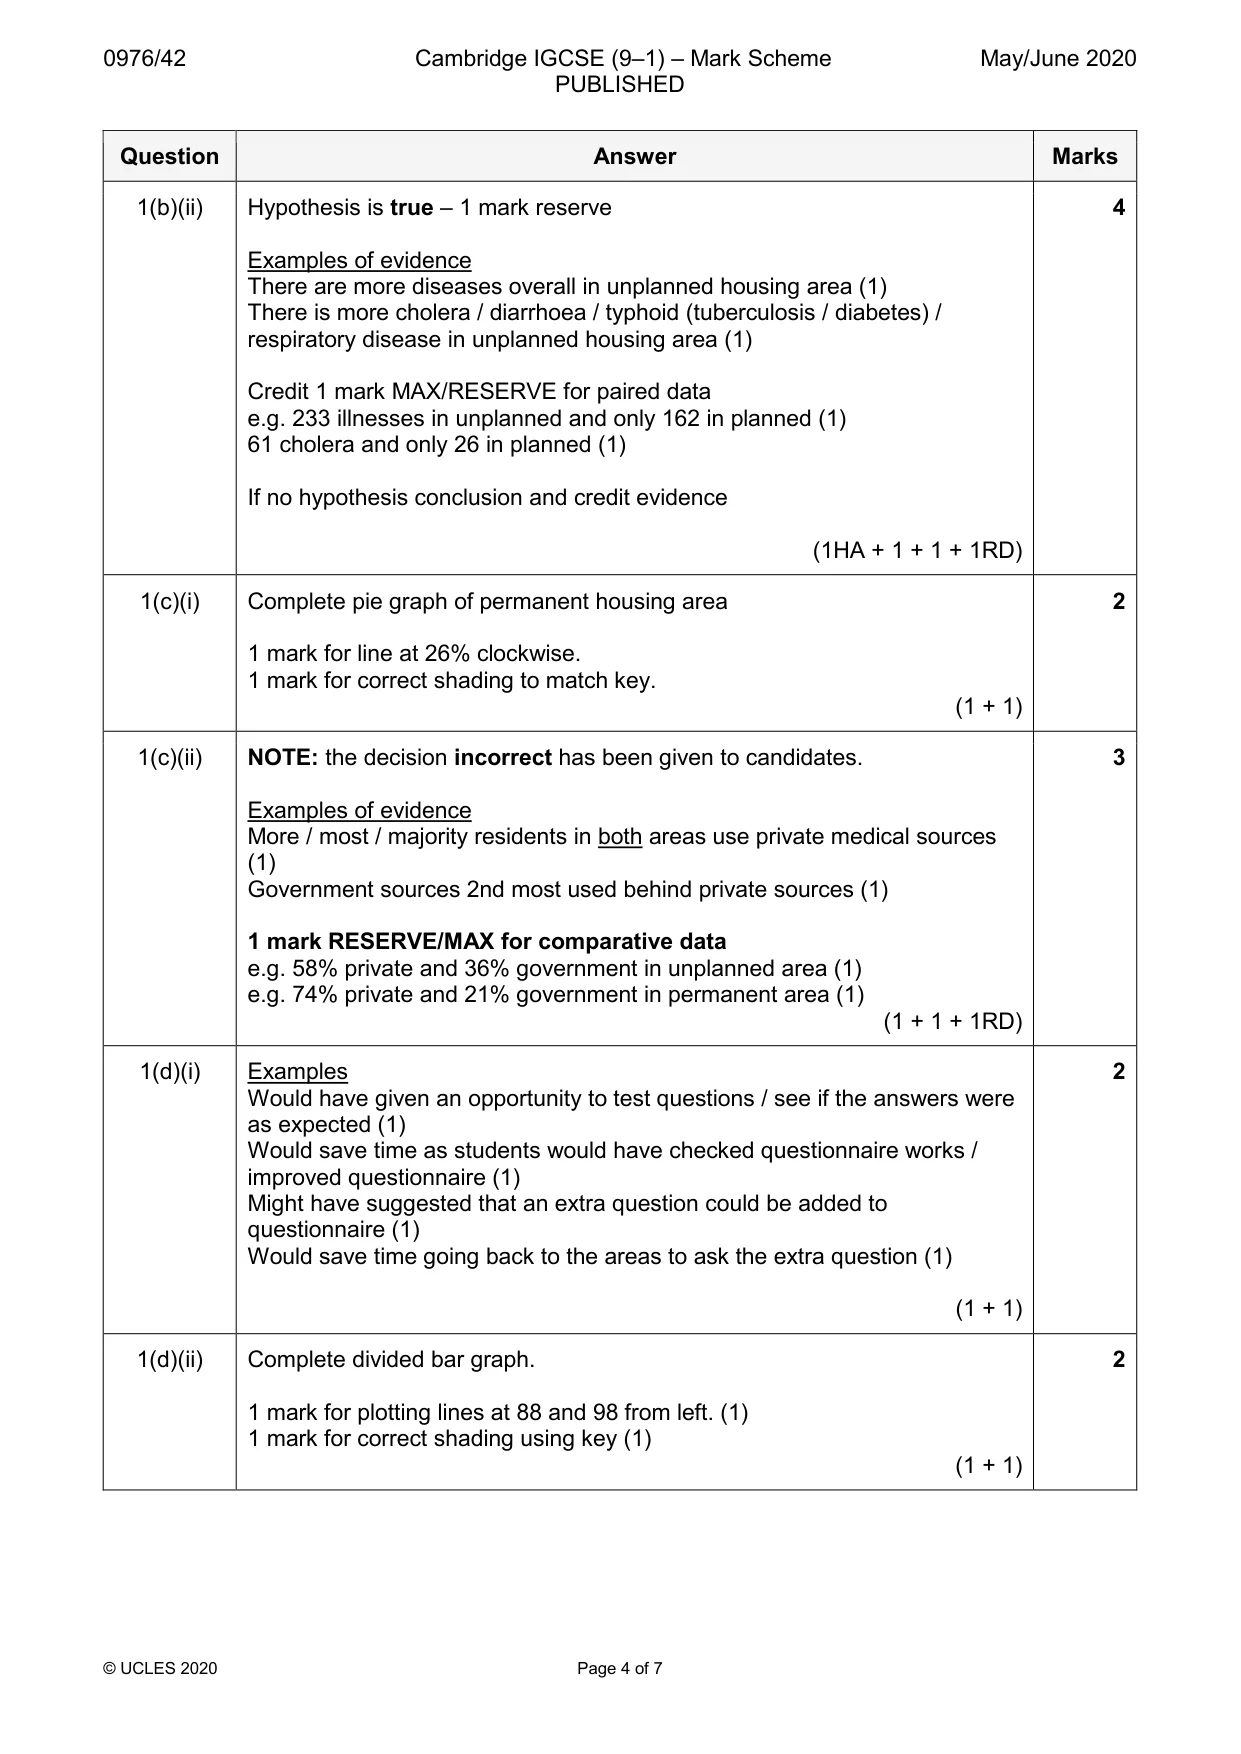
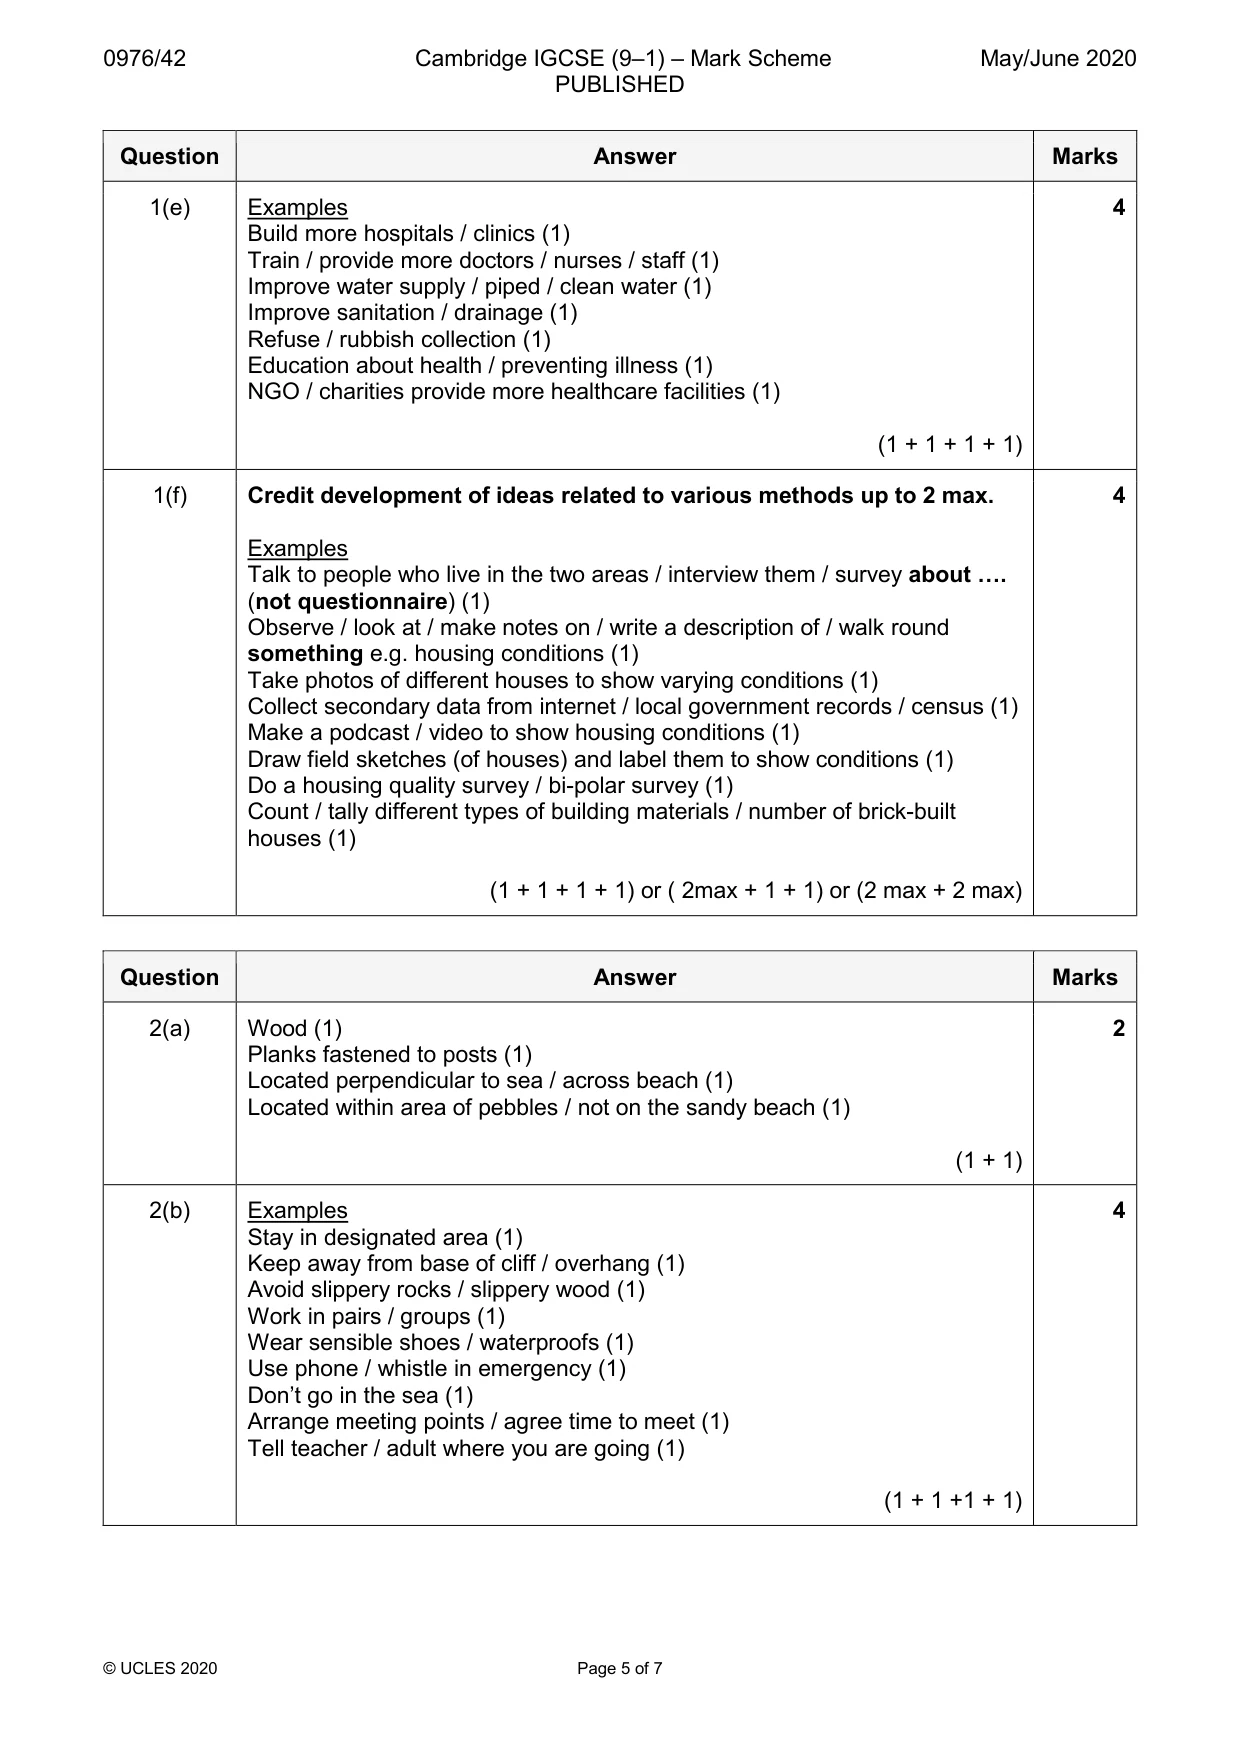
Mark scheme: Question Answer Marks 1(a)(i) Examples 1 Impossible / impractical to give the questionnaire to all residents (1) Would take too much time / saves time / need too many researchers (1) Would be too much data to analyse (1) 1(a)(ii) Examples 1 Collected by researchers themselves (1) Not obtained from another source (1) Data that has not been collected before (1) 1(a)(iii) Examples 3 It is only using the questionnaires with mothers (1) It does not take answers / opinions from males / other females (1) It will probably be used only with mothers of children at the school (1) Using only local school location (1) Answers may be biased / not typical of the whole population (1) It may produce a narrow range of answers (1) (1 + 1 + 1) 1(a)(iv) 1 mark Reserve for stating one of these three methods. If not stated 3 can credit valid statements up to 2 max. Stratified (1R): Find out gender or age balance of residents (1) Ask a balanced number or proportionate number of residents of different age group and gender (1) Sample would be similar to structure of the whole population / not biased (1) Systematic (1R): Choose residents at regular intervals (1) Every nth / tenth resident who passes them (1) Avoids asking people who are together / from same group / family (1) Not biased (1) Random (1R): Use random number table / similar method to produce random numbers (1) Use numbers to identify person to ask / ask 4th/6th/10th etc. (1) Not biased (1) (1R + 1 + 1) 1(b)(i) Plot 42 for typhoid in unplanned housing area 1 1(b)(ii) Hypothesis is true – 1 mark reserve 4 Examples of evidence There are more diseases overall in unplanned housing area (1) There is more cholera / diarrhoea / typhoid (tuberculosis / diabetes) / respiratory disease in unplanned housing area (1) Credit 1 mark MAX/RESERVE for paired data e.g. 233 illnesses in unplanned and only 162 in planned (1) 61 cholera and only 26 in planned (1) If no hypothesis conclusion and credit evidence (1HA + 1 + 1 + 1RD) 1(c)(i) Complete pie graph of permanent housing area 2 1 mark for line at 26% clockwise. 1 mark for correct shading to match key. (1 + 1) 1(c)(ii) NOTE: the decision incorrect has been given to candidates. 3 Examples of evidence More / most / majority residents in both areas use private medical sources (1) Government sources 2nd most used behind private sources (1) 1 mark RESERVE/MAX for comparative data e.g. 58% private and 36% government in unplanned area (1) e.g. 74% private and 21% government in permanent area (1) (1 + 1 + 1RD) 1(d)(i) Examples 2 Would have given an opportunity to test questions / see if the answers were as expected (1) Would save time as students would have checked questionnaire works / improved questionnaire (1) Might have suggested that an extra question could be added to questionnaire (1) Would save time going back to the areas to ask the extra question (1) (1 + 1) 1(d)(ii) Complete divided bar graph. 2 1 mark for plotting lines at 88 and 98 from left. (1) 1 mark for correct shading using key (1) (1 + 1) 1(e) Examples 4 Build more hospitals / clinics (1) Train / provide more doctors / nurses / staff (1) Improve water supply / piped / clean water (1) Improve sanitation / drainage (1) Refuse / rubbish collection (1) Education about health / preventing illness (1) NGO / charities provide more healthcare facilities (1) (1 + 1 + 1 + 1) 1(f) Credit development of ideas related to various methods up to 2 max. 4 Examples Talk to people who live in the two areas / interview them / survey about …. (not questionnaire) (1) Observe / look at / make notes on / write a description of / walk round something e.g. housing conditions (1) Take photos of different houses to show varying conditions (1) Collect secondary data from internet / local government records / census (1) Make a podcast / video to show housing conditions (1) Draw field sketches (of houses) and label them to show conditions (1) Do a housing quality survey / bi-polar survey (1) Count / tally different types of building materials / number of brick-built houses (1) (1 + 1 + 1 + 1) or ( 2max + 1 + 1) or (2 max + 2 max)
Q2 · Students were planning fieldwork on a local pebble beach
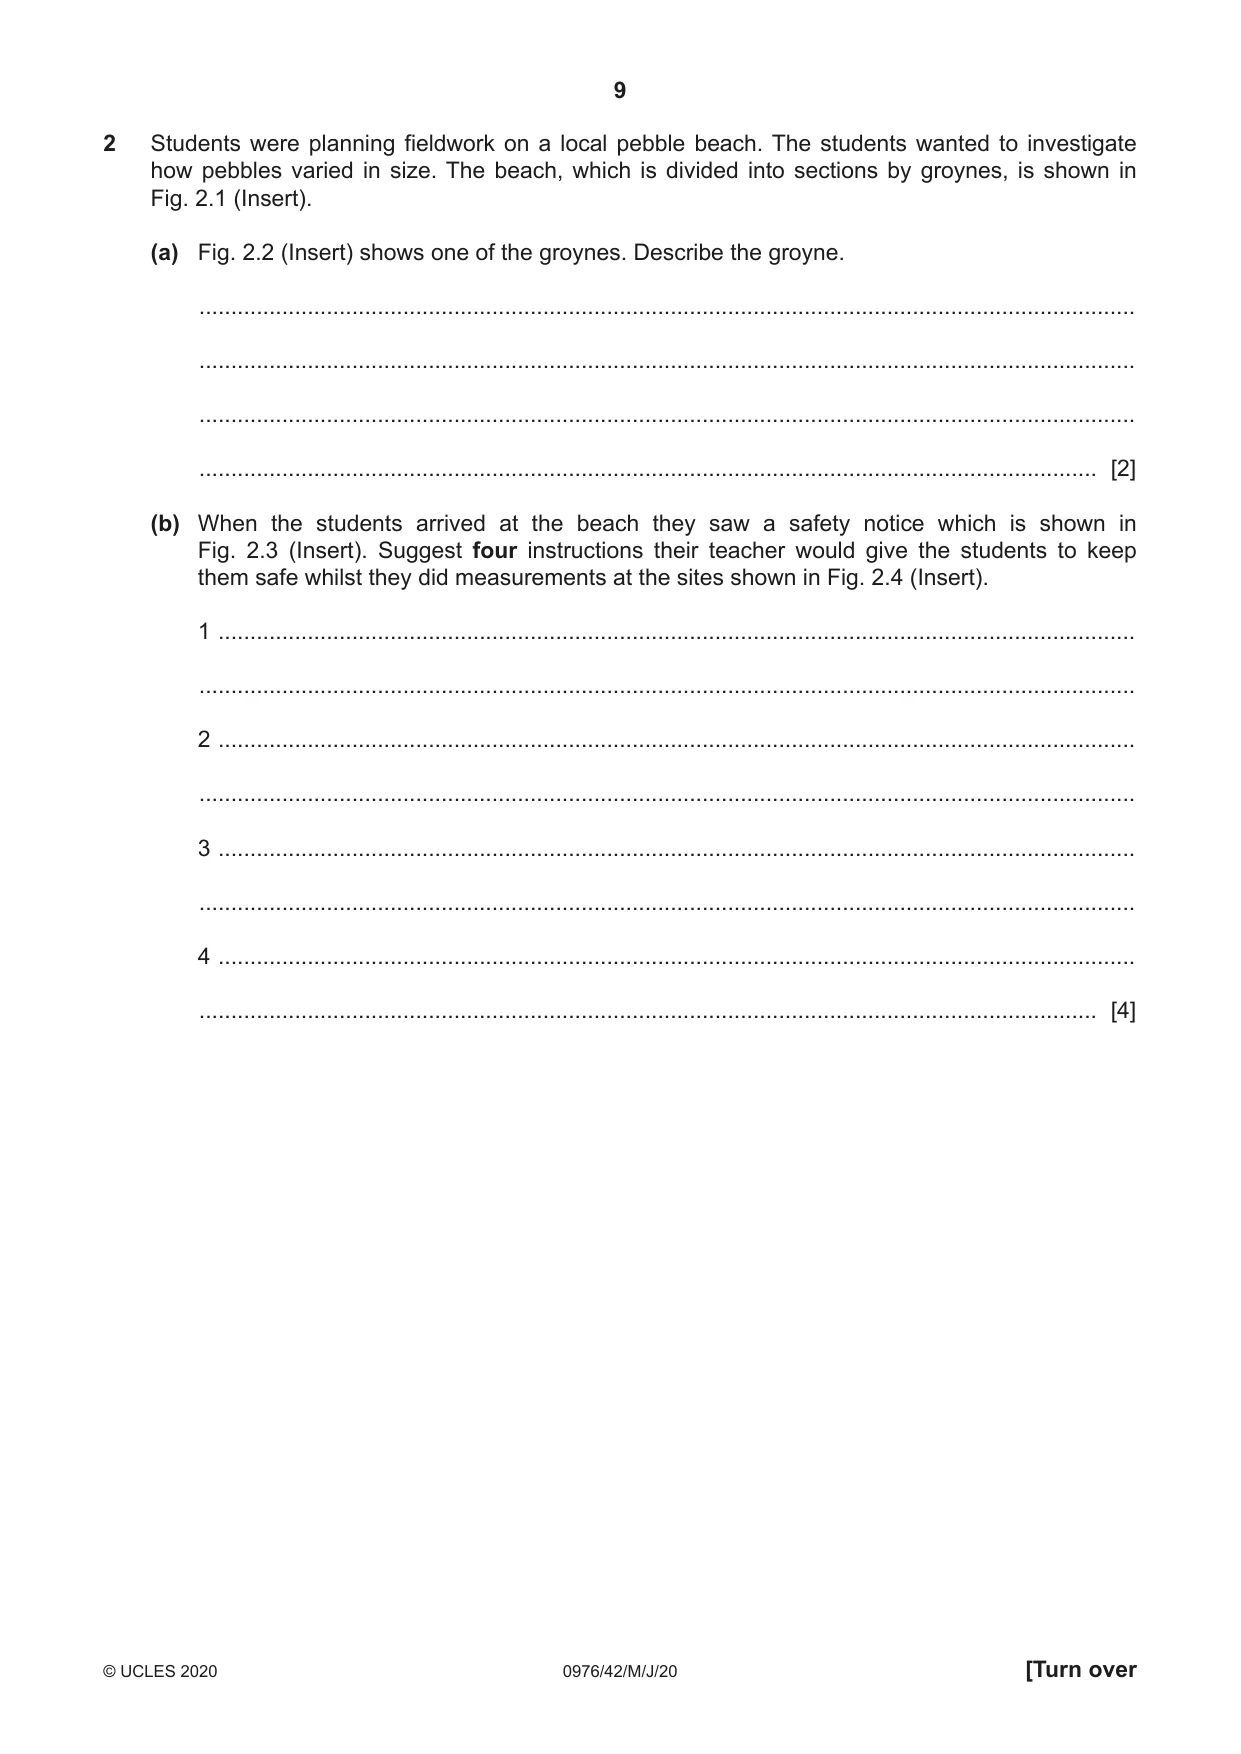
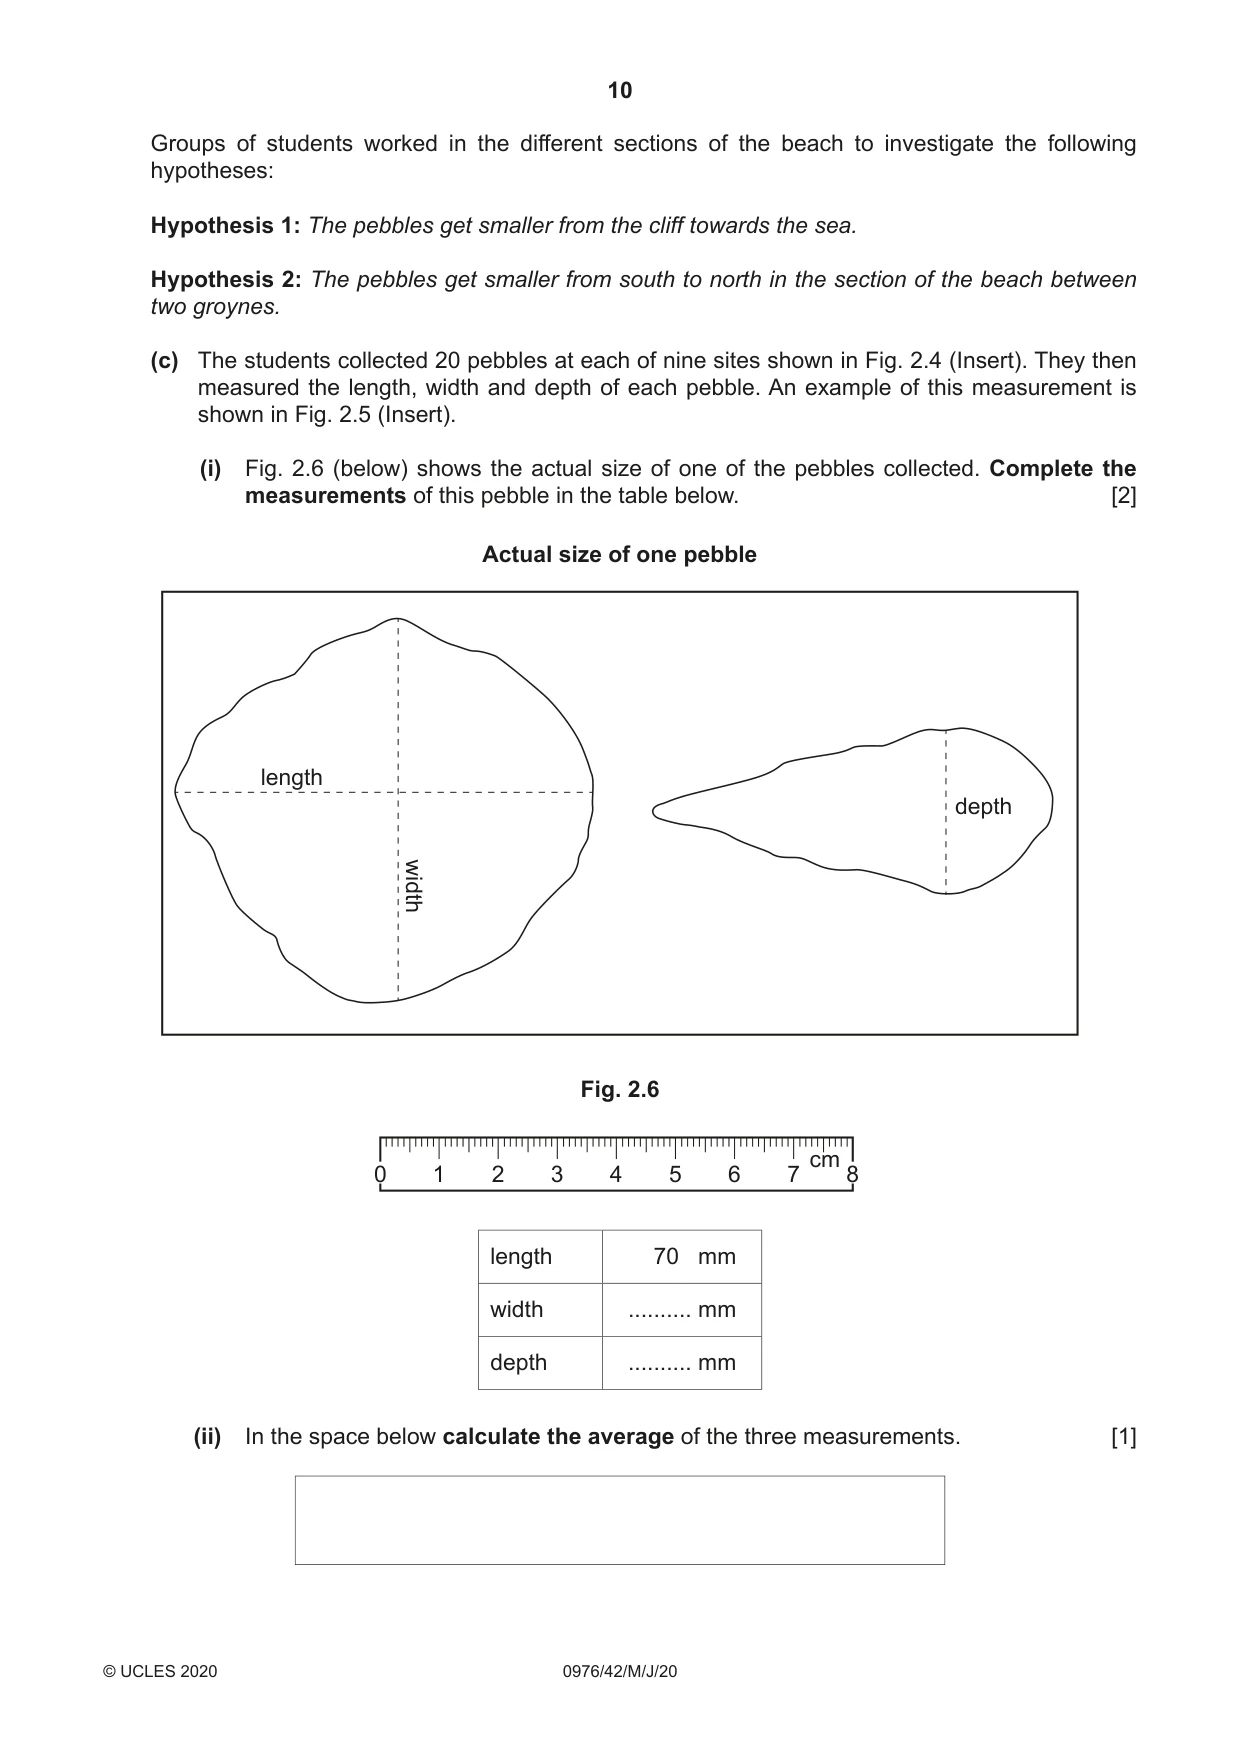
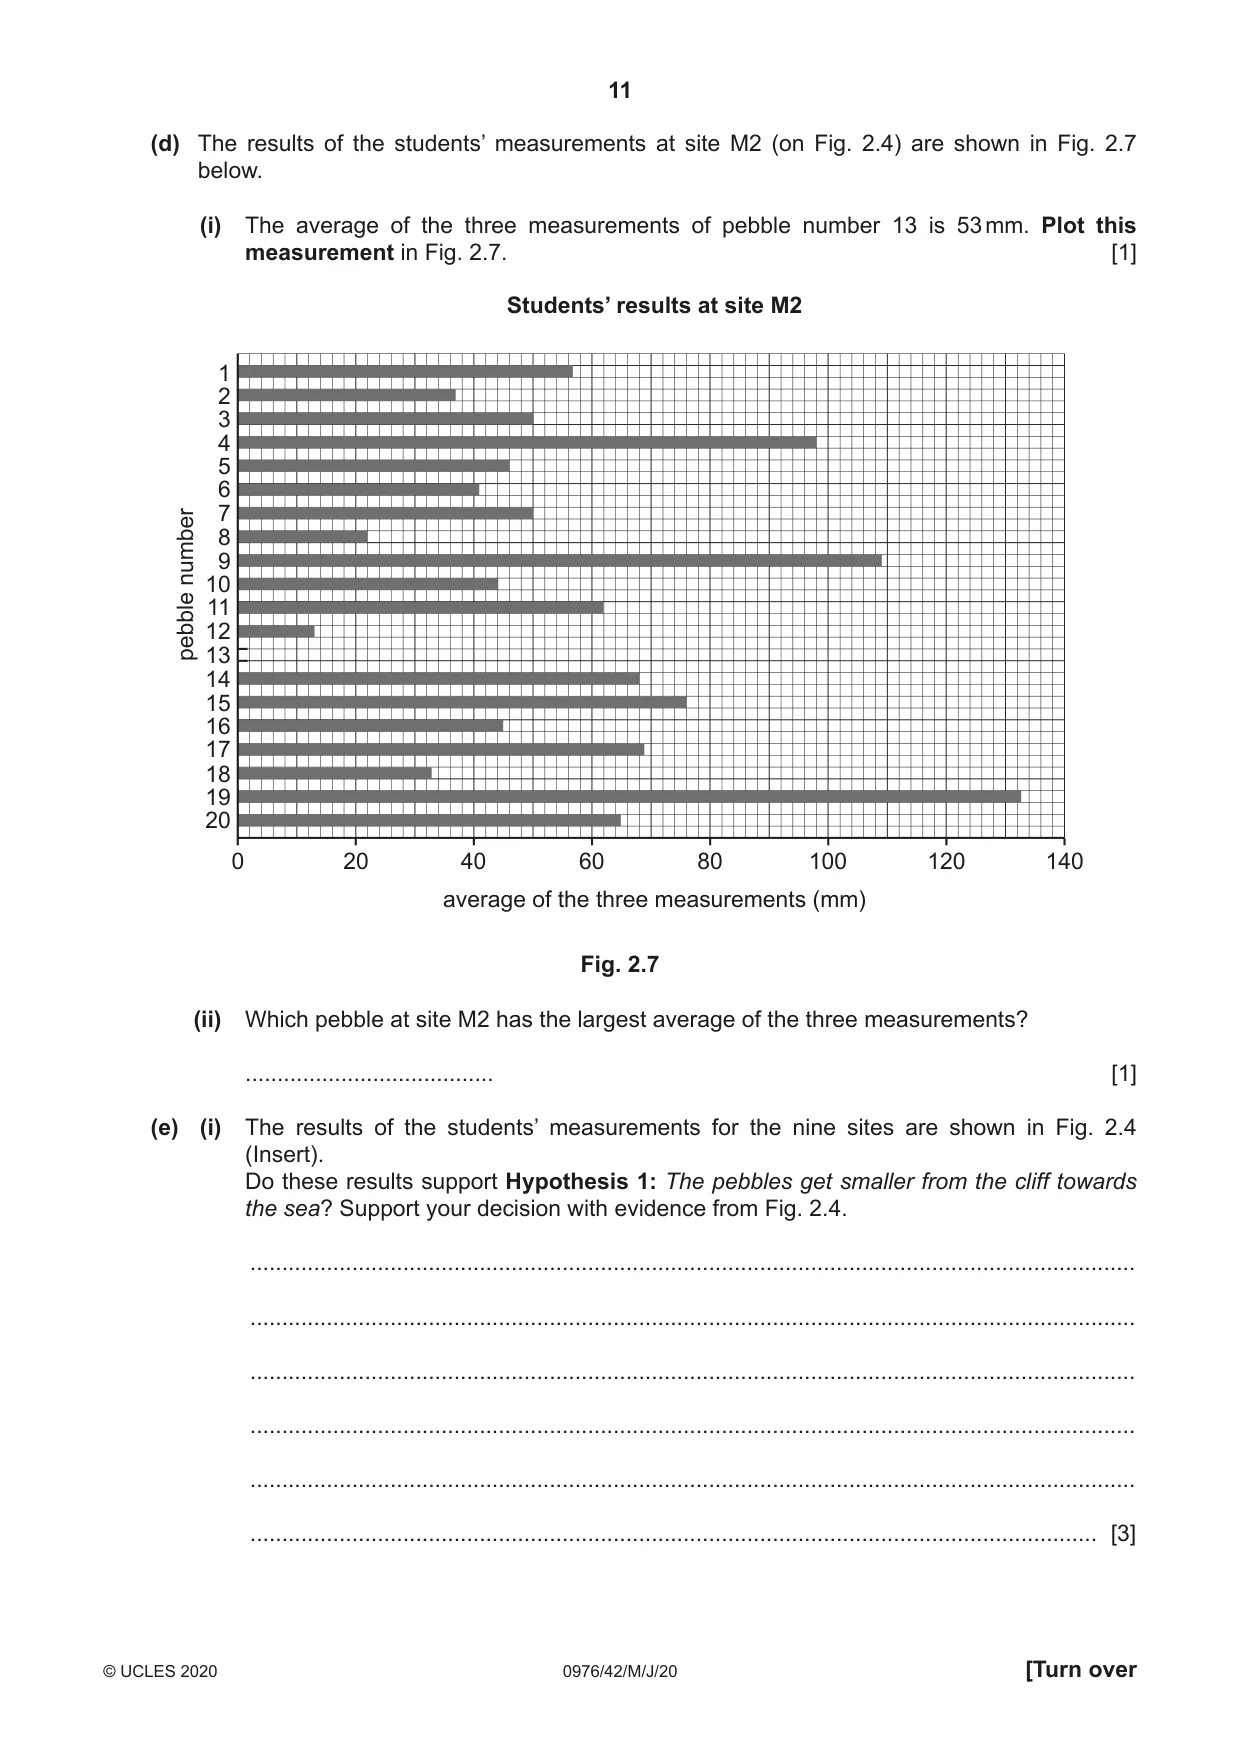
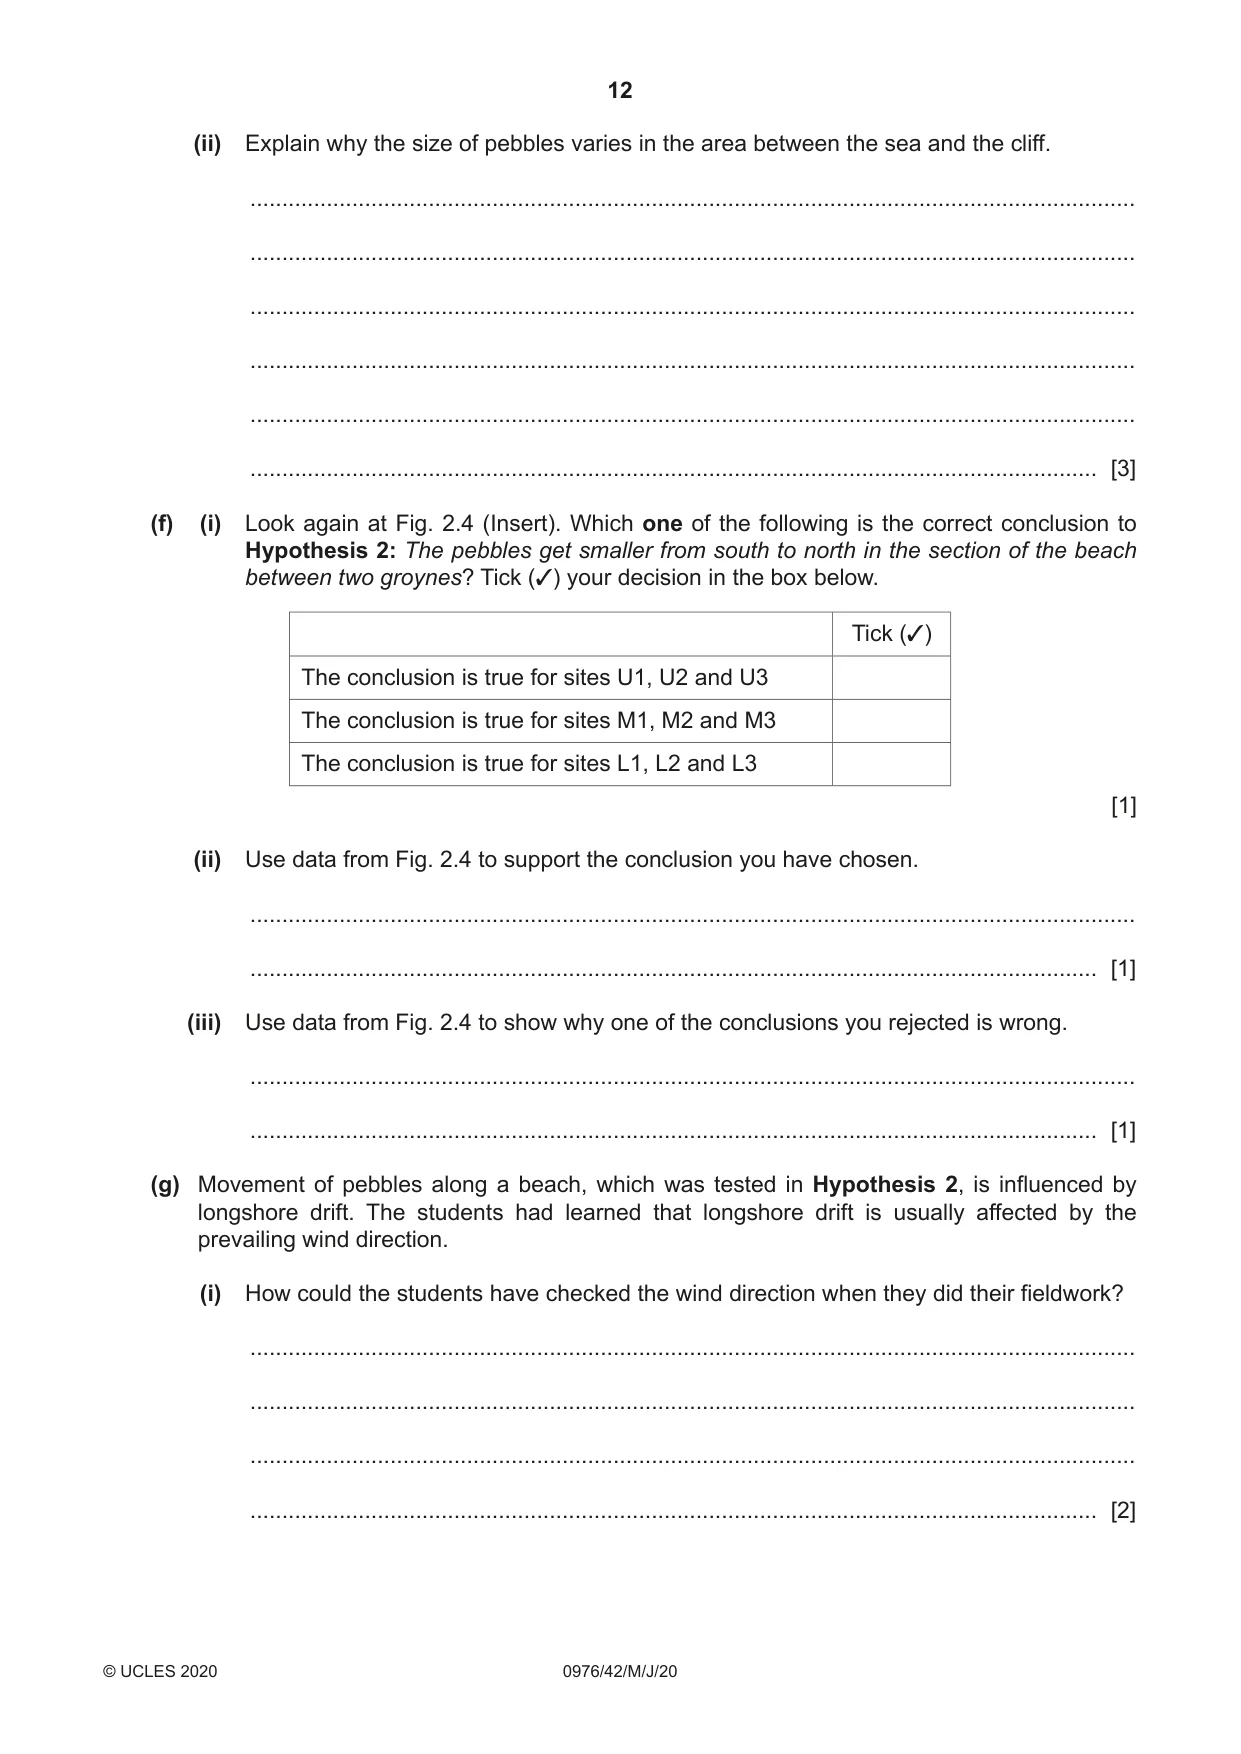
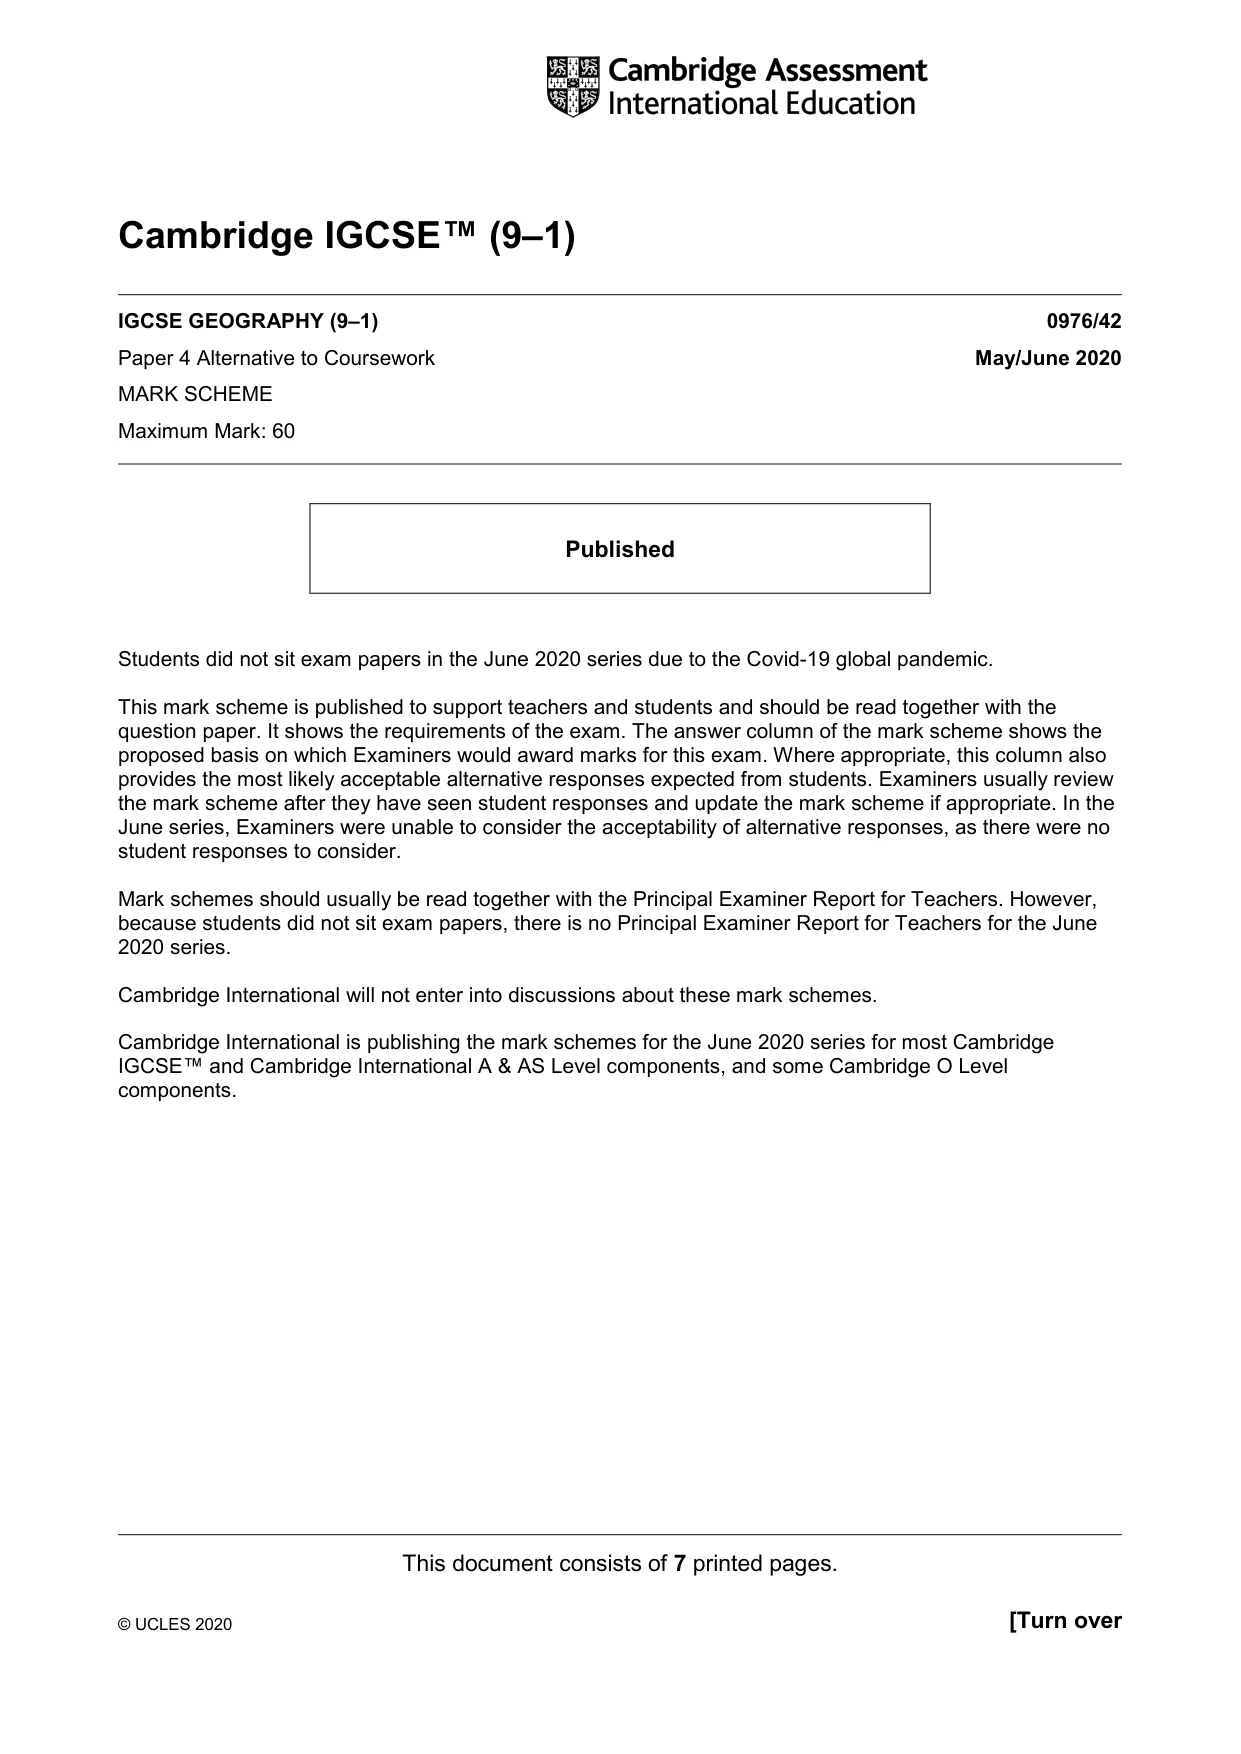
2 Students were planning fieldwork on a local pebble beach. The students wanted to investigate how pebbles varied in size. The beach, which is divided into sections by groynes, is shown in Fig. 2.1 (Insert). (a) Fig. 2.2 (Insert) shows one of the groynes. Describe the groyne. ................................................................................................................................................... ................................................................................................................................................... ................................................................................................................................................... ............................................................................................................................................. [2] (b) When the students arrived at the beach they saw a safety notice which is shown in Fig. 2.3 (Insert). Suggest four instructions their teacher would give the students to keep them safe whilst they did measurements at the sites shown in Fig. 2.4 (Insert). 1 ................................................................................................................................................ ................................................................................................................................................... 2 ................................................................................................................................................ ................................................................................................................................................... 3 ................................................................................................................................................ ................................................................................................................................................... 4 ................................................................................................................................................ ............................................................................................................................................. [4] Groups of students worked in the different sections of the beach to investigate the following hypotheses: Hypothesis 1: The pebbles get smaller from the cliff towards the sea. Hypothesis 2: The pebbles get smaller from south to north in the section of the beach between two groynes. (c) The students collected 20 pebbles at each of nine sites shown in Fig. 2.4 (Insert). They then measured the length, width and depth of each pebble. An example of this measurement is shown in Fig. 2.5 (Insert). (i) Fig. 2.6 (below) shows the actual size of one of the pebbles collected. Complete the measurements of this pebble in the table below. [2] Actual size of one pebble length depth width Fig. 2.6 cm 0 1 2 3 4 5 6 7 8 length 70 mm width .......... mm depth .......... mm (ii) In the space below calculate the average of the three measurements. [1] (d) The results of the students’ measurements at site M2 (on Fig. 2.4) are shown in Fig. 2.7 below. (i) The average of the three measurements of pebble number 13 is 53 mm. Plot this measurement in Fig. 2.7. [1] Students’ results at site M2 1 2 3 4 5 6 7 8 9 number 10 11 12 pebble 13 14 15 16 17 18 19 20 0 20 40 60 80 100 120 140 average of the three measurements (mm) Fig. 2.7 (ii) Which pebble at site M2 has the largest average of the three measurements? ....................................... [1] (e) (i) The results of the students’ measurements for the nine sites are shown in Fig. 2.4 (Insert). Do these results support Hypothesis 1: The pebbles get smaller from the cliff towards the sea? Support your decision with evidence from Fig. 2.4. ........................................................................................................................................... ........................................................................................................................................... ........................................................................................................................................... ........................................................................................................................................... ........................................................................................................................................... ..................................................................................................................................... [3]
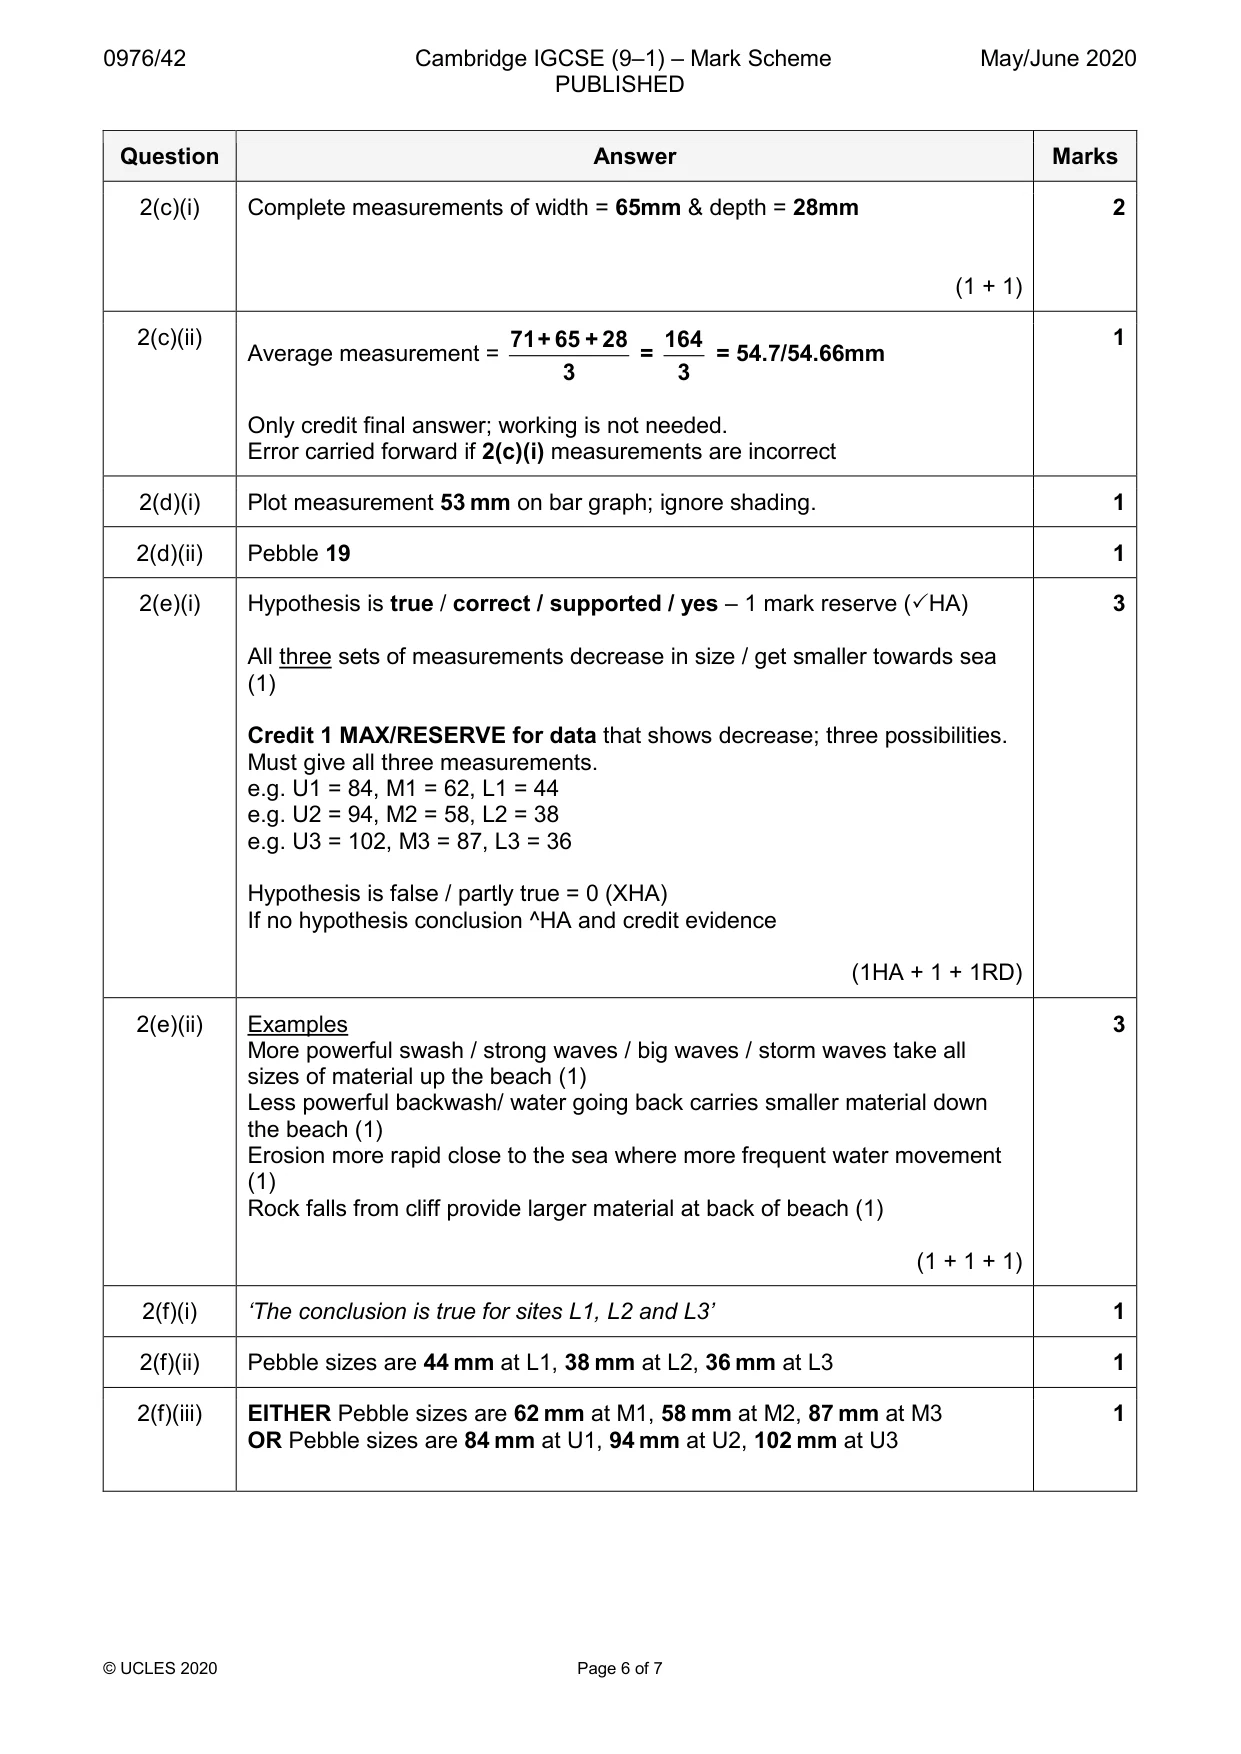
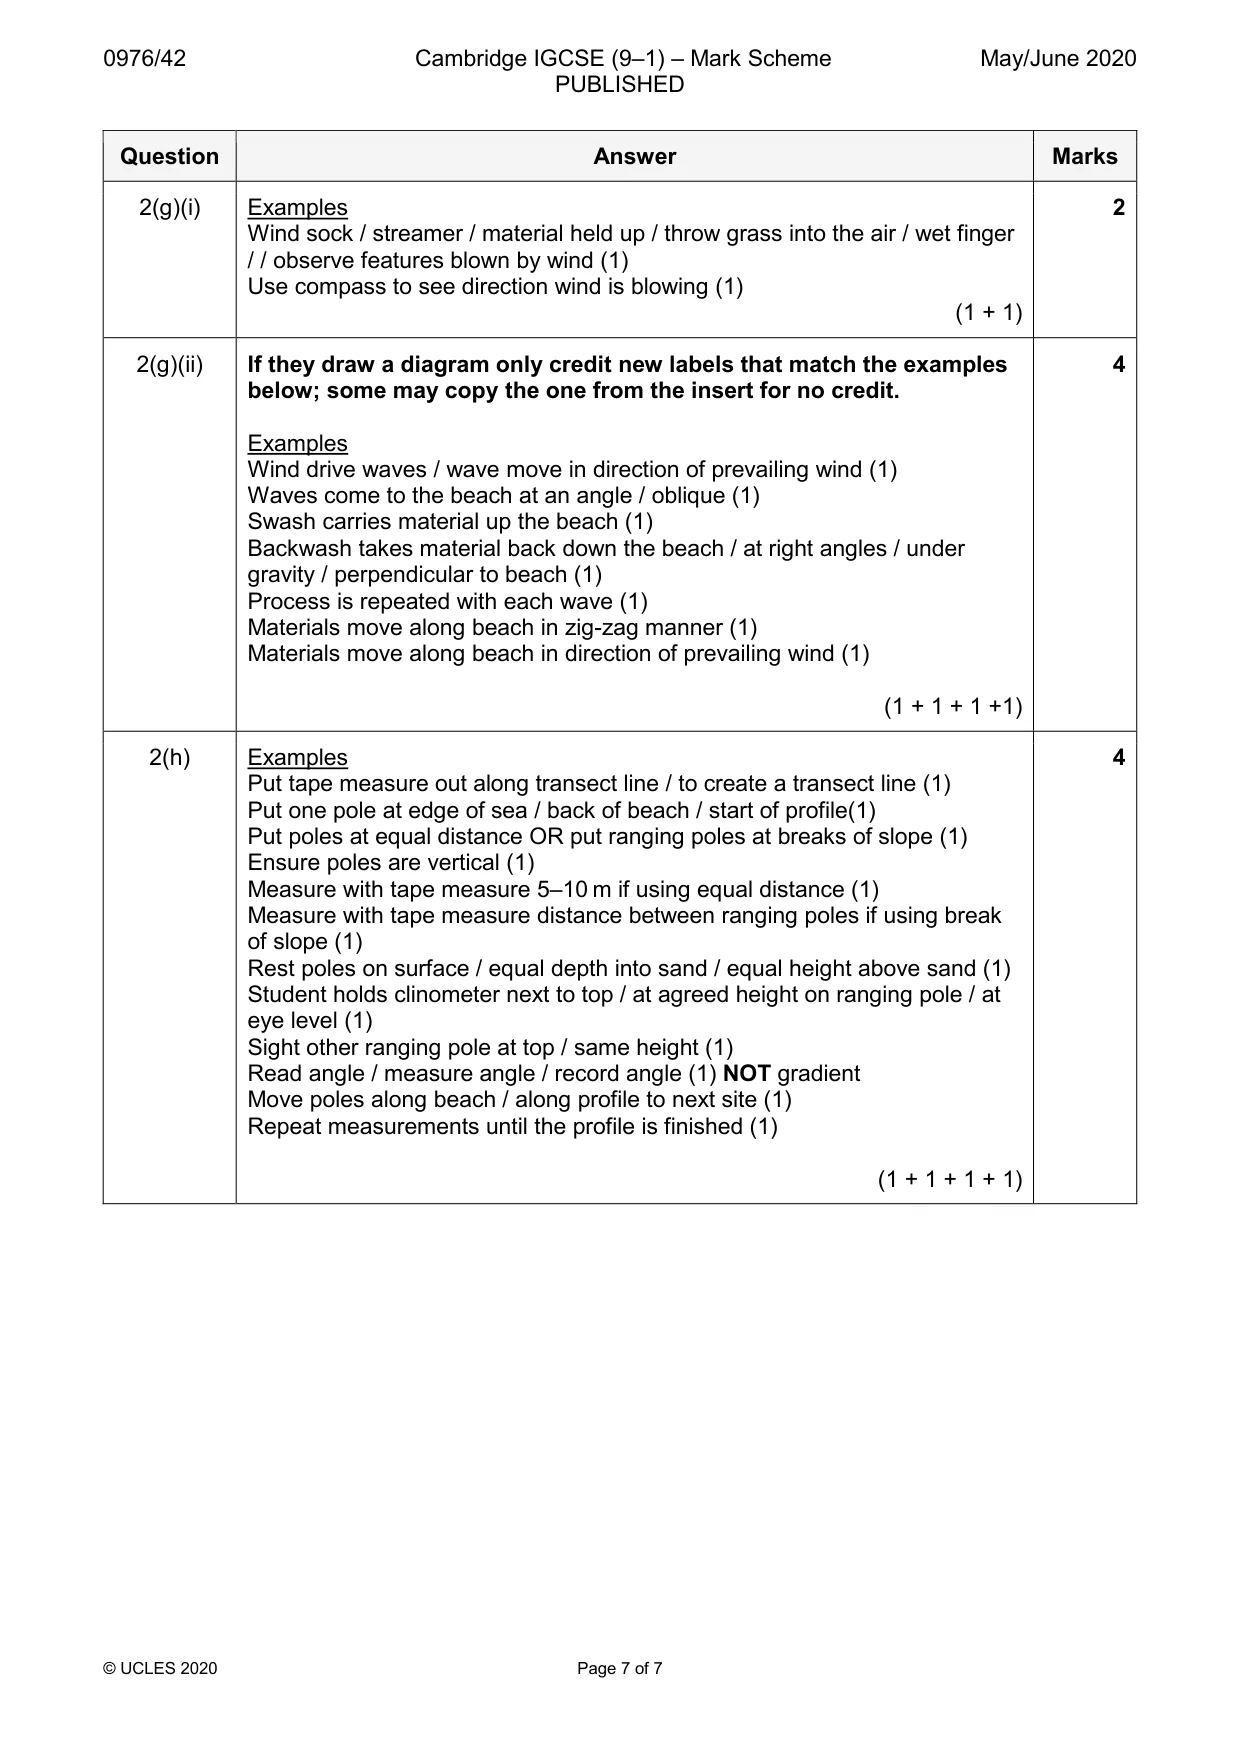
Mark scheme: 2(a) Wood (1) 2 Planks fastened to posts (1) Located perpendicular to sea / across beach (1) Located within area of pebbles / not on the sandy beach (1) (1 + 1) 2(b) Examples 4 Stay in designated area (1) Keep away from base of cliff / overhang (1) Avoid slippery rocks / slippery wood (1) Work in pairs / groups (1) Wear sensible shoes / waterproofs (1) Use phone / whistle in emergency (1) Don’t go in the sea (1) Arrange meeting points / agree time to meet (1) Tell teacher / adult where you are going (1) (1 + 1 +1 + 1) 2(c)(i) Complete measurements of width = 65mm & depth = 28mm 2 (1 + 1) 2(c)(ii) 71+ 65 + 28 164 1 Average measurement = = = 54.7/54.66mm 3 3 Only credit final answer; working is not needed. Error carried forward if 2(c)(i) measurements are incorrect 2(d)(i) Plot measurement 53 mm on bar graph; ignore shading. 1 2(d)(ii) Pebble 19 1 2(e)(i) Hypothesis is true / correct / supported / yes – 1 mark reserve (HA) 3 All three sets of measurements decrease in size / get smaller towards sea (1) Credit 1 MAX/RESERVE for data that shows decrease; three possibilities. Must give all three measurements. e.g. U1 = 84, M1 = 62, L1 = 44 e.g. U2 = 94, M2 = 58, L2 = 38 e.g. U3 = 102, M3 = 87, L3 = 36 Hypothesis is false / partly true = 0 (XHA) If no hypothesis conclusion ^HA and credit evidence (1HA + 1 + 1RD) 2(e)(ii) Examples 3 More powerful swash / strong waves / big waves / storm waves take all sizes of material up the beach (1) Less powerful backwash/ water going back carries smaller material down the beach (1) Erosion more rapid close to the sea where more frequent water movement (1) Rock falls from cliff provide larger material at back of beach (1) (1 + 1 + 1) 2(f)(i) ‘The conclusion is true for sites L1, L2 and L3’ 1 2(f)(ii) Pebble sizes are 44 mm at L1, 38 mm at L2, 36 mm at L3 1 2(f)(iii) EITHER Pebble sizes are 62 mm at M1, 58 mm at M2, 87 mm at M3 1 OR Pebble sizes are 84 mm at U1, 94 mm at U2, 102 mm at U3 2(g)(i) Examples 2 Wind sock / streamer / material held up / throw grass into the air / wet finger / / observe features blown by wind (1) Use compass to see direction wind is blowing (1) (1 + 1) 2(g)(ii) If they draw a diagram only credit new labels that match the examples 4 below; some may copy the one from the insert for no credit. Examples Wind drive waves / wave move in direction of prevailing wind (1) Waves come to the beach at an angle / oblique (1) Swash carries material up the beach (1) Backwash takes material back down the beach / at right angles / under gravity / perpendicular to beach (1) Process is repeated with each wave (1) Materials move along beach in zig-zag manner (1) Materials move along beach in direction of prevailing wind (1) (1 + 1 + 1 +1) 2(h) Examples 4 Put tape measure out along transect line / to create a transect line (1) Put one pole at edge of sea / back of beach / start of profile(1) Put poles at equal distance OR put ranging poles at breaks of slope (1) Ensure poles are vertical (1) Measure with tape measure 5–10 m if using equal distance (1) Measure with tape measure distance between ranging poles if using break of slope (1) Rest poles on surface / equal depth into sand / equal height above sand (1) Student holds clinometer next to top / at agreed height on ranging pole / at eye level (1) Sight other ranging pole at top / same height (1) Read angle / measure angle / record angle (1) NOT gradient Move poles along beach / along profile to next site (1) Repeat measurements until the profile is finished (1) (1 + 1 + 1 + 1)
What was in this paper
The subtopics covered by these 2 questions, and how many questions each got. Open one in a new tab to see every Cambridge question on it.