Cambridge IGCSE Geography 0460 — 2016 Oct/Nov Paper 1 · Variant 3
0460/13/O/N/16 · 75 marks · ≈84 min
The question paper and its mark scheme, free to read here and free to download. This is Cambridge’s own paper, exactly as it was sat.
Question paper32 pages


Mark scheme16 pages
Answers below. Sit the paper first if you are practising.
Paper as text
Question paper, page 1
This document consists of 31 printed pages, 1 blank page and 1 Insert. DC (ST/SG) 115306/5 © UCLES 2016 [Turn over Cambridge International Examinations Cambridge International General Certificate of Secondary Education * 1 1 9 9 6 8 9 2 2 4 * GEOGRAPHY 0460/13 Paper 1 October/November 2016 1 hour 45 minutes Candidates answer on the Question Paper. Additional Materials: Calculator Protractor Ruler READ THESE INSTRUCTIONS FIRST Write your Centre number, candidate number and name in the spaces provided. Write in dark blue or black pen. You may use an HB pencil for any diagrams or graphs. Do not use staples, paper clips, glue or correction fluid. DO NOT WRITE IN ANY BARCODES. Write your answer to each question in the space provided. If additional space is required, you should use the lined pages at the end of this booklet. The question number(s) must be clearly shown. Answer three questions, one from each section. The Insert contains Photographs A, B and C for Question 1, Photograph D for Question 4, and Fig. 8 and Photograph E for Question 5. The Insert is not required by the Examiner. Sketch maps and diagrams should be drawn whenever they serve to illustrate an answer. At the end of the examination, fasten all your work securely together. The number of marks is given in brackets [ ] at the end of each question or part question. Definitions MEDCs – More Economically Developed Countries LEDCs – Less Economically Developed Countries The syllabus is approved for use in England, Wales and Northern Ireland as a Cambridge International Level 1/Level 2 Certificate.
Question paper, page 2
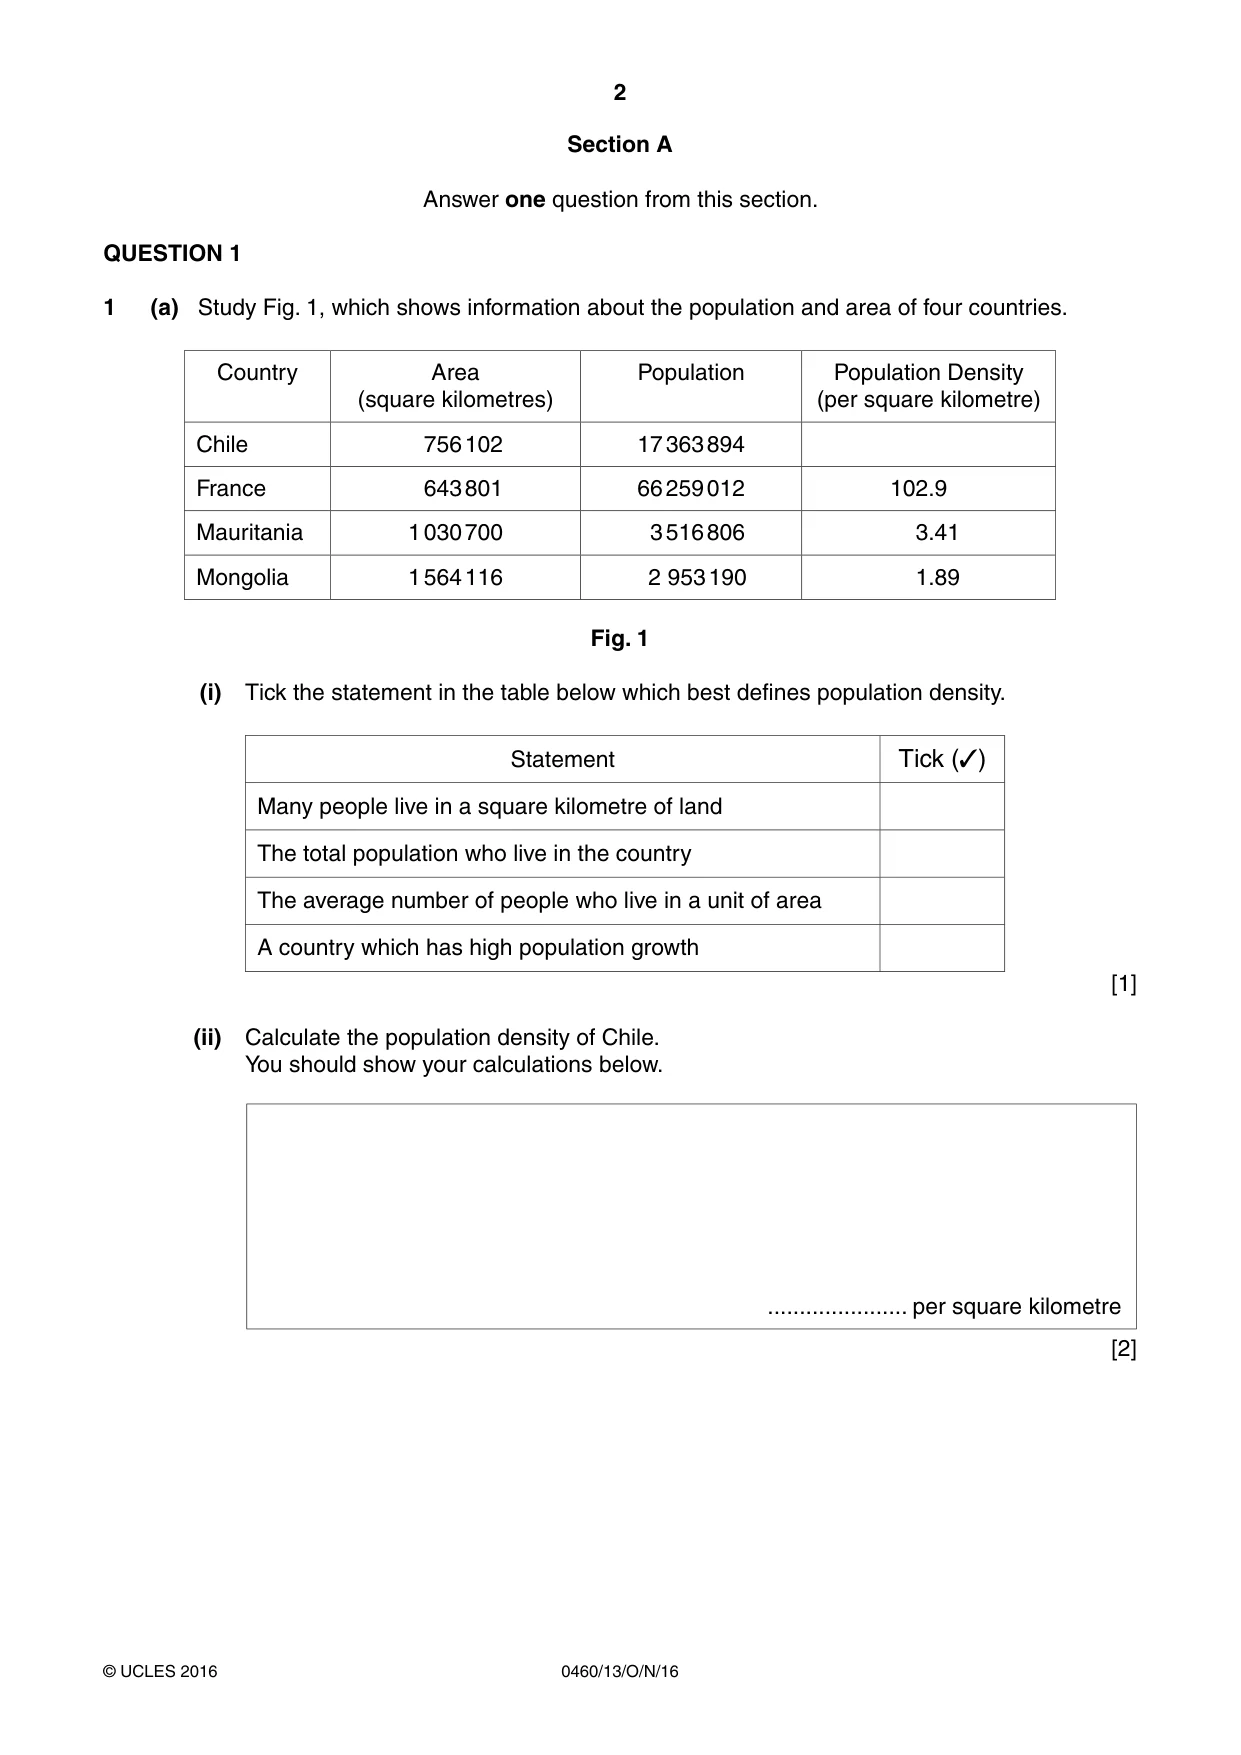
2 0460/13/O/N/16 © UCLES 2016 Section A Answer one question from this section. QUESTION 1 1 (a) Study Fig. 1, which shows information about the population and area of four countries. Country Area (square kilometres) Population Population Density (per square kilometre) Chile 756 102 17 363 894 France 643 801 66 259 012 102.9 Mauritania 1 030 700 3 516 806 3.41 Mongolia 1 564 116 2 953 190 1.89 Fig. 1 (i) Tick the statement in the table below which best defines population density. Statement Tick (✓) Many people live in a square kilometre of land The total population who live in the country The average number of people who live in a unit of area A country which has high population growth [1] (ii) Calculate the population density of Chile. You should show your calculations below. … per square kilometre [2]
Question paper, page 3
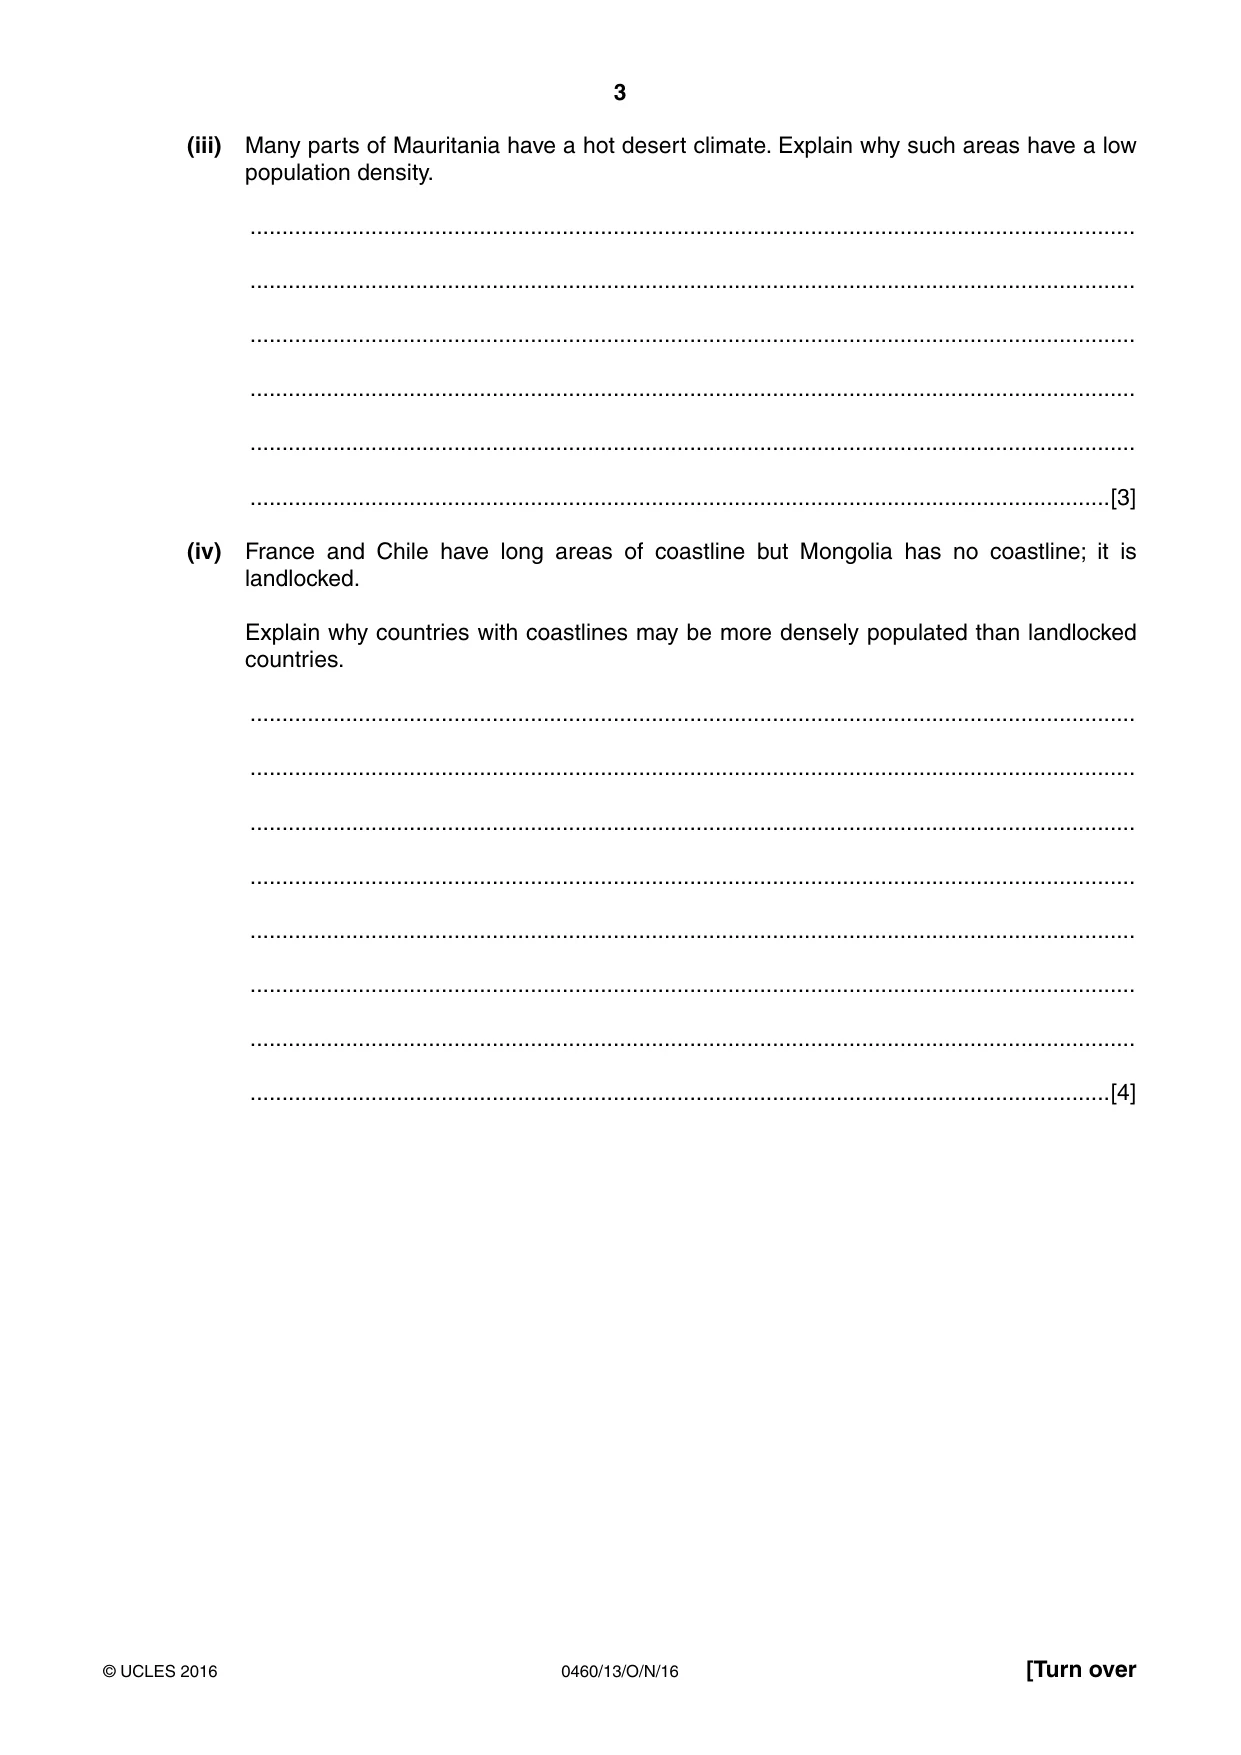
3 0460/13/O/N/16 © UCLES 2016 [Turn over (iii) Many parts of Mauritania have a hot desert climate. Explain why such areas have a low population density. … … … … … …[3] (iv) France and Chile have long areas of coastline but Mongolia has no coastline; it is landlocked. Explain why countries with coastlines may be more densely populated than landlocked countries. … … … … … … … …[4]
Question paper, page 4
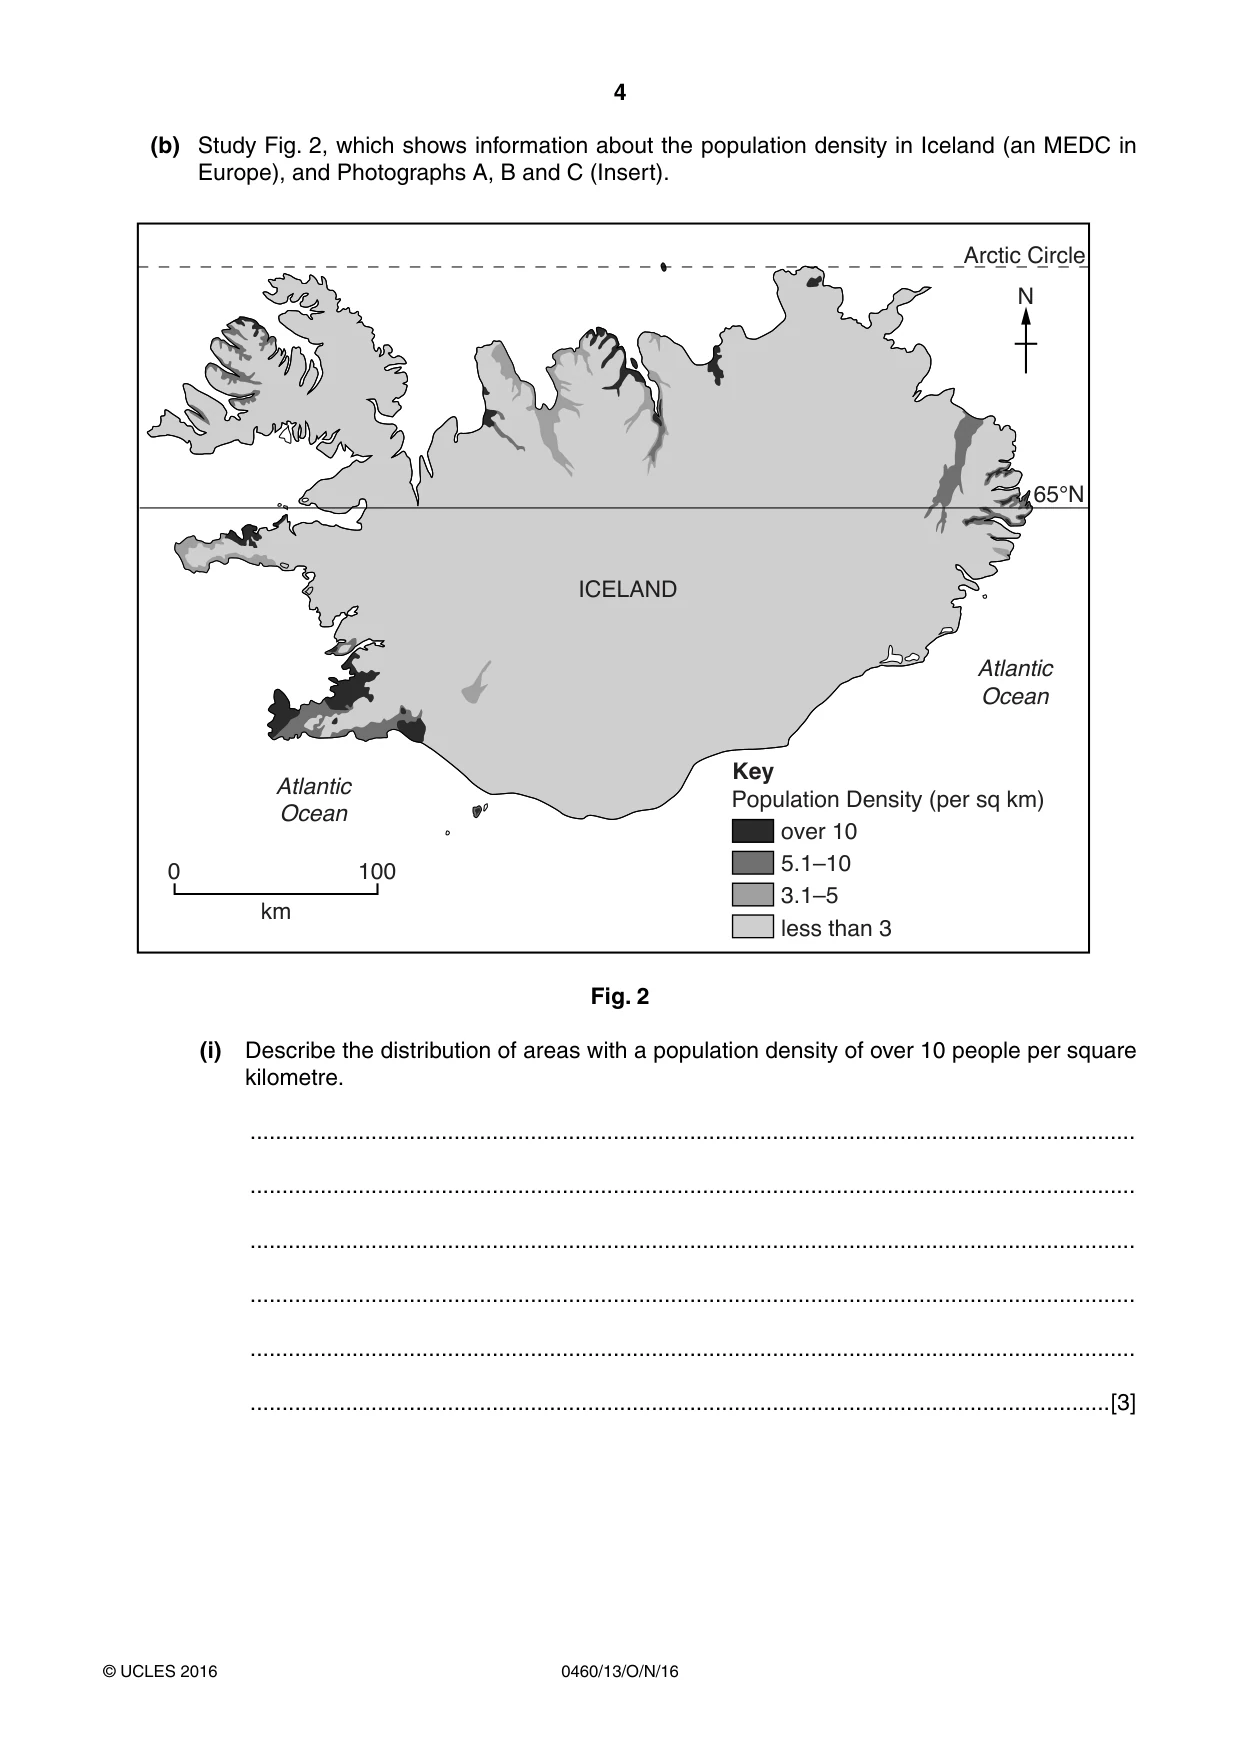
4 0460/13/O/N/16 © UCLES 2016 (b) Study Fig. 2, which shows information about the population density in Iceland (an MEDC in Europe), and Photographs A, B and C (Insert). Population Density (per sq km) less than 3 3.1–5 5.1–10 over 10 0 100 km ICELAND Arctic Circle 65°N N Key Atlantic Ocean Atlantic Ocean Fig. 2 (i) Describe the distribution of areas with a population density of over 10 people per square kilometre. … … … … … …[3]
Question paper, page 5
5 0460/13/O/N/16 © UCLES 2016 [Turn over (ii) Using evidence from Fig. 2 and Photographs A, B and C only, explain why large areas of Iceland have a low population density. … … … … … … … … … …[5]
Question paper, page 6
6 0460/13/O/N/16 © UCLES 2016 (c) Urban areas are densely populated. Explain why many people are migrating from rural areas to a named urban area you have studied. Name of urban area … … … … … … … … … … … … … … … … … … … … … … … … [7] [Total: 25 marks] END OF QUESTION 1
Question paper, page 7
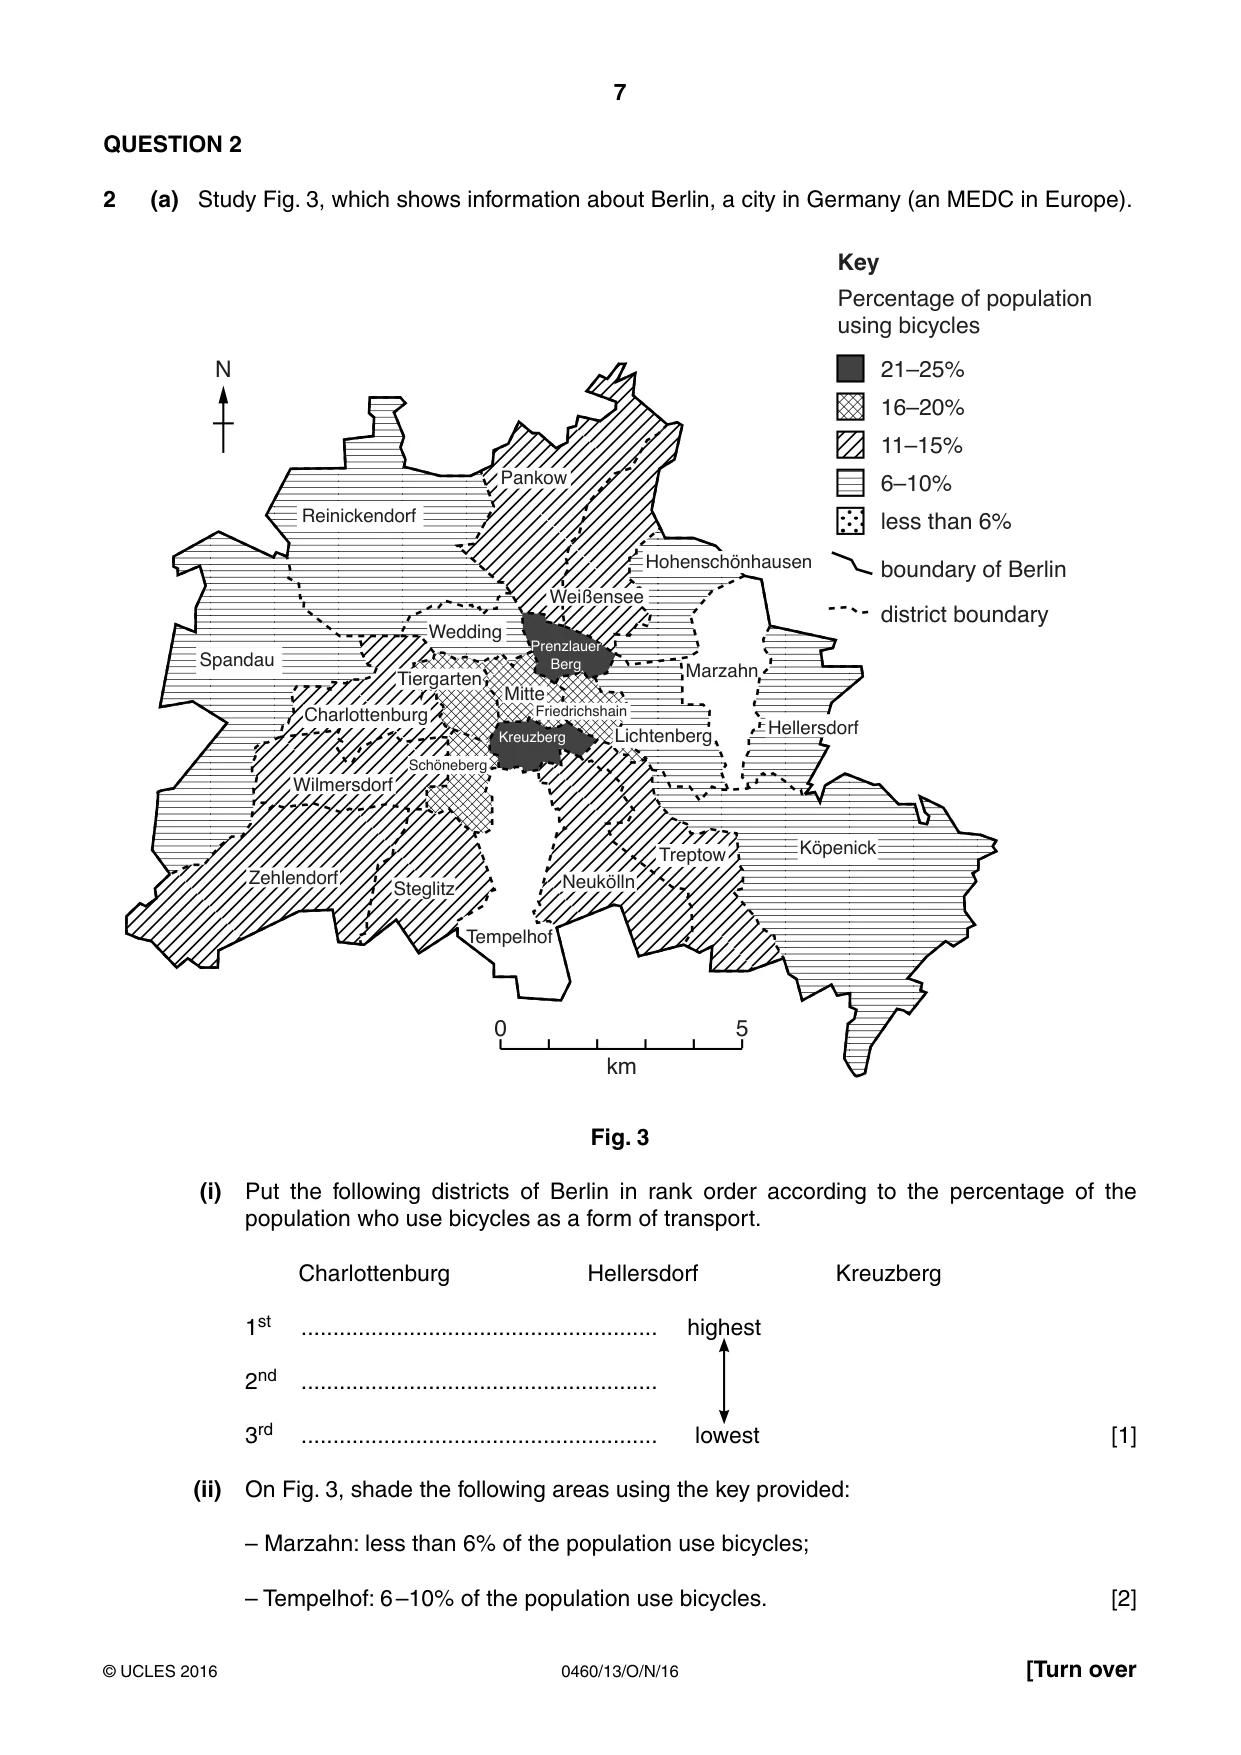
7 0460/13/O/N/16 © UCLES 2016 [Turn over QUESTION 2 2 (a) Study Fig. 3, which shows information about Berlin, a city in Germany (an MEDC in Europe). N 0 5 km Spandau Reinickendorf Pankow Weißensee Hohenschönhausen Marzahn Hellersdorf Prenzlauer Berg Kreuzberg Tiergarten Mitte Friedrichshain Lichtenberg Köpenick Treptow Neukölln Tempelhof Steglitz Zehlendorf Wilmersdorf Schöneberg Charlottenburg Key Percentage of population using bicycles less than 6% boundary of Berlin district boundary 6–10% 11–15% 16–20% 21–25% Wedding Fig. 3 (i) Put the following districts of Berlin in rank order according to the percentage of the population who use bicycles as a form of transport. Charlottenburg Hellersdorf Kreuzberg 1st … highest 2nd … 3rd … lowest [1] (ii) On Fig. 3, shade the following areas using the key provided: – Marzahn: less than 6% of the population use bicycles; – Tempelhof: 6 –10% of the population use bicycles. [2]
Question paper, page 8
8 0460/13/O/N/16 © UCLES 2016 (iii) Using evidence from Fig. 3, describe the variation in the percentage of the population using bicycles in Berlin. Refer to different areas and use statistics in your answer. … … … … … …[3] (iv) Give the advantages of using bicycles to reduce the problems caused by traffic congestion in urban areas. … … … … … … … …[4]
Question paper, page 9
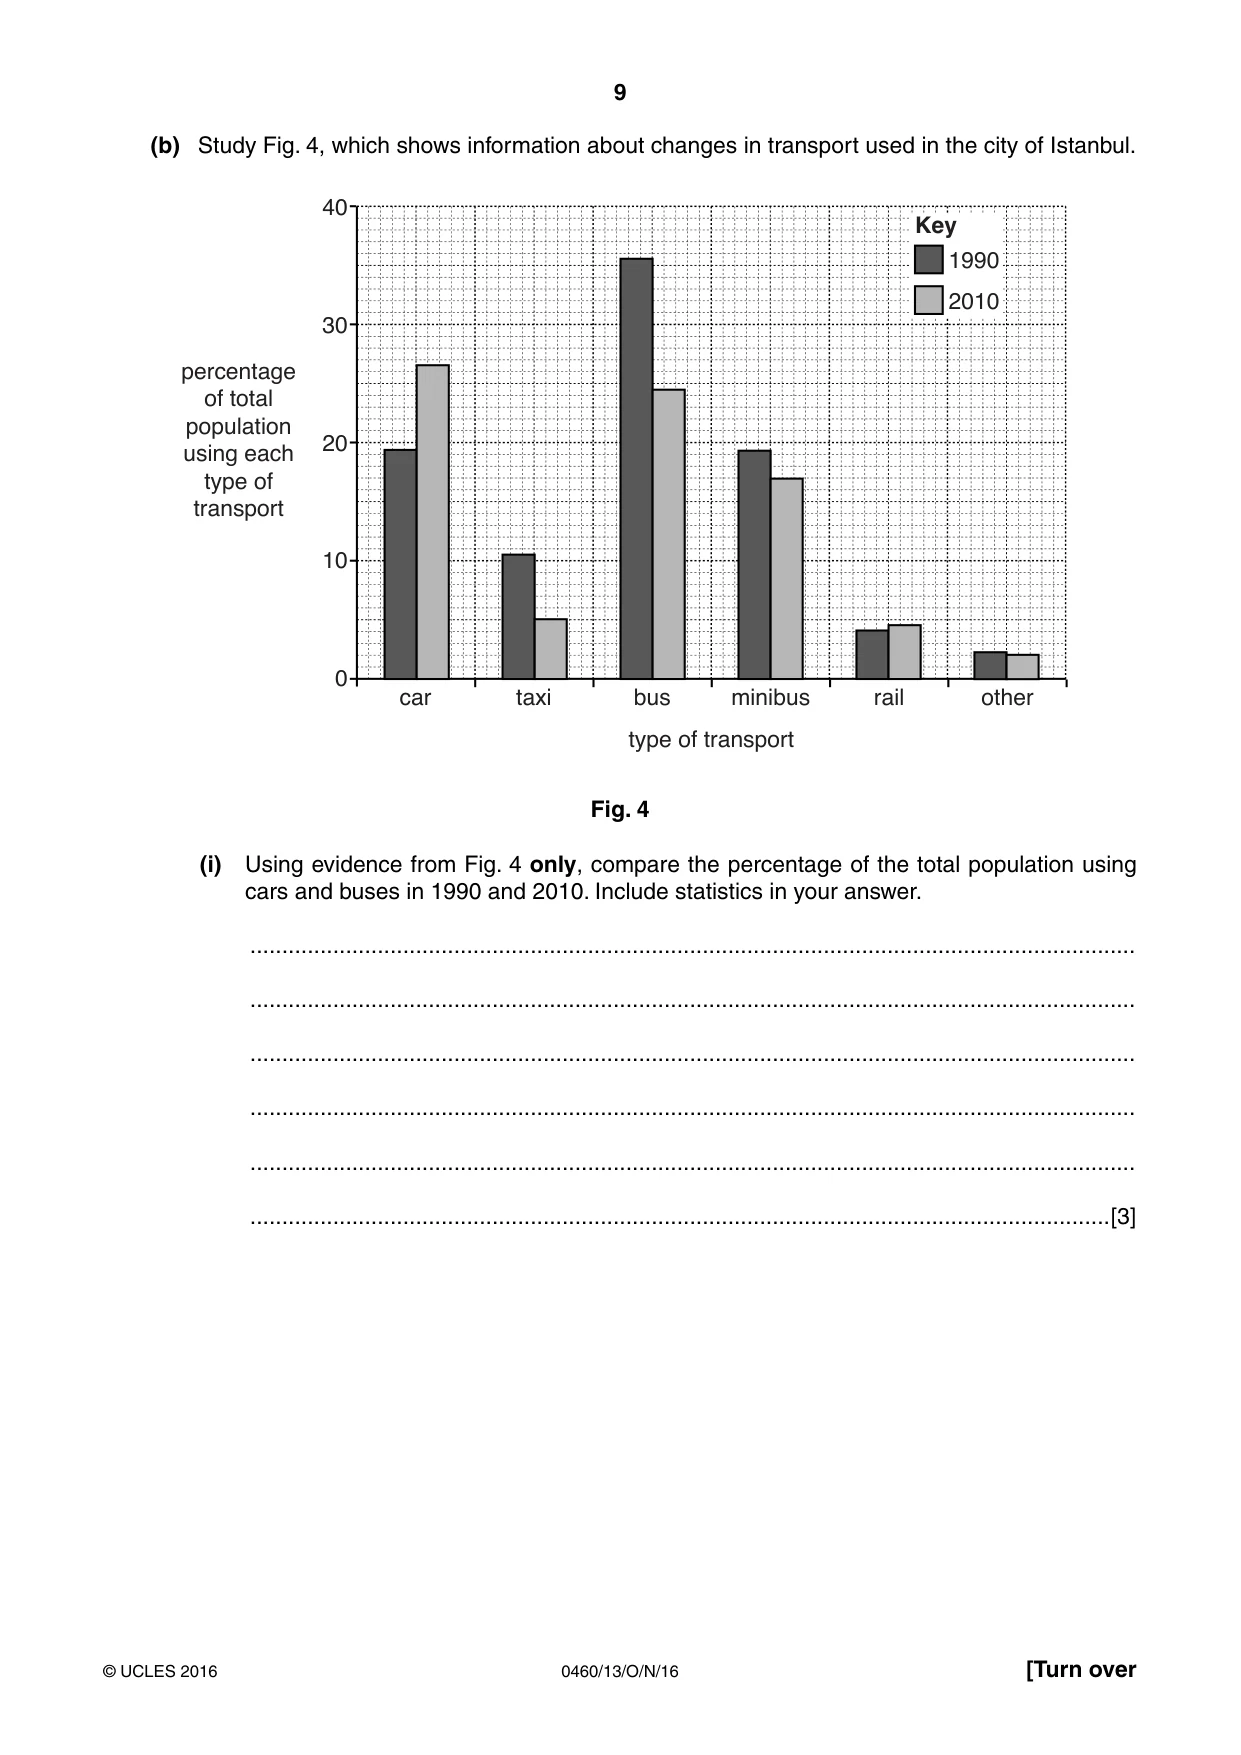
9 0460/13/O/N/16 © UCLES 2016 [Turn over (b) Study Fig. 4, which shows information about changes in transport used in the city of Istanbul. 40 30 20 10 0 car taxi bus minibus rail other type of transport percentage of total population using each type of transport 1990 2010 Key Fig. 4 (i) Using evidence from Fig. 4 only, compare the percentage of the total population using cars and buses in 1990 and 2010. Include statistics in your answer. … … … … … …[3]
Question paper, page 10
10 0460/13/O/N/16 © UCLES 2016 (ii) Explain how public transport can be developed to reduce traffic congestion in urban areas. … … … … … … … … … …[5]
Question paper, page 11
11 0460/13/O/N/16 © UCLES 2016 [Turn over (c) Another issue faced by planners in many urban areas is urban sprawl. For an urban area you have studied, describe the impacts of urban sprawl. Name of urban area … … … … … … … … … … … … … … … … … … … … … … … … … … [7] [Total: 25 marks] END OF QUESTION 2
Question paper, page 12
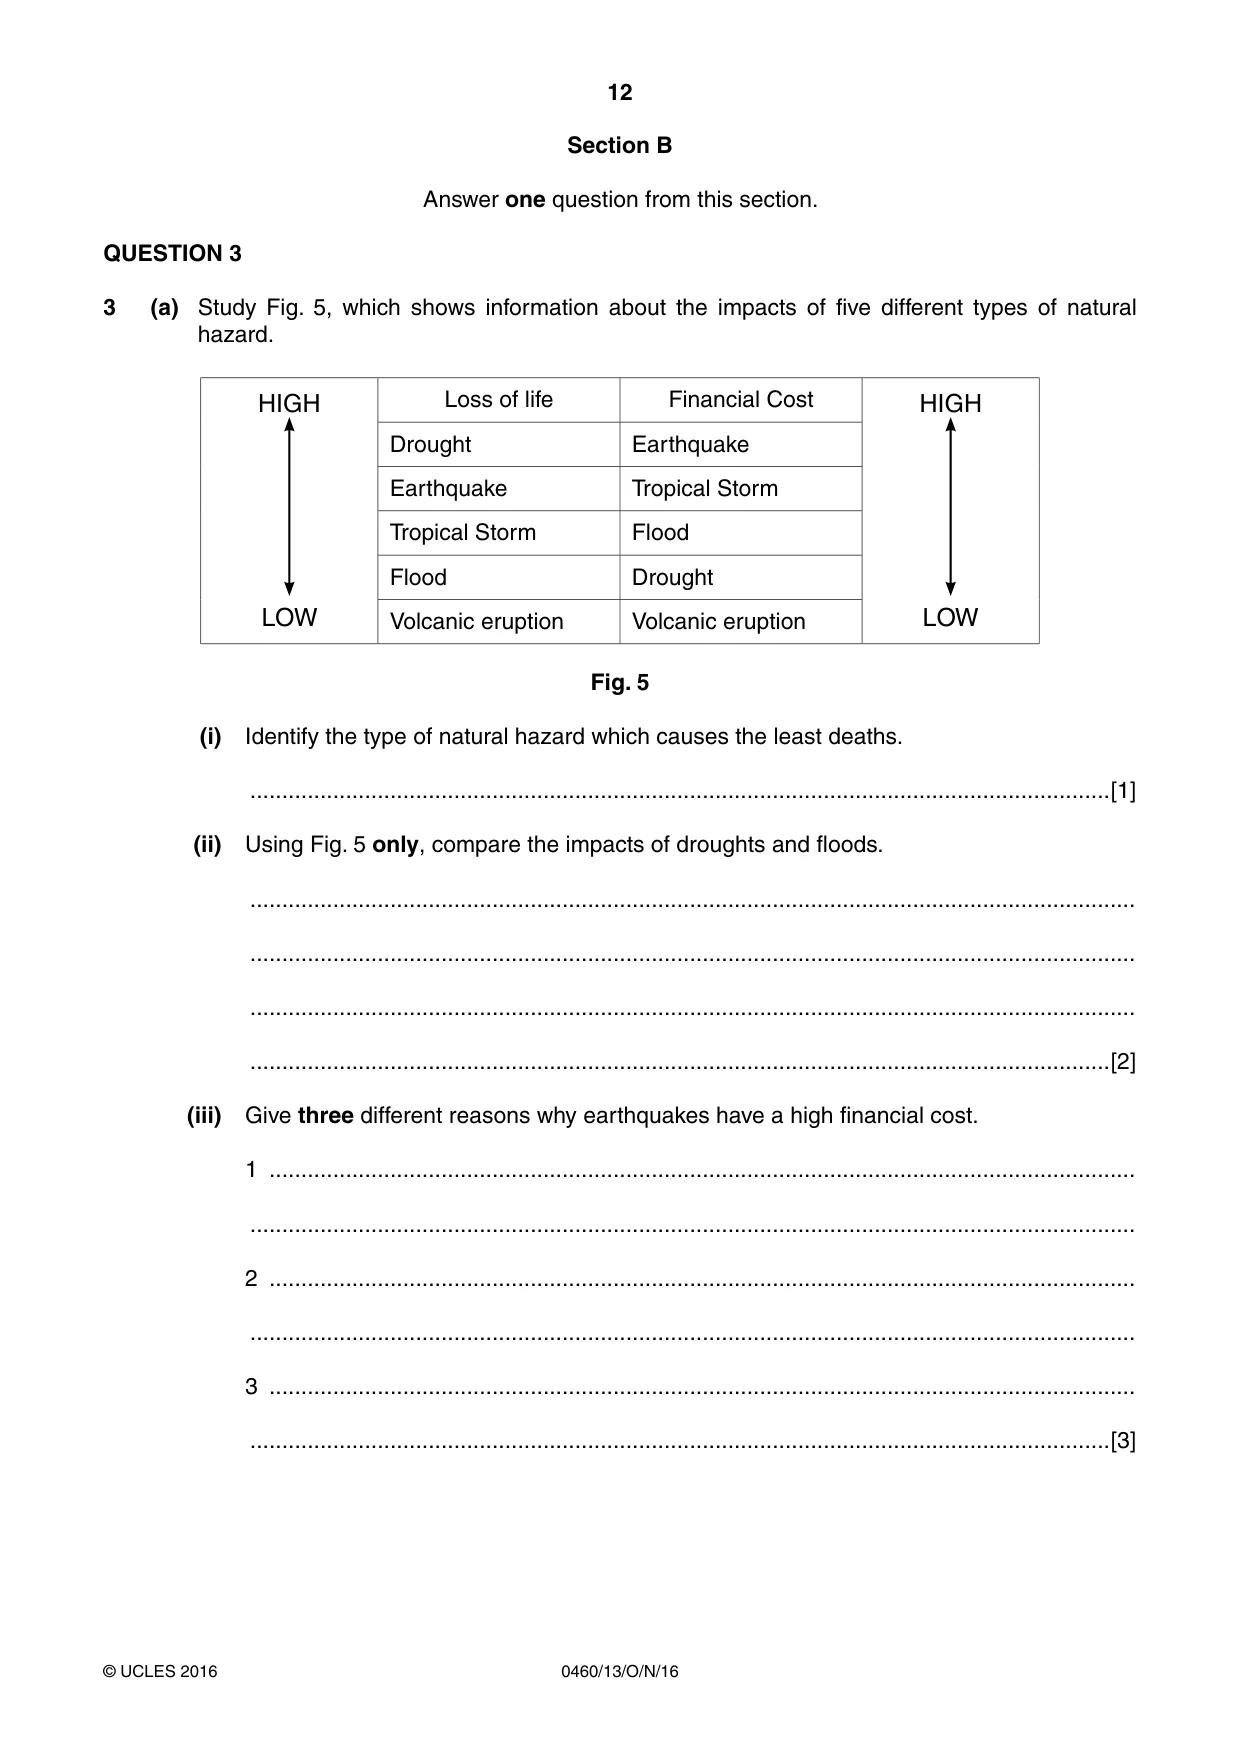
12 0460/13/O/N/16 © UCLES 2016 Section B Answer one question from this section. QUESTION 3 3 (a) Study Fig. 5, which shows information about the impacts of five different types of natural hazard. HIGH LOW Loss of life Financial Cost HIGH LOW Drought Earthquake Earthquake Tropical Storm Tropical Storm Flood Flood Drought Volcanic eruption Volcanic eruption Fig. 5 (i) Identify the type of natural hazard which causes the least deaths. …[1] (ii) Using Fig. 5 only, compare the impacts of droughts and floods. … … … …[2] (iii) Give three different reasons why earthquakes have a high financial cost. 1 … … 2 … … 3 … …[3]
Question paper, page 13
13 0460/13/O/N/16 © UCLES 2016 [Turn over TURN PAGE FOR QUESTION 3 (b)
Question paper, page 14
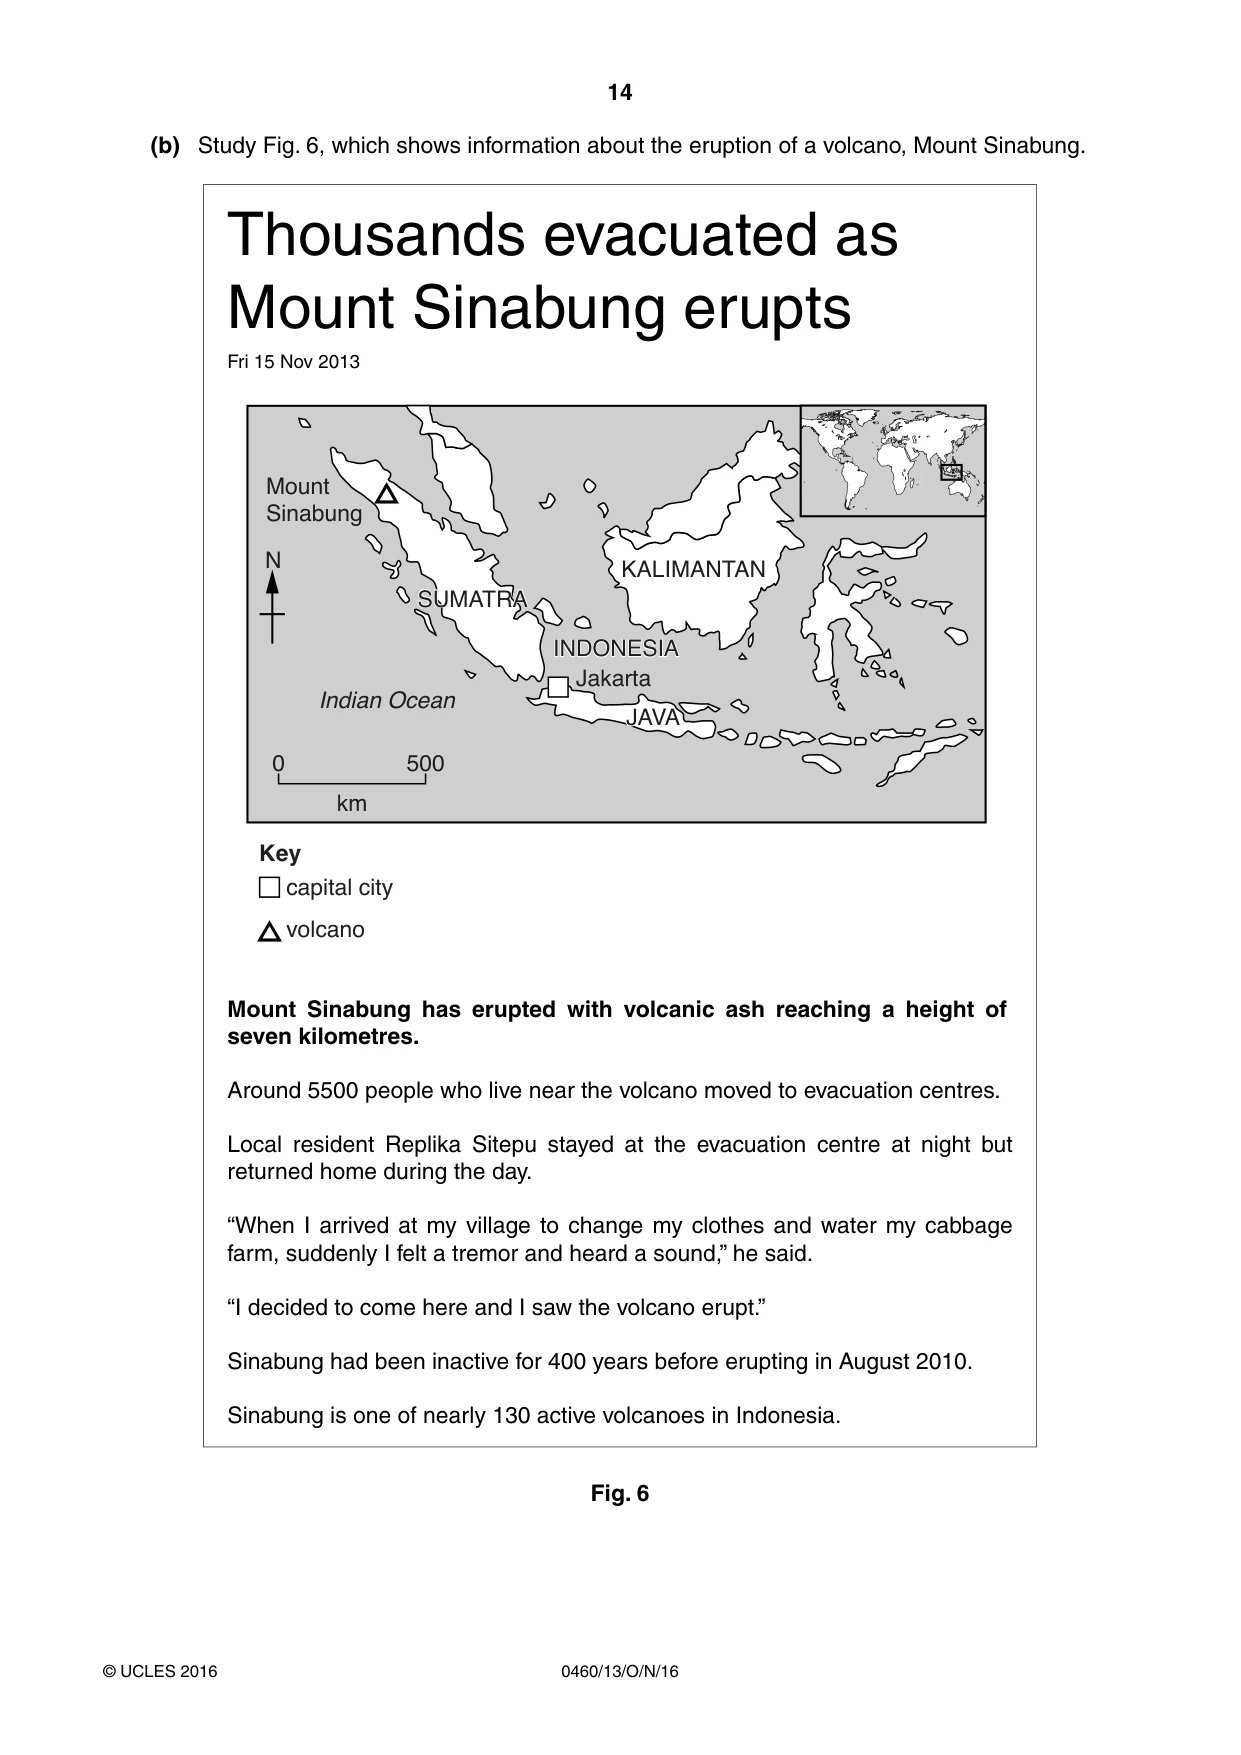
14 0460/13/O/N/16 © UCLES 2016 (b) Study Fig. 6, which shows information about the eruption of a volcano, Mount Sinabung. Thousands evacuated as Mount Sinabung erupts Fri 15 Nov 2013 JAVA JAVA Jakarta Indian Ocean Mount Sinabung SUMATRA SUMATRA INDONESIA INDONESIA KALIMANTAN KALIMANTAN 0 500 km Key capital city volcano N Mount Sinabung has erupted with volcanic ash reaching a height of seven kilometres. Around 5500 people who live near the volcano moved to evacuation centres. Local resident Replika Sitepu stayed at the evacuation centre at night but returned home during the day. “When I arrived at my village to change my clothes and water my cabbage farm, suddenly I felt a tremor and heard a sound,” he said. “I decided to come here and I saw the volcano erupt.” Sinabung had been inactive for 400 years before erupting in August 2010. Sinabung is one of nearly 130 active volcanoes in Indonesia. Fig. 6
Question paper, page 15
15 0460/13/O/N/16 © UCLES 2016 [Turn over (i) Describe the location of Mount Sinabung. … … … … … …[3] (ii) Explain why volcanic eruptions, such as that of Mount Sinabung, do not cause many deaths even though many people live close to them. … … … … … … … …[4] (iii) Explain why many people live close to active volcanoes. … … … … … … … … … …[5]
Question paper, page 16
16 0460/13/O/N/16 © UCLES 2016 (c) For a named volcano you have studied, explain the causes of an eruption. Name of volcano … … … … … … … … … … … … … … … … … … … … … … … … [7] [Total: 25 marks] END OF QUESTION 3
Question paper, page 17
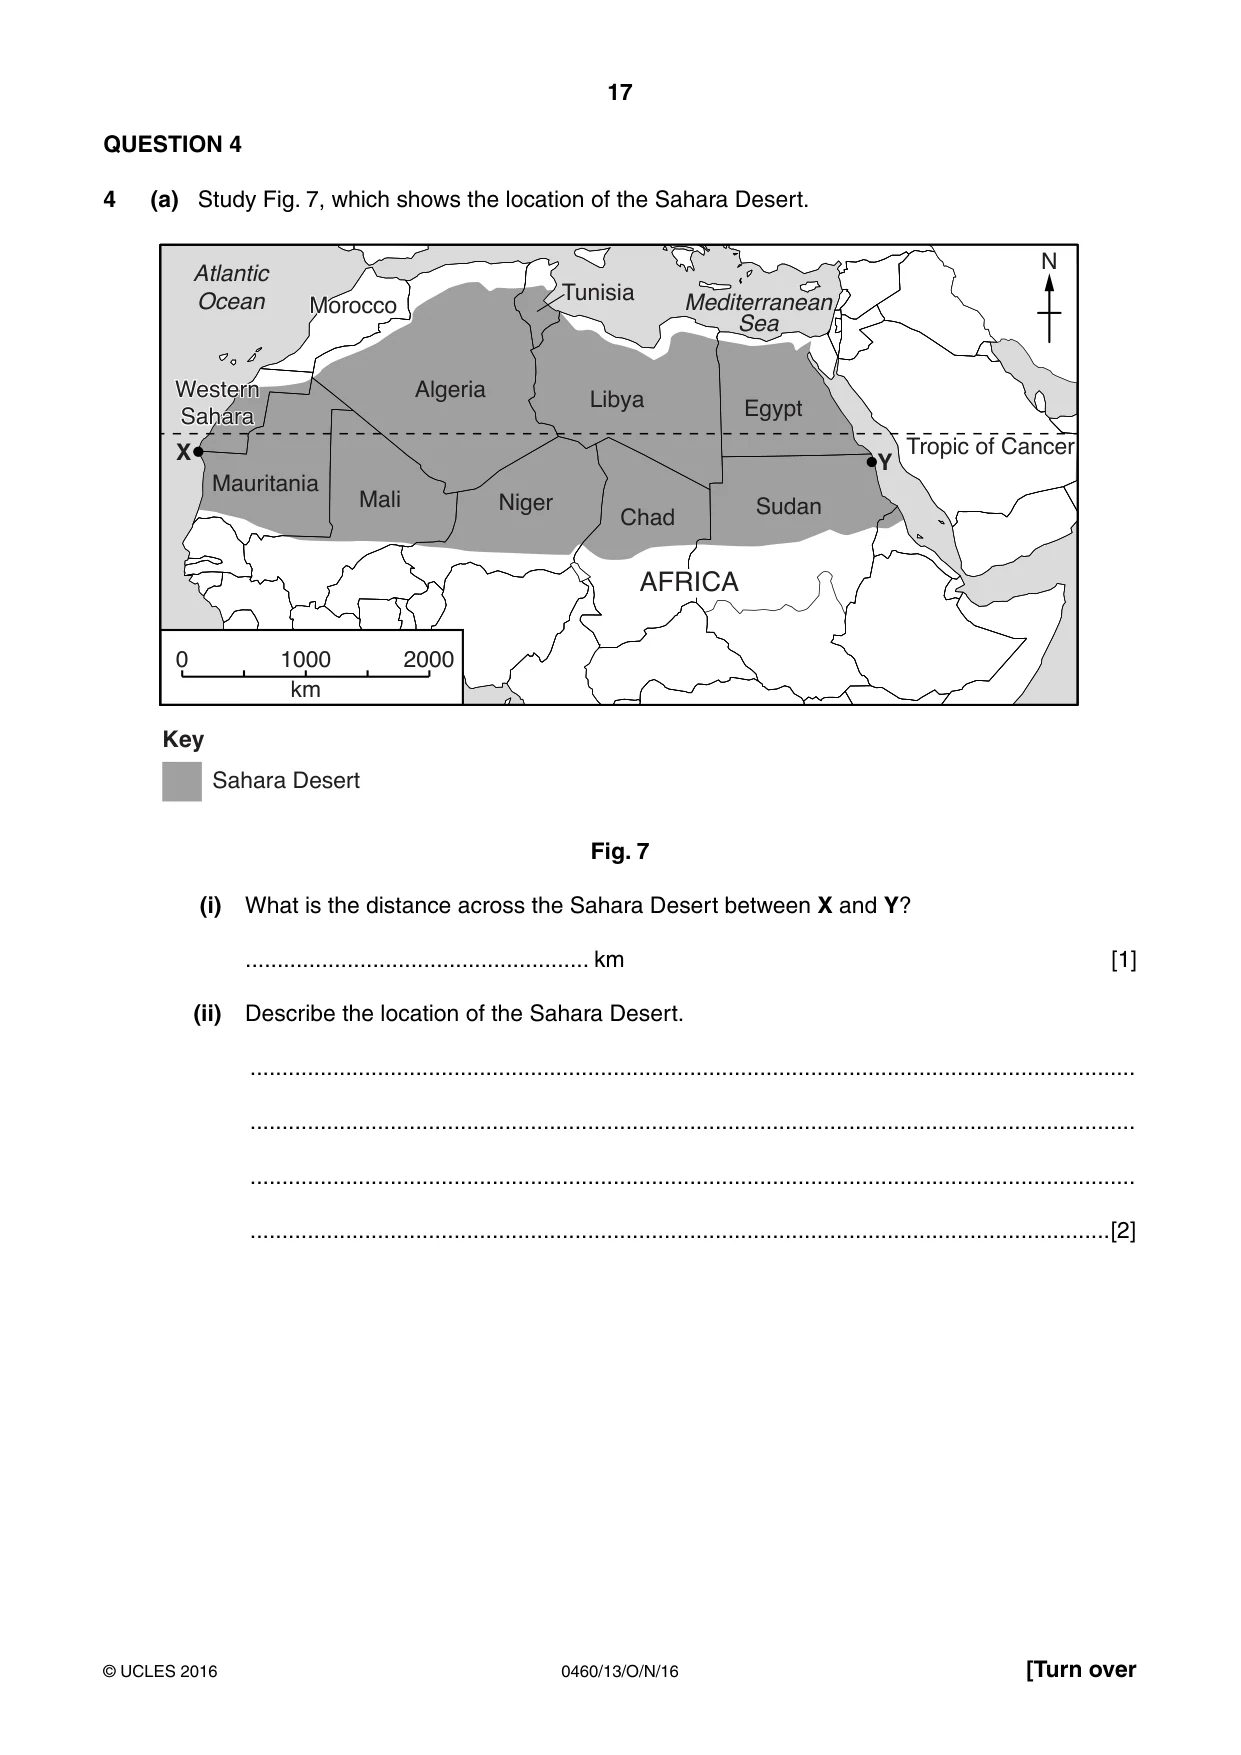
17 0460/13/O/N/16 © UCLES 2016 [Turn over QUESTION 4 4 (a) Study Fig. 7, which shows the location of the Sahara Desert. Morocco Morocco Algeria Tunisia Libya Western Sahara Western Sahara Mauritania X Mali Niger Chad Egypt Sudan Tropic of Cancer AFRICA 0 1000 2000 km Y Key Sahara Desert N Atlantic Ocean Mediterranean Sea Fig. 7 (i) What is the distance across the Sahara Desert between X and Y? … km [1] (ii) Describe the location of the Sahara Desert. … … … …[2]
Question paper, page 18
18 0460/13/O/N/16 © UCLES 2016 (iii) Describe and explain the main characteristics of the hot desert climate. A Description … … … … … …[3] B Explanation … … … … … … … …[4] (b) Study Photograph D (Insert), which shows an area of hot desert. (i) Describe the characteristics of the hot desert area shown in Photograph D. … … … … … …[3]
Question paper, page 19
19 0460/13/O/N/16 © UCLES 2016 [Turn over (ii) Explain how natural vegetation has adapted to survive in a hot desert. … … … … … … … … … …[5]
Question paper, page 20
20 0460/13/O/N/16 © UCLES 2016 (c) Another area of natural vegetation is a mangrove swamp. Describe the main characteristics of mangrove swamps and explain why they develop in some areas. … … … … … … … … … … … … … … … … … … … … … … … … …[7] [Total: 25 marks] END OF QUESTION 4
Question paper, page 21
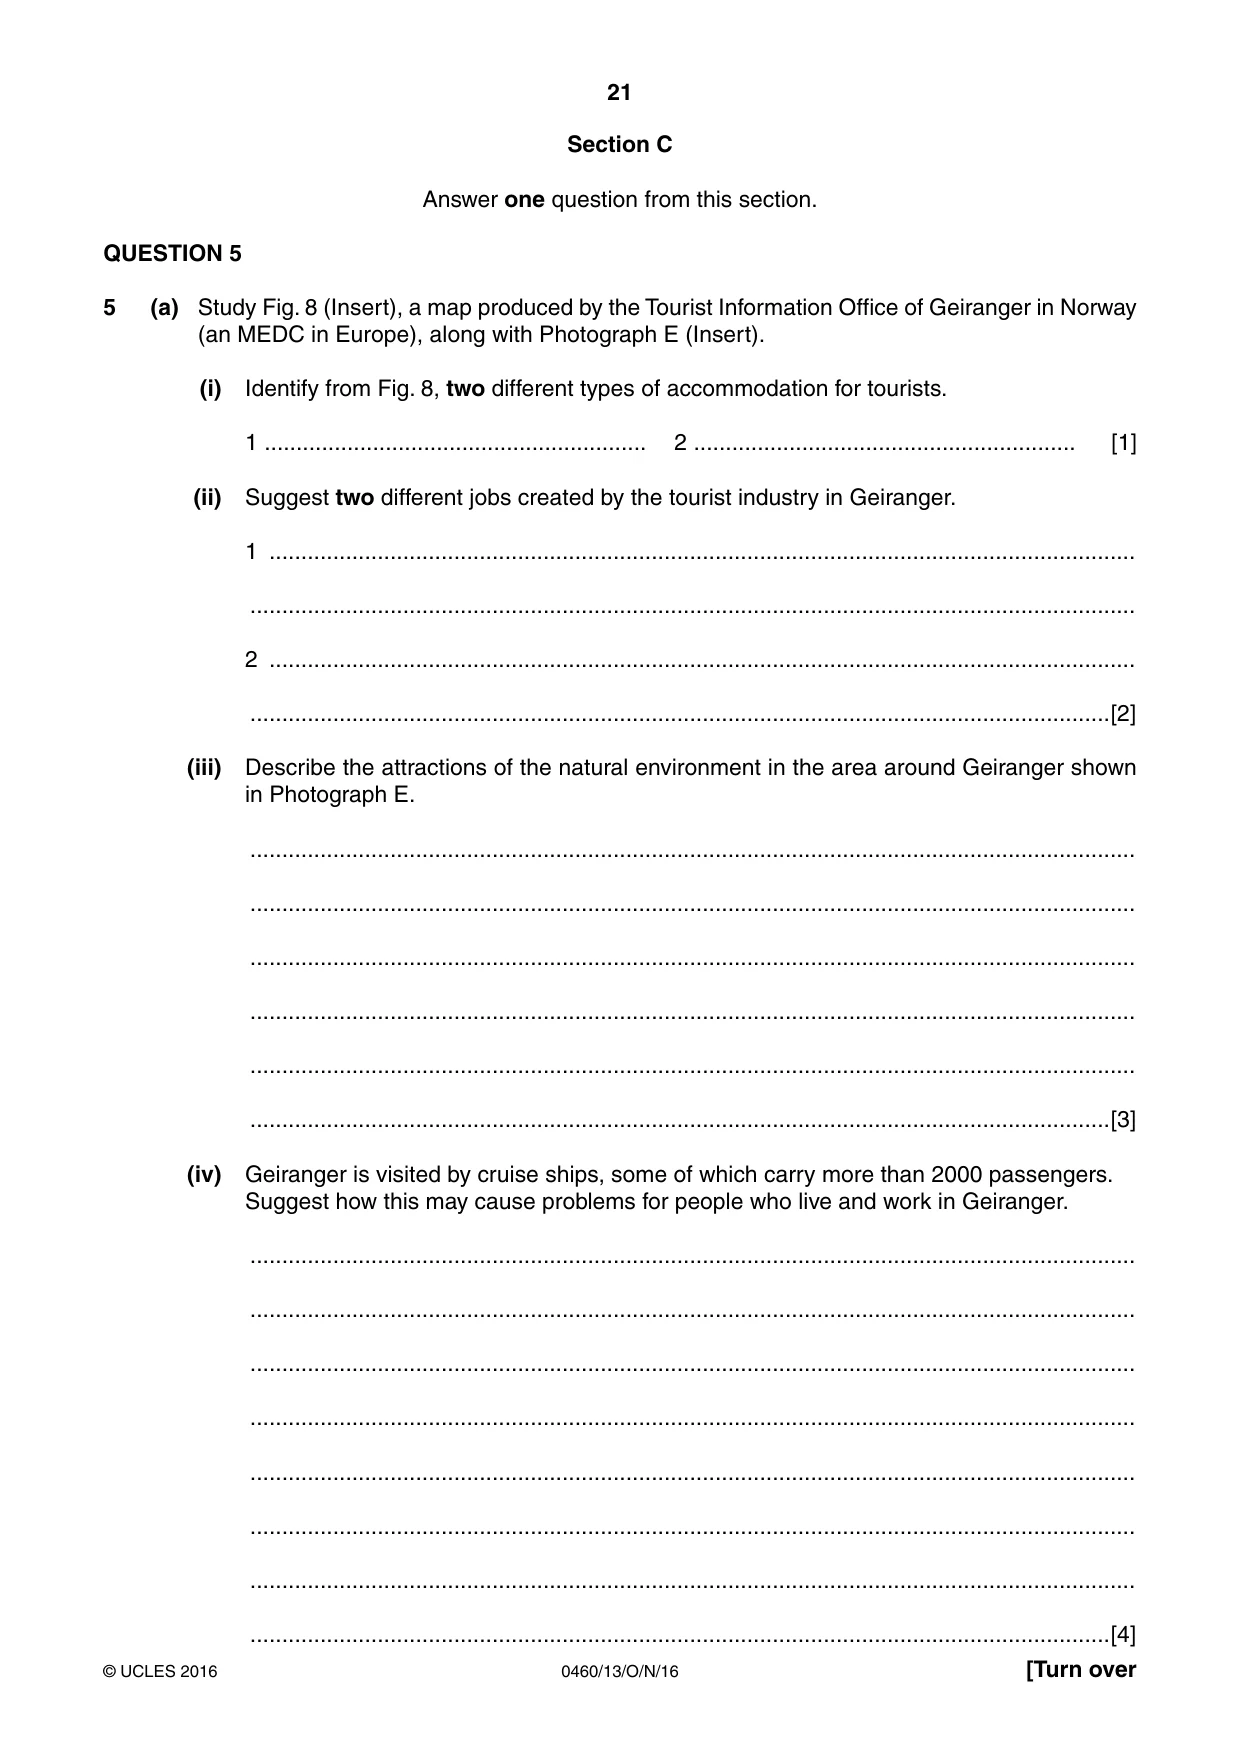
21 0460/13/O/N/16 © UCLES 2016 [Turn over Section C Answer one question from this section. QUESTION 5 5 (a) Study Fig. 8 (Insert), a map produced by the Tourist Information Office of Geiranger in Norway (an MEDC in Europe), along with Photograph E (Insert). (i) Identify from Fig. 8, two different types of accommodation for tourists. 1 … 2 … [1] (ii) Suggest two different jobs created by the tourist industry in Geiranger. 1 … … 2 … …[2] (iii) Describe the attractions of the natural environment in the area around Geiranger shown in Photograph E. … … … … … …[3] (iv) Geiranger is visited by cruise ships, some of which carry more than 2000 passengers. Suggest how this may cause problems for people who live and work in Geiranger. … … … … … … … …[4]
Question paper, page 22
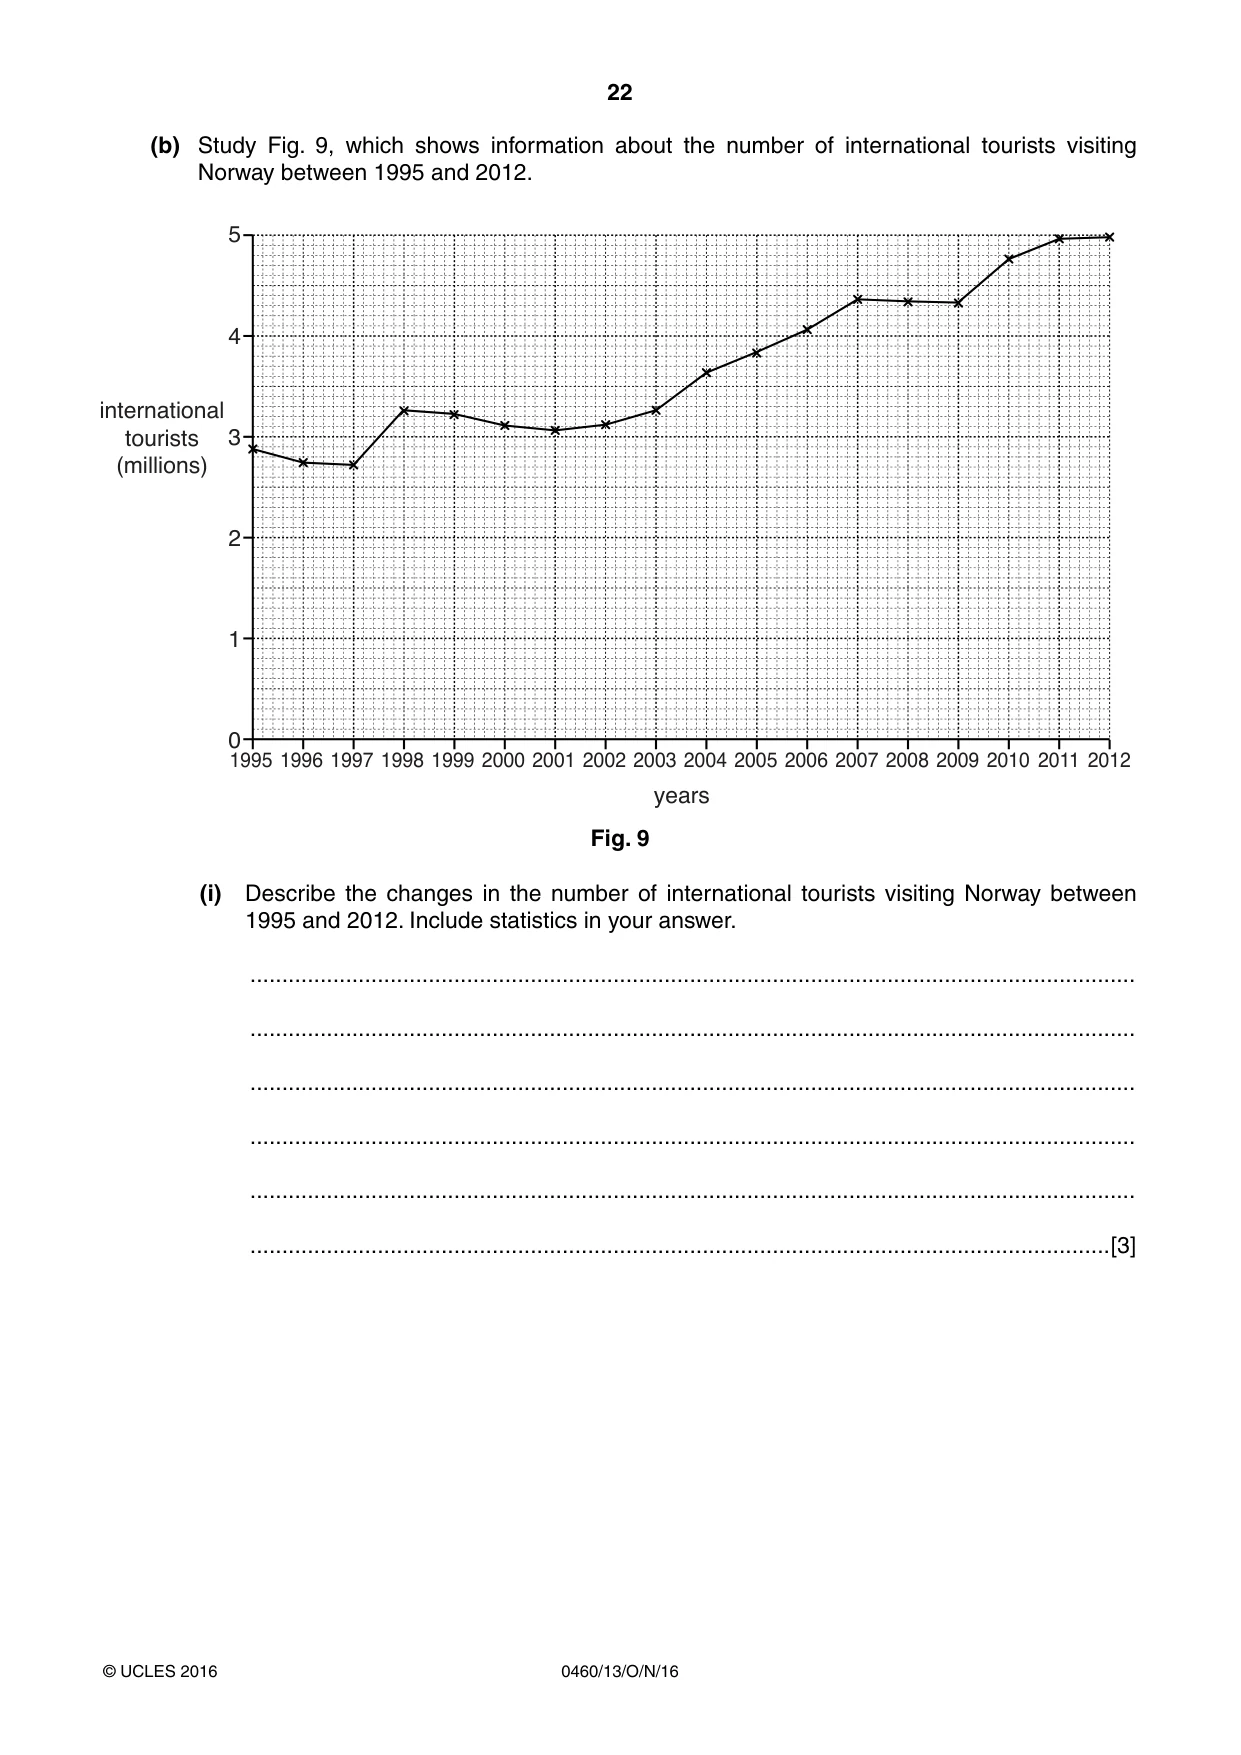
22 0460/13/O/N/16 © UCLES 2016 (b) Study Fig. 9, which shows information about the number of international tourists visiting Norway between 1995 and 2012. 1995 1996 1997 1998 1999 2000 2001 2002 2003 2004 2005 2006 2007 2008 2009 2010 2011 2012 5 4 3 2 1 0 international tourists (millions) years Fig. 9 (i) Describe the changes in the number of international tourists visiting Norway between 1995 and 2012. Include statistics in your answer. … … … … … …[3]
Question paper, page 23
23 0460/13/O/N/16 © UCLES 2016 [Turn over (ii) Explain how the growth of international tourism encourages the development of the economy and infrastructure in a country. … … … … … … … … … …[5]
Question paper, page 24
24 0460/13/O/N/16 © UCLES 2016 (c) For a named area you have studied, describe an economic activity which takes place and explain how this is threatening the local natural environment. Name of area … … … … … … … … … … … … … … … … … … … … … … … … … … [7] [Total: 25 marks] END OF QUESTION 5
Question paper, page 25
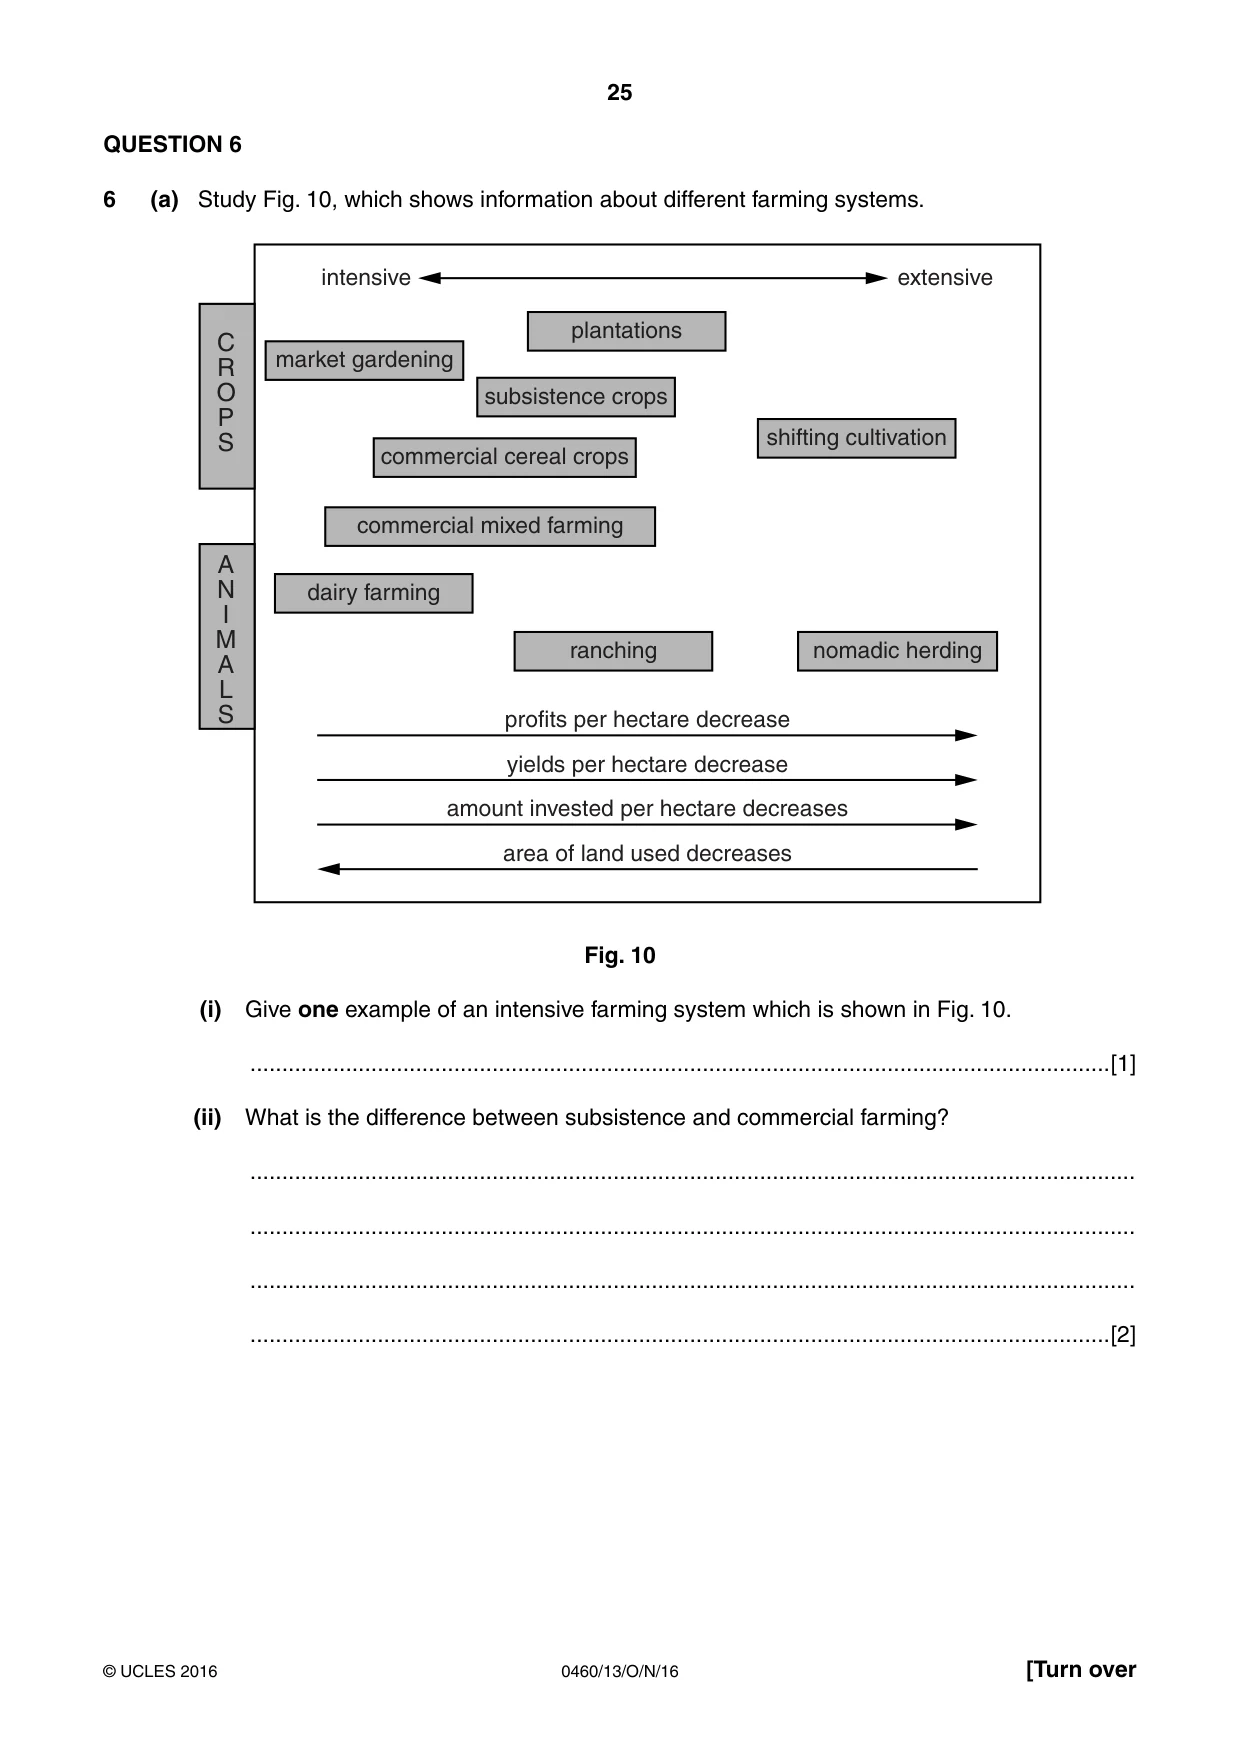
25 0460/13/O/N/16 © UCLES 2016 [Turn over QUESTION 6 6 (a) Study Fig. 10, which shows information about different farming systems. plantations market gardening subsistence crops shifting cultivation dairy farming ranching nomadic herding commercial cereal crops commercial mixed farming extensive intensive # 2 / 0 3 ! . ) - ! , 3 profits per hectare decrease yields per hectare decrease amount invested per hectare decreases area of land used decreases Fig. 10 (i) Give one example of an intensive farming system which is shown in Fig. 10. …[1] (ii) What is the difference between subsistence and commercial farming? … … … …[2]
Question paper, page 26
26 0460/13/O/N/16 © UCLES 2016 (iii) Identify the following types of farming which are shown in Fig. 10: • The extensive rearing of animals by farmers who move from place to place in search of pasture; ………………………………………………. • The intensive rearing of animals for milk; ………………………………………………. • The production of both crops and animals for sale. ………………………………………………. [3] (iv) Suggest reasons why many farmers carry out intensive farming. … … … … … … … …[4]
Question paper, page 27
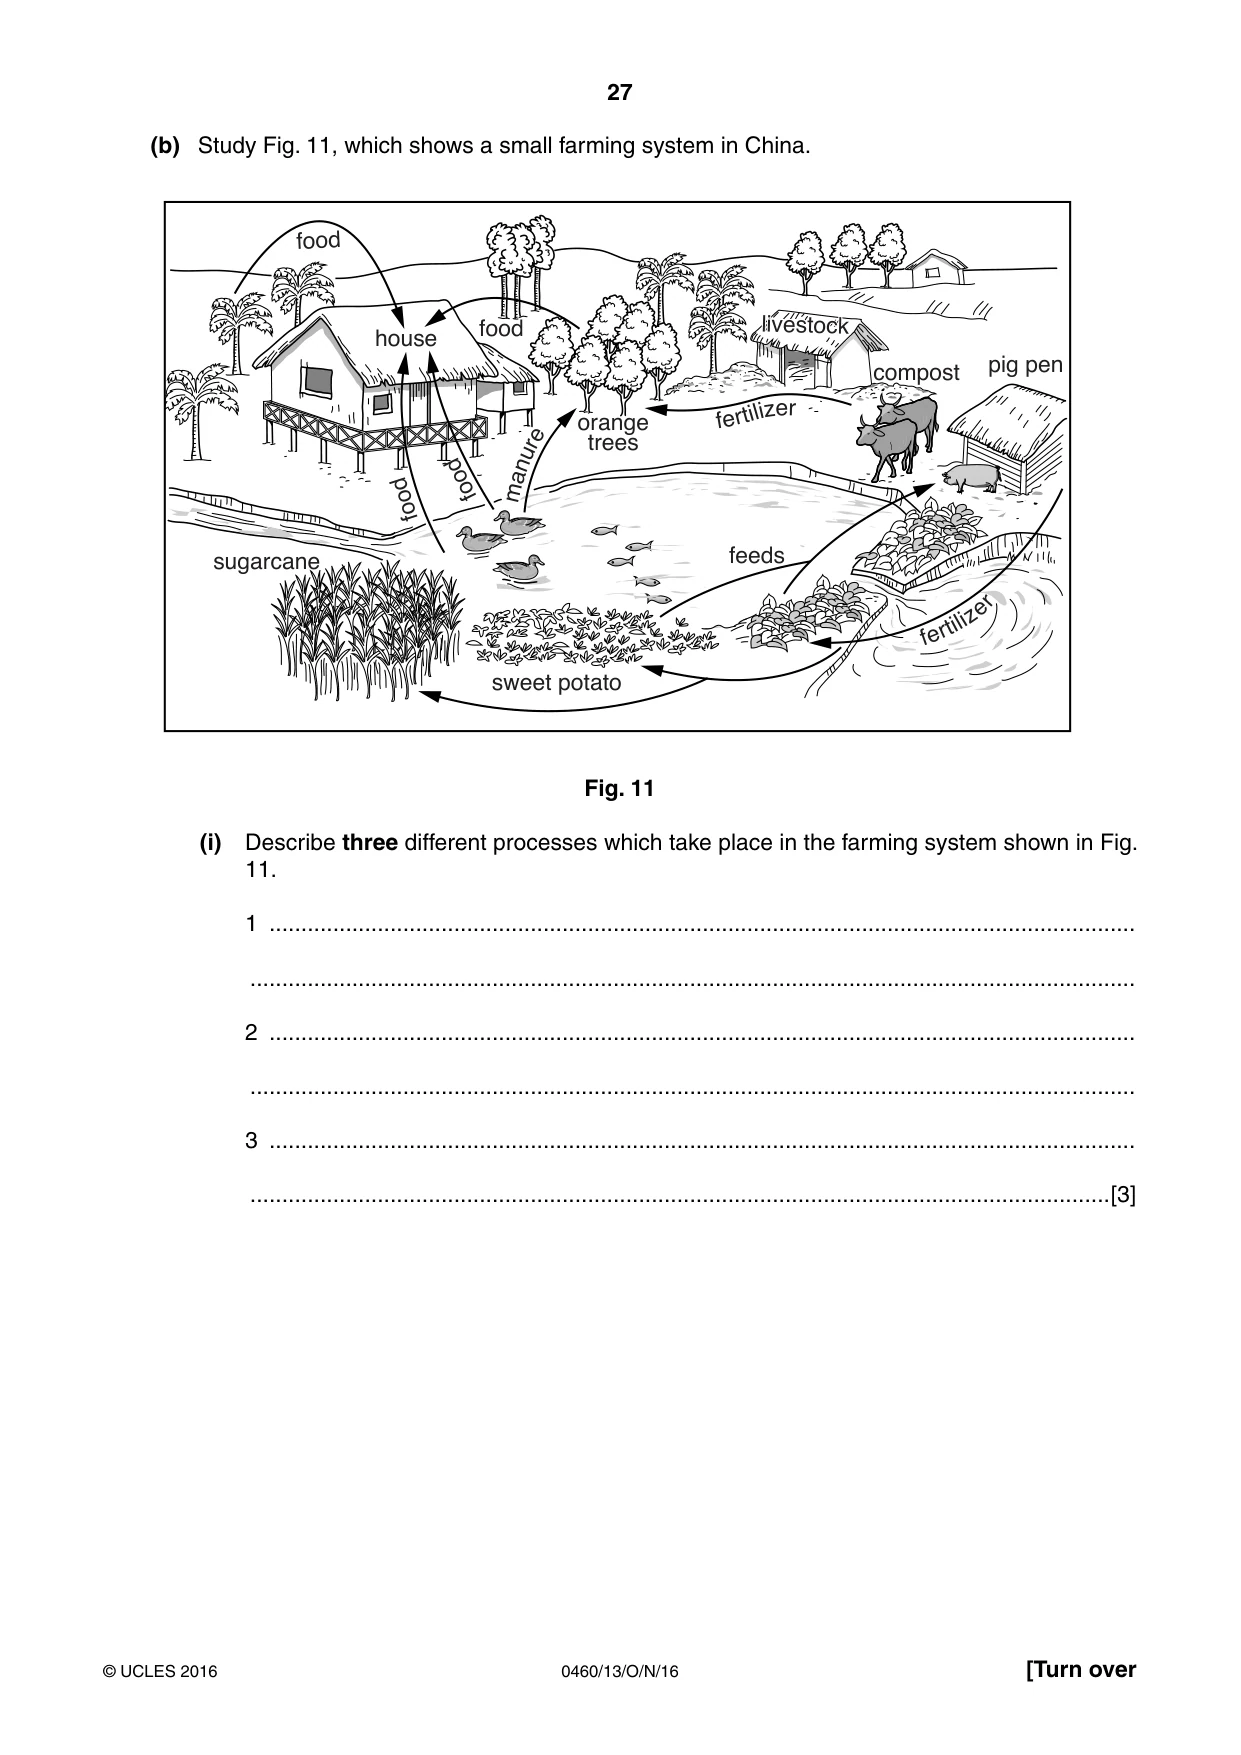
27 0460/13/O/N/16 © UCLES 2016 [Turn over (b) Study Fig. 11, which shows a small farming system in China. house food food food food fe rt il i z e r sweet potato sugarcane orange trees fe rt il i z e r livestock livestock compost pig pen feeds m a n u r e Fig. 11 (i) Describe three different processes which take place in the farming system shown in Fig. 11. 1 … … 2 … … 3 … …[3]
Question paper, page 28
28 0460/13/O/N/16 © UCLES 2016 (ii) Suggest how the land use shown in Fig. 11 may have been influenced by natural and human factors. … … … … … … … … … …[5]
Question paper, page 29
29 0460/13/O/N/16 © UCLES 2016 (c) For a named country or region you have studied, describe the causes of food shortages. Name of country or region … … … … … … … … … … … … … … … … … … … … … … … … … … … [7] [Total: 25 marks] END OF QUESTION 6
Question paper, page 30
30 0460/13/O/N/16 © UCLES 2016 Additional Pages If you use the following lined pages to complete the answer(s) to any question(s), the question number(s) must be clearly shown. … … … … … … … … … … … … … … … … … … … … … … … … … …
Question paper, page 31
31 0460/13/O/N/16 © UCLES 2016 … … … … … … … … … … … … … … … … … … … … … … … … … … … …
Question paper, page 32
32 0460/13/O/N/16 © UCLES 2016 Permission to reproduce items where third-party owned material protected by copyright is included has been sought and cleared where possible. Every reasonable effort has been made by the publisher (UCLES) to trace copyright holders, but if any items requiring clearance have unwittingly been included, the publisher will be pleased to make amends at the earliest possible opportunity. To avoid the issue of disclosure of answer-related information to candidates, all copyright acknowledgements are reproduced online in the Cambridge International Examinations Copyright Acknowledgements Booklet. This is produced for each series of examinations and is freely available to download at www.cie.org.uk after the live examination series. Cambridge International Examinations is part of the Cambridge Assessment Group. Cambridge Assessment is the brand name of University of Cambridge Local Examinations Syndicate (UCLES), which is itself a department of the University of Cambridge. BLANK PAGE
Mark scheme, page 1
® IGCSE is the registered trademark of Cambridge International Examinations. This syllabus is approved for use in England, Wales and Northern Ireland as a Cambridge International Level 1/Level 2 Certificate. This document consists of 16 printed pages. © UCLES 2016 [Turn over Cambridge International Examinations Cambridge International General Certificate of Secondary Education GEOGRAPHY 0460/13 Paper 1 October/November 2016 MARK SCHEME Maximum Mark: 75 Published This mark scheme is published as an aid to teachers and candidates, to indicate the requirements of the examination. It shows the basis on which Examiners were instructed to award marks. It does not indicate the details of the discussions that took place at an Examiners’ meeting before marking began, which would have considered the acceptability of alternative answers. Mark schemes should be read in conjunction with the question paper and the Principal Examiner Report for Teachers. Cambridge will not enter into discussions about these mark schemes. Cambridge is publishing the mark schemes for the October/November 2016 series for most Cambridge IGCSE®, Cambridge International A and AS Level components and some Cambridge O Level components.
Mark scheme, page 2
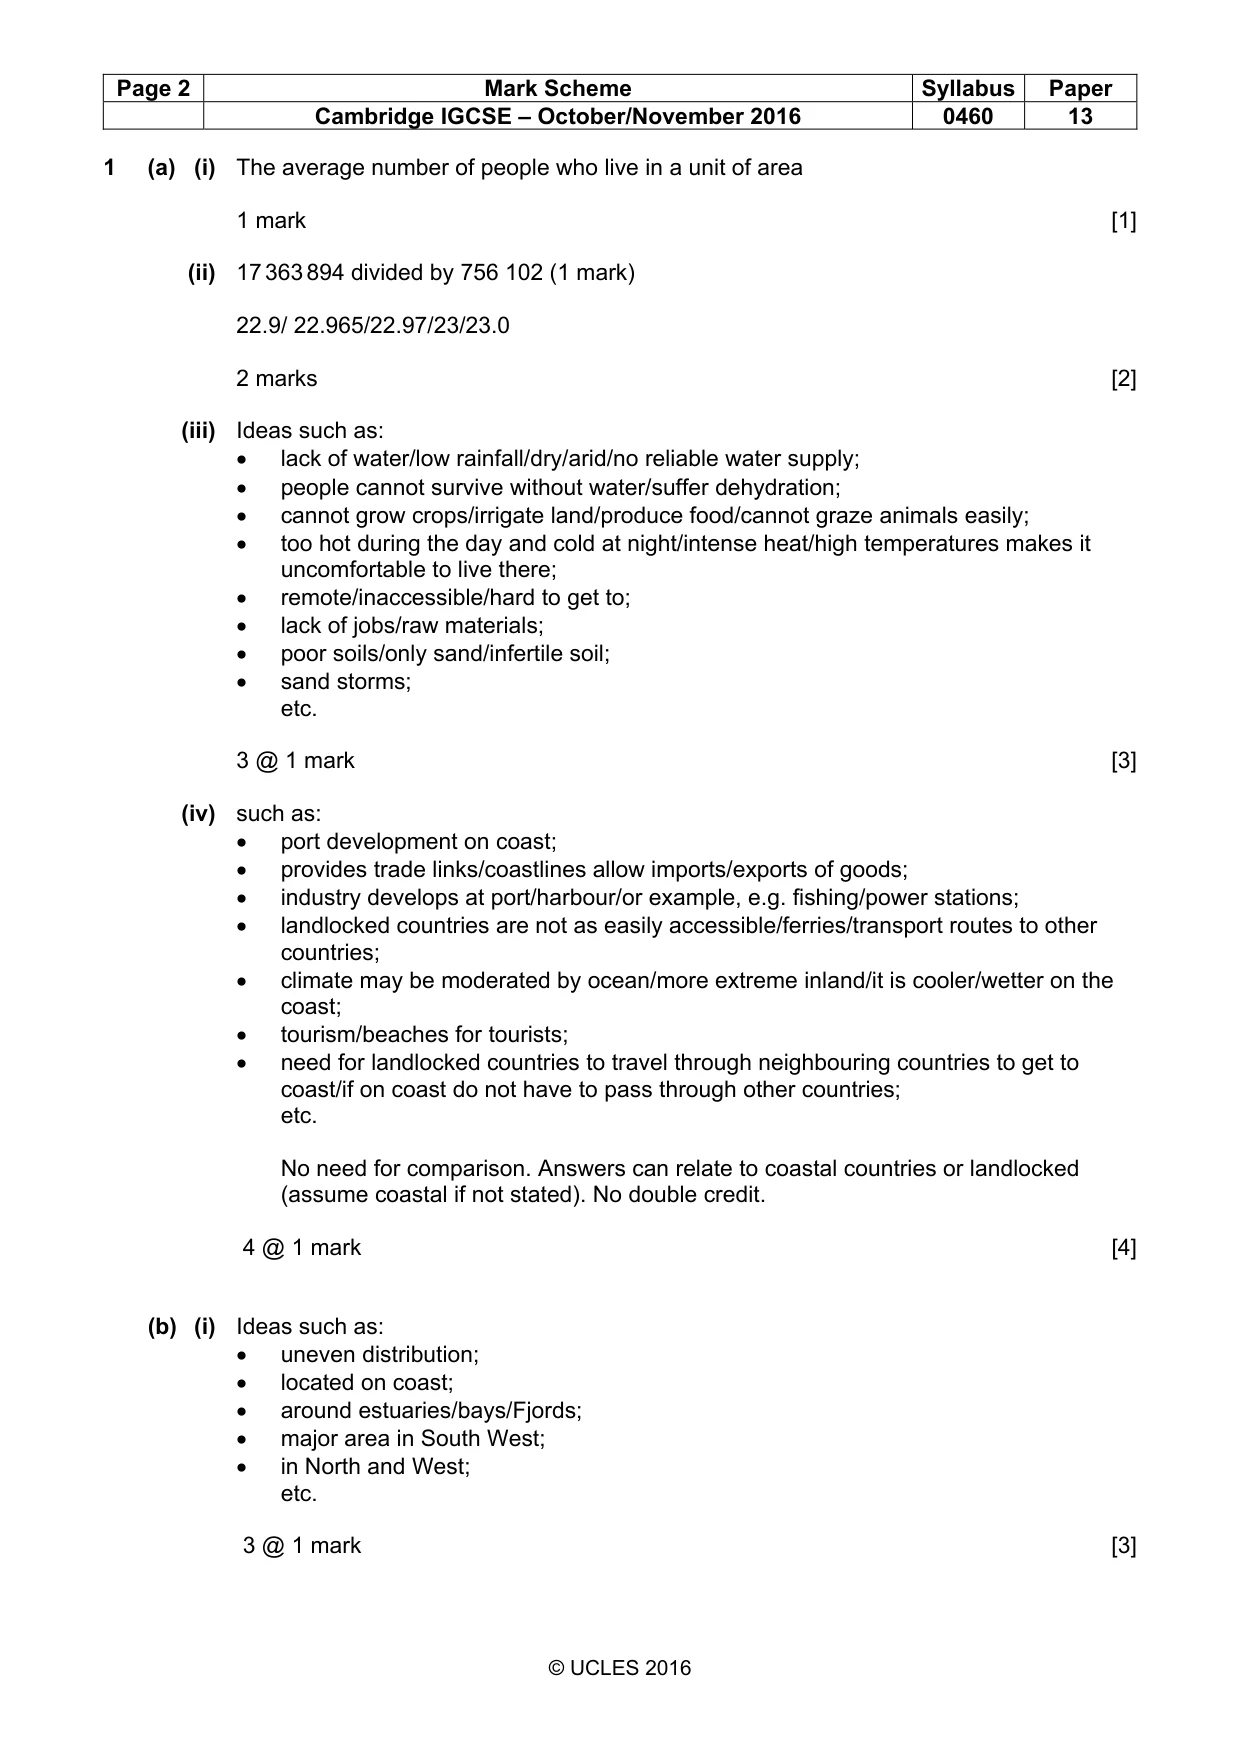
Page 2 Mark Scheme Syllabus Paper Cambridge IGCSE – October/November 2016 0460 13 © UCLES 2016 1 (a) (i) The average number of people who live in a unit of area 1 mark [1] (ii) 17 363 894 divided by 756 102 (1 mark) 22.9/ 22.965/22.97/23/23.0 2 marks [2] (iii) Ideas such as: • lack of water/low rainfall/dry/arid/no reliable water supply; • people cannot survive without water/suffer dehydration; • cannot grow crops/irrigate land/produce food/cannot graze animals easily; • too hot during the day and cold at night/intense heat/high temperatures makes it uncomfortable to live there; • remote/inaccessible/hard to get to; • lack of jobs/raw materials; • poor soils/only sand/infertile soil; • sand storms; etc. 3 @ 1 mark [3] (iv) such as: • port development on coast; • provides trade links/coastlines allow imports/exports of goods; • industry develops at port/harbour/or example, e.g. fishing/power stations; • landlocked countries are not as easily accessible/ferries/transport routes to other countries; • climate may be moderated by ocean/more extreme inland/it is cooler/wetter on the coast; • tourism/beaches for tourists; • need for landlocked countries to travel through neighbouring countries to get to coast/if on coast do not have to pass through other countries; etc. No need for comparison. Answers can relate to coastal countries or landlocked (assume coastal if not stated). No double credit. 4 @ 1 mark [4] (b) (i) Ideas such as: • uneven distribution; • located on coast; • around estuaries/bays/Fjords; • major area in South West; • in North and West; etc. 3 @ 1 mark [3]
Mark scheme, page 3
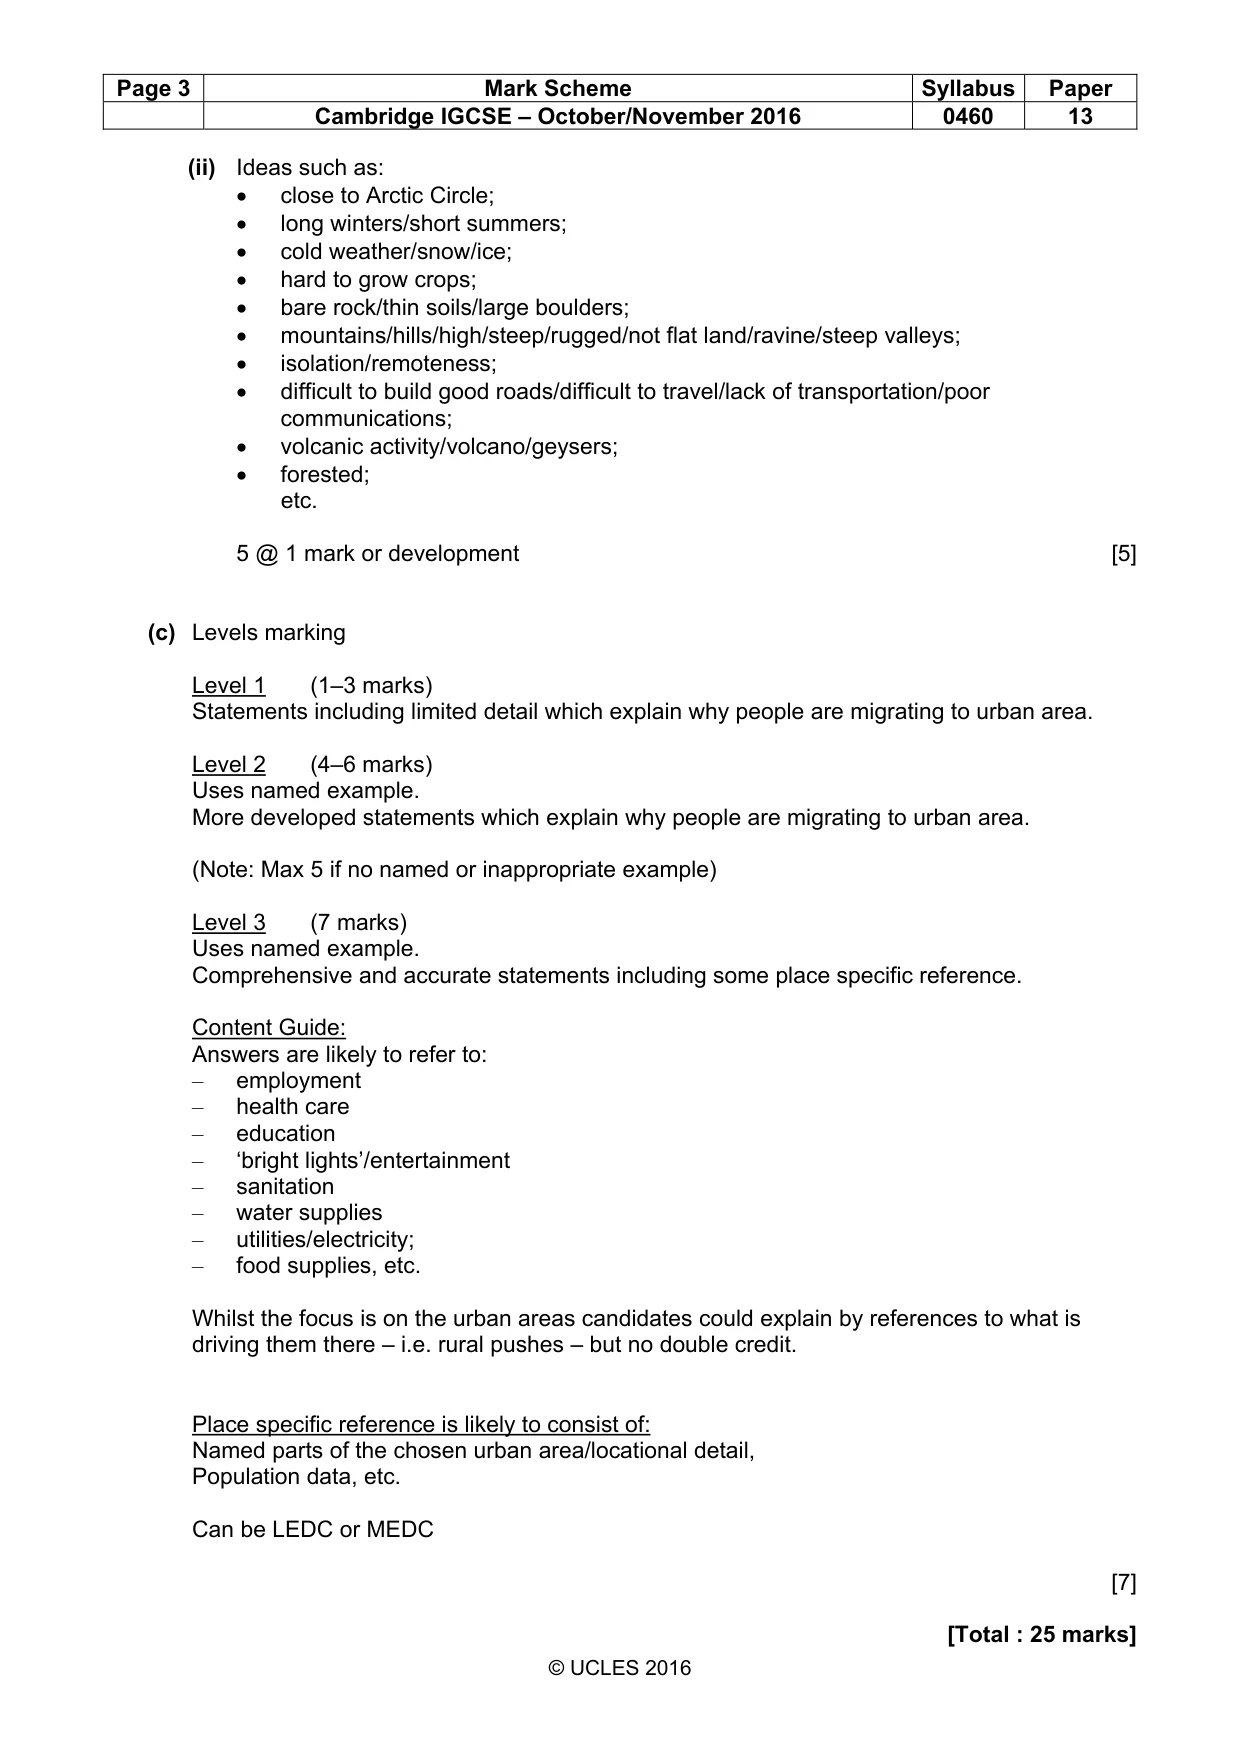
Page 3 Mark Scheme Syllabus Paper Cambridge IGCSE – October/November 2016 0460 13 © UCLES 2016 (ii) Ideas such as: • close to Arctic Circle; • long winters/short summers; • cold weather/snow/ice; • hard to grow crops; • bare rock/thin soils/large boulders; • mountains/hills/high/steep/rugged/not flat land/ravine/steep valleys; • isolation/remoteness; • difficult to build good roads/difficult to travel/lack of transportation/poor communications; • volcanic activity/volcano/geysers; • forested; etc. 5 @ 1 mark or development [5] (c) Levels marking Level 1 (1–3 marks) Statements including limited detail which explain why people are migrating to urban area. Level 2 (4–6 marks) Uses named example. More developed statements which explain why people are migrating to urban area. (Note: Max 5 if no named or inappropriate example) Level 3 (7 marks) Uses named example. Comprehensive and accurate statements including some place specific reference. Content Guide: Answers are likely to refer to: – employment – health care – education – ‘bright lights’/entertainment – sanitation – water supplies – utilities/electricity; – food supplies, etc. Whilst the focus is on the urban areas candidates could explain by references to what is driving them there – i.e. rural pushes – but no double credit. Place specific reference is likely to consist of: Named parts of the chosen urban area/locational detail, Population data, etc. Can be LEDC or MEDC [7] [Total : 25 marks]
Mark scheme, page 4
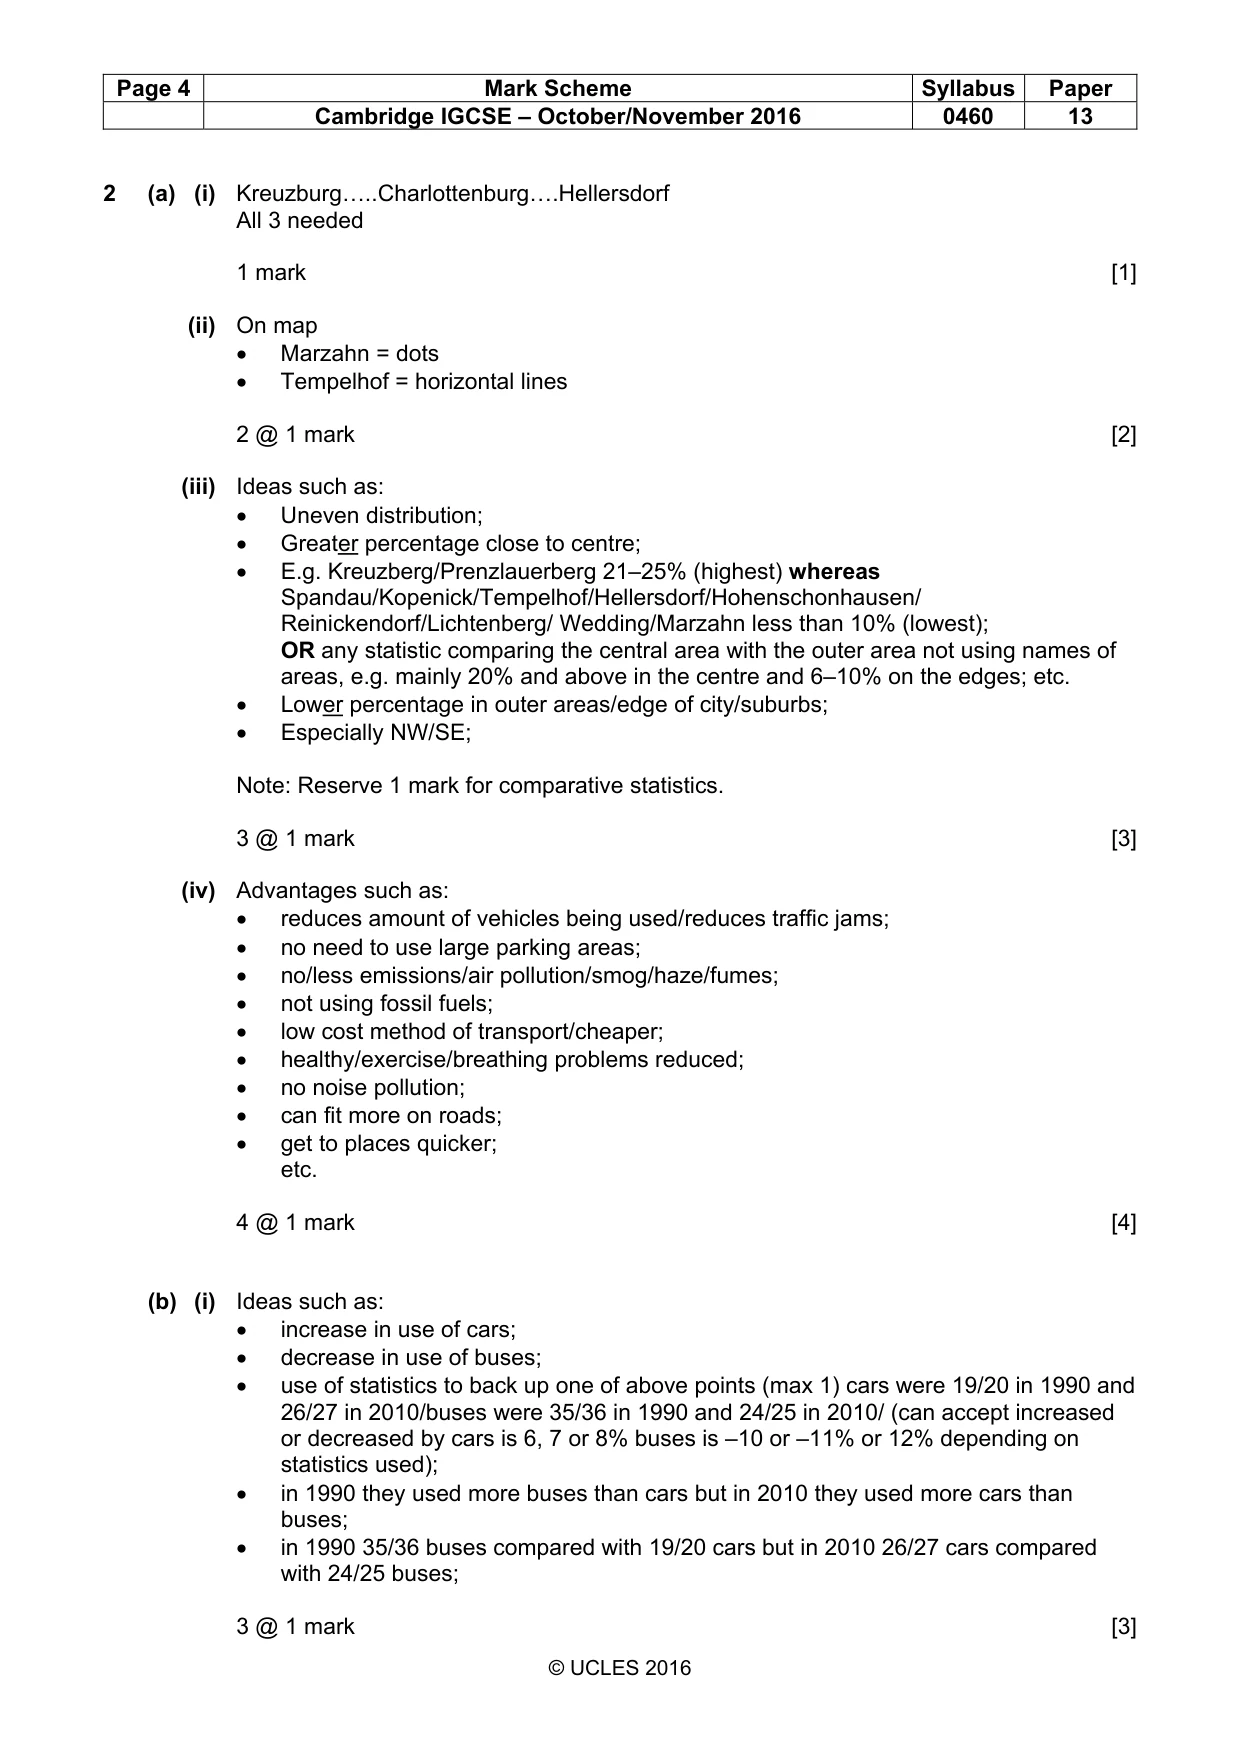
Page 4 Mark Scheme Syllabus Paper Cambridge IGCSE – October/November 2016 0460 13 © UCLES 2016 2 (a) (i) Kreuzburg…..Charlottenburg….Hellersdorf All 3 needed 1 mark [1] (ii) On map • Marzahn = dots • Tempelhof = horizontal lines 2 @ 1 mark [2] (iii) Ideas such as: • Uneven distribution; • Greater percentage close to centre; • E.g. Kreuzberg/Prenzlauerberg 21–25% (highest) whereas Spandau/Kopenick/Tempelhof/Hellersdorf/Hohenschonhausen/ Reinickendorf/Lichtenberg/ Wedding/Marzahn less than 10% (lowest); OR any statistic comparing the central area with the outer area not using names of areas, e.g. mainly 20% and above in the centre and 6–10% on the edges; etc. • Lower percentage in outer areas/edge of city/suburbs; • Especially NW/SE; Note: Reserve 1 mark for comparative statistics. 3 @ 1 mark [3] (iv) Advantages such as: • reduces amount of vehicles being used/reduces traffic jams; • no need to use large parking areas; • no/less emissions/air pollution/smog/haze/fumes; • not using fossil fuels; • low cost method of transport/cheaper; • healthy/exercise/breathing problems reduced; • no noise pollution; • can fit more on roads; • get to places quicker; etc. 4 @ 1 mark [4] (b) (i) Ideas such as: • increase in use of cars; • decrease in use of buses; • use of statistics to back up one of above points (max 1) cars were 19/20 in 1990 and 26/27 in 2010/buses were 35/36 in 1990 and 24/25 in 2010/ (can accept increased or decreased by cars is 6, 7 or 8% buses is –10 or –11% or 12% depending on statistics used); • in 1990 they used more buses than cars but in 2010 they used more cars than buses; • in 1990 35/36 buses compared with 19/20 cars but in 2010 26/27 cars compared with 24/25 buses; 3 @ 1 mark [3]
Mark scheme, page 5
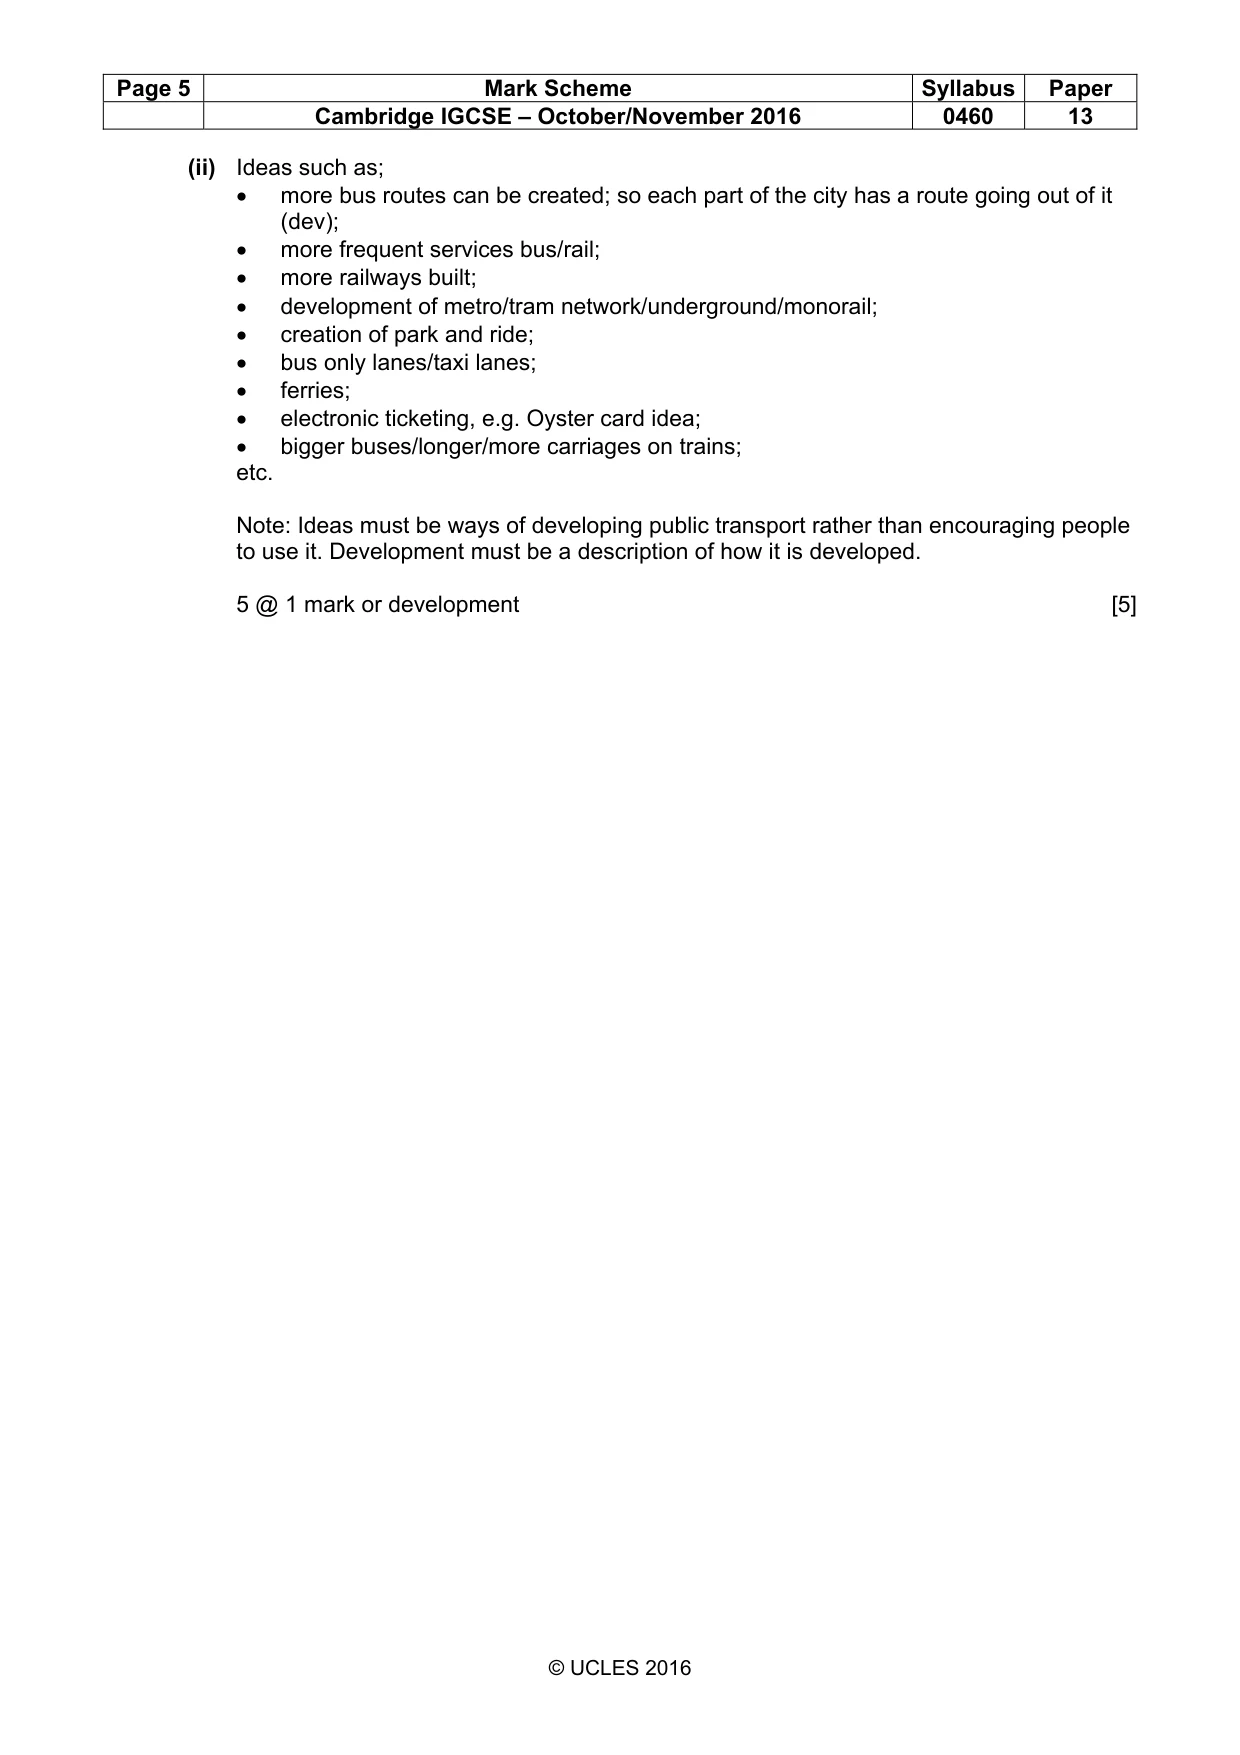
Page 5 Mark Scheme Syllabus Paper Cambridge IGCSE – October/November 2016 0460 13 © UCLES 2016 (ii) Ideas such as; • more bus routes can be created; so each part of the city has a route going out of it (dev); • more frequent services bus/rail; • more railways built; • development of metro/tram network/underground/monorail; • creation of park and ride; • bus only lanes/taxi lanes; • ferries; • electronic ticketing, e.g. Oyster card idea; • bigger buses/longer/more carriages on trains; etc. Note: Ideas must be ways of developing public transport rather than encouraging people to use it. Development must be a description of how it is developed. 5 @ 1 mark or development [5]
Mark scheme, page 6
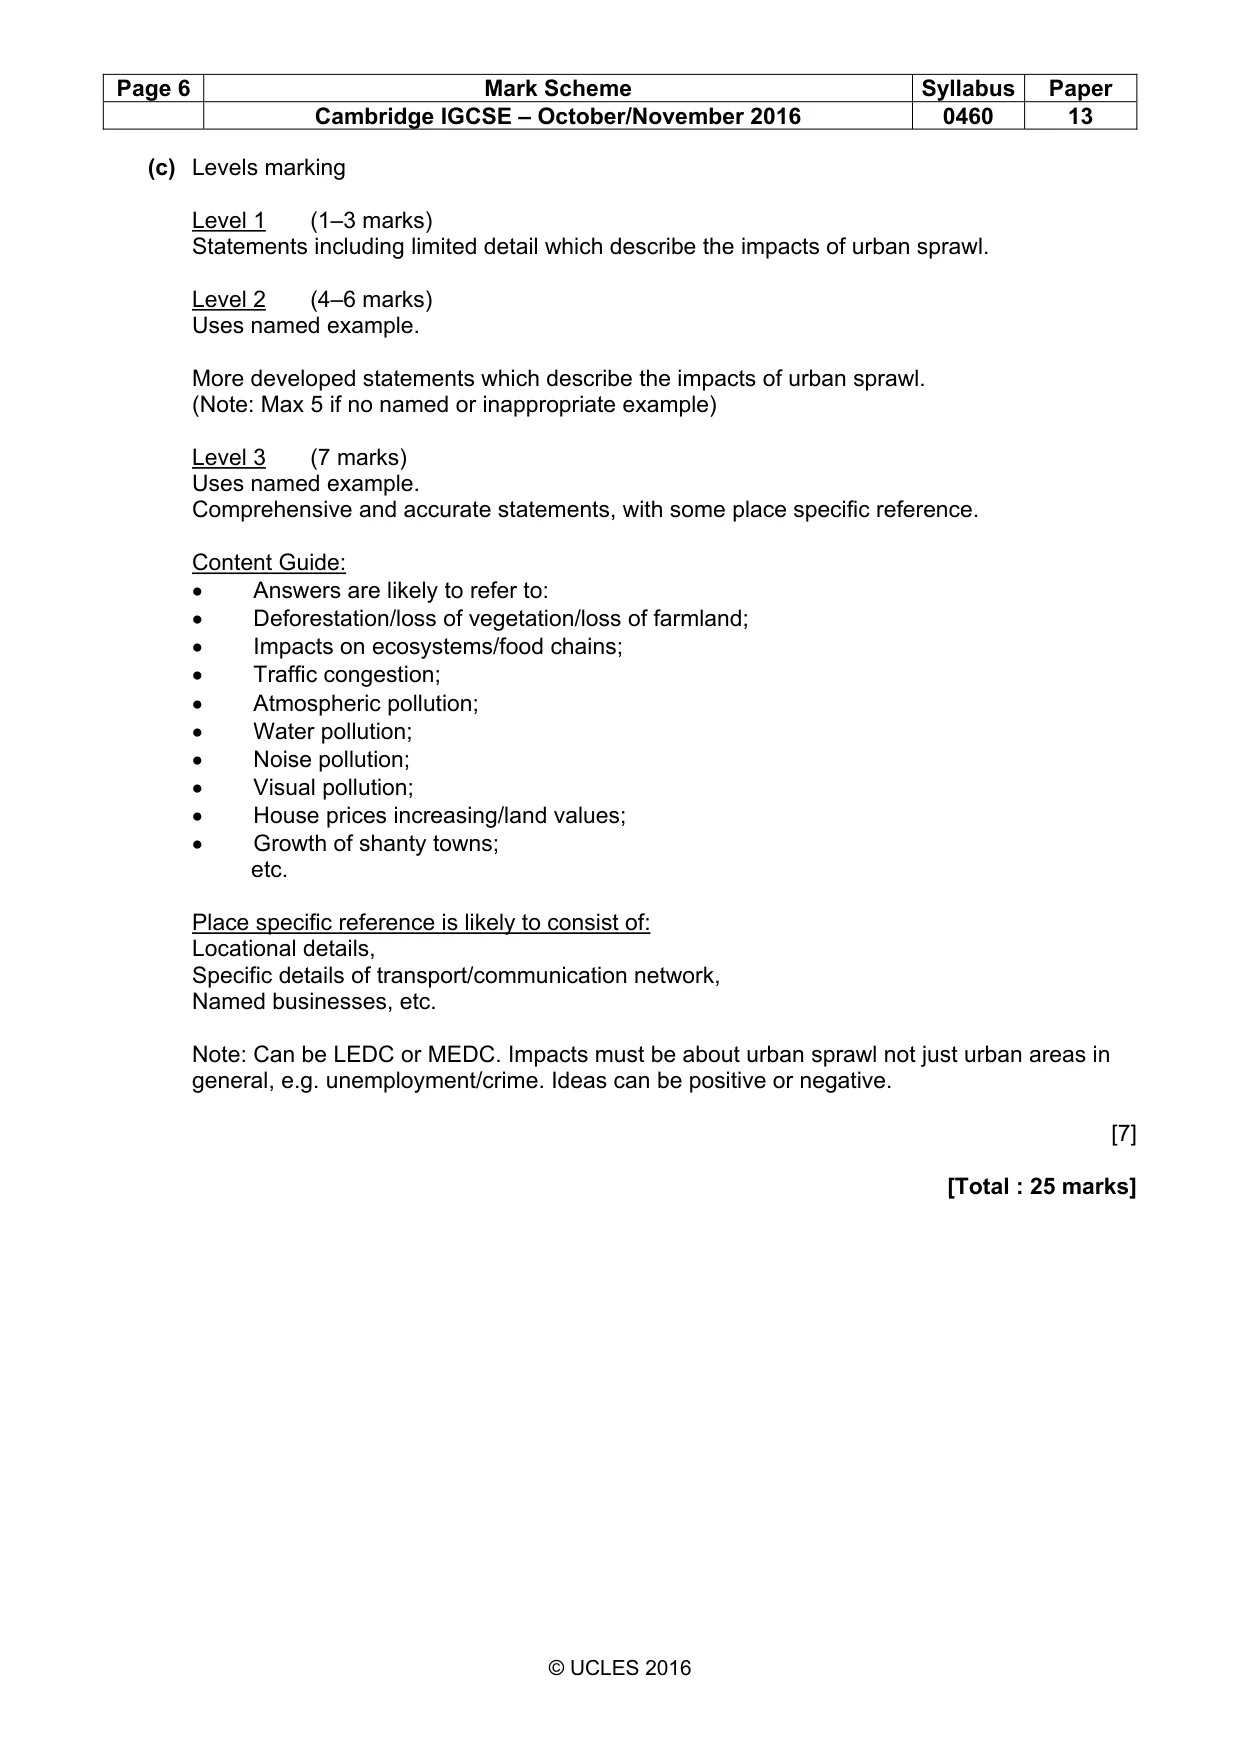
Page 6 Mark Scheme Syllabus Paper Cambridge IGCSE – October/November 2016 0460 13 © UCLES 2016 (c) Levels marking Level 1 (1–3 marks) Statements including limited detail which describe the impacts of urban sprawl. Level 2 (4–6 marks) Uses named example. More developed statements which describe the impacts of urban sprawl. (Note: Max 5 if no named or inappropriate example) Level 3 (7 marks) Uses named example. Comprehensive and accurate statements, with some place specific reference. Content Guide: • Answers are likely to refer to: • Deforestation/loss of vegetation/loss of farmland; • Impacts on ecosystems/food chains; • Traffic congestion; • Atmospheric pollution; • Water pollution; • Noise pollution; • Visual pollution; • House prices increasing/land values; • Growth of shanty towns; etc. Place specific reference is likely to consist of: Locational details, Specific details of transport/communication network, Named businesses, etc. Note: Can be LEDC or MEDC. Impacts must be about urban sprawl not just urban areas in general, e.g. unemployment/crime. Ideas can be positive or negative. [7] [Total : 25 marks]
Mark scheme, page 7
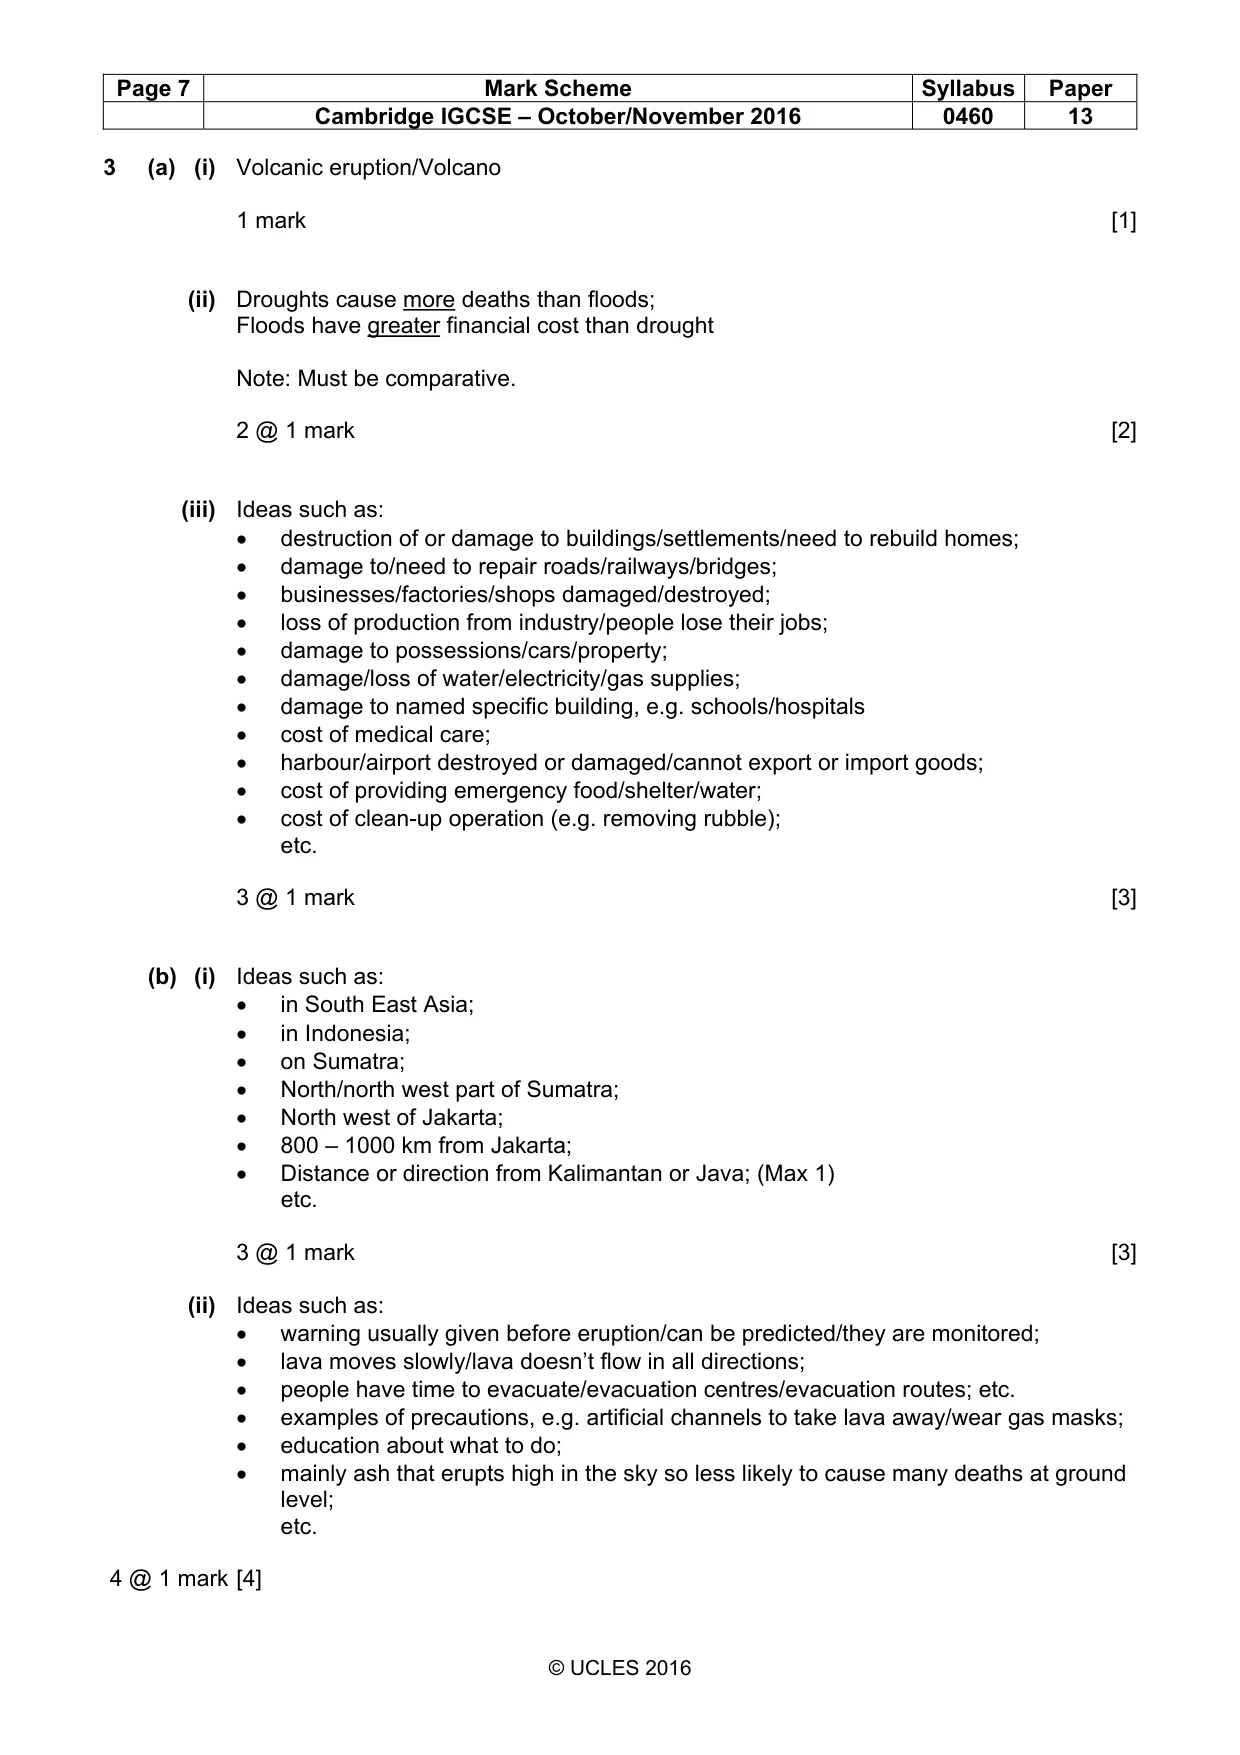
Page 7 Mark Scheme Syllabus Paper Cambridge IGCSE – October/November 2016 0460 13 © UCLES 2016 3 (a) (i) Volcanic eruption/Volcano 1 mark [1] (ii) Droughts cause more deaths than floods; Floods have greater financial cost than drought Note: Must be comparative. 2 @ 1 mark [2] (iii) Ideas such as: • destruction of or damage to buildings/settlements/need to rebuild homes; • damage to/need to repair roads/railways/bridges; • businesses/factories/shops damaged/destroyed; • loss of production from industry/people lose their jobs; • damage to possessions/cars/property; • damage/loss of water/electricity/gas supplies; • damage to named specific building, e.g. schools/hospitals • cost of medical care; • harbour/airport destroyed or damaged/cannot export or import goods; • cost of providing emergency food/shelter/water; • cost of clean-up operation (e.g. removing rubble); etc. 3 @ 1 mark [3] (b) (i) Ideas such as: • in South East Asia; • in Indonesia; • on Sumatra; • North/north west part of Sumatra; • North west of Jakarta; • 800 – 1000 km from Jakarta; • Distance or direction from Kalimantan or Java; (Max 1) etc. 3 @ 1 mark [3] (ii) Ideas such as: • warning usually given before eruption/can be predicted/they are monitored; • lava moves slowly/lava doesn’t flow in all directions; • people have time to evacuate/evacuation centres/evacuation routes; etc. • examples of precautions, e.g. artificial channels to take lava away/wear gas masks; • education about what to do; • mainly ash that erupts high in the sky so less likely to cause many deaths at ground level; etc. 4 @ 1 mark [4]
Mark scheme, page 8
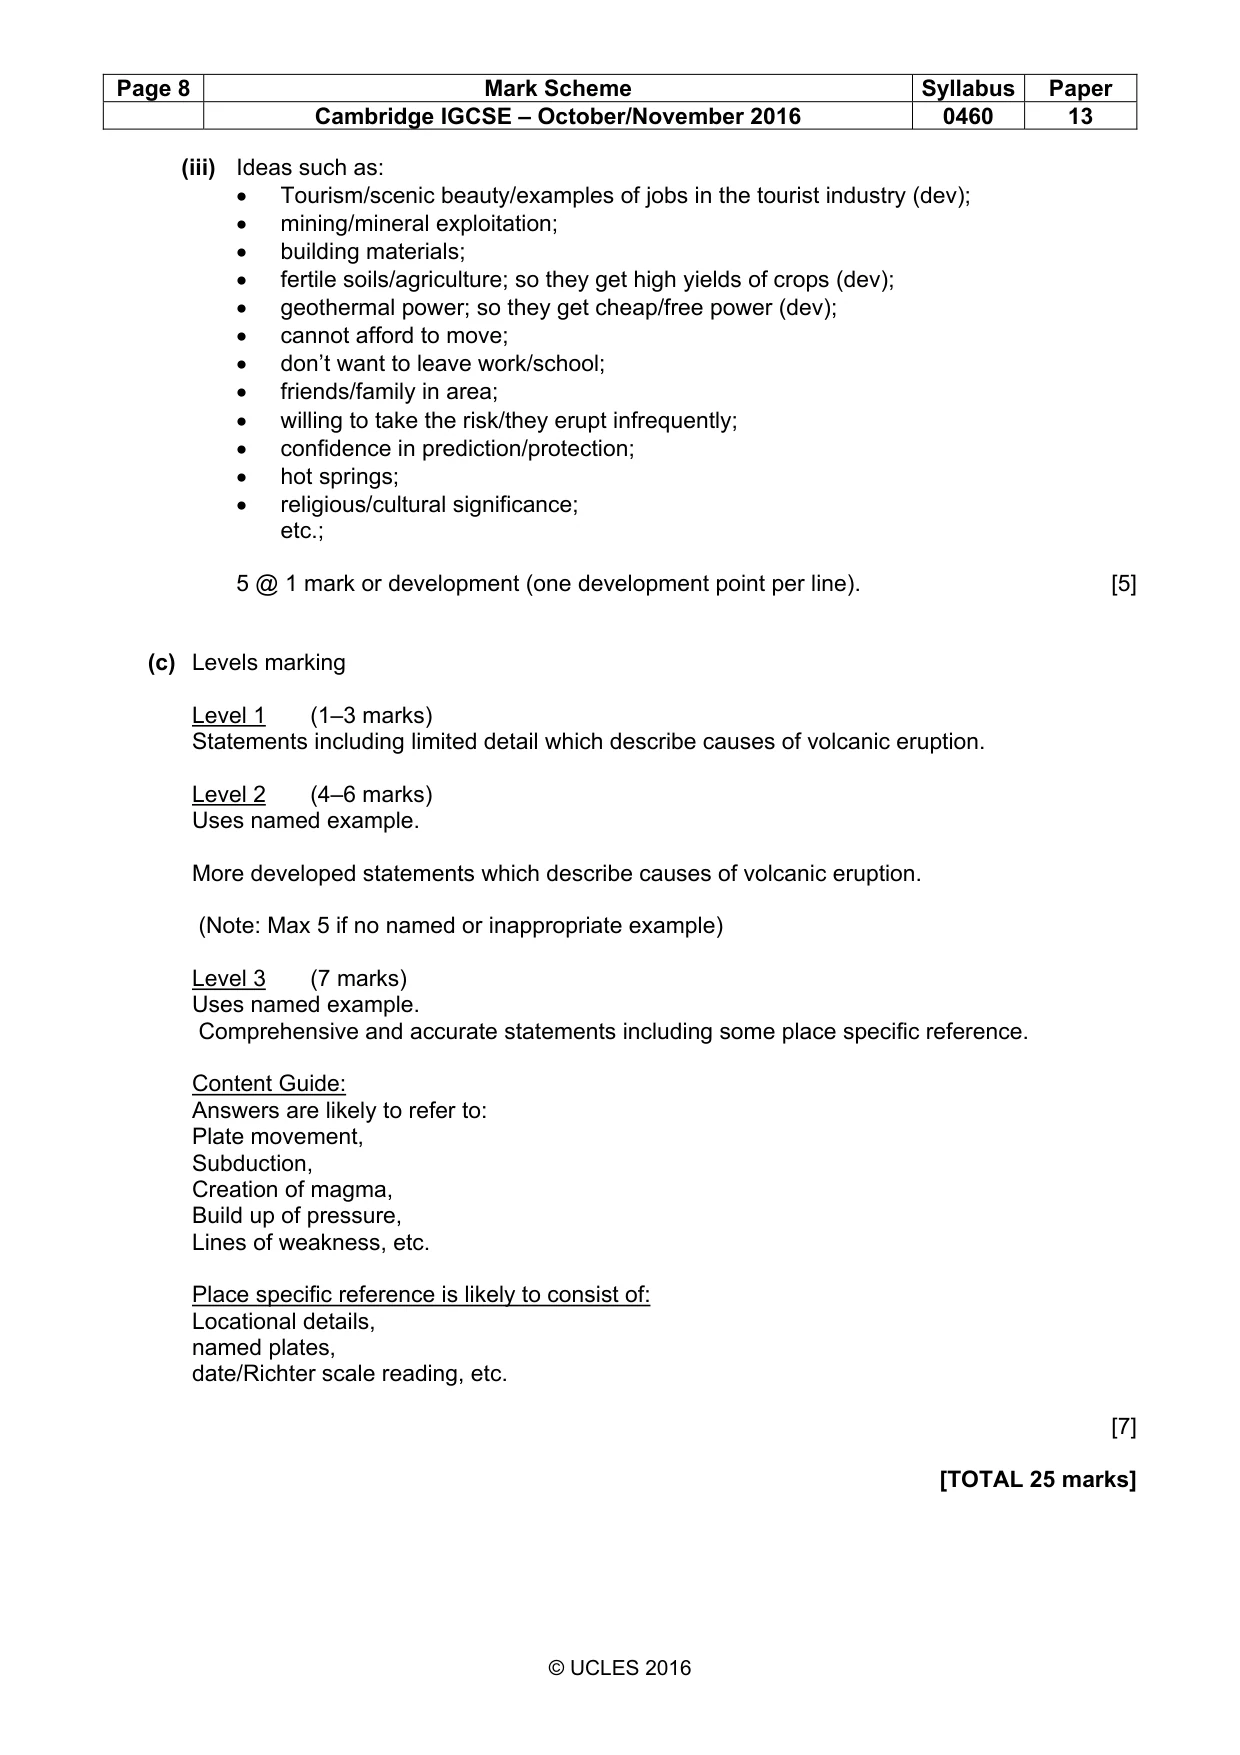
Page 8 Mark Scheme Syllabus Paper Cambridge IGCSE – October/November 2016 0460 13 © UCLES 2016 (iii) Ideas such as: • Tourism/scenic beauty/examples of jobs in the tourist industry (dev); • mining/mineral exploitation; • building materials; • fertile soils/agriculture; so they get high yields of crops (dev); • geothermal power; so they get cheap/free power (dev); • cannot afford to move; • don’t want to leave work/school; • friends/family in area; • willing to take the risk/they erupt infrequently; • confidence in prediction/protection; • hot springs; • religious/cultural significance; etc.; 5 @ 1 mark or development (one development point per line). [5] (c) Levels marking Level 1 (1–3 marks) Statements including limited detail which describe causes of volcanic eruption. Level 2 (4–6 marks) Uses named example. More developed statements which describe causes of volcanic eruption. (Note: Max 5 if no named or inappropriate example) Level 3 (7 marks) Uses named example. Comprehensive and accurate statements including some place specific reference. Content Guide: Answers are likely to refer to: Plate movement, Subduction, Creation of magma, Build up of pressure, Lines of weakness, etc. Place specific reference is likely to consist of: Locational details, named plates, date/Richter scale reading, etc. [7] [TOTAL 25 marks]
Mark scheme, page 9
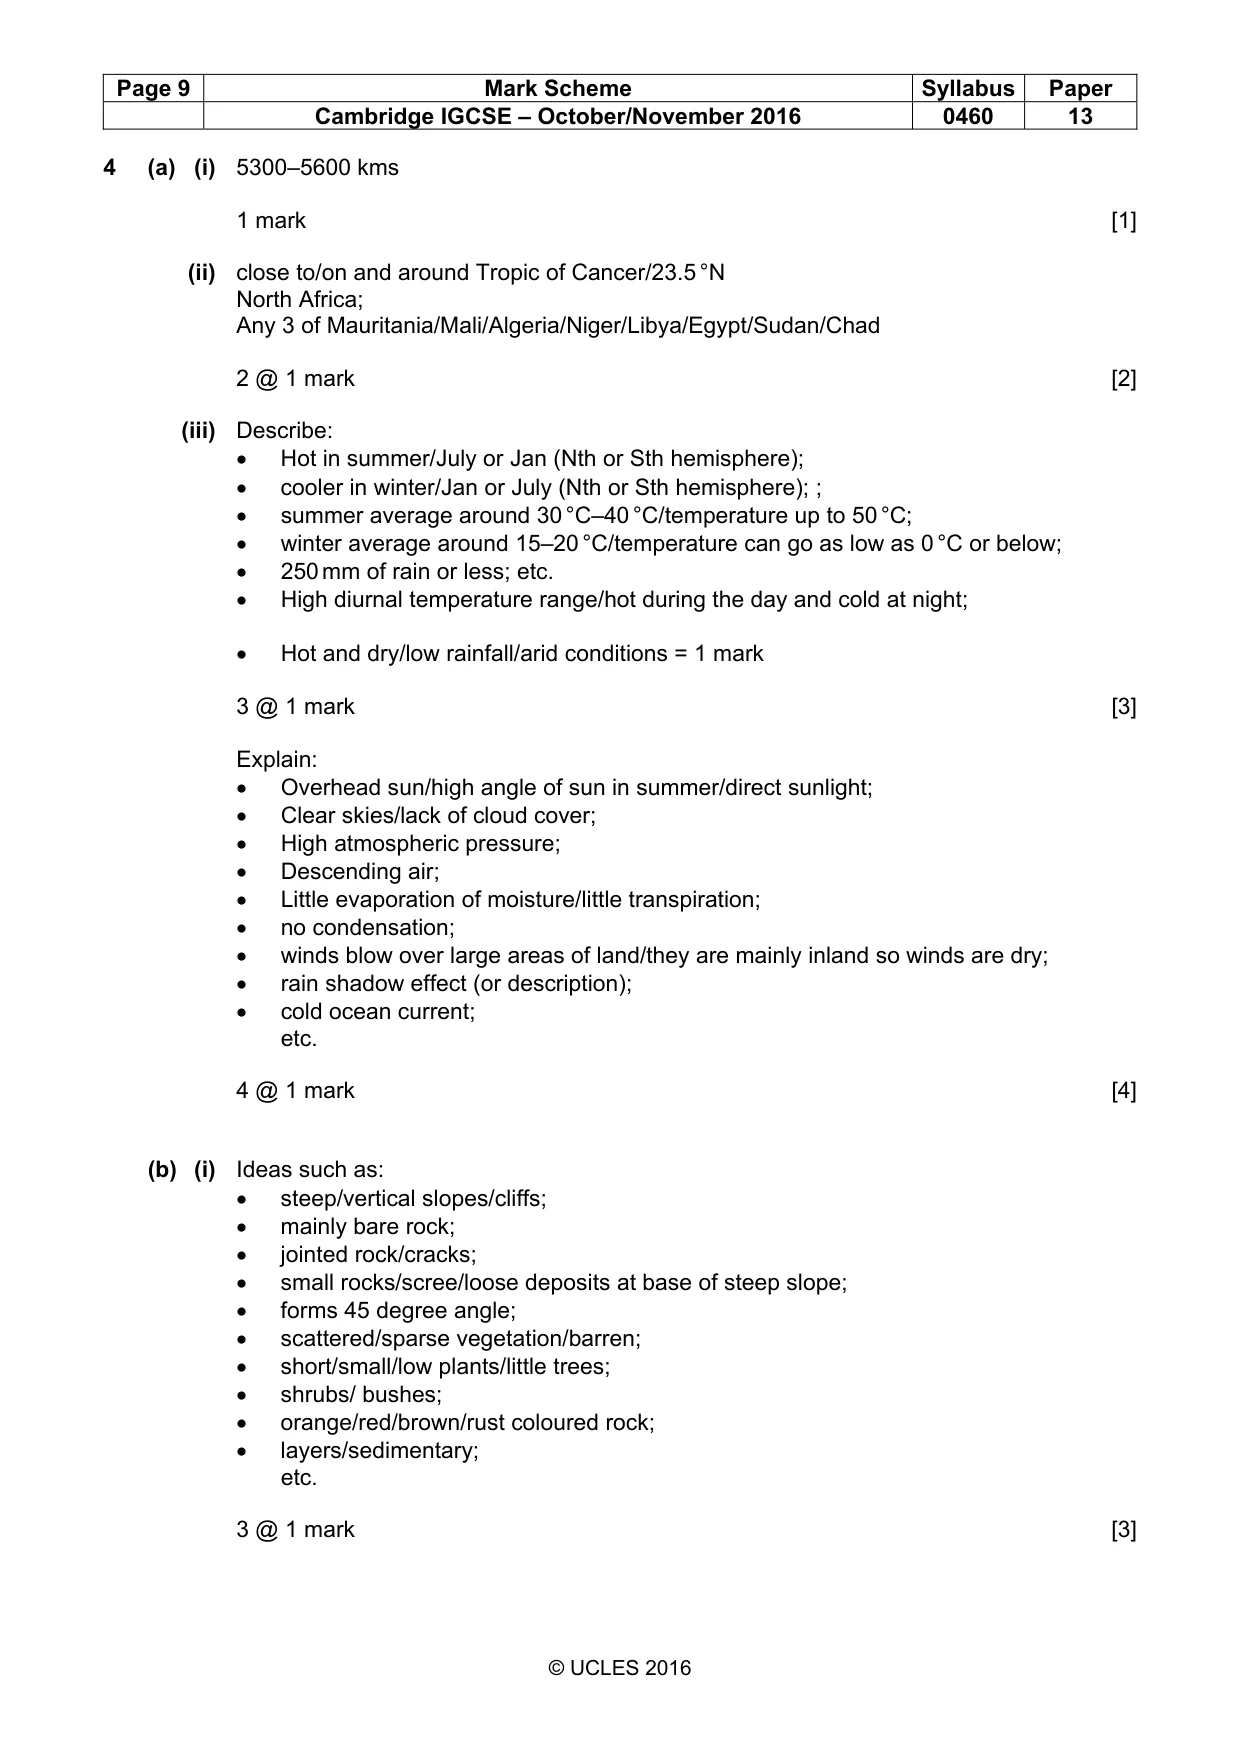
Page 9 Mark Scheme Syllabus Paper Cambridge IGCSE – October/November 2016 0460 13 © UCLES 2016 4 (a) (i) 5300–5600 kms 1 mark [1] (ii) close to/on and around Tropic of Cancer/23.5 °N North Africa; Any 3 of Mauritania/Mali/Algeria/Niger/Libya/Egypt/Sudan/Chad 2 @ 1 mark [2] (iii) Describe: • Hot in summer/July or Jan (Nth or Sth hemisphere); • cooler in winter/Jan or July (Nth or Sth hemisphere); ; • summer average around 30 °C–40 °C/temperature up to 50 °C; • winter average around 15–20 °C/temperature can go as low as 0 °C or below; • 250 mm of rain or less; etc. • High diurnal temperature range/hot during the day and cold at night; • Hot and dry/low rainfall/arid conditions = 1 mark 3 @ 1 mark [3] Explain: • Overhead sun/high angle of sun in summer/direct sunlight; • Clear skies/lack of cloud cover; • High atmospheric pressure; • Descending air; • Little evaporation of moisture/little transpiration; • no condensation; • winds blow over large areas of land/they are mainly inland so winds are dry; • rain shadow effect (or description); • cold ocean current; etc. 4 @ 1 mark [4] (b) (i) Ideas such as: • steep/vertical slopes/cliffs; • mainly bare rock; • jointed rock/cracks; • small rocks/scree/loose deposits at base of steep slope; • forms 45 degree angle; • scattered/sparse vegetation/barren; • short/small/low plants/little trees; • shrubs/ bushes; • orange/red/brown/rust coloured rock; • layers/sedimentary; etc. 3 @ 1 mark [3]
Mark scheme, page 10
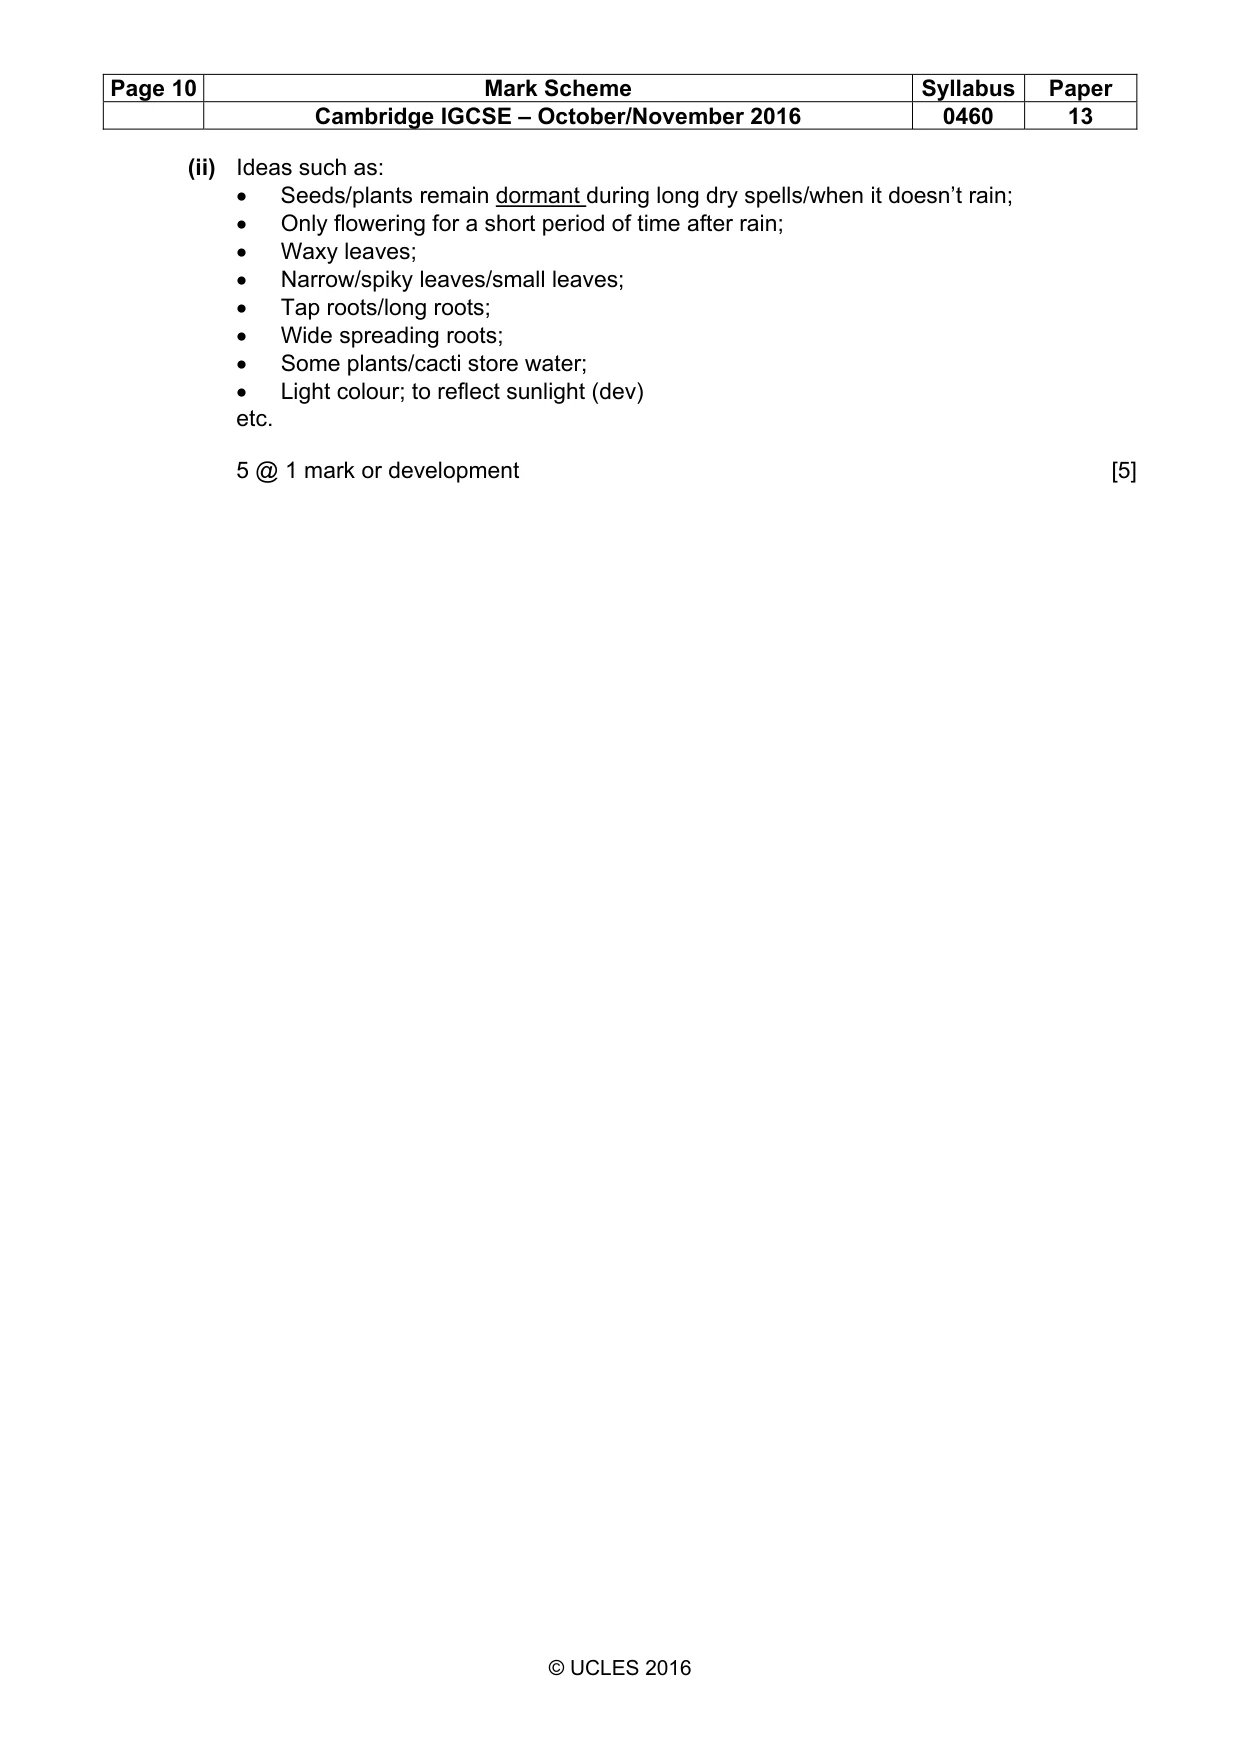
Page 10 Mark Scheme Syllabus Paper Cambridge IGCSE – October/November 2016 0460 13 © UCLES 2016 (ii) Ideas such as: • Seeds/plants remain dormant during long dry spells/when it doesn’t rain; • Only flowering for a short period of time after rain; • Waxy leaves; • Narrow/spiky leaves/small leaves; • Tap roots/long roots; • Wide spreading roots; • Some plants/cacti store water; • Light colour; to reflect sunlight (dev) etc. 5 @ 1 mark or development [5]
Mark scheme, page 11
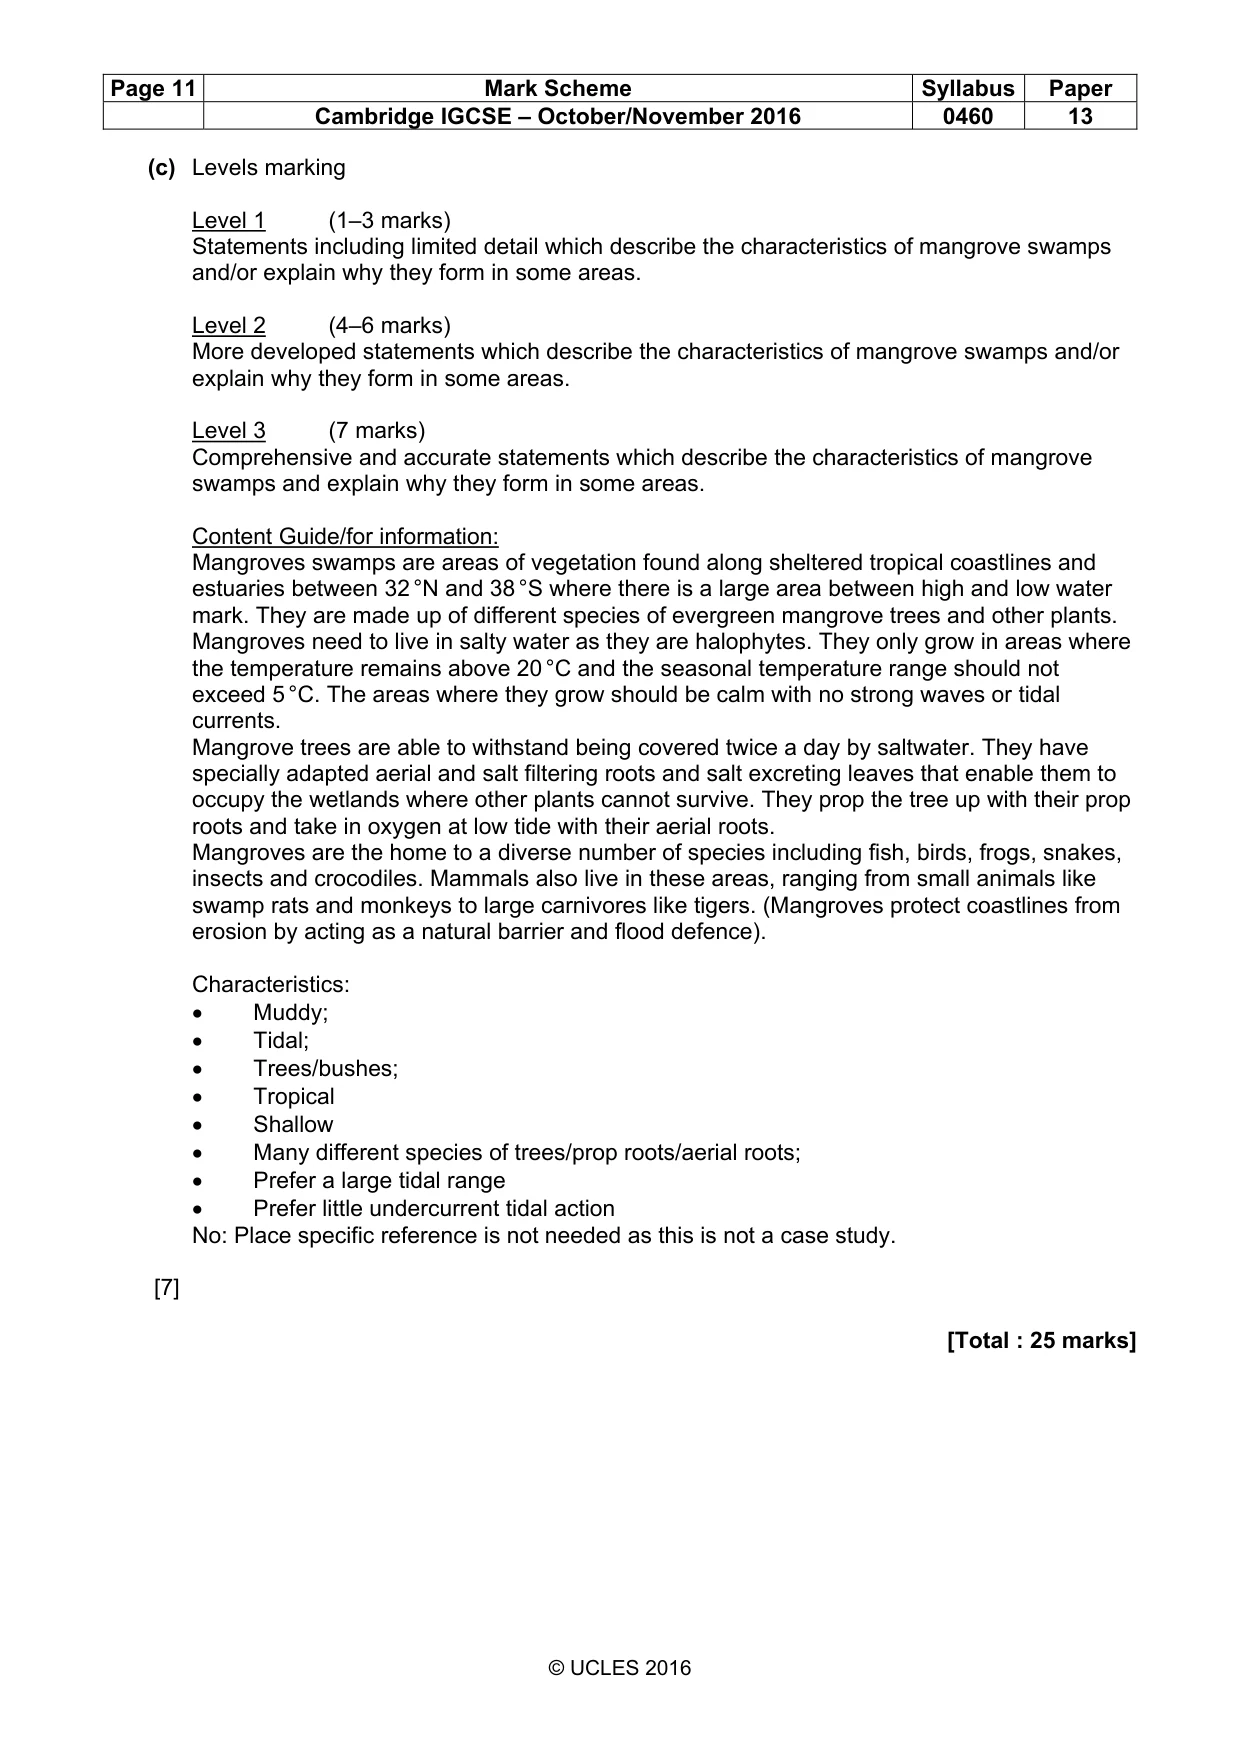
Page 11 Mark Scheme Syllabus Paper Cambridge IGCSE – October/November 2016 0460 13 © UCLES 2016 (c) Levels marking Level 1 (1–3 marks) Statements including limited detail which describe the characteristics of mangrove swamps and/or explain why they form in some areas. Level 2 (4–6 marks) More developed statements which describe the characteristics of mangrove swamps and/or explain why they form in some areas. Level 3 (7 marks) Comprehensive and accurate statements which describe the characteristics of mangrove swamps and explain why they form in some areas. Content Guide/for information: Mangroves swamps are areas of vegetation found along sheltered tropical coastlines and estuaries between 32 °N and 38 °S where there is a large area between high and low water mark. They are made up of different species of evergreen mangrove trees and other plants. Mangroves need to live in salty water as they are halophytes. They only grow in areas where the temperature remains above 20 °C and the seasonal temperature range should not exceed 5 °C. The areas where they grow should be calm with no strong waves or tidal currents. Mangrove trees are able to withstand being covered twice a day by saltwater. They have specially adapted aerial and salt filtering roots and salt excreting leaves that enable them to occupy the wetlands where other plants cannot survive. They prop the tree up with their prop roots and take in oxygen at low tide with their aerial roots. Mangroves are the home to a diverse number of species including fish, birds, frogs, snakes, insects and crocodiles. Mammals also live in these areas, ranging from small animals like swamp rats and monkeys to large carnivores like tigers. (Mangroves protect coastlines from erosion by acting as a natural barrier and flood defence). Characteristics: • Muddy; • Tidal; • Trees/bushes; • Tropical • Shallow • Many different species of trees/prop roots/aerial roots; • Prefer a large tidal range • Prefer little undercurrent tidal action No: Place specific reference is not needed as this is not a case study. [7] [Total : 25 marks]
Mark scheme, page 12
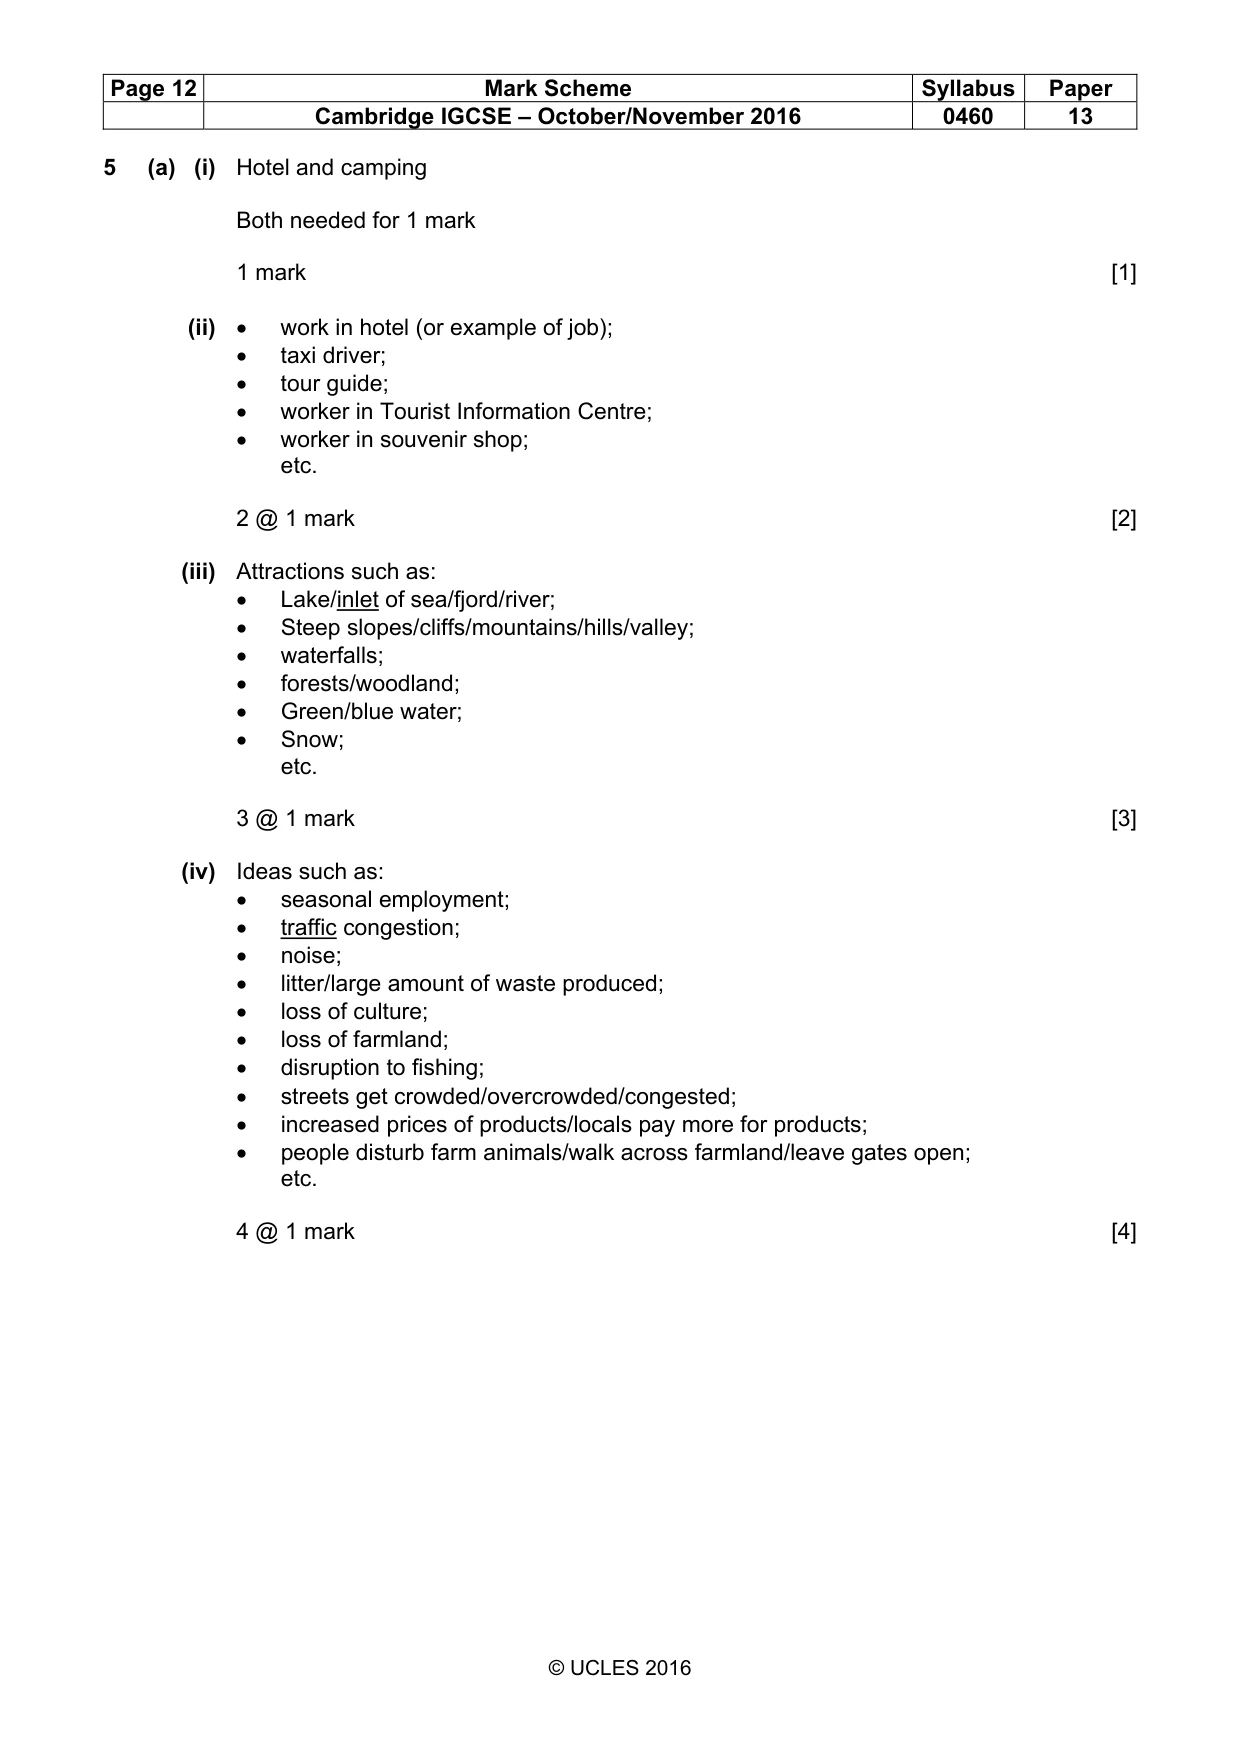
Page 12 Mark Scheme Syllabus Paper Cambridge IGCSE – October/November 2016 0460 13 © UCLES 2016 5 (a) (i) Hotel and camping Both needed for 1 mark 1 mark [1] (ii) • work in hotel (or example of job); • taxi driver; • tour guide; • worker in Tourist Information Centre; • worker in souvenir shop; etc. 2 @ 1 mark [2] (iii) Attractions such as: • Lake/inlet of sea/fjord/river; • Steep slopes/cliffs/mountains/hills/valley; • waterfalls; • forests/woodland; • Green/blue water; • Snow; etc. 3 @ 1 mark [3] (iv) Ideas such as: • seasonal employment; • traffic congestion; • noise; • litter/large amount of waste produced; • loss of culture; • loss of farmland; • disruption to fishing; • streets get crowded/overcrowded/congested; • increased prices of products/locals pay more for products; • people disturb farm animals/walk across farmland/leave gates open; etc. 4 @ 1 mark [4]
Mark scheme, page 13
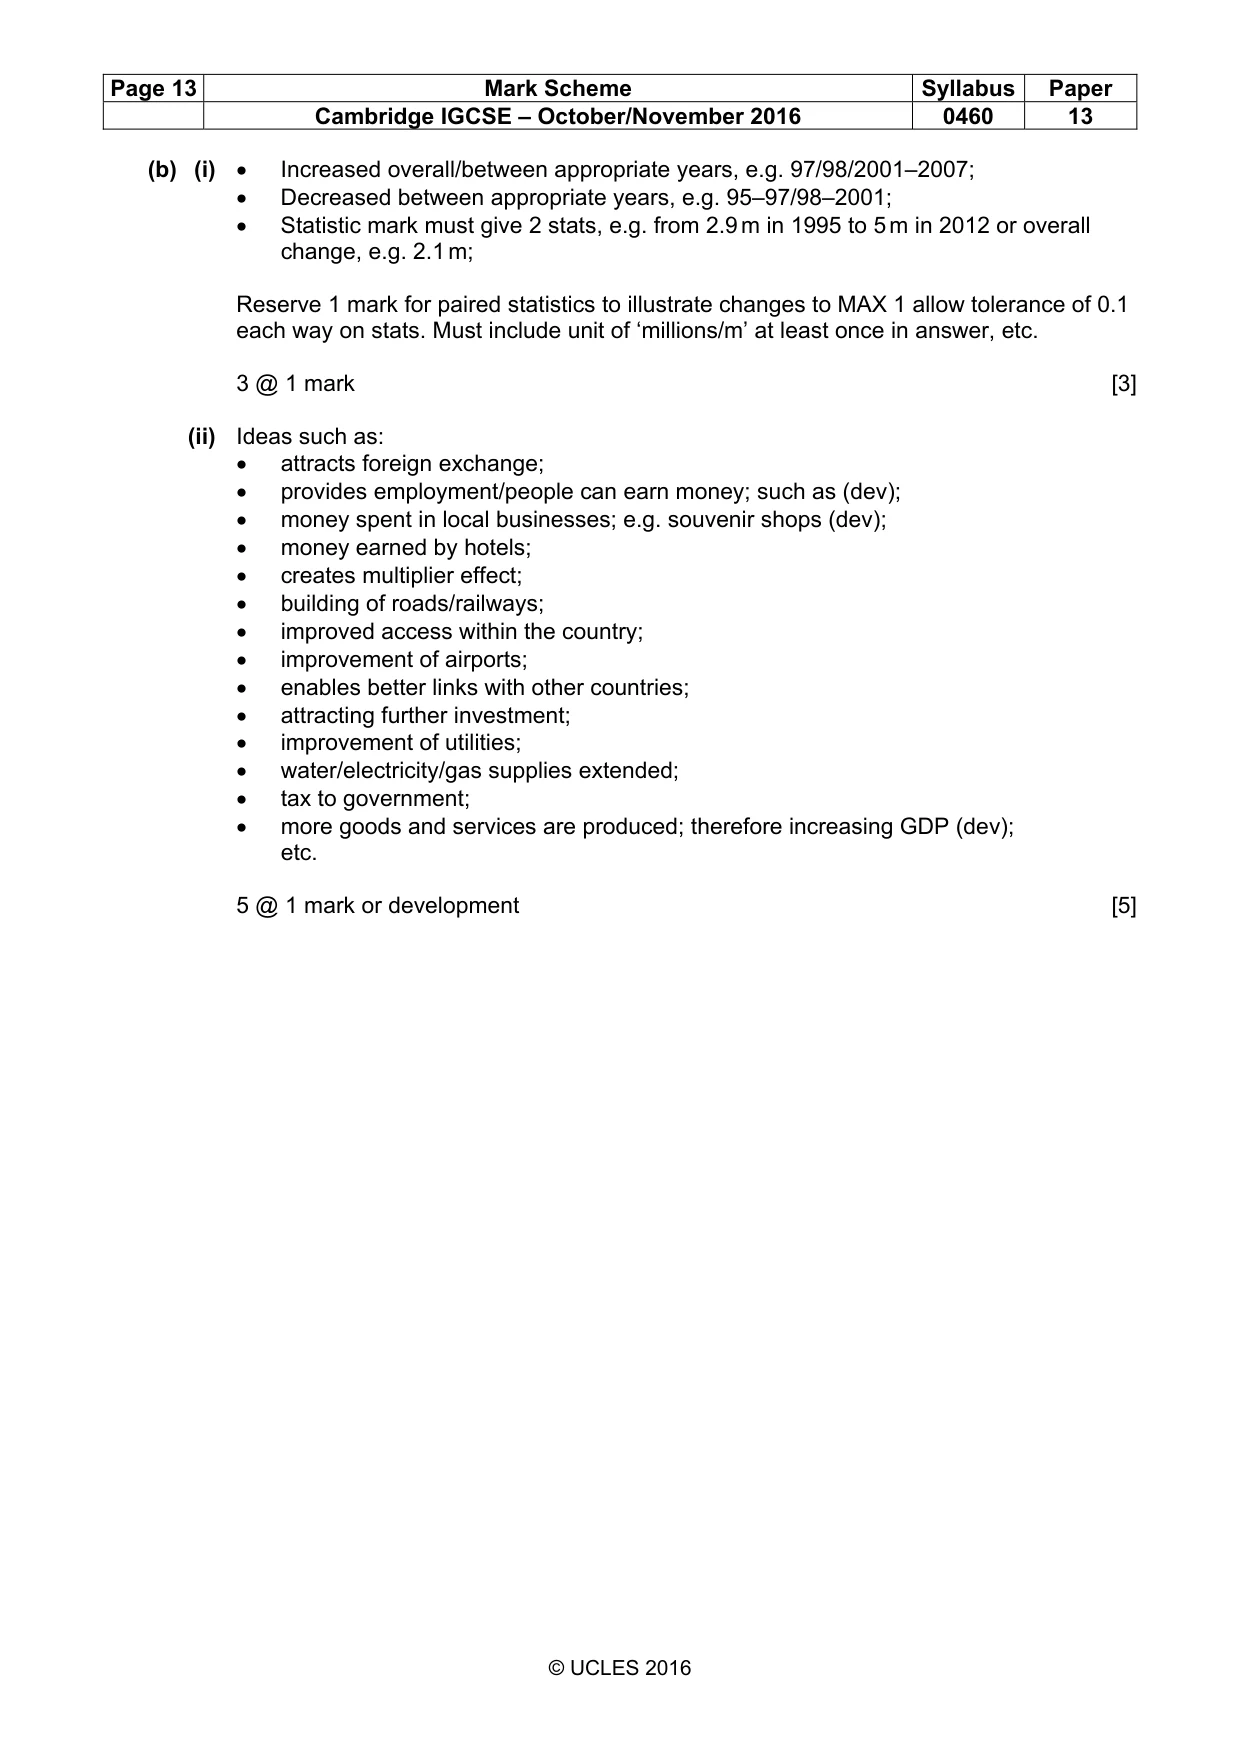
Page 13 Mark Scheme Syllabus Paper Cambridge IGCSE – October/November 2016 0460 13 © UCLES 2016 (b) (i) • Increased overall/between appropriate years, e.g. 97/98/2001–2007; • Decreased between appropriate years, e.g. 95–97/98–2001; • Statistic mark must give 2 stats, e.g. from 2.9 m in 1995 to 5 m in 2012 or overall change, e.g. 2.1 m; Reserve 1 mark for paired statistics to illustrate changes to MAX 1 allow tolerance of 0.1 each way on stats. Must include unit of ‘millions/m’ at least once in answer, etc. 3 @ 1 mark [3] (ii) Ideas such as: • attracts foreign exchange; • provides employment/people can earn money; such as (dev); • money spent in local businesses; e.g. souvenir shops (dev); • money earned by hotels; • creates multiplier effect; • building of roads/railways; • improved access within the country; • improvement of airports; • enables better links with other countries; • attracting further investment; • improvement of utilities; • water/electricity/gas supplies extended; • tax to government; • more goods and services are produced; therefore increasing GDP (dev); etc. 5 @ 1 mark or development [5]
Mark scheme, page 14
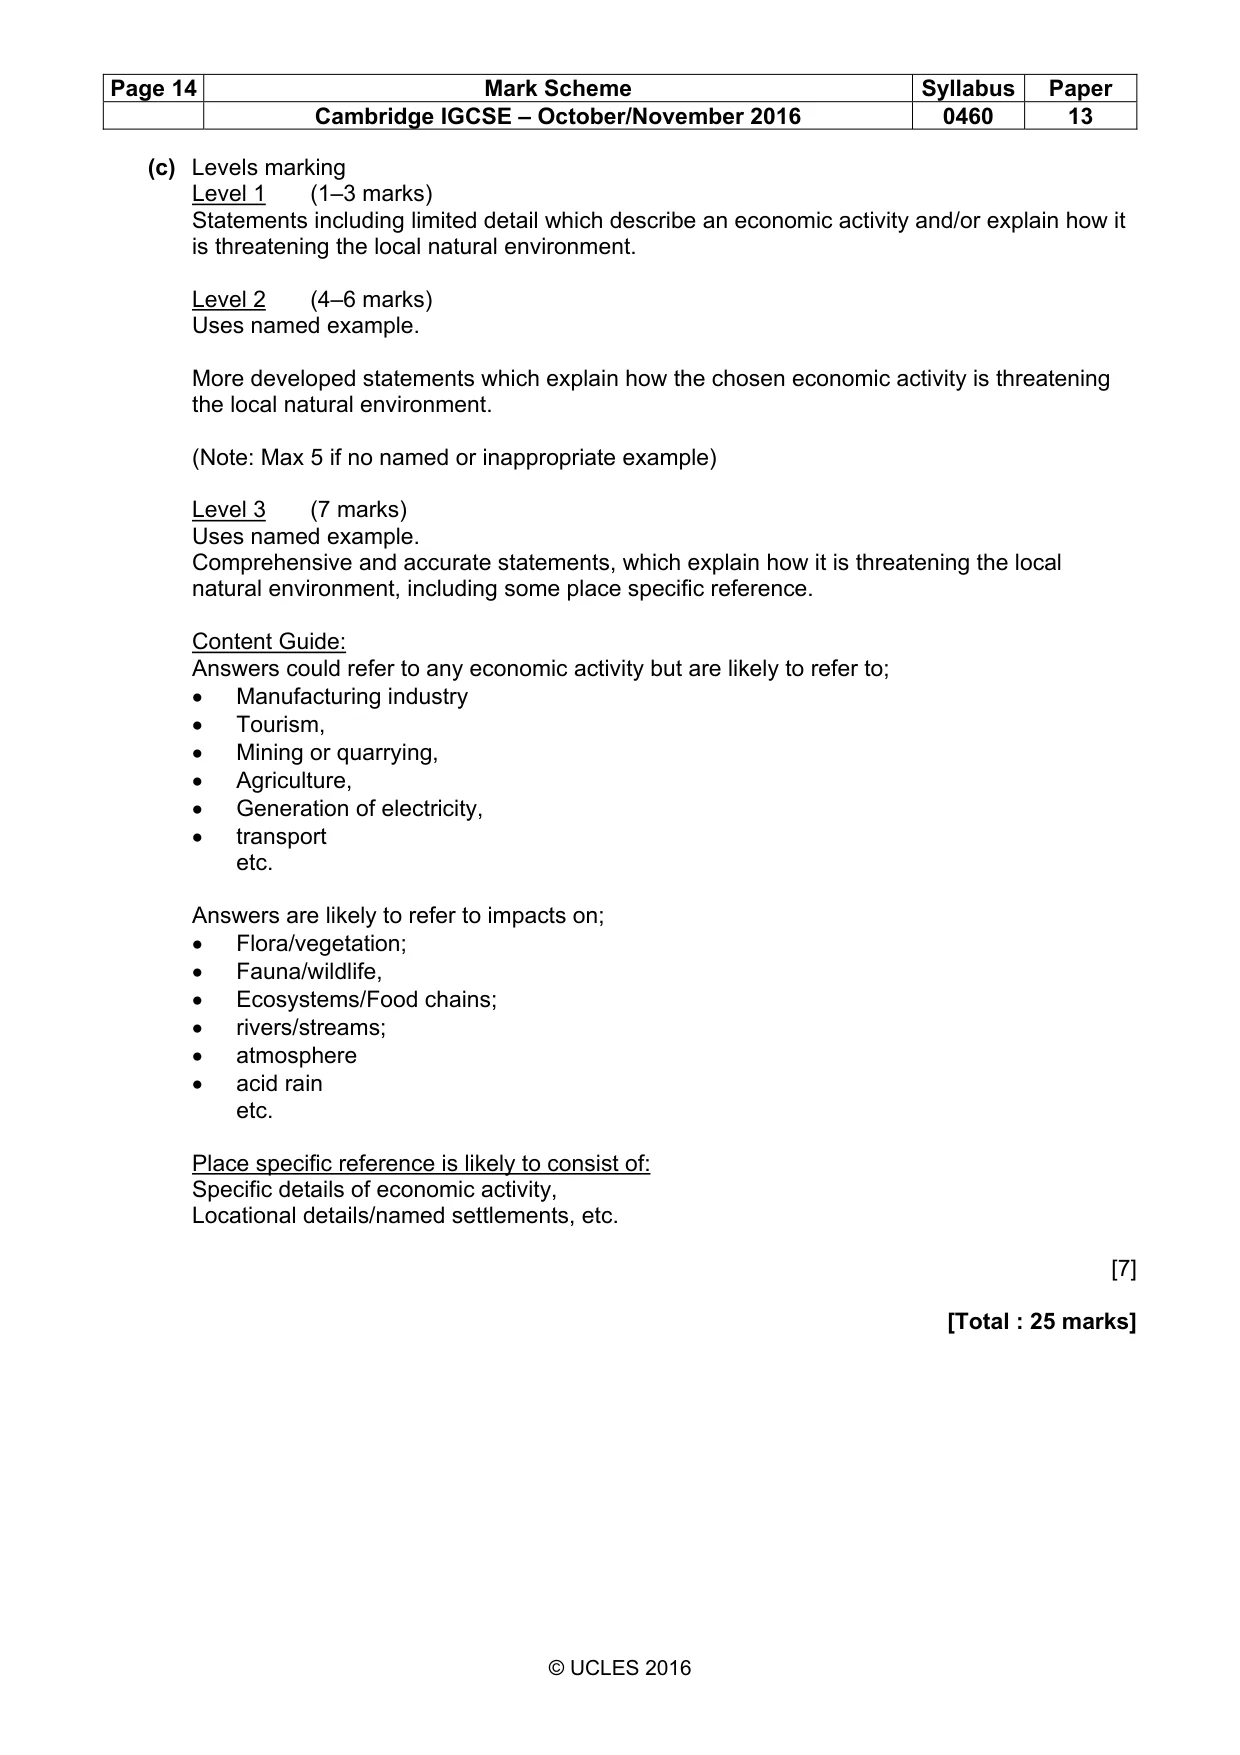
Page 14 Mark Scheme Syllabus Paper Cambridge IGCSE – October/November 2016 0460 13 © UCLES 2016 (c) Levels marking Level 1 (1–3 marks) Statements including limited detail which describe an economic activity and/or explain how it is threatening the local natural environment. Level 2 (4–6 marks) Uses named example. More developed statements which explain how the chosen economic activity is threatening the local natural environment. (Note: Max 5 if no named or inappropriate example) Level 3 (7 marks) Uses named example. Comprehensive and accurate statements, which explain how it is threatening the local natural environment, including some place specific reference. Content Guide: Answers could refer to any economic activity but are likely to refer to; • Manufacturing industry • Tourism, • Mining or quarrying, • Agriculture, • Generation of electricity, • transport etc. Answers are likely to refer to impacts on; • Flora/vegetation; • Fauna/wildlife, • Ecosystems/Food chains; • rivers/streams; • atmosphere • acid rain etc. Place specific reference is likely to consist of: Specific details of economic activity, Locational details/named settlements, etc. [7] [Total : 25 marks]
Mark scheme, page 15
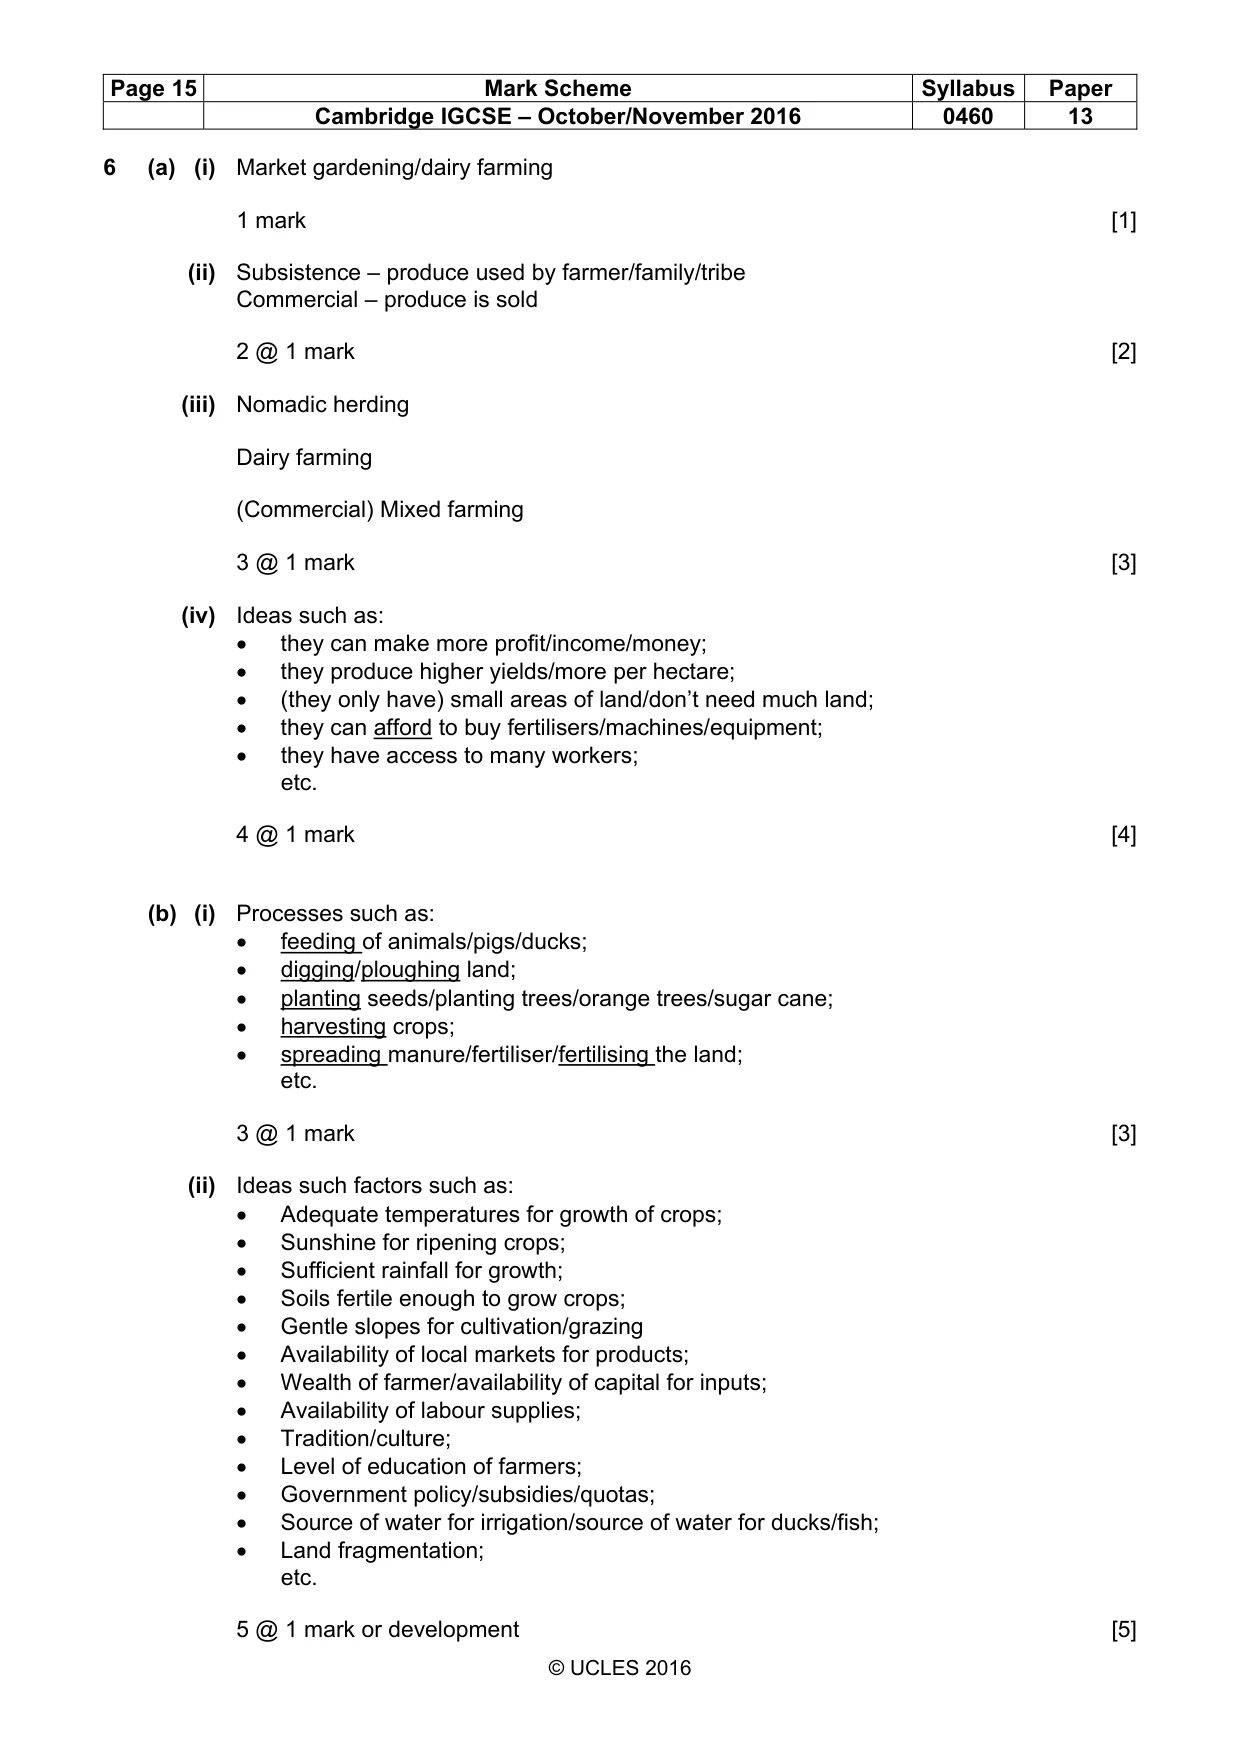
Page 15 Mark Scheme Syllabus Paper Cambridge IGCSE – October/November 2016 0460 13 © UCLES 2016 6 (a) (i) Market gardening/dairy farming 1 mark [1] (ii) Subsistence – produce used by farmer/family/tribe Commercial – produce is sold 2 @ 1 mark [2] (iii) Nomadic herding Dairy farming (Commercial) Mixed farming 3 @ 1 mark [3] (iv) Ideas such as: • they can make more profit/income/money; • they produce higher yields/more per hectare; • (they only have) small areas of land/don’t need much land; • they can afford to buy fertilisers/machines/equipment; • they have access to many workers; etc. 4 @ 1 mark [4] (b) (i) Processes such as: • feeding of animals/pigs/ducks; • digging/ploughing land; • planting seeds/planting trees/orange trees/sugar cane; • harvesting crops; • spreading manure/fertiliser/fertilising the land; etc. 3 @ 1 mark [3] (ii) Ideas such factors such as: • Adequate temperatures for growth of crops; • Sunshine for ripening crops; • Sufficient rainfall for growth; • Soils fertile enough to grow crops; • Gentle slopes for cultivation/grazing • Availability of local markets for products; • Wealth of farmer/availability of capital for inputs; • Availability of labour supplies; • Tradition/culture; • Level of education of farmers; • Government policy/subsidies/quotas; • Source of water for irrigation/source of water for ducks/fish; • Land fragmentation; etc. 5 @ 1 mark or development [5]
Mark scheme, page 16
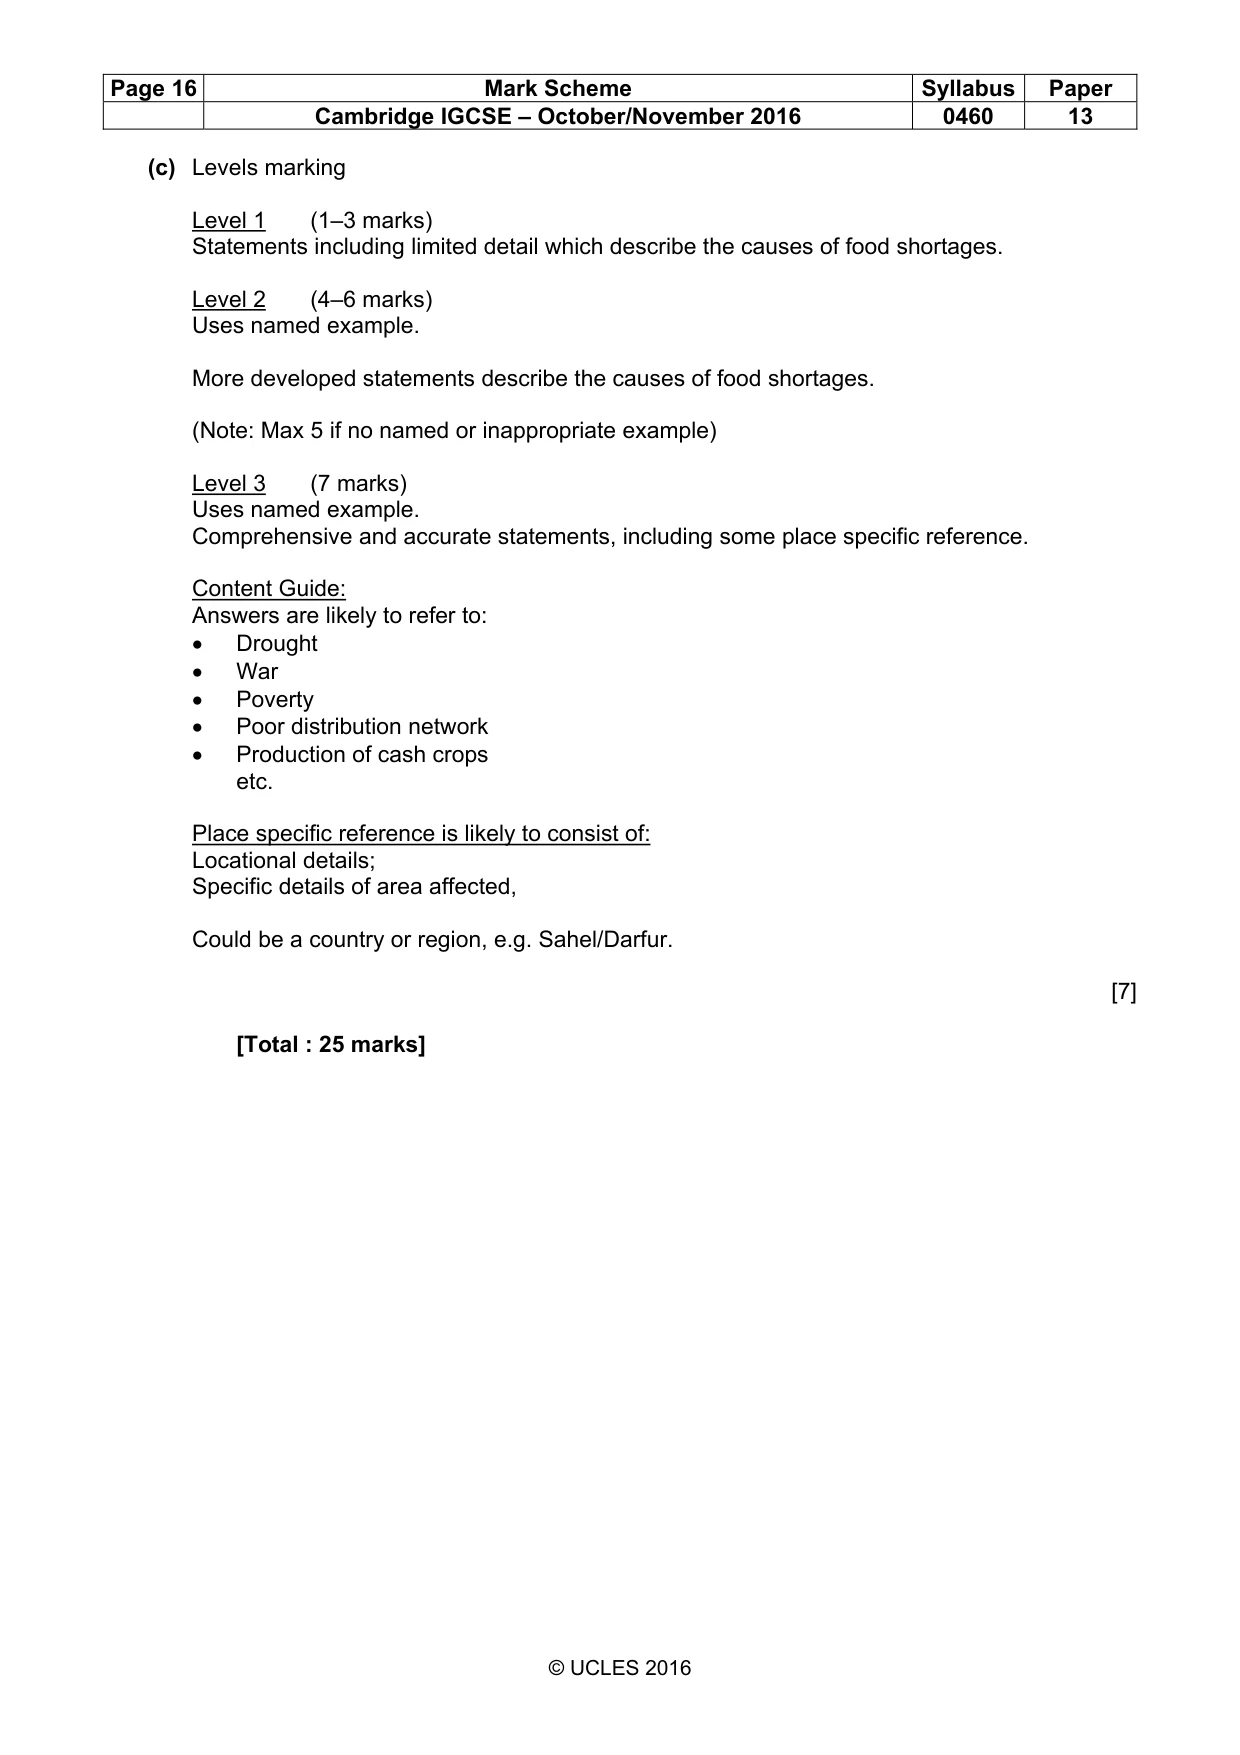
Page 16 Mark Scheme Syllabus Paper Cambridge IGCSE – October/November 2016 0460 13 © UCLES 2016 (c) Levels marking Level 1 (1–3 marks) Statements including limited detail which describe the causes of food shortages. Level 2 (4–6 marks) Uses named example. More developed statements describe the causes of food shortages. (Note: Max 5 if no named or inappropriate example) Level 3 (7 marks) Uses named example. Comprehensive and accurate statements, including some place specific reference. Content Guide: Answers are likely to refer to: • Drought • War • Poverty • Poor distribution network • Production of cash crops etc. Place specific reference is likely to consist of: Locational details; Specific details of area affected, Could be a country or region, e.g. Sahel/Darfur. [7] [Total : 25 marks]
What you needed in this session
Cambridge’s own grade thresholds for 2016 Oct/Nov, Paper 1 · Variant 3. A higher threshold means an easier paper — the bar moves with how the cohort did.