Cambridge IGCSE Geography 0460 — 2012 May/June Paper 1 · Variant 2
0460/12/M/J/12 · 75 marks · ≈84 min
The question paper and its mark scheme, free to read here and free to download. This is Cambridge’s own paper, exactly as it was sat.
Question paper28 pages




Mark scheme15 pages
Answers below. Sit the paper first if you are practising.
Paper as text
Question paper, page 1
This document consists of 28 printed pages and 1 Insert. DC (NF/JG) 47034/5 © UCLES 2012 [Turn over UNIVERSITY OF CAMBRIDGE INTERNATIONAL EXAMINATIONS International General Certificate of Secondary Education * 0 7 7 8 4 6 3 9 0 1 * GEOGRAPHY 0460/12 Paper 1 May/June 2012 1 hour 45 minutes Candidates answer on the Question Paper. Additional Materials: Ruler READ THESE INSTRUCTIONS FIRST Write your Centre number, candidate number and name in the spaces provided. Write in dark blue or black pen. You may use a soft pencil for any diagrams, graphs or rough working. Do not use staples, paper clips, highlighters, glue or correction fluid. DO NOT WRITE ON ANY BARCODES. Write your answer to each question in the space provided. If additional space is required, you should use the lined page at the end of this booklet. The question number(s) must be clearly shown. Answer three questions. The Insert contains Photographs A, B and C for Question 1, Photographs D and E for Question 2, and Photographs F and G for Question 3. The Insert is not required by the Examiner. Sketch maps and diagrams should be drawn whenever they serve to illustrate an answer. At the end of the examination, fasten all your work securely together. The number of marks is given in brackets [ ] at the end of each question or part question. For Examiner’s Use Q1 Q2 Q3 Q4 Q5 Q6 Total www.theallpapers.com
Question paper, page 2
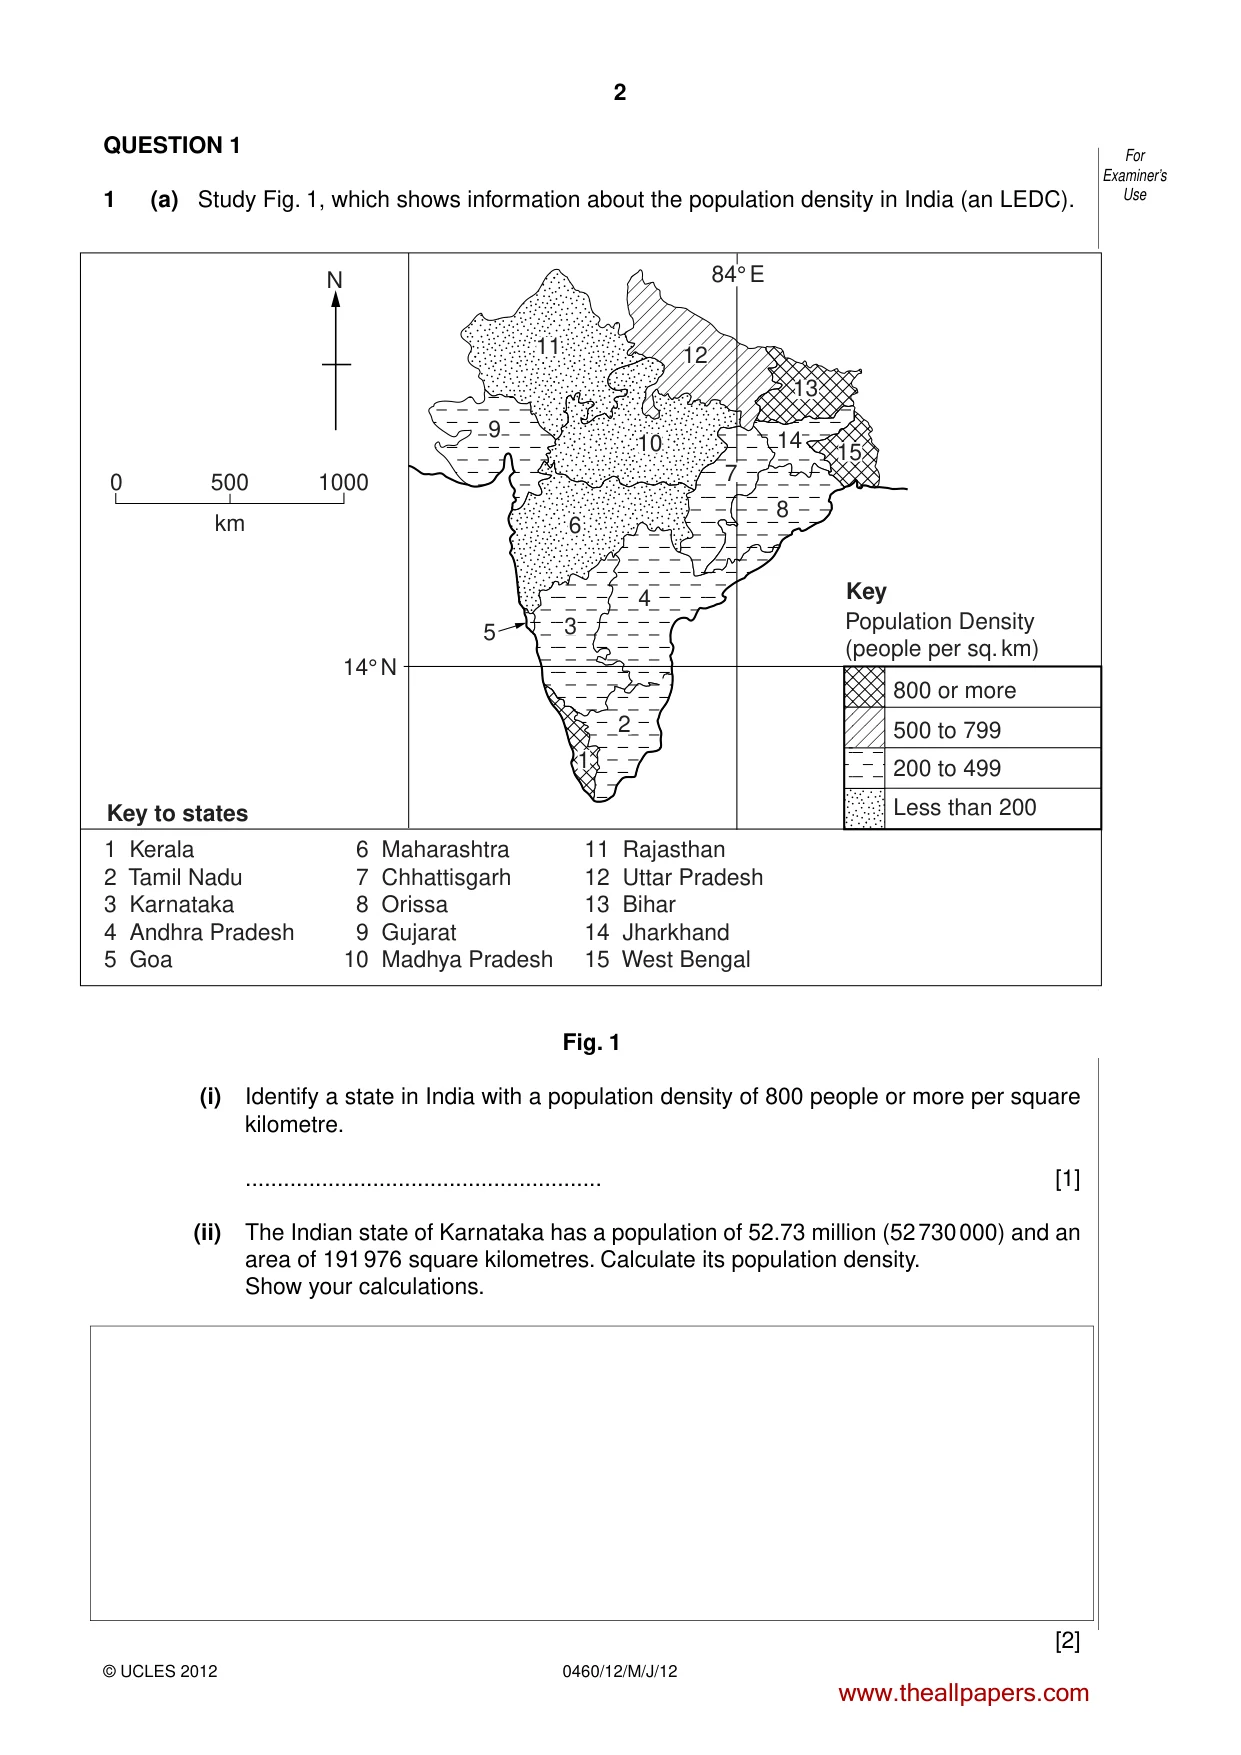
2 0460/12/M/J/12 © UCLES 2012 For Examiner’s Use QUESTION 1 1 (a) Study Fig. 1, which shows information about the population density in India (an LEDC). km 500 0 1000 N 800 or more Population Density (people per sq. km) 500 to 799 200 to 499 Less than 200 1 2 3 4 5 6 7 8 9 10 11 12 13 14 15 1 Kerala 2 Tamil Nadu 3 Karnataka 4 Andhra Pradesh 5 Goa 6 Maharashtra 7 Chhattisgarh 8 Orissa 9 Gujarat 10 Madhya Pradesh 11 Rajasthan 12 Uttar Pradesh 13 Bihar 14 Jharkhand 15 West Bengal Key to states 84° E 14° N Key Fig. 1 (i) Identify a state in India with a population density of 800 people or more per square kilometre. … [1] (ii) The Indian state of Karnataka has a population of 52.73 million (52 730 000) and an area of 191 976 square kilometres. Calculate its population density. Show your calculations. [2] www.theallpapers.com
Question paper, page 3
3 0460/12/M/J/12 © UCLES 2012 [Turn over For Examiner’s Use (iii) List the three states in India which have the lowest population density. Describe one similarity in the location of all three of these states. 1 … 2 … 3 … Similarity in location … … [3] (iv) Many parts of India are densely populated. Give reasons why both agricultural areas and industrial areas may be densely populated in an LEDC. … … … … … … … … [4] (b) Study Photographs A, B and C (Insert), which show areas with a low population density. (i) Give one reason why each of the areas shown are sparsely populated. You should choose a different reason for each photograph. Photograph A … … Photograph B … … Photograph C … … [3] www.theallpapers.com
Question paper, page 4
4 0460/12/M/J/12 © UCLES 2012 For Examiner’s Use (ii) Explain why some towns may grow up in areas which otherwise have a low population density. … … … … … … … … … … [5] www.theallpapers.com
Question paper, page 5
5 0460/12/M/J/12 © UCLES 2012 [Turn over For Examiner’s Use (c) For a named country which you have studied, explain why the birth rate is high. Name of country … … … … … … … … … … … … … … … [7] [Total: 25 marks] END OF QUESTION 1 www.theallpapers.com
Question paper, page 6
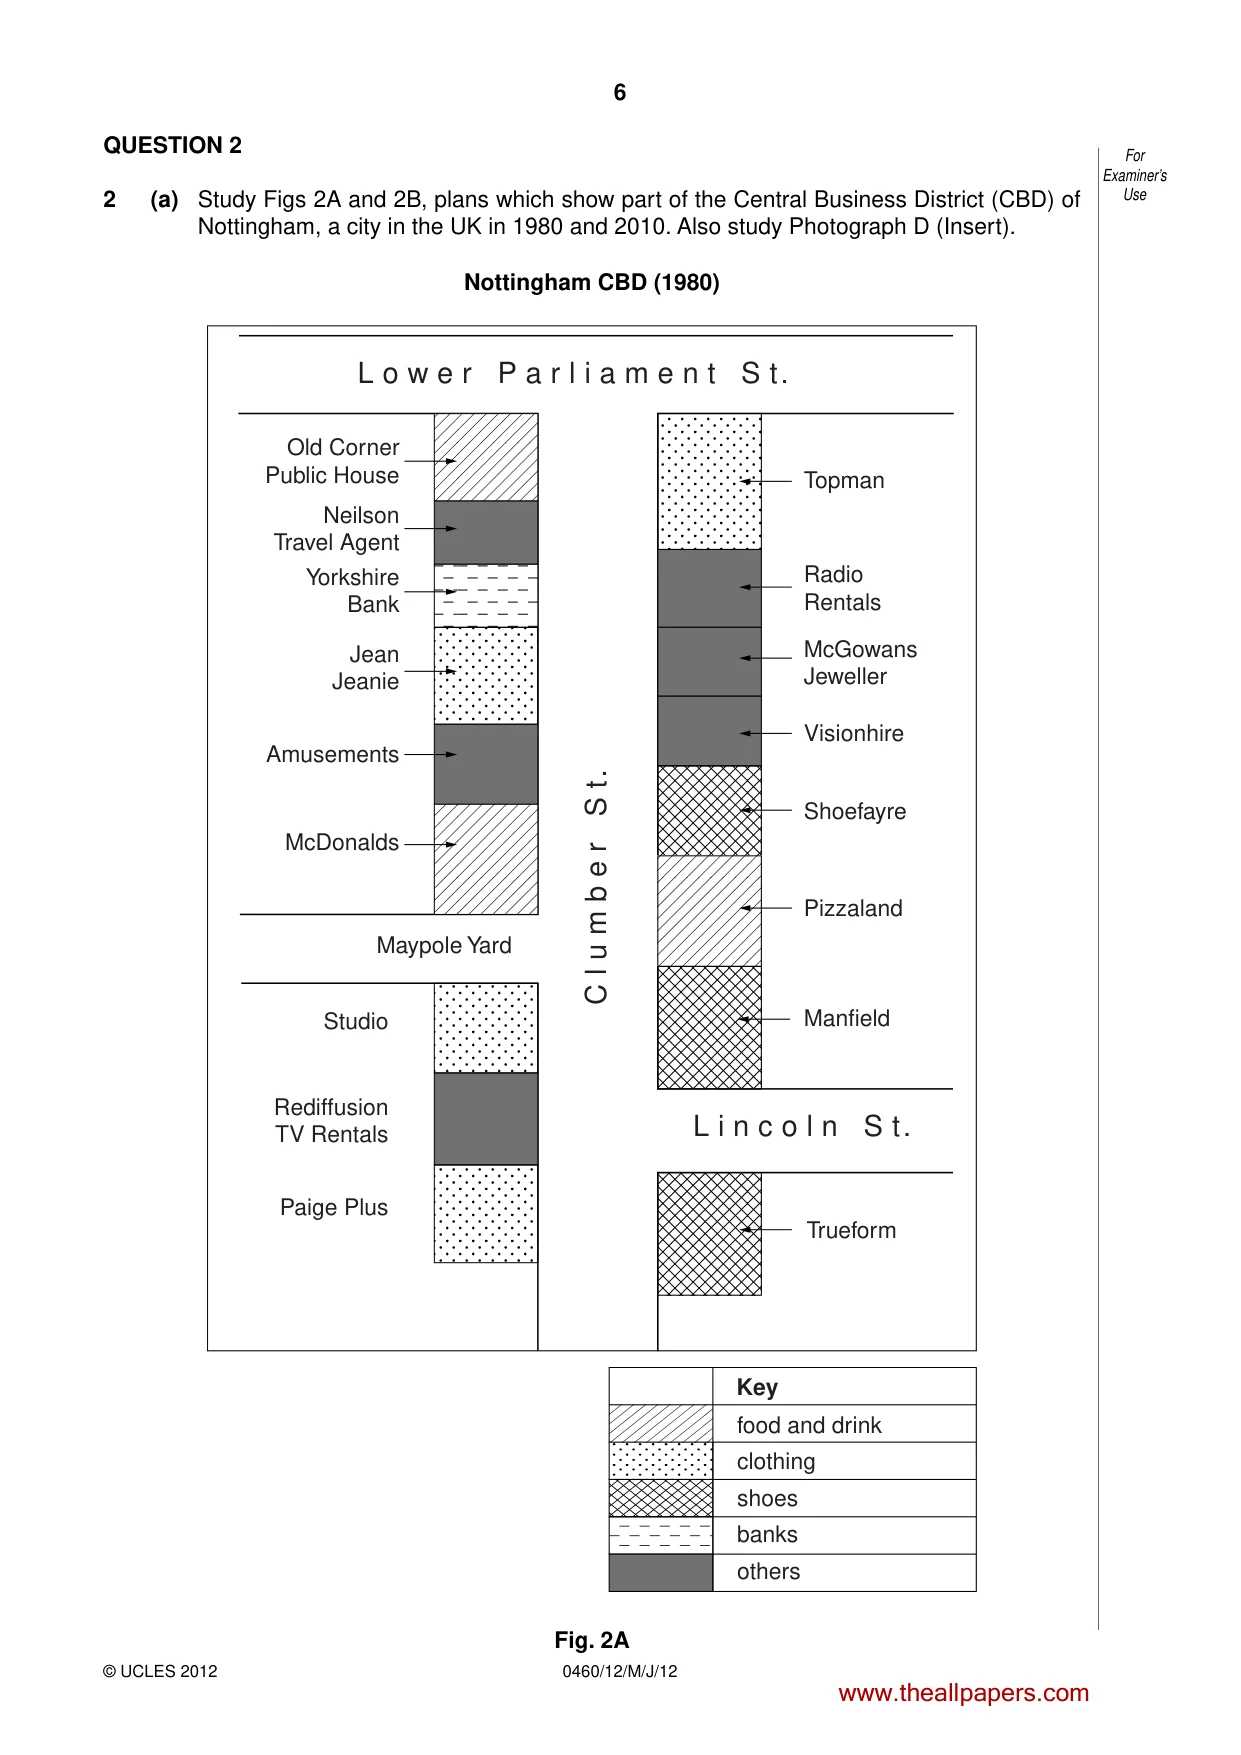
6 0460/12/M/J/12 © UCLES 2012 For Examiner’s Use QUESTION 2 2 (a) Study Figs 2A and 2B, plans which show part of the Central Business District (CBD) of Nottingham, a city in the UK in 1980 and 2010. Also study Photograph D (Insert). Nottingham CBD (1980) Topman Old Corner Public House Neilson Travel Agent Yorkshire Bank Jean Jeanie Amusements McDonalds Studio Rediffusion TV Rentals Paige Plus Trueform food and drink clothing shoes banks others Visionhire Shoefayre Pizzaland Manfield Radio Rentals McGowans Jeweller Maypole Yard L i n c o l n S t. C l u m b e r S t. L o w e r P a r l i a m e n t S t. Key Fig. 2A www.theallpapers.com
Question paper, page 7
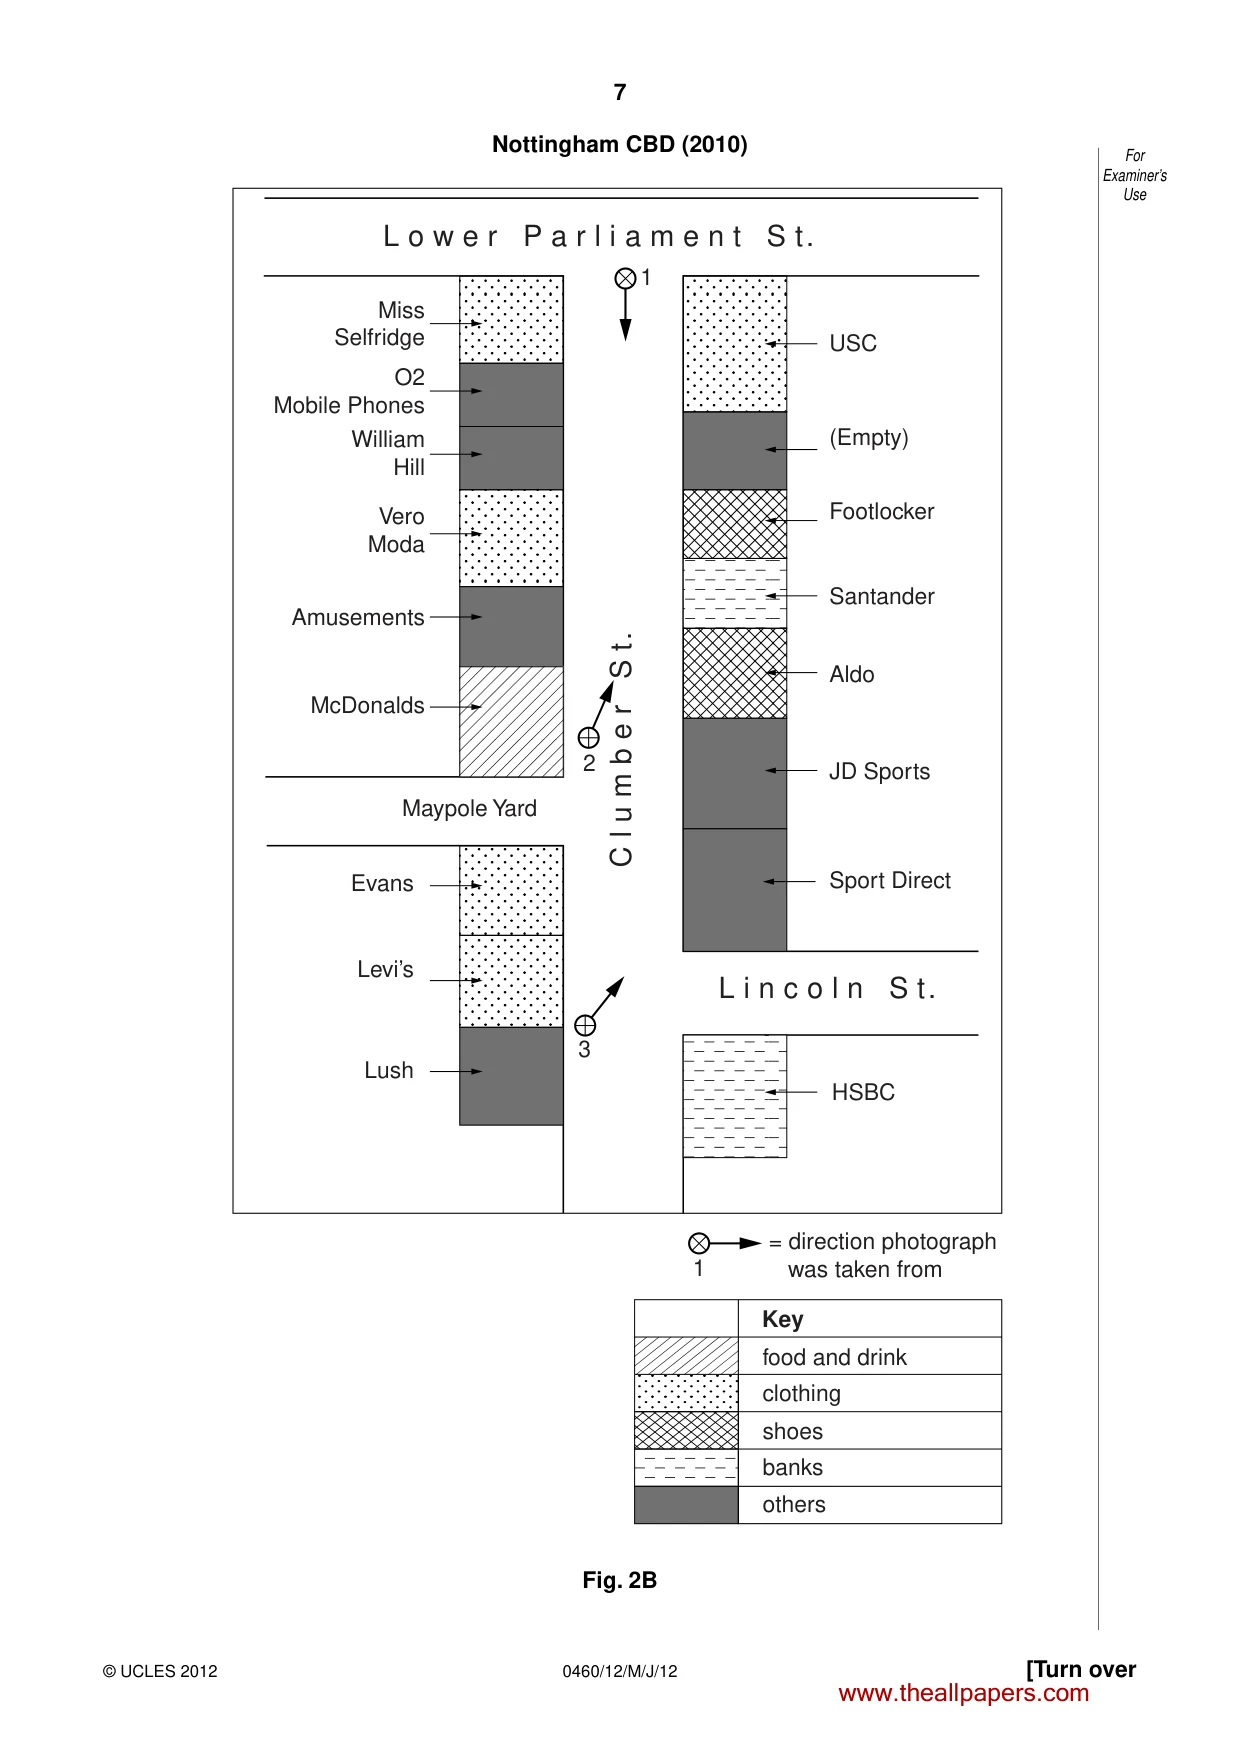
7 0460/12/M/J/12 © UCLES 2012 [Turn over For Examiner’s Use Nottingham CBD (2010) USC Miss Selfridge O2 Mobile Phones William Hill Vero Moda Amusements McDonalds Evans Levi’s Lush HSBC food and drink = direction photograph was taken from clothing shoes banks others Santander Aldo JD Sports Sport Direct (Empty) Footlocker Maypole Yard L i n c o l n S t. C l u m b e r S t. L o w e r P a r l i a m e n t S t. Key 3 2 1 1 Fig. 2B www.theallpapers.com
Question paper, page 8
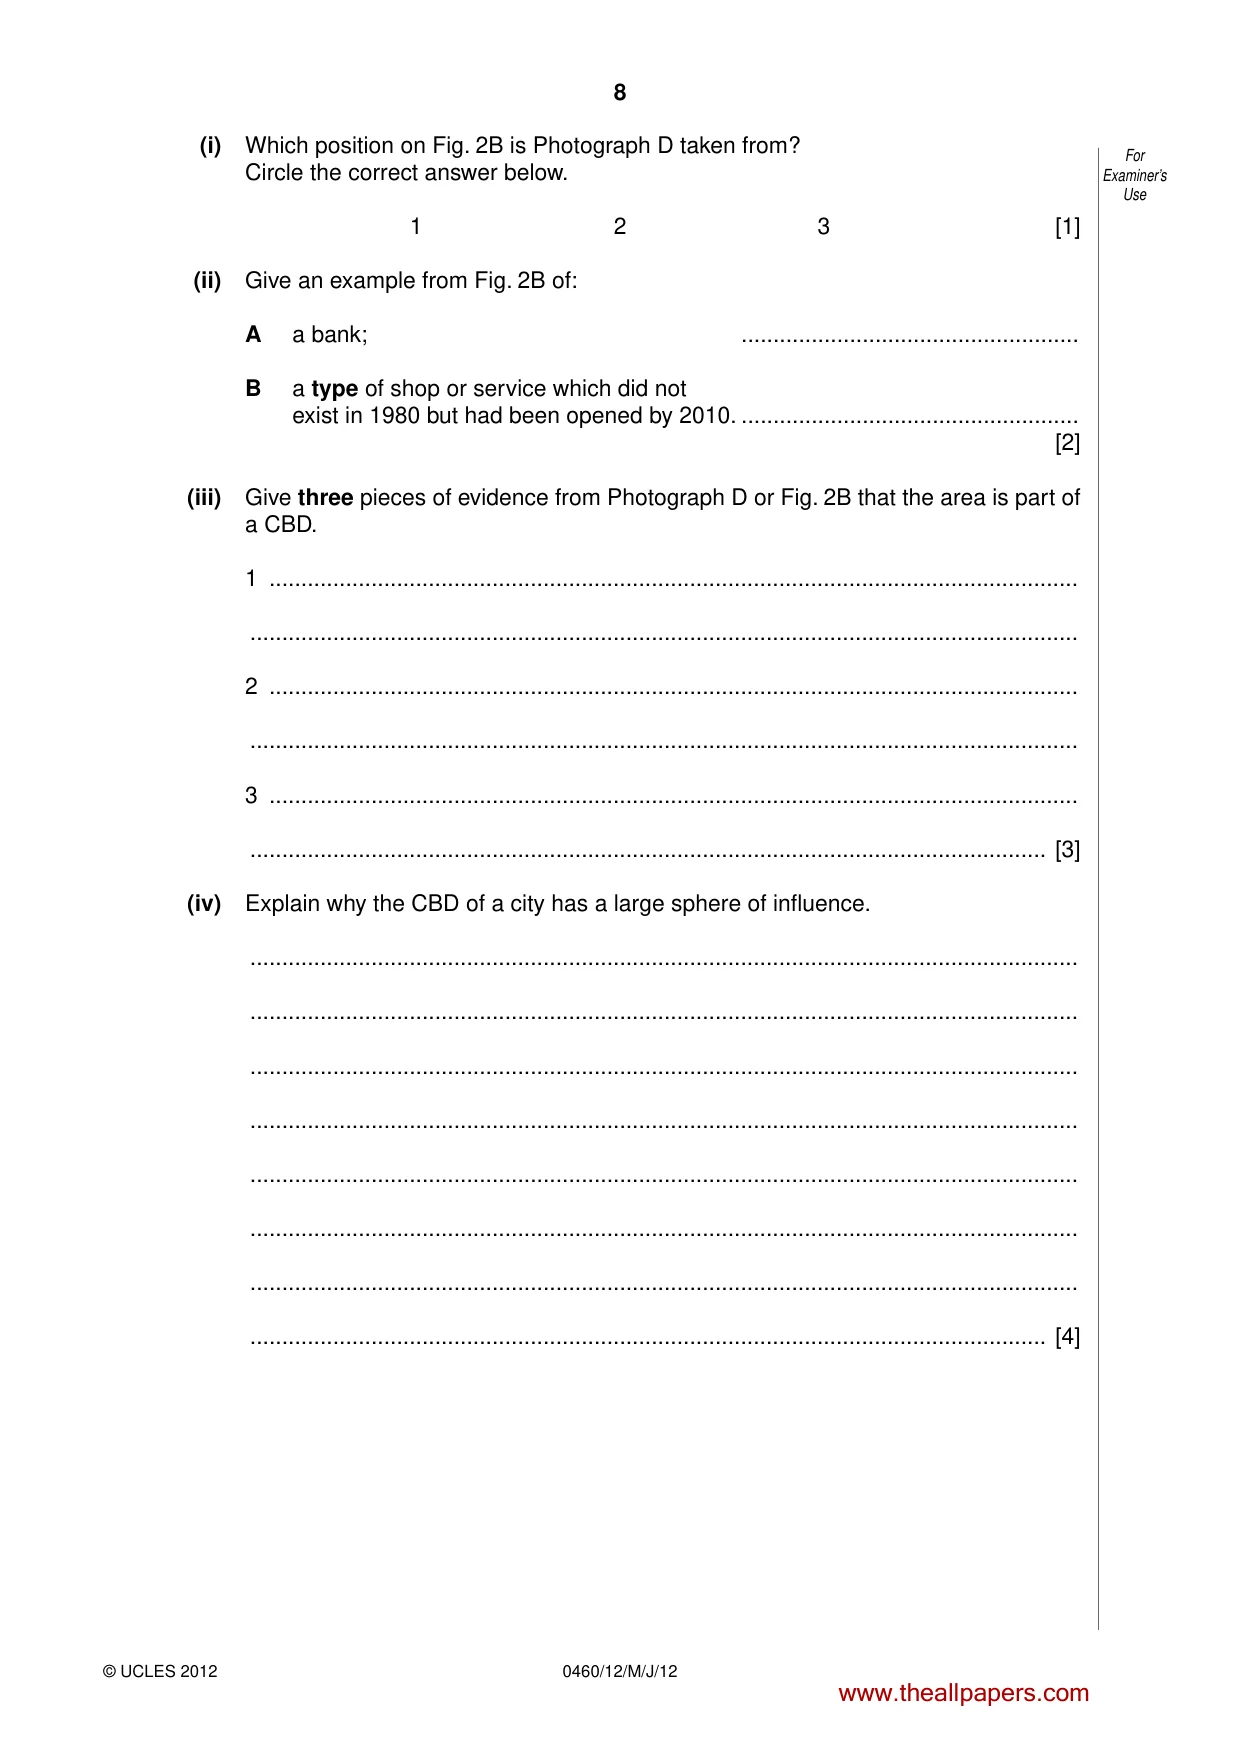
8 0460/12/M/J/12 © UCLES 2012 For Examiner’s Use (i) Which position on Fig. 2B is Photograph D taken from? Circle the correct answer below. 1 2 3 [1] (ii) Give an example from Fig. 2B of: A a bank; … B a type of shop or service which did not exist in 1980 but had been opened by 2010. … [2] (iii) Give three pieces of evidence from Photograph D or Fig. 2B that the area is part of a CBD. 1 … … 2 … … 3 … … [3] (iv) Explain why the CBD of a city has a large sphere of influence. … … … … … … … … [4] www.theallpapers.com
Question paper, page 9
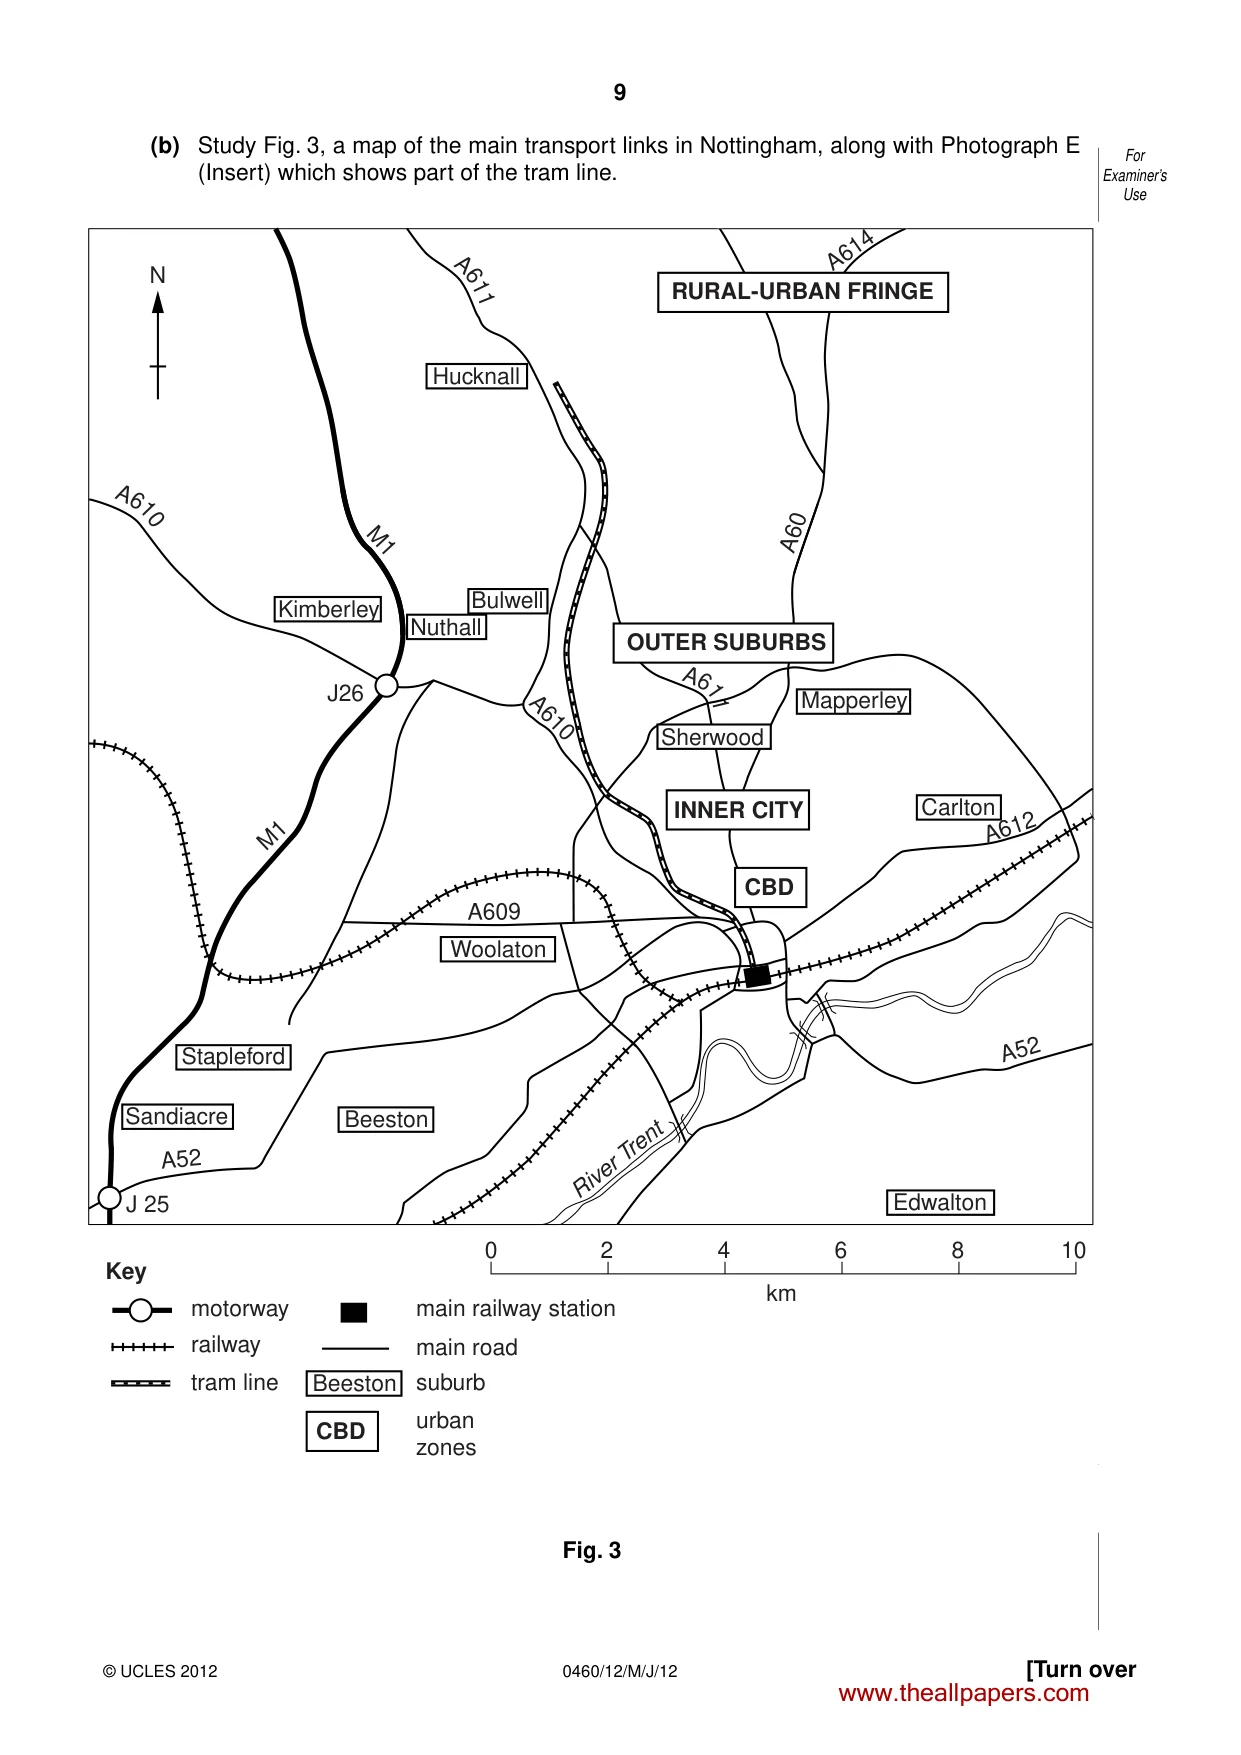
9 0460/12/M/J/12 © UCLES 2012 [Turn over For Examiner’s Use (b) Study Fig. 3, a map of the main transport links in Nottingham, along with Photograph E (Insert) which shows part of the tram line. A 6 1 0 A 6 1 1 A60 A 6 1 1 OUTER SUBURBS INNER CITY CBD CBD RURAL-URBAN FRINGE A614 Sherwood Bulwell Hucknall Nuthall Mapperley Carlton Beeston Beeston Edwalton Woolaton Stapleford Sandiacre Kimberley J26 M1 M1 A52 A609 A52 0 2 4 6 8 10 km J 25 River Trent A612 N Key motorway main railway station main road suburb urban zones railway tram line A610 Fig. 3 www.theallpapers.com
Question paper, page 10
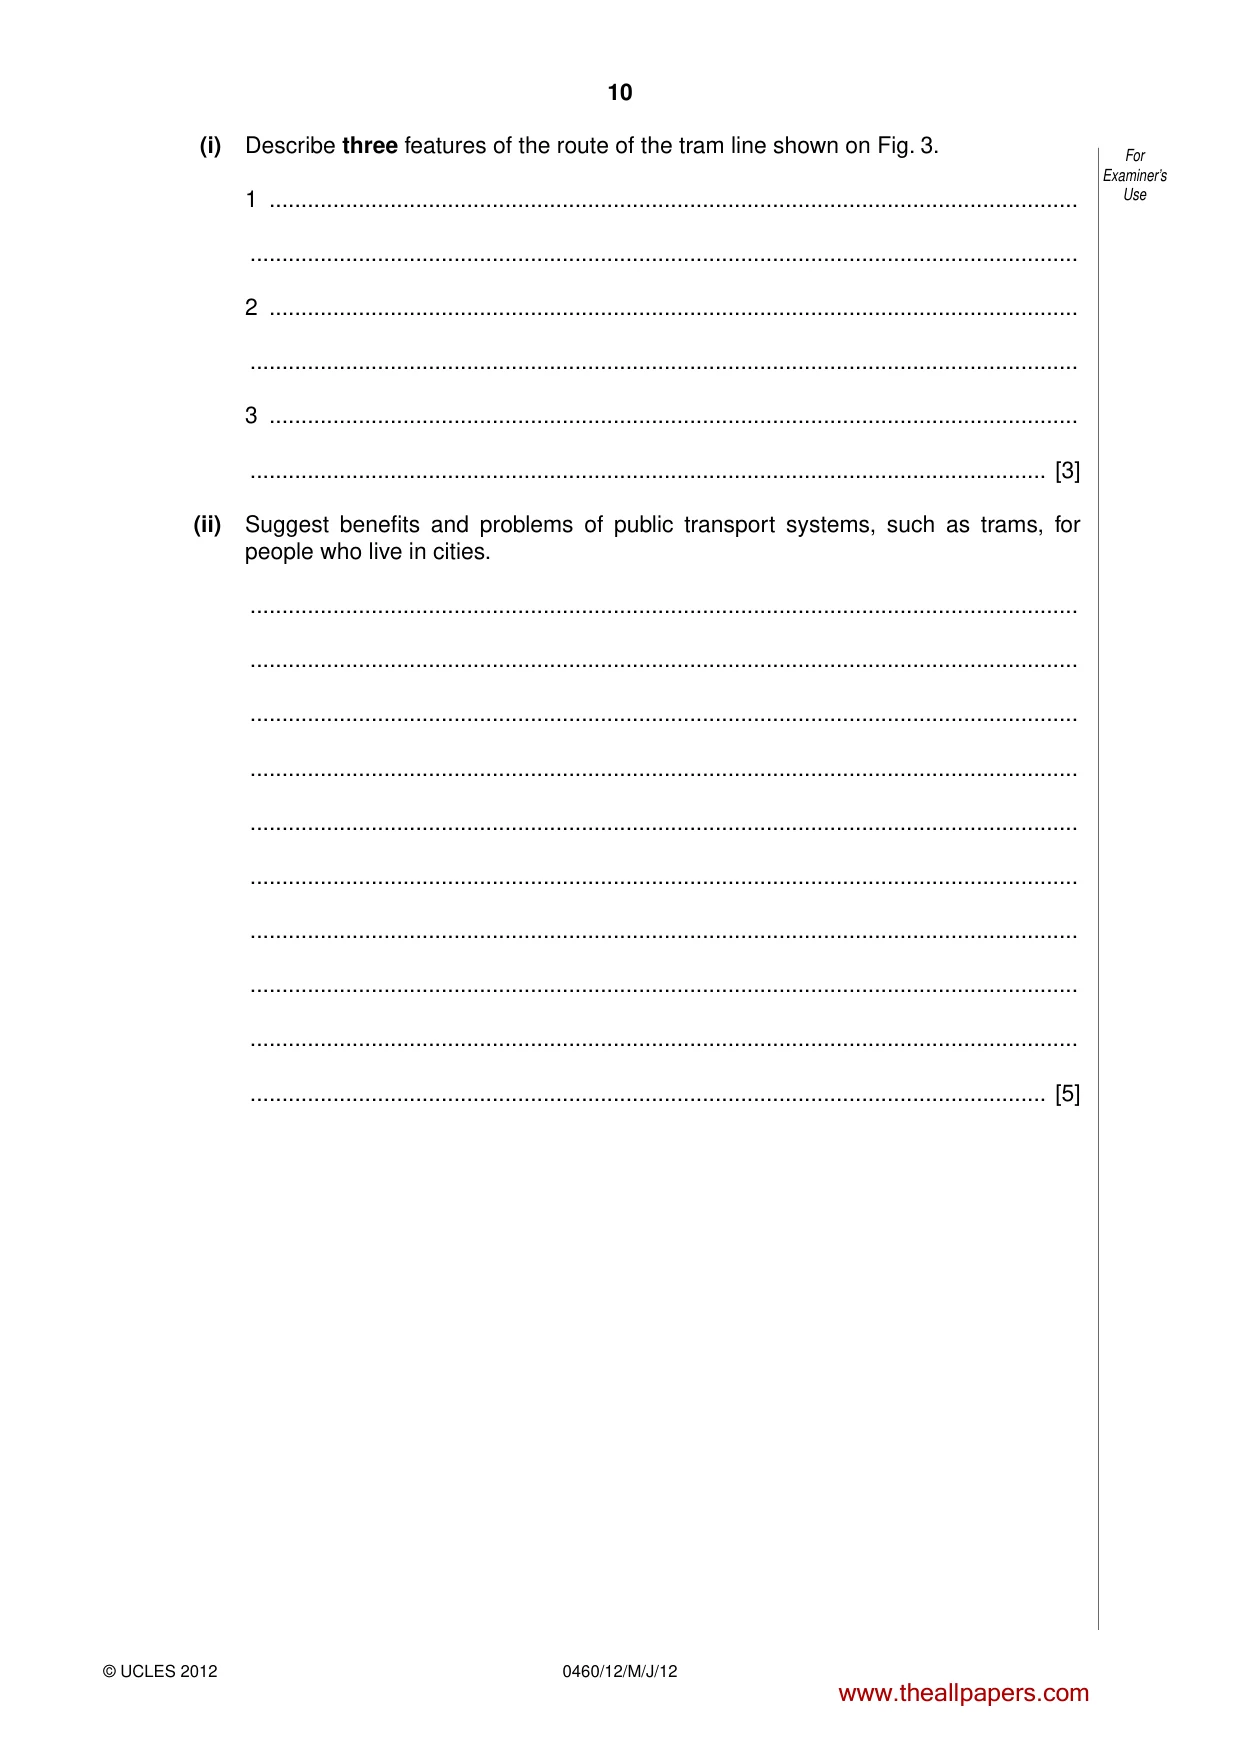
10 0460/12/M/J/12 © UCLES 2012 For Examiner’s Use (i) Describe three features of the route of the tram line shown on Fig. 3. 1 … … 2 … … 3 … … [3] (ii) Suggest benefits and problems of public transport systems, such as trams, for people who live in cities. … … … … … … … … … … [5] www.theallpapers.com
Question paper, page 11
11 0460/12/M/J/12 © UCLES 2012 [Turn over For Examiner’s Use (c) For a named example of a town or city which you have studied, explain how urban sprawl has changed the surrounding areas. Name of town or city … … … … … … … … … … … … … … … [7] [Total: 25 marks] END OF QUESTION 2 www.theallpapers.com
Question paper, page 12
12 0460/12/M/J/12 © UCLES 2012 For Examiner’s Use QUESTION 3 3 (a) Study Photograph F (Insert), which shows a river valley. (i) Describe the shape of the valley shown in Photograph F. … … [1] (ii) Describe two features of the river shown in Photograph F. 1 … … 2 … … [2] (iii) Suggest three ways in which the river shown in Photograph F could be carrying out erosion. 1 … … 2 … … 3 … … [3] (iv) Name and describe two methods by which rivers transport their load. Method 1 … Description … … … Method 2 … Description … … … [4] www.theallpapers.com
Question paper, page 13
13 0460/12/M/J/12 © UCLES 2012 [Turn over For Examiner’s Use (b) Study Photograph G (Insert), which shows rocks where biological weathering is taking place. (i) Describe how biological weathering has occurred in the area shown. … … … … … … [3] (ii) Explain why biological and chemical weathering are rapid in areas which are hot and wet. … … … … … … … … … … [5] www.theallpapers.com
Question paper, page 14
14 0460/12/M/J/12 © UCLES 2012 For Examiner’s Use (c) Describe and explain the process of freeze-thaw weathering. Include fully labelled diagrams. … … … … … … … … … … … … … … [7] [Total: 25 marks] END OF QUESTION 3 www.theallpapers.com
Question paper, page 15
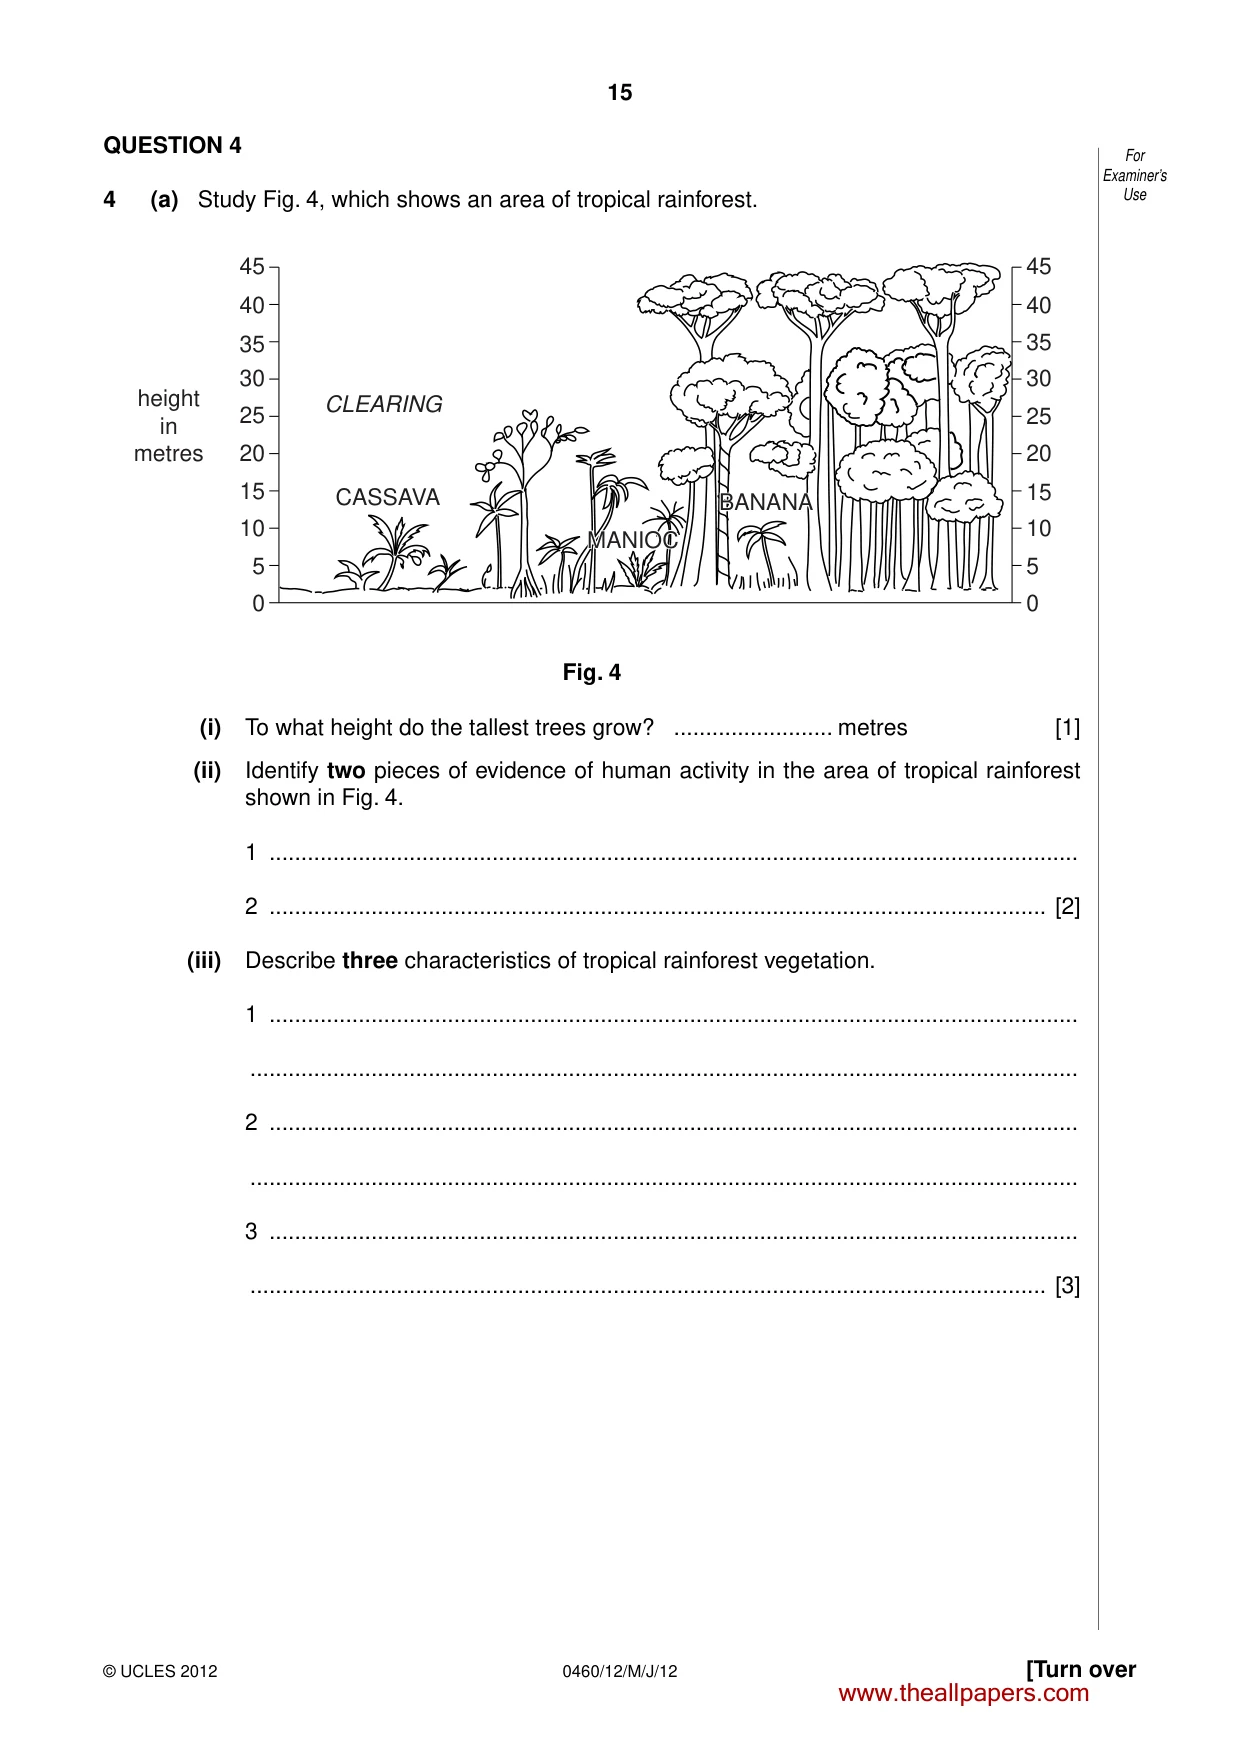
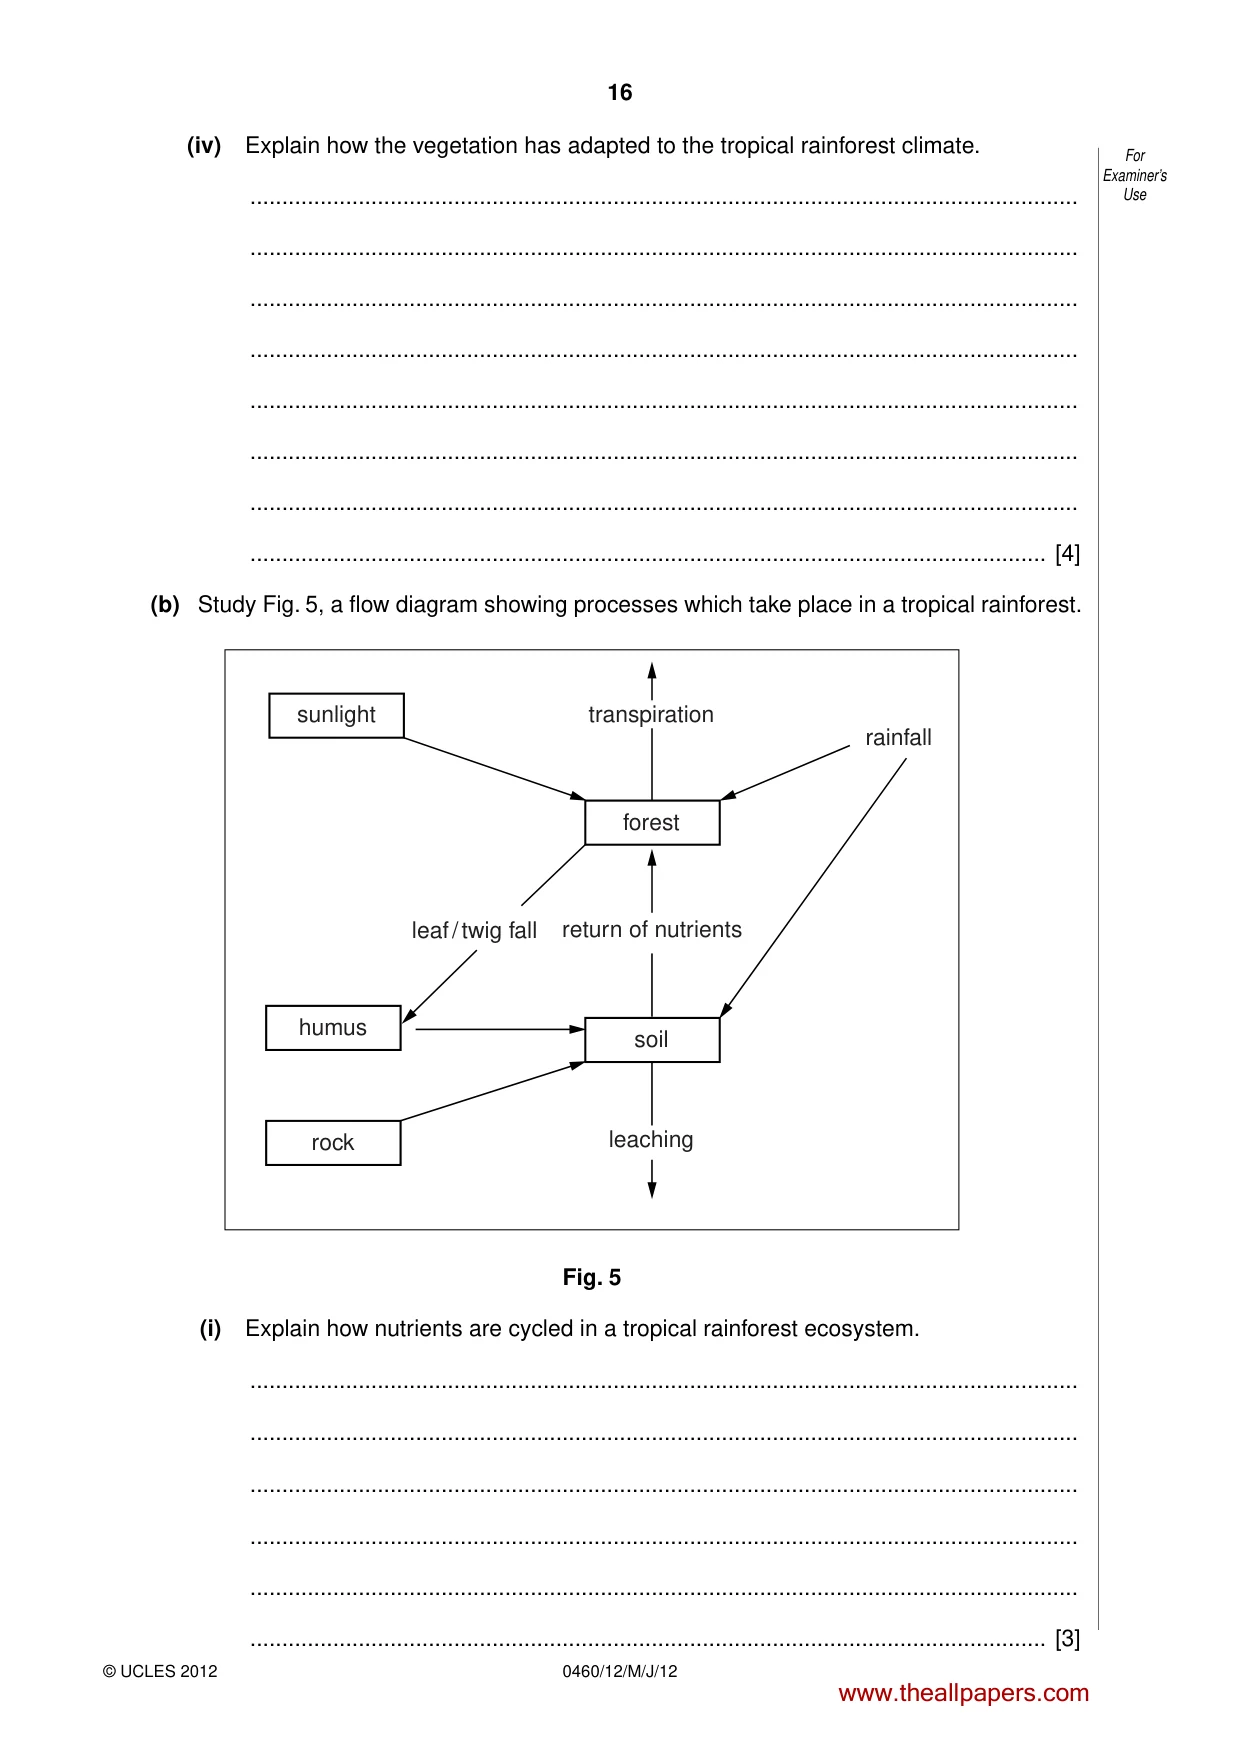
15 0460/12/M/J/12 © UCLES 2012 [Turn over For Examiner’s Use QUESTION 4 4 (a) Study Fig. 4, which shows an area of tropical rainforest. 0 5 10 15 20 25 30 35 40 45 0 5 10 15 20 25 30 35 40 45 height in metres CLEARING CASSAVA MANIOC MANIOC BANANA BANANA Fig. 4 (i) To what height do the tallest trees grow? … metres [1] (ii) Identify two pieces of evidence of human activity in the area of tropical rainforest shown in Fig. 4. 1 … 2 … [2] (iii) Describe three characteristics of tropical rainforest vegetation. 1 … … 2 … … 3 … … [3] www.theallpapers.com
Question paper, page 16
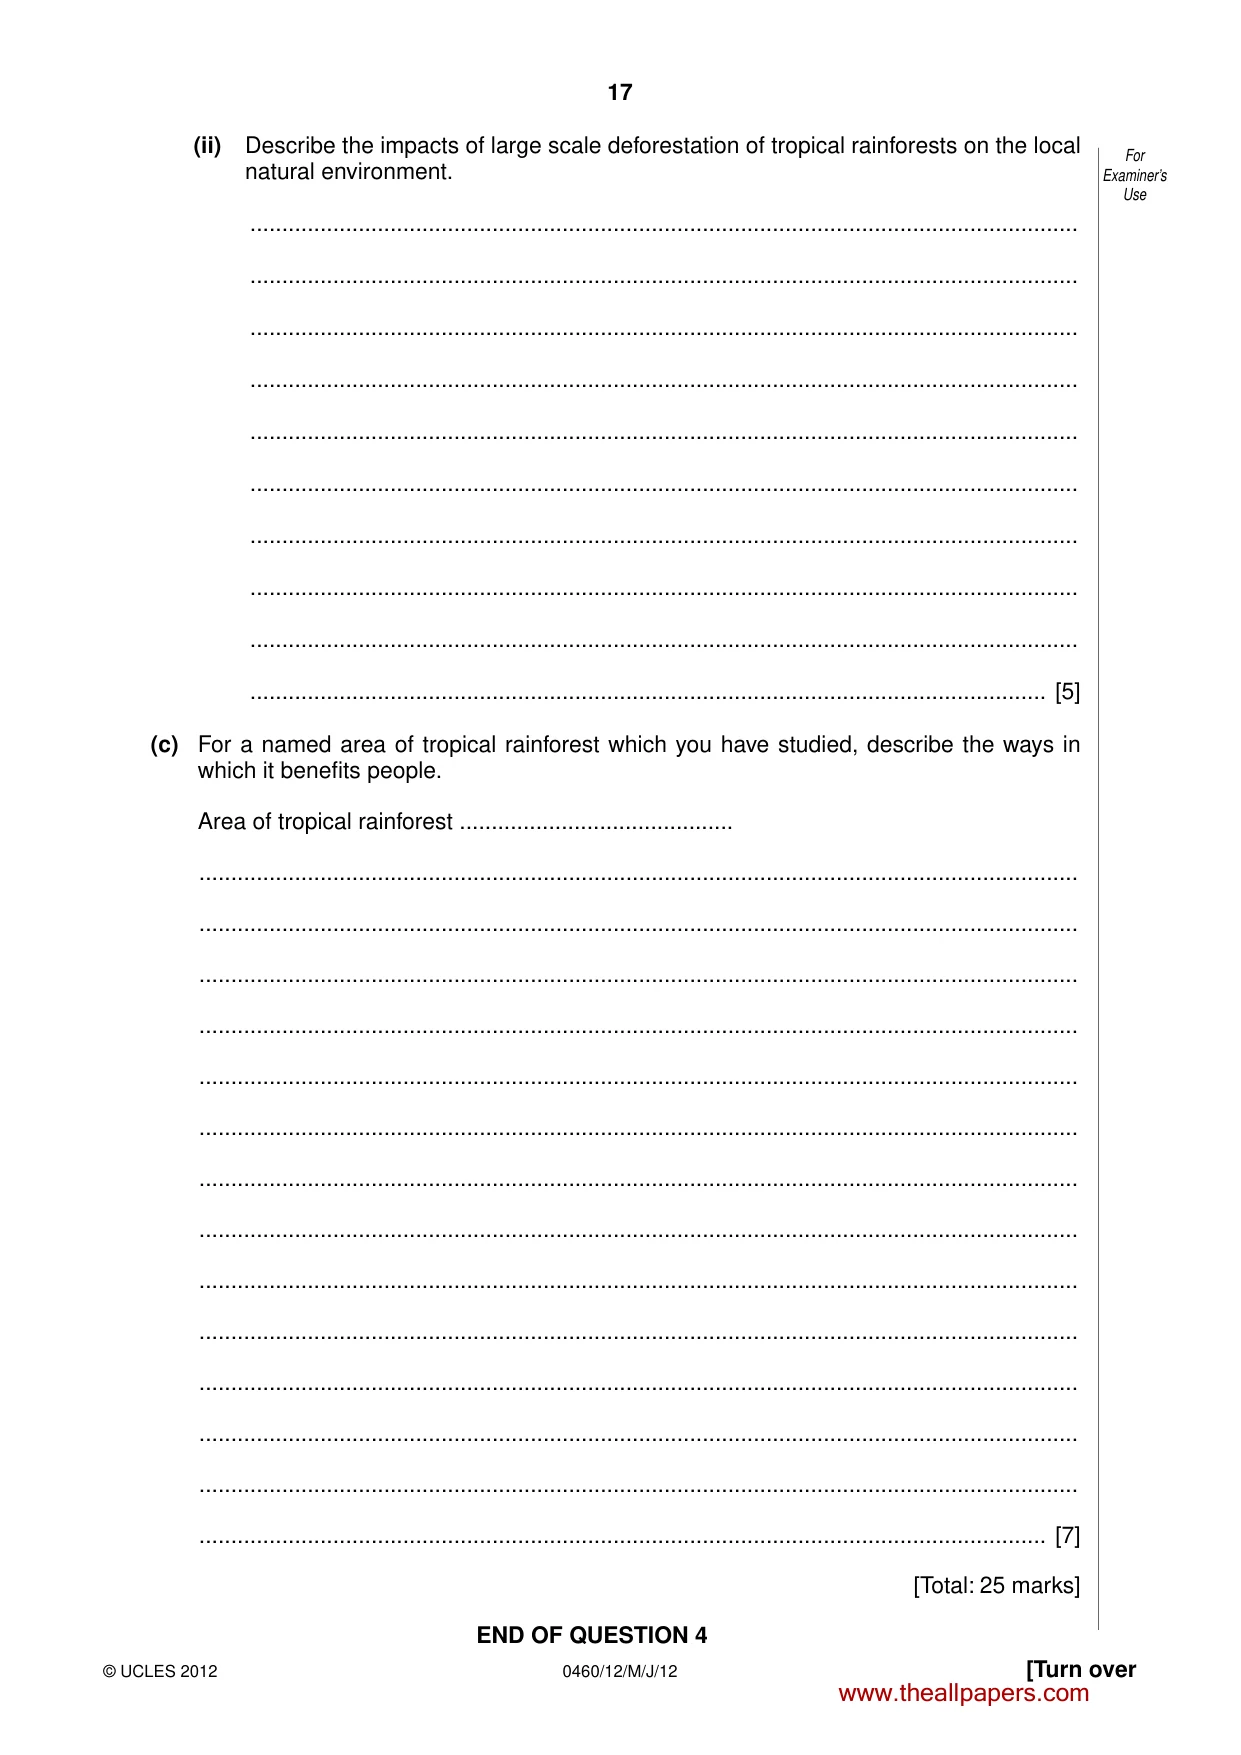
16 0460/12/M/J/12 © UCLES 2012 For Examiner’s Use (iv) Explain how the vegetation has adapted to the tropical rainforest climate. … … … … … … … … [4] (b) Study Fig. 5, a flow diagram showing processes which take place in a tropical rainforest. sunlight transpiration rainfall return of nutrients leaf / twig fall leaching forest soil rock humus Fig. 5 (i) Explain how nutrients are cycled in a tropical rainforest ecosystem. … … … … … … [3] www.theallpapers.com
Question paper, page 17
17 0460/12/M/J/12 © UCLES 2012 [Turn over For Examiner’s Use (ii) Describe the impacts of large scale deforestation of tropical rainforests on the local natural environment. … … … … … … … … … … [5] (c) For a named area of tropical rainforest which you have studied, describe the ways in which it benefits people. Area of tropical rainforest … … … … … … … … … … … … … … … [7] [Total: 25 marks] END OF QUESTION 4 www.theallpapers.com
Question paper, page 18
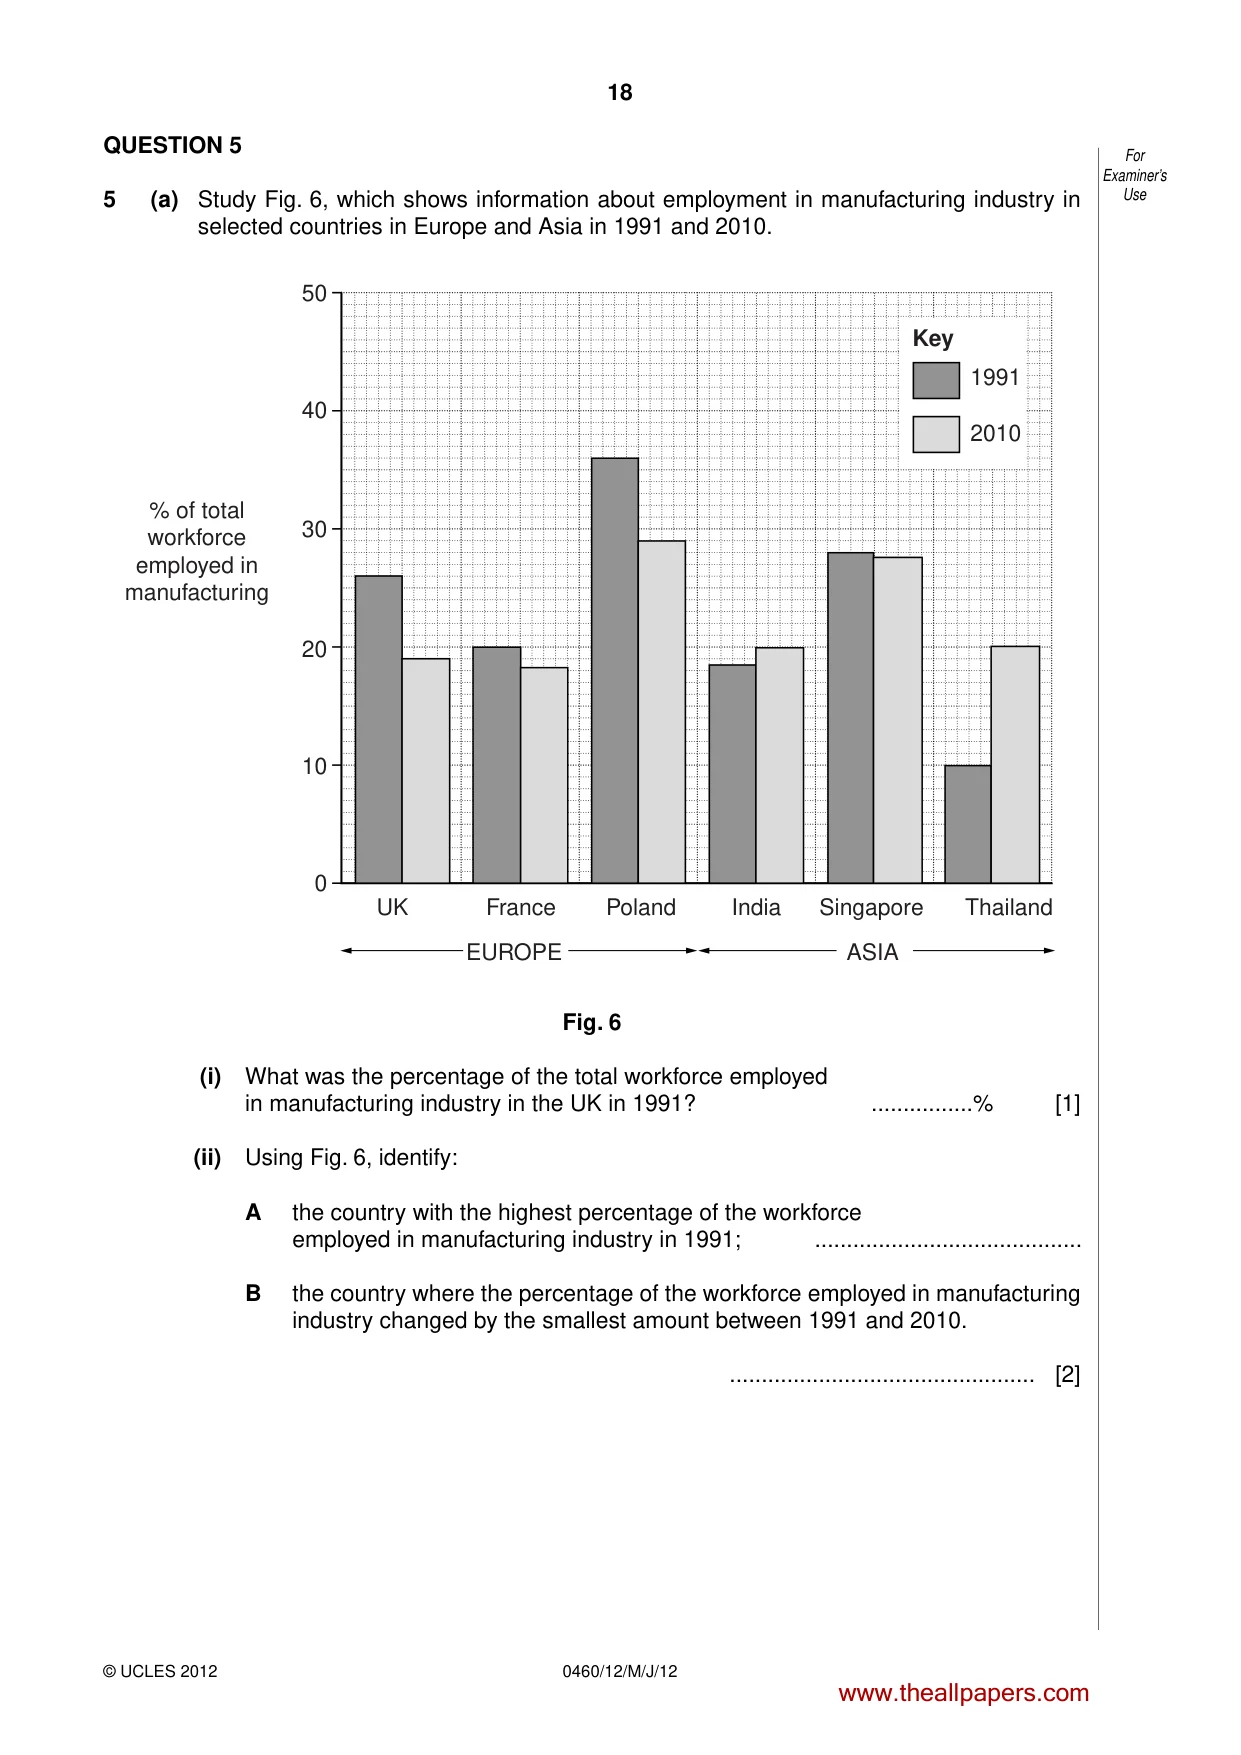
18 0460/12/M/J/12 © UCLES 2012 For Examiner’s Use QUESTION 5 5 (a) Study Fig. 6, which shows information about employment in manufacturing industry in selected countries in Europe and Asia in 1991 and 2010. UK France Poland India Singapore Thailand 0 10 20 30 40 50 % of total workforce employed in manufacturing EUROPE ASIA 1991 2010 Key Fig. 6 (i) What was the percentage of the total workforce employed in manufacturing industry in the UK in 1991? …% [1] (ii) Using Fig. 6, identify: A the country with the highest percentage of the workforce employed in manufacturing industry in 1991; … B the country where the percentage of the workforce employed in manufacturing industry changed by the smallest amount between 1991 and 2010. … [2] www.theallpapers.com
Question paper, page 19
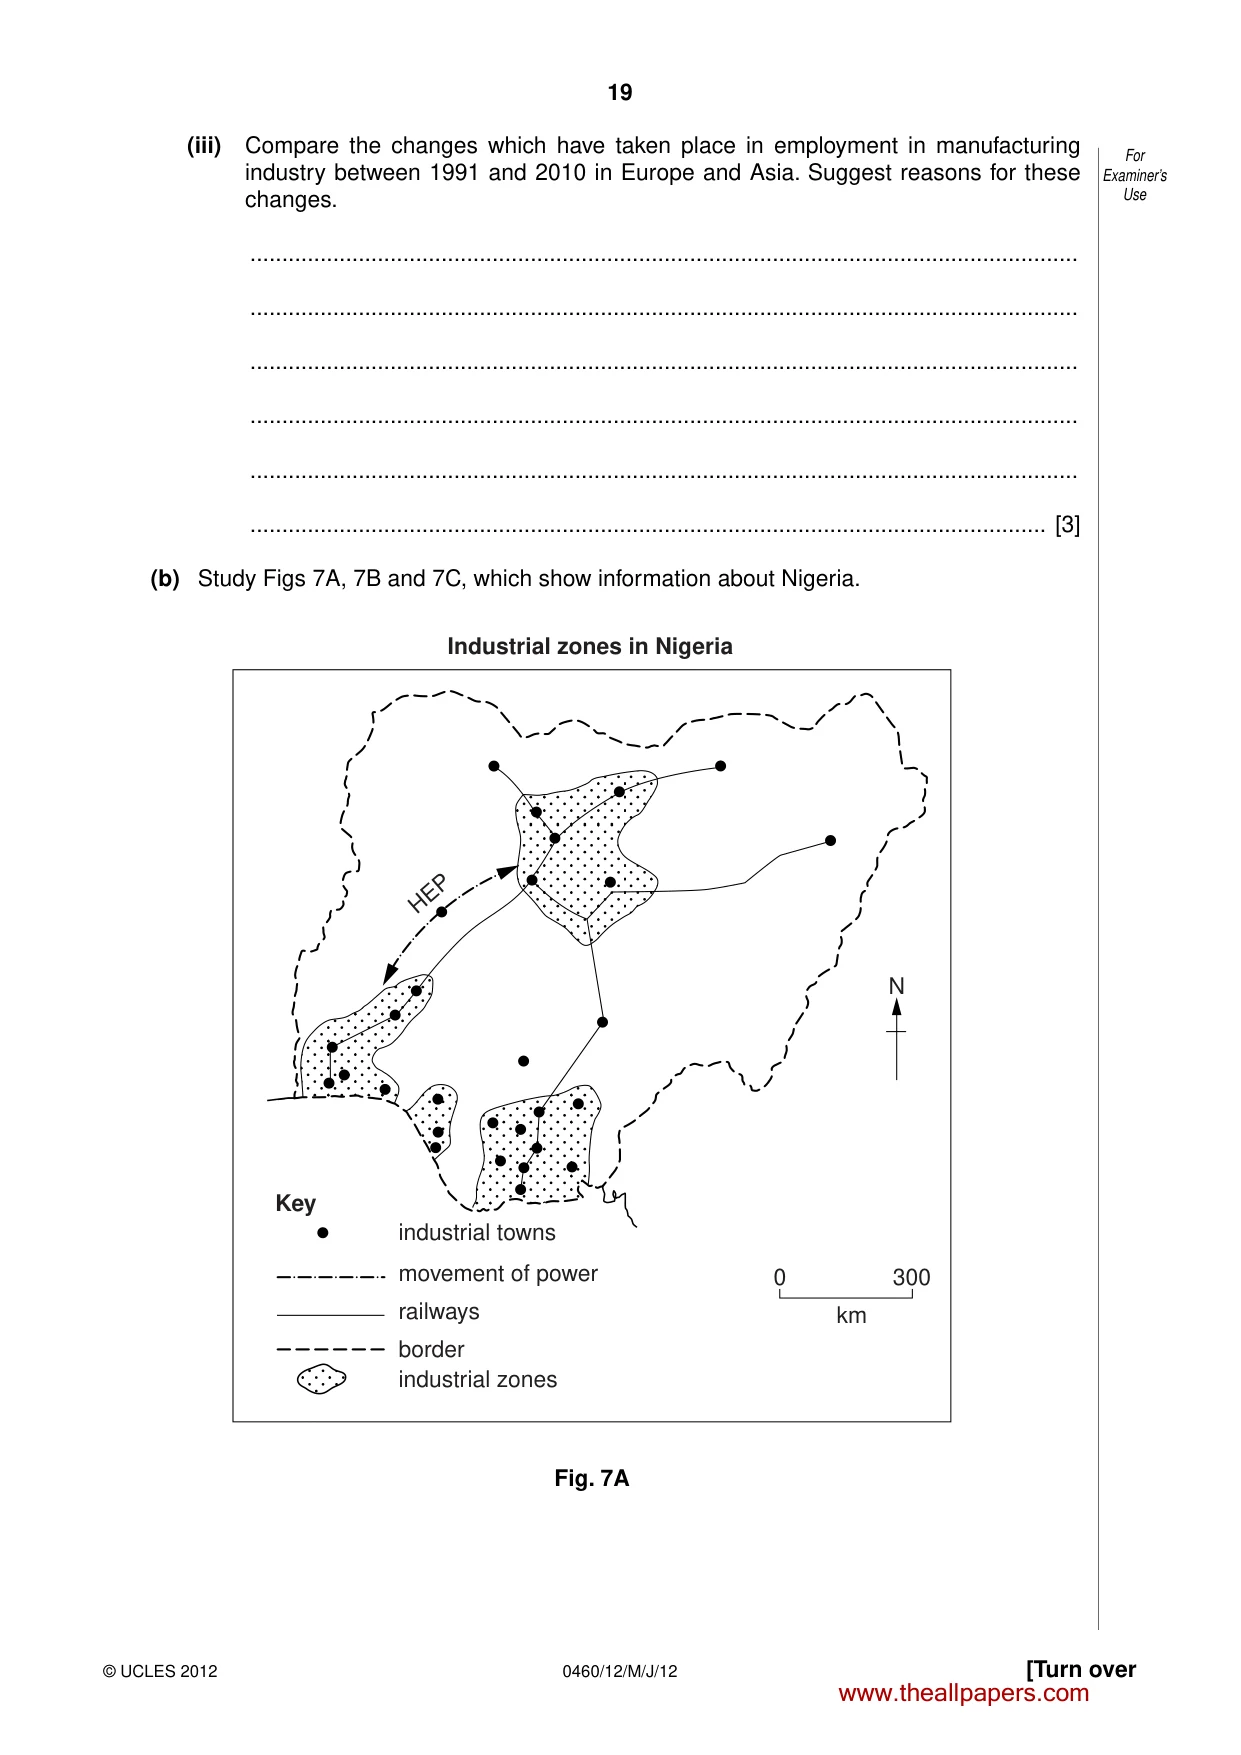
19 0460/12/M/J/12 © UCLES 2012 [Turn over For Examiner’s Use (iii) Compare the changes which have taken place in employment in manufacturing industry between 1991 and 2010 in Europe and Asia. Suggest reasons for these changes. … … … … … … [3] (b) Study Figs 7A, 7B and 7C, which show information about Nigeria. Key Industrial zones in Nigeria km 0 300 N industrial towns movement of power railways border industrial zones HEP Fig. 7A www.theallpapers.com
Question paper, page 20
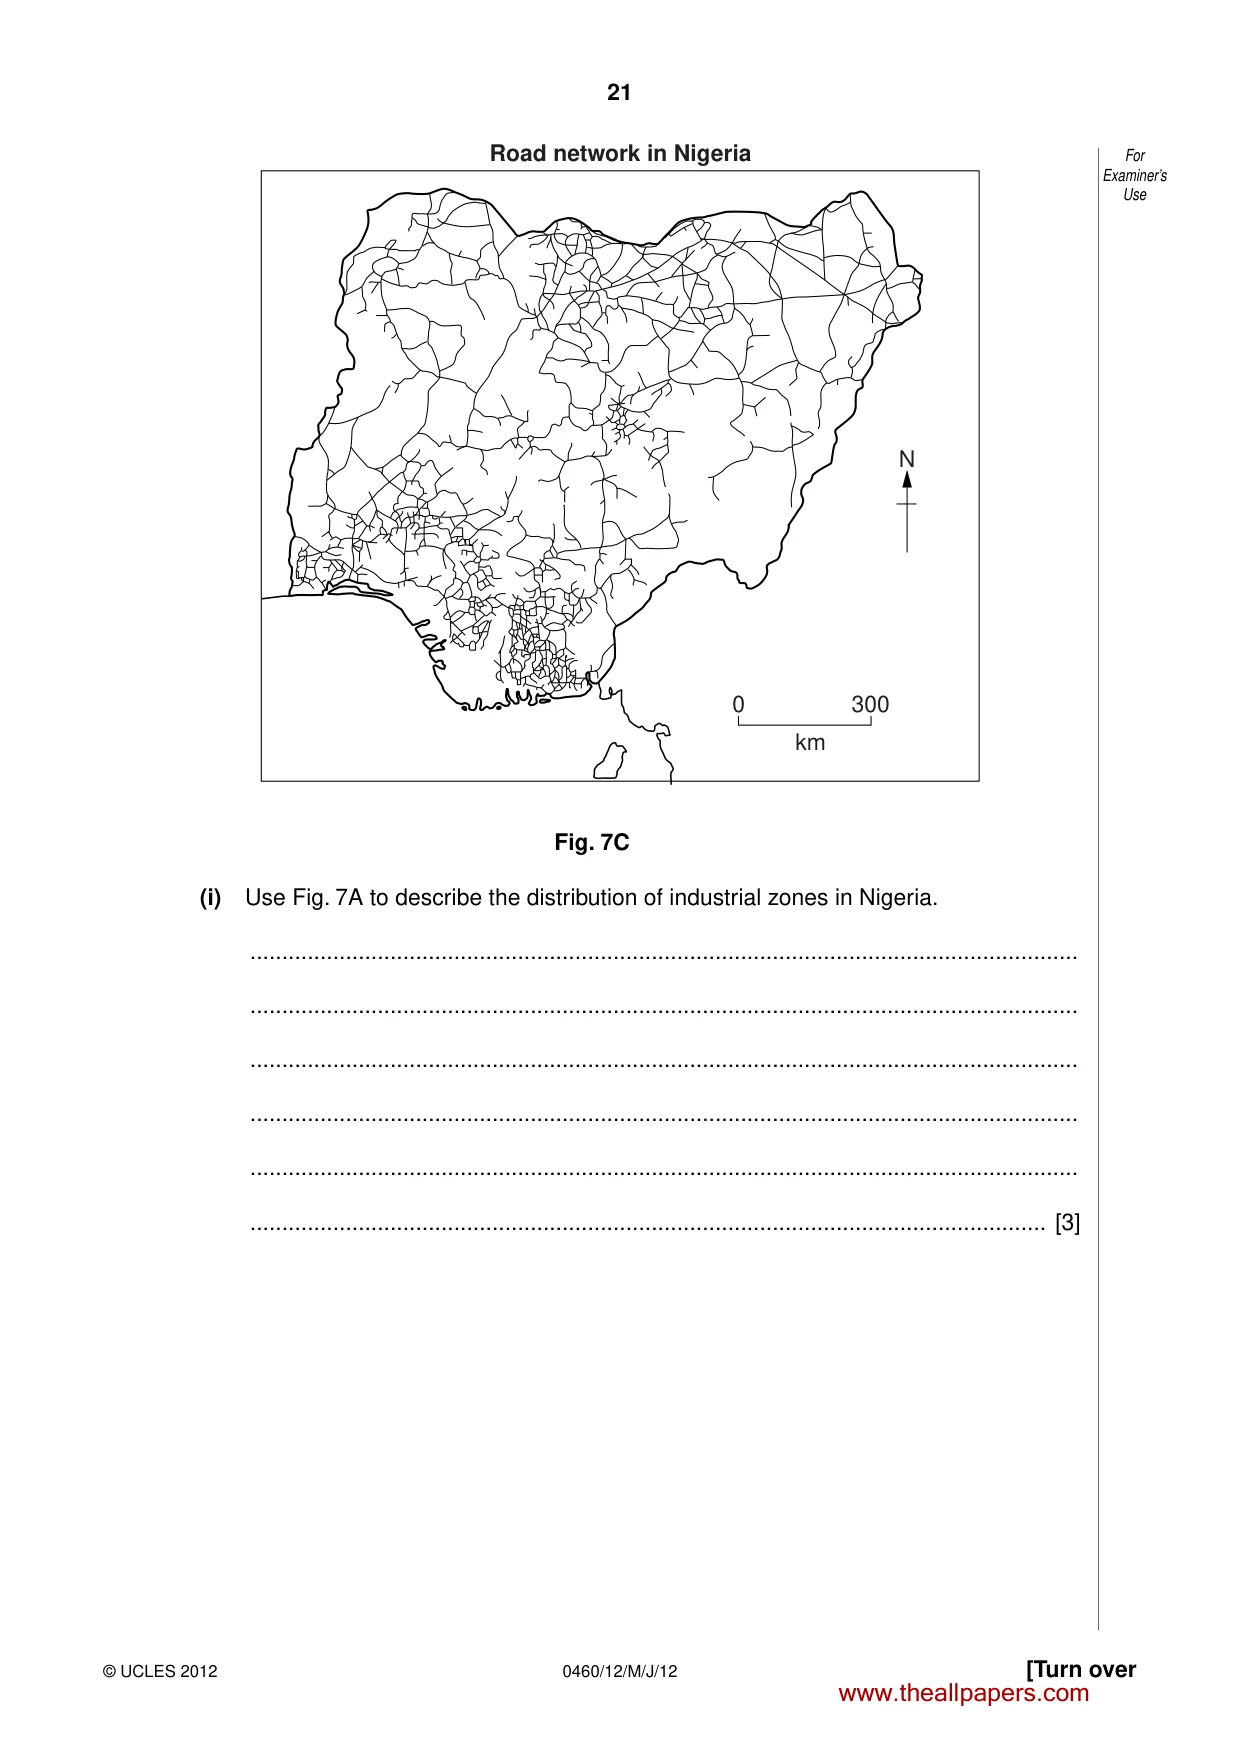
20 0460/12/M/J/12 © UCLES 2012 For Examiner’s Use Density ( inhabitants per km2 ) over 200 51 – 200 11 – 50 1 – 10 under 1 or uninhabited Key Urban population Over 1 million inhabitants 250 001 – 1 million inhabitants 100 000 – 250 000 inhabitants Population distribution and urban population in Nigeria km 0 300 N Fig. 7B www.theallpapers.com
Question paper, page 21
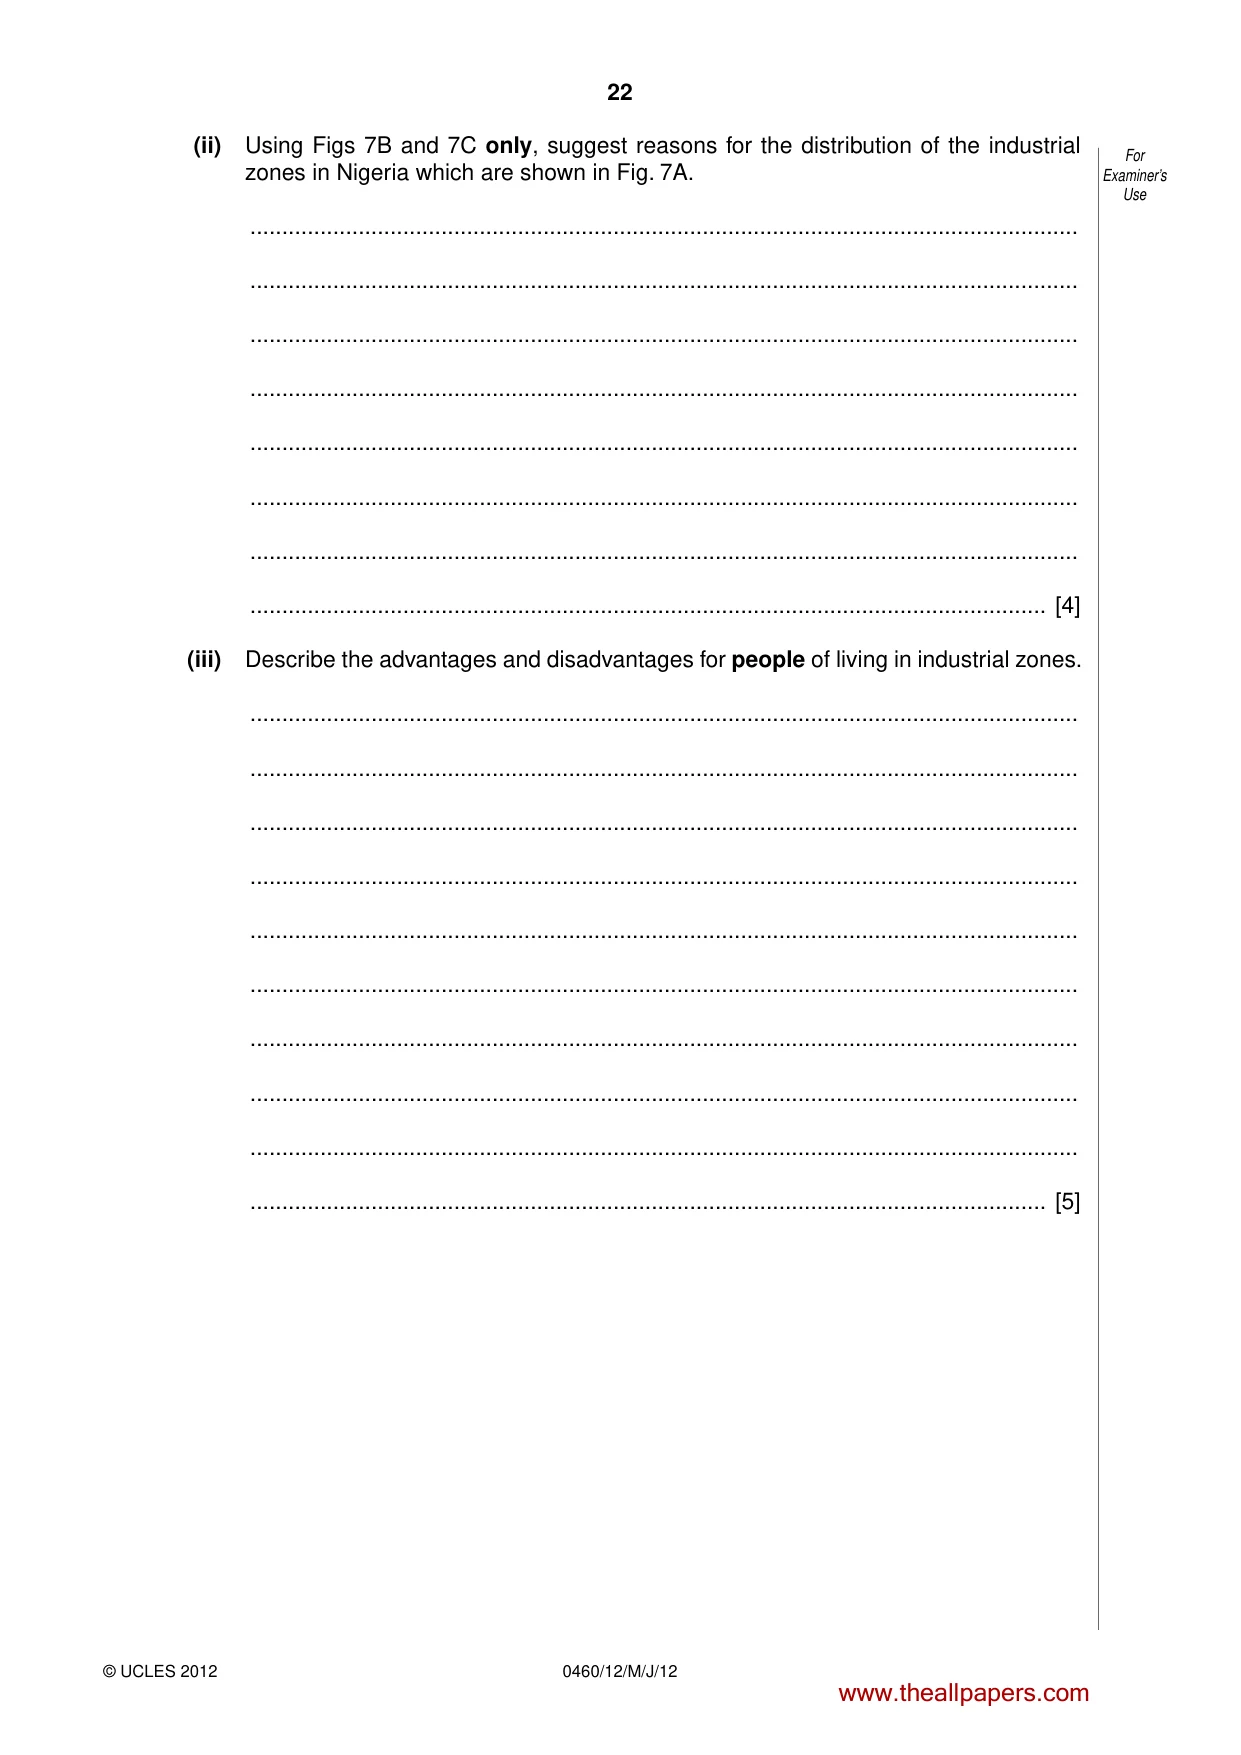
21 0460/12/M/J/12 © UCLES 2012 [Turn over For Examiner’s Use Road network in Nigeria km 0 300 N Fig. 7C (i) Use Fig. 7A to describe the distribution of industrial zones in Nigeria. … … … … … … [3] www.theallpapers.com
Question paper, page 22
22 0460/12/M/J/12 © UCLES 2012 For Examiner’s Use (ii) Using Figs 7B and 7C only, suggest reasons for the distribution of the industrial zones in Nigeria which are shown in Fig. 7A. … … … … … … … … [4] (iii) Describe the advantages and disadvantages for people of living in industrial zones. … … … … … … … … … … [5] www.theallpapers.com
Question paper, page 23
23 0460/12/M/J/12 © UCLES 2012 [Turn over For Examiner’s Use (c) For a named area where manufacturing industry is important, describe its impacts on the natural environment. Name of area … … … … … … … … … … … … … … … [7] [Total: 25 marks] END OF QUESTION 5 www.theallpapers.com
Question paper, page 24
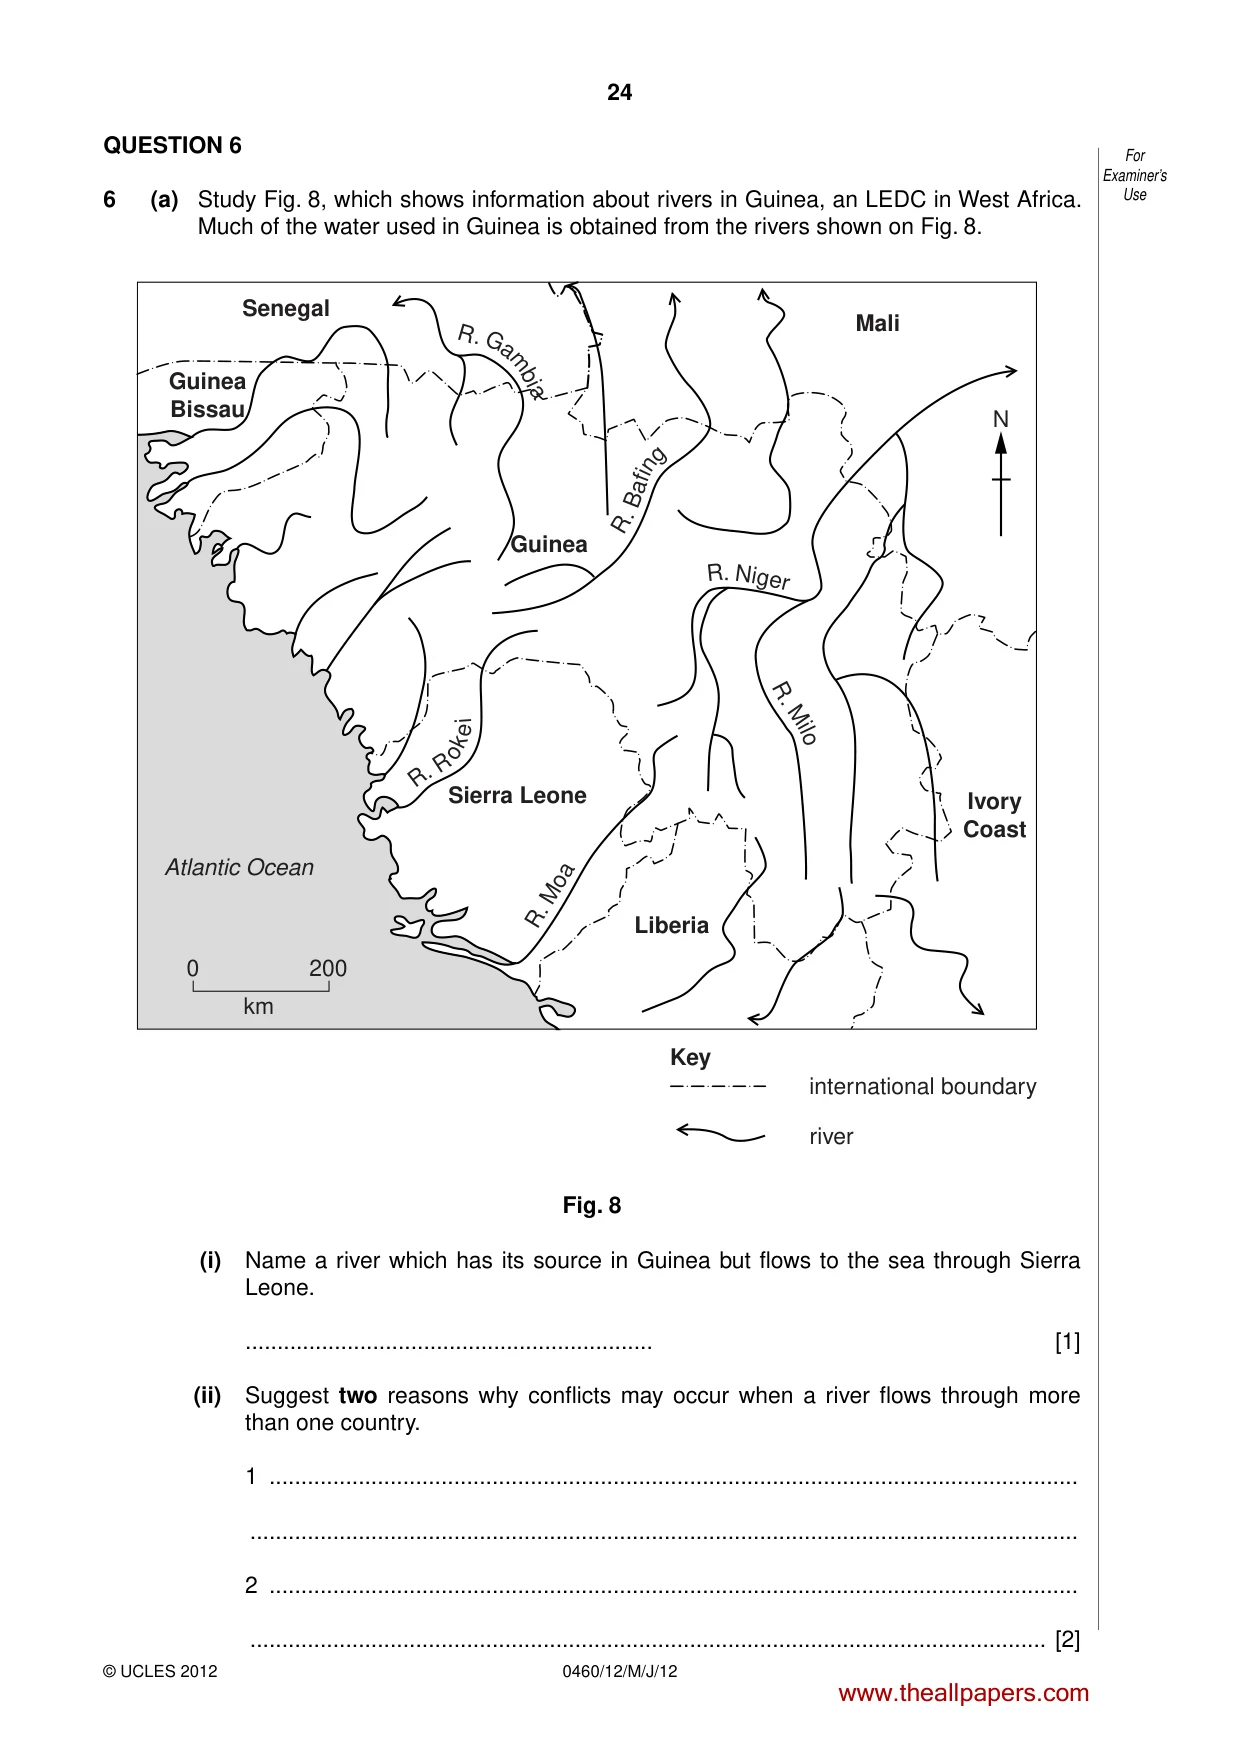
24 0460/12/M/J/12 © UCLES 2012 For Examiner’s Use QUESTION 6 6 (a) Study Fig. 8, which shows information about rivers in Guinea, an LEDC in West Africa. Much of the water used in Guinea is obtained from the rivers shown on Fig. 8. R . B af i n g R . Ni ge r Senegal Guinea Bissau Mali Ivory Coast Sierra Leone Liberia Guinea R . M i l o R. Moa R . R o k e i R . G a m bi a 0 km 200 N international boundary river Key Atlantic Ocean Fig. 8 (i) Name a river which has its source in Guinea but flows to the sea through Sierra Leone. … [1] (ii) Suggest two reasons why conflicts may occur when a river flows through more than one country. 1 … … 2 … … [2] www.theallpapers.com
Question paper, page 25
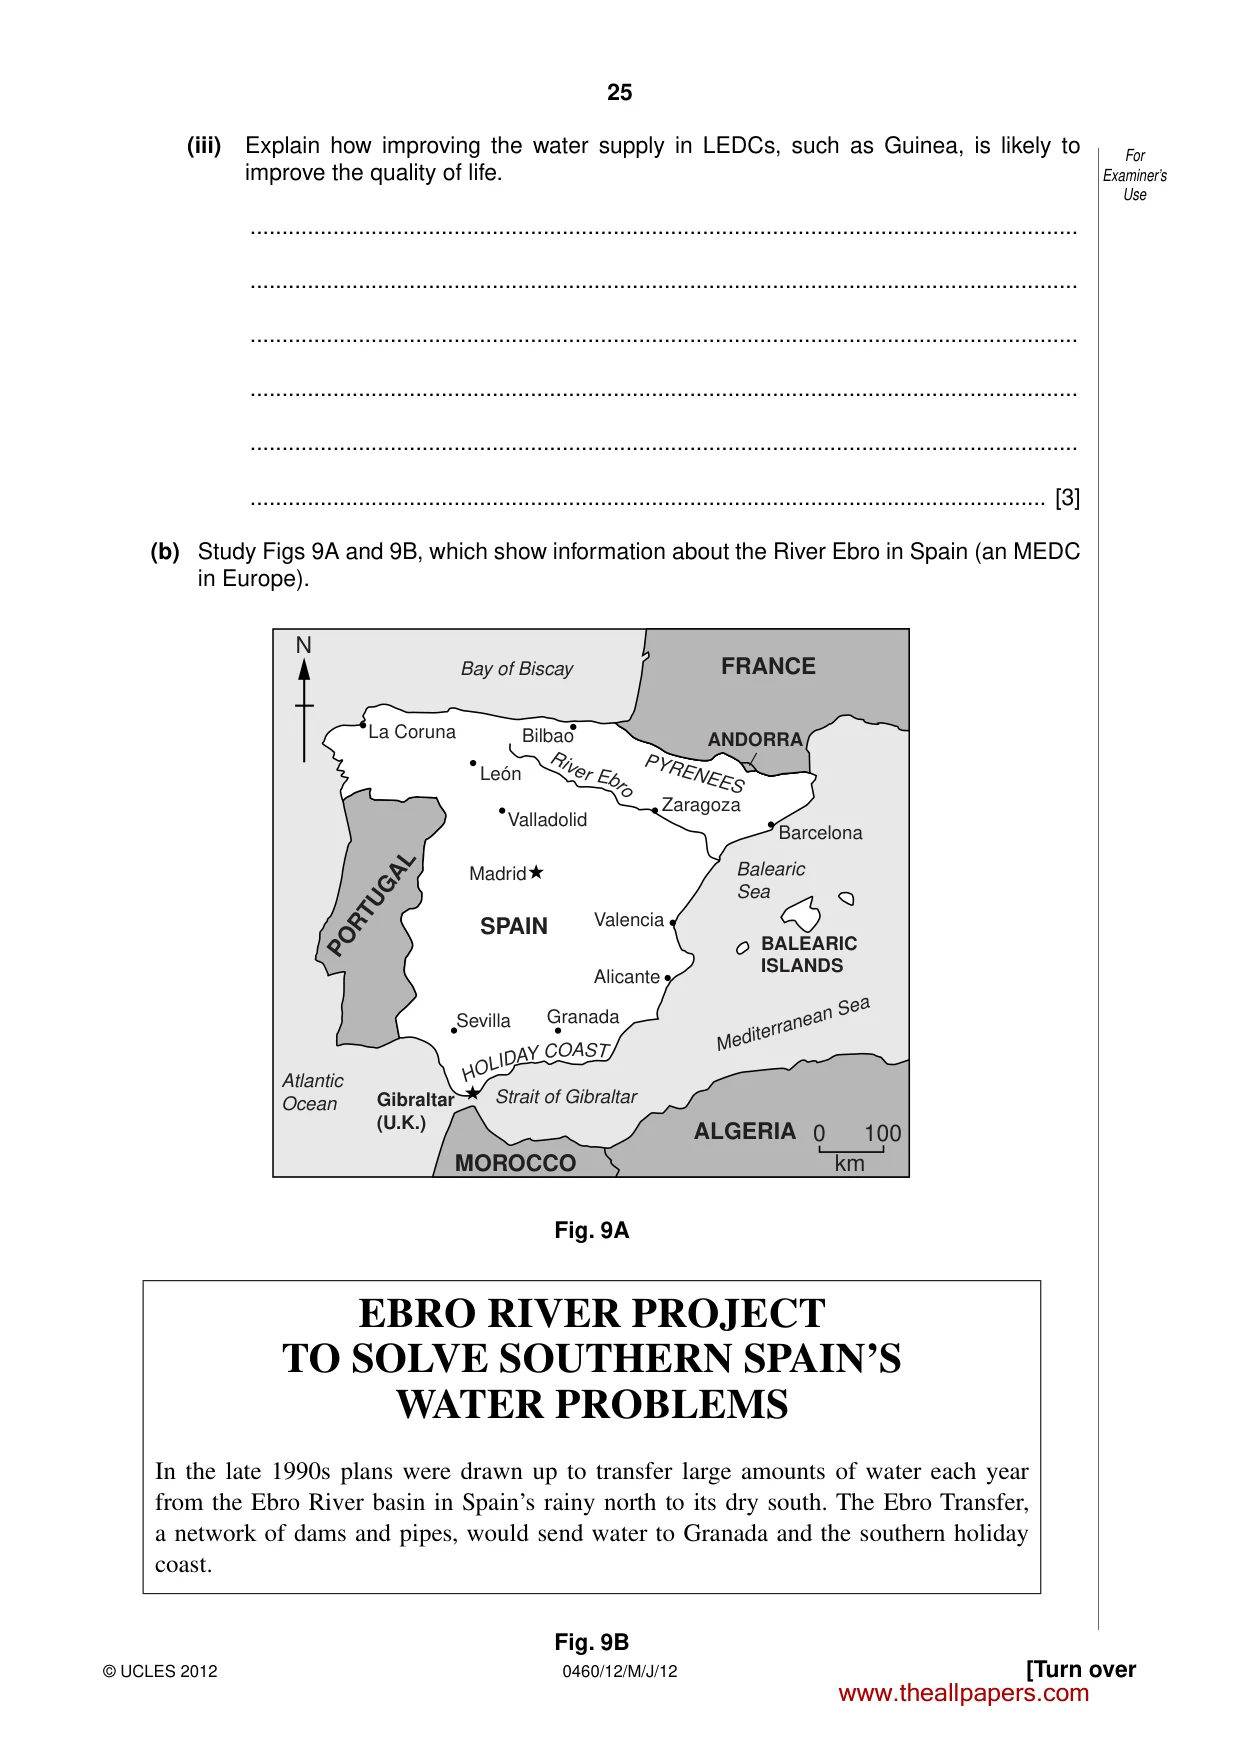
25 0460/12/M/J/12 © UCLES 2012 [Turn over For Examiner’s Use (iii) Explain how improving the water supply in LEDCs, such as Guinea, is likely to improve the quality of life. … … … … … … [3] (b) Study Figs 9A and 9B, which show information about the River Ebro in Spain (an MEDC in Europe). 0 100 km ALGERIA MOROCCO PORTUGAL SPAIN FRANCE N Barcelona Valencia Zaragoza ANDORRA Valladolid Alicante Granada Sevilla H O LI D AY C O AS T Strait of Gibraltar Gibraltar (U.K.) Atlantic Ocean Mediterranean Sea PYRENEES Balearic Sea Bay of Biscay León Bilbao La Coruna BALEARIC ISLANDS Madrid R iv e r E b r o Fig. 9A EBRO RIVER PROJECT TO SOLVE SOUTHERN SPAIN’S WATER PROBLEMS In the late 1990s plans were drawn up to transfer large amounts of water each year from the Ebro River basin in Spain’s rainy north to its dry south. The Ebro Transfer, a network of dams and pipes, would send water to Granada and the southern holiday coast. Fig. 9B www.theallpapers.com
Question paper, page 26
26 0460/12/M/J/12 © UCLES 2012 For Examiner’s Use (i) Explain why the Ebro River Project was planned. … … … … … … [3] (ii) Describe other methods which can be used to supply more water to areas which need it. … … … … … … … … [4] (iii) Explain how water can be used in a sustainable way. … … … … … … … … … … [5] www.theallpapers.com
Question paper, page 27
27 0460/12/M/J/12 © UCLES 2012 [Turn over For Examiner’s Use (c) For a named country or area which you have studied, describe one way in which energy is produced. Name of area or country … … … … … … … … … … … … … … … [7] [Total: 25 marks] END OF QUESTION 6 www.theallpapers.com
Question paper, page 28
28 0460/12/M/J/12 © UCLES 2012 For Examiner’s Use Additional Page If you used the following lines to complete the answer(s) to any question(s), the question number(s) must be clearly shown. … … … … … … … … … … … … … … … … … … … … … … Copyright Acknowledgements: Question 1 Photographs A, B and C Steve Sibley © UCLES. Question 2 Photographs D and E Steve Sibley © UCLES. Question 3 Photographs F and G Steve Sibley © UCLES. Permission to reproduce items where third-party owned material protected by copyright is included has been sought and cleared where possible. Every reasonable effort has been made by the publisher (UCLES) to trace copyright holders, but if any items requiring clearance have unwittingly been included, the publisher will be pleased to make amends at the earliest possible opportunity. University of Cambridge International Examinations is part of the Cambridge Assessment Group. Cambridge Assessment is the brand name of University of Cambridge Local Examinations Syndicate (UCLES), which is itself a department of the University of Cambridge. www.theallpapers.com
Mark scheme, page 1
UNIVERSITY OF CAMBRIDGE INTERNATIONAL EXAMINATIONS International General Certificate of Secondary Education MARK SCHEME for the May/June 2012 question paper for the guidance of teachers 0460 GEOGRAPHY 0460/12 Paper 1, maximum raw mark 75 This mark scheme is published as an aid to teachers and candidates, to indicate the requirements of the examination. It shows the basis on which Examiners were instructed to award marks. It does not indicate the details of the discussions that took place at an Examiners’ meeting before marking began, which would have considered the acceptability of alternative answers. Mark schemes must be read in conjunction with the question papers and the report on the examination. • Cambridge will not enter into discussions or correspondence in connection with these mark schemes. Cambridge is publishing the mark schemes for the May/June 2012 question papers for most IGCSE, GCE Advanced Level and Advanced Subsidiary Level syllabuses and some Ordinary Level syllabuses. www.theallpapers.com
Mark scheme, page 2
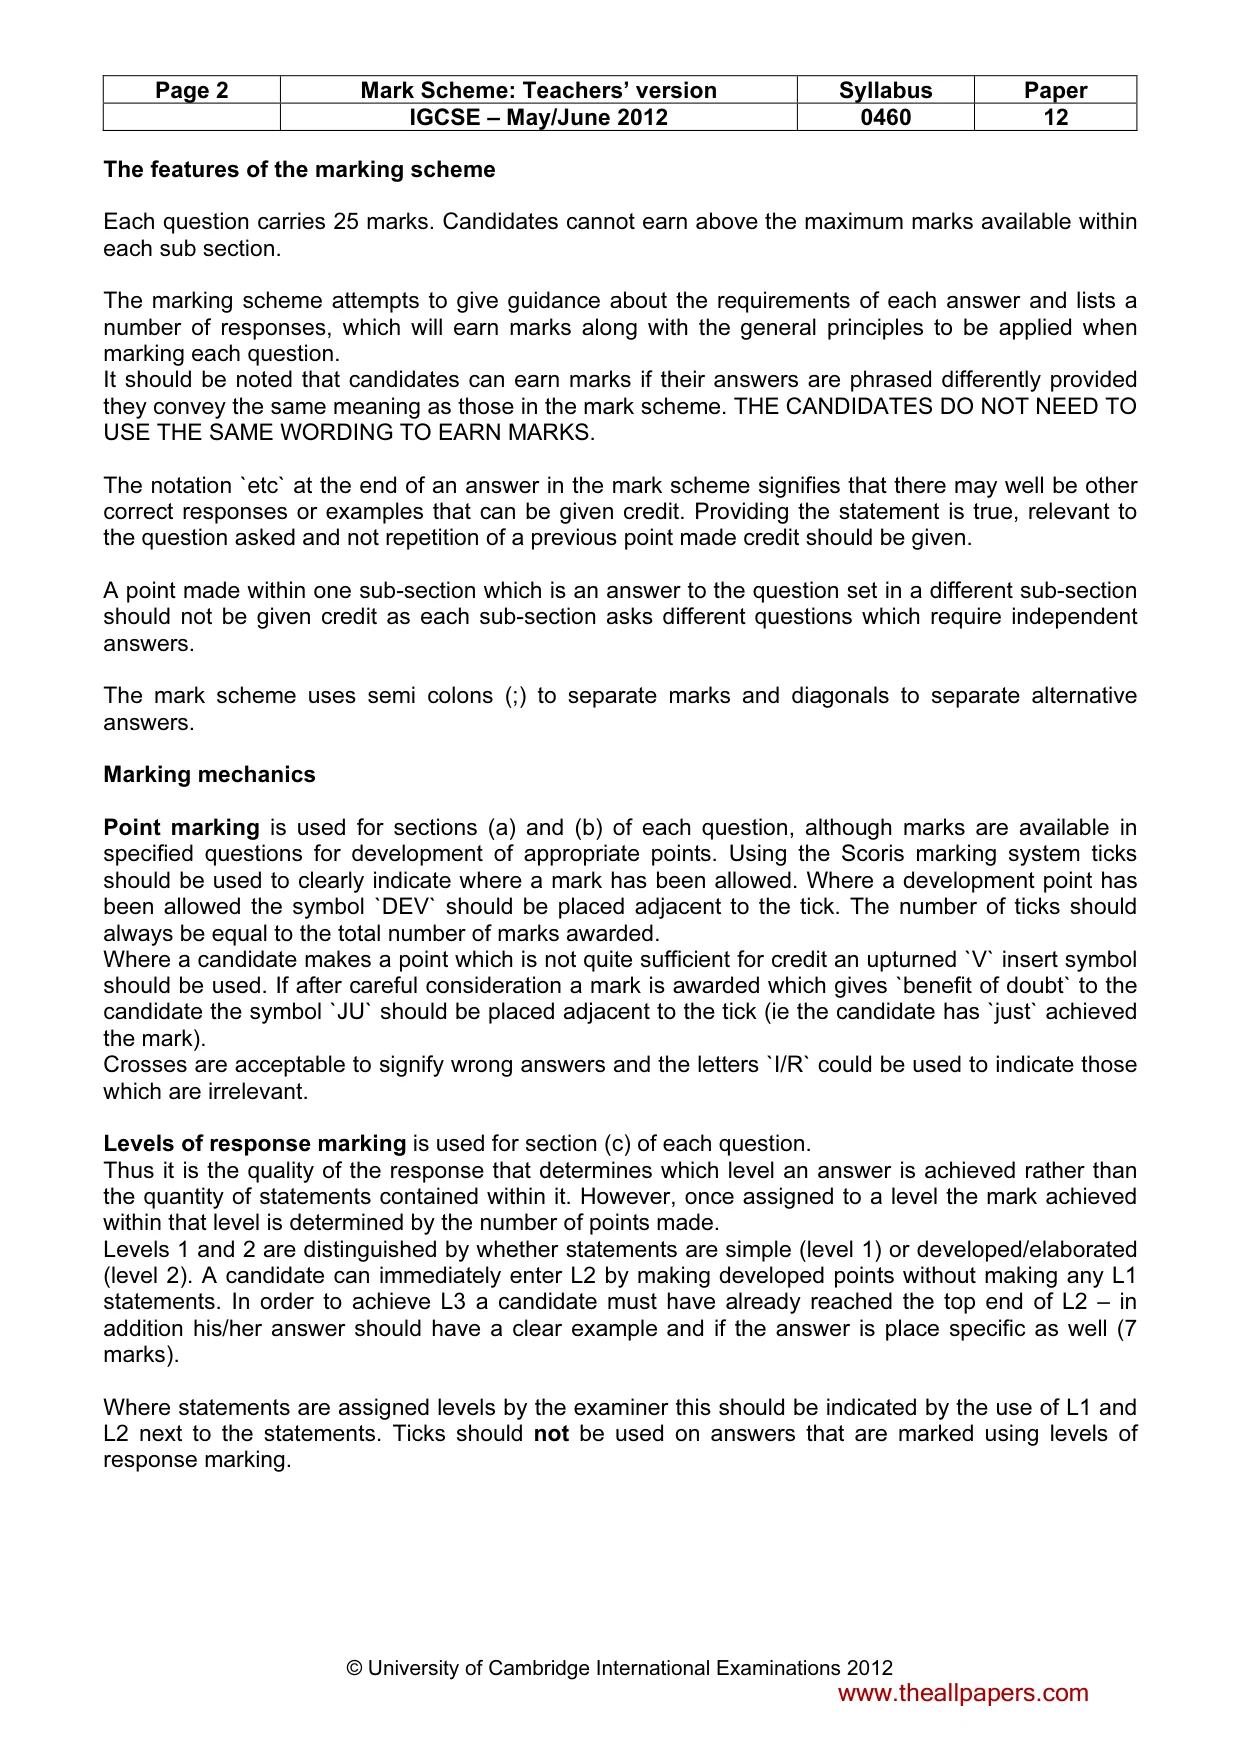
Page 2 Mark Scheme: Teachers’ version Syllabus Paper IGCSE – May/June 2012 0460 12 © University of Cambridge International Examinations 2012 The features of the marking scheme Each question carries 25 marks. Candidates cannot earn above the maximum marks available within each sub section. The marking scheme attempts to give guidance about the requirements of each answer and lists a number of responses, which will earn marks along with the general principles to be applied when marking each question. It should be noted that candidates can earn marks if their answers are phrased differently provided they convey the same meaning as those in the mark scheme. THE CANDIDATES DO NOT NEED TO USE THE SAME WORDING TO EARN MARKS. The notation `etc` at the end of an answer in the mark scheme signifies that there may well be other correct responses or examples that can be given credit. Providing the statement is true, relevant to the question asked and not repetition of a previous point made credit should be given. A point made within one sub-section which is an answer to the question set in a different sub-section should not be given credit as each sub-section asks different questions which require independent answers. The mark scheme uses semi colons (;) to separate marks and diagonals to separate alternative answers. Marking mechanics Point marking is used for sections (a) and (b) of each question, although marks are available in specified questions for development of appropriate points. Using the Scoris marking system ticks should be used to clearly indicate where a mark has been allowed. Where a development point has been allowed the symbol `DEV` should be placed adjacent to the tick. The number of ticks should always be equal to the total number of marks awarded. Where a candidate makes a point which is not quite sufficient for credit an upturned `V` insert symbol should be used. If after careful consideration a mark is awarded which gives `benefit of doubt` to the candidate the symbol `JU` should be placed adjacent to the tick (ie the candidate has `just` achieved the mark). Crosses are acceptable to signify wrong answers and the letters `I/R` could be used to indicate those which are irrelevant. Levels of response marking is used for section (c) of each question. Thus it is the quality of the response that determines which level an answer is achieved rather than the quantity of statements contained within it. However, once assigned to a level the mark achieved within that level is determined by the number of points made. Levels 1 and 2 are distinguished by whether statements are simple (level 1) or developed/elaborated (level 2). A candidate can immediately enter L2 by making developed points without making any L1 statements. In order to achieve L3 a candidate must have already reached the top end of L2 – in addition his/her answer should have a clear example and if the answer is place specific as well (7 marks). Where statements are assigned levels by the examiner this should be indicated by the use of L1 and L2 next to the statements. Ticks should not be used on answers that are marked using levels of response marking. www.theallpapers.com
Mark scheme, page 3
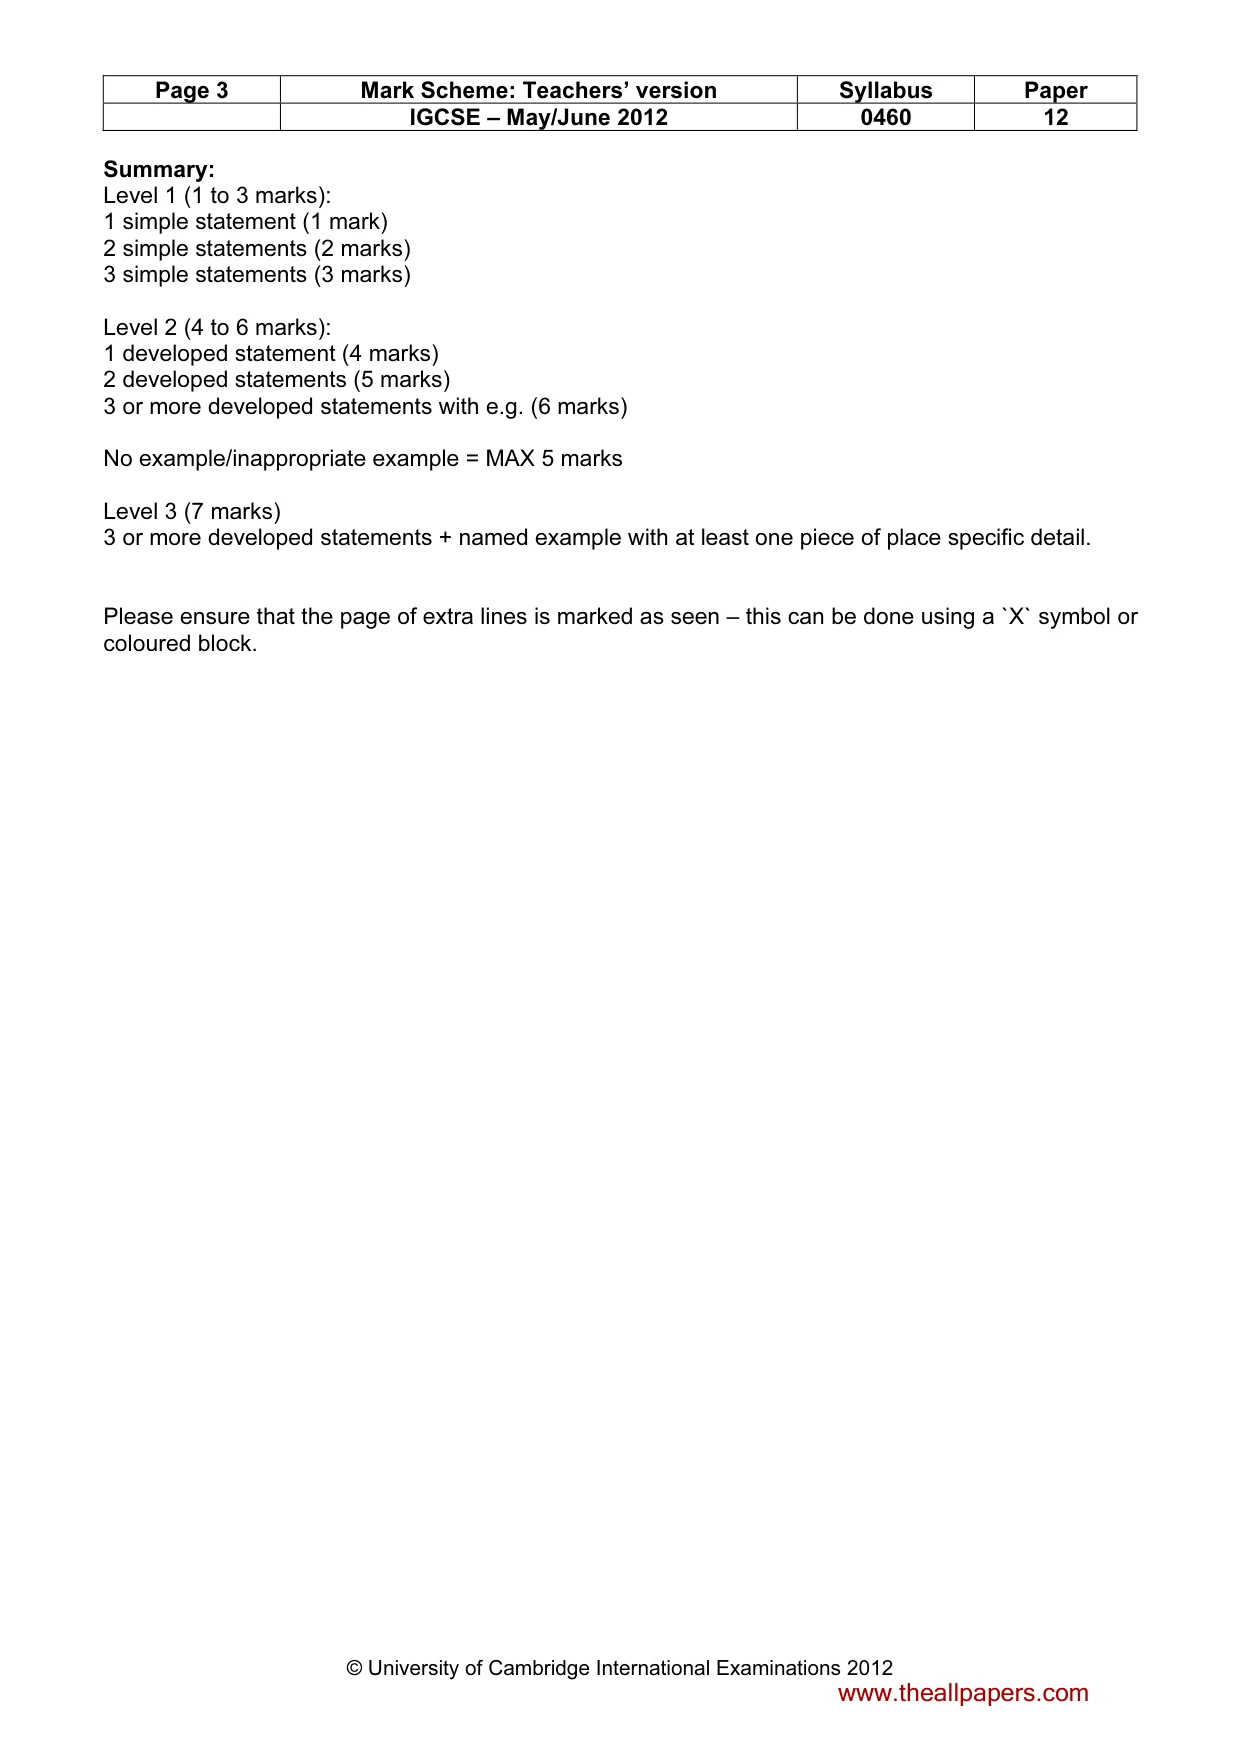
Page 3 Mark Scheme: Teachers’ version Syllabus Paper IGCSE – May/June 2012 0460 12 © University of Cambridge International Examinations 2012 Summary: Level 1 (1 to 3 marks): 1 simple statement (1 mark) 2 simple statements (2 marks) 3 simple statements (3 marks) Level 2 (4 to 6 marks): 1 developed statement (4 marks) 2 developed statements (5 marks) 3 or more developed statements with e.g. (6 marks) No example/inappropriate example = MAX 5 marks Level 3 (7 marks) 3 or more developed statements + named example with at least one piece of place specific detail. Please ensure that the page of extra lines is marked as seen – this can be done using a `X` symbol or coloured block. www.theallpapers.com
Mark scheme, page 4
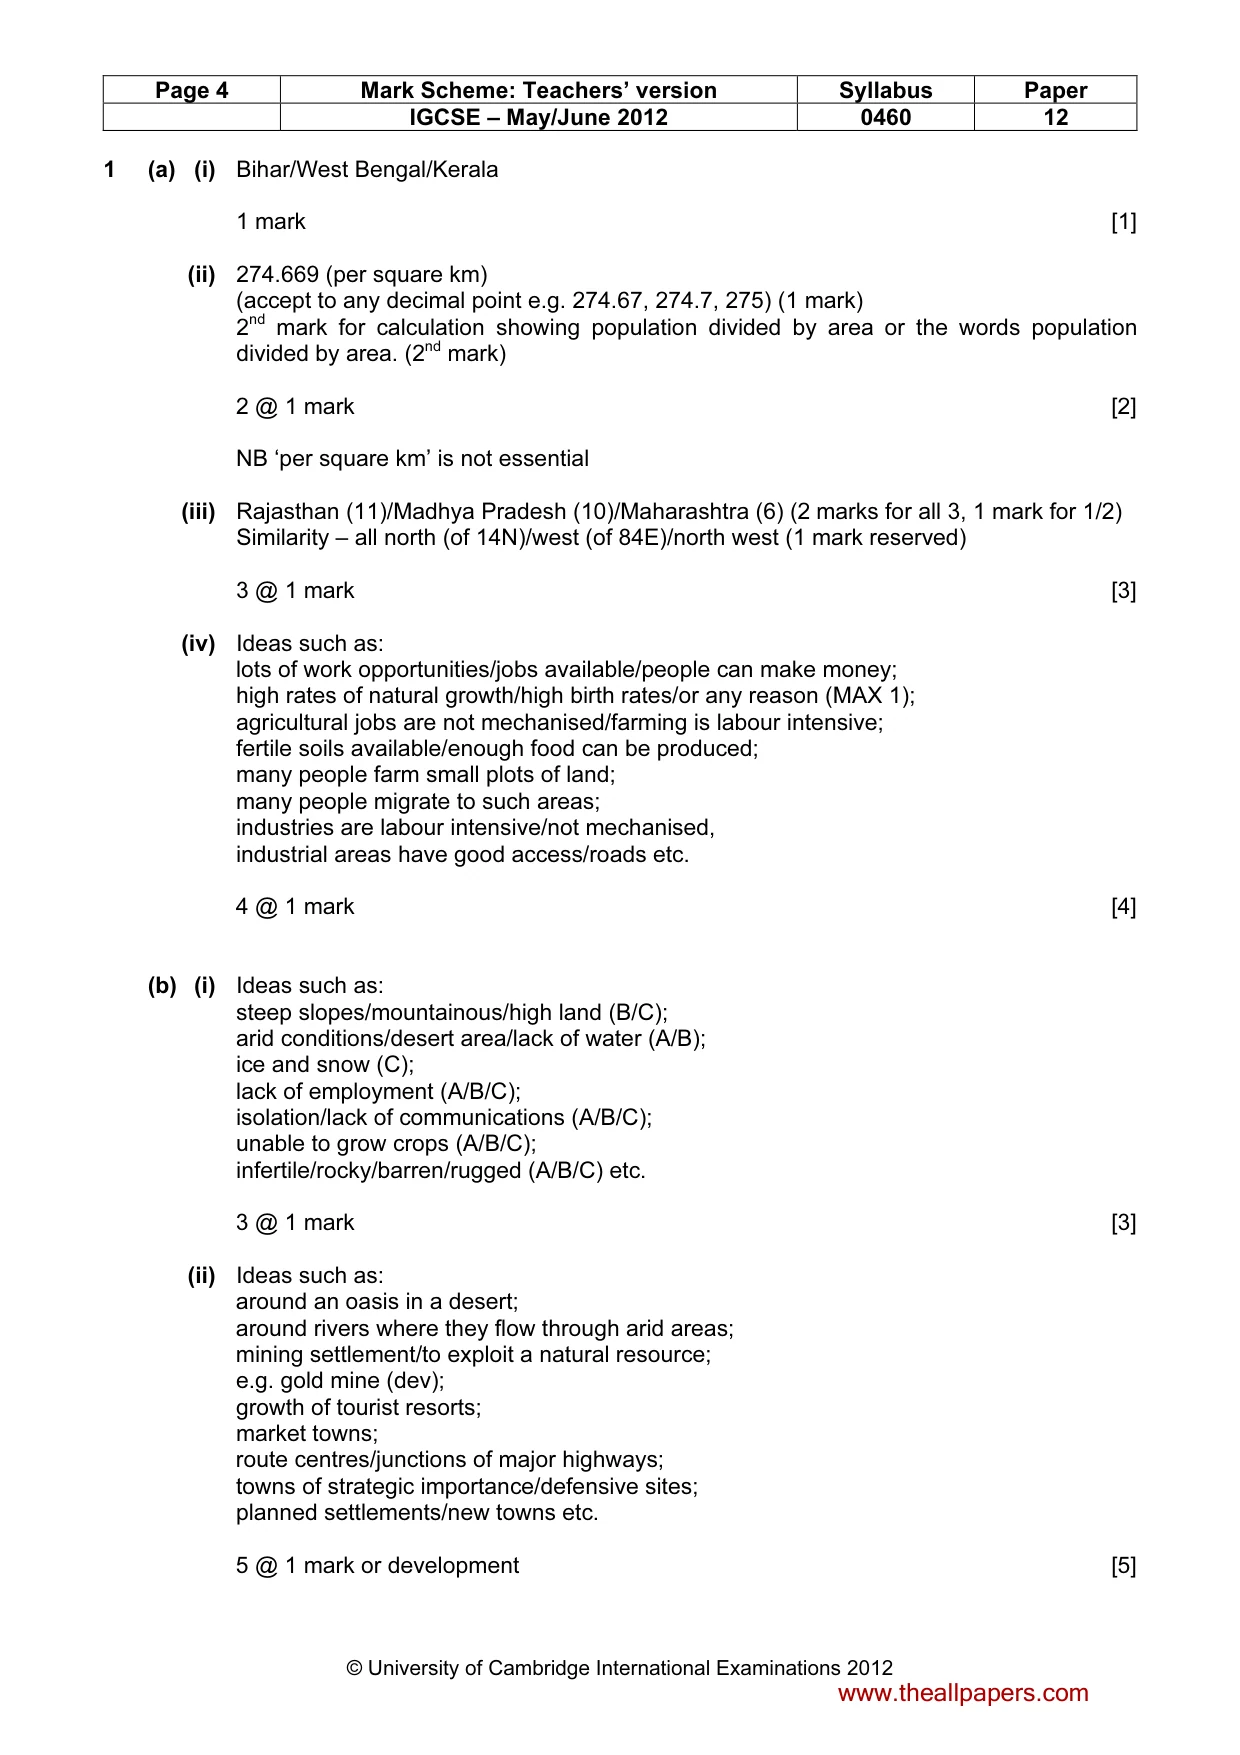
Page 4 Mark Scheme: Teachers’ version Syllabus Paper IGCSE – May/June 2012 0460 12 © University of Cambridge International Examinations 2012 1 (a) (i) Bihar/West Bengal/Kerala 1 mark [1] (ii) 274.669 (per square km) (accept to any decimal point e.g. 274.67, 274.7, 275) (1 mark) 2nd mark for calculation showing population divided by area or the words population divided by area. (2nd mark) 2 @ 1 mark [2] NB ‘per square km’ is not essential (iii) Rajasthan (11)/Madhya Pradesh (10)/Maharashtra (6) (2 marks for all 3, 1 mark for 1/2) Similarity – all north (of 14N)/west (of 84E)/north west (1 mark reserved) 3 @ 1 mark [3] (iv) Ideas such as: lots of work opportunities/jobs available/people can make money; high rates of natural growth/high birth rates/or any reason (MAX 1); agricultural jobs are not mechanised/farming is labour intensive; fertile soils available/enough food can be produced; many people farm small plots of land; many people migrate to such areas; industries are labour intensive/not mechanised, industrial areas have good access/roads etc. 4 @ 1 mark [4] (b) (i) Ideas such as: steep slopes/mountainous/high land (B/C); arid conditions/desert area/lack of water (A/B); ice and snow (C); lack of employment (A/B/C); isolation/lack of communications (A/B/C); unable to grow crops (A/B/C); infertile/rocky/barren/rugged (A/B/C) etc. 3 @ 1 mark [3] (ii) Ideas such as: around an oasis in a desert; around rivers where they flow through arid areas; mining settlement/to exploit a natural resource; e.g. gold mine (dev); growth of tourist resorts; market towns; route centres/junctions of major highways; towns of strategic importance/defensive sites; planned settlements/new towns etc. 5 @ 1 mark or development [5] www.theallpapers.com
Mark scheme, page 5
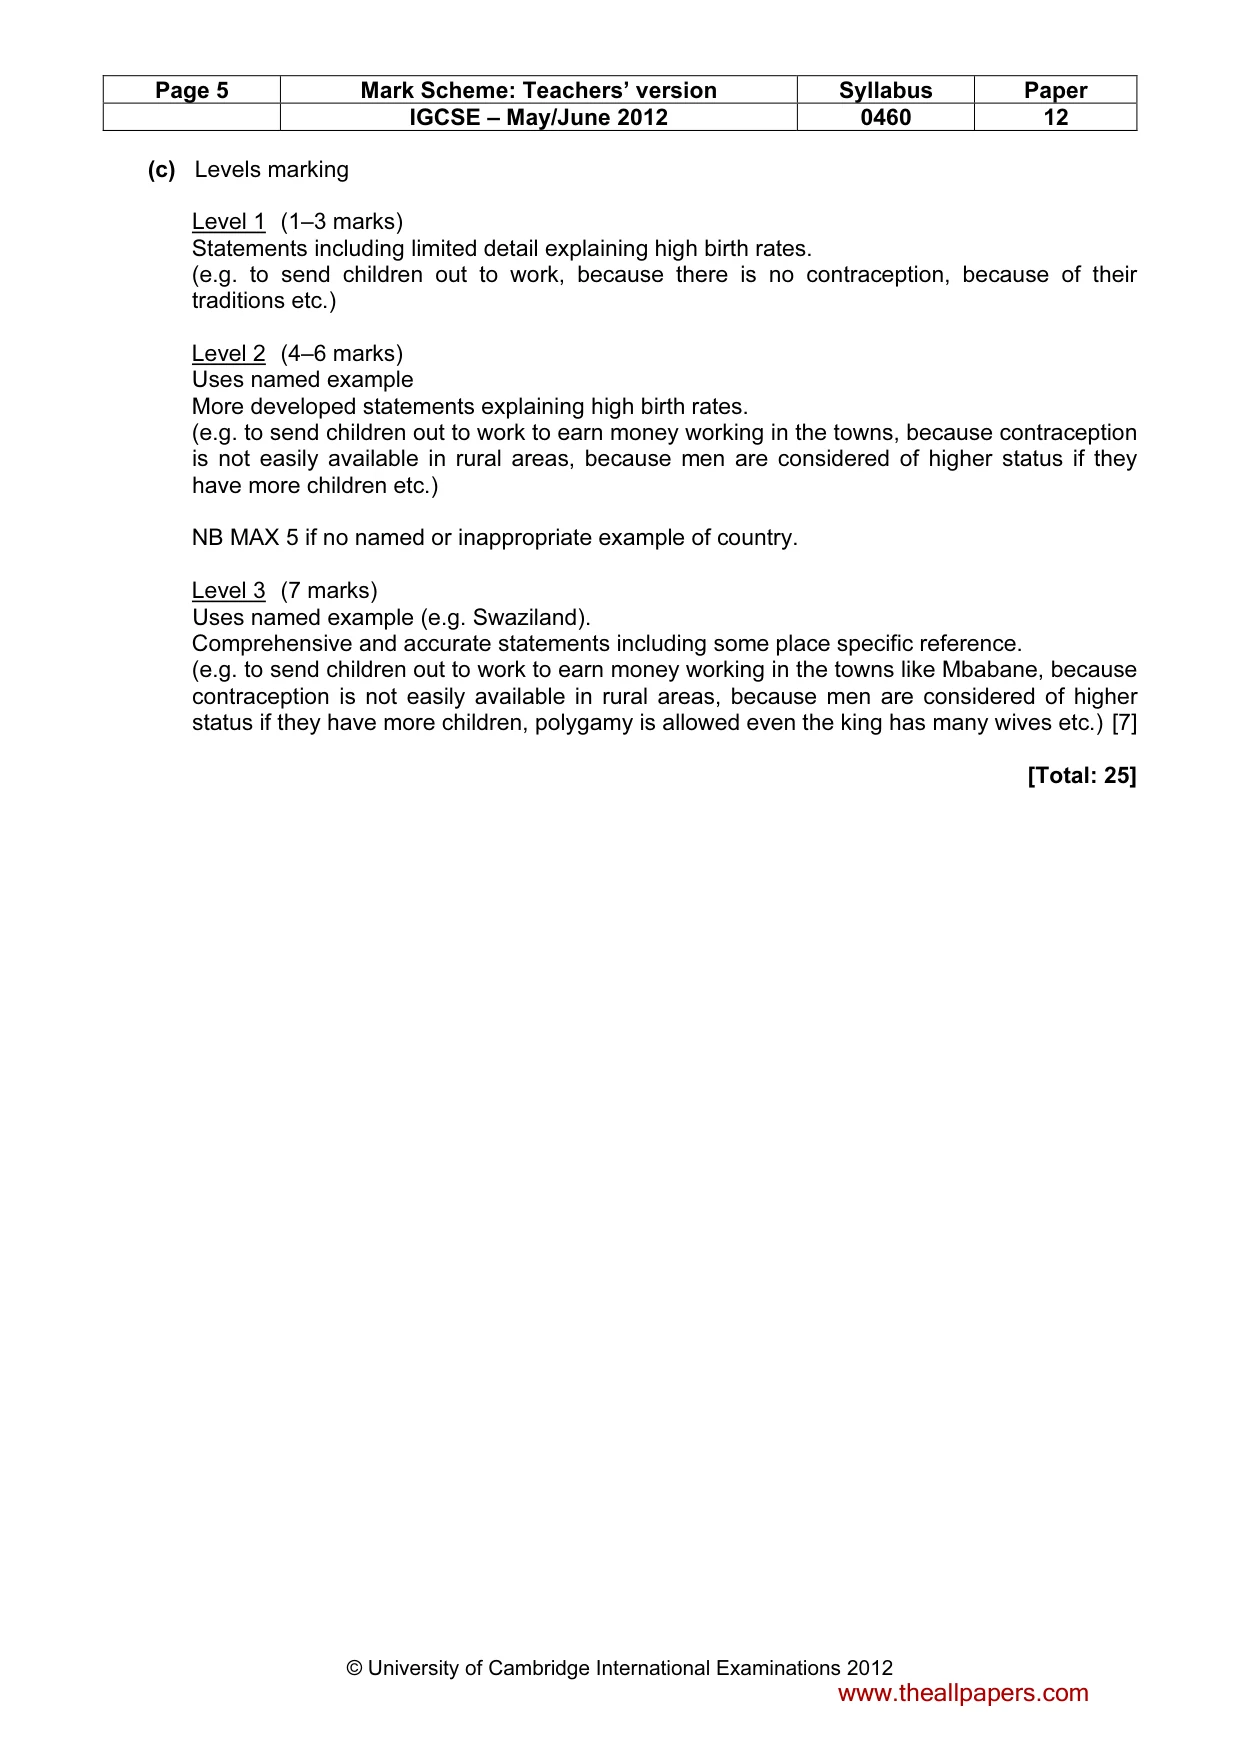
Page 5 Mark Scheme: Teachers’ version Syllabus Paper IGCSE – May/June 2012 0460 12 © University of Cambridge International Examinations 2012 (c) Levels marking Level 1 (1–3 marks) Statements including limited detail explaining high birth rates. (e.g. to send children out to work, because there is no contraception, because of their traditions etc.) Level 2 (4–6 marks) Uses named example More developed statements explaining high birth rates. (e.g. to send children out to work to earn money working in the towns, because contraception is not easily available in rural areas, because men are considered of higher status if they have more children etc.) NB MAX 5 if no named or inappropriate example of country. Level 3 (7 marks) Uses named example (e.g. Swaziland). Comprehensive and accurate statements including some place specific reference. (e.g. to send children out to work to earn money working in the towns like Mbabane, because contraception is not easily available in rural areas, because men are considered of higher status if they have more children, polygamy is allowed even the king has many wives etc.) [7] [Total: 25] www.theallpapers.com
Mark scheme, page 6
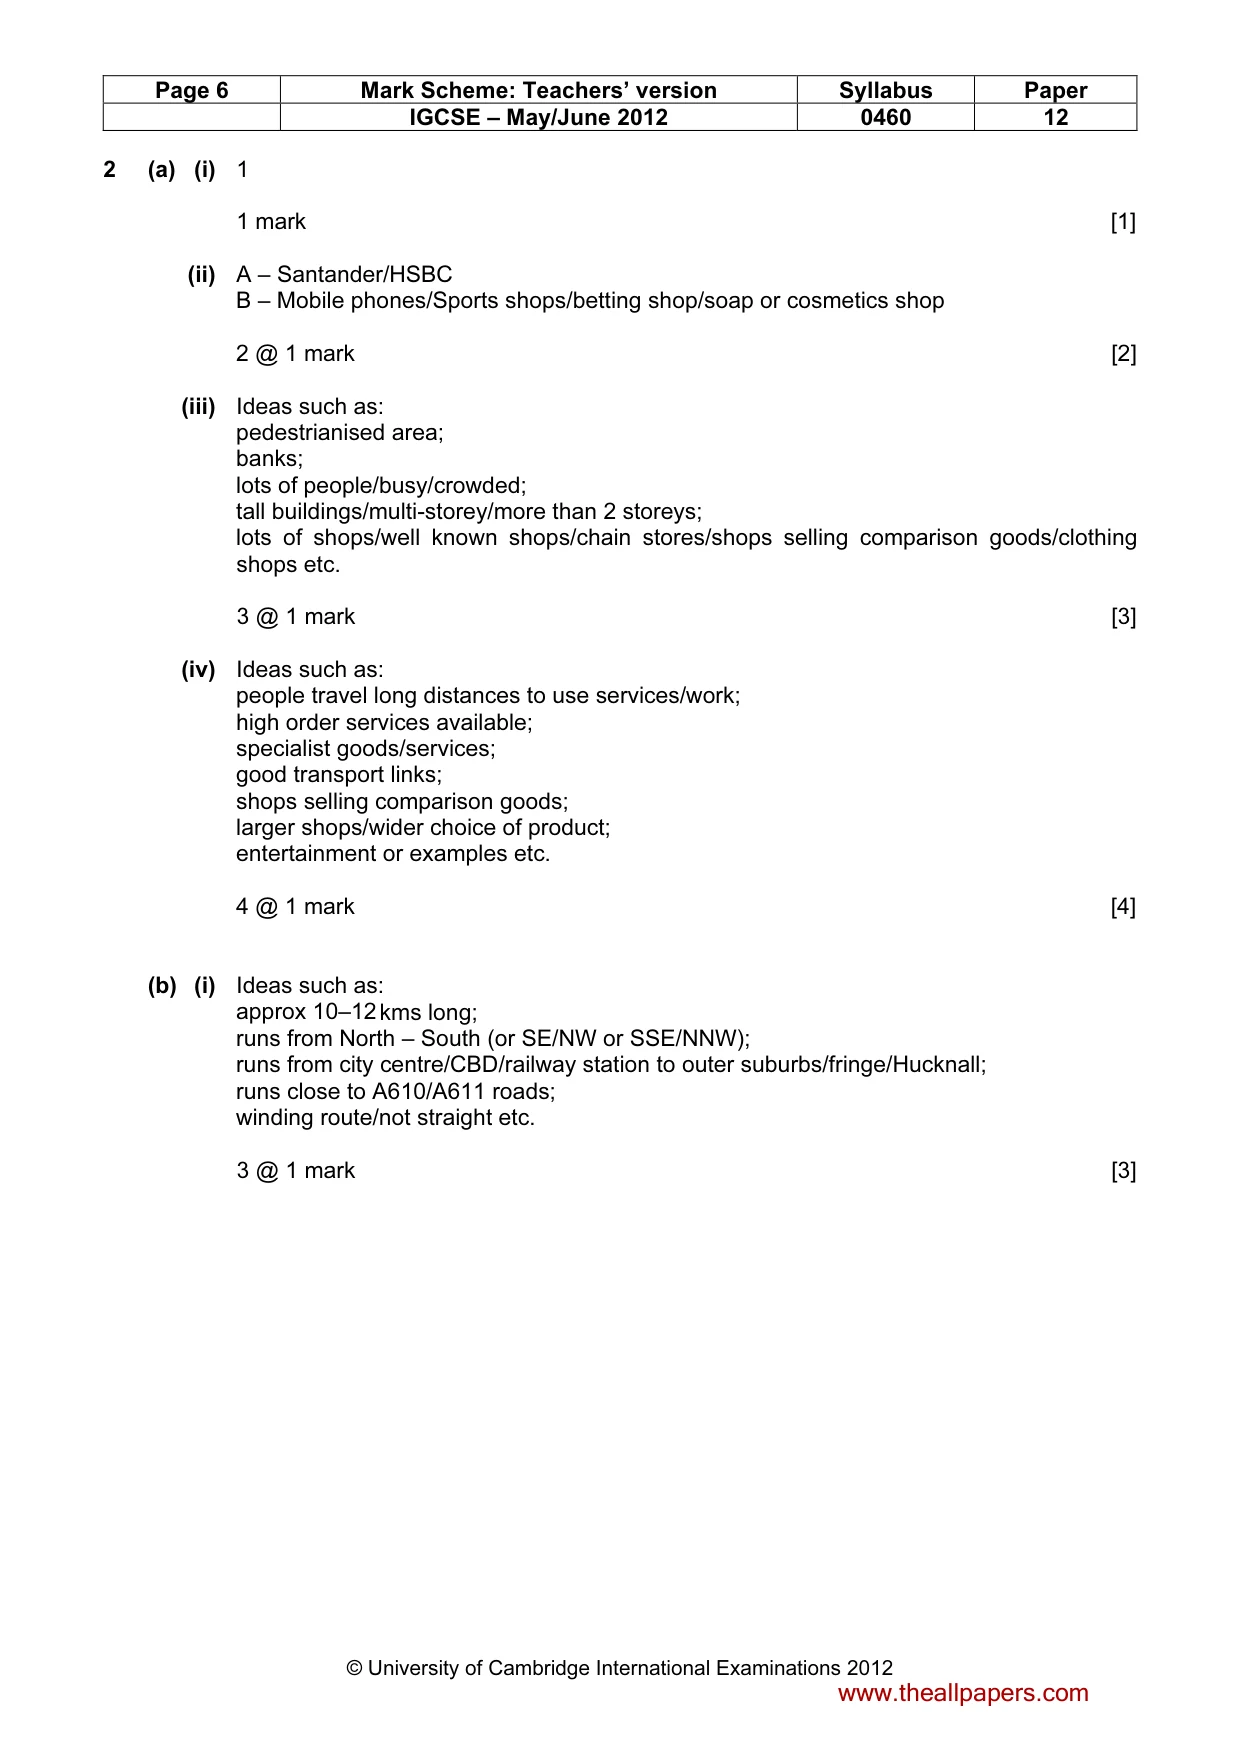
Page 6 Mark Scheme: Teachers’ version Syllabus Paper IGCSE – May/June 2012 0460 12 © University of Cambridge International Examinations 2012 2 (a) (i) 1 1 mark [1] (ii) A – Santander/HSBC B – Mobile phones/Sports shops/betting shop/soap or cosmetics shop 2 @ 1 mark [2] (iii) Ideas such as: pedestrianised area; banks; lots of people/busy/crowded; tall buildings/multi-storey/more than 2 storeys; lots of shops/well known shops/chain stores/shops selling comparison goods/clothing shops etc. 3 @ 1 mark [3] (iv) Ideas such as: people travel long distances to use services/work; high order services available; specialist goods/services; good transport links; shops selling comparison goods; larger shops/wider choice of product; entertainment or examples etc. 4 @ 1 mark [4] (b) (i) Ideas such as: approx 10–12 kms long; runs from North – South (or SE/NW or SSE/NNW); runs from city centre/CBD/railway station to outer suburbs/fringe/Hucknall; runs close to A610/A611 roads; winding route/not straight etc. 3 @ 1 mark [3] www.theallpapers.com
Mark scheme, page 7
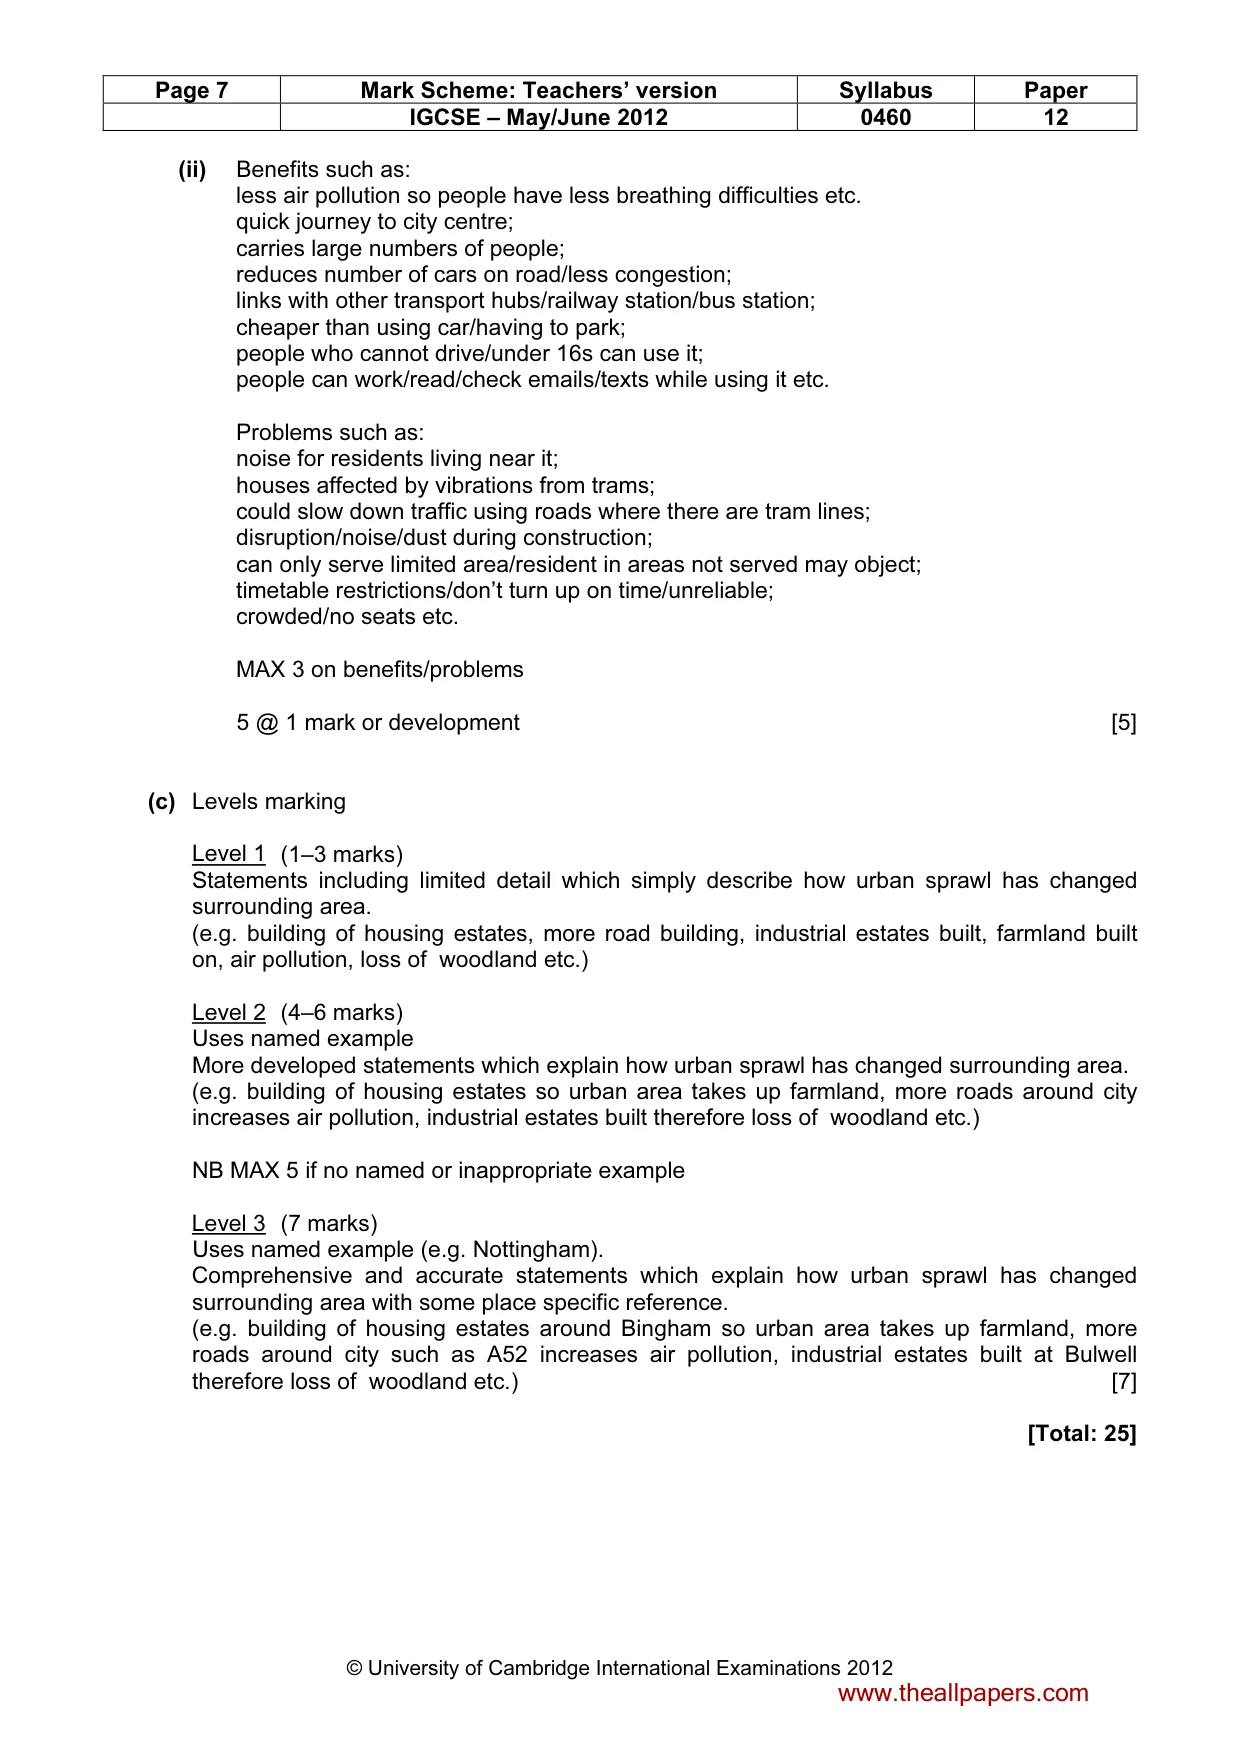
Page 7 Mark Scheme: Teachers’ version Syllabus Paper IGCSE – May/June 2012 0460 12 © University of Cambridge International Examinations 2012 (ii) Benefits such as: less air pollution so people have less breathing difficulties etc. quick journey to city centre; carries large numbers of people; reduces number of cars on road/less congestion; links with other transport hubs/railway station/bus station; cheaper than using car/having to park; people who cannot drive/under 16s can use it; people can work/read/check emails/texts while using it etc. Problems such as: noise for residents living near it; houses affected by vibrations from trams; could slow down traffic using roads where there are tram lines; disruption/noise/dust during construction; can only serve limited area/resident in areas not served may object; timetable restrictions/don’t turn up on time/unreliable; crowded/no seats etc. MAX 3 on benefits/problems 5 @ 1 mark or development [5] (c) Levels marking Level 1 (1–3 marks) Statements including limited detail which simply describe how urban sprawl has changed surrounding area. (e.g. building of housing estates, more road building, industrial estates built, farmland built on, air pollution, loss of woodland etc.) Level 2 (4–6 marks) Uses named example More developed statements which explain how urban sprawl has changed surrounding area. (e.g. building of housing estates so urban area takes up farmland, more roads around city increases air pollution, industrial estates built therefore loss of woodland etc.) NB MAX 5 if no named or inappropriate example Level 3 (7 marks) Uses named example (e.g. Nottingham). Comprehensive and accurate statements which explain how urban sprawl has changed surrounding area with some place specific reference. (e.g. building of housing estates around Bingham so urban area takes up farmland, more roads around city such as A52 increases air pollution, industrial estates built at Bulwell therefore loss of woodland etc.) [7] [Total: 25] www.theallpapers.com
Mark scheme, page 8
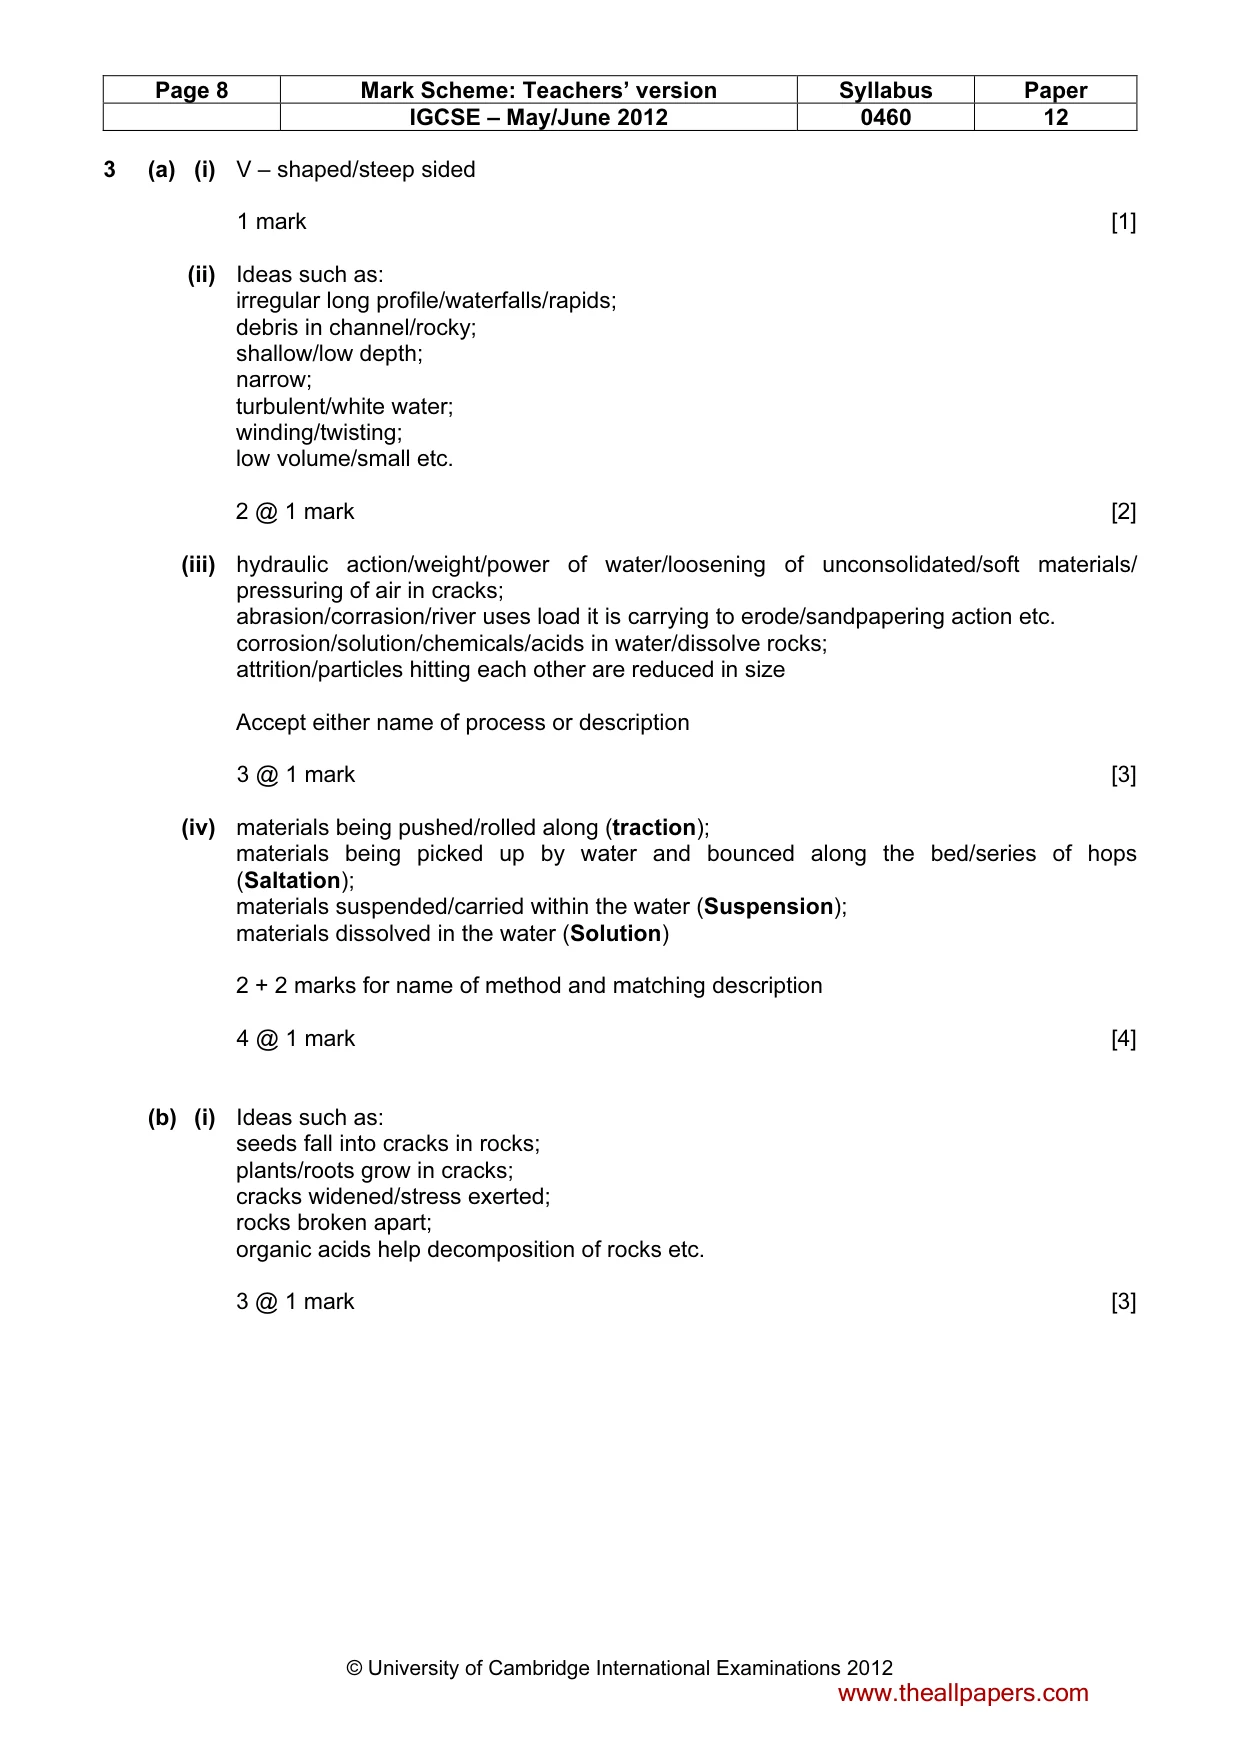
Page 8 Mark Scheme: Teachers’ version Syllabus Paper IGCSE – May/June 2012 0460 12 © University of Cambridge International Examinations 2012 3 (a) (i) V – shaped/steep sided 1 mark [1] (ii) Ideas such as: irregular long profile/waterfalls/rapids; debris in channel/rocky; shallow/low depth; narrow; turbulent/white water; winding/twisting; low volume/small etc. 2 @ 1 mark [2] (iii) hydraulic action/weight/power of water/loosening of unconsolidated/soft materials/ pressuring of air in cracks; abrasion/corrasion/river uses load it is carrying to erode/sandpapering action etc. corrosion/solution/chemicals/acids in water/dissolve rocks; attrition/particles hitting each other are reduced in size Accept either name of process or description 3 @ 1 mark [3] (iv) materials being pushed/rolled along (traction); materials being picked up by water and bounced along the bed/series of hops (Saltation); materials suspended/carried within the water (Suspension); materials dissolved in the water (Solution) 2 + 2 marks for name of method and matching description 4 @ 1 mark [4] (b) (i) Ideas such as: seeds fall into cracks in rocks; plants/roots grow in cracks; cracks widened/stress exerted; rocks broken apart; organic acids help decomposition of rocks etc. 3 @ 1 mark [3] www.theallpapers.com
Mark scheme, page 9
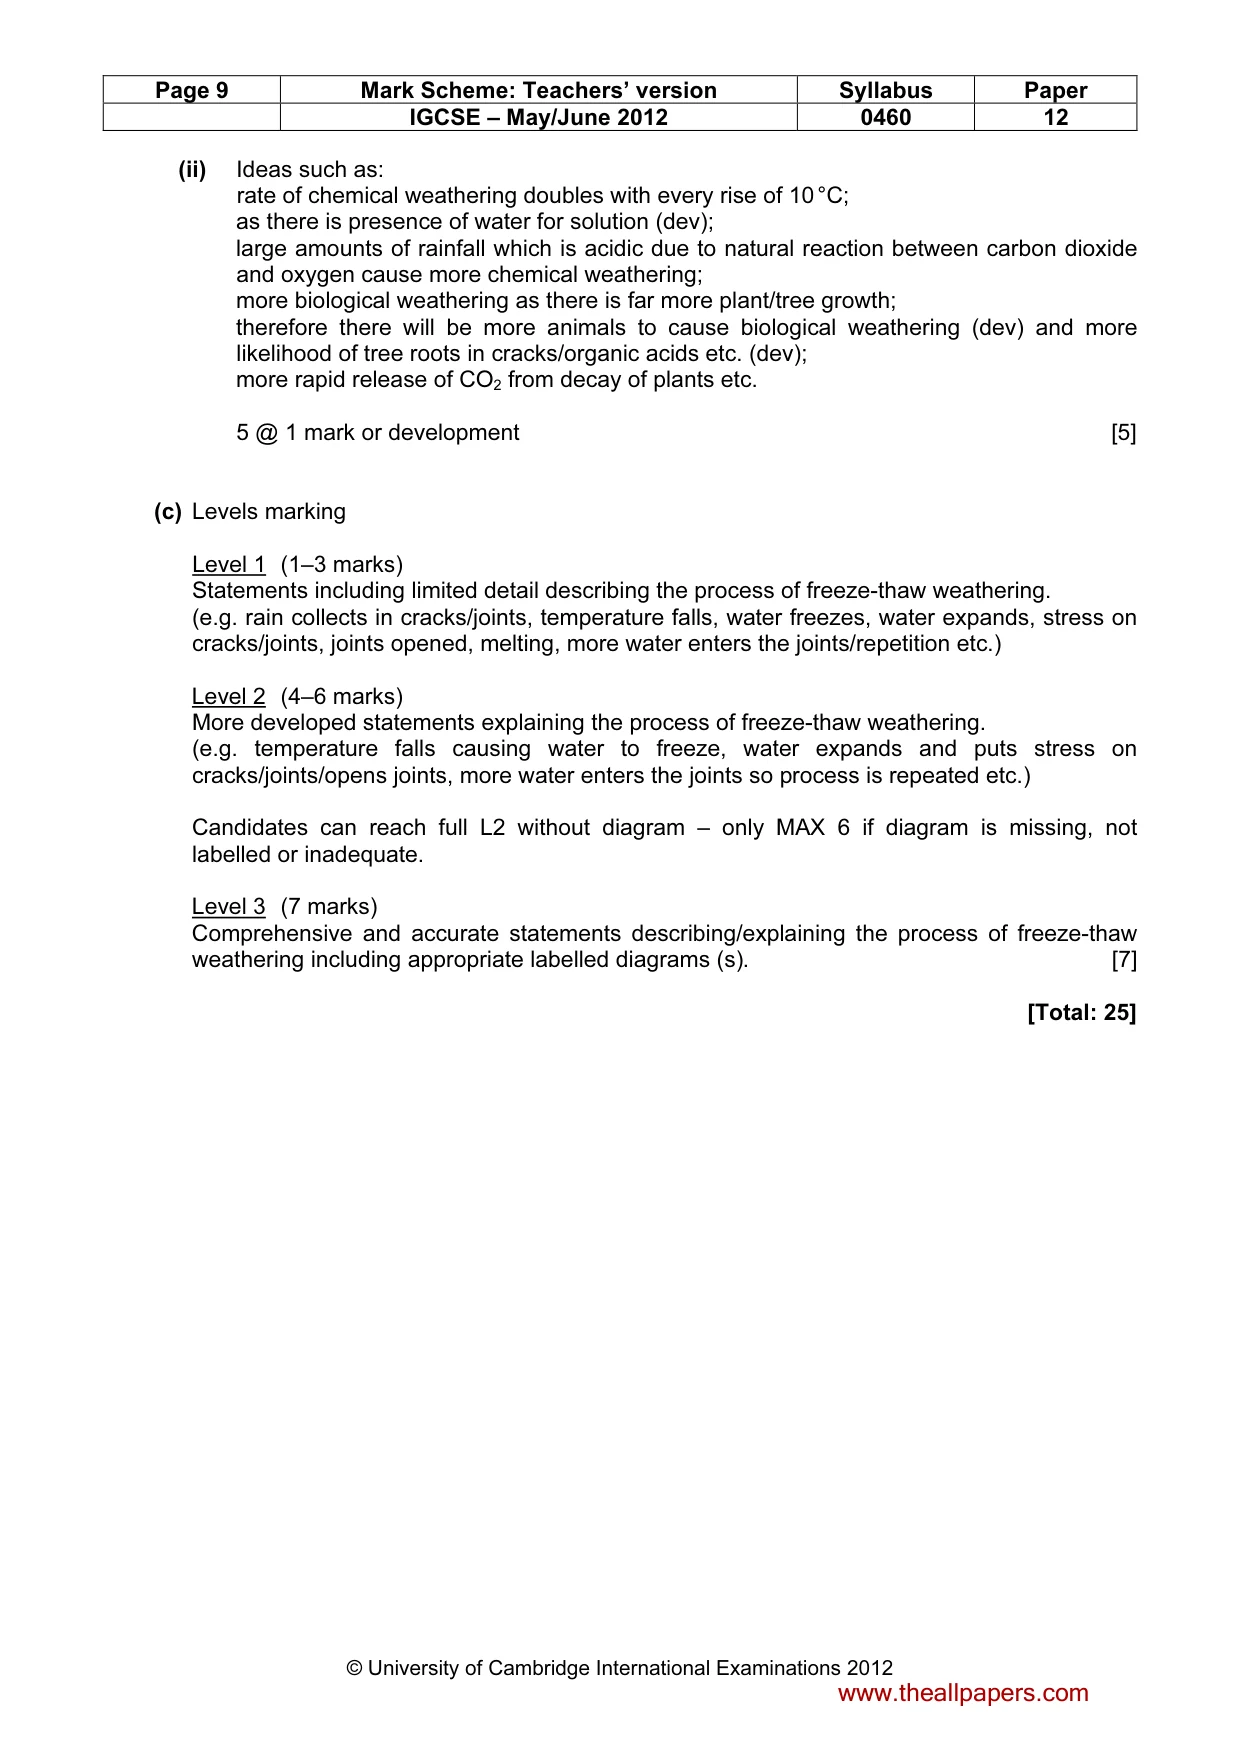
Page 9 Mark Scheme: Teachers’ version Syllabus Paper IGCSE – May/June 2012 0460 12 © University of Cambridge International Examinations 2012 (ii) Ideas such as: rate of chemical weathering doubles with every rise of 10 °C; as there is presence of water for solution (dev); large amounts of rainfall which is acidic due to natural reaction between carbon dioxide and oxygen cause more chemical weathering; more biological weathering as there is far more plant/tree growth; therefore there will be more animals to cause biological weathering (dev) and more likelihood of tree roots in cracks/organic acids etc. (dev); more rapid release of CO2 from decay of plants etc. 5 @ 1 mark or development [5] (c) Levels marking Level 1 (1–3 marks) Statements including limited detail describing the process of freeze-thaw weathering. (e.g. rain collects in cracks/joints, temperature falls, water freezes, water expands, stress on cracks/joints, joints opened, melting, more water enters the joints/repetition etc.) Level 2 (4–6 marks) More developed statements explaining the process of freeze-thaw weathering. (e.g. temperature falls causing water to freeze, water expands and puts stress on cracks/joints/opens joints, more water enters the joints so process is repeated etc.) Candidates can reach full L2 without diagram – only MAX 6 if diagram is missing, not labelled or inadequate. Level 3 (7 marks) Comprehensive and accurate statements describing/explaining the process of freeze-thaw weathering including appropriate labelled diagrams (s). [7] [Total: 25] www.theallpapers.com
Mark scheme, page 10
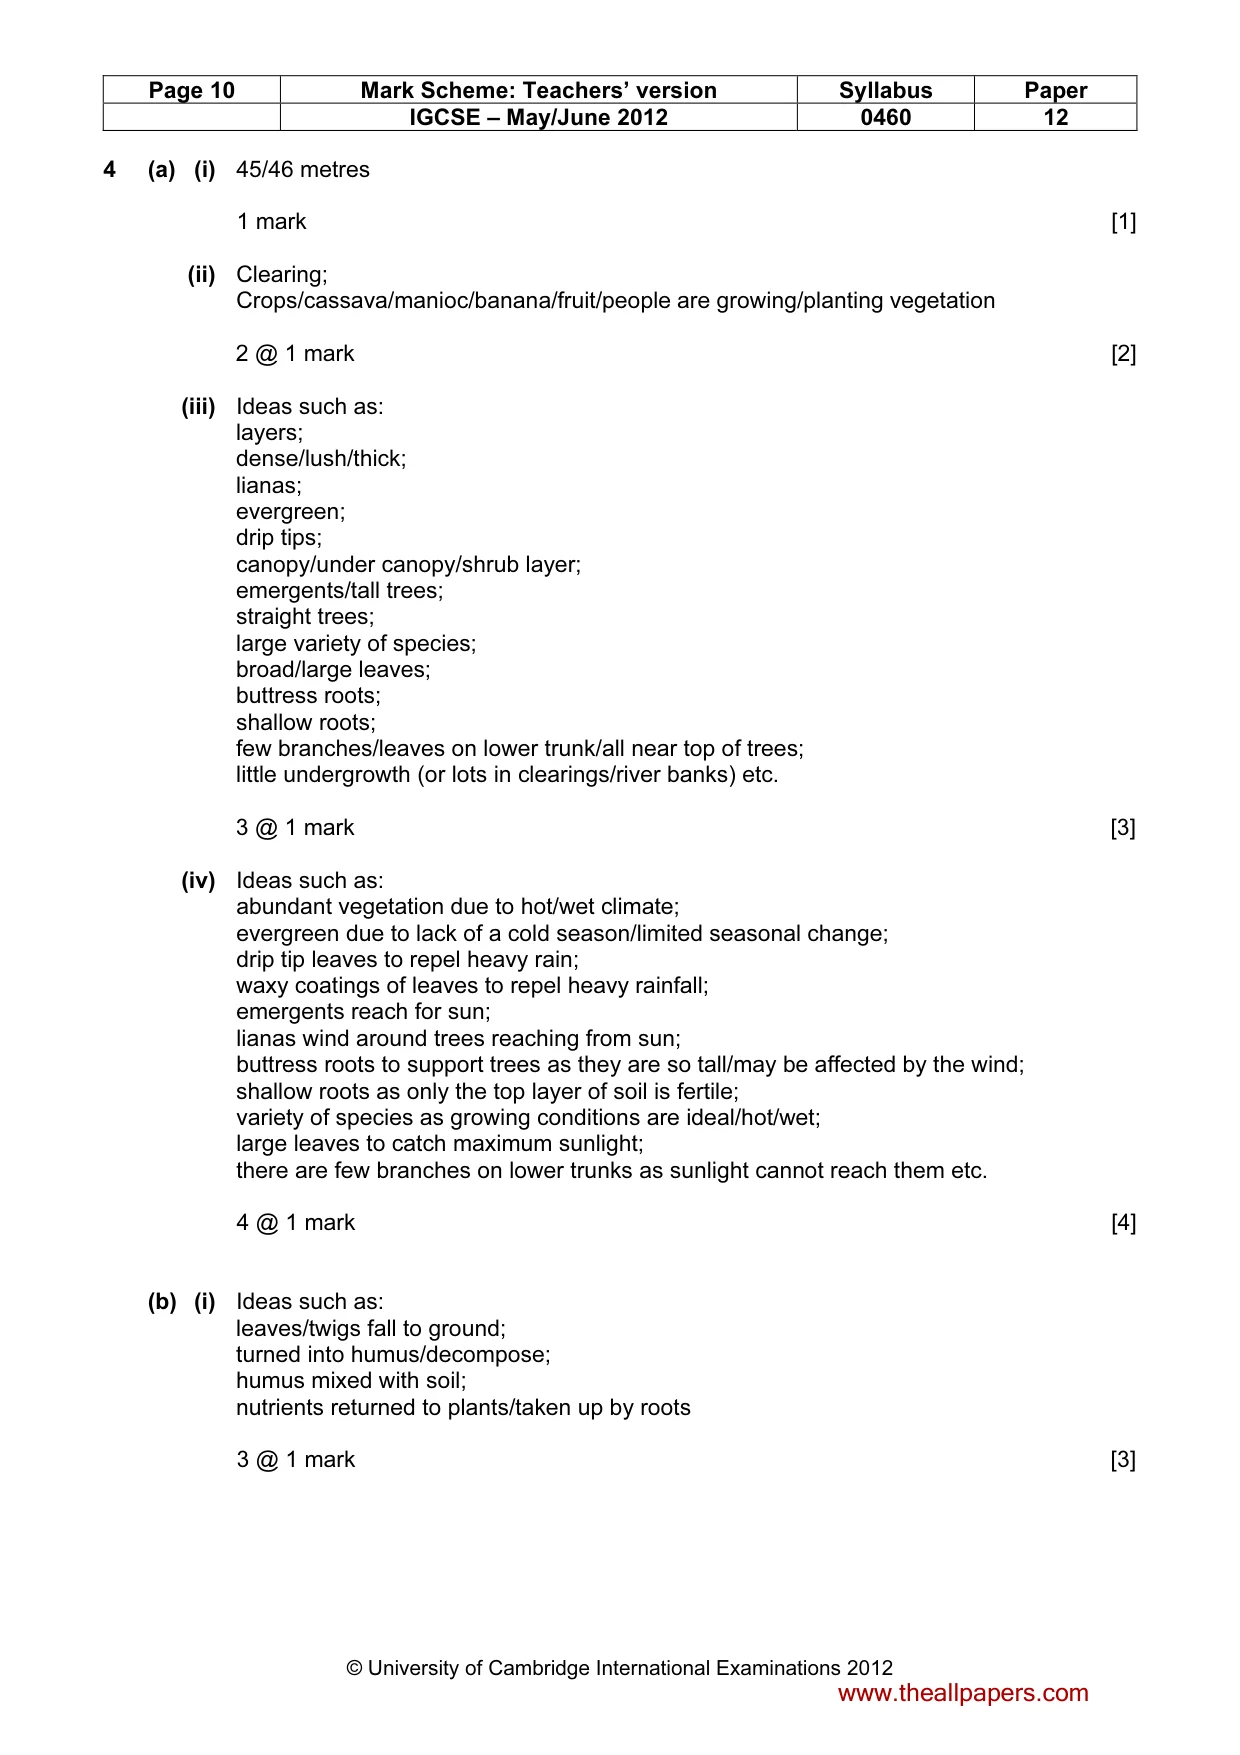
Page 10 Mark Scheme: Teachers’ version Syllabus Paper IGCSE – May/June 2012 0460 12 © University of Cambridge International Examinations 2012 4 (a) (i) 45/46 metres 1 mark [1] (ii) Clearing; Crops/cassava/manioc/banana/fruit/people are growing/planting vegetation 2 @ 1 mark [2] (iii) Ideas such as: layers; dense/lush/thick; lianas; evergreen; drip tips; canopy/under canopy/shrub layer; emergents/tall trees; straight trees; large variety of species; broad/large leaves; buttress roots; shallow roots; few branches/leaves on lower trunk/all near top of trees; little undergrowth (or lots in clearings/river banks) etc. 3 @ 1 mark [3] (iv) Ideas such as: abundant vegetation due to hot/wet climate; evergreen due to lack of a cold season/limited seasonal change; drip tip leaves to repel heavy rain; waxy coatings of leaves to repel heavy rainfall; emergents reach for sun; lianas wind around trees reaching from sun; buttress roots to support trees as they are so tall/may be affected by the wind; shallow roots as only the top layer of soil is fertile; variety of species as growing conditions are ideal/hot/wet; large leaves to catch maximum sunlight; there are few branches on lower trunks as sunlight cannot reach them etc. 4 @ 1 mark [4] (b) (i) Ideas such as: leaves/twigs fall to ground; turned into humus/decompose; humus mixed with soil; nutrients returned to plants/taken up by roots 3 @ 1 mark [3] www.theallpapers.com
Mark scheme, page 11
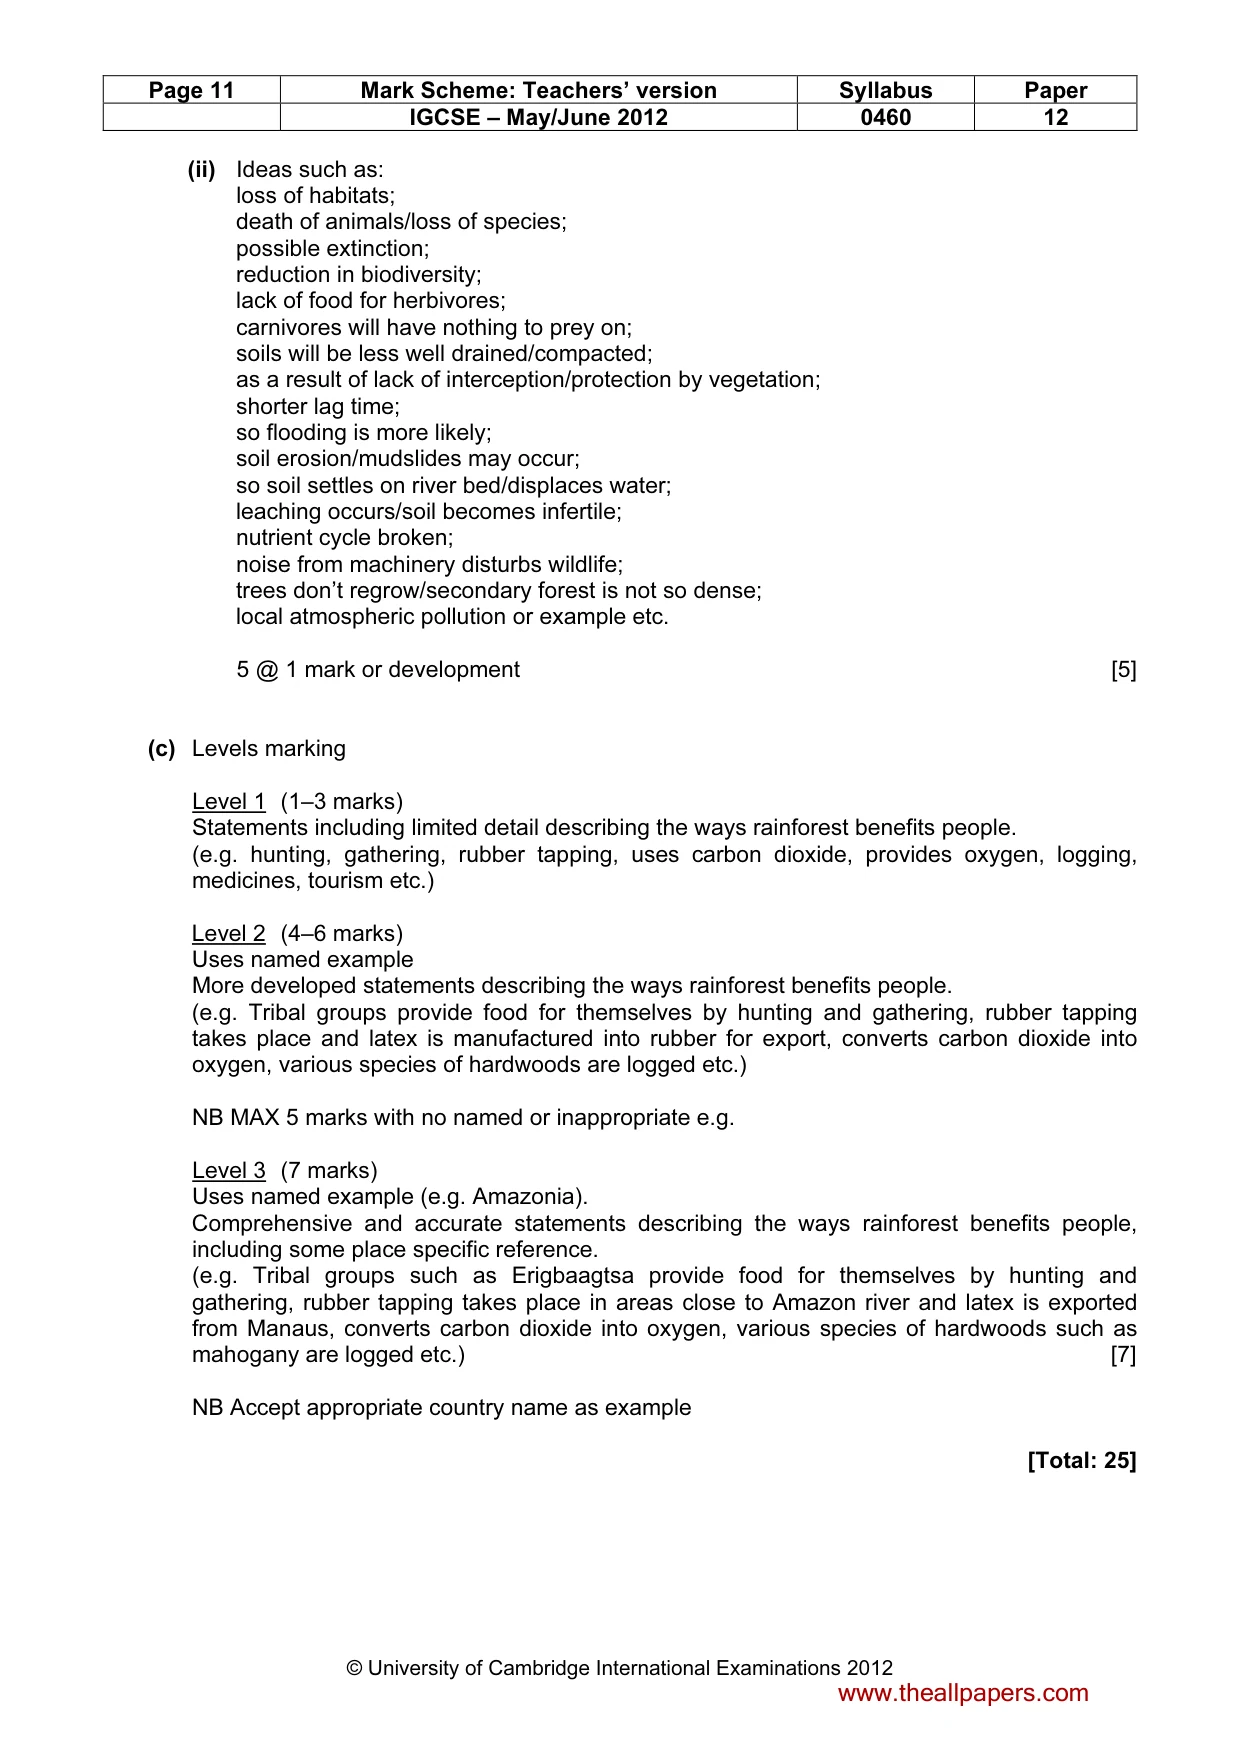
Page 11 Mark Scheme: Teachers’ version Syllabus Paper IGCSE – May/June 2012 0460 12 © University of Cambridge International Examinations 2012 (ii) Ideas such as: loss of habitats; death of animals/loss of species; possible extinction; reduction in biodiversity; lack of food for herbivores; carnivores will have nothing to prey on; soils will be less well drained/compacted; as a result of lack of interception/protection by vegetation; shorter lag time; so flooding is more likely; soil erosion/mudslides may occur; so soil settles on river bed/displaces water; leaching occurs/soil becomes infertile; nutrient cycle broken; noise from machinery disturbs wildlife; trees don’t regrow/secondary forest is not so dense; local atmospheric pollution or example etc. 5 @ 1 mark or development [5] (c) Levels marking Level 1 (1–3 marks) Statements including limited detail describing the ways rainforest benefits people. (e.g. hunting, gathering, rubber tapping, uses carbon dioxide, provides oxygen, logging, medicines, tourism etc.) Level 2 (4–6 marks) Uses named example More developed statements describing the ways rainforest benefits people. (e.g. Tribal groups provide food for themselves by hunting and gathering, rubber tapping takes place and latex is manufactured into rubber for export, converts carbon dioxide into oxygen, various species of hardwoods are logged etc.) NB MAX 5 marks with no named or inappropriate e.g. Level 3 (7 marks) Uses named example (e.g. Amazonia). Comprehensive and accurate statements describing the ways rainforest benefits people, including some place specific reference. (e.g. Tribal groups such as Erigbaagtsa provide food for themselves by hunting and gathering, rubber tapping takes place in areas close to Amazon river and latex is exported from Manaus, converts carbon dioxide into oxygen, various species of hardwoods such as mahogany are logged etc.) [7] NB Accept appropriate country name as example [Total: 25] www.theallpapers.com
Mark scheme, page 12
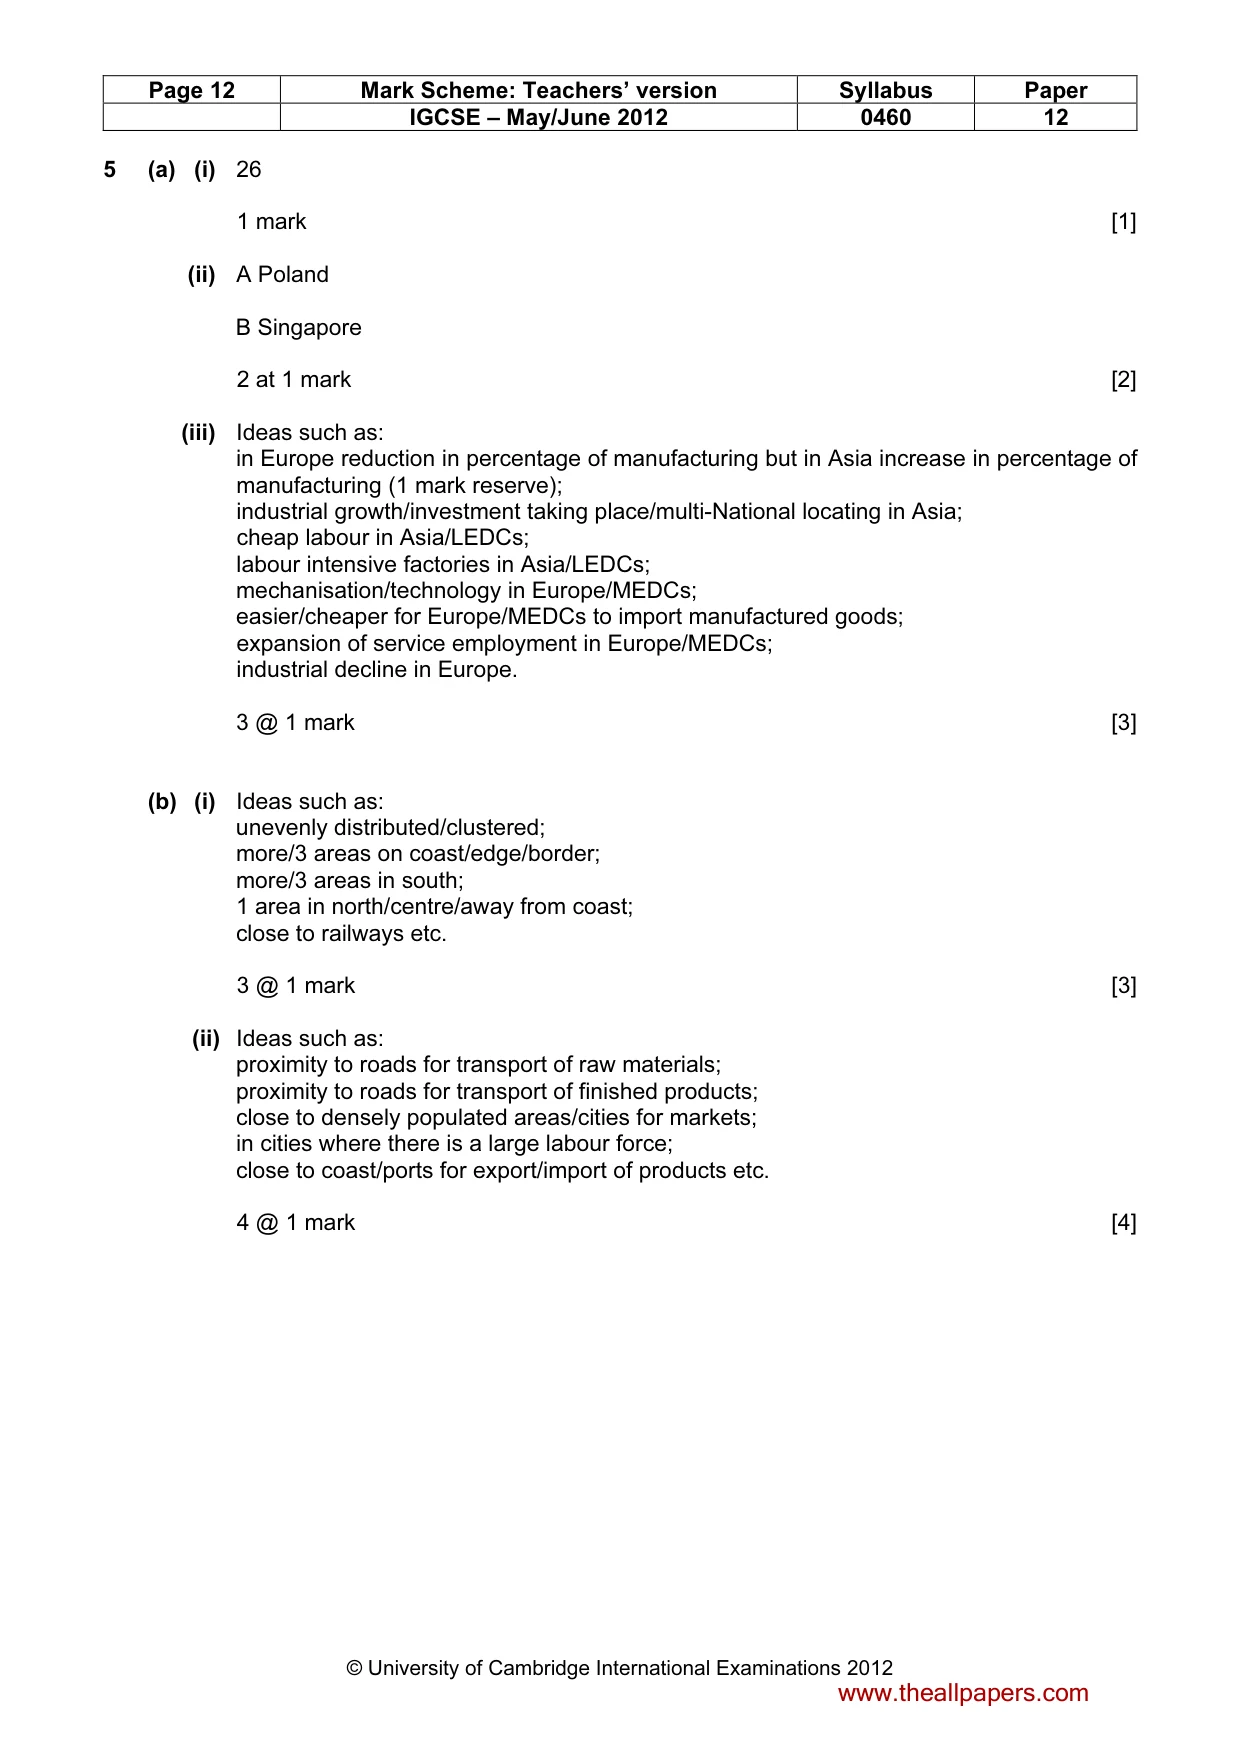
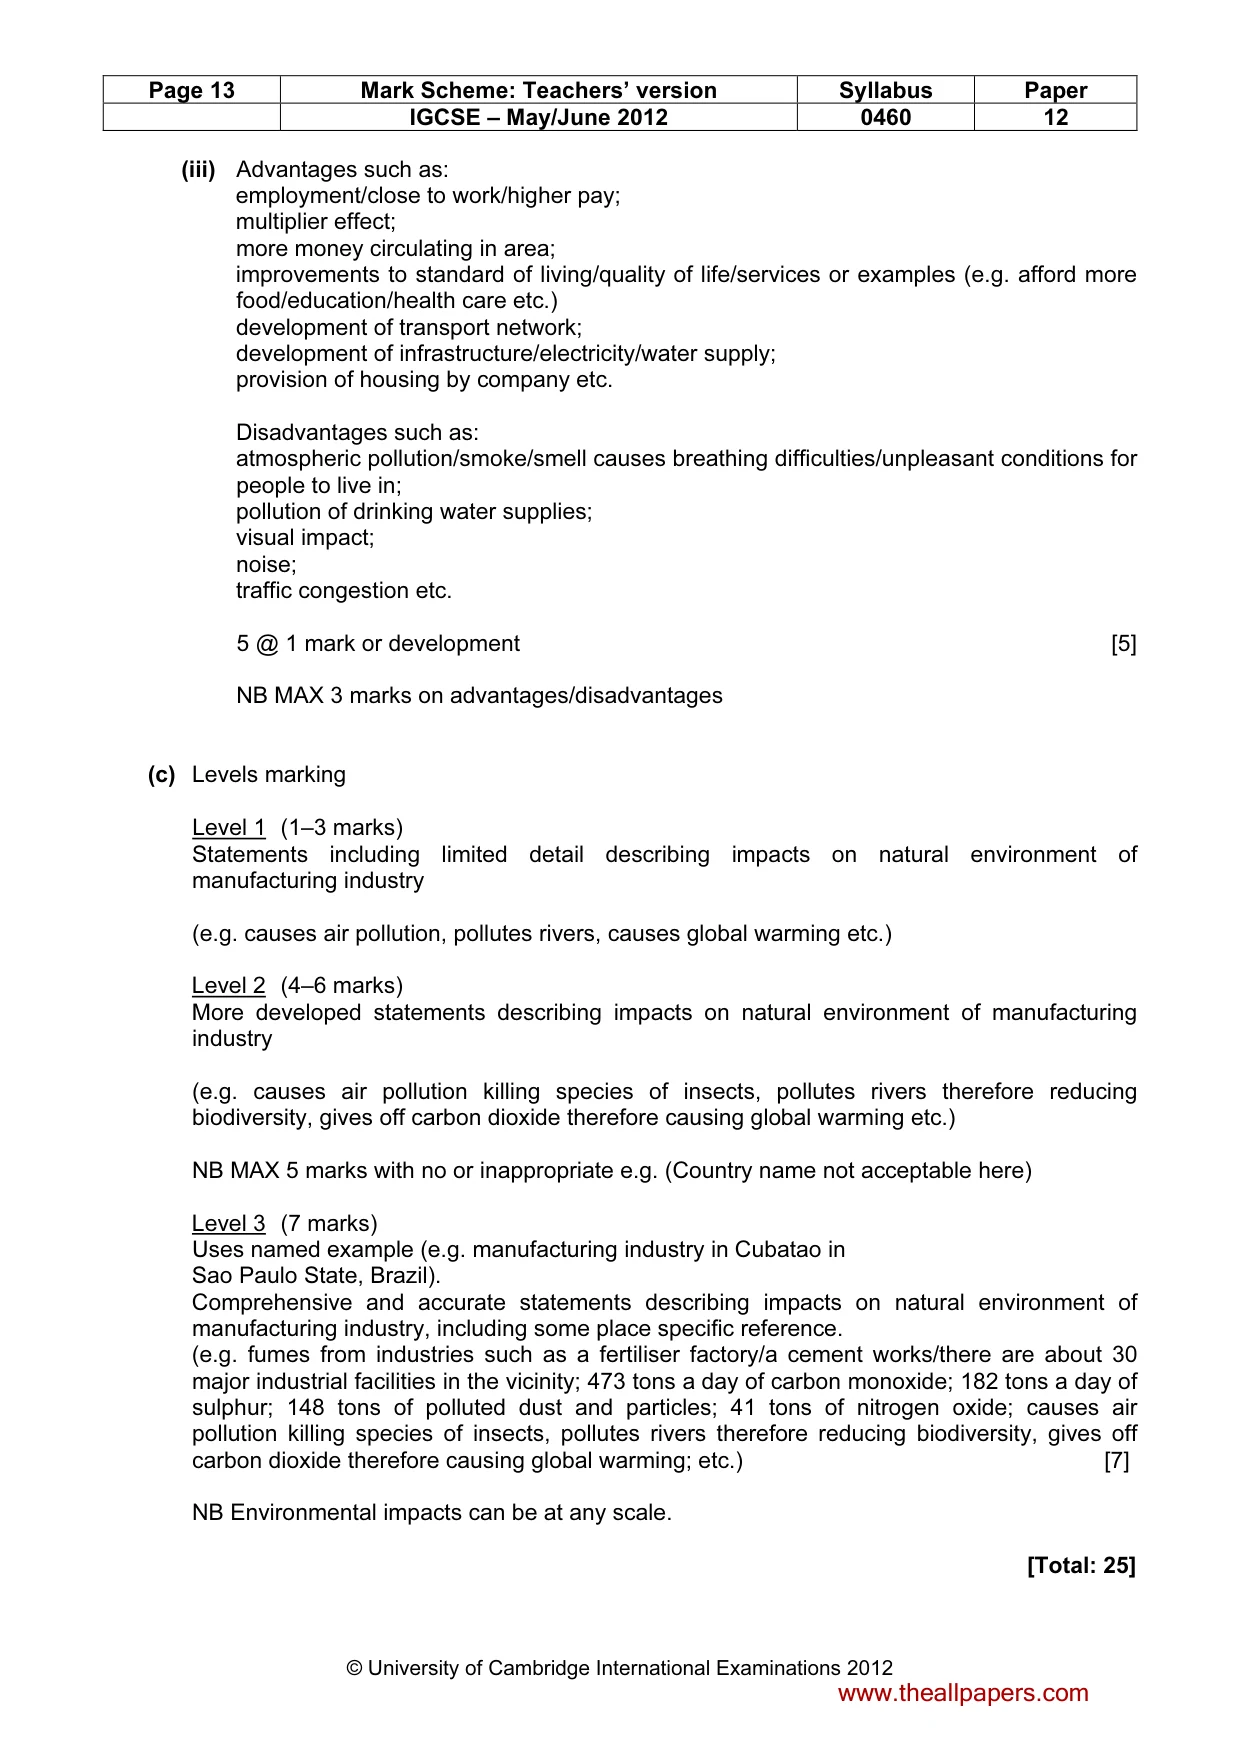
Page 12 Mark Scheme: Teachers’ version Syllabus Paper IGCSE – May/June 2012 0460 12 © University of Cambridge International Examinations 2012 5 (a) (i) 26 1 mark [1] (ii) A Poland B Singapore 2 at 1 mark [2] (iii) Ideas such as: in Europe reduction in percentage of manufacturing but in Asia increase in percentage of manufacturing (1 mark reserve); industrial growth/investment taking place/multi-National locating in Asia; cheap labour in Asia/LEDCs; labour intensive factories in Asia/LEDCs; mechanisation/technology in Europe/MEDCs; easier/cheaper for Europe/MEDCs to import manufactured goods; expansion of service employment in Europe/MEDCs; industrial decline in Europe. 3 @ 1 mark [3] (b) (i) Ideas such as: unevenly distributed/clustered; more/3 areas on coast/edge/border; more/3 areas in south; 1 area in north/centre/away from coast; close to railways etc. 3 @ 1 mark [3] (ii) Ideas such as: proximity to roads for transport of raw materials; proximity to roads for transport of finished products; close to densely populated areas/cities for markets; in cities where there is a large labour force; close to coast/ports for export/import of products etc. 4 @ 1 mark [4] www.theallpapers.com
Mark scheme, page 13
Page 13 Mark Scheme: Teachers’ version Syllabus Paper IGCSE – May/June 2012 0460 12 © University of Cambridge International Examinations 2012 (iii) Advantages such as: employment/close to work/higher pay; multiplier effect; more money circulating in area; improvements to standard of living/quality of life/services or examples (e.g. afford more food/education/health care etc.) development of transport network; development of infrastructure/electricity/water supply; provision of housing by company etc. Disadvantages such as: atmospheric pollution/smoke/smell causes breathing difficulties/unpleasant conditions for people to live in; pollution of drinking water supplies; visual impact; noise; traffic congestion etc. 5 @ 1 mark or development [5] NB MAX 3 marks on advantages/disadvantages (c) Levels marking Level 1 (1–3 marks) Statements including limited detail describing impacts on natural environment of manufacturing industry (e.g. causes air pollution, pollutes rivers, causes global warming etc.) Level 2 (4–6 marks) More developed statements describing impacts on natural environment of manufacturing industry (e.g. causes air pollution killing species of insects, pollutes rivers therefore reducing biodiversity, gives off carbon dioxide therefore causing global warming etc.) NB MAX 5 marks with no or inappropriate e.g. (Country name not acceptable here) Level 3 (7 marks) Uses named example (e.g. manufacturing industry in Cubatao in Sao Paulo State, Brazil). Comprehensive and accurate statements describing impacts on natural environment of manufacturing industry, including some place specific reference. (e.g. fumes from industries such as a fertiliser factory/a cement works/there are about 30 major industrial facilities in the vicinity; 473 tons a day of carbon monoxide; 182 tons a day of sulphur; 148 tons of polluted dust and particles; 41 tons of nitrogen oxide; causes air pollution killing species of insects, pollutes rivers therefore reducing biodiversity, gives off carbon dioxide therefore causing global warming; etc.) [7] NB Environmental impacts can be at any scale. [Total: 25] www.theallpapers.com
Mark scheme, page 14
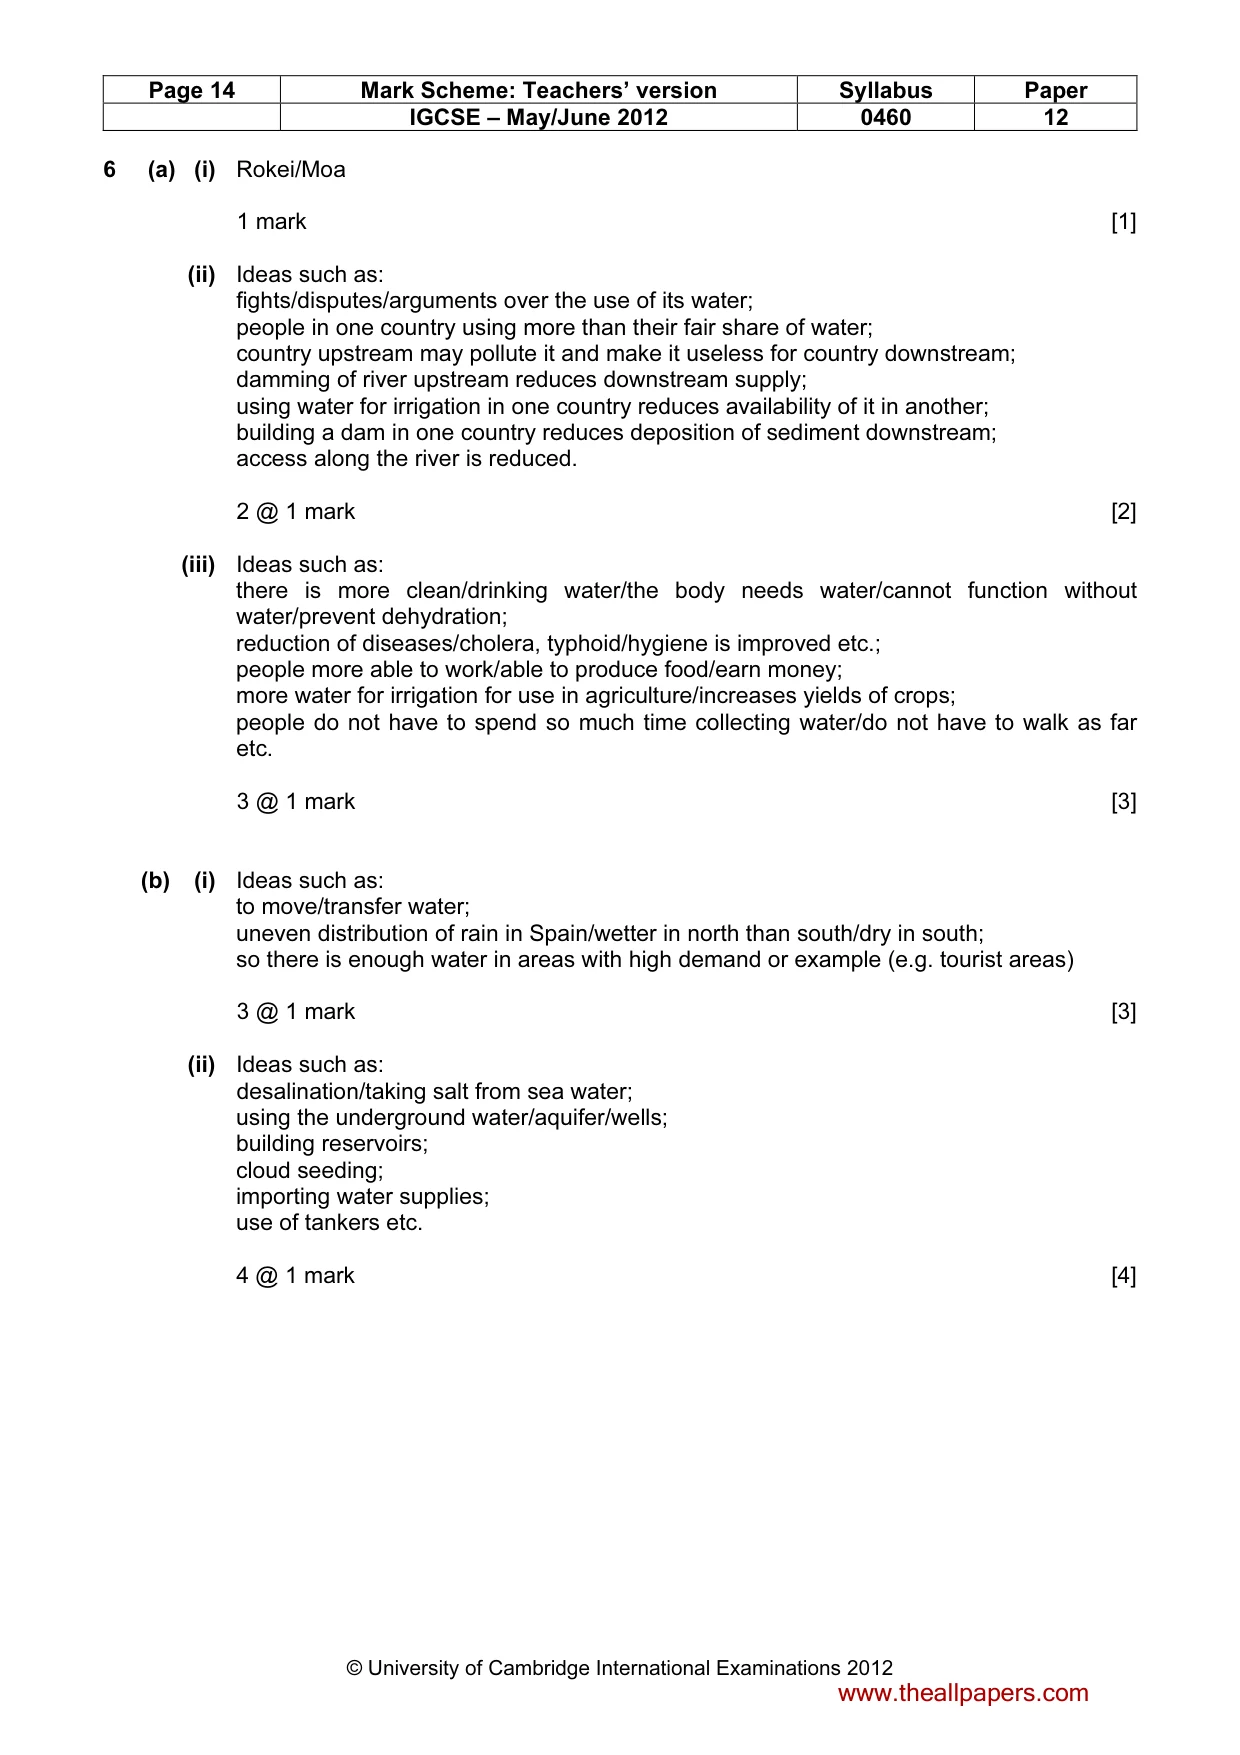
Page 14 Mark Scheme: Teachers’ version Syllabus Paper IGCSE – May/June 2012 0460 12 © University of Cambridge International Examinations 2012 6 (a) (i) Rokei/Moa 1 mark [1] (ii) Ideas such as: fights/disputes/arguments over the use of its water; people in one country using more than their fair share of water; country upstream may pollute it and make it useless for country downstream; damming of river upstream reduces downstream supply; using water for irrigation in one country reduces availability of it in another; building a dam in one country reduces deposition of sediment downstream; access along the river is reduced. 2 @ 1 mark [2] (iii) Ideas such as: there is more clean/drinking water/the body needs water/cannot function without water/prevent dehydration; reduction of diseases/cholera, typhoid/hygiene is improved etc.; people more able to work/able to produce food/earn money; more water for irrigation for use in agriculture/increases yields of crops; people do not have to spend so much time collecting water/do not have to walk as far etc. 3 @ 1 mark [3] (b) (i) Ideas such as: to move/transfer water; uneven distribution of rain in Spain/wetter in north than south/dry in south; so there is enough water in areas with high demand or example (e.g. tourist areas) 3 @ 1 mark [3] (ii) Ideas such as: desalination/taking salt from sea water; using the underground water/aquifer/wells; building reservoirs; cloud seeding; importing water supplies; use of tankers etc. 4 @ 1 mark [4] www.theallpapers.com
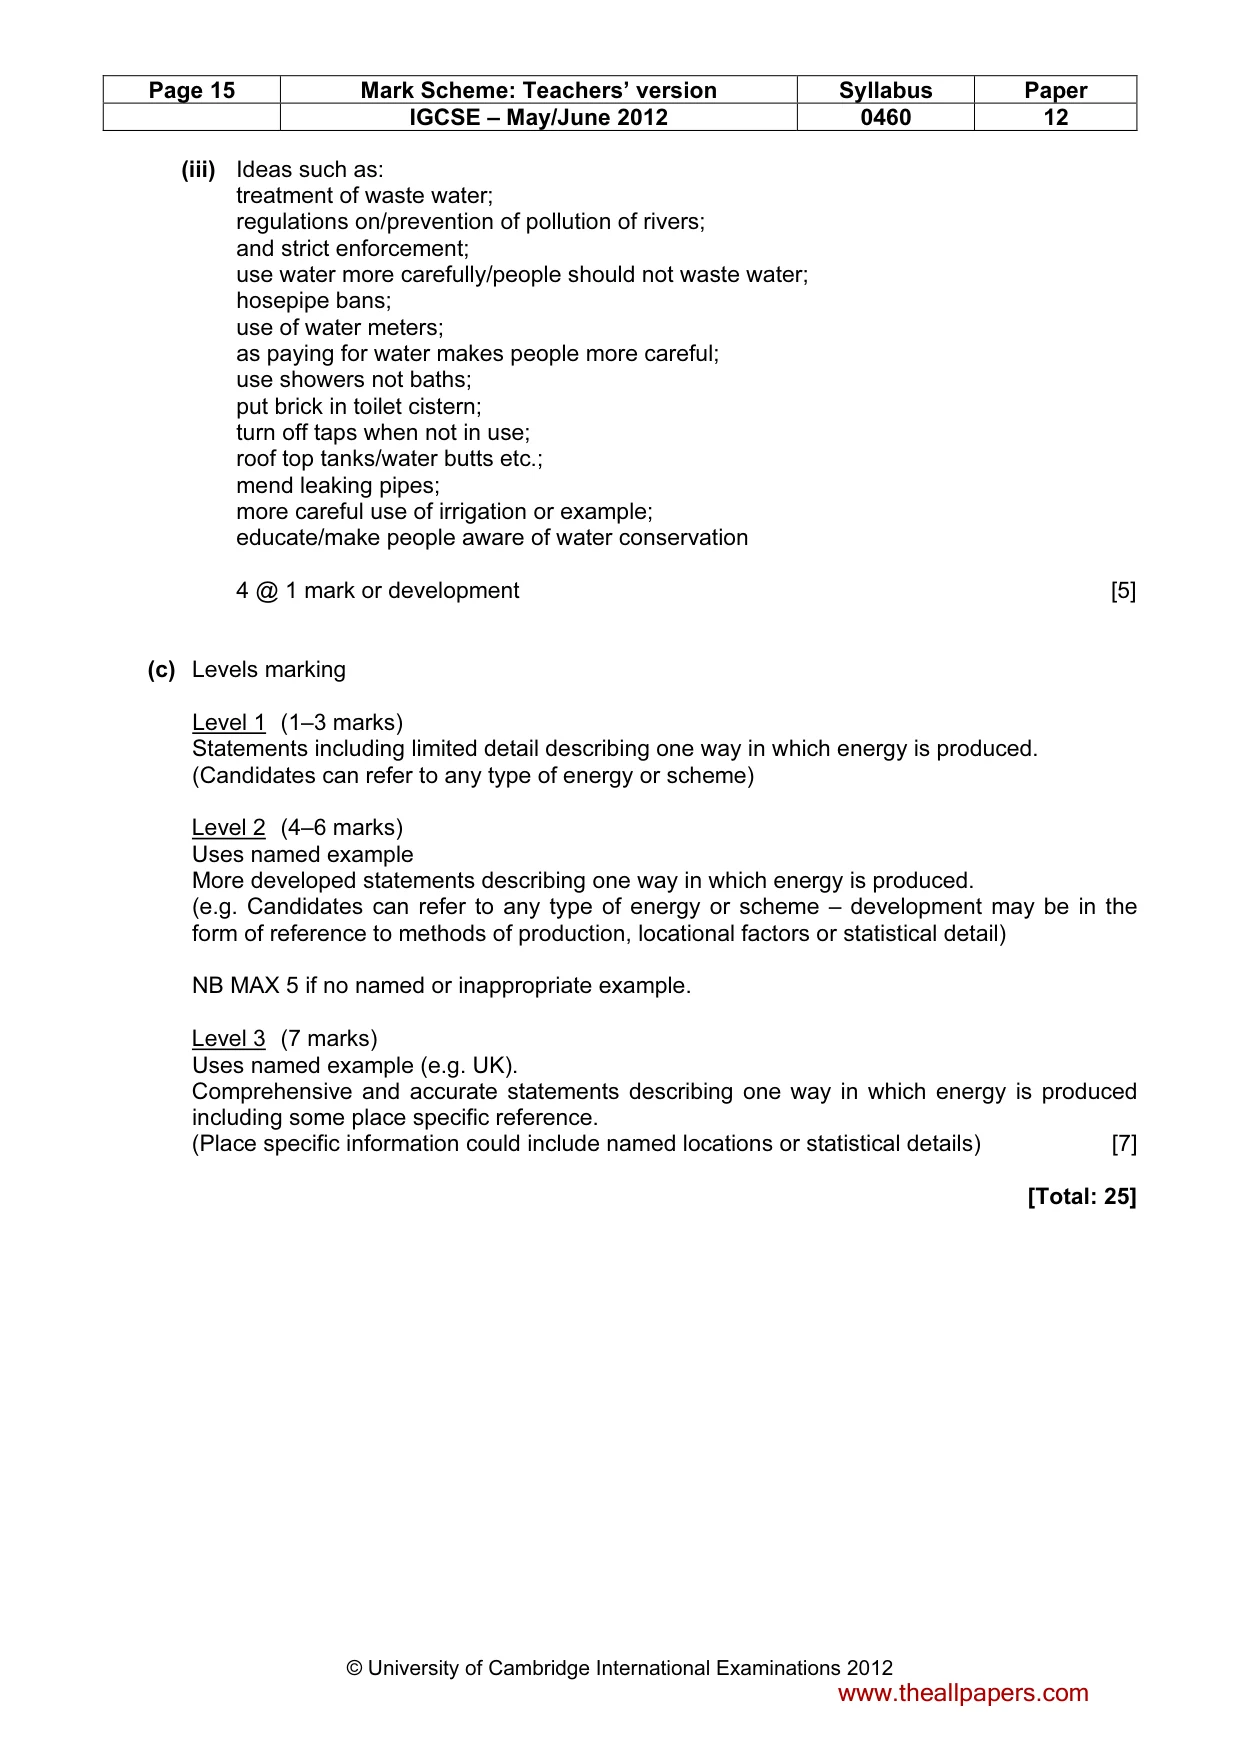
Mark scheme, page 15
Page 15 Mark Scheme: Teachers’ version Syllabus Paper IGCSE – May/June 2012 0460 12 © University of Cambridge International Examinations 2012 (iii) Ideas such as: treatment of waste water; regulations on/prevention of pollution of rivers; and strict enforcement; use water more carefully/people should not waste water; hosepipe bans; use of water meters; as paying for water makes people more careful; use showers not baths; put brick in toilet cistern; turn off taps when not in use; roof top tanks/water butts etc.; mend leaking pipes; more careful use of irrigation or example; educate/make people aware of water conservation 4 @ 1 mark or development [5] (c) Levels marking Level 1 (1–3 marks) Statements including limited detail describing one way in which energy is produced. (Candidates can refer to any type of energy or scheme) Level 2 (4–6 marks) Uses named example More developed statements describing one way in which energy is produced. (e.g. Candidates can refer to any type of energy or scheme – development may be in the form of reference to methods of production, locational factors or statistical detail) NB MAX 5 if no named or inappropriate example. Level 3 (7 marks) Uses named example (e.g. UK). Comprehensive and accurate statements describing one way in which energy is produced including some place specific reference. (Place specific information could include named locations or statistical details) [7] [Total: 25] www.theallpapers.com
What you needed in this session
Cambridge’s own grade thresholds for 2012 May/June, Paper 1 · Variant 2. A higher threshold means an easier paper — the bar moves with how the cohort did.