Cambridge IGCSE Environmental Management 0680 — 2015 Feb/March Paper 1 · Variant 2
0680/12/F/M/15 · 60 marks · ≈68 min
The question paper and its mark scheme, free to read here and free to download. This is Cambridge’s own paper, exactly as it was sat.
Question paper16 pages

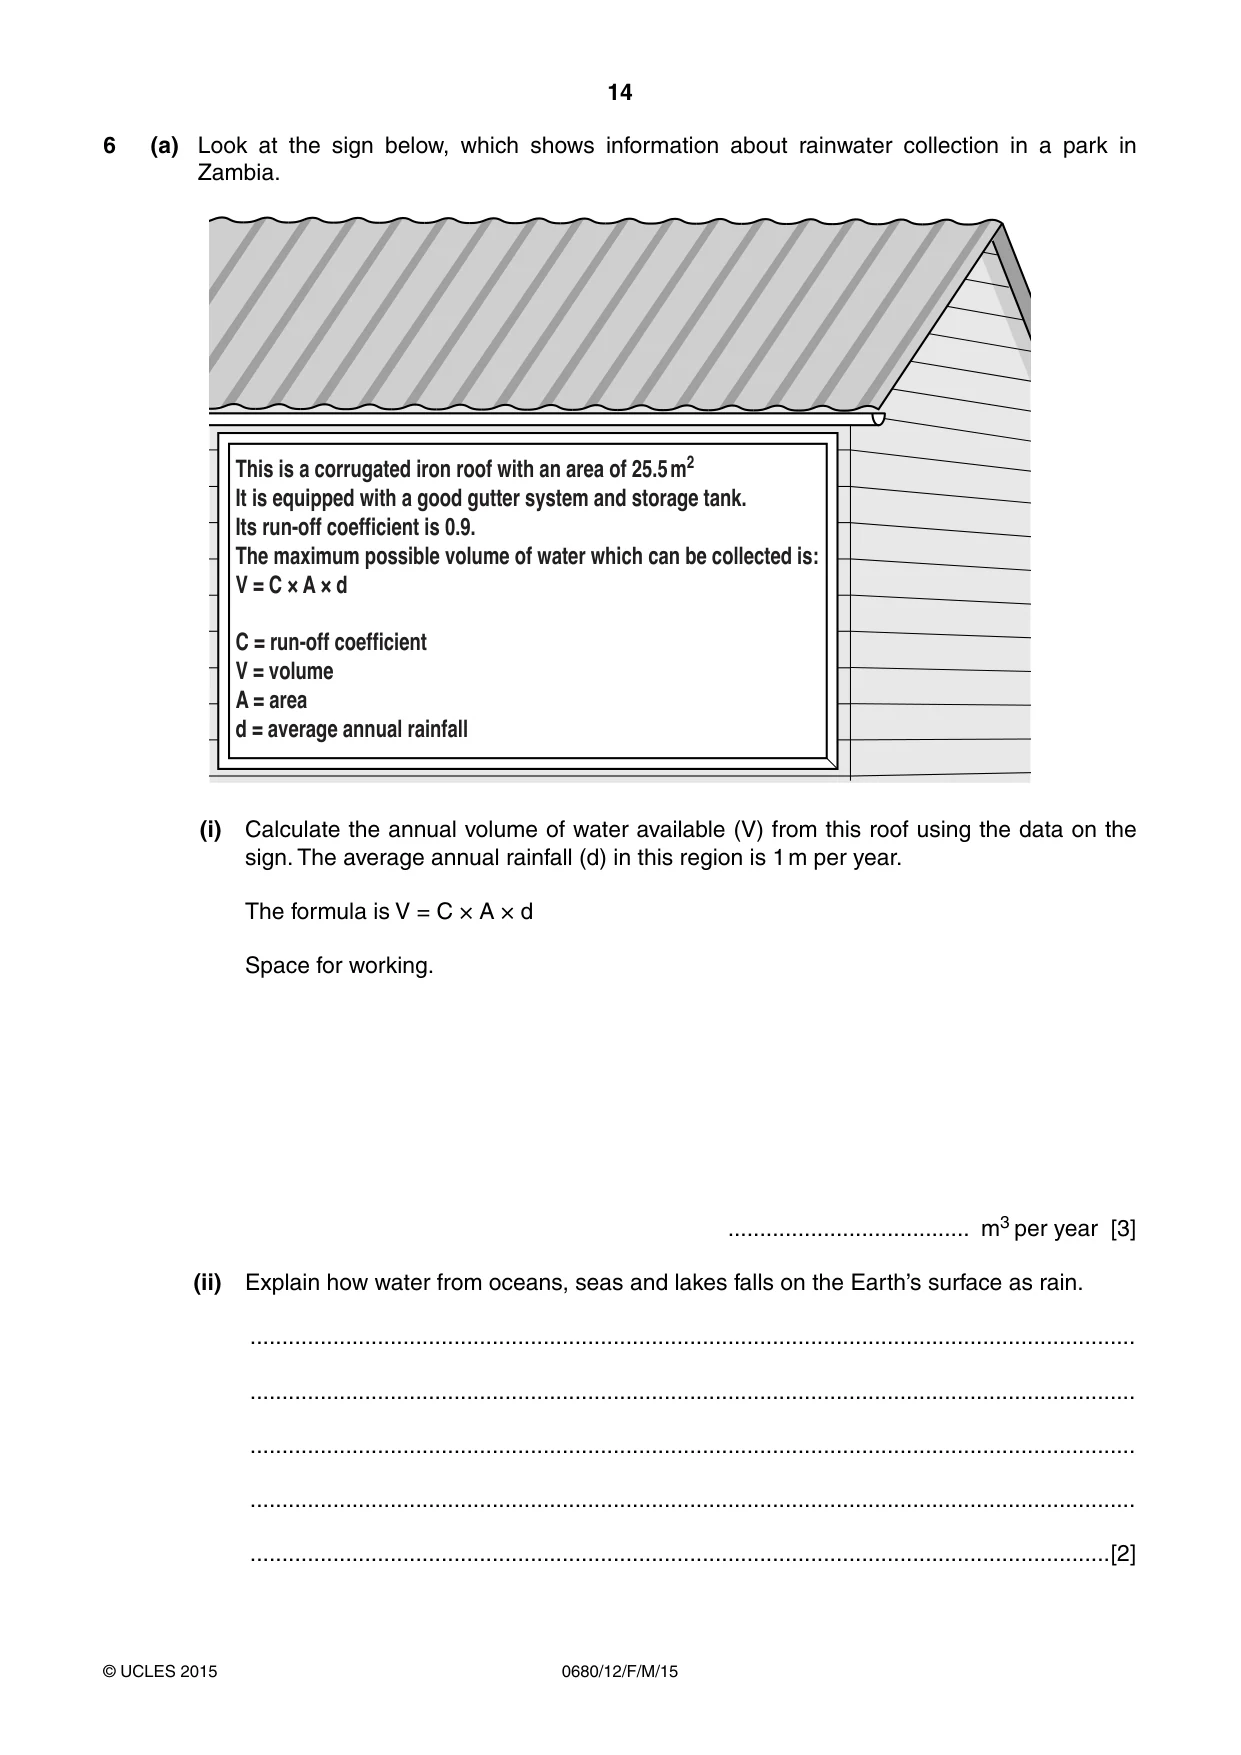
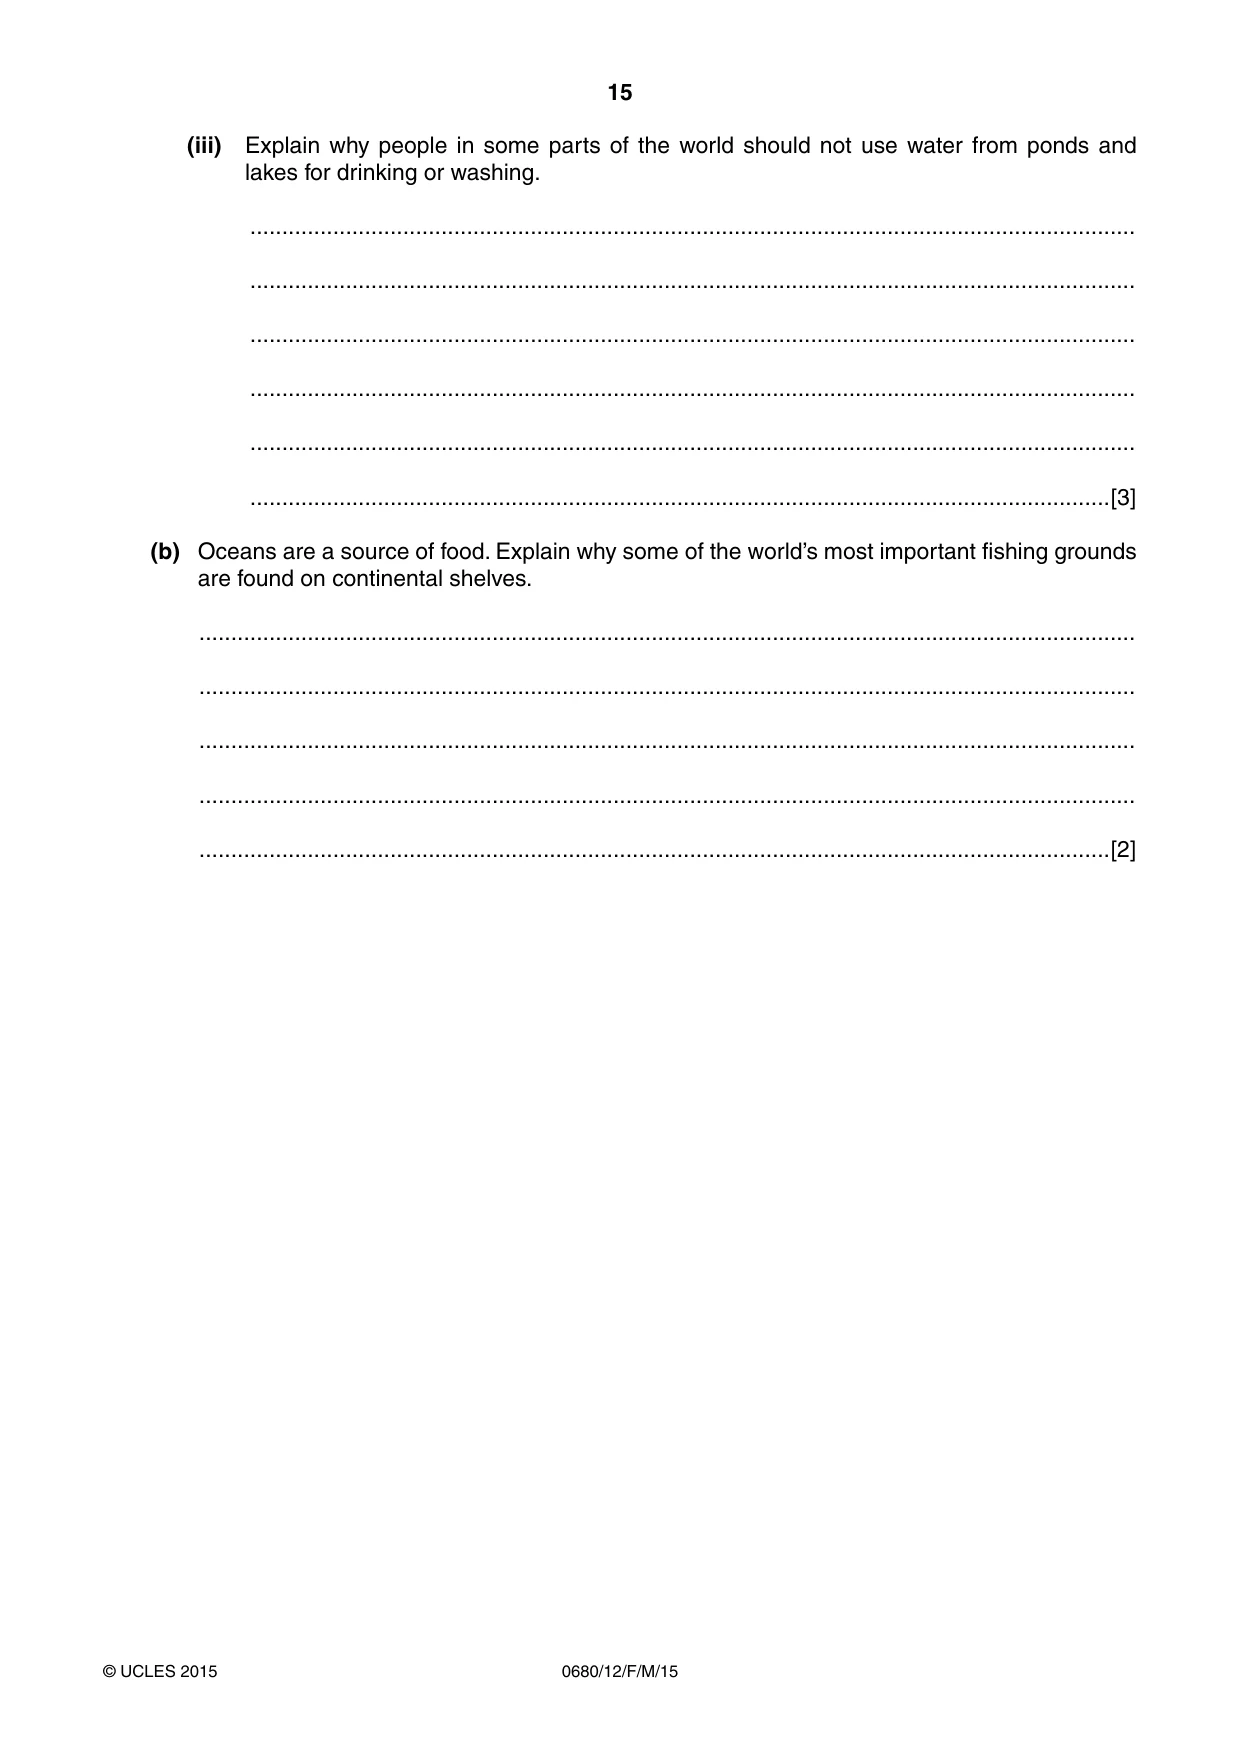
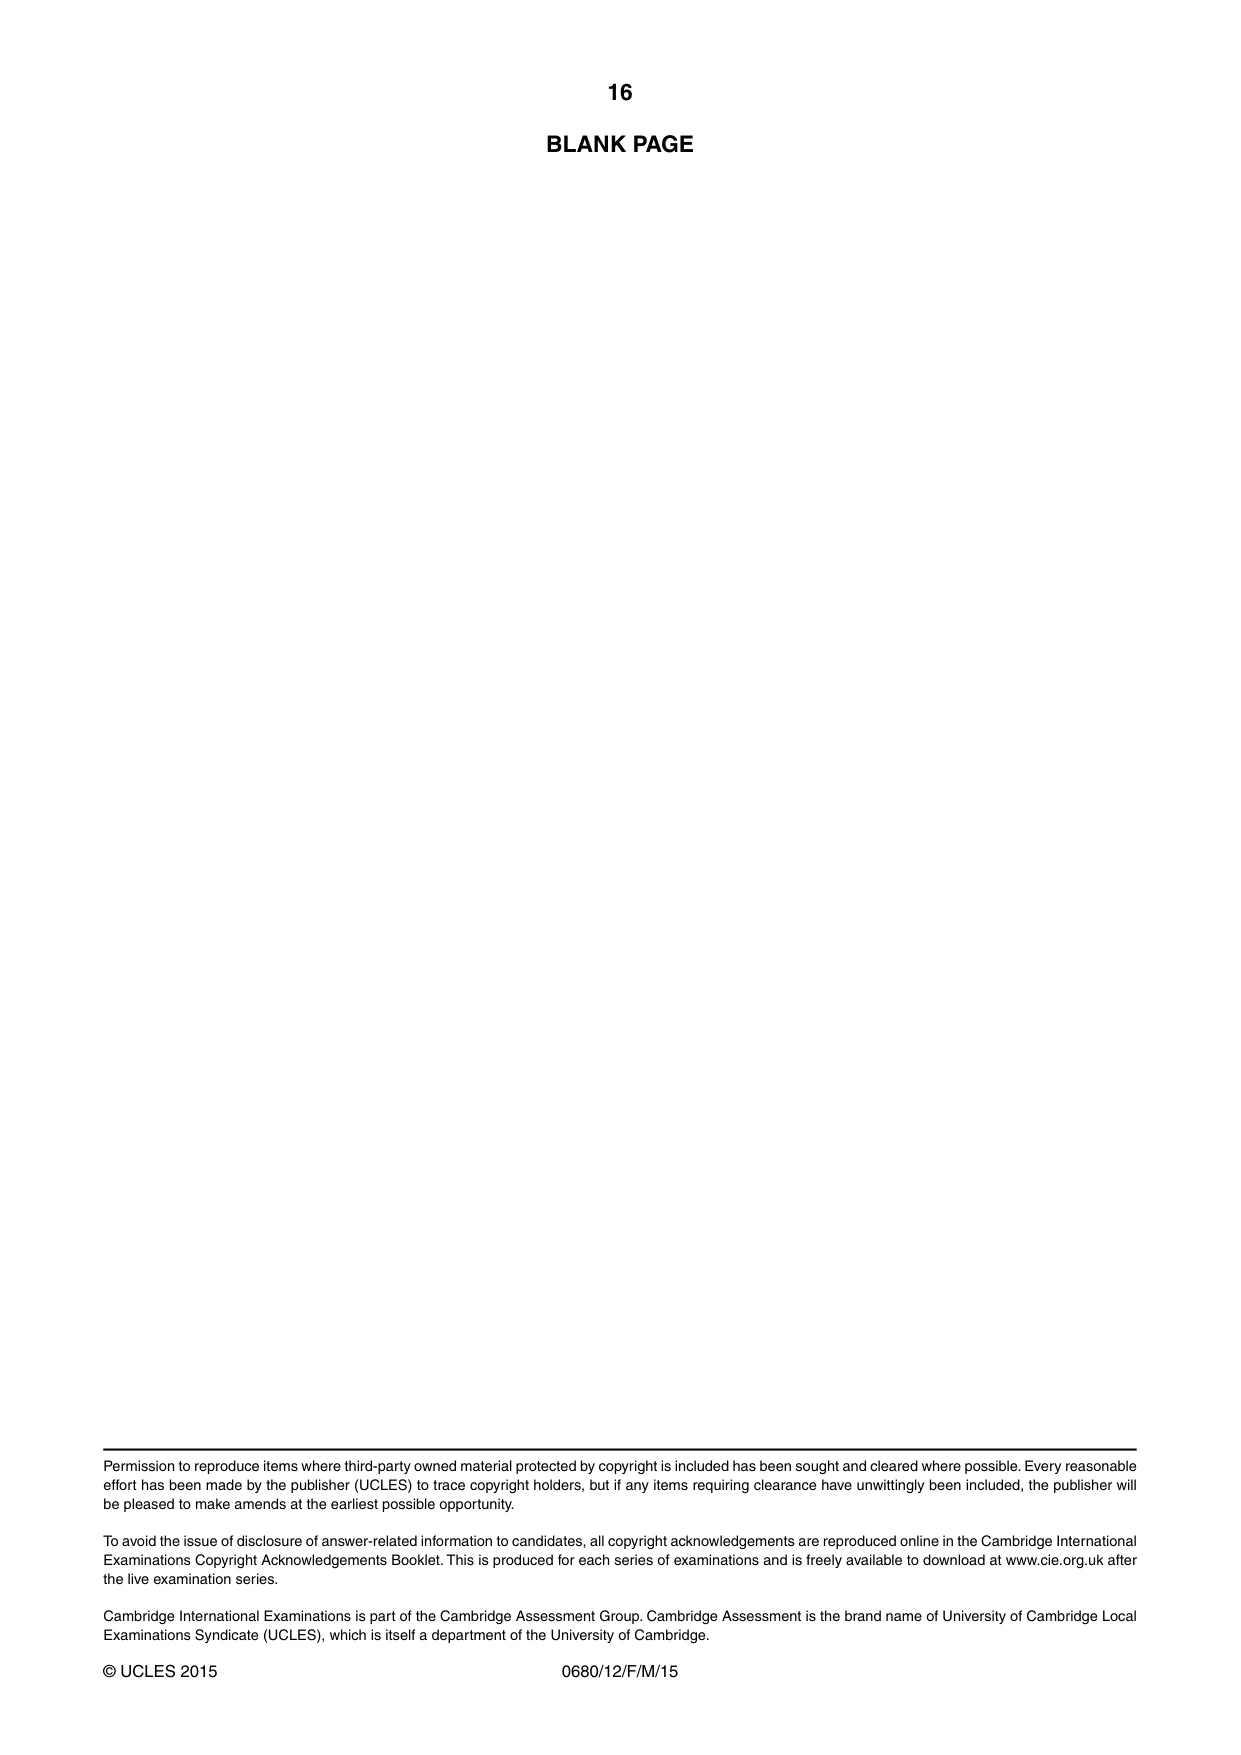
Mark scheme4 pages
Answers below. Sit the paper first if you are practising.
Paper as text
Question paper, page 1
This document consists of 14 printed pages and 2 blank pages. DC (LEG/SW) 107151/4 R © UCLES 2015 [Turn over Cambridge International Examinations Cambridge International General Certificate of Secondary Education * 4 3 9 0 9 2 9 0 8 7 * ENVIRONMENTAL MANAGEMENT 0680/12 Paper 1 February/March 2015 1 hour 30 minutes Candidates answer on the Question Paper. No Additional Materials are required. READ THESE INSTRUCTIONS FIRST Write your Centre number, candidate number and name on all the work you hand in. Write in dark blue or black pen. You may use an HB pencil for any diagrams or graphs. Do not use staples, paper clips, glue or correction fluid. DO NOT WRITE IN ANY BARCODES. Answer all questions. Electronic calculators may be used. You may lose marks if you do not show your working or if you do not use appropriate units. At the end of the examination, fasten all your work securely together. The number of marks is given in brackets [ ] at the end of each question or part question.
Question paper, page 2
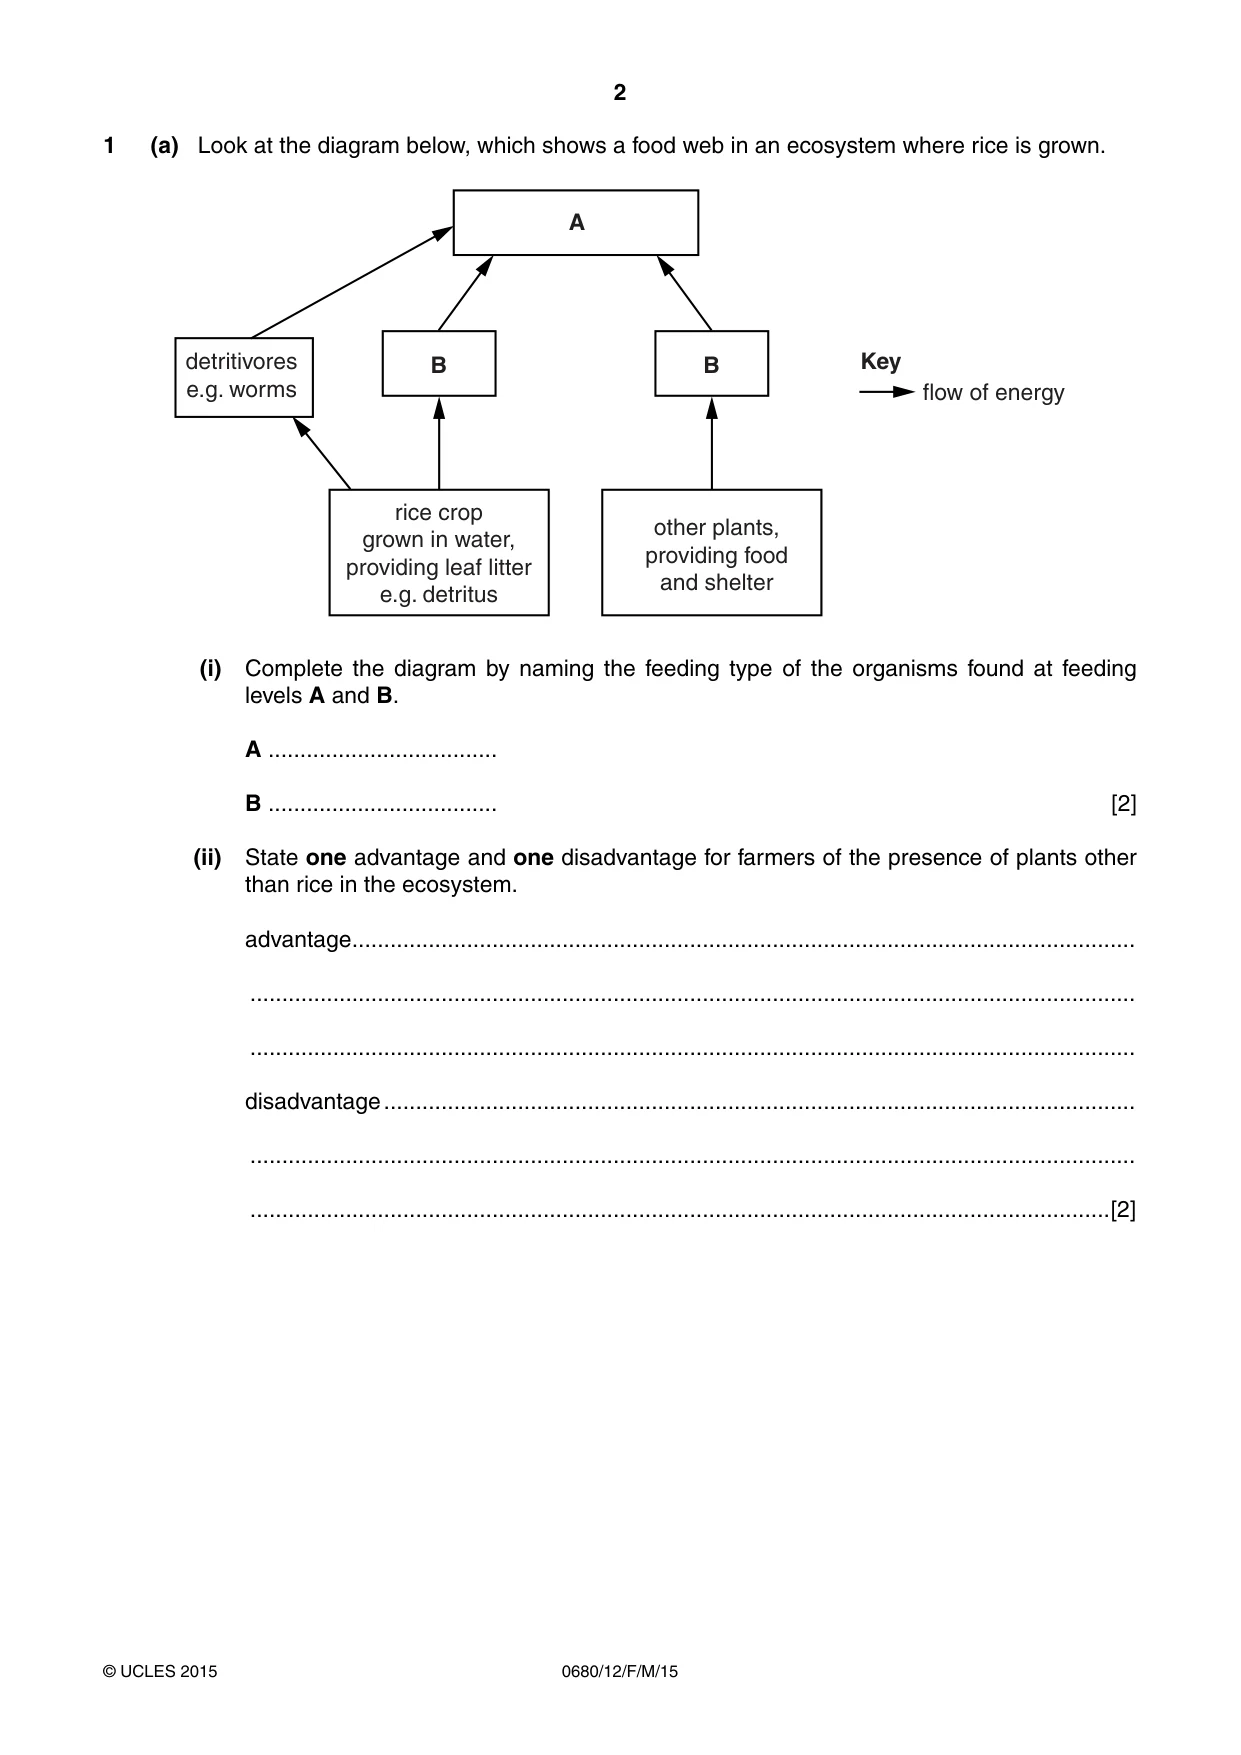
2 0680/12/F/M/15 © UCLES 2015 1 (a) Look at the diagram below, which shows a food web in an ecosystem where rice is grown. detritivores e.g. worms Key flow of energy rice crop grown in water, providing leaf litter e.g. detritus B B A other plants, providing food and shelter (i) Complete the diagram by naming the feeding type of the organisms found at feeding levels A and B. A … B … [2] (ii) State one advantage and one disadvantage for farmers of the presence of plants other than rice in the ecosystem. advantage … … … disadvantage … … …[2]
Question paper, page 3
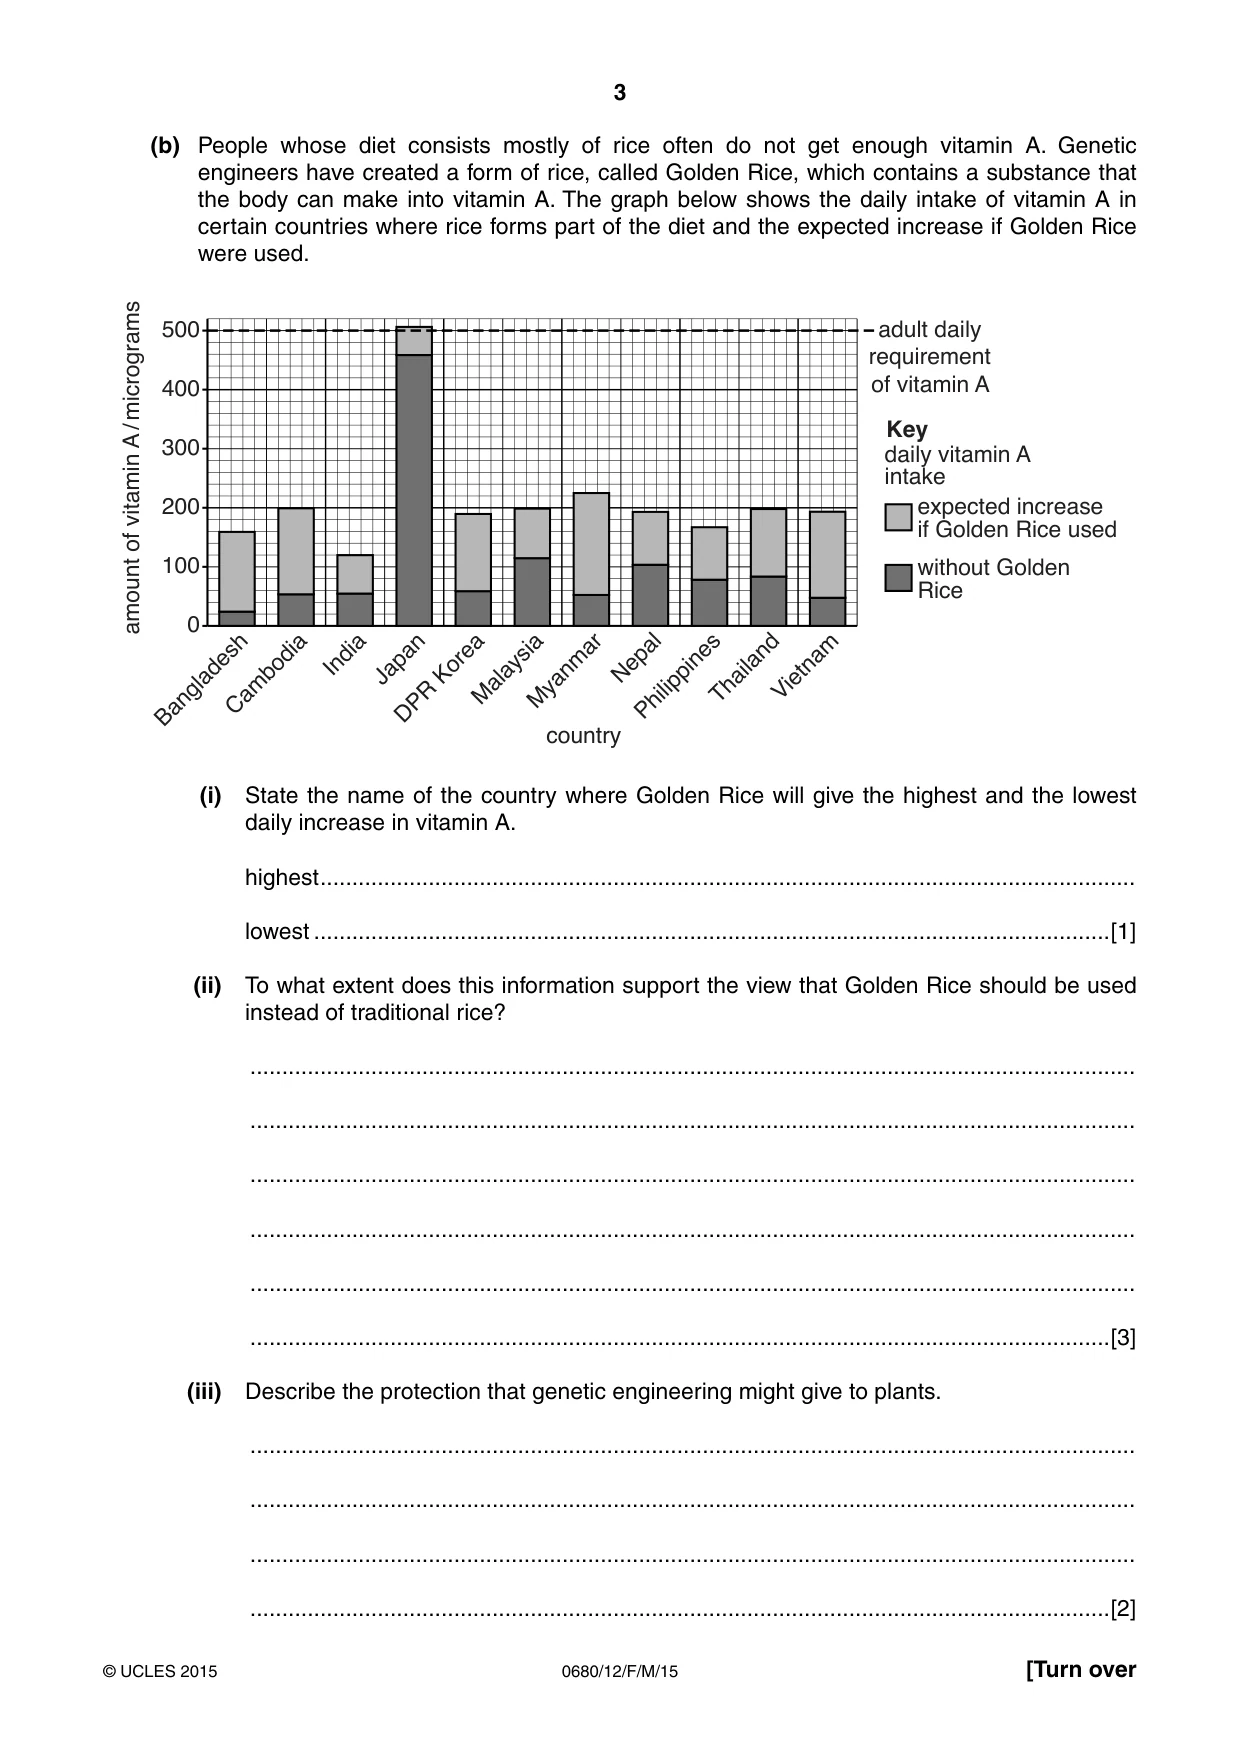
3 0680/12/F/M/15 © UCLES 2015 [Turn over (b) People whose diet consists mostly of rice often do not get enough vitamin A. Genetic engineers have created a form of rice, called Golden Rice, which contains a substance that the body can make into vitamin A. The graph below shows the daily intake of vitamin A in certain countries where rice forms part of the diet and the expected increase if Golden Rice were used. 0 100 200 300 400 500 Bangladesh Cambodia India Japan DPR Korea Malaysia Myanmar Nepal Philippines Thailand Vietnam country amount of vitamin A / micrograms adult daily requirement of vitamin A daily vitamin A intake Key expected increase if Golden Rice used without Golden Rice (i) State the name of the country where Golden Rice will give the highest and the lowest daily increase in vitamin A. highest … lowest …[1] (ii) To what extent does this information support the view that Golden Rice should be used instead of traditional rice? … … … … … …[3] (iii) Describe the protection that genetic engineering might give to plants. … … … …[2]
Question paper, page 4
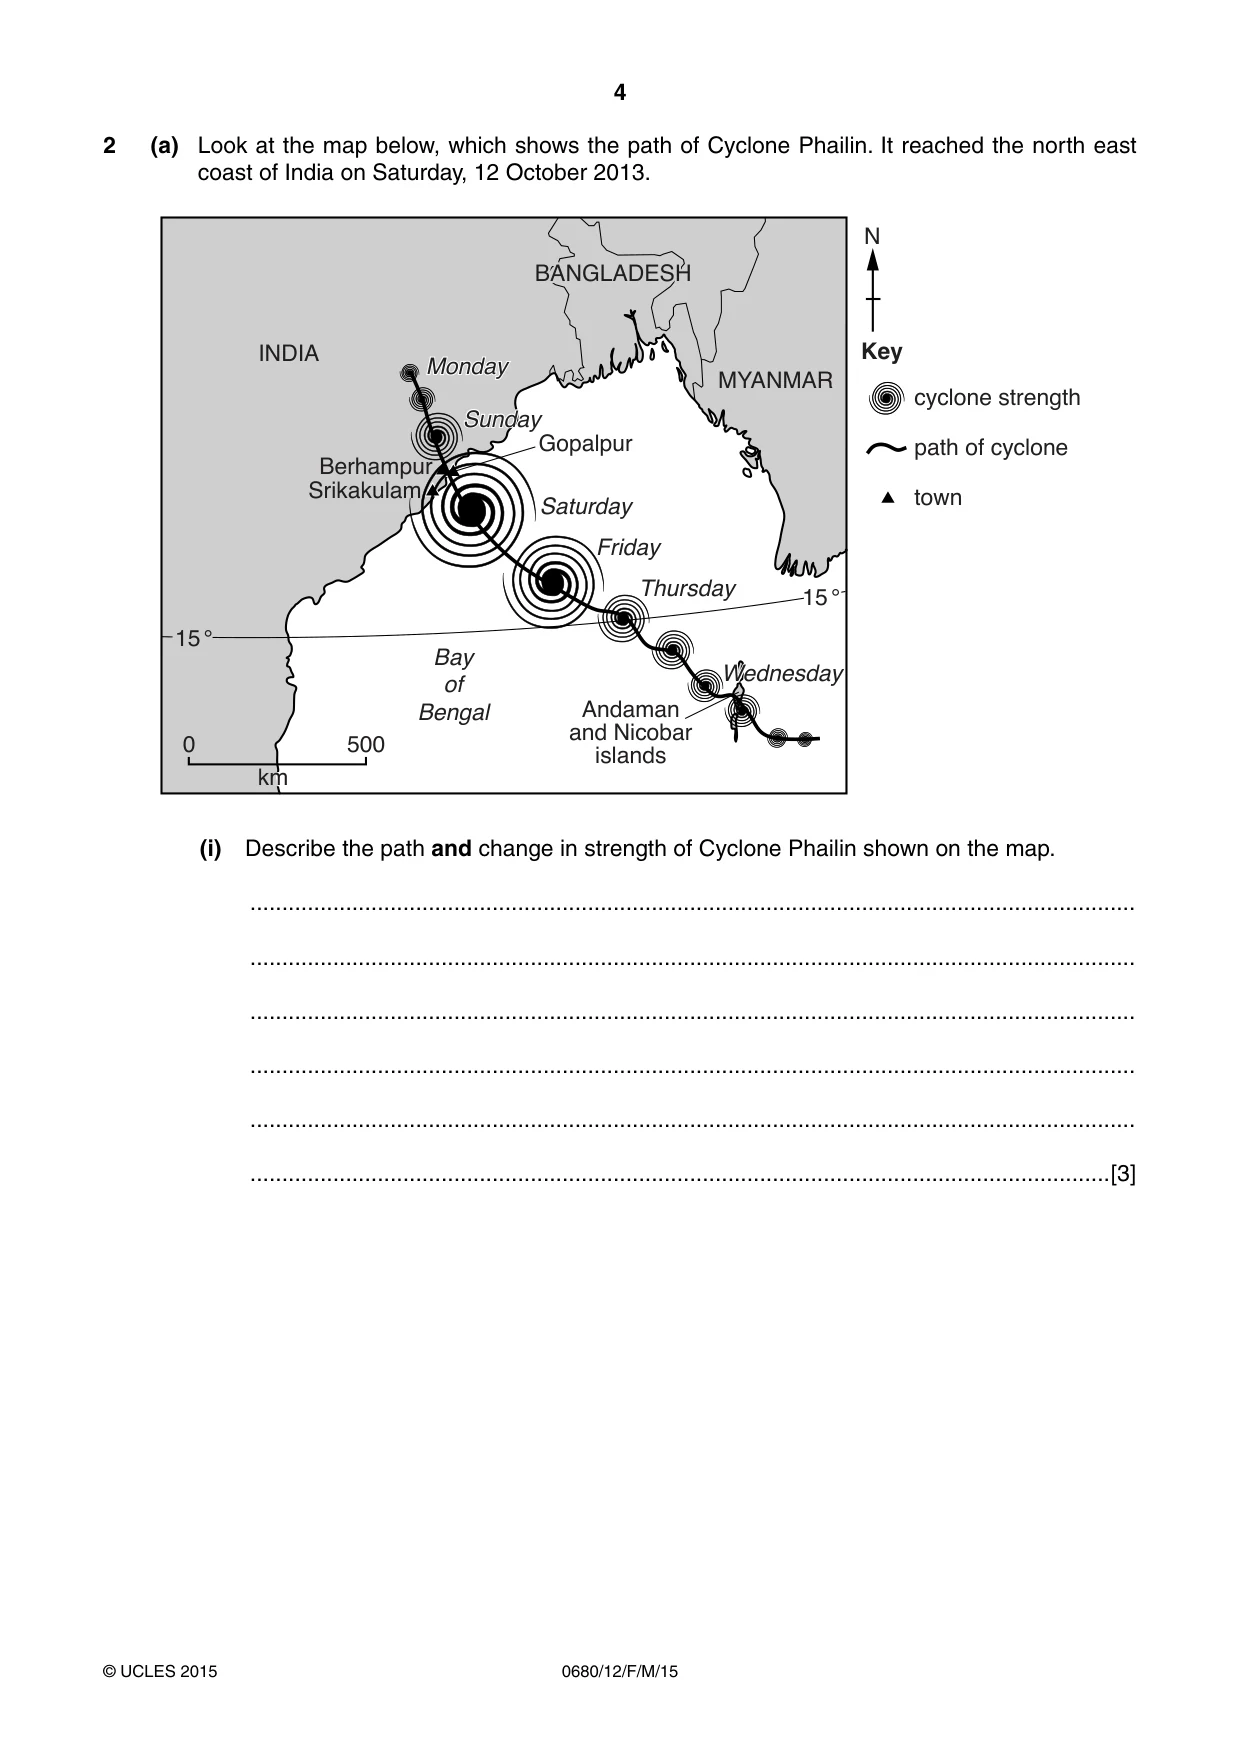
4 0680/12/F/M/15 © UCLES 2015 2 (a) Look at the map below, which shows the path of Cyclone Phailin. It reached the north east coast of India on Saturday, 12 October 2013. INDIA Bay of Bengal BANGLADESH MYANMAR N Key 15 ° 15 ° Berhampur Andaman and Nicobar islands Srikakulam km 0 500 Gopalpur Thursday Friday Saturday Wednesday Sunday Monday cyclone strength path of cyclone town (i) Describe the path and change in strength of Cyclone Phailin shown on the map. … … … … … …[3]
Question paper, page 5
5 0680/12/F/M/15 © UCLES 2015 [Turn over (ii) Explain how a cyclone forms. … … … … … … … …[4] (b) When Cyclone Paradip hit this same area of India in 1999, over 10 000 people died. Cyclone Phailin led to the deaths of fewer than 100 people. Suggest reasons for this difference in the number of deaths. … … … … … …[3]
Question paper, page 6
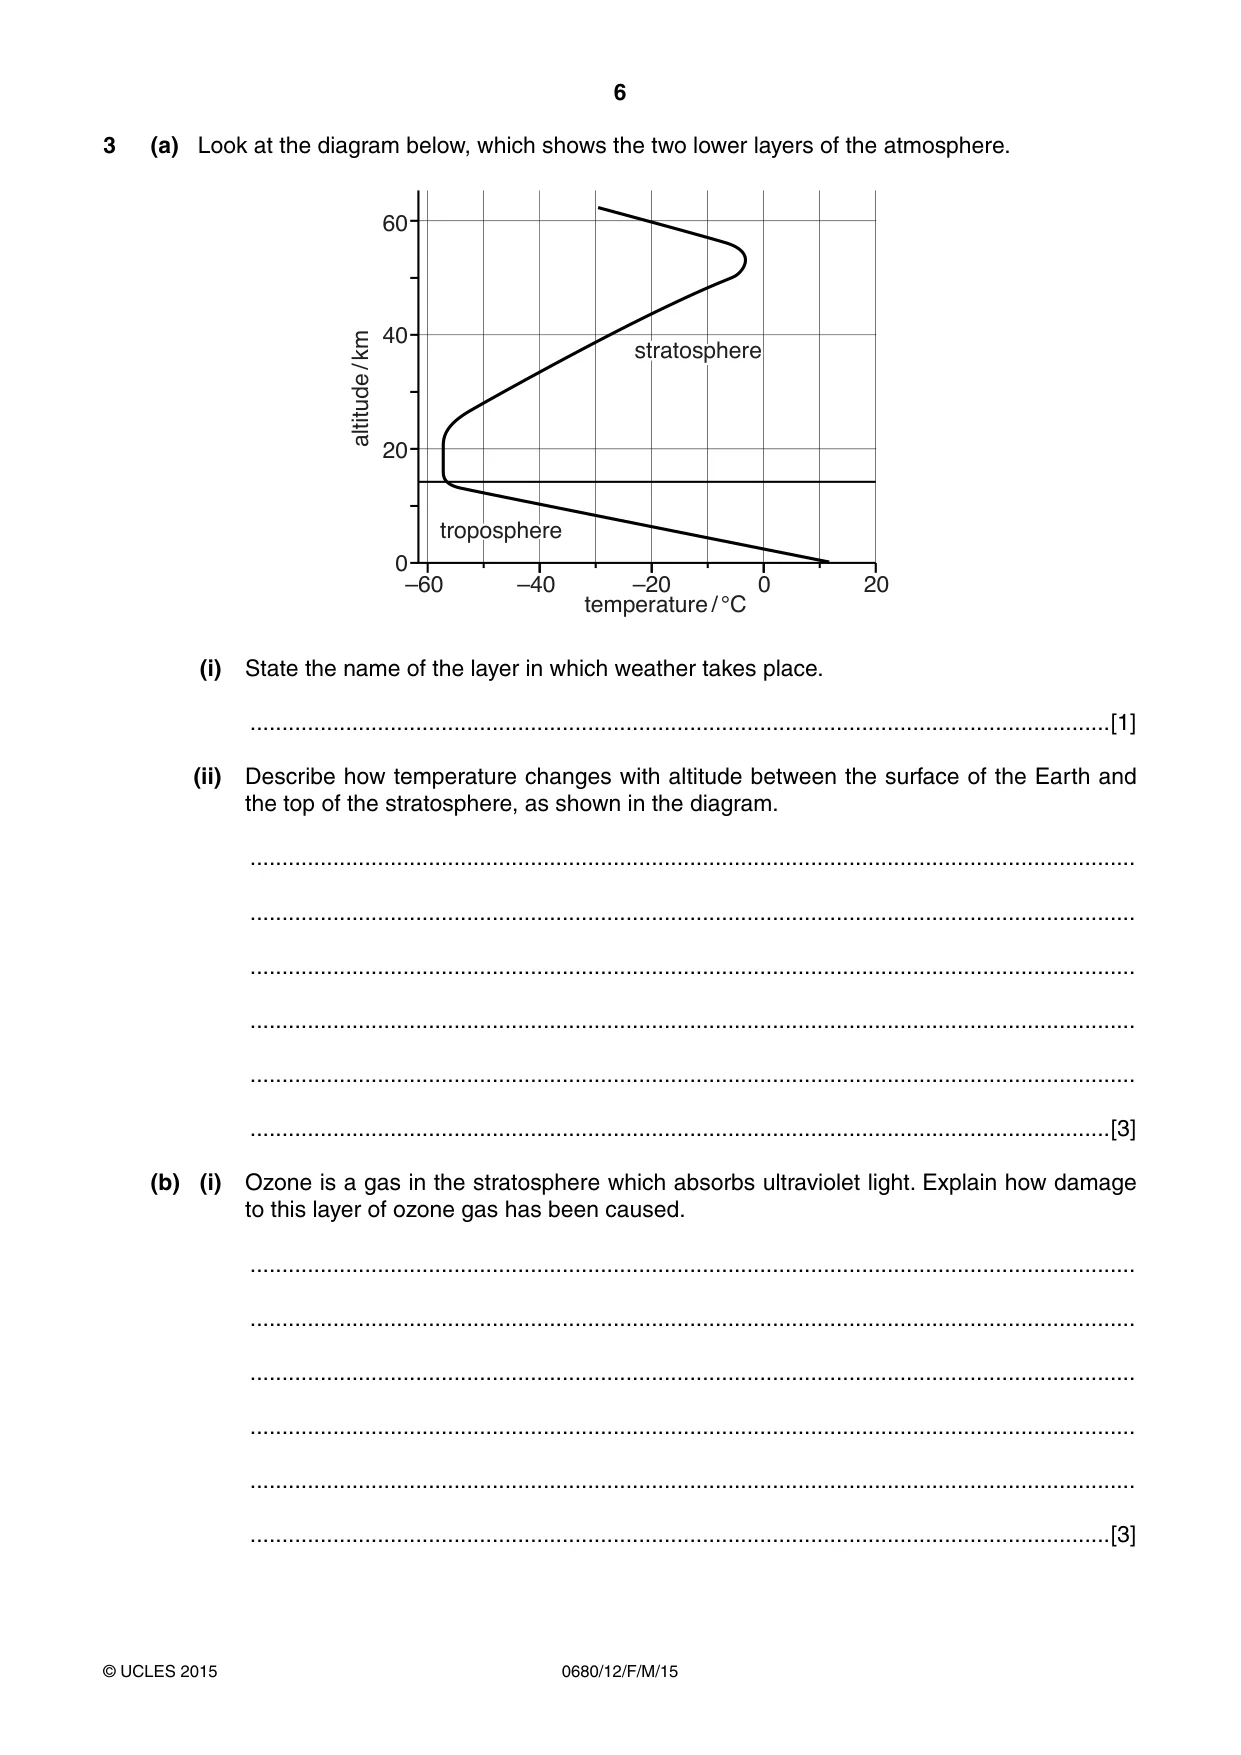
6 0680/12/F/M/15 © UCLES 2015 3 (a) Look at the diagram below, which shows the two lower layers of the atmosphere. –60 0 20 altitude / km temperature / °C 40 60 –40 –20 0 20 troposphere stratosphere (i) State the name of the layer in which weather takes place. …[1] (ii) Describe how temperature changes with altitude between the surface of the Earth and the top of the stratosphere, as shown in the diagram. … … … … … …[3] (b) (i) Ozone is a gas in the stratosphere which absorbs ultraviolet light. Explain how damage to this layer of ozone gas has been caused. … … … … … …[3]
Question paper, page 7
7 0680/12/F/M/15 © UCLES 2015 [Turn over (ii) Explain how ultraviolet light is harmful to people and the environment. … … … … … …[3]
Question paper, page 8
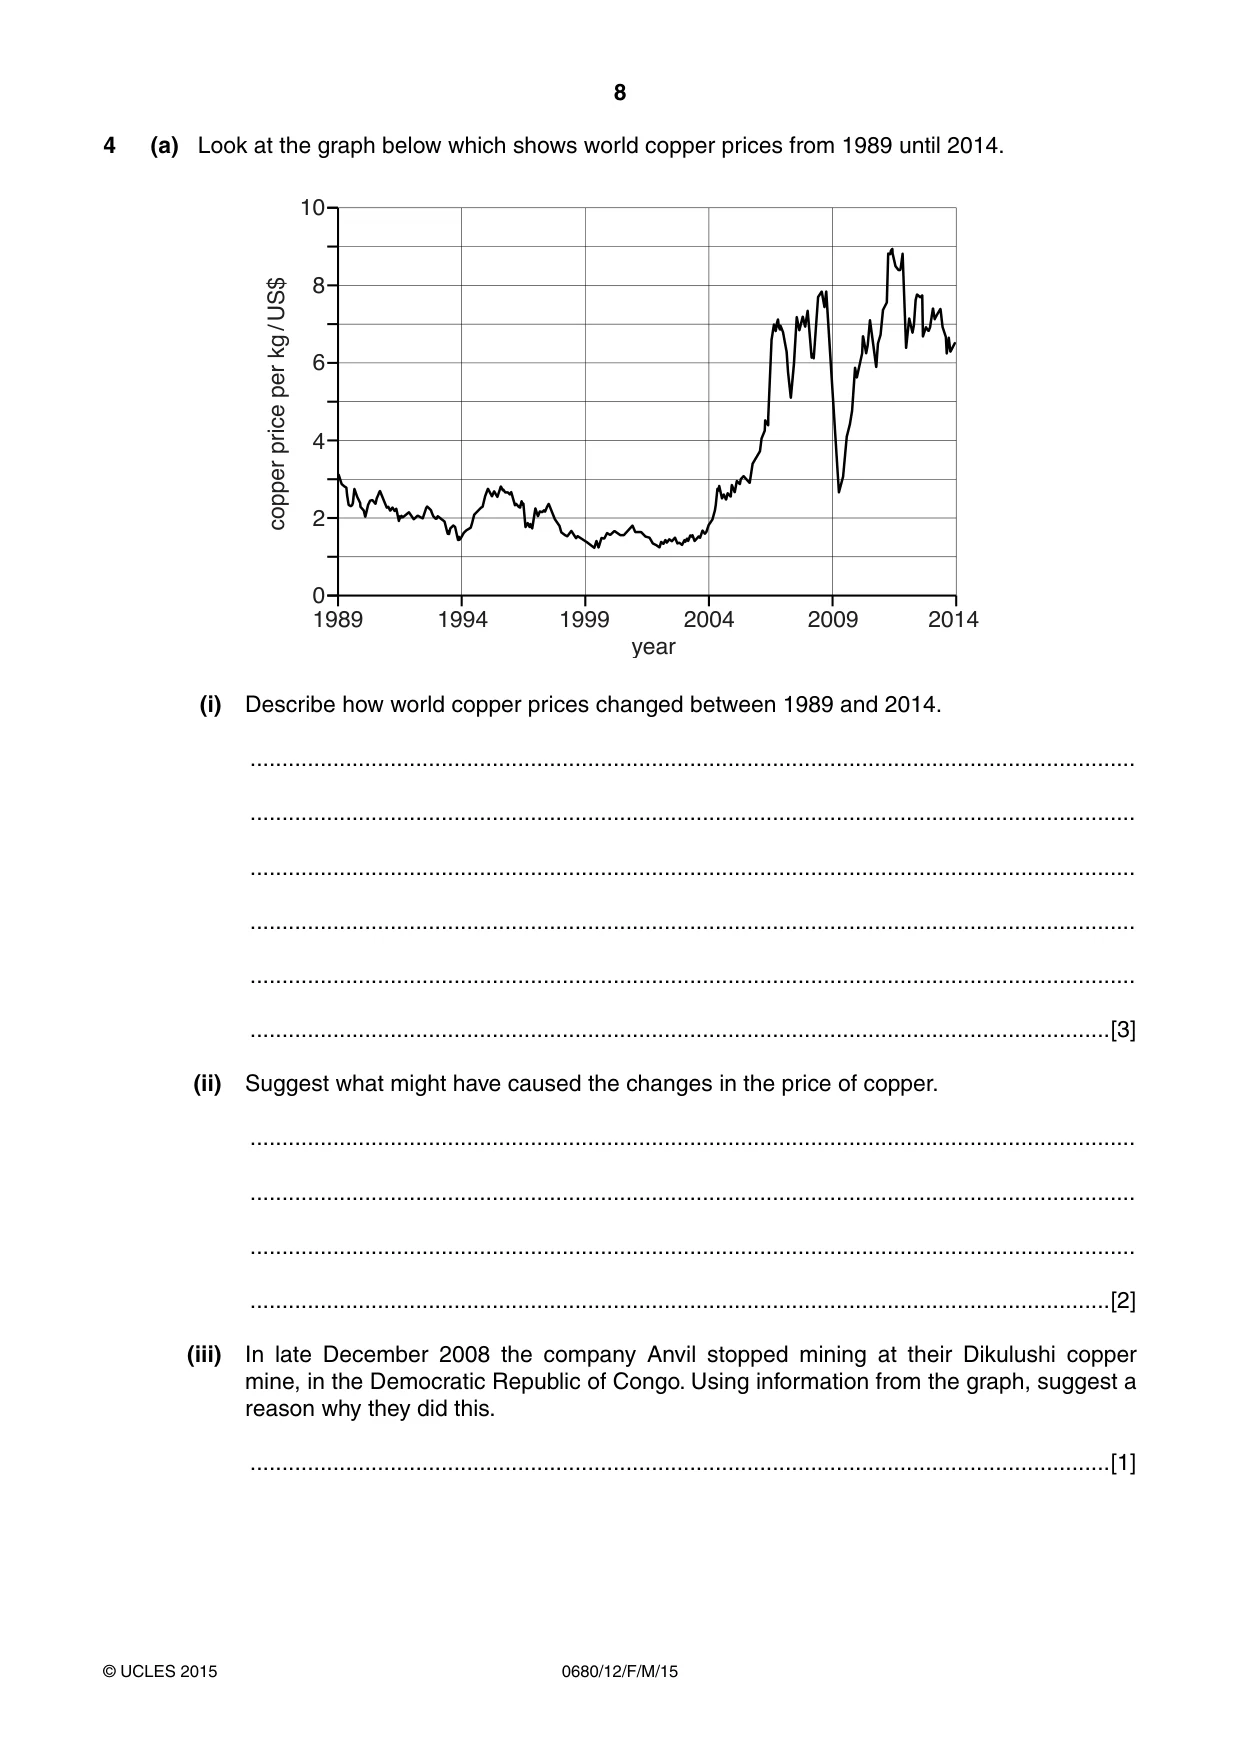
8 0680/12/F/M/15 © UCLES 2015 4 (a) Look at the graph below which shows world copper prices from 1989 until 2014. 1989 0 2 4 6 8 10 1994 1999 2004 year copper price per kg / US$ 2009 2014 (i) Describe how world copper prices changed between 1989 and 2014. … … … … … …[3] (ii) Suggest what might have caused the changes in the price of copper. … … … …[2] (iii) In late December 2008 the company Anvil stopped mining at their Dikulushi copper mine, in the Democratic Republic of Congo. Using information from the graph, suggest a reason why they did this. …[1]
Question paper, page 9
9 0680/12/F/M/15 © UCLES 2015 [Turn over (b) (i) The mining of minerals, such as copper, can cause environmental damage. State two ways in which environments damaged by mining can be conserved. … … … …[2] (ii) Suggest how quarries or large holes left after mining might be used. … … … …[2]
Question paper, page 10
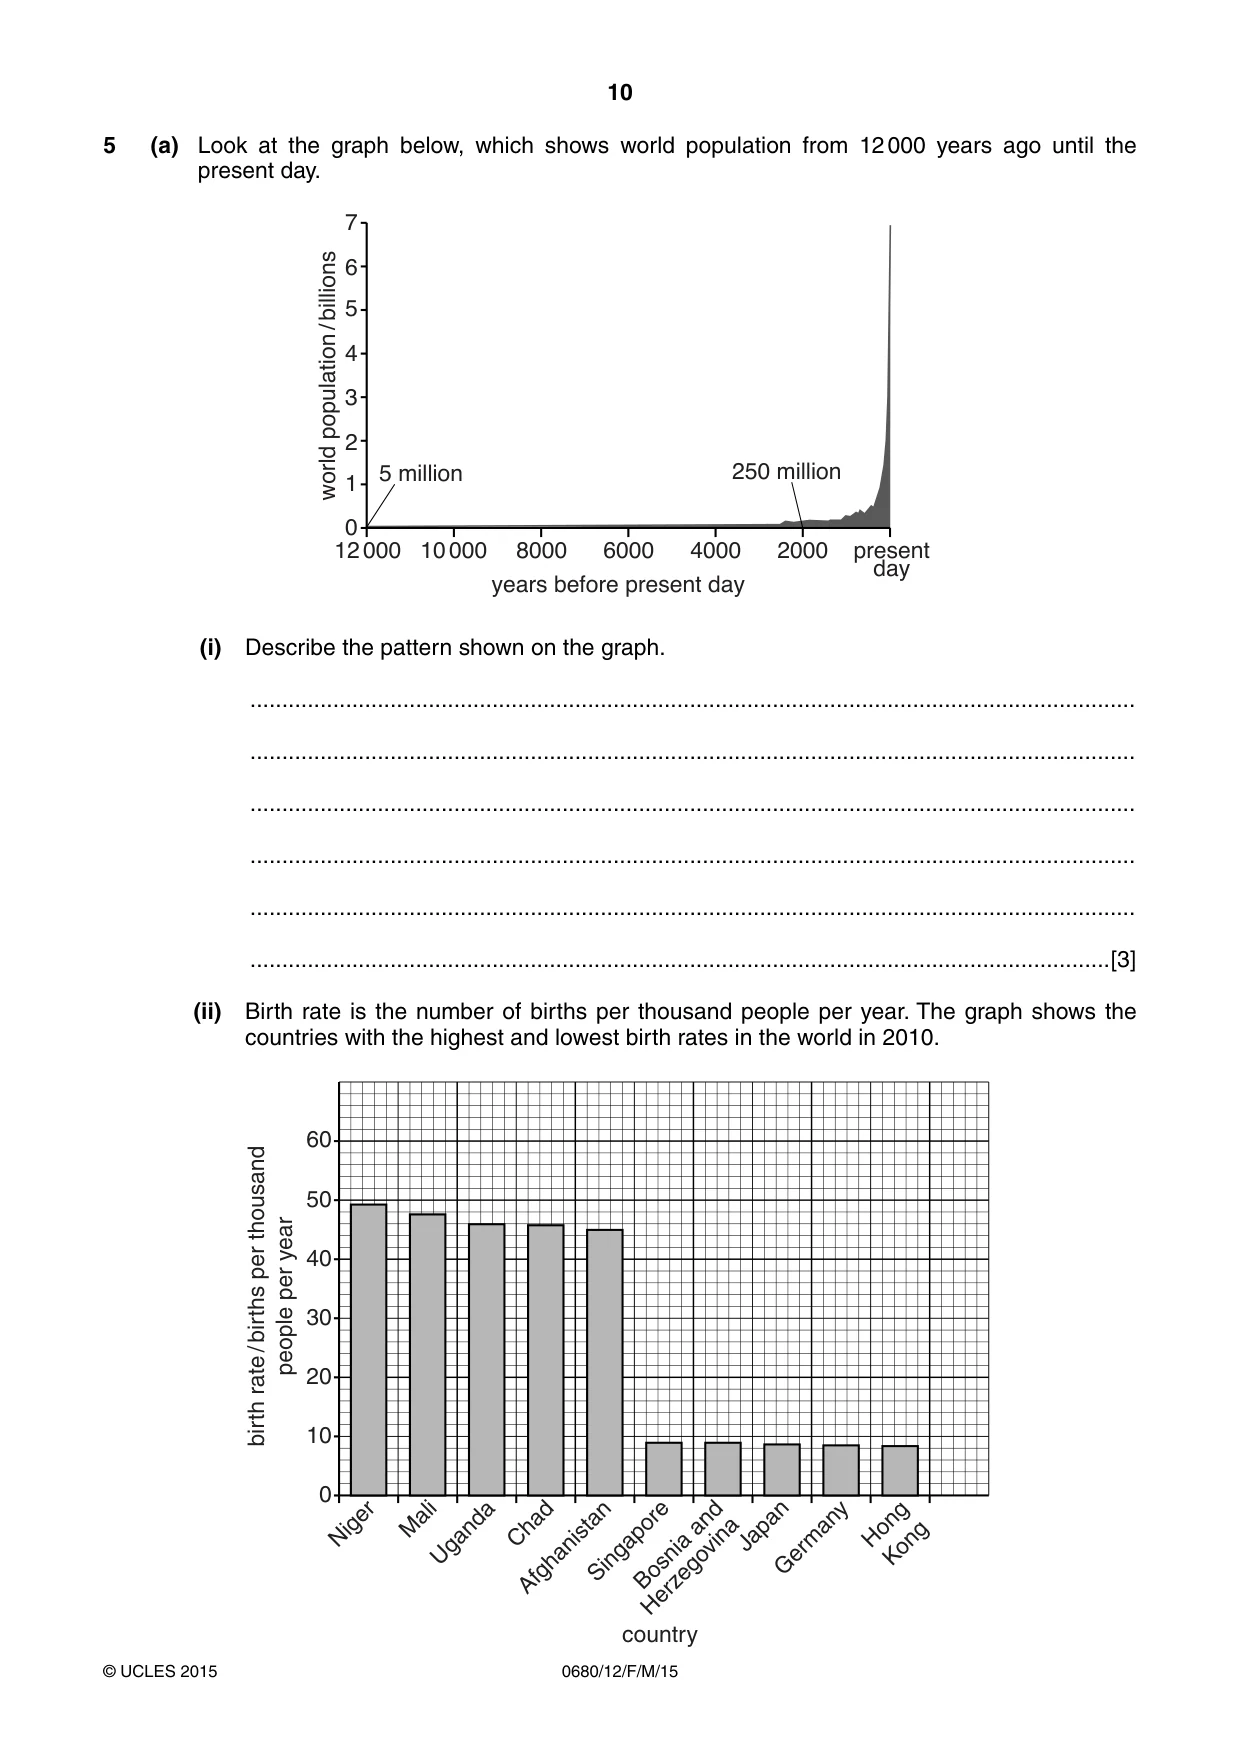
10 0680/12/F/M/15 © UCLES 2015 5 (a) Look at the graph below, which shows world population from 12 000 years ago until the present day. 7 6 5 4 3 2 1 0 12 000 10 000 8000 6000 4000 2000 present day years before present day world population / billions 5 million 250 million (i) Describe the pattern shown on the graph. … … … … … …[3] (ii) Birth rate is the number of births per thousand people per year. The graph shows the countries with the highest and lowest birth rates in the world in 2010. 0 10 20 30 40 50 60 birth rate / births per thousand people per year Niger Mali Uganda Chad Afghanistan Singapore Bosnia and Herzegovina Japan Germany Hong Kong country
Question paper, page 11
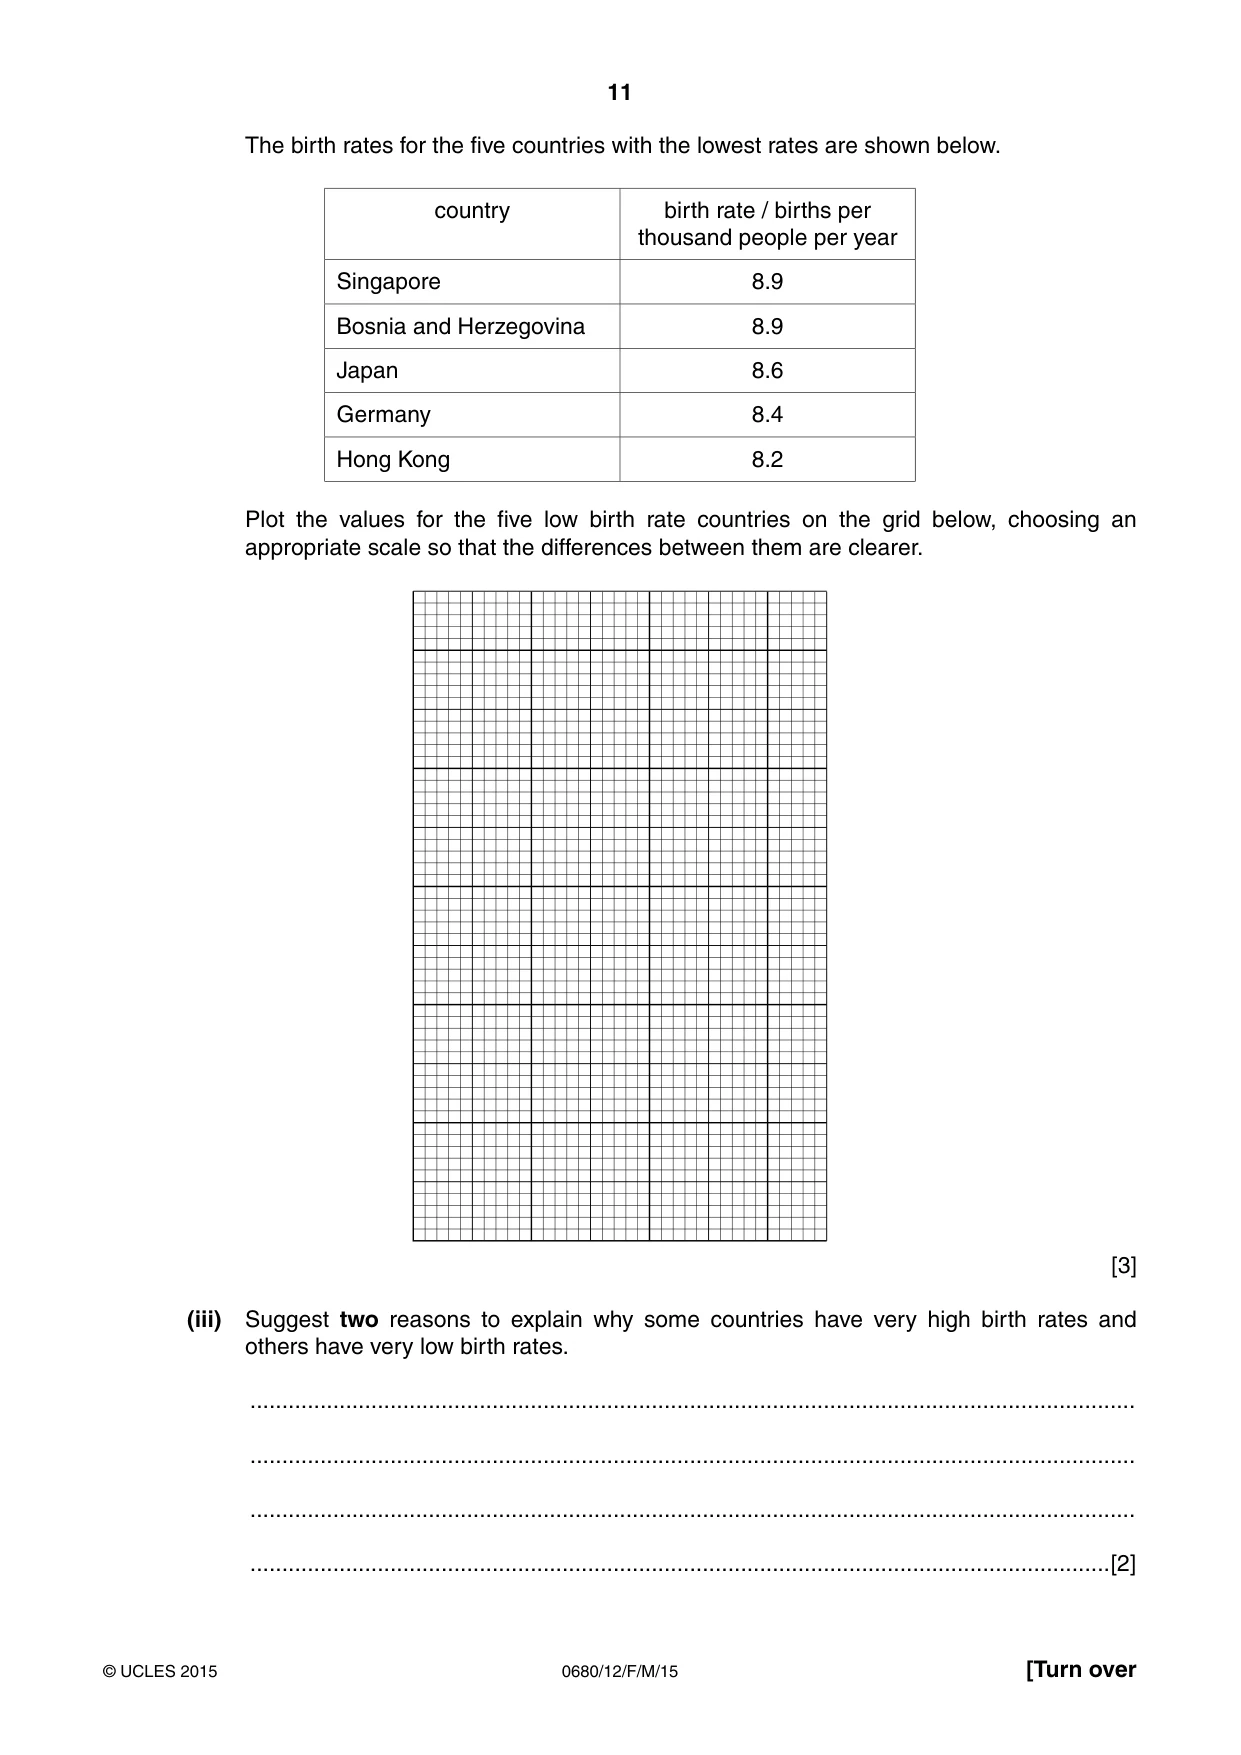
11 0680/12/F/M/15 © UCLES 2015 [Turn over The birth rates for the five countries with the lowest rates are shown below. country birth rate / births per thousand people per year Singapore 8.9 Bosnia and Herzegovina 8.9 Japan 8.6 Germany 8.4 Hong Kong 8.2 Plot the values for the five low birth rate countries on the grid below, choosing an appropriate scale so that the differences between them are clearer. [3] (iii) Suggest two reasons to explain why some countries have very high birth rates and others have very low birth rates. … … … …[2]
Question paper, page 12
12 0680/12/F/M/15 © UCLES 2015 (b) If birth rates are higher than death rates, populations will grow. Populations also change as a result of the movement of people (migration). State two push factors that explain why people might move from rural to urban areas. … … … … …[2]
Question paper, page 13
13 0680/12/F/M/15 © UCLES 2015 [Turn over BLANK PAGE
Question paper, page 14
14 0680/12/F/M/15 © UCLES 2015 6 (a) Look at the sign below, which shows information about rainwater collection in a park in Zambia. This is a corrugated iron roof with an area of 25.5 m2 It is equipped with a good gutter system and storage tank. Its run-off coefficient is 0.9. The maximum possible volume of water which can be collected is: V = C × A × d C = run-off coefficient V = volume A = area d = average annual rainfall (i) Calculate the annual volume of water available (V) from this roof using the data on the sign. The average annual rainfall (d) in this region is 1 m per year. The formula is V = C × A × d Space for working. … m3 per year [3] (ii) Explain how water from oceans, seas and lakes falls on the Earth’s surface as rain. … … … … …[2]
Question paper, page 15
15 0680/12/F/M/15 © UCLES 2015 (iii) Explain why people in some parts of the world should not use water from ponds and lakes for drinking or washing. … … … … … …[3] (b) Oceans are a source of food. Explain why some of the world’s most important fishing grounds are found on continental shelves. … … … … …[2]
Question paper, page 16
16 0680/12/F/M/15 © UCLES 2015 Permission to reproduce items where third-party owned material protected by copyright is included has been sought and cleared where possible. Every reasonable effort has been made by the publisher (UCLES) to trace copyright holders, but if any items requiring clearance have unwittingly been included, the publisher will be pleased to make amends at the earliest possible opportunity. To avoid the issue of disclosure of answer-related information to candidates, all copyright acknowledgements are reproduced online in the Cambridge International Examinations Copyright Acknowledgements Booklet. This is produced for each series of examinations and is freely available to download at www.cie.org.uk after the live examination series. Cambridge International Examinations is part of the Cambridge Assessment Group. Cambridge Assessment is the brand name of University of Cambridge Local Examinations Syndicate (UCLES), which is itself a department of the University of Cambridge. BLANK PAGE
Mark scheme, page 1
® IGCSE is the registered trademark of Cambridge International Examinations. CAMBRIDGE INTERNATIONAL EXAMINATIONS Cambridge International General Certificate of Secondary Education MARK SCHEME for the March 2015 series 0680 ENVIRONMENTAL MANAGEMENT 0680/12 Paper 12, maximum raw mark 60 This mark scheme is published as an aid to teachers and candidates, to indicate the requirements of the examination. It shows the basis on which Examiners were instructed to award marks. It does not indicate the details of the discussions that took place at an Examiners’ meeting before marking began, which would have considered the acceptability of alternative answers. Mark schemes should be read in conjunction with the question paper and the Principal Examiner Report for Teachers. Cambridge will not enter into discussions about these mark schemes. Cambridge is publishing the mark schemes for the March 2015 series for most Cambridge IGCSE® components.
Mark scheme, page 2
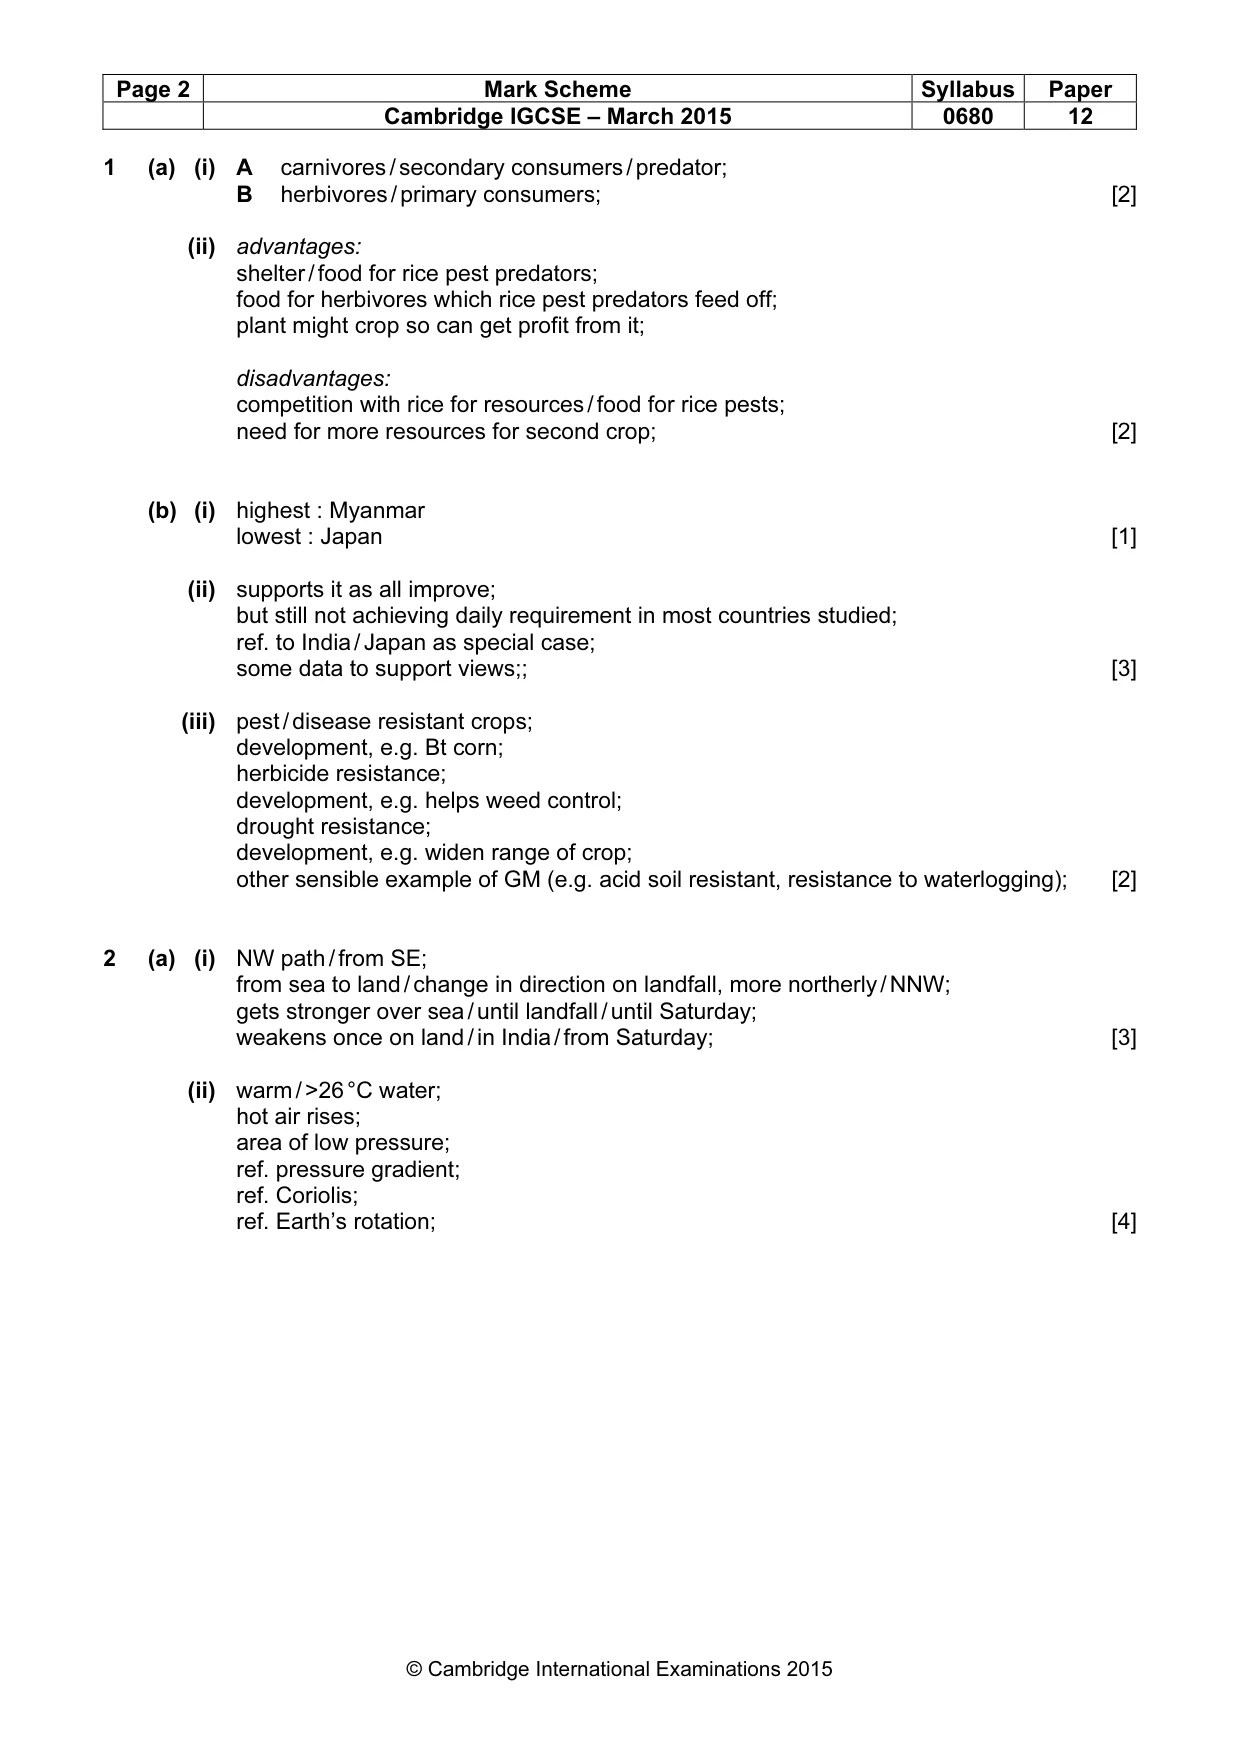
Page 2 Mark Scheme Syllabus Paper Cambridge IGCSE – March 2015 0680 12 © Cambridge International Examinations 2015 1 (a) (i) A carnivores / secondary consumers / predator; B herbivores / primary consumers; [2] (ii) advantages: shelter / food for rice pest predators; food for herbivores which rice pest predators feed off; plant might crop so can get profit from it; disadvantages: competition with rice for resources / food for rice pests; need for more resources for second crop; [2] (b) (i) highest : Myanmar lowest : Japan [1] (ii) supports it as all improve; but still not achieving daily requirement in most countries studied; ref. to India / Japan as special case; some data to support views;; [3] (iii) pest / disease resistant crops; development, e.g. Bt corn; herbicide resistance; development, e.g. helps weed control; drought resistance; development, e.g. widen range of crop; other sensible example of GM (e.g. acid soil resistant, resistance to waterlogging); [2] 2 (a) (i) NW path / from SE; from sea to land / change in direction on landfall, more northerly / NNW; gets stronger over sea / until landfall / until Saturday; weakens once on land / in India / from Saturday; [3] (ii) warm / >26 °C water; hot air rises; area of low pressure; ref. pressure gradient; ref. Coriolis; ref. Earth’s rotation; [4]
Mark scheme, page 3
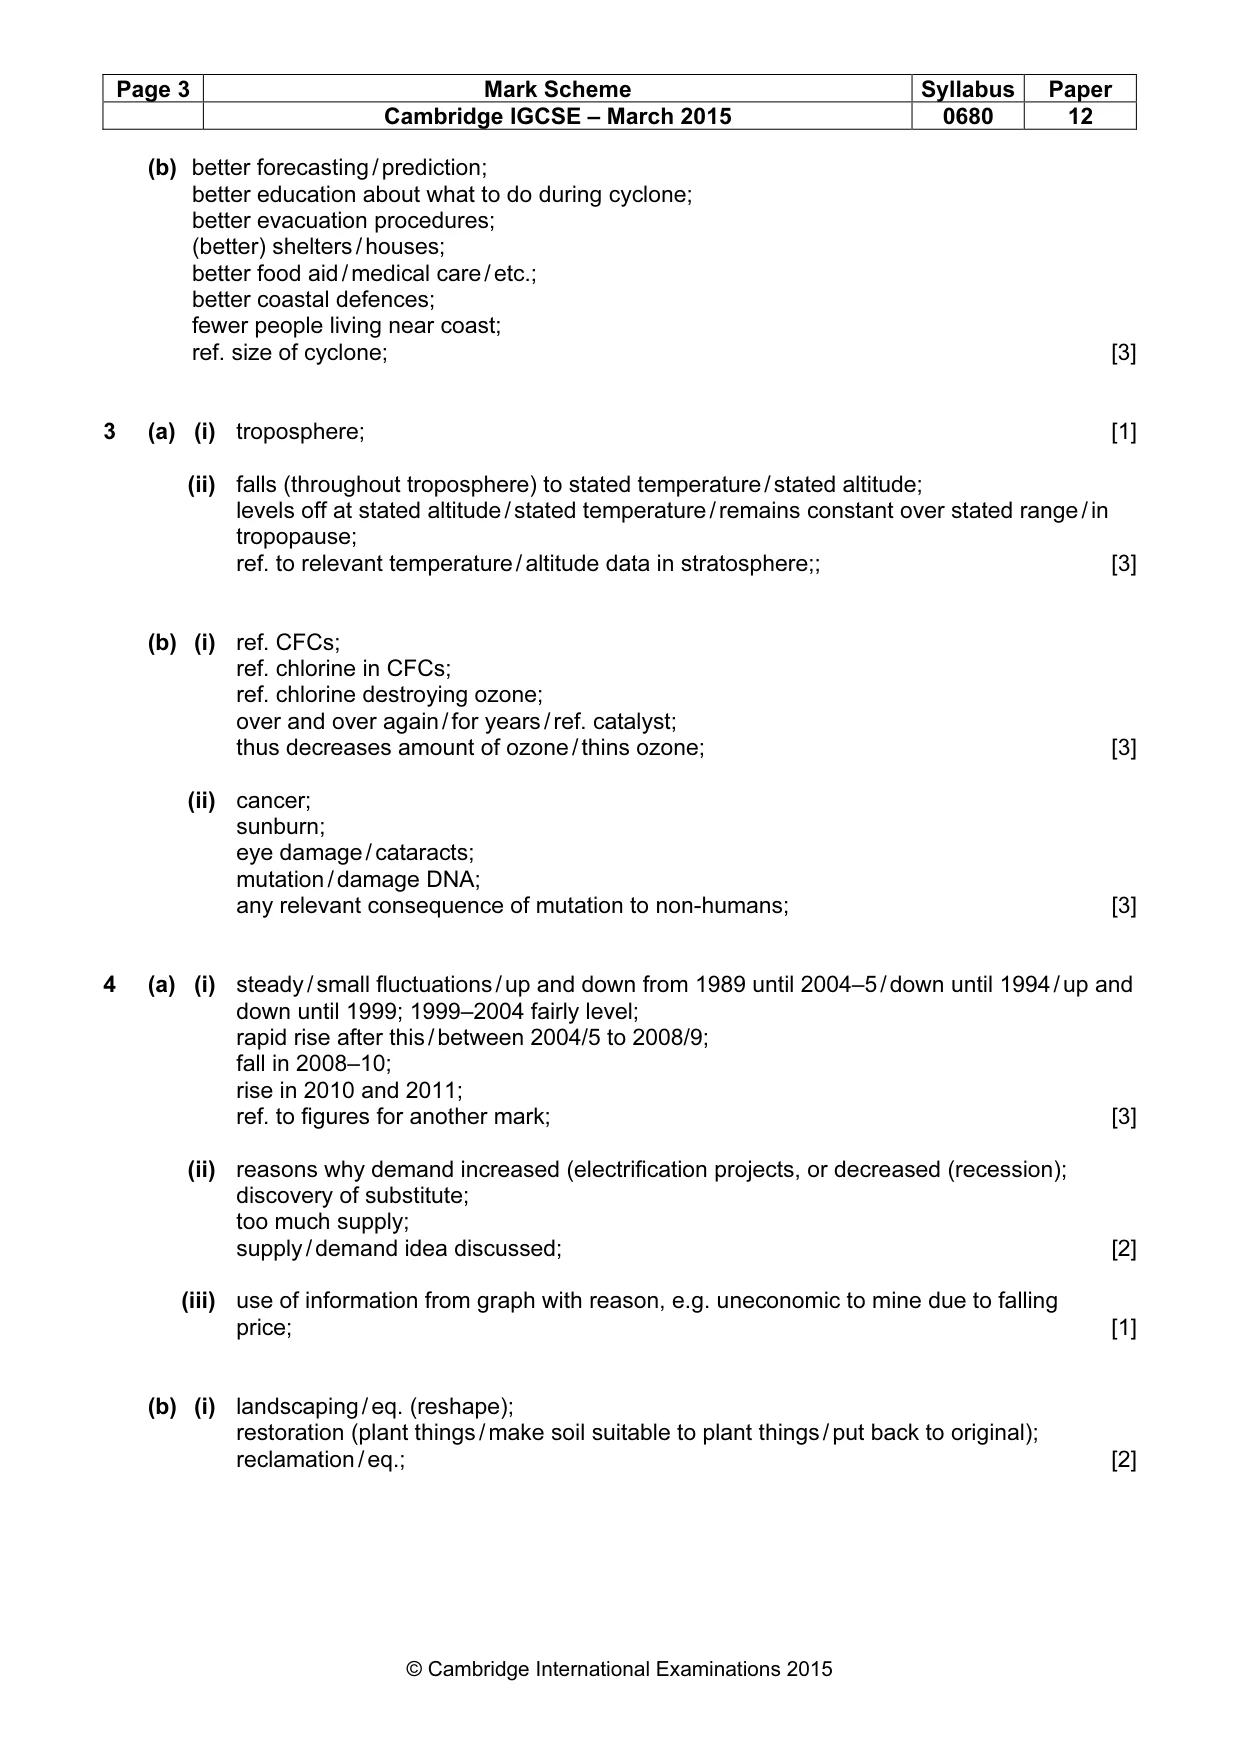
Page 3 Mark Scheme Syllabus Paper Cambridge IGCSE – March 2015 0680 12 © Cambridge International Examinations 2015 (b) better forecasting / prediction; better education about what to do during cyclone; better evacuation procedures; (better) shelters / houses; better food aid / medical care / etc.; better coastal defences; fewer people living near coast; ref. size of cyclone; [3] 3 (a) (i) troposphere; [1] (ii) falls (throughout troposphere) to stated temperature / stated altitude; levels off at stated altitude / stated temperature / remains constant over stated range / in tropopause; ref. to relevant temperature / altitude data in stratosphere;; [3] (b) (i) ref. CFCs; ref. chlorine in CFCs; ref. chlorine destroying ozone; over and over again / for years / ref. catalyst; thus decreases amount of ozone / thins ozone; [3] (ii) cancer; sunburn; eye damage / cataracts; mutation / damage DNA; any relevant consequence of mutation to non-humans; [3] 4 (a) (i) steady / small fluctuations / up and down from 1989 until 2004–5 / down until 1994 / up and down until 1999; 1999–2004 fairly level; rapid rise after this / between 2004/5 to 2008/9; fall in 2008–10; rise in 2010 and 2011; ref. to figures for another mark; [3] (ii) reasons why demand increased (electrification projects, or decreased (recession); discovery of substitute; too much supply; supply / demand idea discussed; [2] (iii) use of information from graph with reason, e.g. uneconomic to mine due to falling price; [1] (b) (i) landscaping / eq. (reshape); restoration (plant things / make soil suitable to plant things / put back to original); reclamation / eq.; [2]
Mark scheme, page 4
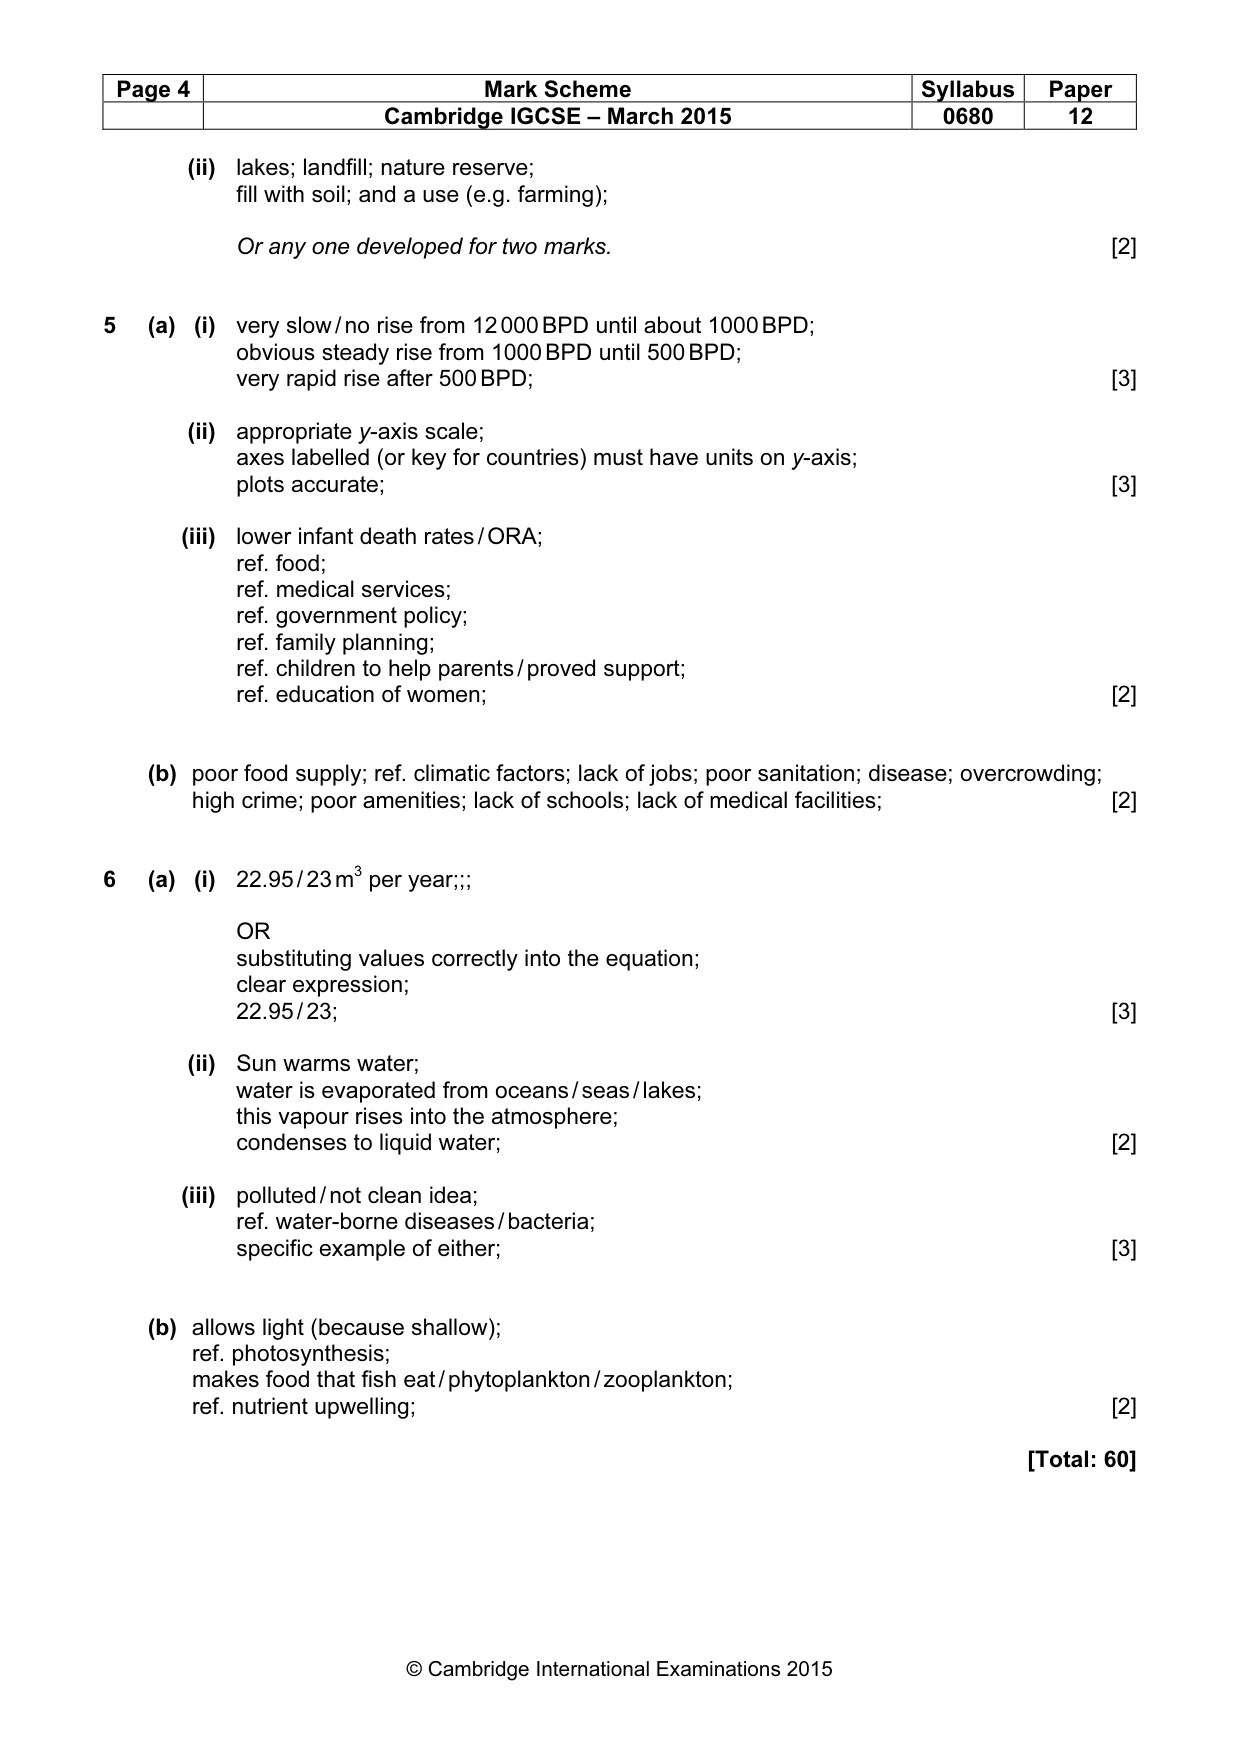
Page 4 Mark Scheme Syllabus Paper Cambridge IGCSE – March 2015 0680 12 © Cambridge International Examinations 2015 (ii) lakes; landfill; nature reserve; fill with soil; and a use (e.g. farming); Or any one developed for two marks. [2] 5 (a) (i) very slow / no rise from 12 000 BPD until about 1000 BPD; obvious steady rise from 1000 BPD until 500 BPD; very rapid rise after 500 BPD; [3] (ii) appropriate y-axis scale; axes labelled (or key for countries) must have units on y-axis; plots accurate; [3] (iii) lower infant death rates / ORA; ref. food; ref. medical services; ref. government policy; ref. family planning; ref. children to help parents / proved support; ref. education of women; [2] (b) poor food supply; ref. climatic factors; lack of jobs; poor sanitation; disease; overcrowding; high crime; poor amenities; lack of schools; lack of medical facilities; [2] 6 (a) (i) 22.95 / 23 m3 per year;;; OR substituting values correctly into the equation; clear expression; 22.95 / 23; [3] (ii) Sun warms water; water is evaporated from oceans / seas / lakes; this vapour rises into the atmosphere; condenses to liquid water; [2] (iii) polluted / not clean idea; ref. water-borne diseases / bacteria; specific example of either; [3] (b) allows light (because shallow); ref. photosynthesis; makes food that fish eat / phytoplankton / zooplankton; ref. nutrient upwelling; [2] [Total: 60]
What you needed in this session
Cambridge’s own grade thresholds for 2015 Feb/March, Paper 1 · Variant 2. A higher threshold means an easier paper — the bar moves with how the cohort did.