Cambridge IGCSE Environmental Management 0680 — 2007 May/June Paper 1 · Variant 1
0680/11/M/J/07 · 60 marks · ≈68 min
The question paper and its mark scheme, free to read here and free to download. This is Cambridge’s own paper, exactly as it was sat.
Question paper16 pages


Mark scheme3 pages
Answers below. Sit the paper first if you are practising.
Paper as text
Question paper, page 1
This document consists of 13 printed pages and 3 blank pages. SP (SJF4354/DR) T26415/4 © UCLES 2007 [Turn over UNIVERSITY OF CAMBRIDGE INTERNATIONAL EXAMINATIONS International General Certificate of Secondary Education READ THESE INSTRUCTIONS FIRST Write your Centre number, candidate number and name on all the work you hand in. Write in dark blue or black pen. You may use a soft pencil for any diagrams, graphs or rough working. Do not use staples, paper clips, highlighters, glue or correction fluid. DO NOT WRITE IN ANY BARCODES. Answer all questions. At the end of the examination, fasten all your work securely together. The number of marks is given in brackets [ ] at the end of each question or part question. * 6 0 6 2 8 6 6 4 5 3 * ENVIRONMENTAL MANAGEMENT 0680/01 Paper 1 May/June 2007 1 hour 30 minutes Candidates answer on the Question Paper. Additional Materials: Ruler For Examiner’s Use 1 2 3 4 5 6 Total www.XtremePapers.com
Question paper, page 2
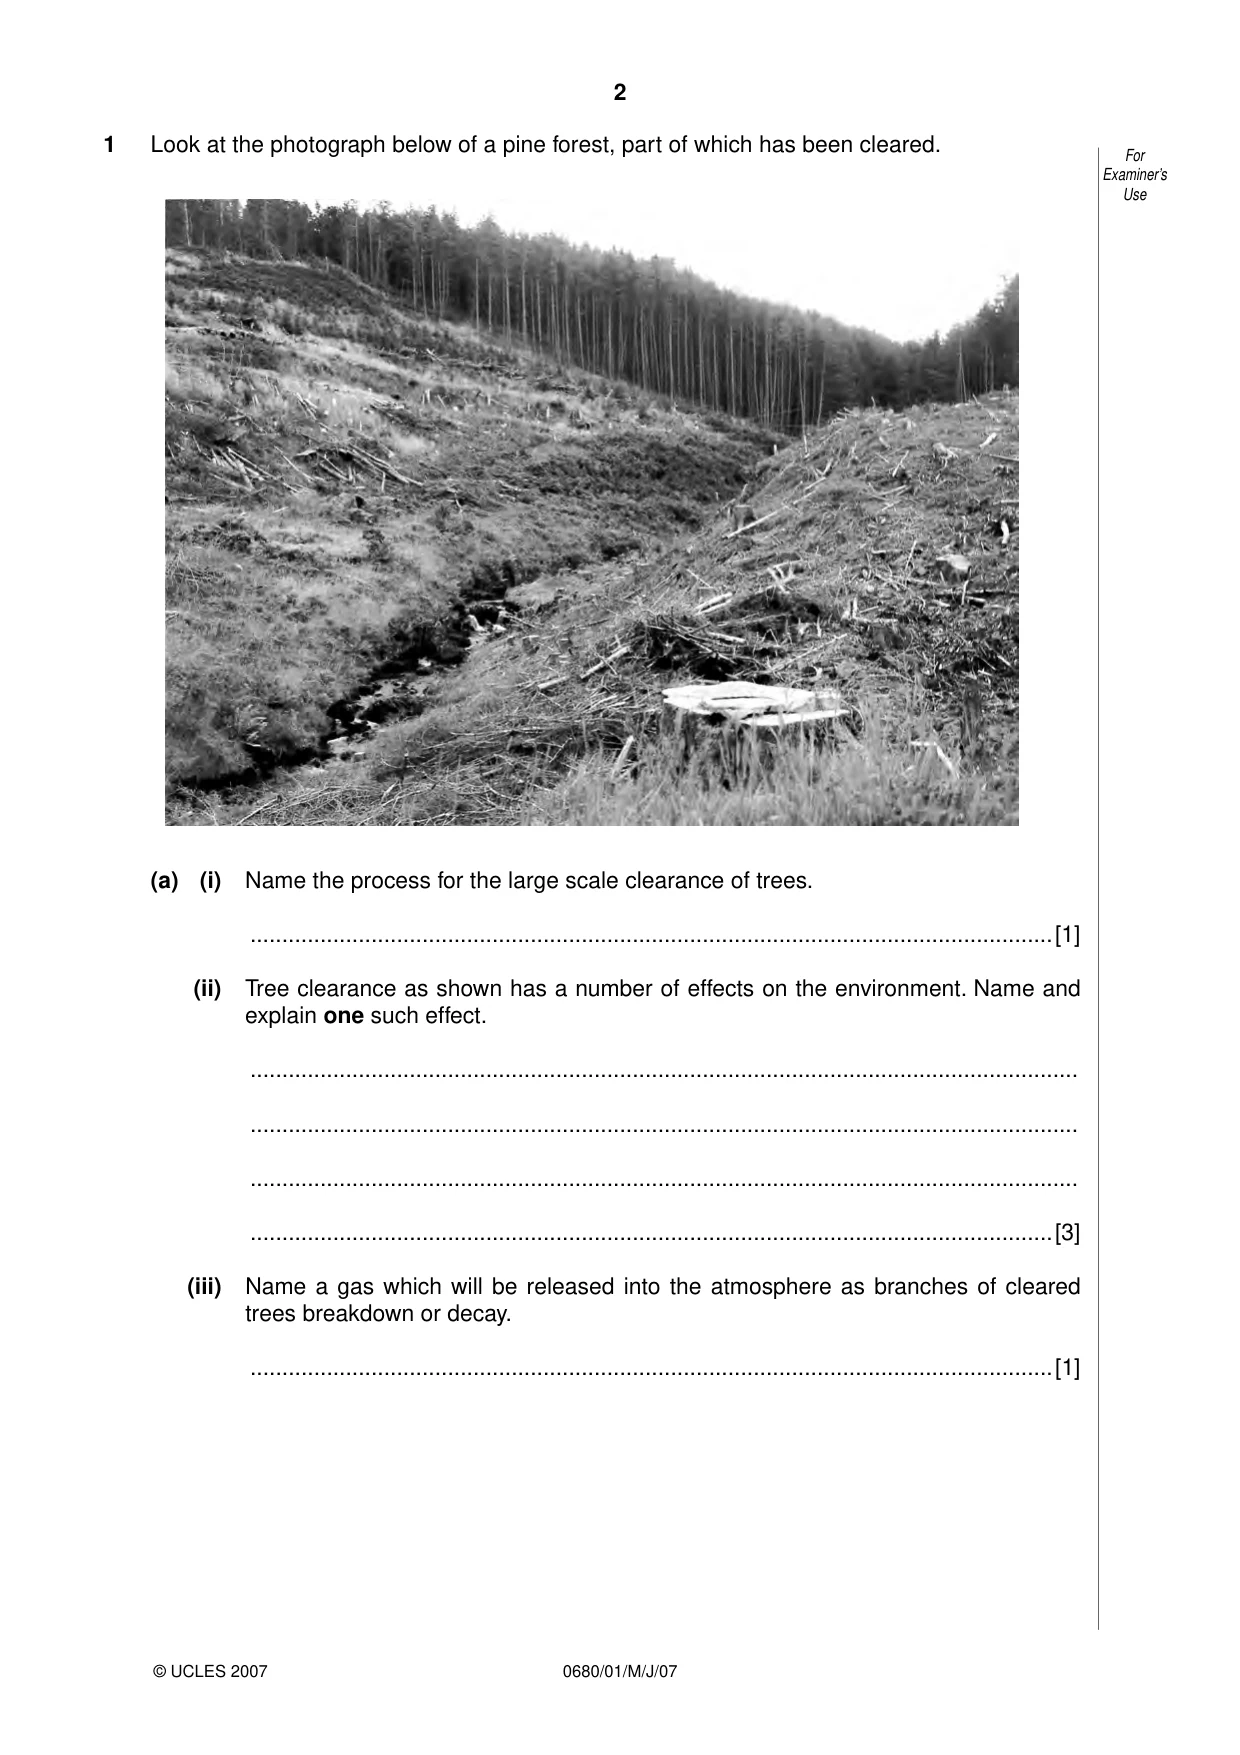
2 0680/01/M/J/07 For Examiner’s Use © UCLES 2007 1 Look at the photograph below of a pine forest, part of which has been cleared. (a) (i) Name the process for the large scale clearance of trees. …[1] (ii) Tree clearance as shown has a number of effects on the environment. Name and explain one such effect. … … … …[3] (iii) Name a gas which will be released into the atmosphere as branches of cleared trees breakdown or decay. …[1]
Question paper, page 3
3 0680/01/M/J/07 [Turn over For Examiner’s Use © UCLES 2007 (b) (i) Describe one effect of global warming. … … …[2] (ii) What can governments do to reduce global warming? … … … … …[3] [Total: 10]
Question paper, page 4
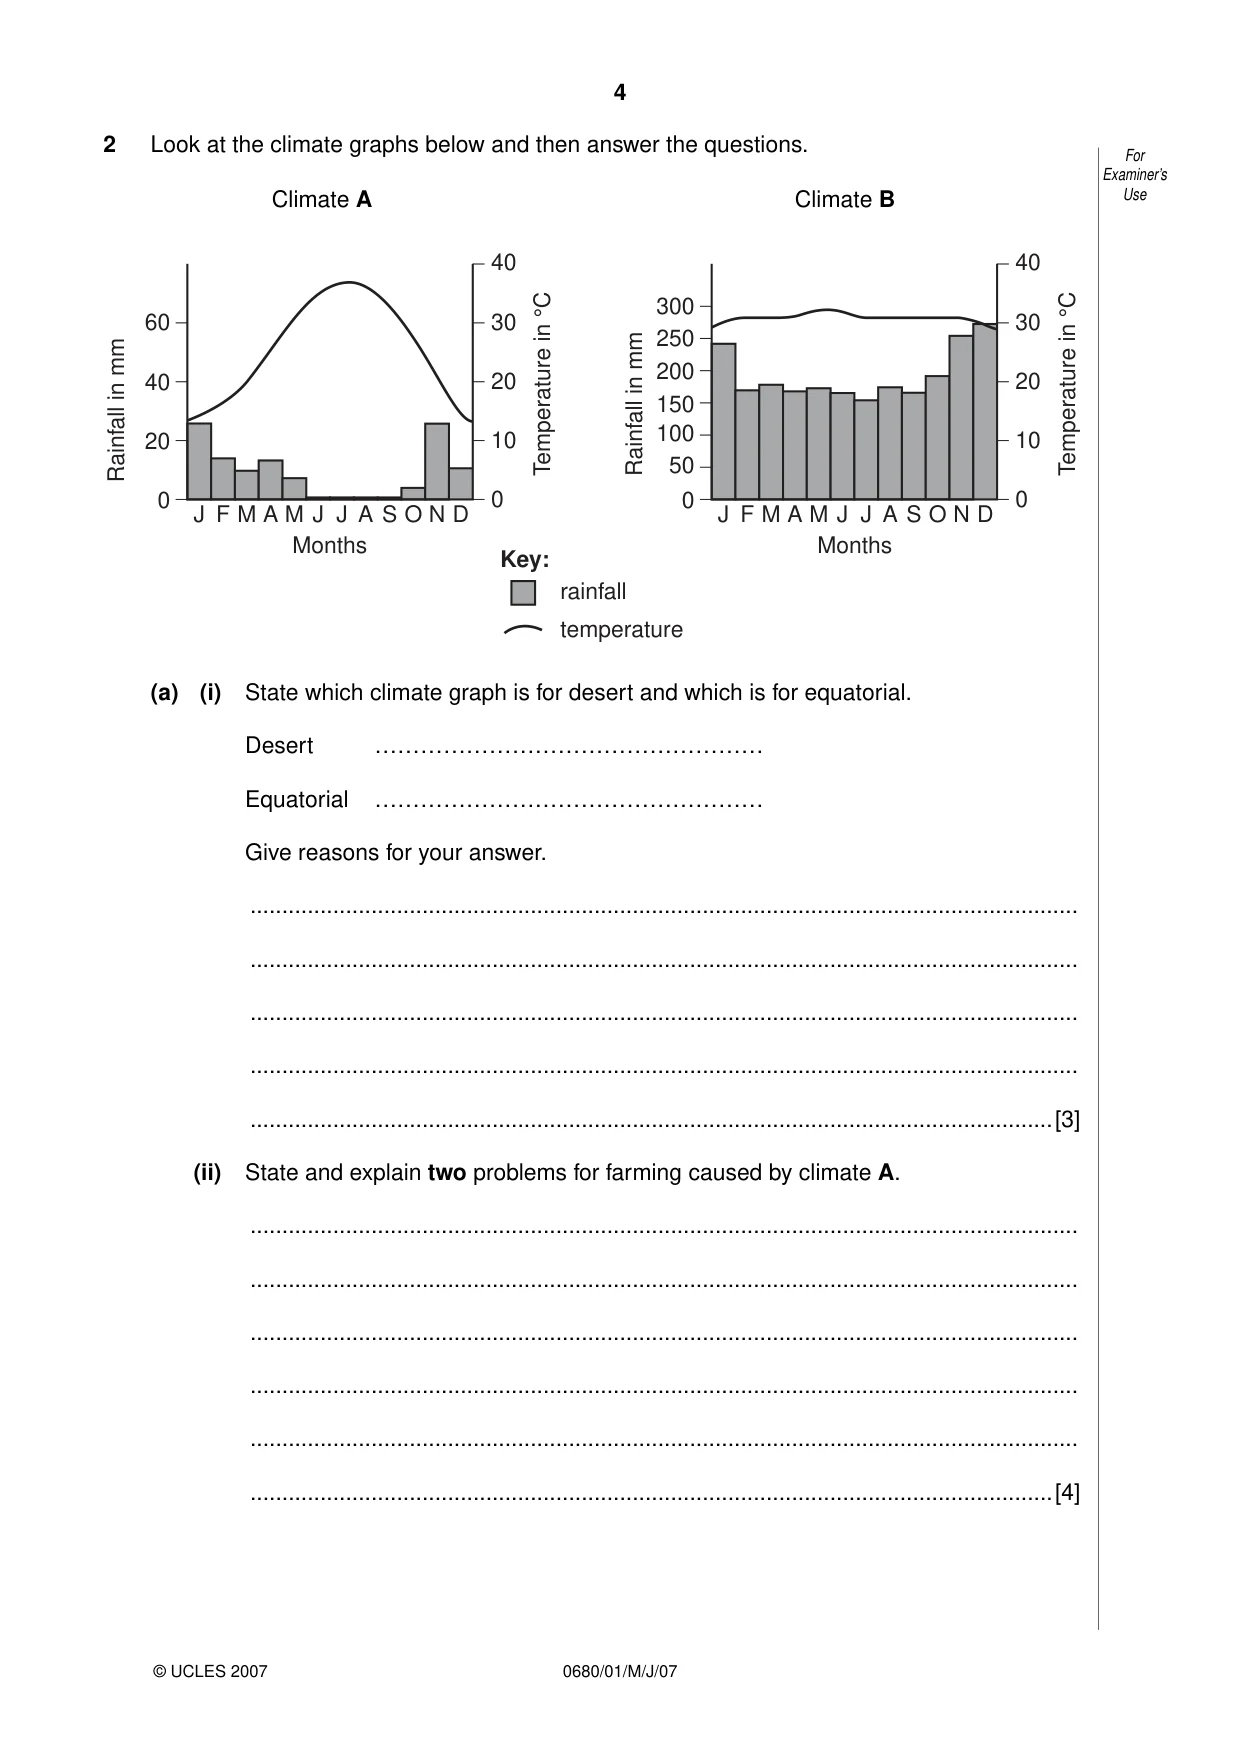
4 0680/01/M/J/07 For Examiner’s Use © UCLES 2007 2 Look at the climate graphs below and then answer the questions. Climate A Climate B 0 20 40 60 10 20 0 30 40 J F M A M J J A S O N D Rainfall in mm Temperature in °C 10 20 0 30 40 J F M A M J J A S O N D Rainfall in mm Temperature in °C 0 100 150 50 200 250 300 Months Months Key: rainfall temperature (a) (i) State which climate graph is for desert and which is for equatorial. Desert …………………………………………… Equatorial …………………………………………… Give reasons for your answer. … … … … …[3] (ii) State and explain two problems for farming caused by climate A. … … … … … …[4]
Question paper, page 5
5 0680/01/M/J/07 [Turn over For Examiner’s Use © UCLES 2007 (b) Farmers also experience problems caused by pests and weeds. How can they control these? … … … …[3] [Total: 10]
Question paper, page 6
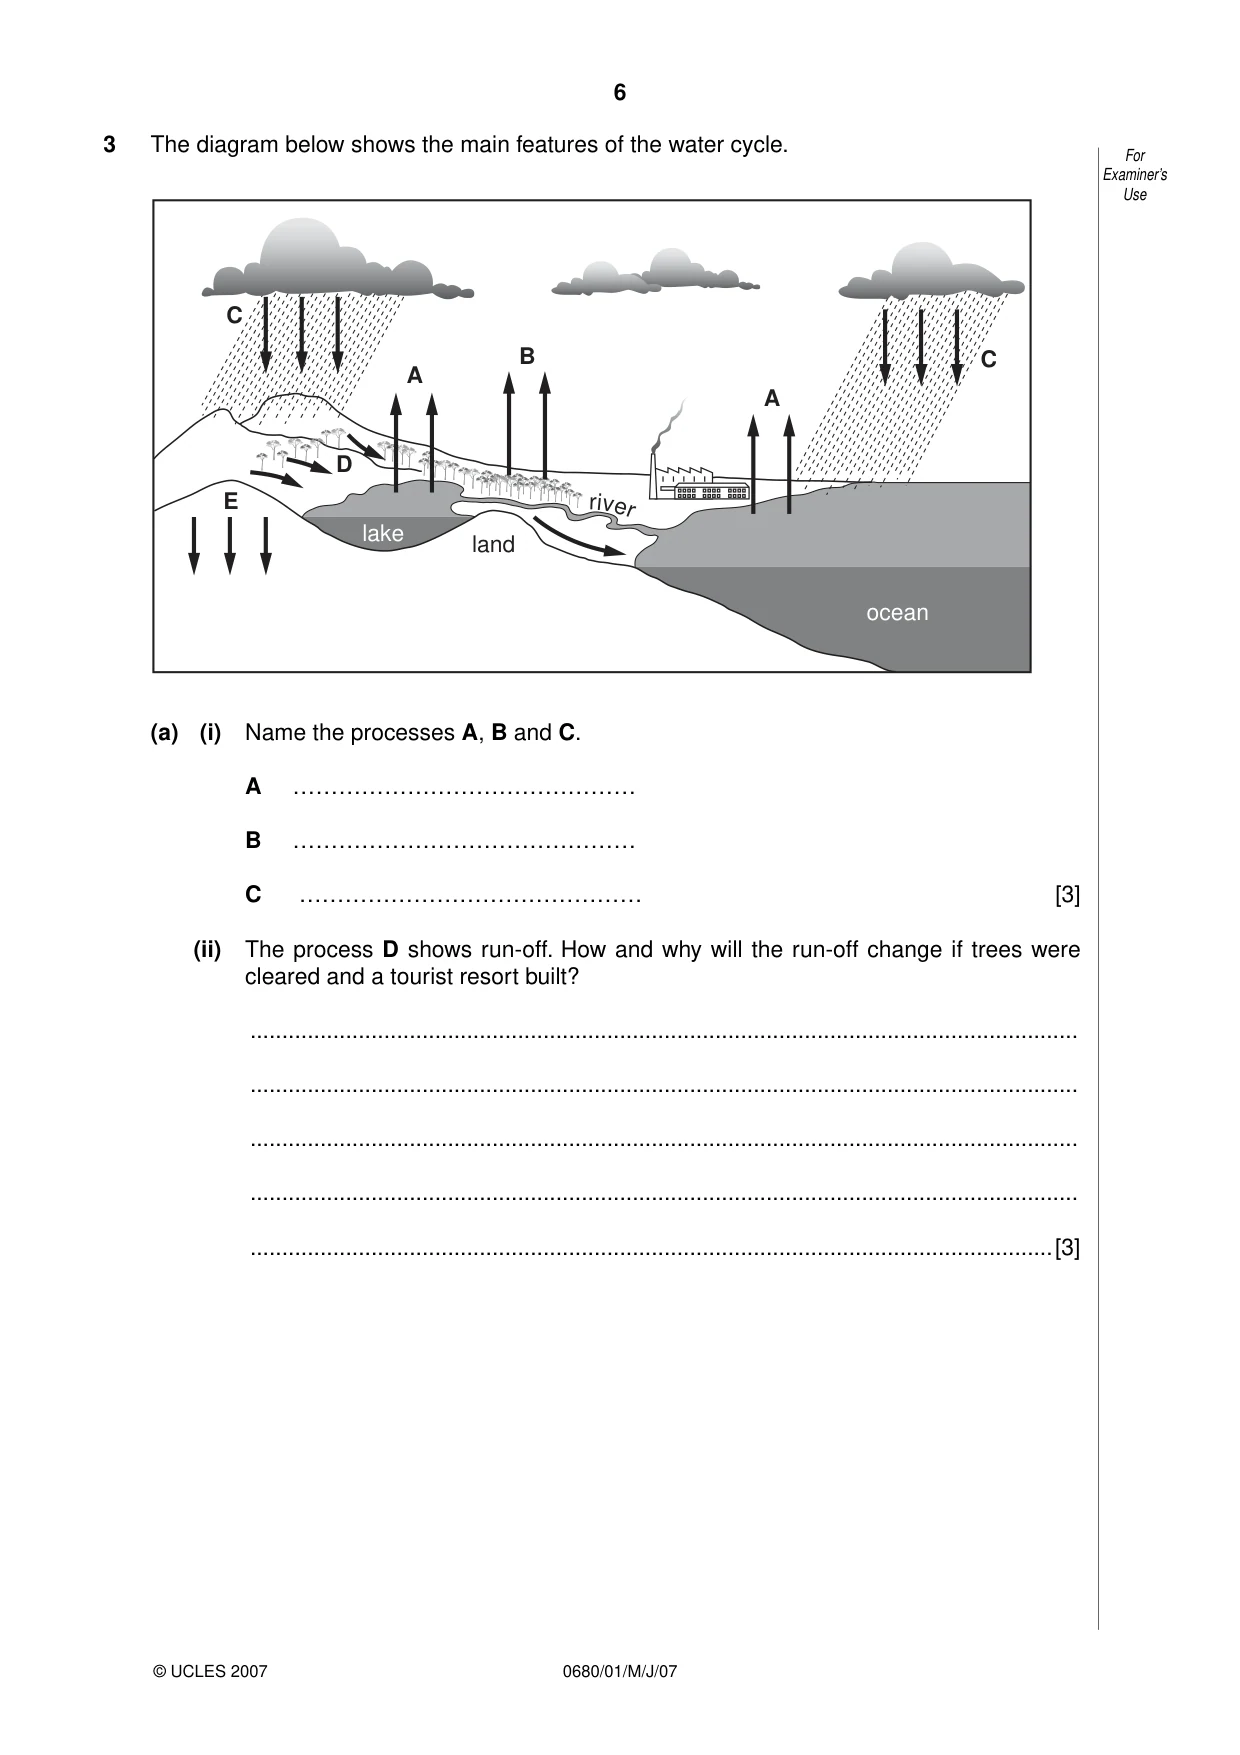
6 0680/01/M/J/07 For Examiner’s Use © UCLES 2007 3 The diagram below shows the main features of the water cycle. C A B A C E D lake land ocean r i v e r (a) (i) Name the processes A, B and C. A ……………………………………… B ……………………………………… C ……………………………………… [3] (ii) The process D shows run-off. How and why will the run-off change if trees were cleared and a tourist resort built? … … … … …[3]
Question paper, page 7
7 0680/01/M/J/07 [Turn over For Examiner’s Use © UCLES 2007 (b) (i) People use water for a variety of purposes. State one domestic and one industrial use of water, apart from drinking. … … …[2] (ii) Sometimes water supplies are adequate, but not safe. Describe one way in which the quality of water supplied to people might be improved. … … …[2] [Total: 10]
Question paper, page 8
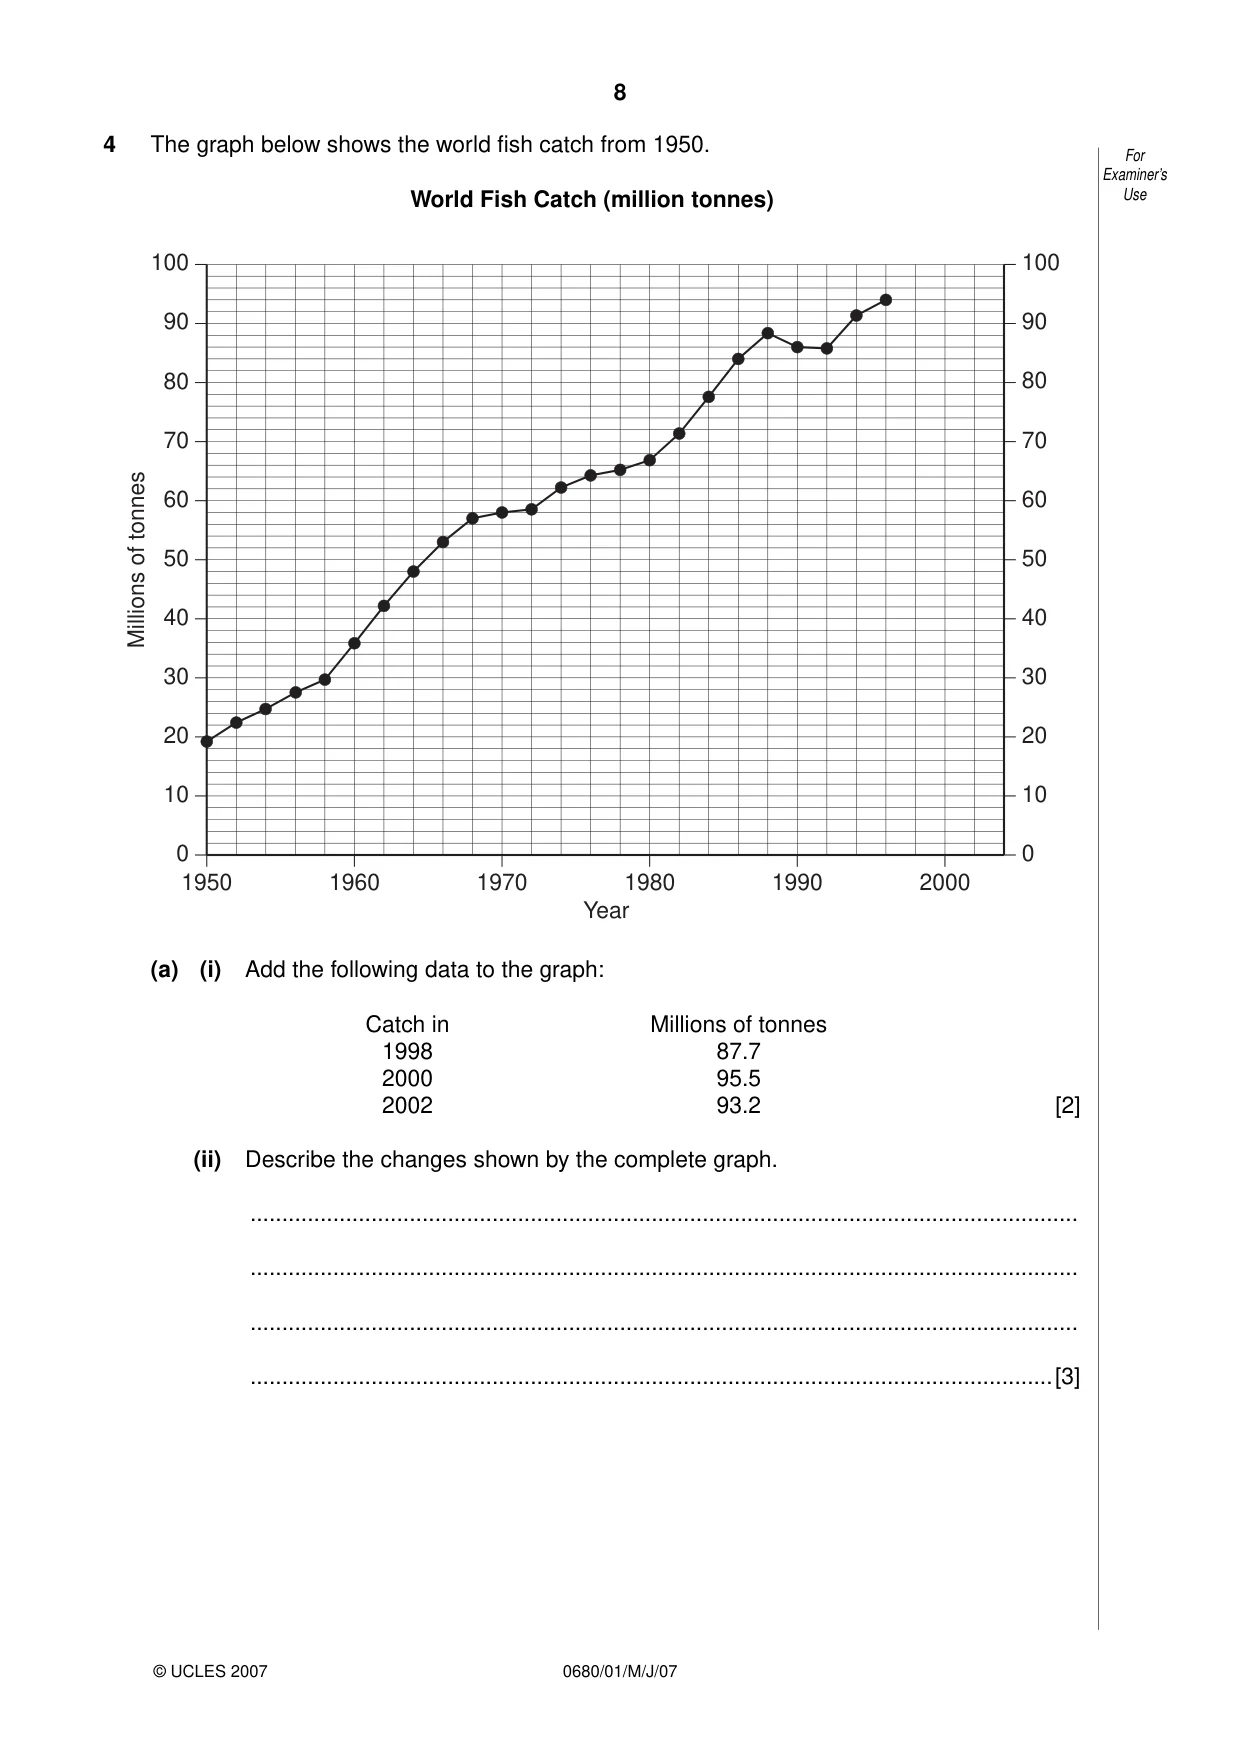
8 0680/01/M/J/07 For Examiner’s Use © UCLES 2007 4 The graph below shows the world fish catch from 1950. World Fish Catch (million tonnes) 1950 1960 1970 1980 1990 2000 0 10 20 30 40 50 60 70 80 90 100 0 10 20 30 40 50 60 70 80 90 100 Year Millions of tonnes (a) (i) Add the following data to the graph: Catch in Millions of tonnes 1998 87.7 2000 95.5 2002 93.2 [2] (ii) Describe the changes shown by the complete graph. … … … …[3]
Question paper, page 9
9 0680/01/M/J/07 [Turn over For Examiner’s Use © UCLES 2007 (b) One of the possible reasons for change in fish catches is marine pollution. (i) State two causes of marine pollution. … … …[2] (ii) How might governments reduce the pollution problems you have named? … … … …[3] [Total: 10]
Question paper, page 10
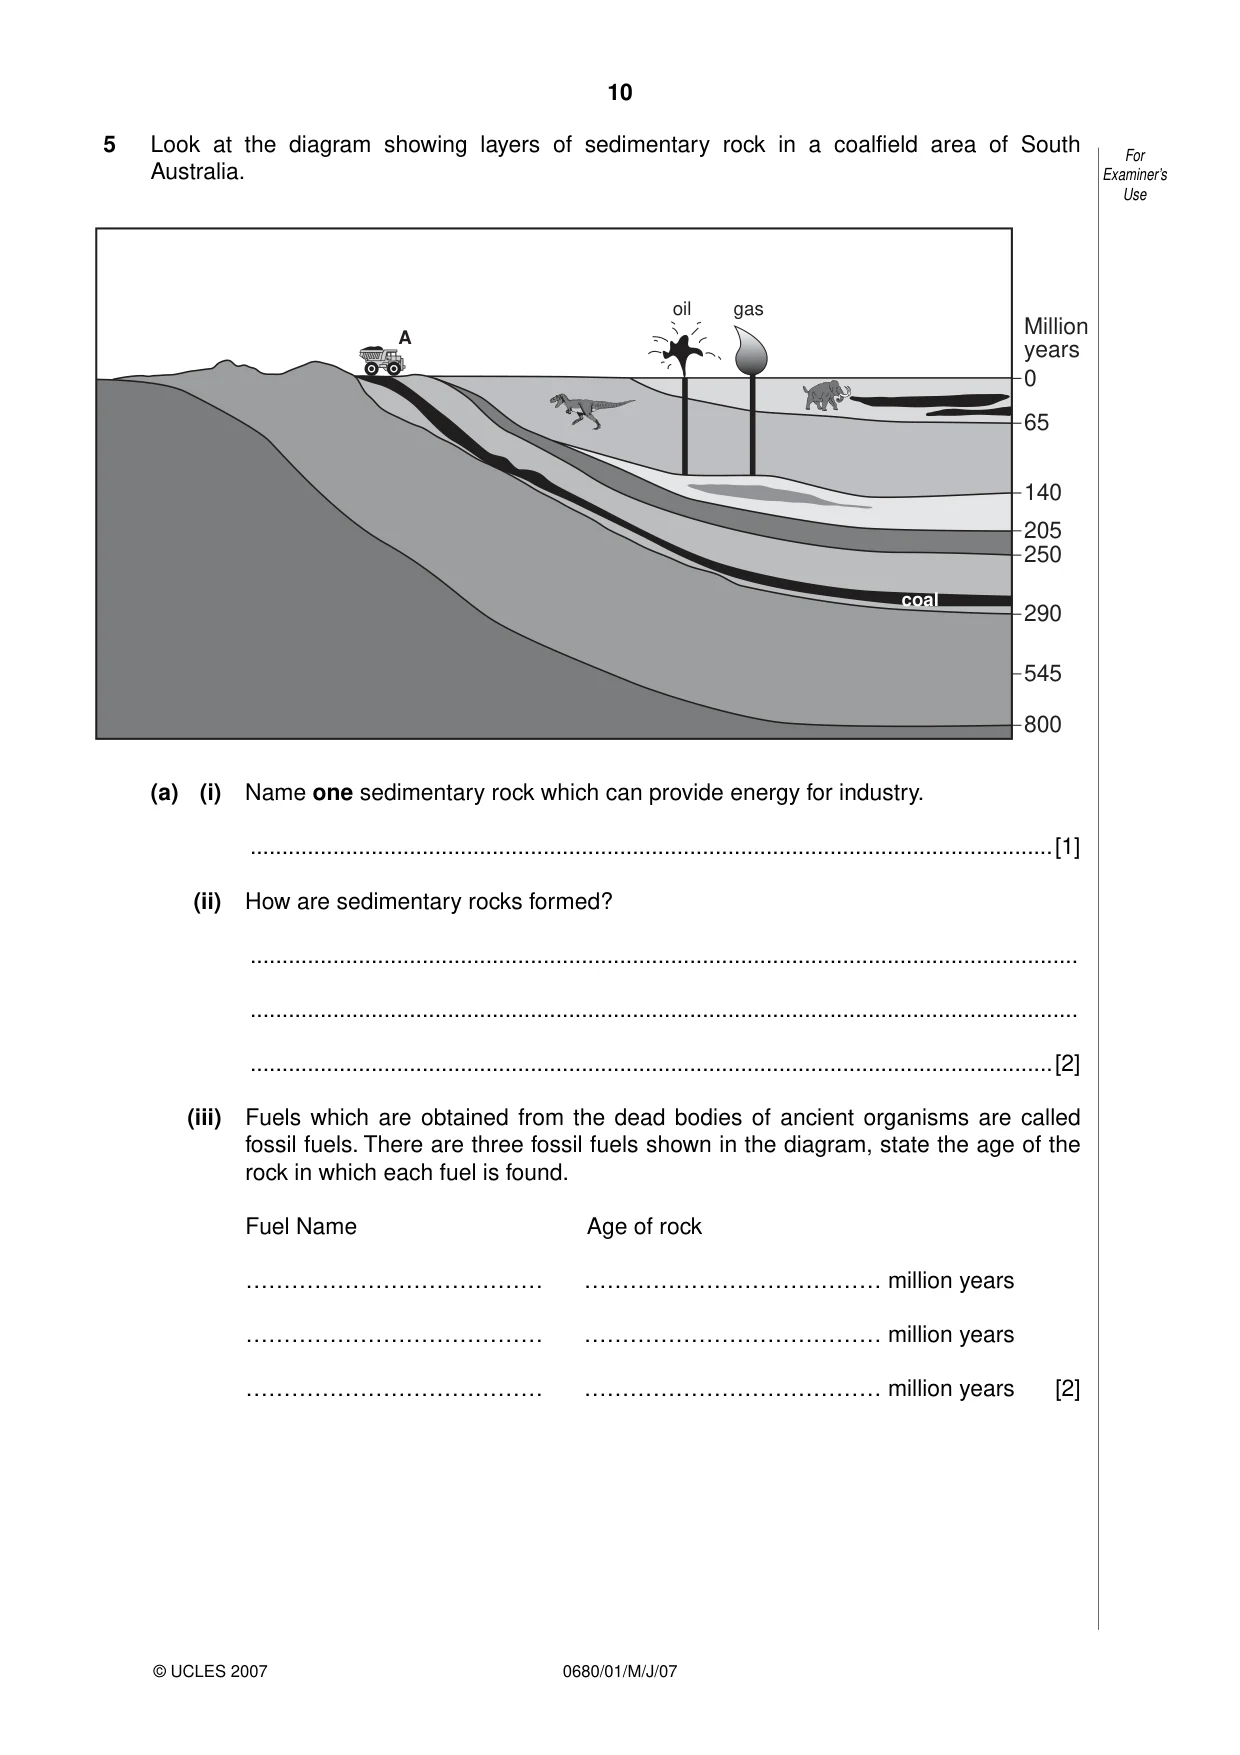
10 0680/01/M/J/07 For Examiner’s Use © UCLES 2007 5 Look at the diagram showing layers of sedimentary rock in a coalfield area of South Australia. 800 545 290 250 205 140 65 0 Million years coal oil gas A (a) (i) Name one sedimentary rock which can provide energy for industry. …[1] (ii) How are sedimentary rocks formed? … … …[2] (iii) Fuels which are obtained from the dead bodies of ancient organisms are called fossil fuels. There are three fossil fuels shown in the diagram, state the age of the rock in which each fuel is found. Fuel Name Age of rock ………………………………… ………………………………… million years ………………………………… ………………………………… million years ………………………………… ………………………………… million years [2]
Question paper, page 11
11 0680/01/M/J/07 [Turn over For Examiner’s Use © UCLES 2007 (b) (i) The coalmine at point A is an opencast one. State two ways in which people living nearby might be affected by opencast mining. … … …[2] (ii) Describe how damage to the environment might be repaired when the opencast mine has stopped working. … … … … …[3] [Total: 10]
Question paper, page 12
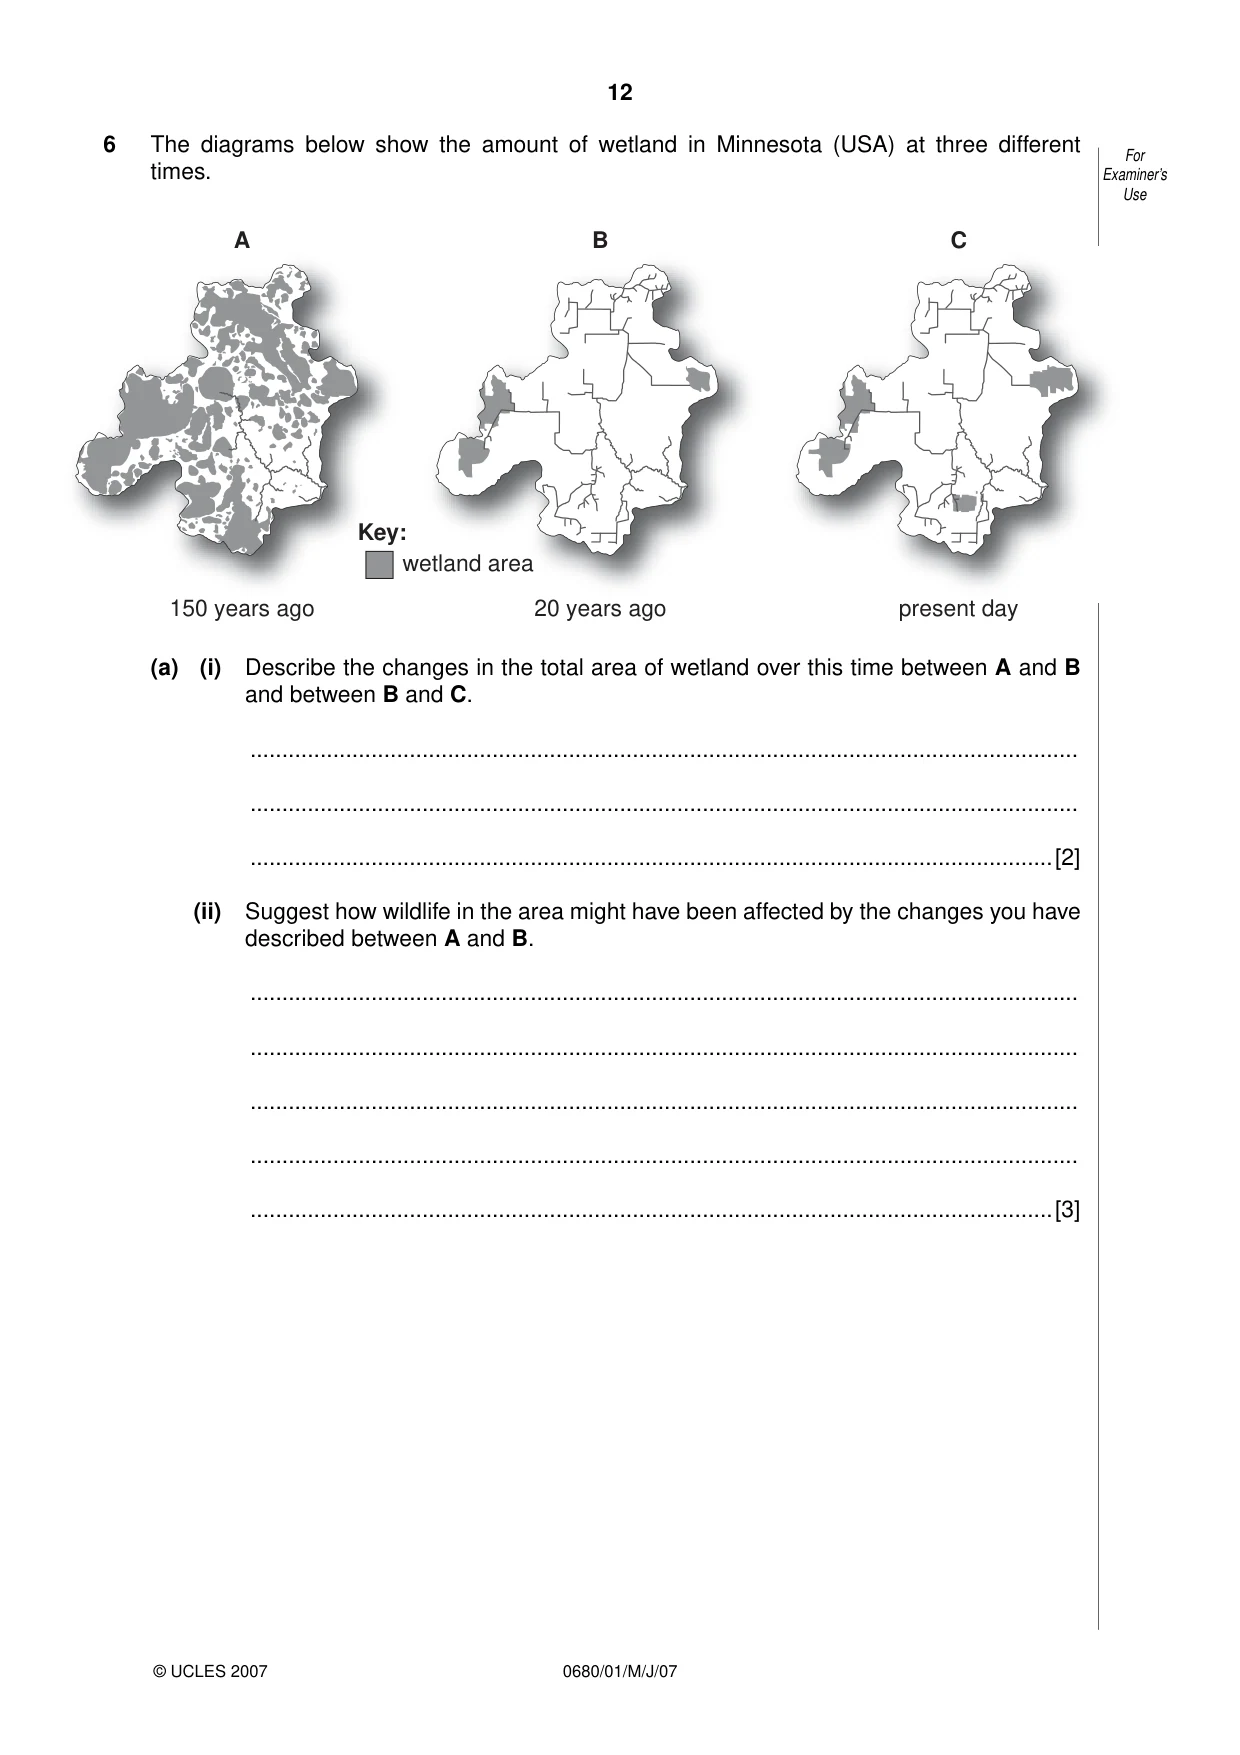
12 0680/01/M/J/07 For Examiner’s Use © UCLES 2007 6 The diagrams below show the amount of wetland in Minnesota (USA) at three different times. 150 years ago 20 years ago present day A B C wetland area Key: (a) (i) Describe the changes in the total area of wetland over this time between A and B and between B and C. … … …[2] (ii) Suggest how wildlife in the area might have been affected by the changes you have described between A and B. … … … … …[3]
Question paper, page 13
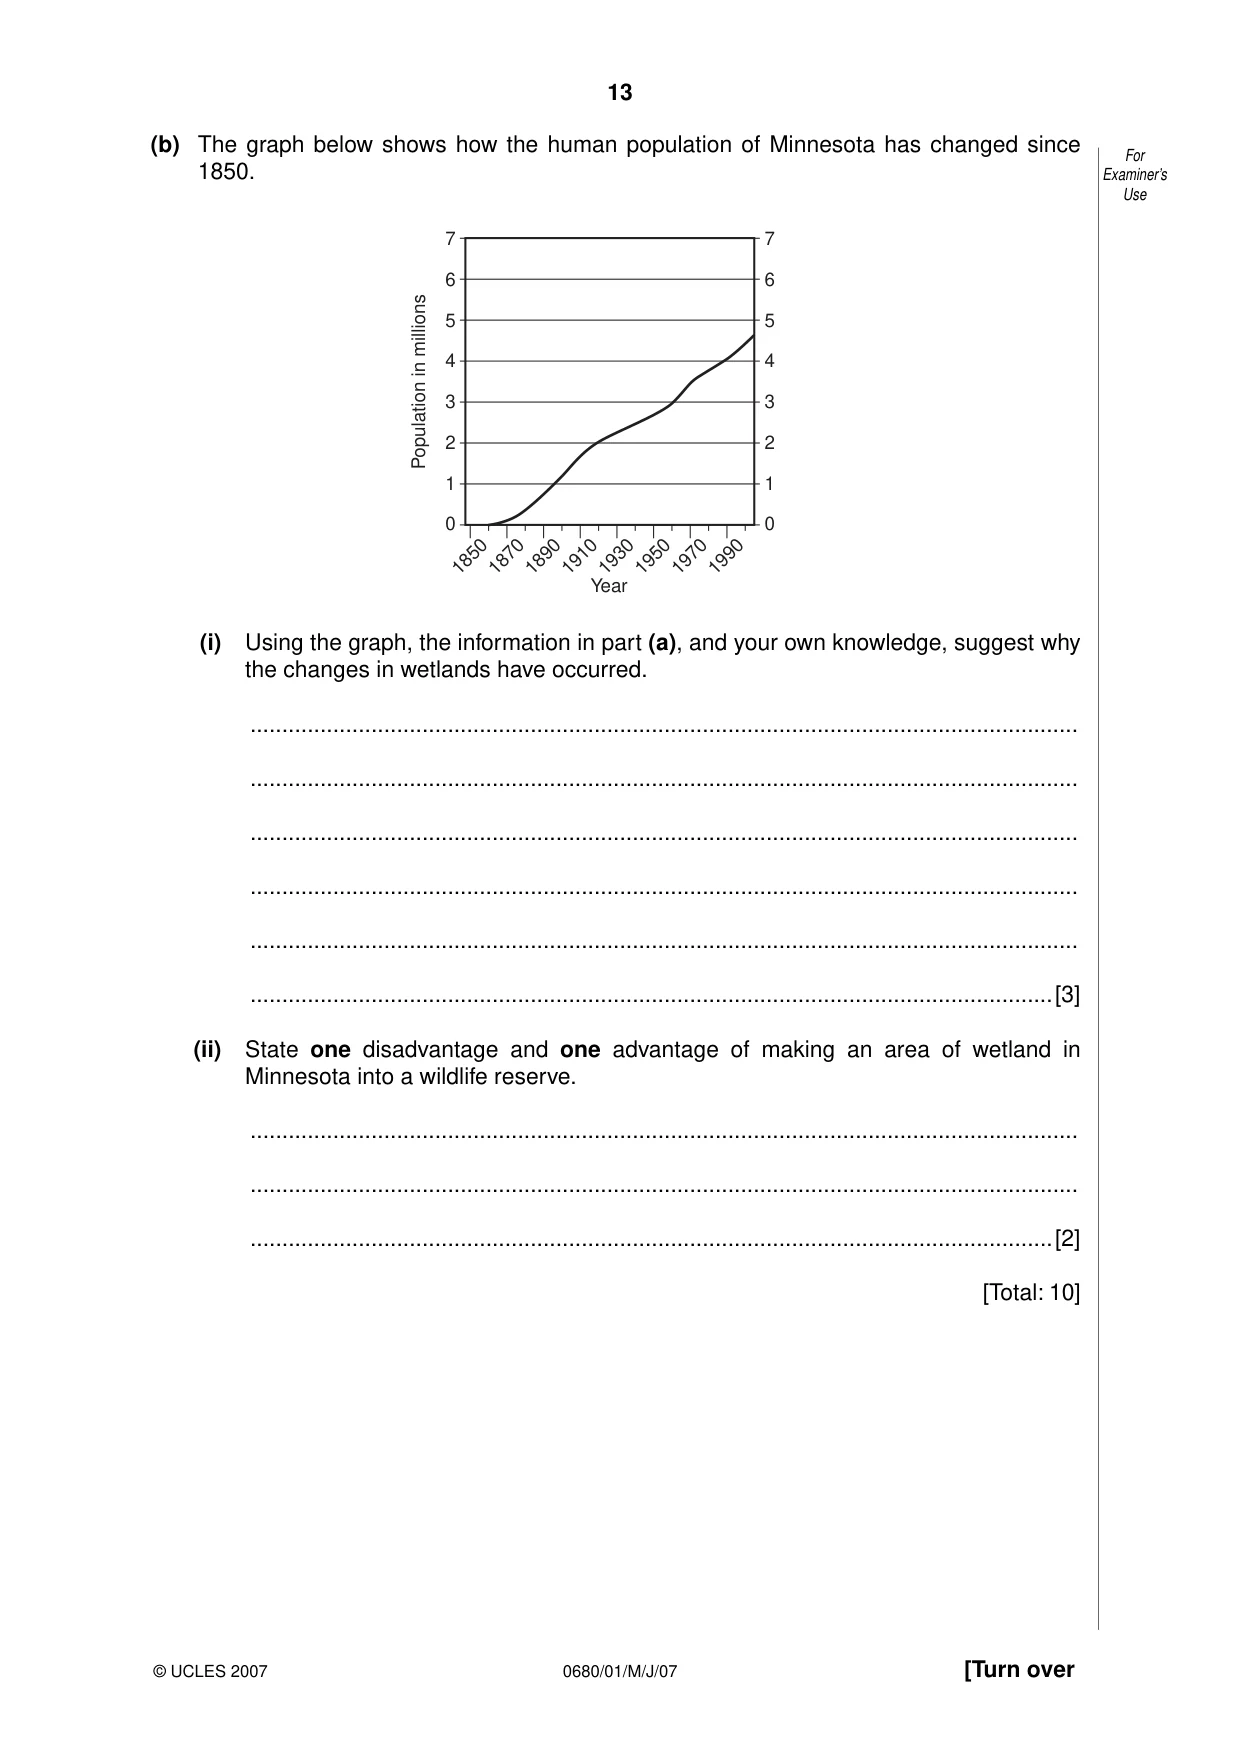
13 0680/01/M/J/07 [Turn over For Examiner’s Use © UCLES 2007 (b) The graph below shows how the human population of Minnesota has changed since 1850. 1850 1870 1890 1910 1930 1950 1970 1990 0 1 2 3 4 5 6 7 0 1 2 3 4 5 6 7 Year Population in millions (i) Using the graph, the information in part (a), and your own knowledge, suggest why the changes in wetlands have occurred. … … … … … …[3] (ii) State one disadvantage and one advantage of making an area of wetland in Minnesota into a wildlife reserve. … … …[2] [Total: 10]
Question paper, page 16
16 0680/01/M/J/07 BLANK PAGE Copyright Acknowledgements: Question 1 G. Skinner © UCLES. Question 4 © http://www.earth-policy.org/Indicators/Fish/Fish_data.htm#table1 Permission to reproduce items where third-party owned material protected by copyright is included has been sought and cleared where possible. Every reasonable effort has been made by the publisher (UCLES) to trace copyright holders, but if any items requiring clearance have unwittingly been included, the publisher will be pleased to make amends at the earliest possible opportunity. University of Cambridge International Examinations is part of the University of Cambridge Local Examinations Syndicate (UCLES), which is itself a department of the University of Cambridge.
Mark scheme, page 1
UNIVERSITY OF CAMBRIDGE INTERNATIONAL EXAMINATIONS International General Certificate of Secondary Education MARK SCHEME for the May/June 2007 question paper 0680 ENVIRONMENTAL MANAGEMENT 0680/01 Paper 1, maximum raw mark 60 This mark scheme is published as an aid to teachers and candidates, to indicate the requirements of the examination. It shows the basis on which Examiners were instructed to award marks. It does not indicate the details of the discussions that took place at an Examiners’ meeting before marking began. All Examiners are instructed that alternative correct answers and unexpected approaches in candidates’ scripts must be given marks that fairly reflect the relevant knowledge and skills demonstrated. Mark schemes must be read in conjunction with the question papers and the report on the examination. • CIE will not enter into discussions or correspondence in connection with these mark schemes. CIE is publishing the mark schemes for the May/June 2007 question papers for most IGCSE, GCE Advanced Level and Advanced Subsidiary Level syllabuses and some Ordinary Level syllabuses. www.XtremePapers.com
Mark scheme, page 2
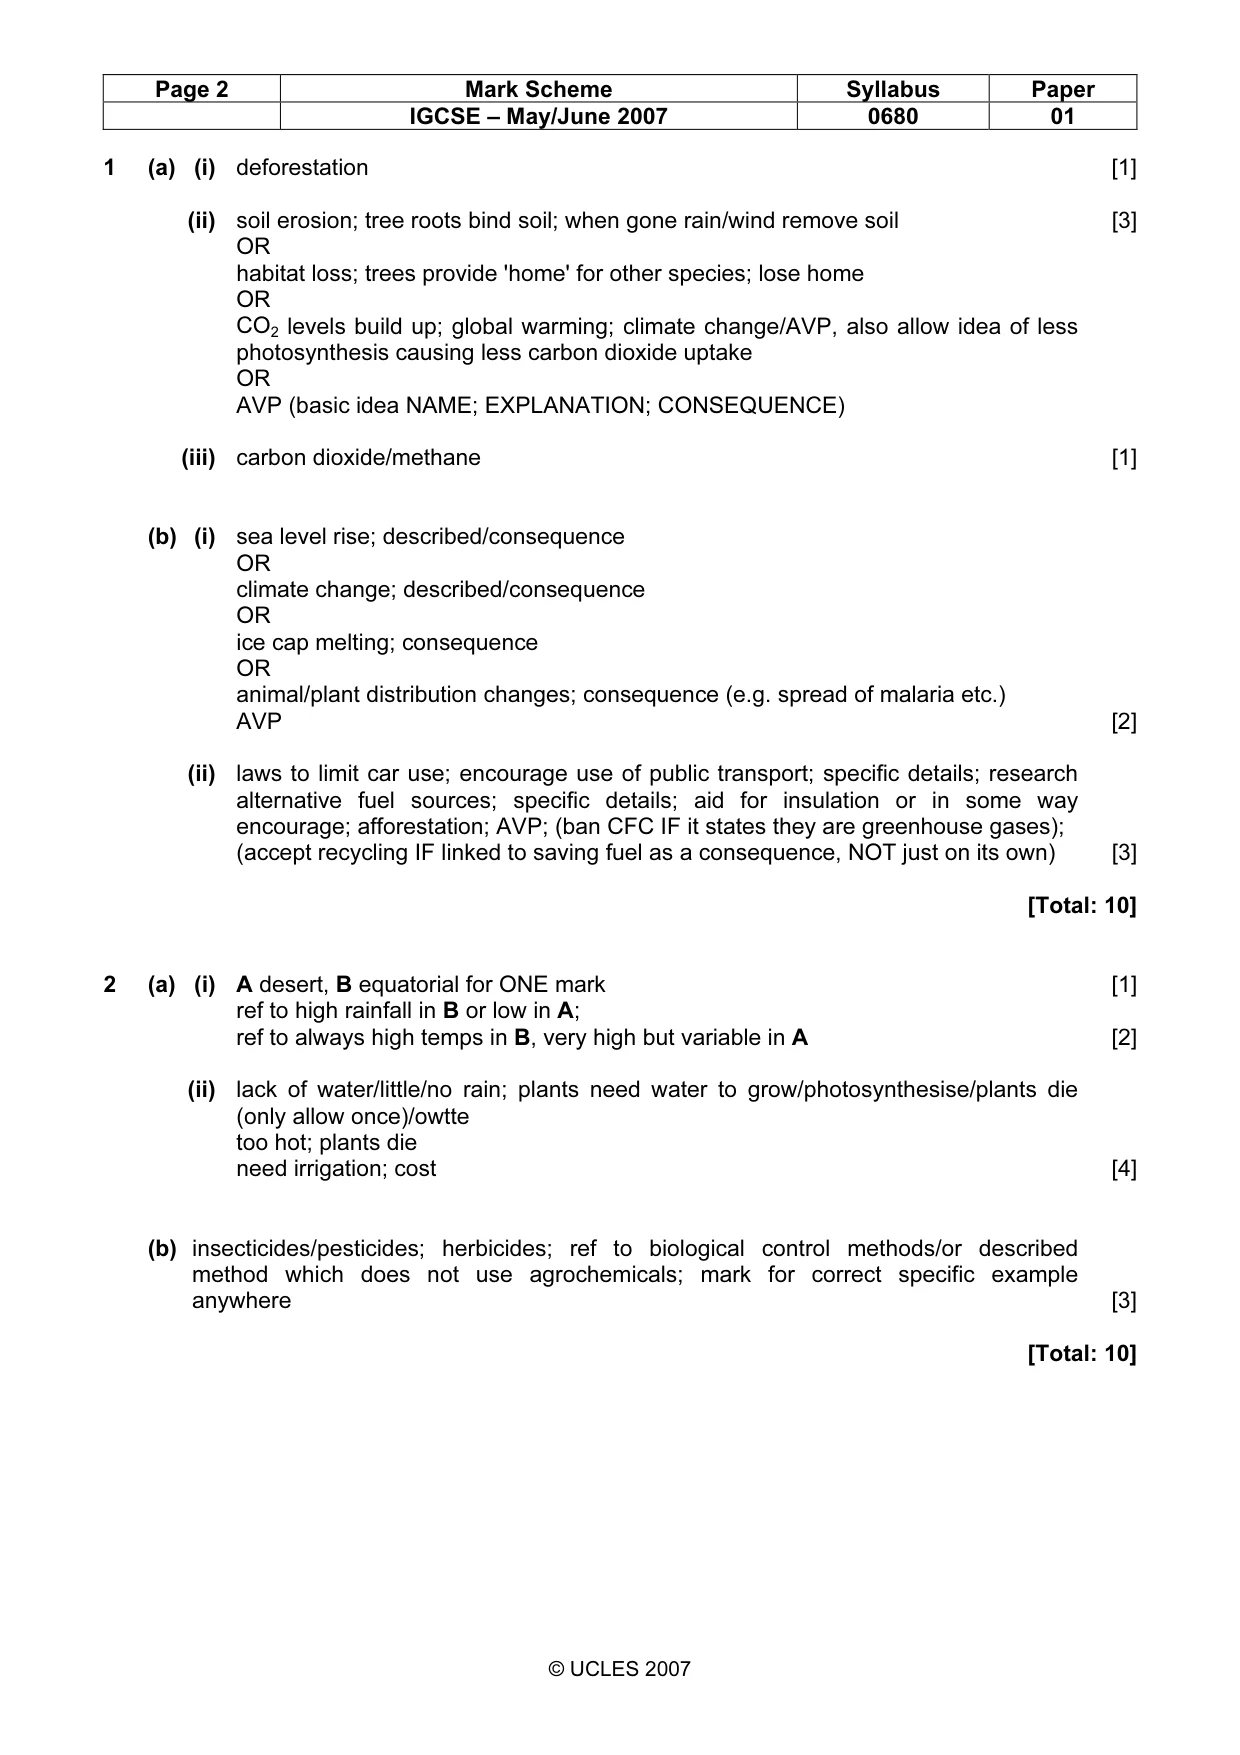
Page 2 Mark Scheme Syllabus Paper IGCSE – May/June 2007 0680 01 © UCLES 2007 1 (a) (i) deforestation [1] (ii) soil erosion; tree roots bind soil; when gone rain/wind remove soil [3] OR habitat loss; trees provide 'home' for other species; lose home OR CO2 levels build up; global warming; climate change/AVP, also allow idea of less photosynthesis causing less carbon dioxide uptake OR AVP (basic idea NAME; EXPLANATION; CONSEQUENCE) (iii) carbon dioxide/methane [1] (b) (i) sea level rise; described/consequence OR climate change; described/consequence OR ice cap melting; consequence OR animal/plant distribution changes; consequence (e.g. spread of malaria etc.) AVP [2] (ii) laws to limit car use; encourage use of public transport; specific details; research alternative fuel sources; specific details; aid for insulation or in some way encourage; afforestation; AVP; (ban CFC IF it states they are greenhouse gases); (accept recycling IF linked to saving fuel as a consequence, NOT just on its own) [3] [Total: 10] 2 (a) (i) A desert, B equatorial for ONE mark [1] ref to high rainfall in B or low in A; ref to always high temps in B, very high but variable in A [2] (ii) lack of water/little/no rain; plants need water to grow/photosynthesise/plants die (only allow once)/owtte too hot; plants die need irrigation; cost [4] (b) insecticides/pesticides; herbicides; ref to biological control methods/or described method which does not use agrochemicals; mark for correct specific example anywhere [3] [Total: 10]
Mark scheme, page 3
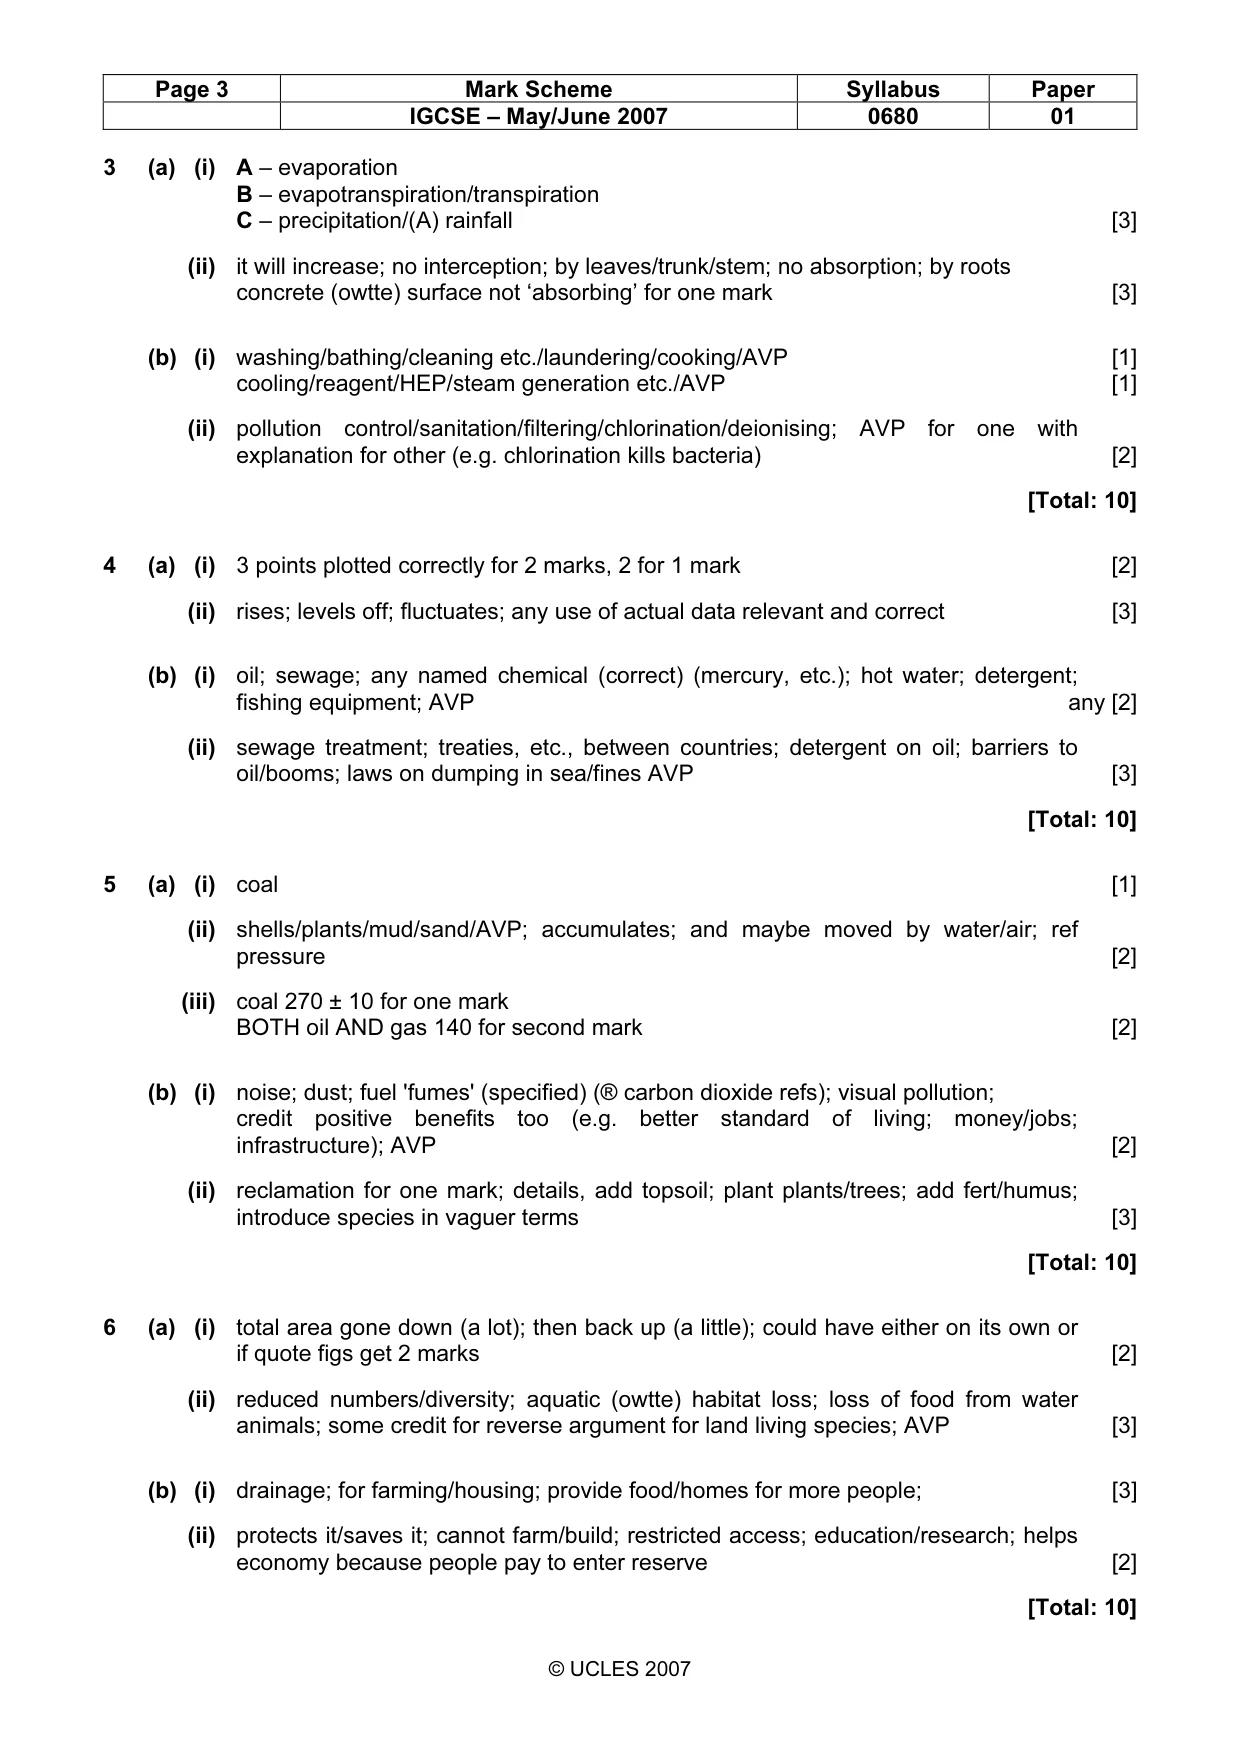
Page 3 Mark Scheme Syllabus Paper IGCSE – May/June 2007 0680 01 © UCLES 2007 3 (a) (i) A – evaporation B – evapotranspiration/transpiration C – precipitation/(A) rainfall [3] (ii) it will increase; no interception; by leaves/trunk/stem; no absorption; by roots concrete (owtte) surface not ‘absorbing’ for one mark [3] (b) (i) washing/bathing/cleaning etc./laundering/cooking/AVP [1] cooling/reagent/HEP/steam generation etc./AVP [1] (ii) pollution control/sanitation/filtering/chlorination/deionising; AVP for one with explanation for other (e.g. chlorination kills bacteria) [2] [Total: 10] 4 (a) (i) 3 points plotted correctly for 2 marks, 2 for 1 mark [2] (ii) rises; levels off; fluctuates; any use of actual data relevant and correct [3] (b) (i) oil; sewage; any named chemical (correct) (mercury, etc.); hot water; detergent; fishing equipment; AVP any [2] (ii) sewage treatment; treaties, etc., between countries; detergent on oil; barriers to oil/booms; laws on dumping in sea/fines AVP [3] [Total: 10] 5 (a) (i) coal [1] (ii) shells/plants/mud/sand/AVP; accumulates; and maybe moved by water/air; ref pressure [2] (iii) coal 270 ± 10 for one mark BOTH oil AND gas 140 for second mark [2] (b) (i) noise; dust; fuel 'fumes' (specified) (® carbon dioxide refs); visual pollution; credit positive benefits too (e.g. better standard of living; money/jobs; infrastructure); AVP [2] (ii) reclamation for one mark; details, add topsoil; plant plants/trees; add fert/humus; introduce species in vaguer terms [3] [Total: 10] 6 (a) (i) total area gone down (a lot); then back up (a little); could have either on its own or if quote figs get 2 marks [2] (ii) reduced numbers/diversity; aquatic (owtte) habitat loss; loss of food from water animals; some credit for reverse argument for land living species; AVP [3] (b) (i) drainage; for farming/housing; provide food/homes for more people; [3] (ii) protects it/saves it; cannot farm/build; restricted access; education/research; helps economy because people pay to enter reserve [2] [Total: 10]
What you needed in this session
Cambridge’s own grade thresholds for 2007 May/June, Paper 1 · Variant 1. A higher threshold means an easier paper — the bar moves with how the cohort did.