Cambridge IGCSE Environmental Management 0680 — 2004 May/June Paper 1 · Variant 1
0680/11/M/J/04
The question paper and its mark scheme, free to read here and free to download. This is Cambridge’s own paper, exactly as it was sat.
Question paper12 pages
Mark scheme
No mark scheme is in the library for this paper.
Paper as text
Question paper, page 1
This document consists of 12 printed pages. (DR) S61595/2 © UCLES 2004 [Turn over UNIVERSITY OF CAMBRIDGE INTERNATIONAL EXAMINATIONS International General Certificate of Secondary Education ENVIRONMENTAL MANAGEMENT 0680/01 Paper 1 May/June 2004 1 hour 30 minutes Candidates answer on the Question Paper. Additional Materials: Ruler (cm/mm) READ THESE INSTRUCTIONS FIRST Write your Centre number, candidate number and name on all the work you hand in. Write in dark blue or black pen in the spaces provided on the Question Paper. You may use a soft pencil for any diagrams, graphs or rough working. Do not use staples, paper clips, highlighters, glue or correction fluid. Answer all questions. The number of marks is given in brackets [ ] at the end of each question or part question. Centre Number Candidate Number Name If you have been given a label, look at the details. If any details are incorrect or missing, please fill in your correct details in the space given at the top of this page. Stick your personal label here, if provided. FOR EXAMINER’S USE 1 2 3 4 5 6 TOTAL www.XtremePapers.com
Question paper, page 2
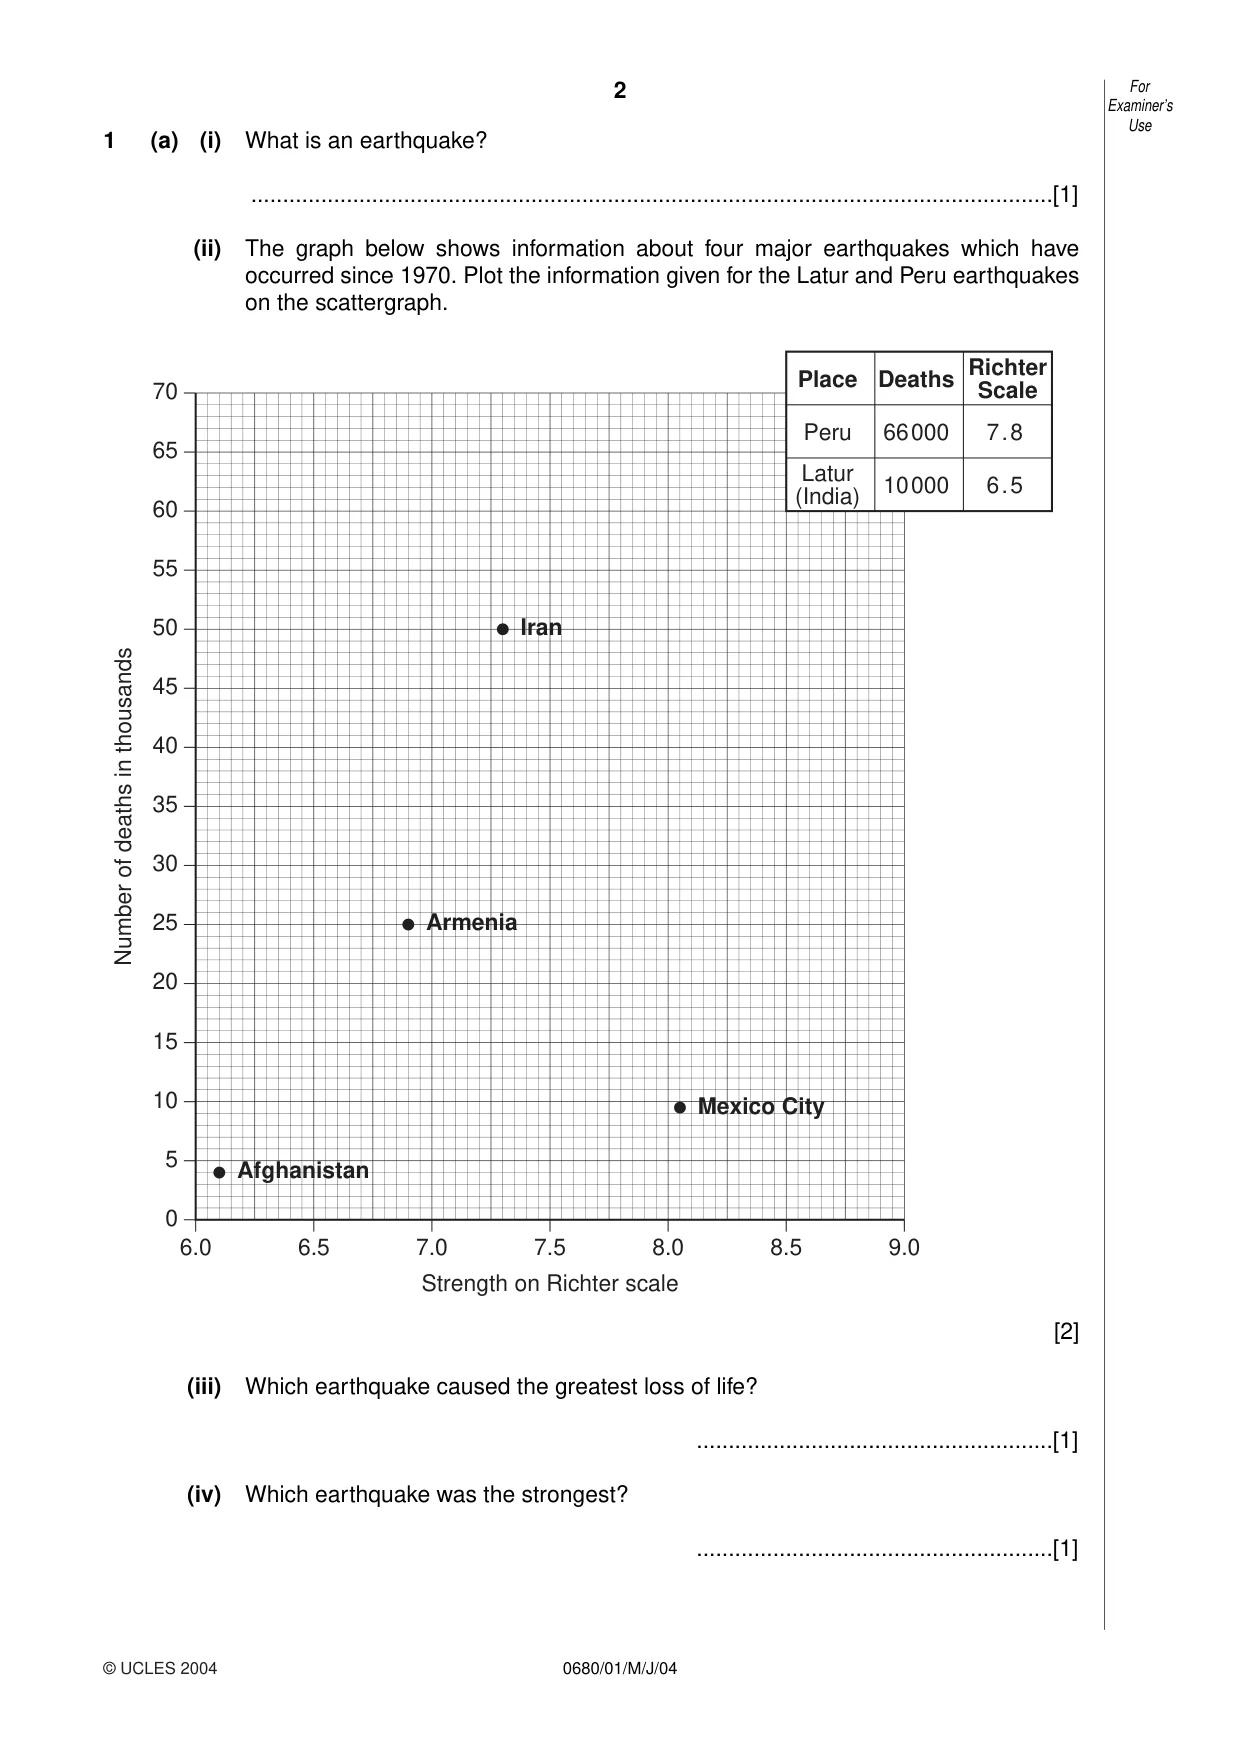
© UCLES 2004 2 0680/01/M/J/04 1 (a) (i) What is an earthquake? …[1] (ii) The graph below shows information about four major earthquakes which have occurred since 1970. Plot the information given for the Latur and Peru earthquakes on the scattergraph. [2] (iii) Which earthquake caused the greatest loss of life? …[1] (iv) Which earthquake was the strongest? …[1] 0 5 10 15 20 25 30 35 40 45 50 55 60 65 70 6.0 6.5 7.0 7.5 8.0 8.5 9.0 Number of deaths in thousands Strength on Richter scale Place Deaths Richter Scale Peru Latur (India) 66000 10000 7.8 6.5 Afghanistan Mexico City Armenia Iran For Examiner’s Use
Question paper, page 3
3 0680/01/M/J/04 [Turn over (b) The strongest earthquakes do not always cause the greatest loss of life. Give two reasons for this. … … … …[2] (c) Describe strategies that governments might adopt to help people prepare for an earthquake. … … … … … …[3] Total [10] For Examiner’s Use © UCLES 2004
Question paper, page 4
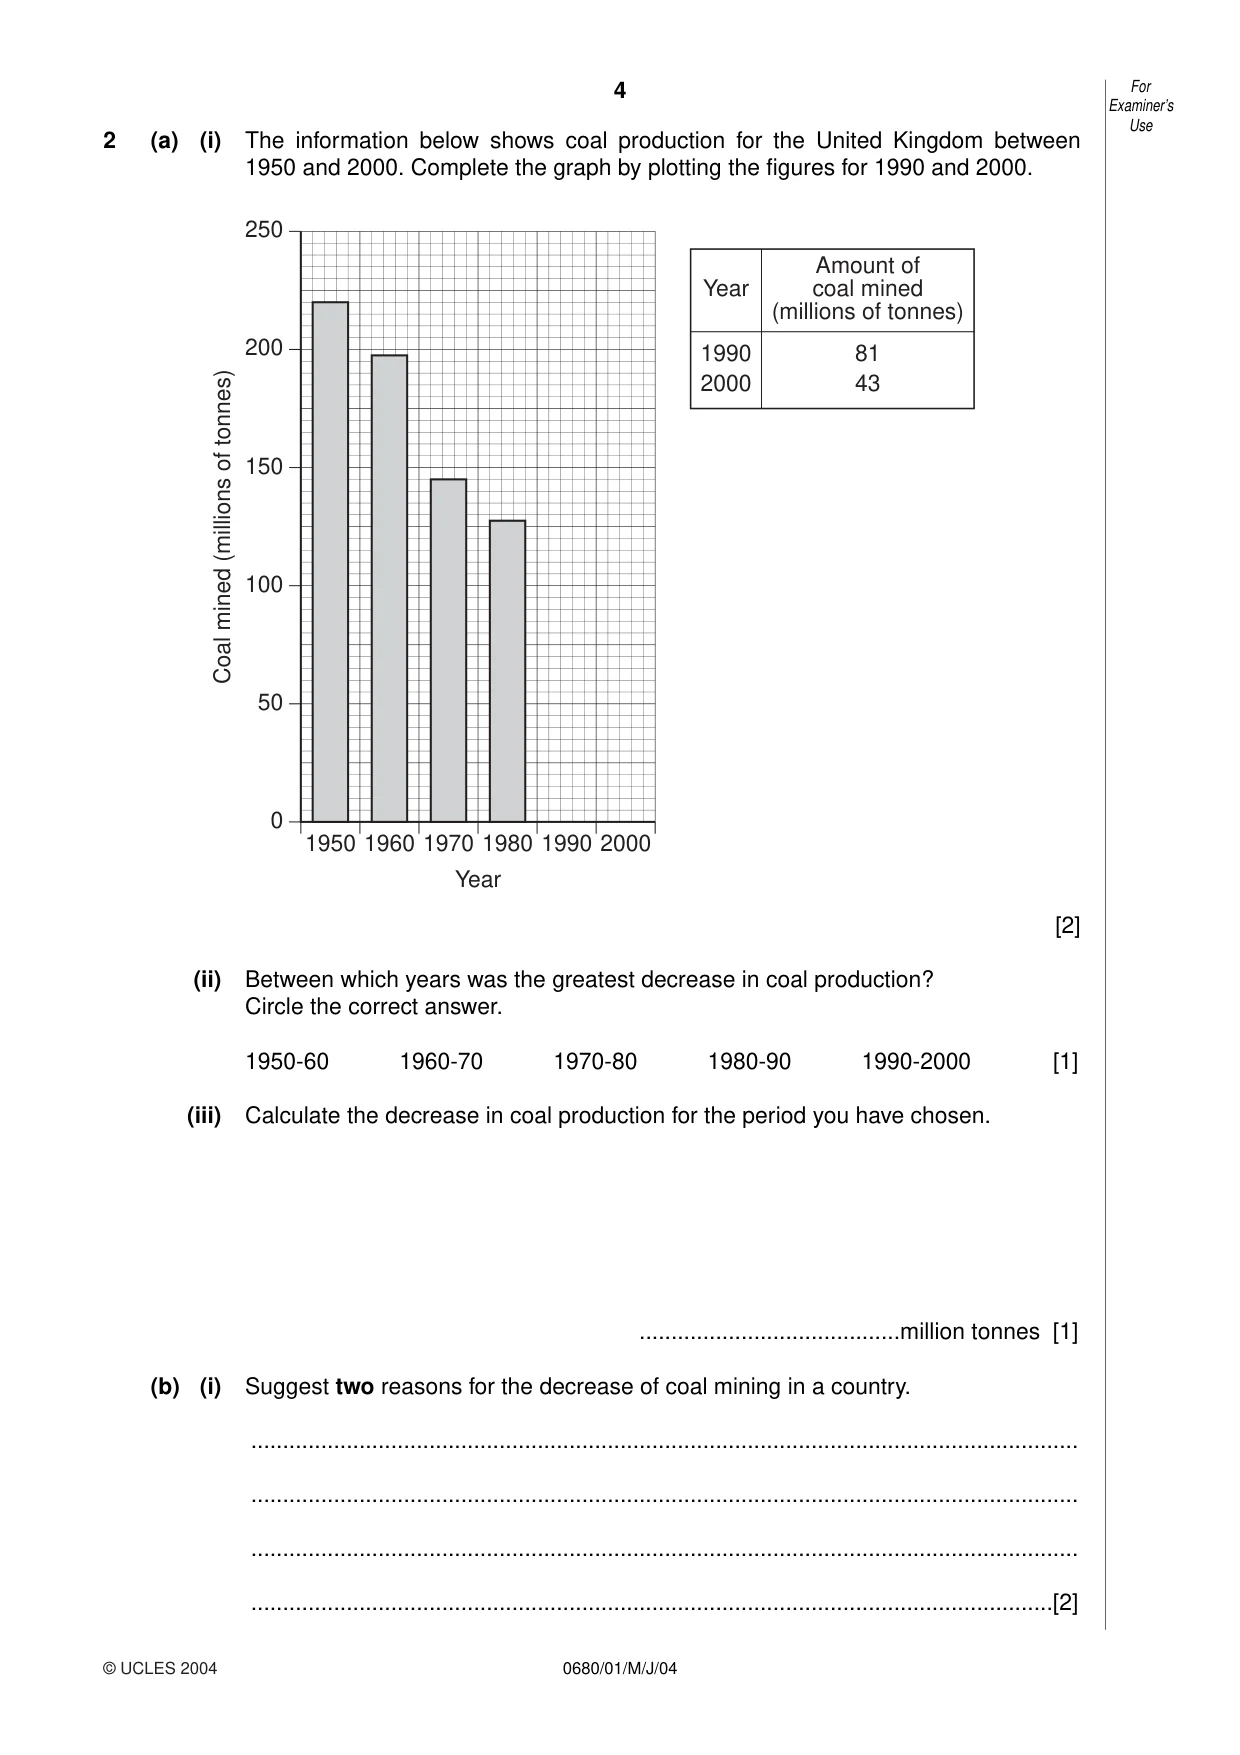
© UCLES 2004 4 0680/01/M/J/04 2 (a) (i) The information below shows coal production for the United Kingdom between 1950 and 2000. Complete the graph by plotting the figures for 1990 and 2000. [2] (ii) Between which years was the greatest decrease in coal production? Circle the correct answer. 1950-60 1960-70 1970-80 1980-90 1990-2000 [1] (iii) Calculate the decrease in coal production for the period you have chosen. …million tonnes [1] (b) (i) Suggest two reasons for the decrease of coal mining in a country. … … … …[2] 1950 1960 1970 1980 1990 2000 0 50 100 150 200 250 Year 1990 2000 Amount of coal mined (millions of tonnes) 81 43 Year Coal mined (millions of tonnes) For Examiner’s Use
Question paper, page 5
5 0680/01/M/J/04 [Turn over (ii) Name two alternative forms of energy that are renewable. …[1] (c) Suggest strategies that would help to conserve non-renewable energy sources. … … … … … …[3] Total [10] For Examiner’s Use © UCLES 2004
Question paper, page 6
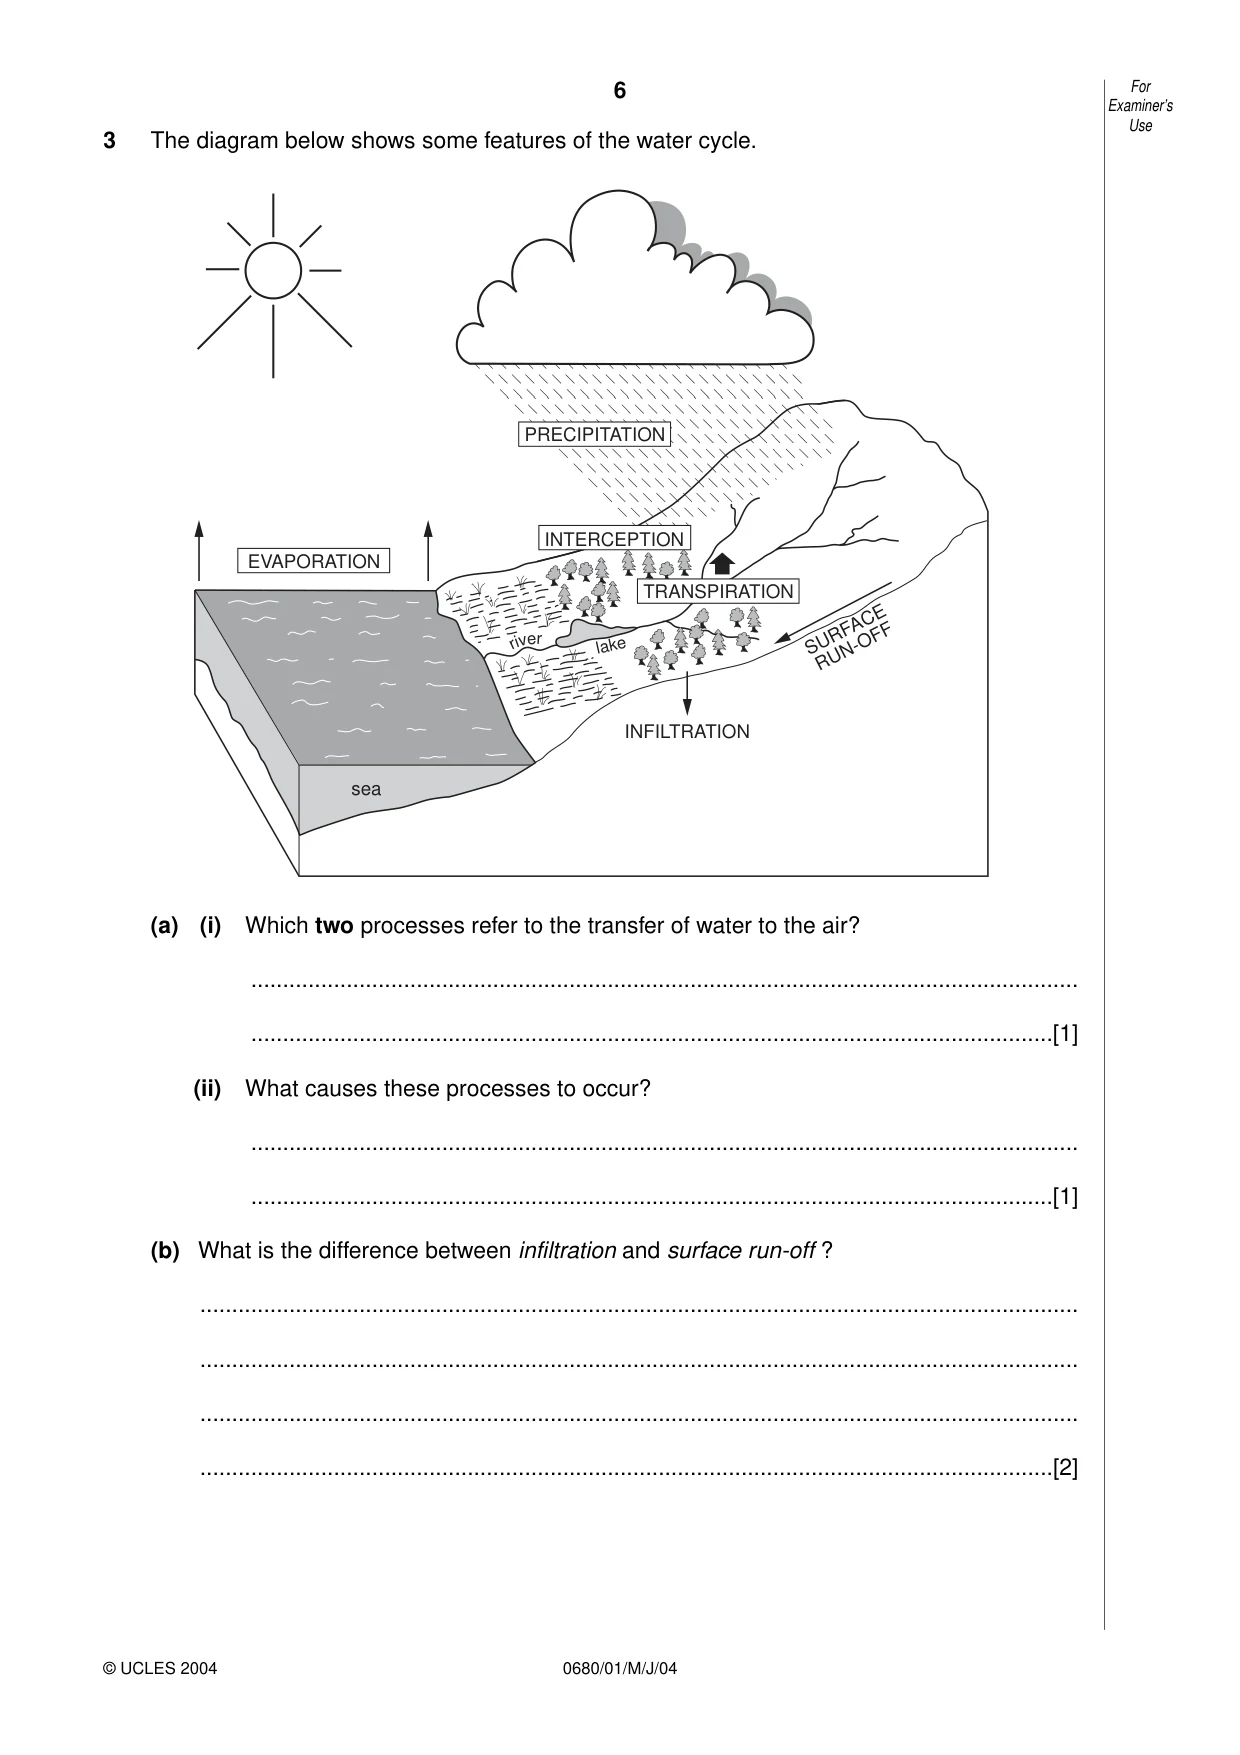
6 0680/01/M/J/04 3 The diagram below shows some features of the water cycle. (a) (i) Which two processes refer to the transfer of water to the air? … …[1] (ii) What causes these processes to occur? … …[1] (b) What is the difference between infiltration and surface run-off ? … … … …[2] PRECIPITATION EVAPORATION TRANSPIRATION INTERCEPTION INFILTRATION SURFACE RUN-OFF sea r i v e r lake For Examiner’s Use © UCLES 2004
Question paper, page 7
7 0680/01/M/J/04 [Turn over (c) What is interception, and how is it changed by deforestation? … … … … … …[3] (d) Explain how building towns and cities increases the risk of flooding. … … … … … …[3] Total [10] For Examiner’s Use © UCLES 2004
Question paper, page 8
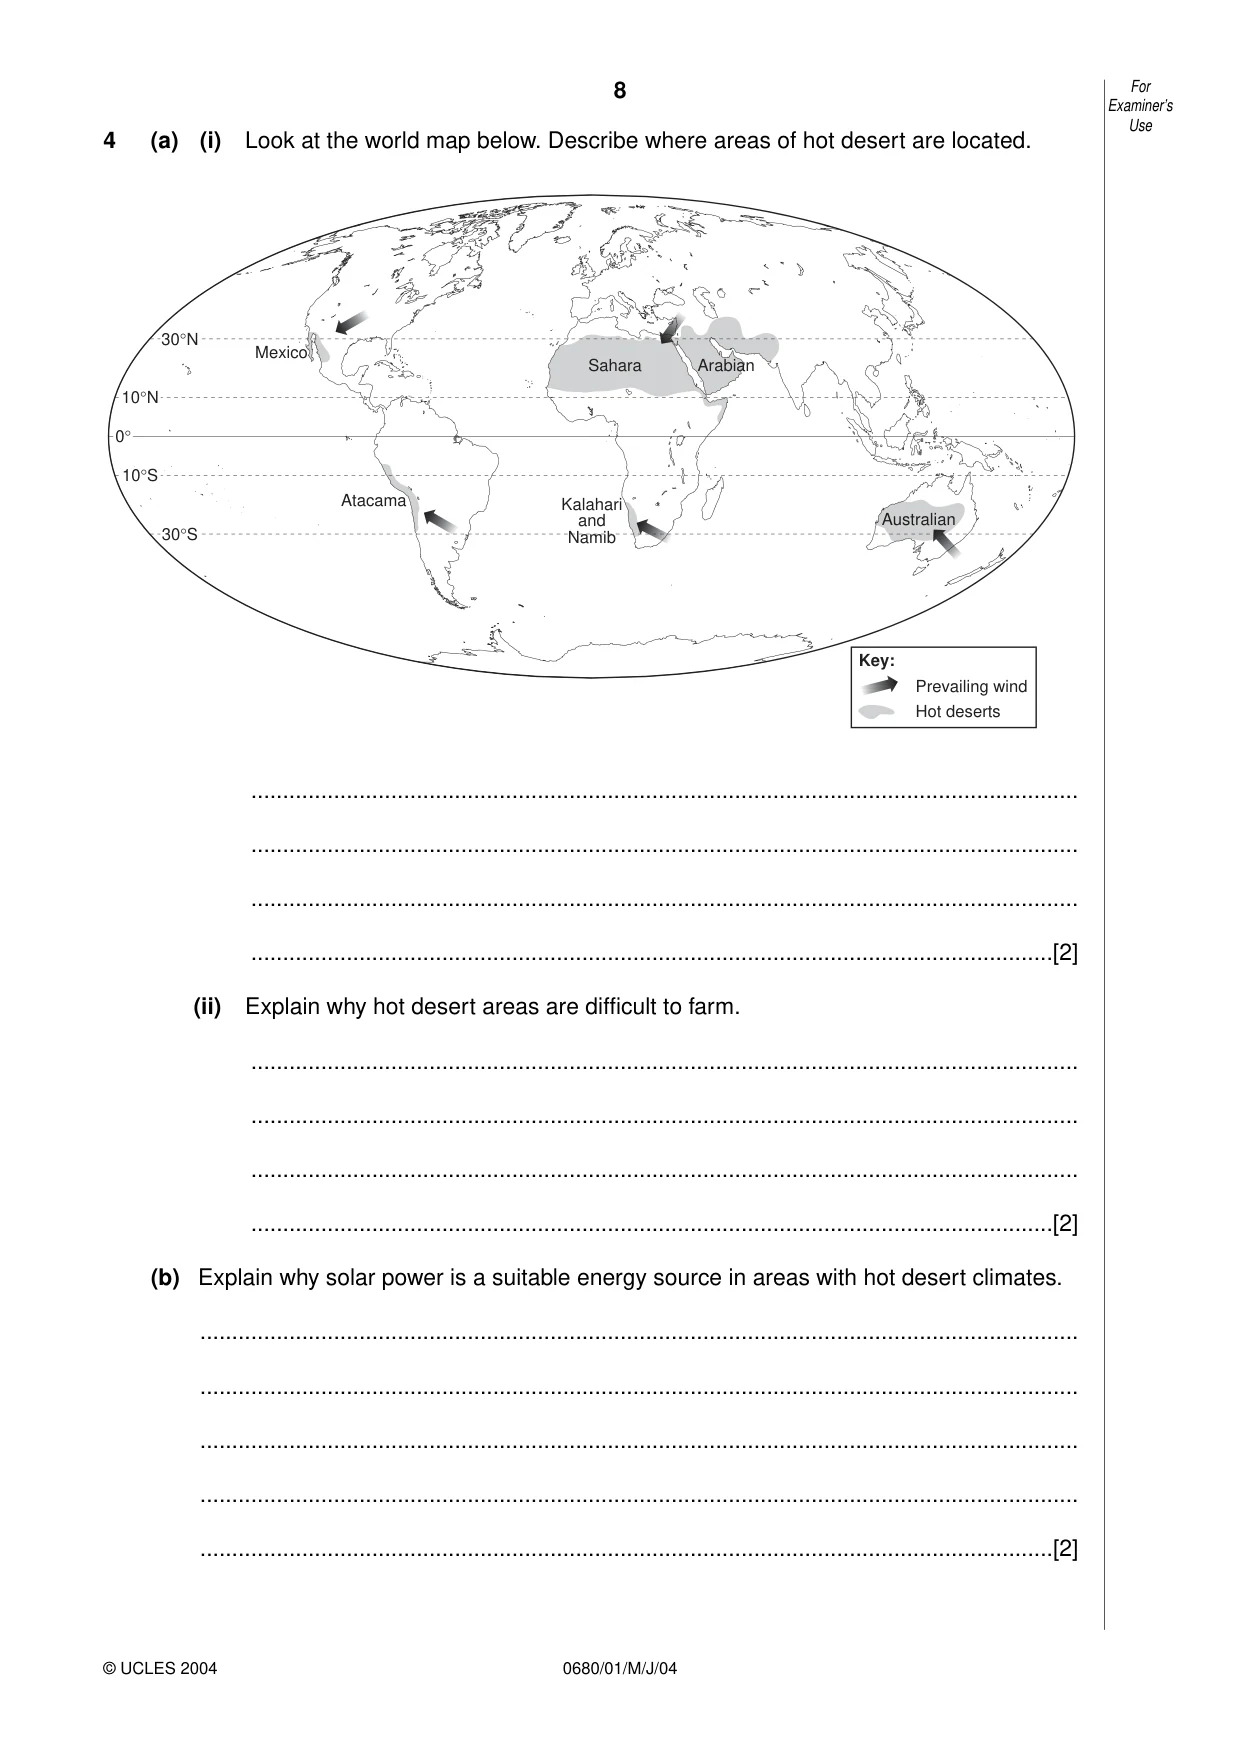
8 0680/01/M/J/04 4 (a) (i) Look at the world map below. Describe where areas of hot desert are located. … … … …[2] (ii) Explain why hot desert areas are difficult to farm. … … … …[2] (b) Explain why solar power is a suitable energy source in areas with hot desert climates. … … … … …[2] Arabian Sahara Kalahari and Namib Atacama Australian Mexico Key: Prevailing wind Hot deserts 30°N 30°S 10°N 10°S 0° For Examiner’s Use © UCLES 2004
Question paper, page 9
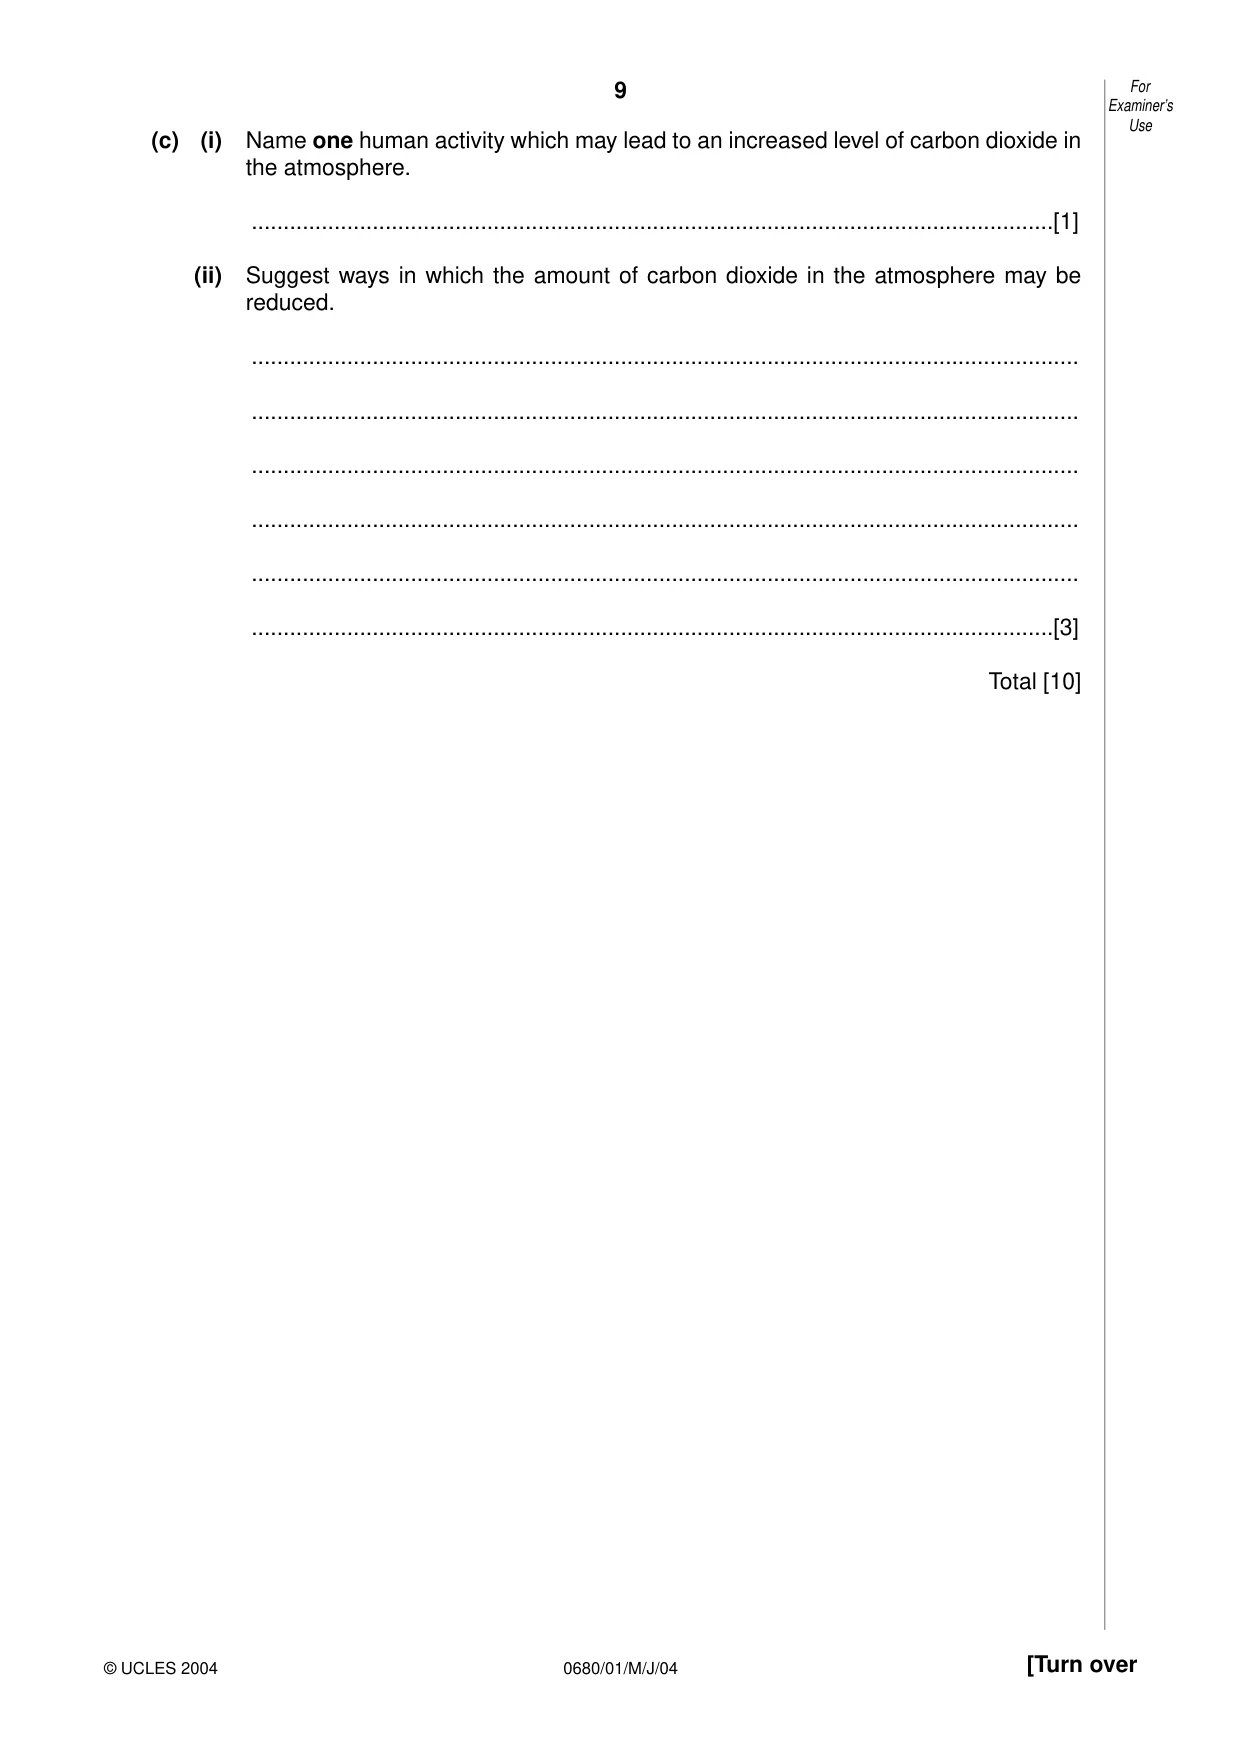
9 0680/01/M/J/04 [Turn over (c) (i) Name one human activity which may lead to an increased level of carbon dioxide in the atmosphere. …[1] (ii) Suggest ways in which the amount of carbon dioxide in the atmosphere may be reduced. … … … … … …[3] Total [10] For Examiner’s Use © UCLES 2004
Question paper, page 10
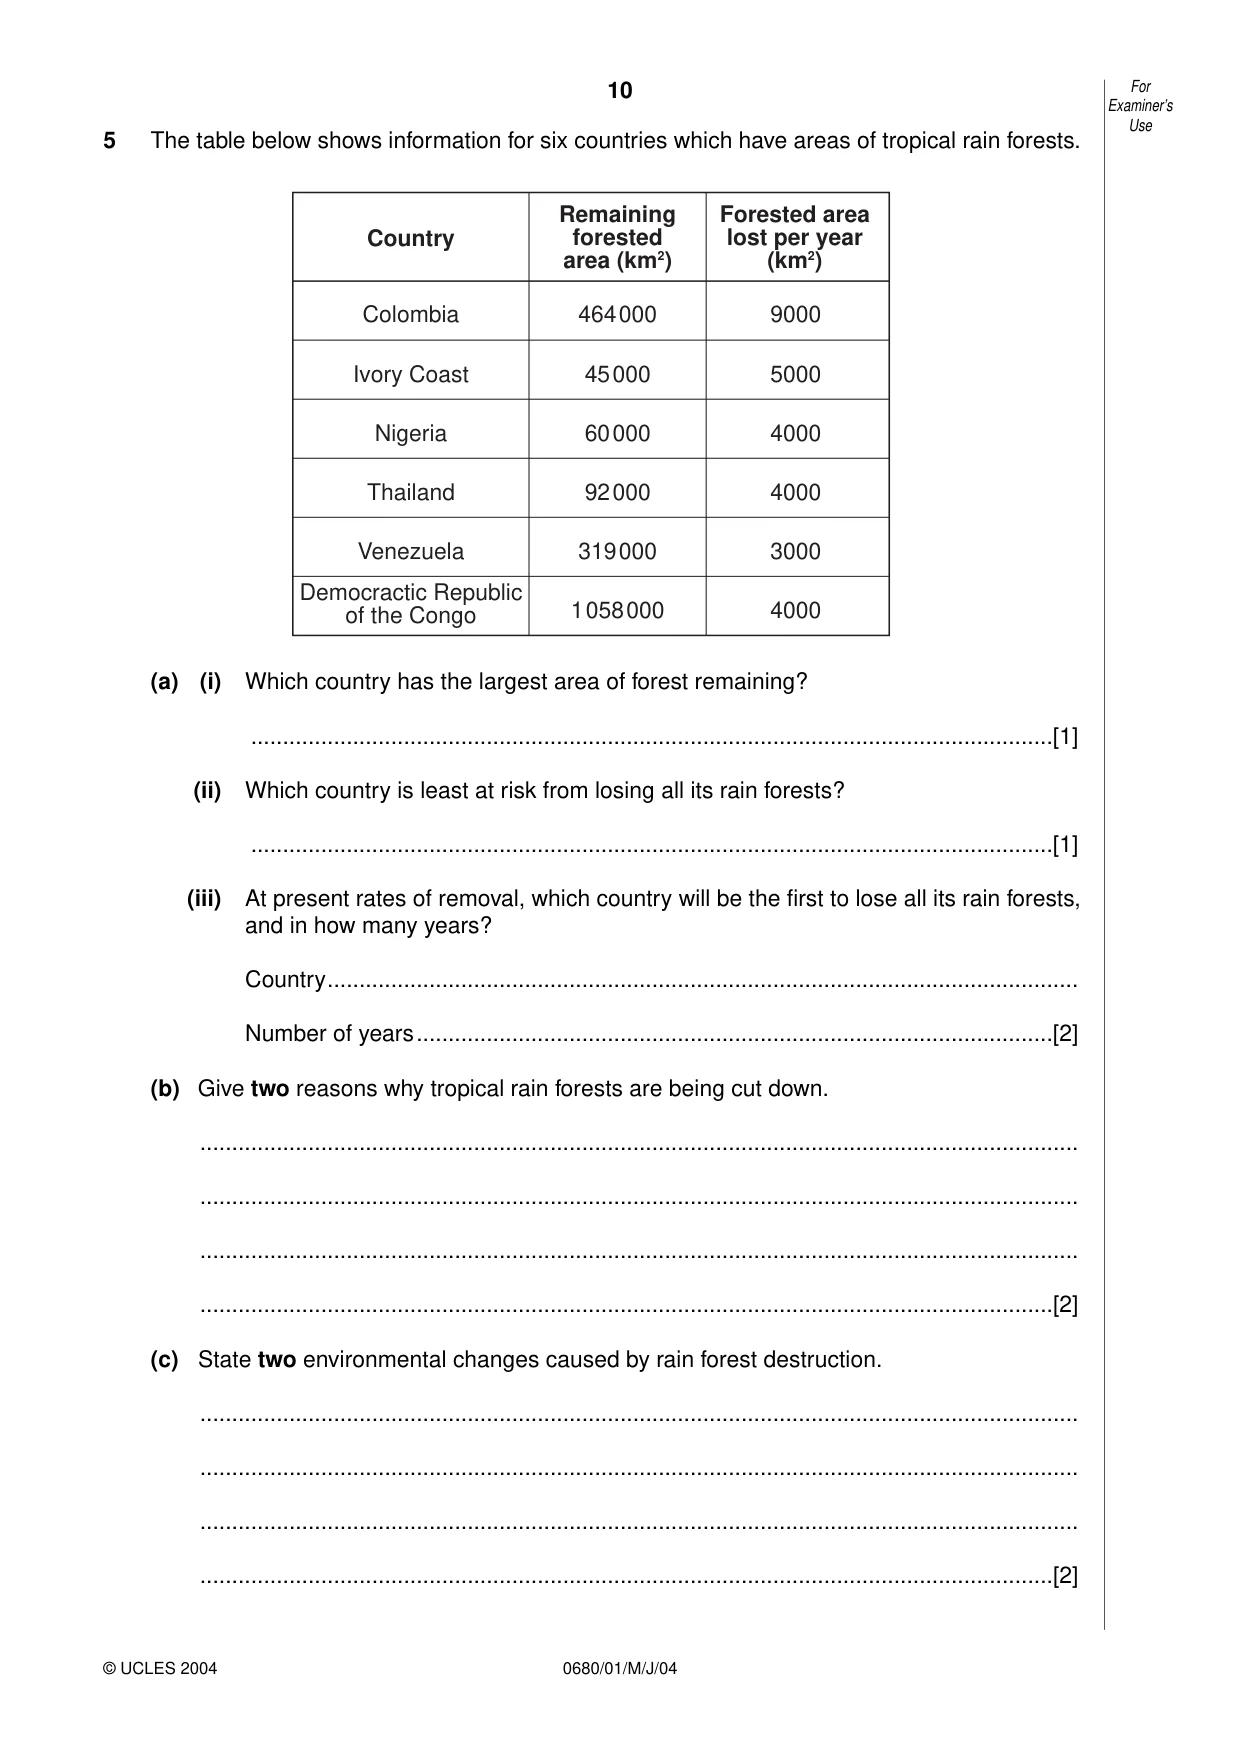
10 0680/01/M/J/04 5 The table below shows information for six countries which have areas of tropical rain forests. (a) (i) Which country has the largest area of forest remaining? …[1] (ii) Which country is least at risk from losing all its rain forests? …[1] (iii) At present rates of removal, which country will be the first to lose all its rain forests, and in how many years? Country… Number of years…[2] (b) Give two reasons why tropical rain forests are being cut down. … … … …[2] (c) State two environmental changes caused by rain forest destruction. … … … …[2] Country Remaining forested area (km2) Forested area lost per year (km2) Colombia Ivory Coast Nigeria Thailand Venezuela Democractic Republic of the Congo 464000 45000 60000 92000 319000 1058000 9000 5000 4000 4000 3000 4000 For Examiner’s Use © UCLES 2004
Question paper, page 11
11 0680/01/M/J/04 [Turn over (d) Describe one sustainable way of managing areas of tropical rain forests. … … … … …[2] Total [10] For Examiner’s Use © UCLES 2004 University of Cambridge International Examinations is part of the University of Cambridge Local Examinations Syndicate (UCLES) which is itself a department of the University of Cambridge.
Question paper, page 12
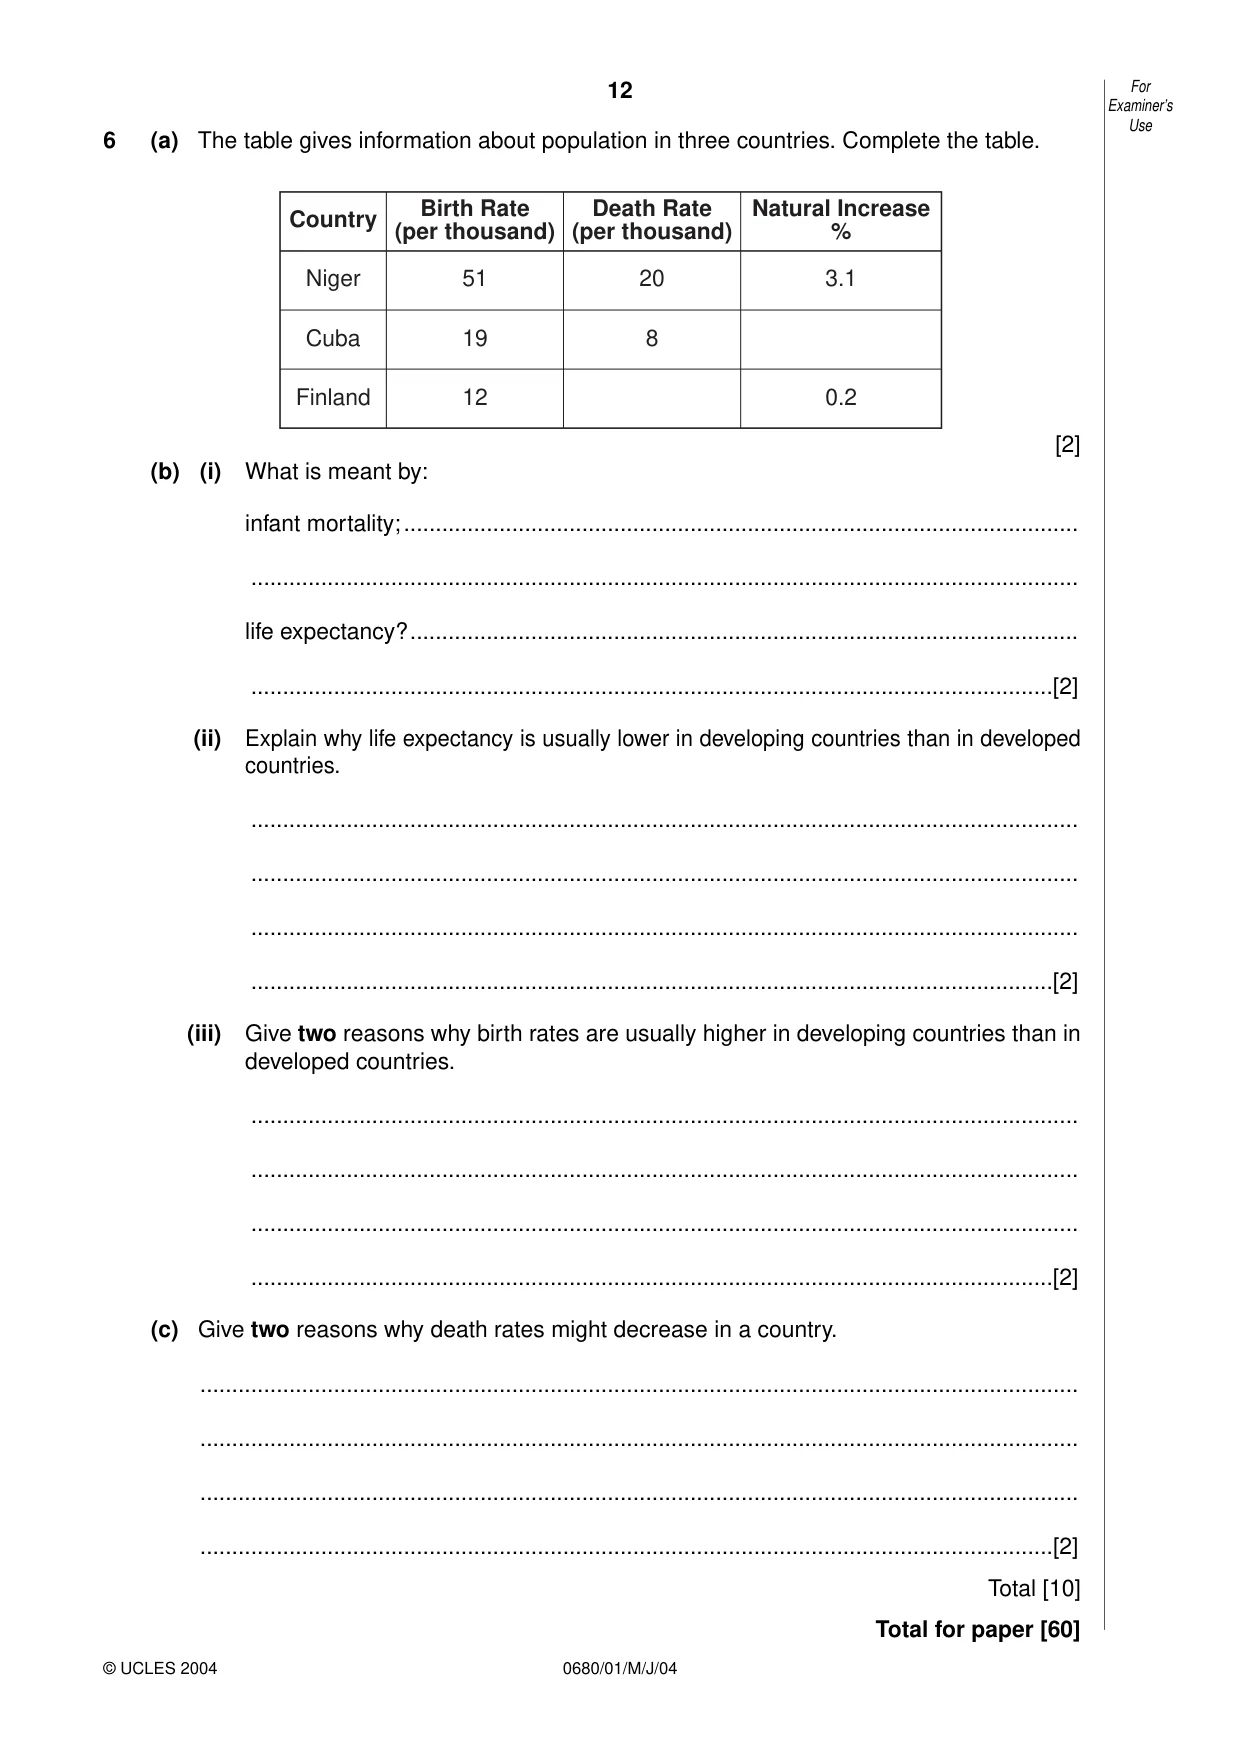
12 0680/01/M/J/04 6 (a) The table gives information about population in three countries. Complete the table. [2] (b) (i) What is meant by: infant mortality;… … life expectancy?… …[2] (ii) Explain why life expectancy is usually lower in developing countries than in developed countries. … … … …[2] (iii) Give two reasons why birth rates are usually higher in developing countries than in developed countries. … … … …[2] (c) Give two reasons why death rates might decrease in a country. … … … …[2] Total [10] Total for paper [60] Country Niger Cuba Finland 51 19 12 20 8 3.1 0.2 Birth Rate (per thousand) Death Rate (per thousand) Natural Increase % For Examiner’s Use © UCLES 2004