Cambridge IGCSE Economics 0455 — 2011 May/June Paper 3 · Variant 3
0455/33/M/J/11 · 2 questions · 40 marks · ≈45 min
The question paper and its mark scheme, free to read here and free to download. This is Cambridge’s own paper, exactly as it was sat.
Question paper8 pages
Mark scheme5 pages
Answers below. Sit the paper first if you are practising.
Questions as text
Q1 · State two influences on the demand for a country’s exports
1 (a) State two influences on the demand for a country’s exports. .......................................................................................................................................... .......................................................................................................................................... .......................................................................................................................................... .......................................................................................................................................... .......................................................................................................................................... .......................................................................................................................................... .......................................................................................................................................... ......................................................................................................................................[2] (b) Identify two possible reasons why the Chinese savings ratio may fall in the future. .......................................................................................................................................... .......................................................................................................................................... .......................................................................................................................................... .......................................................................................................................................... .......................................................................................................................................... .......................................................................................................................................... .......................................................................................................................................... ......................................................................................................................................[2] (c) (i) What is meant by cyclical unemployment? .................................................................................................................................. .................................................................................................................................. .................................................................................................................................. .................................................................................................................................. .................................................................................................................................. .................................................................................................................................. .................................................................................................................................. ..............................................................................................................................[2] (ii) Explain one consequence of unemployment referred to in the extract. .................................................................................................................................. .................................................................................................................................. .................................................................................................................................. .................................................................................................................................. .................................................................................................................................. .................................................................................................................................. .................................................................................................................................. .................................................................................................................................. .................................................................................................................................. .................................................................................................................................. .................................................................................................................................. ..............................................................................................................................[3] (d) (i) Describe the relationship between unemployment and inflation shown in Table 1. .................................................................................................................................. ..............................................................................................................................[1] (ii) Explain one possible reason for the relationship described in (d) (i). .................................................................................................................................. .................................................................................................................................. .................................................................................................................................. .................................................................................................................................. .................................................................................................................................. .................................................................................................................................. .................................................................................................................................. .................................................................................................................................. .................................................................................................................................. .................................................................................................................................. .................................................................................................................................. ..............................................................................................................................[3] (e) Discuss what factors are likely to influence whether unemployment will rise in China in the future. .......................................................................................................................................... .......................................................................................................................................... .......................................................................................................................................... .......................................................................................................................................... .......................................................................................................................................... .......................................................................................................................................... .......................................................................................................................................... .......................................................................................................................................... .......................................................................................................................................... .......................................................................................................................................... .......................................................................................................................................... .......................................................................................................................................... .......................................................................................................................................... .......................................................................................................................................... .......................................................................................................................................... .......................................................................................................................................... .......................................................................................................................................... .......................................................................................................................................... .......................................................................................................................................... .......................................................................................................................................... .......................................................................................................................................... .......................................................................................................................................... .......................................................................................................................................... .......................................................................................................................................... .......................................................................................................................................... .......................................................................................................................................... .......................................................................................................................................... ......................................................................................................................................[7] [Total: 20] The extract ‘Japan’s population problem’ will be needed for this question.
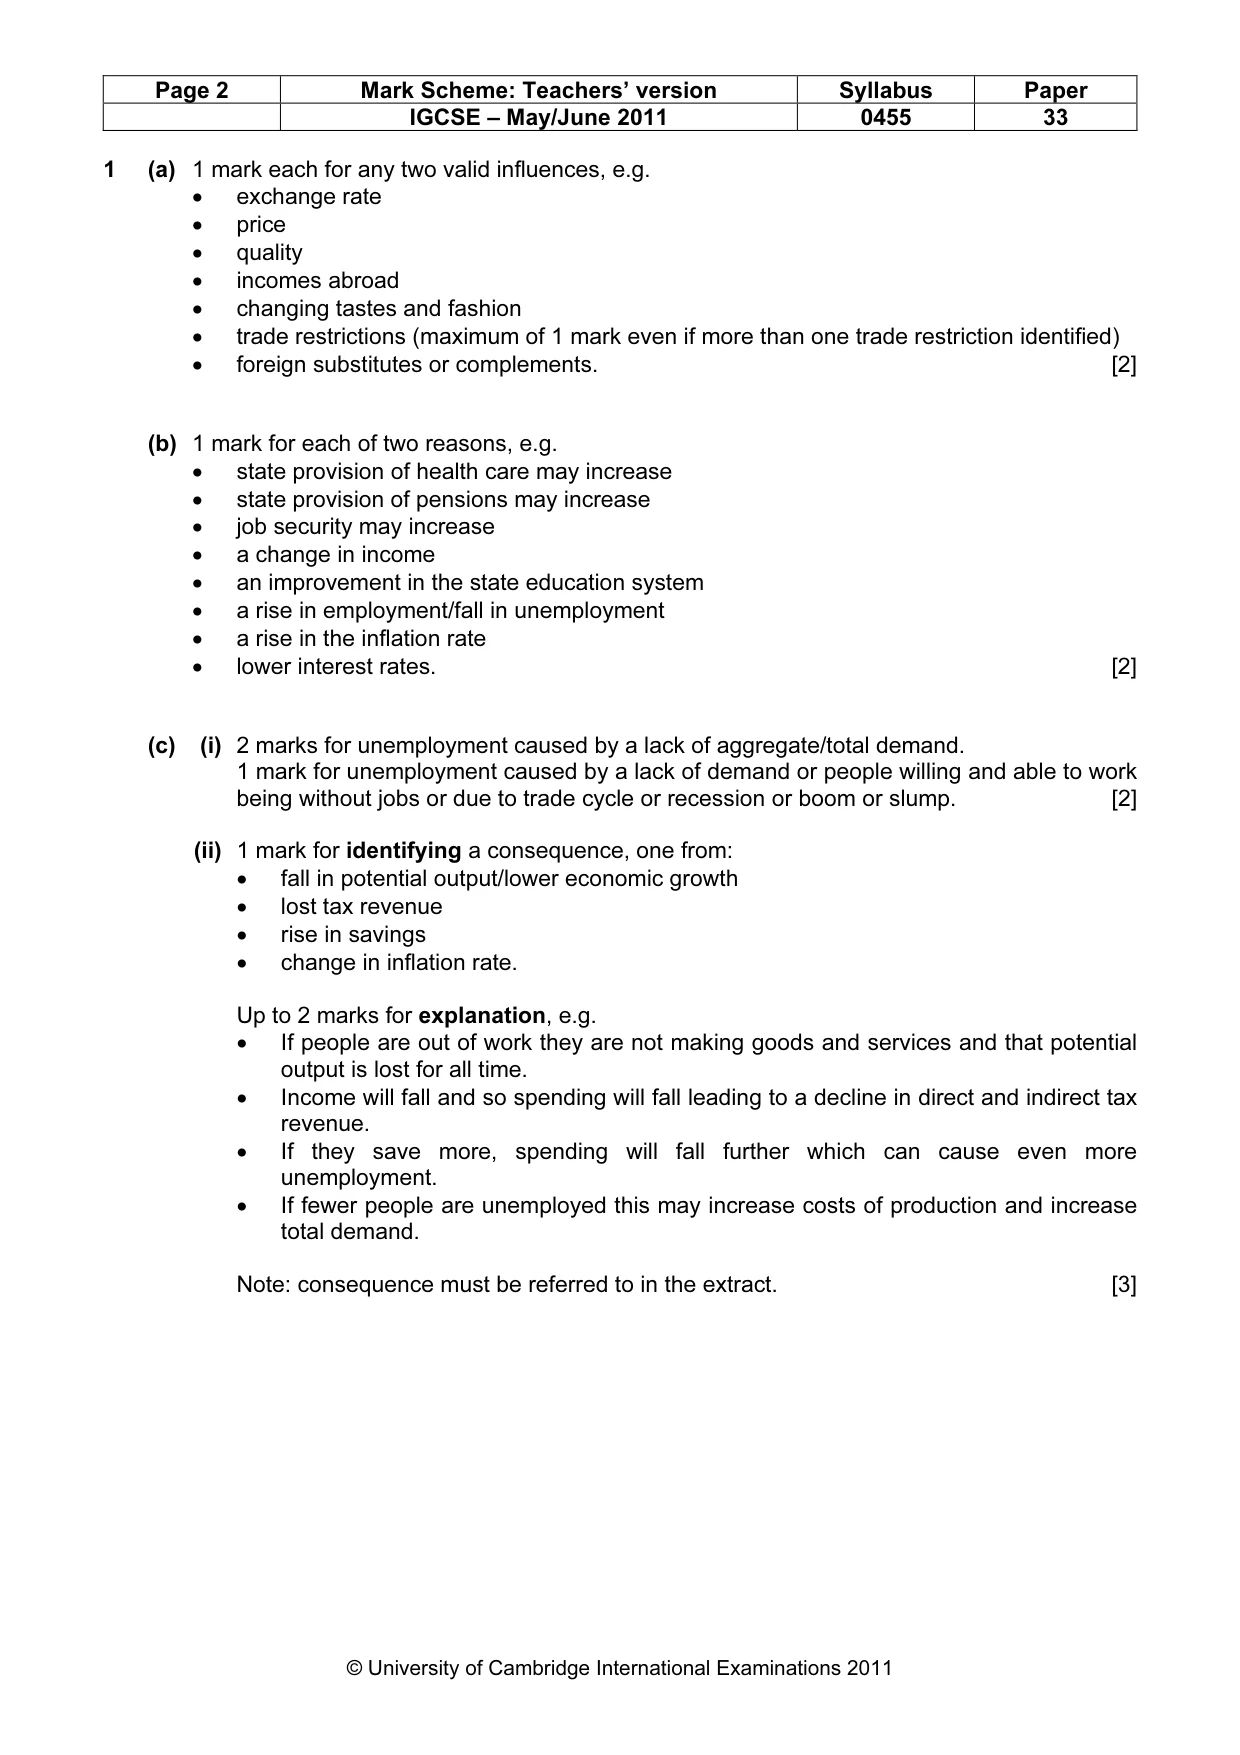
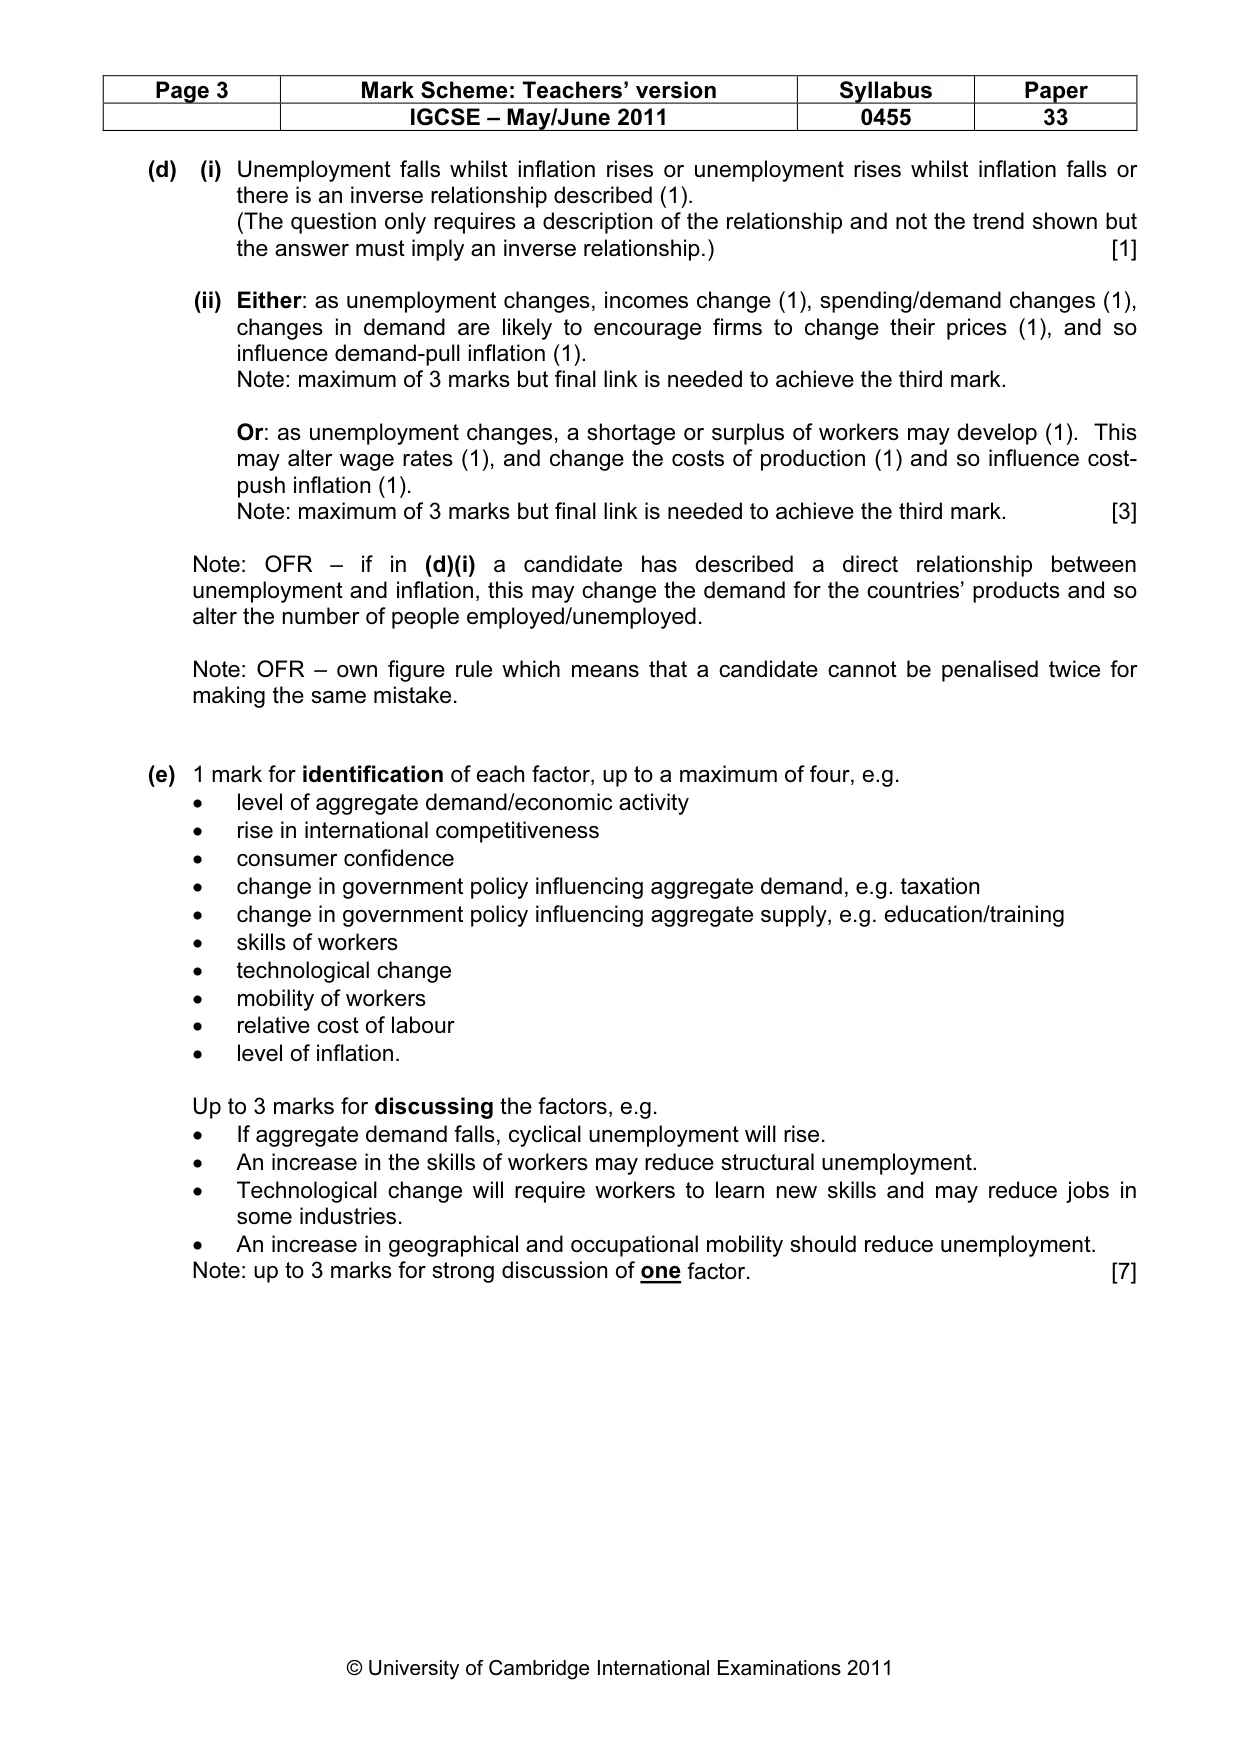
Mark scheme: 1 (a) 1 mark each for any two valid influences, e.g. • exchange rate • price • quality • incomes abroad • changing tastes and fashion • trade restrictions (maximum of 1 mark even if more than one trade restriction identified) • foreign substitutes or complements. [2] (b) 1 mark for each of two reasons, e.g. • state provision of health care may increase • state provision of pensions may increase • job security may increase • a change in income • an improvement in the state education system • a rise in employment/fall in unemployment • a rise in the inflation rate • lower interest rates. [2] (c) (i) 2 marks for unemployment caused by a lack of aggregate/total demand. 1 mark for unemployment caused by a lack of demand or people willing and able to work being without jobs or due to trade cycle or recession or boom or slump. [2] (ii) 1 mark for identifying a consequence, one from: • fall in potential output/lower economic growth • lost tax revenue • rise in savings • change in inflation rate. Up to 2 marks for explanation, e.g. • If people are out of work they are not making goods and services and that potential output is lost for all time. • Income will fall and so spending will fall leading to a decline in direct and indirect tax revenue. • If they save more, spending will fall further which can cause even more unemployment. • If fewer people are unemployed this may increase costs of production and increase total demand. Note: consequence must be referred to in the extract. [3] IGCSE – May/June 2011 0455 33 (d) (i) Unemployment falls whilst inflation rises or unemployment rises whilst inflation falls or there is an inverse relationship described (1). (The question only requires a description of the relationship and not the trend shown but the answer must imply an inverse relationship.) [1] (ii) Either: as unemployment changes, incomes change (1), spending/demand changes (1), changes in demand are likely to encourage firms to change their prices (1), and so influence demand-pull inflation (1). Note: maximum of 3 marks but final link is needed to achieve the third mark. Or: as unemployment changes, a shortage or surplus of workers may develop (1). This may alter wage rates (1), and change the costs of production (1) and so influence cost- push inflation (1). Note: maximum of 3 marks but final link is needed to achieve the third mark. [3] Note: OFR – if in (d)(i) a candidate has described a direct relationship between unemployment and inflation, this may change the demand for the countries’ products and so alter the number of people employed/unemployed. Note: OFR – own figure rule which means that a candidate cannot be penalised twice for making the same mistake. (e) 1 mark for identification of each factor, up to a maximum of four, e.g. • level of aggregate demand/economic activity • rise in international competitiveness • consumer confidence • change in government policy influencing aggregate demand, e.g. taxation • change in government policy influencing aggregate supply, e.g. education/training • skills of workers • technological change • mobility of workers • relative cost of labour • level of inflation. Up to 3 marks for discussing the factors, e.g. • If aggregate demand falls, cyclical unemployment will rise. • An increase in the skills of workers may reduce structural unemployment. • Technological change will require workers to learn new skills and may reduce jobs in some industries. • An increase in geographical and occupational mobility should reduce unemployment. Note: up to 3 marks for strong discussion of one factor. [7] IGCSE – May/June 2011 0455 33
Q2 · Calculate the estimated percentage fall in the Japanese population from 2008 to 2050
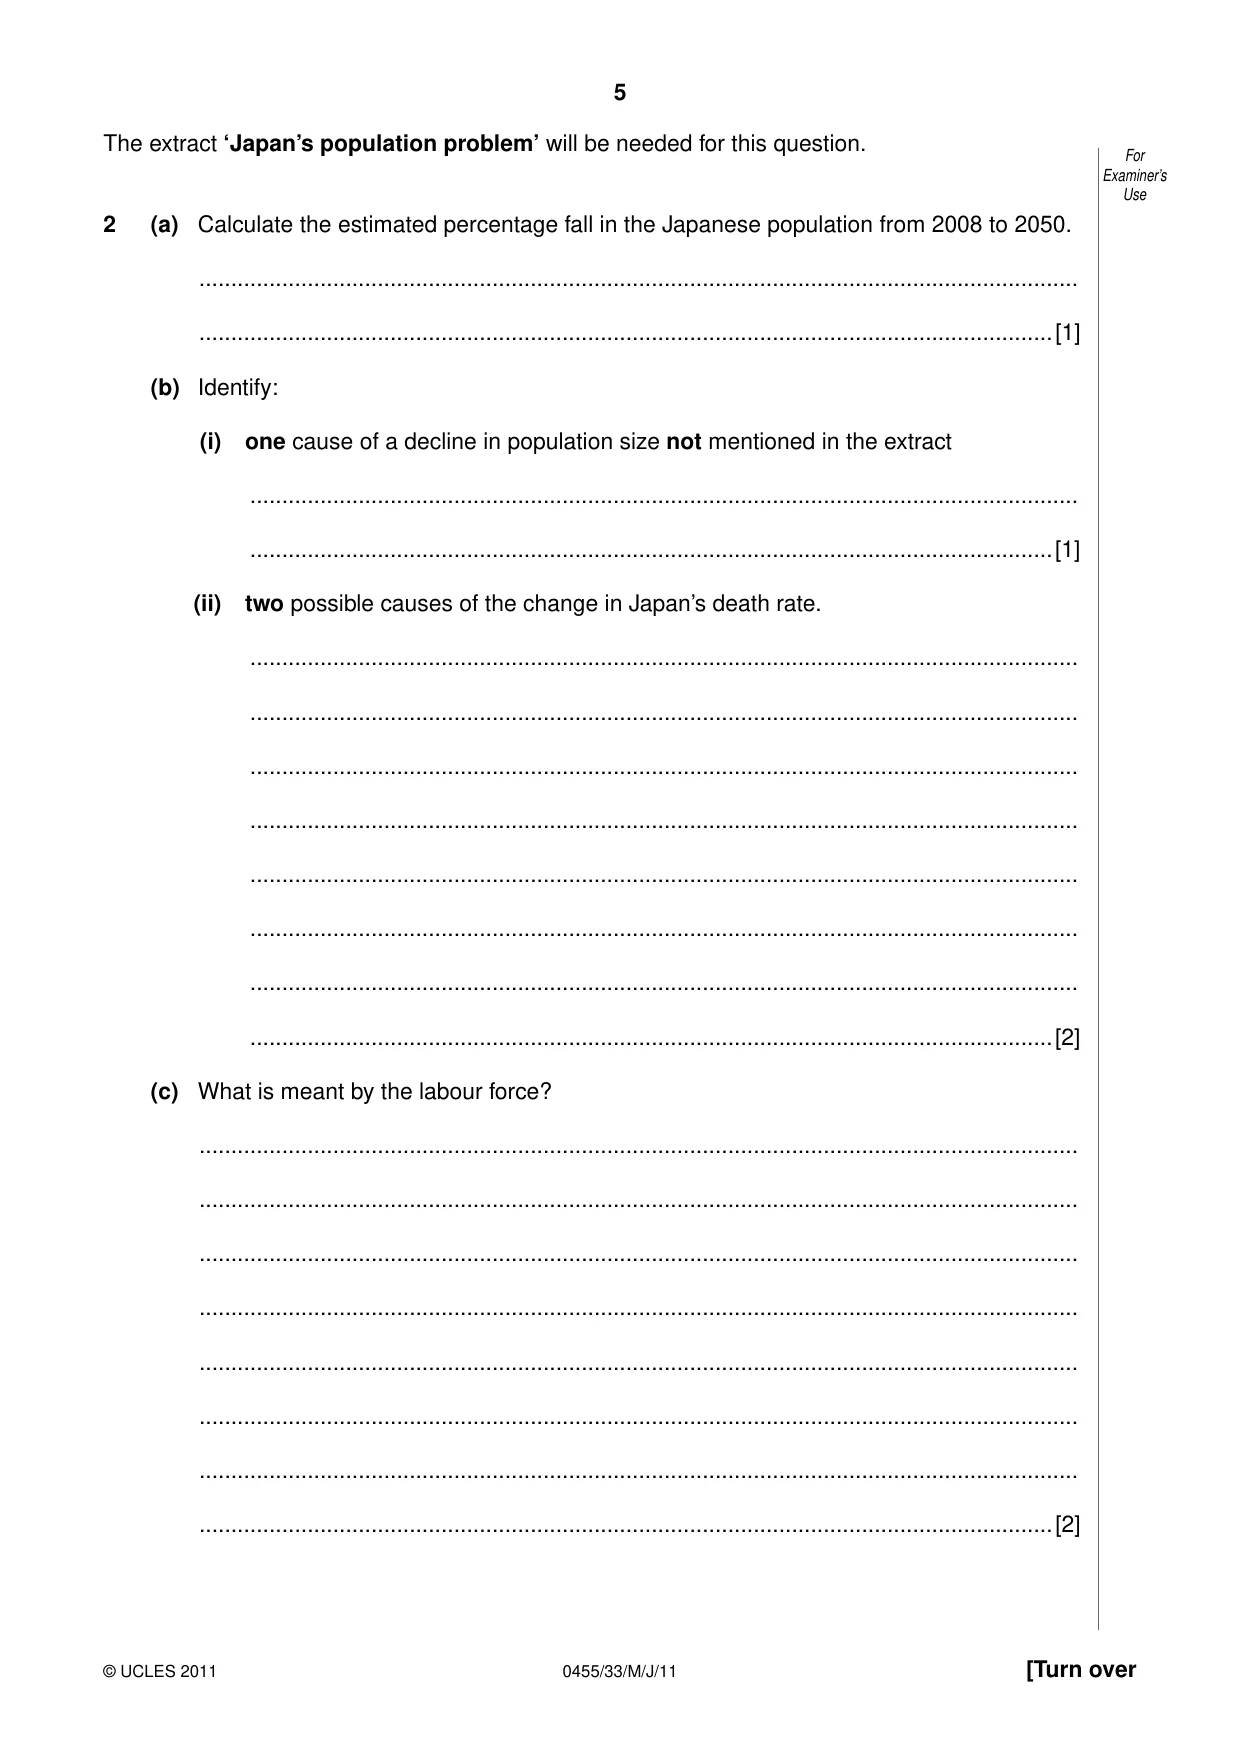
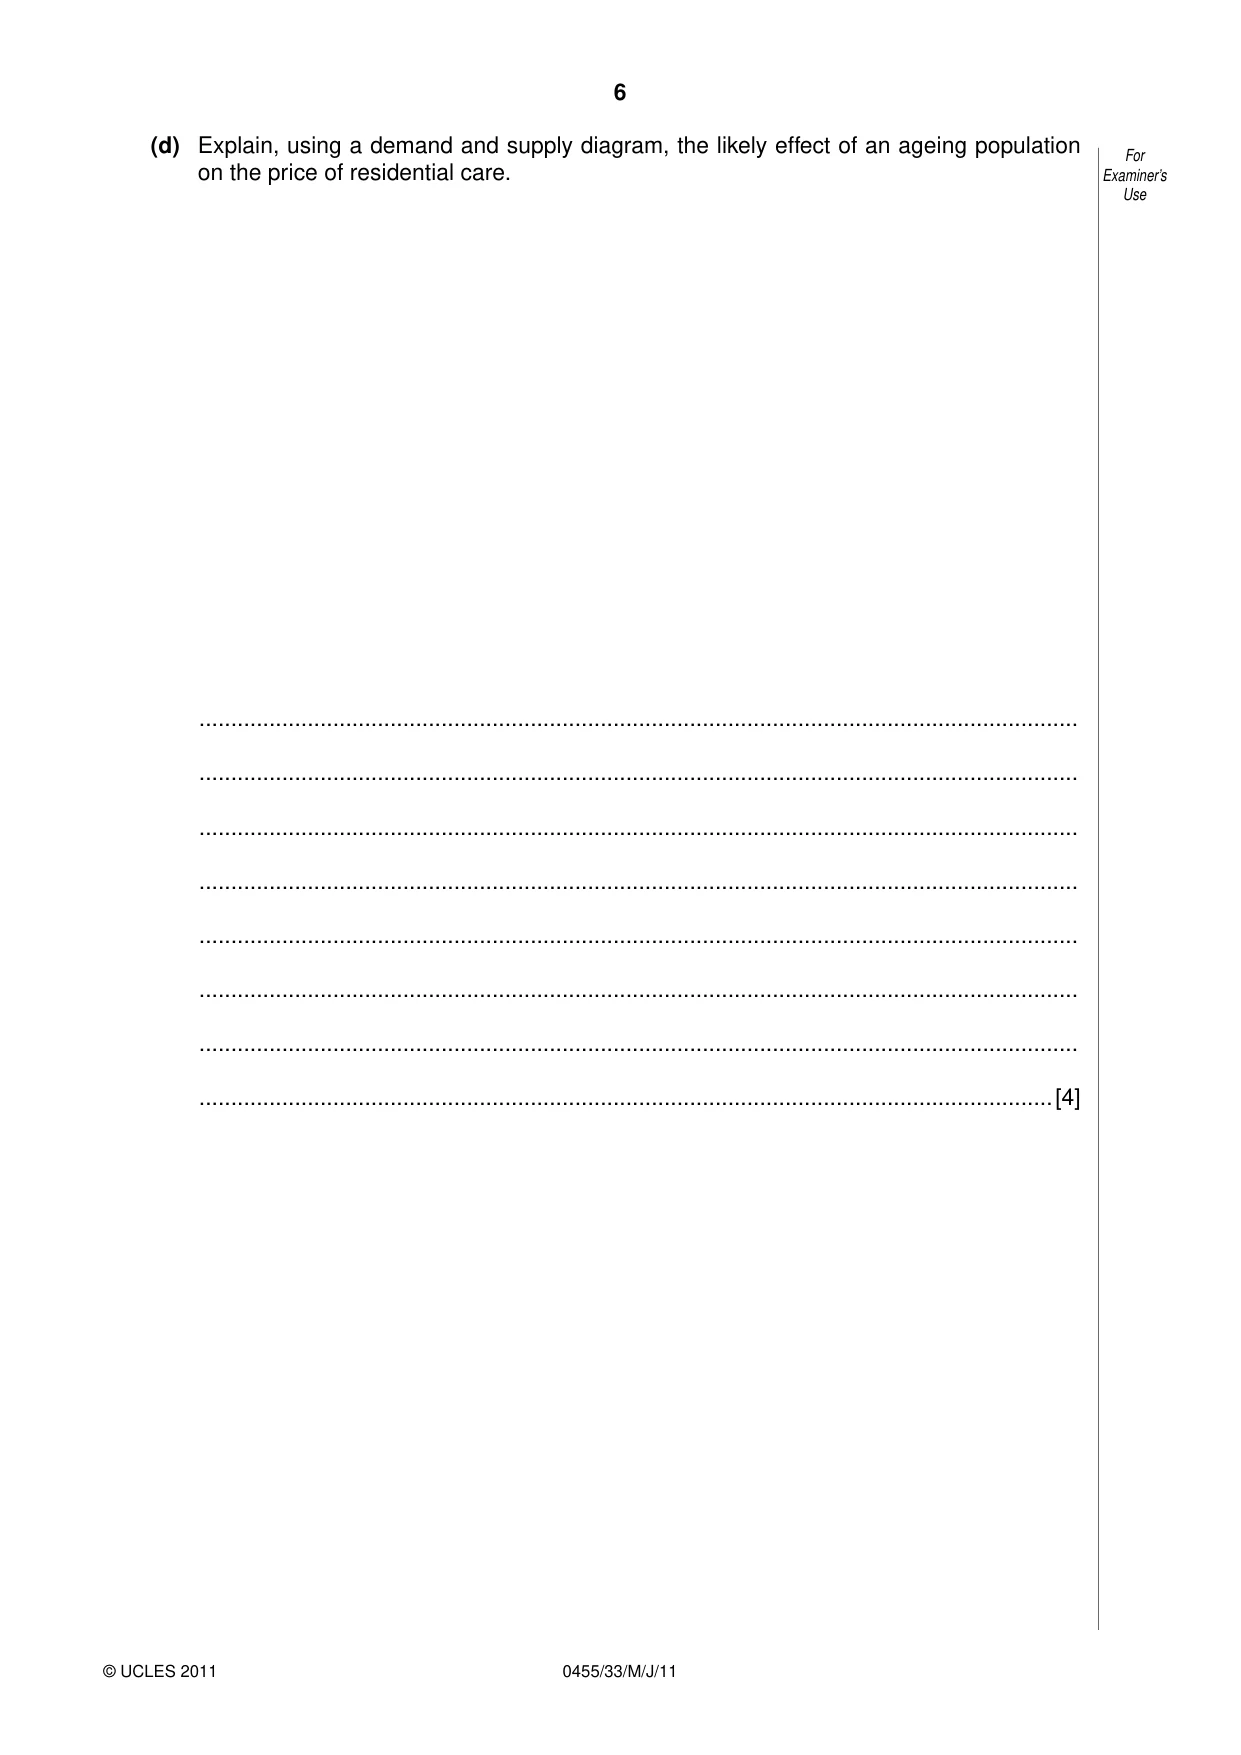
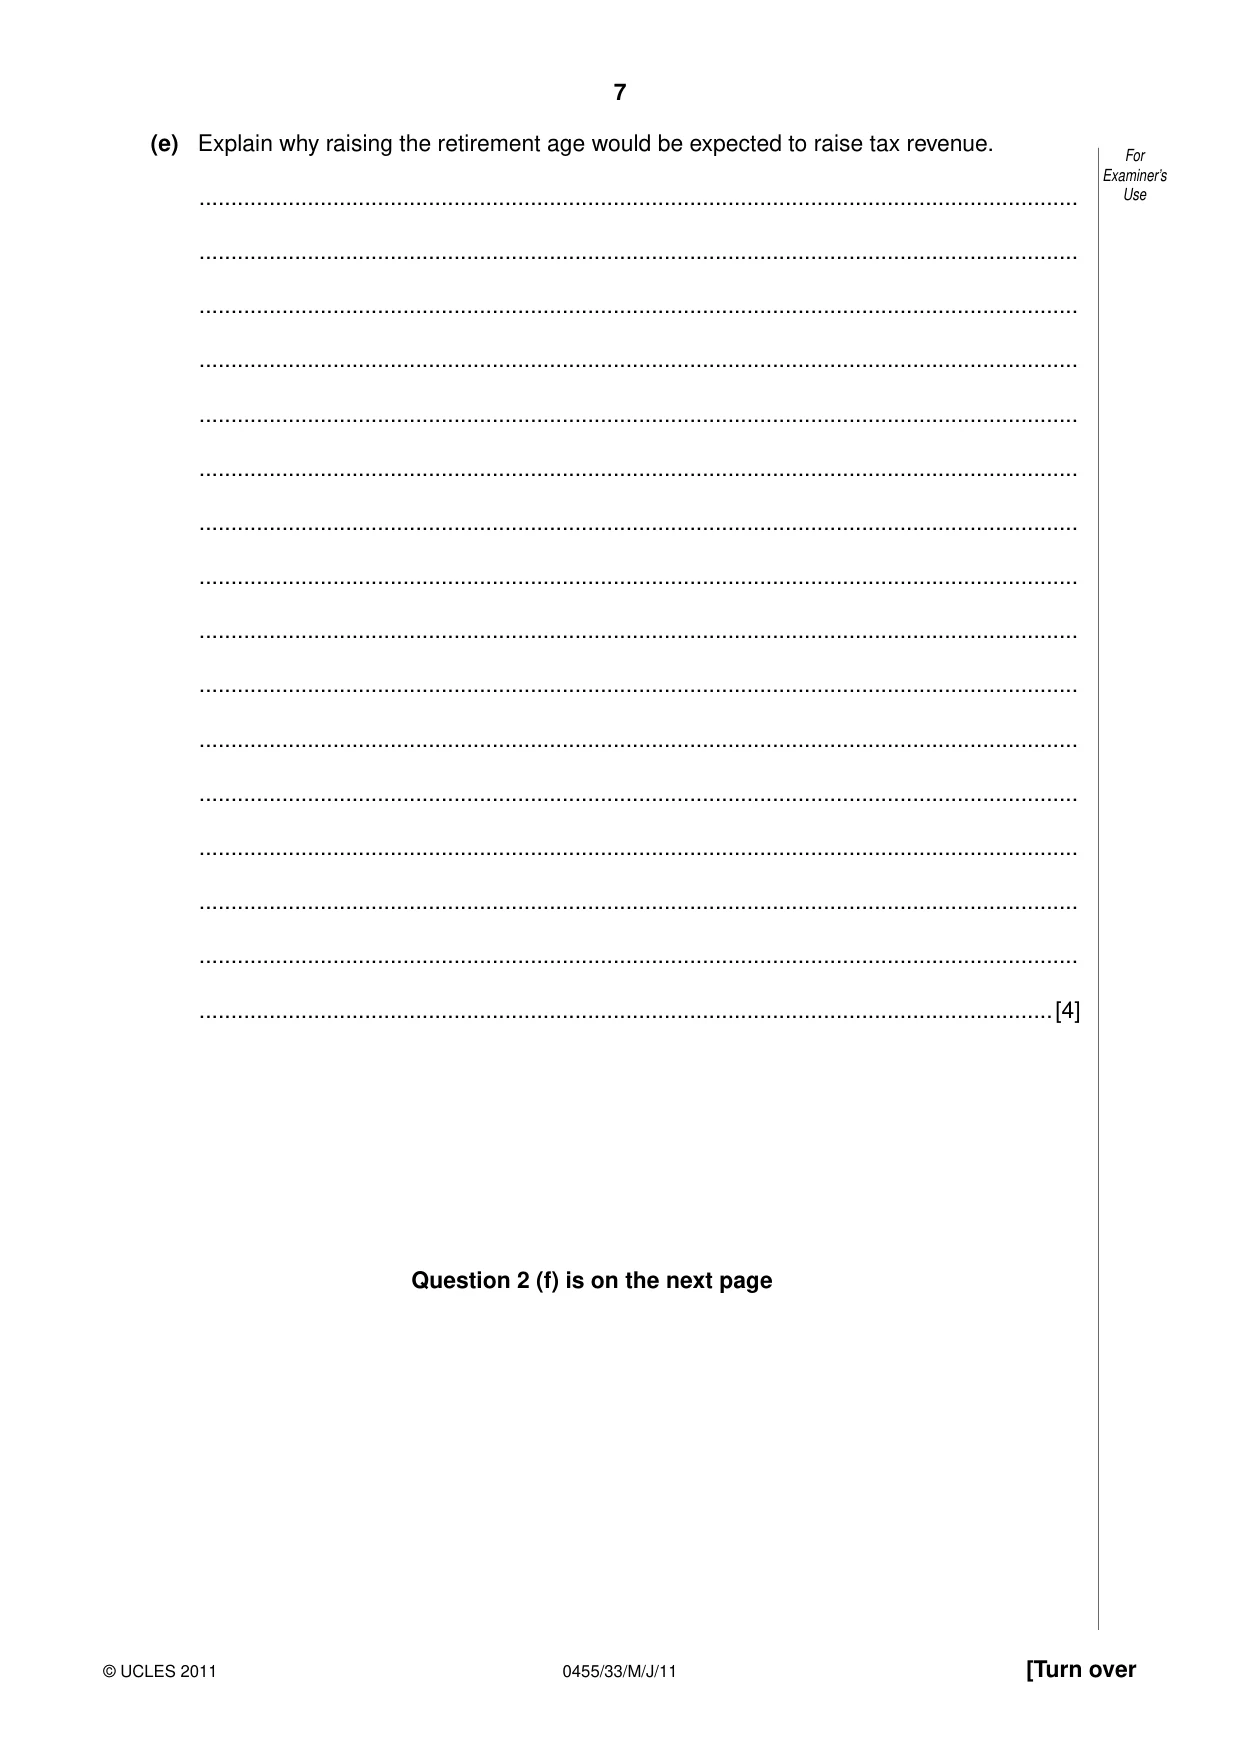
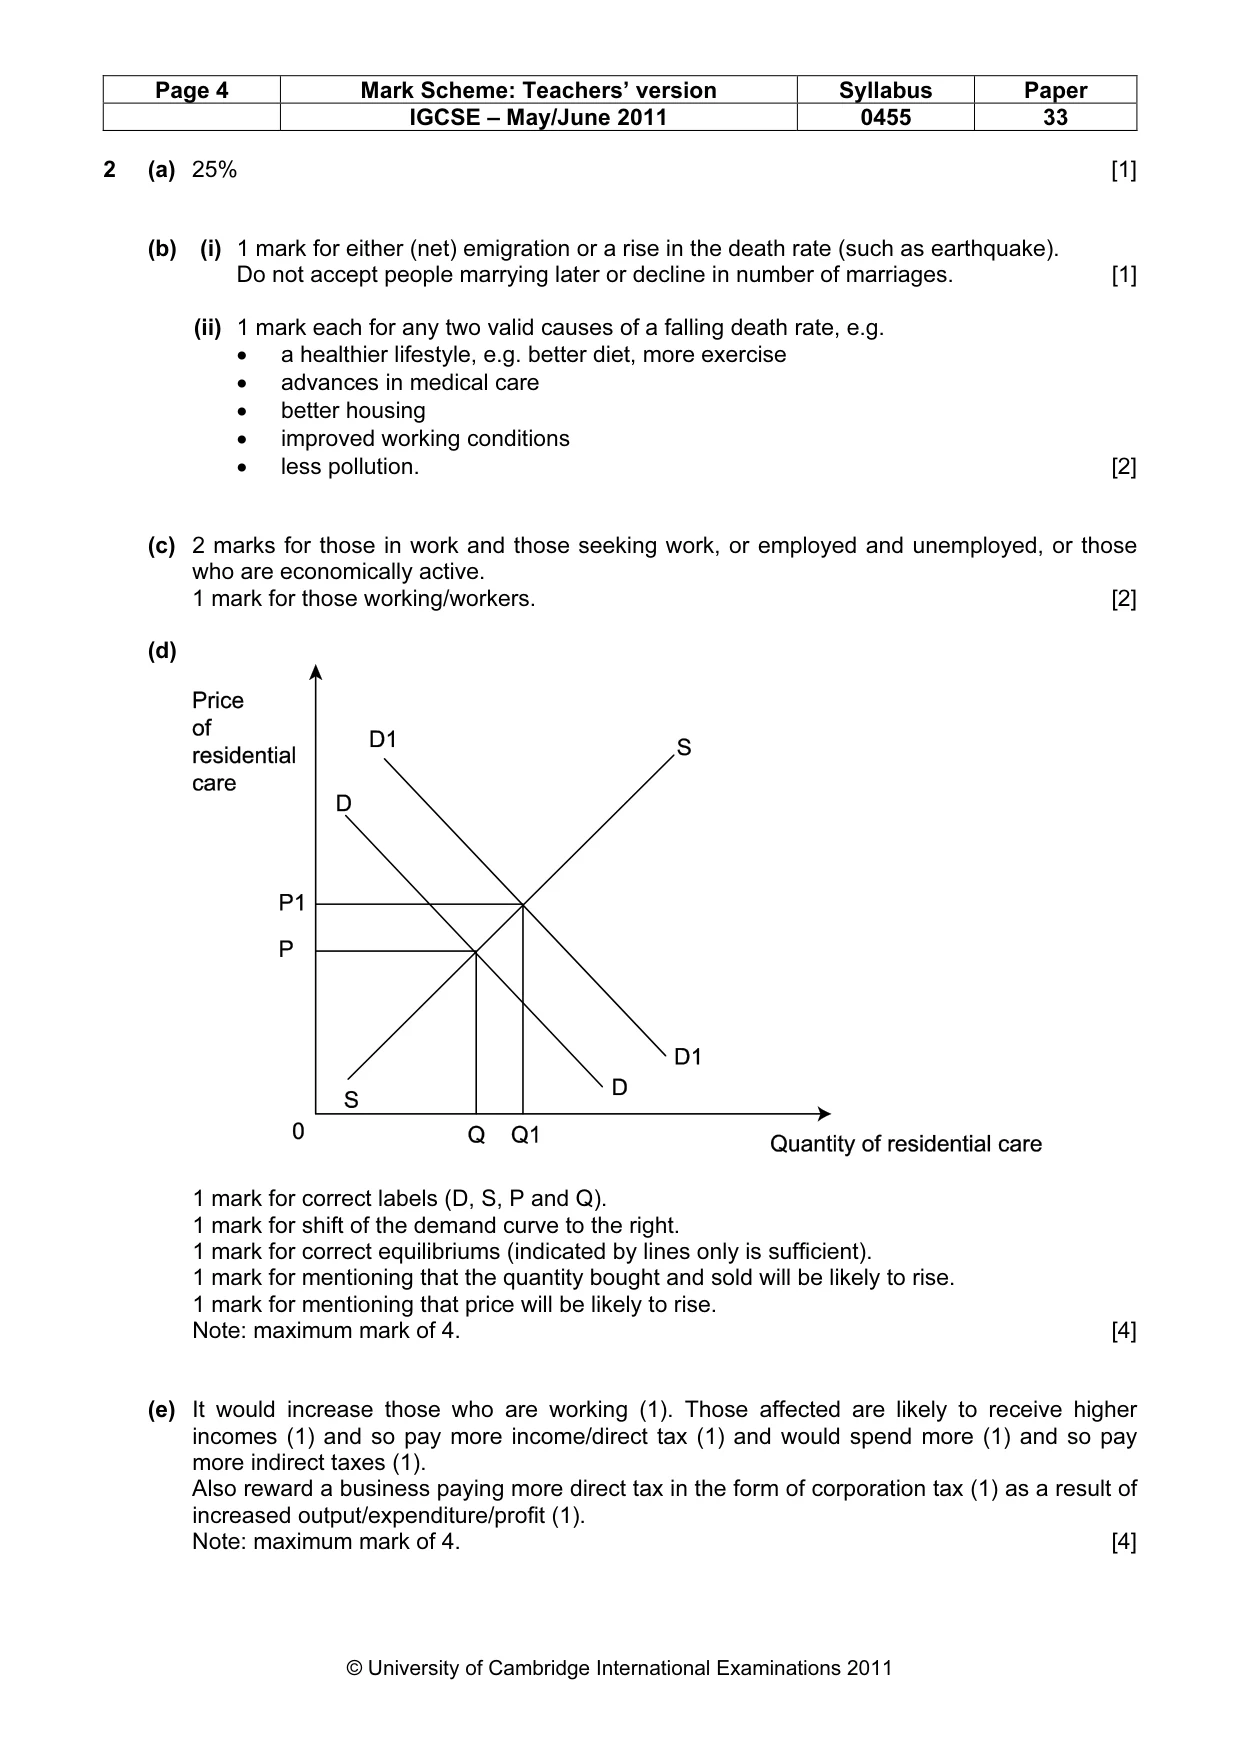
2 (a) Calculate the estimated percentage fall in the Japanese population from 2008 to 2050. .......................................................................................................................................... ......................................................................................................................................[1] (b) Identify: (i) one cause of a decline in population size not mentioned in the extract .................................................................................................................................. ..............................................................................................................................[1] (ii) two possible causes of the change in Japan’s death rate. .................................................................................................................................. .................................................................................................................................. .................................................................................................................................. .................................................................................................................................. .................................................................................................................................. .................................................................................................................................. .................................................................................................................................. ..............................................................................................................................[2] (c) What is meant by the labour force? .......................................................................................................................................... .......................................................................................................................................... .......................................................................................................................................... .......................................................................................................................................... .......................................................................................................................................... .......................................................................................................................................... .......................................................................................................................................... ......................................................................................................................................[2] (d) Explain, using a demand and supply diagram, the likely effect of an ageing population on the price of residential care. .......................................................................................................................................... .......................................................................................................................................... .......................................................................................................................................... .......................................................................................................................................... .......................................................................................................................................... .......................................................................................................................................... .......................................................................................................................................... ......................................................................................................................................[4] (e) Explain why raising the retirement age would be expected to raise tax revenue. .......................................................................................................................................... .......................................................................................................................................... .......................................................................................................................................... .......................................................................................................................................... .......................................................................................................................................... .......................................................................................................................................... .......................................................................................................................................... .......................................................................................................................................... .......................................................................................................................................... .......................................................................................................................................... .......................................................................................................................................... .......................................................................................................................................... .......................................................................................................................................... .......................................................................................................................................... .......................................................................................................................................... ......................................................................................................................................[4] Question 2 (f) is on the next page
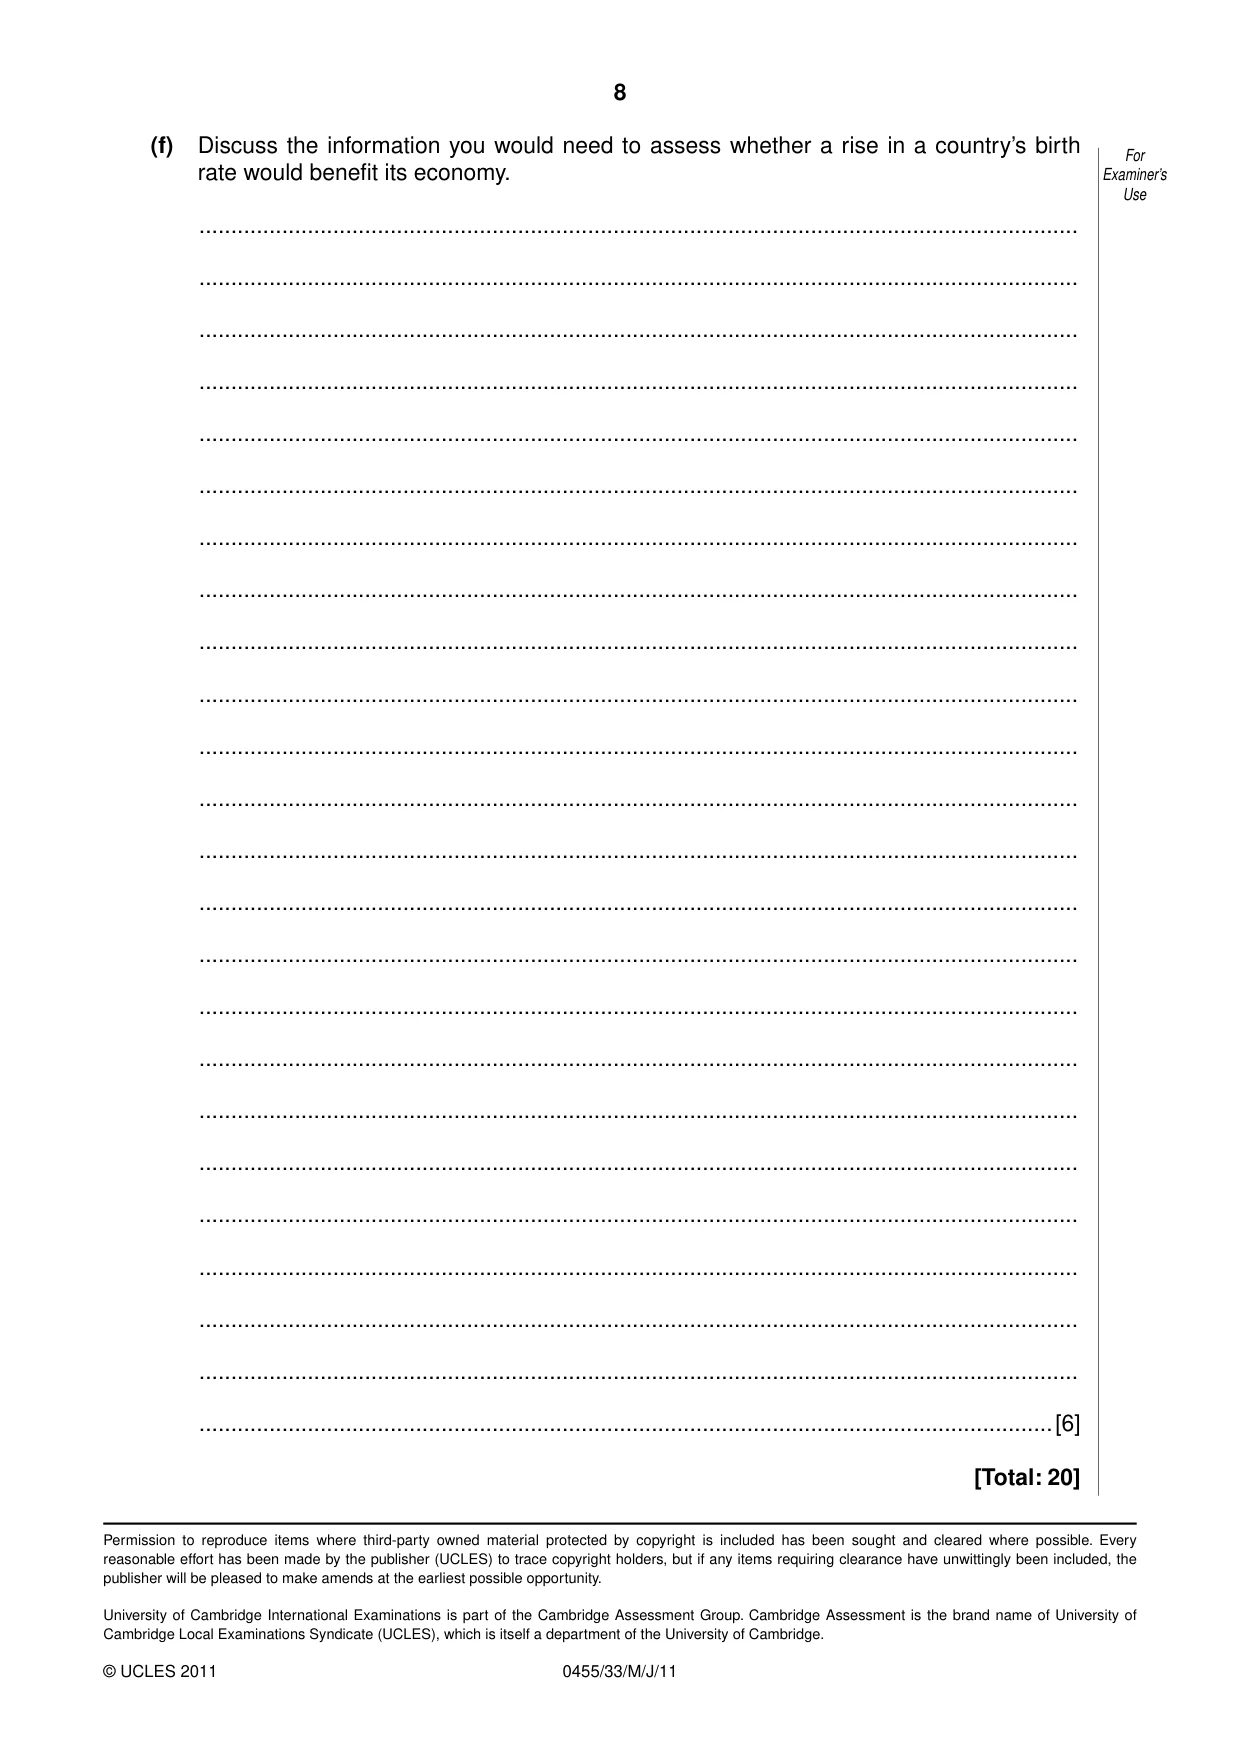
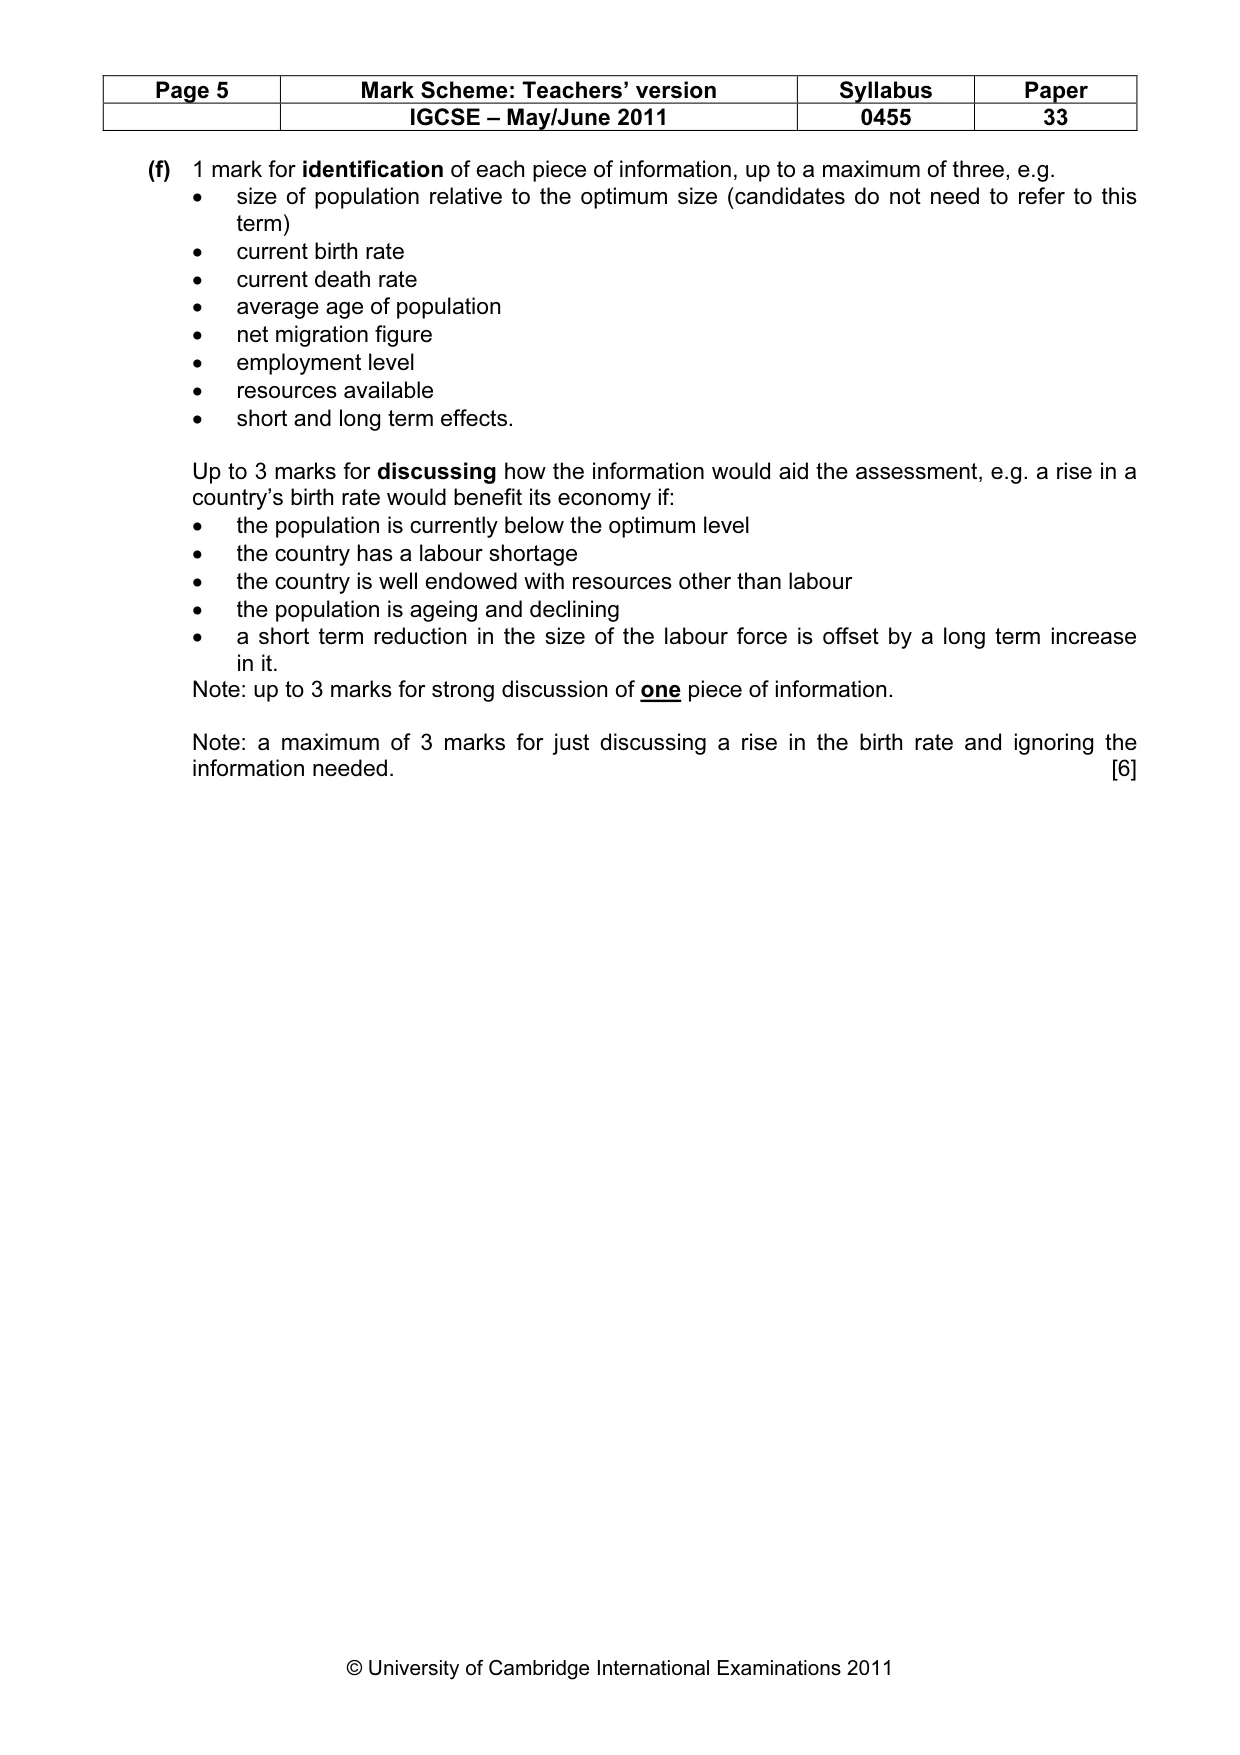
Mark scheme: 2 (a) 25% [1] (b) (i) 1 mark for either (net) emigration or a rise in the death rate (such as earthquake). Do not accept people marrying later or decline in number of marriages. [1] (ii) 1 mark each for any two valid causes of a falling death rate, e.g. • a healthier lifestyle, e.g. better diet, more exercise • advances in medical care • better housing • improved working conditions • less pollution. [2] (c) 2 marks for those in work and those seeking work, or employed and unemployed, or those who are economically active. 1 mark for those working/workers. [2] (d) 1 mark for correct labels (D, S, P and Q). 1 mark for shift of the demand curve to the right. 1 mark for correct equilibriums (indicated by lines only is sufficient). 1 mark for mentioning that the quantity bought and sold will be likely to rise. 1 mark for mentioning that price will be likely to rise. Note: maximum mark of 4. [4] (e) It would increase those who are working (1). Those affected are likely to receive higher incomes (1) and so pay more income/direct tax (1) and would spend more (1) and so pay more indirect taxes (1). Also reward a business paying more direct tax in the form of corporation tax (1) as a result of increased output/expenditure/profit (1). Note: maximum mark of 4. [4] IGCSE – May/June 2011 0455 33 (f) 1 mark for identification of each piece of information, up to a maximum of three, e.g. • size of population relative to the optimum size (candidates do not need to refer to this term) • current birth rate • current death rate • average age of population • net migration figure • employment level • resources available • short and long term effects. Up to 3 marks for discussing how the information would aid the assessment, e.g. a rise in a country’s birth rate would benefit its economy if: • the population is currently below the optimum level • the country has a labour shortage • the country is well endowed with resources other than labour • the population is ageing and declining • a short term reduction in the size of the labour force is offset by a long term increase in it. Note: up to 3 marks for strong discussion of one piece of information. Note: a maximum of 3 marks for just discussing a rise in the birth rate and ignoring the information needed. [6]
What was in this paper
The subtopics covered by these 2 questions, and how many questions each got. Open one in a new tab to see every Cambridge question on it.
What you needed in this session
Cambridge’s own grade thresholds for 2011 May/June, Paper 3 · Variant 3. A higher threshold means an easier paper — the bar moves with how the cohort did.