Cambridge IGCSE Economics 0455 — 2010 Oct/Nov Paper 3 · Variant 3
0455/33/O/N/10 · 2 questions · 40 marks · ≈45 min
The question paper and its mark scheme, free to read here and free to download. This is Cambridge’s own paper, exactly as it was sat.
Question paper12 pages




Mark scheme3 pages
Answers below. Sit the paper first if you are practising.

Questions as text
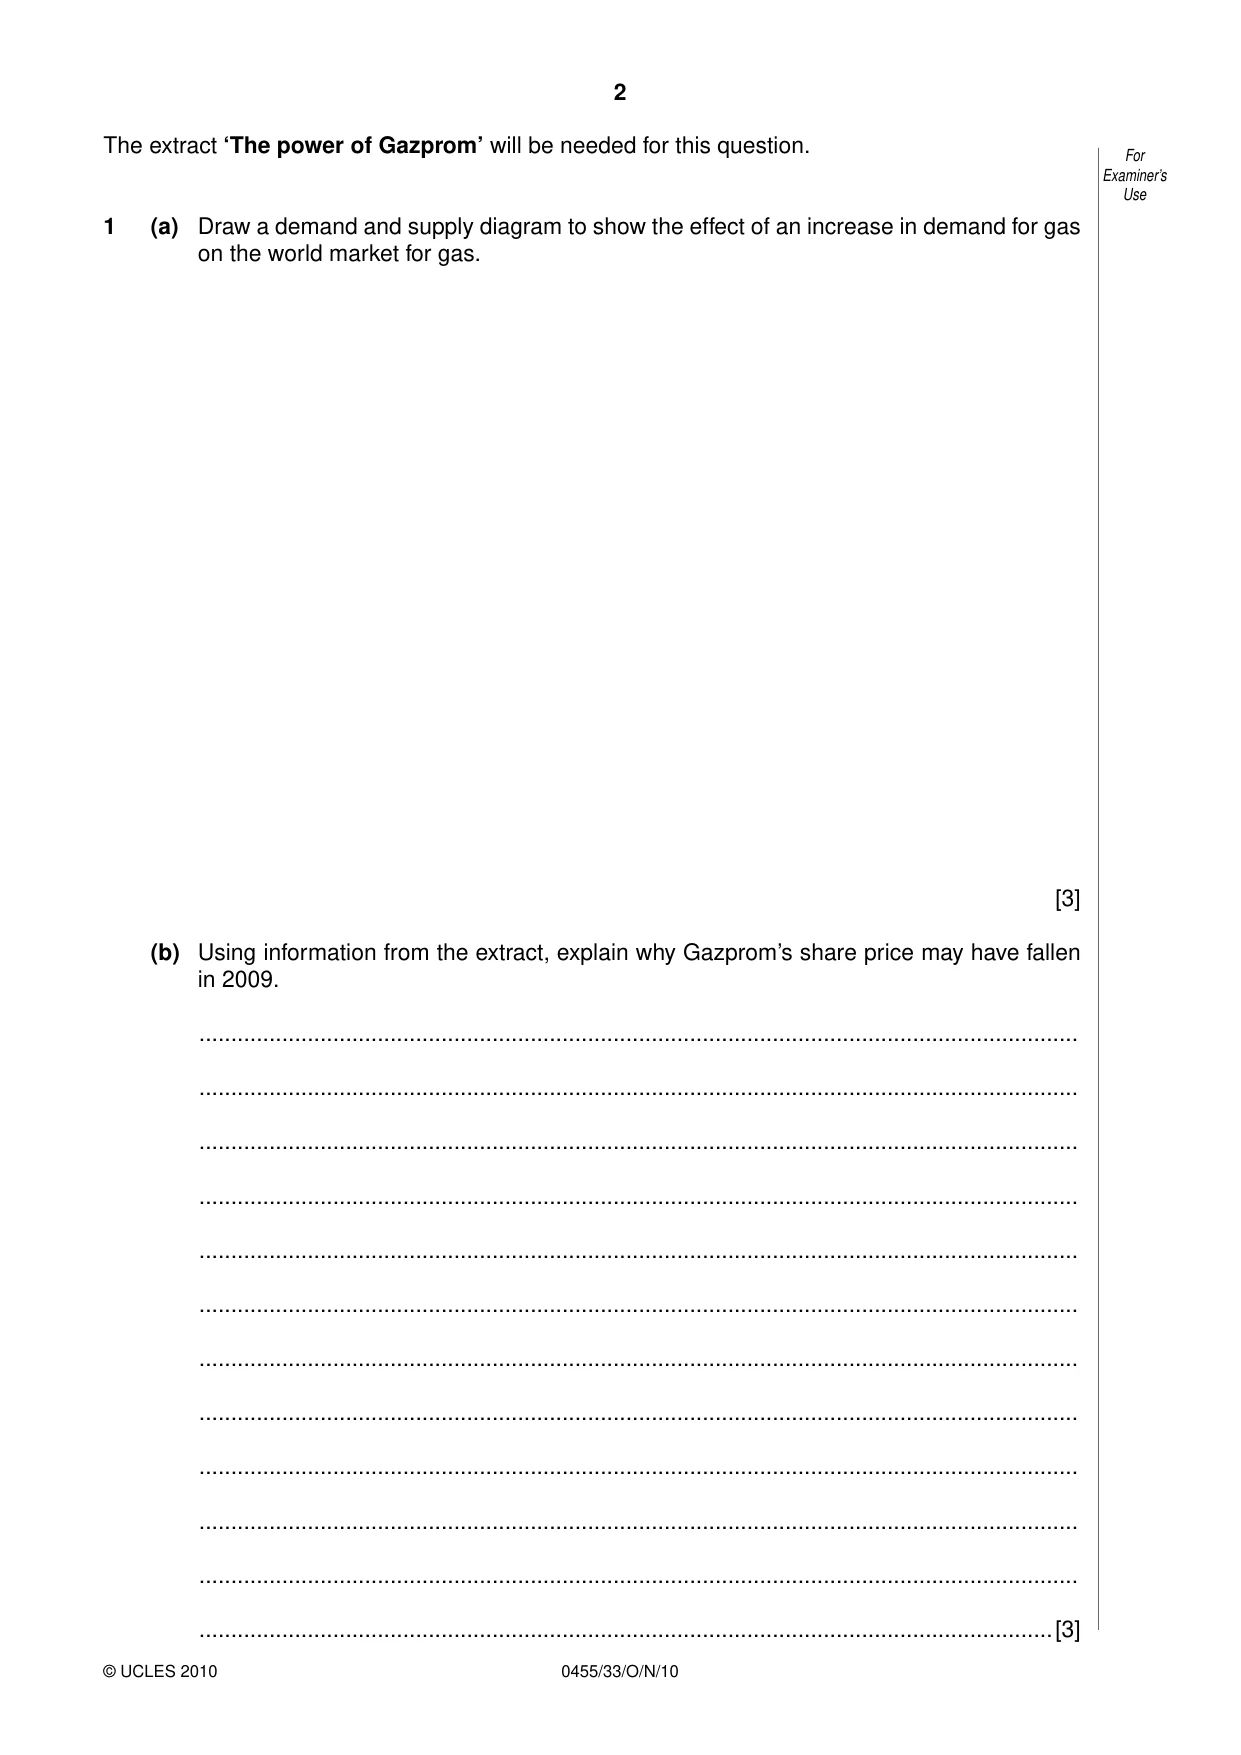
Q1 · Draw a demand and supply diagram to show the effect of an increase in demand for gas on…
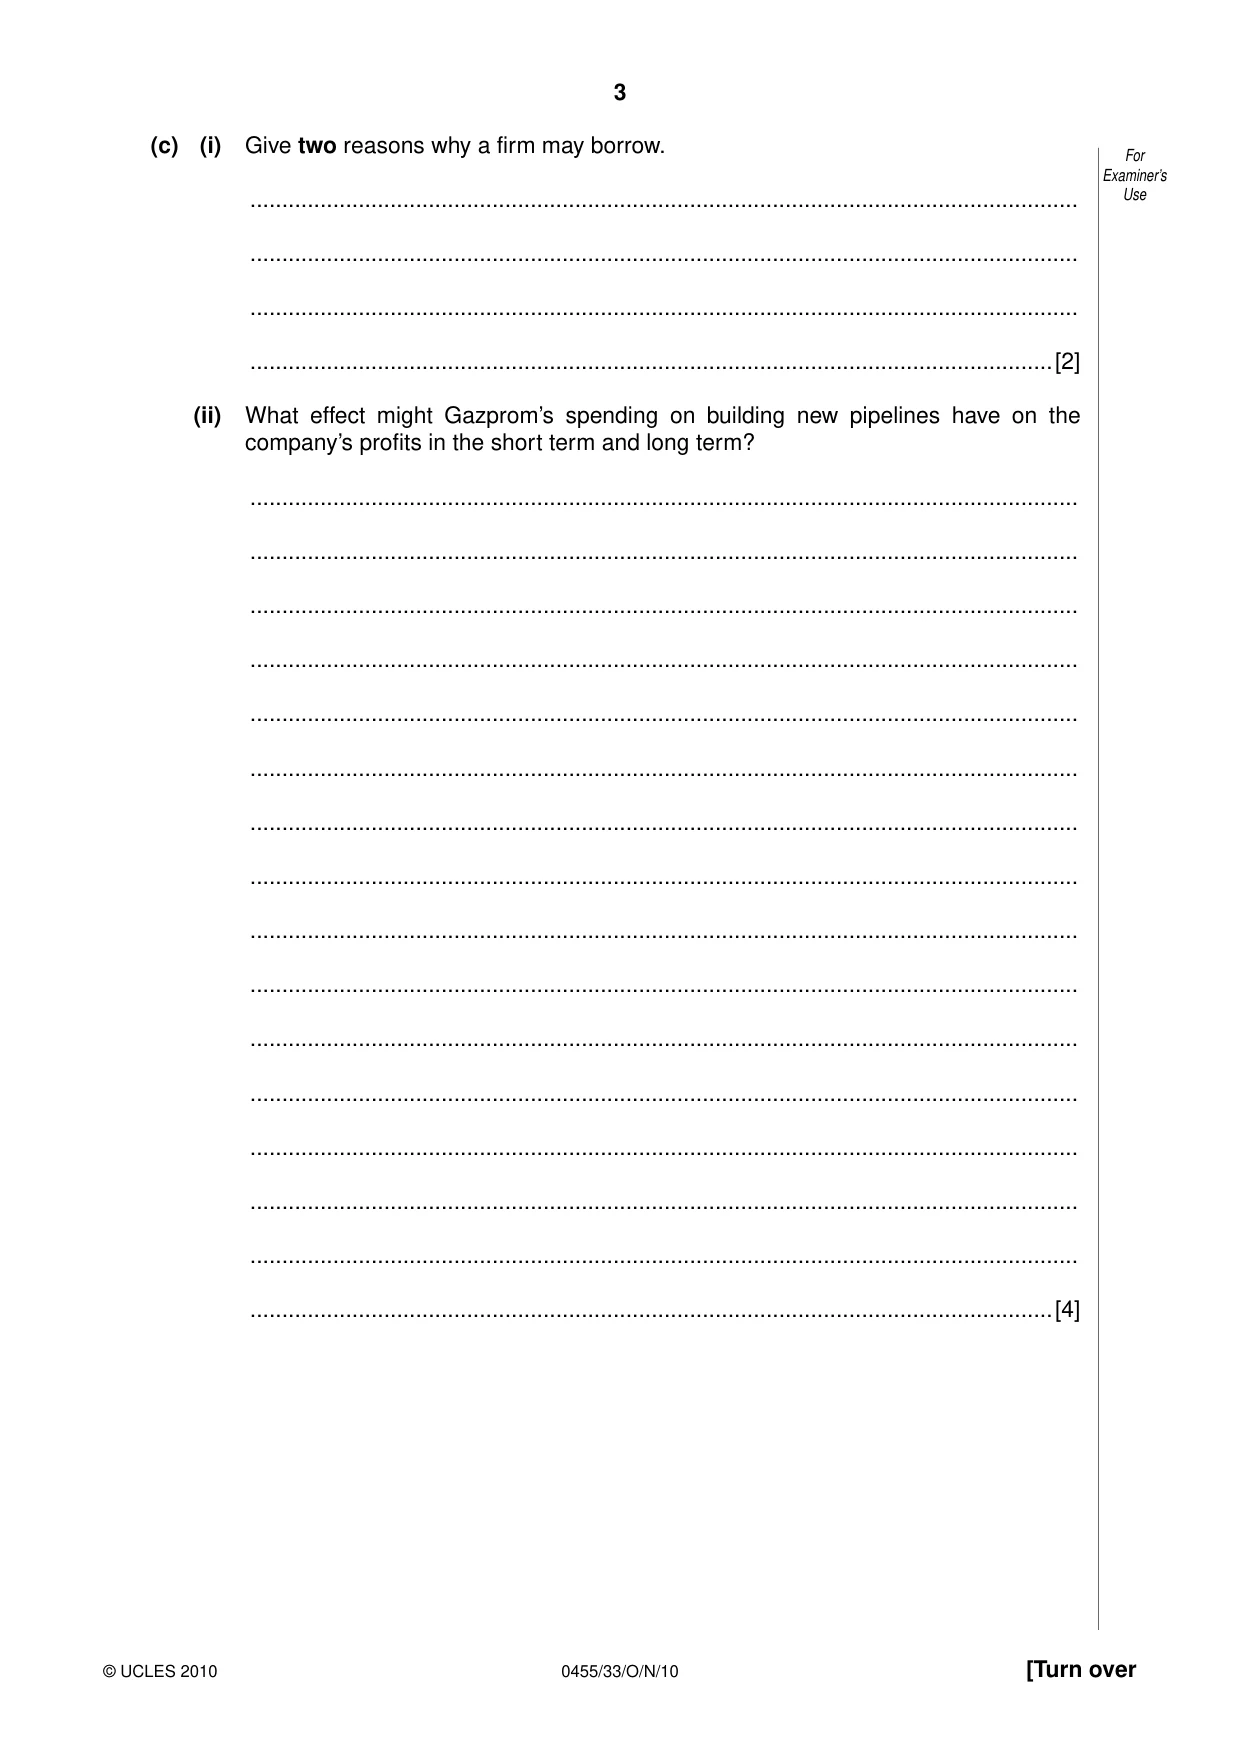
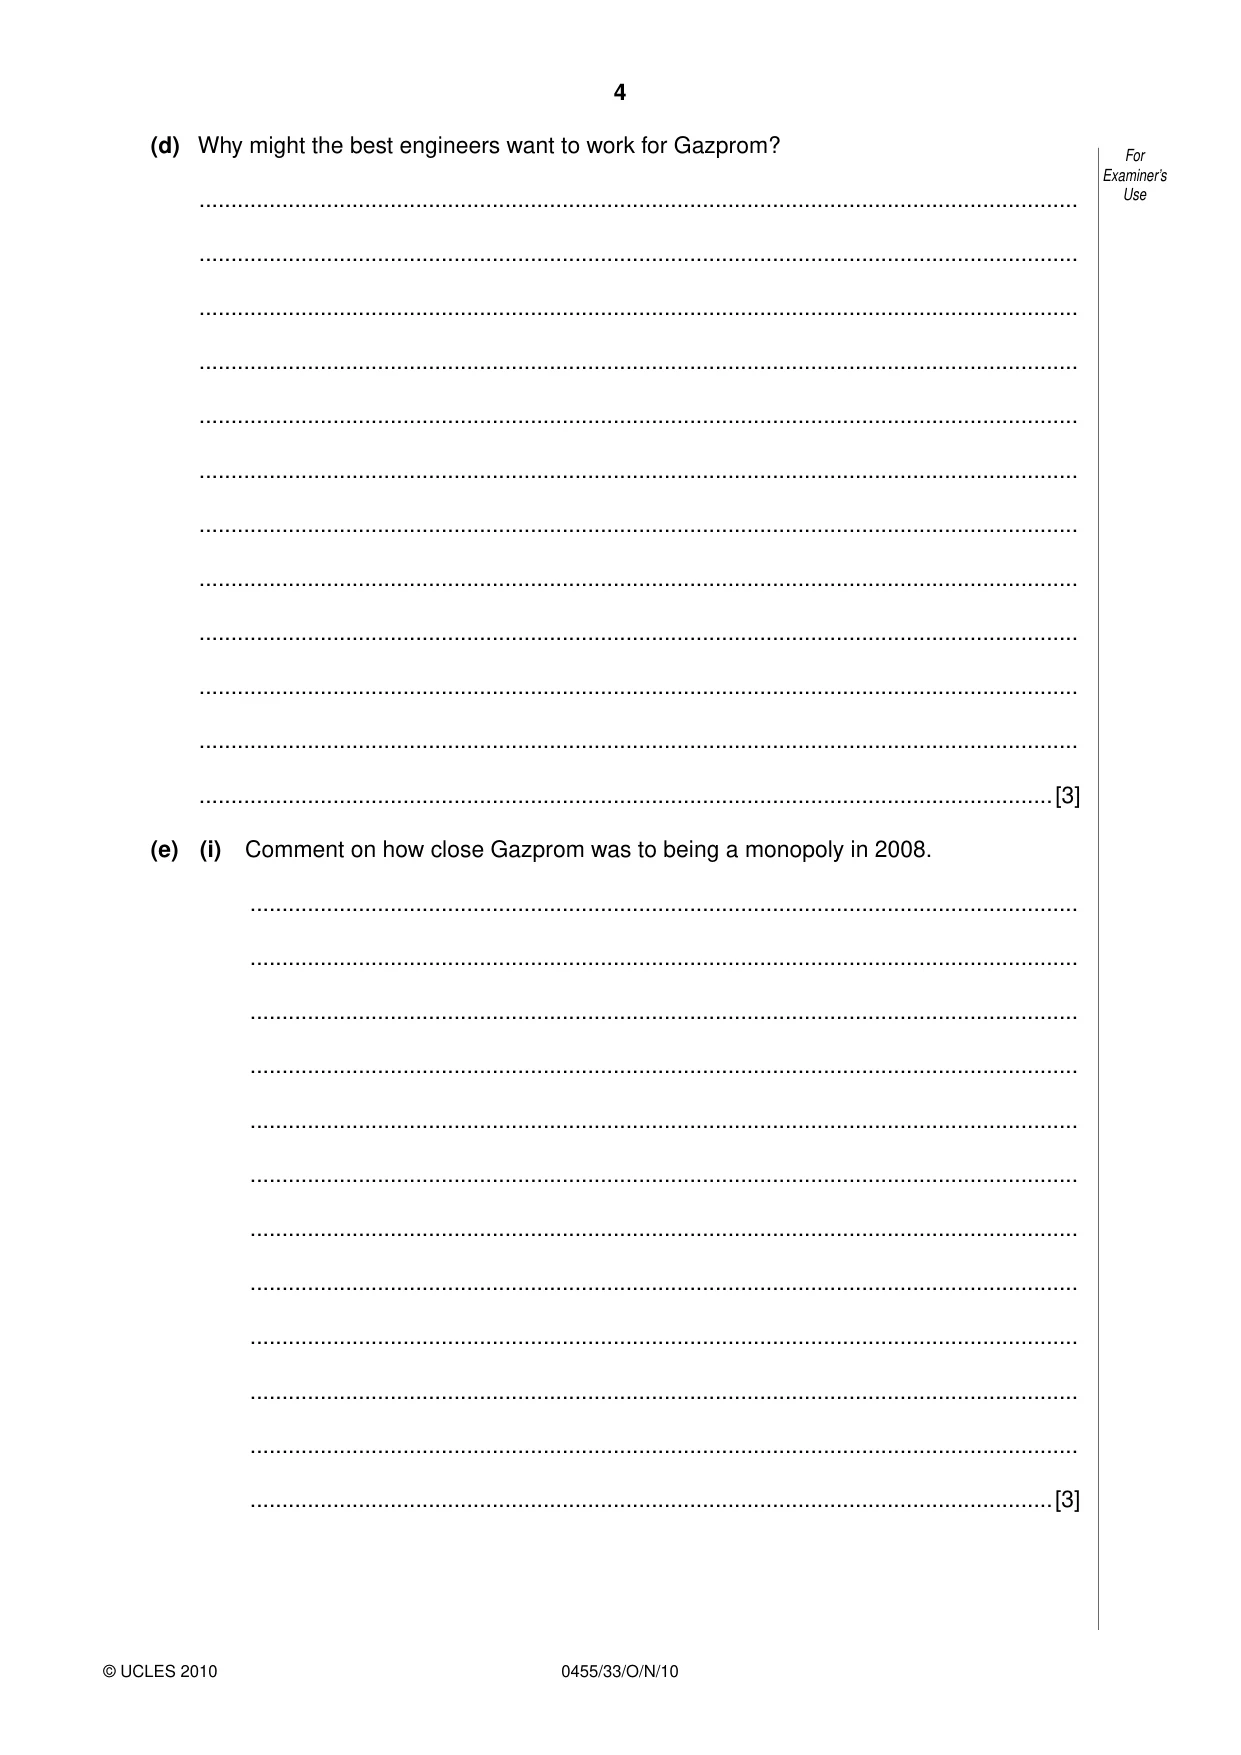
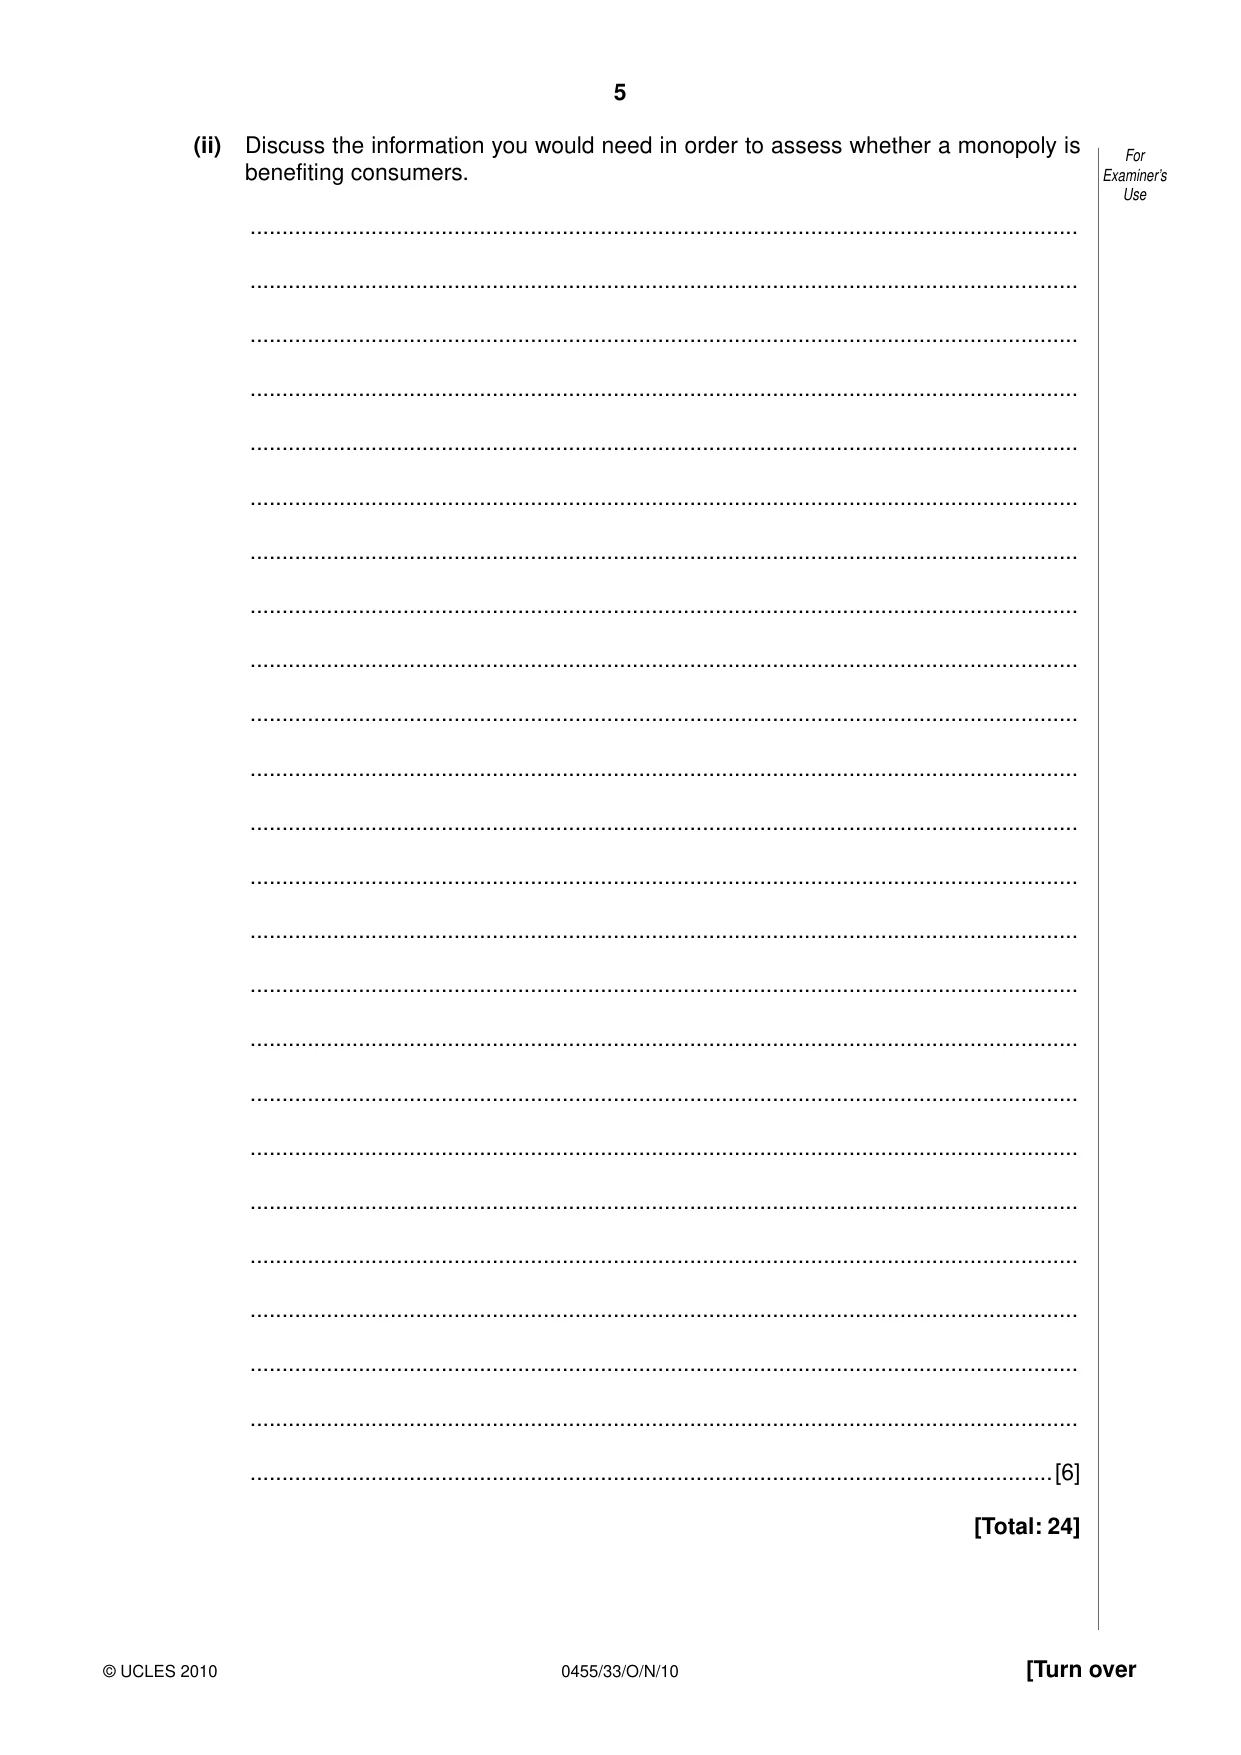
1 (a) Draw a demand and supply diagram to show the effect of an increase in demand for gas on the world market for gas. [3] (b) Using information from the extract, explain why Gazprom’s share price may have fallen in 2009. .......................................................................................................................................... .......................................................................................................................................... .......................................................................................................................................... .......................................................................................................................................... .......................................................................................................................................... .......................................................................................................................................... .......................................................................................................................................... .......................................................................................................................................... .......................................................................................................................................... .......................................................................................................................................... .......................................................................................................................................... ......................................................................................................................................[3] (c) (i) Give two reasons why a firm may borrow. .................................................................................................................................. .................................................................................................................................. .................................................................................................................................. ..............................................................................................................................[2] (ii) What effect might Gazprom’s spending on building new pipelines have on the company’s profits in the short term and long term? .................................................................................................................................. .................................................................................................................................. .................................................................................................................................. .................................................................................................................................. .................................................................................................................................. .................................................................................................................................. .................................................................................................................................. .................................................................................................................................. .................................................................................................................................. .................................................................................................................................. .................................................................................................................................. .................................................................................................................................. .................................................................................................................................. .................................................................................................................................. .................................................................................................................................. ..............................................................................................................................[4] (d) Why might the best engineers want to work for Gazprom? .......................................................................................................................................... .......................................................................................................................................... .......................................................................................................................................... .......................................................................................................................................... .......................................................................................................................................... .......................................................................................................................................... .......................................................................................................................................... .......................................................................................................................................... .......................................................................................................................................... .......................................................................................................................................... .......................................................................................................................................... ......................................................................................................................................[3] (e) (i) Comment on how close Gazprom was to being a monopoly in 2008. .................................................................................................................................. .................................................................................................................................. .................................................................................................................................. .................................................................................................................................. .................................................................................................................................. .................................................................................................................................. .................................................................................................................................. .................................................................................................................................. .................................................................................................................................. .................................................................................................................................. .................................................................................................................................. ..............................................................................................................................[3] (ii) Discuss the information you would need in order to assess whether a monopoly is benefiting consumers. .................................................................................................................................. .................................................................................................................................. .................................................................................................................................. .................................................................................................................................. .................................................................................................................................. .................................................................................................................................. .................................................................................................................................. .................................................................................................................................. .................................................................................................................................. .................................................................................................................................. .................................................................................................................................. .................................................................................................................................. .................................................................................................................................. .................................................................................................................................. .................................................................................................................................. .................................................................................................................................. .................................................................................................................................. .................................................................................................................................. .................................................................................................................................. .................................................................................................................................. .................................................................................................................................. .................................................................................................................................. .................................................................................................................................. ..............................................................................................................................[6] [Total: 24] The extract ‘Information on Gross Domestic Product (GDP), Human Development Index (HDI), foreign aid and health expenditure in selected countries’ will be needed for this question.
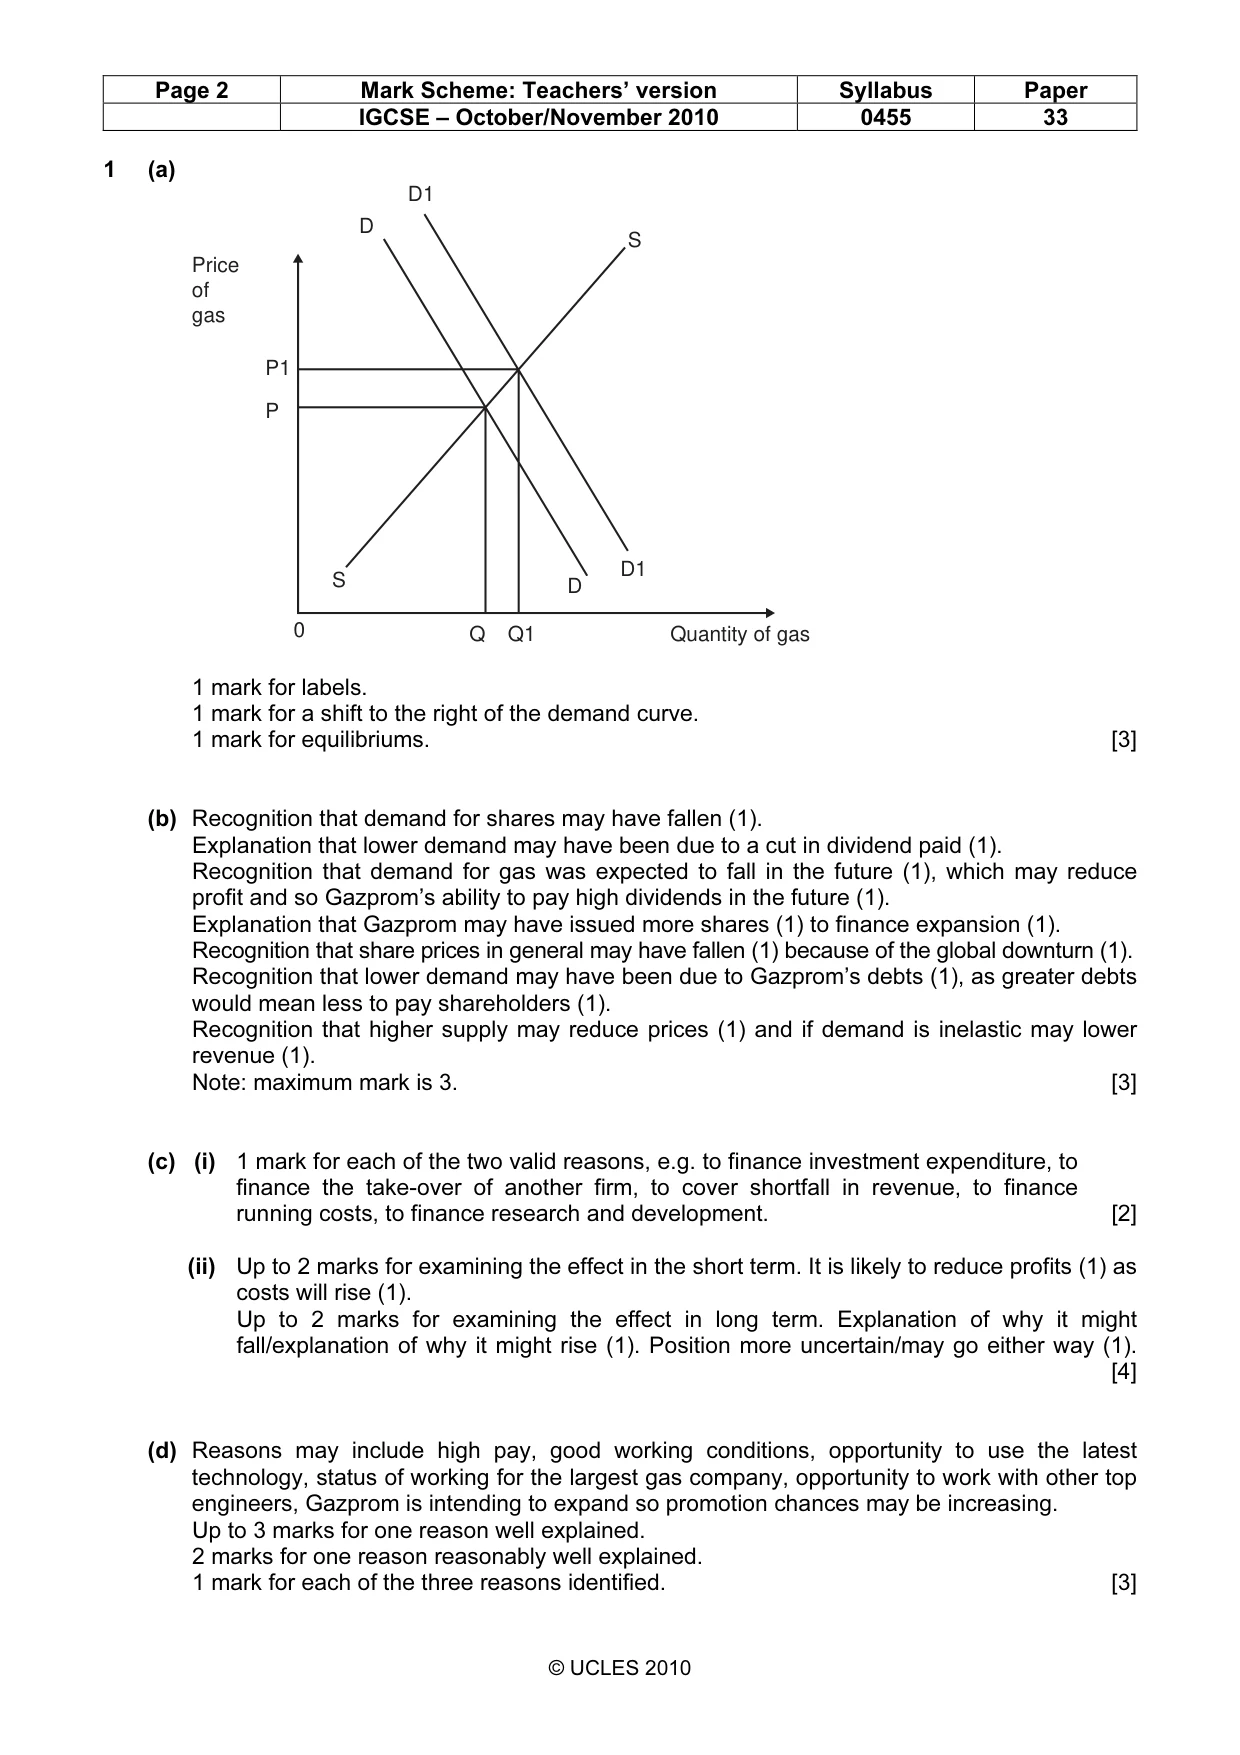
Mark scheme: 1 (a) D1 D S Price of gas P1 P D1 S D 0 Q Q1 Quantity of gas 1 mark for labels. 1 mark for a shift to the right of the demand curve. 1 mark for equilibriums. [3] (b) Recognition that demand for shares may have fallen (1). Explanation that lower demand may have been due to a cut in dividend paid (1). Recognition that demand for gas was expected to fall in the future (1), which may reduce profit and so Gazprom’s ability to pay high dividends in the future (1). Explanation that Gazprom may have issued more shares (1) to finance expansion (1). Recognition that share prices in general may have fallen (1) because of the global downturn (1). Recognition that lower demand may have been due to Gazprom’s debts (1), as greater debts would mean less to pay shareholders (1). Recognition that higher supply may reduce prices (1) and if demand is inelastic may lower revenue (1). Note: maximum mark is 3. [3] (c) (i) 1 mark for each of the two valid reasons, e.g. to finance investment expenditure, to finance the take-over of another firm, to cover shortfall in revenue, to finance running costs, to finance research and development. [2] (ii) Up to 2 marks for examining the effect in the short term. It is likely to reduce profits (1) as costs will rise (1). Up to 2 marks for examining the effect in long term. Explanation of why it might fall/explanation of why it might rise (1). Position more uncertain/may go either way (1). [4] (d) Reasons may include high pay, good working conditions, opportunity to use the latest technology, status of working for the largest gas company, opportunity to work with other top engineers, Gazprom is intending to expand so promotion chances may be increasing. Up to 3 marks for one reason well explained. 2 marks for one reason reasonably well explained. 1 mark for each of the three reasons identified. [3] IGCSE – October/November 2010 0455 33 (e) (i) Defining monopoly (1). Clear judgement on position in Russia (1). Clear judgement on position in Europe (1). No information given on share of sales in other parts of the world so judgement cannot be made on world market share (1). Recognition that a monopoly can be defined in more than one way (1). [3] (ii) Consumers may be disadvantaged as a result of high prices, poor quality, lack of choice and lack of innovation. On the other hand, they may benefit from low prices due to low costs arising from economies of scale, reliability of supply, large profits may lead to more spending on research and development, which can lead to more innovation and better quality. Candidates should consider what needs to be assessed, e.g. how prices, costs, range of products, profit and innovation might compare with a more competitive situation. Up to 4 marks for one-sided view. Up to 6 marks for two-sided view. [6]
Q2 · Economists expect countries which have a high GDP per head to have a high HDI value
2 (a) Economists expect countries which have a high GDP per head to have a high HDI value. Does the information in the extract support this expected relationship? .......................................................................................................................................... .......................................................................................................................................... .......................................................................................................................................... .......................................................................................................................................... .......................................................................................................................................... .......................................................................................................................................... .......................................................................................................................................... .......................................................................................................................................... .......................................................................................................................................... .......................................................................................................................................... .......................................................................................................................................... .......................................................................................................................................... .......................................................................................................................................... .......................................................................................................................................... .......................................................................................................................................... ......................................................................................................................................[4] (b) Explain why a country may have a relatively high GDP per head but a relatively low HDI value. .......................................................................................................................................... .......................................................................................................................................... .......................................................................................................................................... .......................................................................................................................................... .......................................................................................................................................... .......................................................................................................................................... .......................................................................................................................................... .......................................................................................................................................... .......................................................................................................................................... .......................................................................................................................................... .......................................................................................................................................... ......................................................................................................................................[3] (c) (i) Explain how a country’s level of GDP per head might be expected to affect the level of foreign aid received per head. .................................................................................................................................. .................................................................................................................................. .................................................................................................................................. .................................................................................................................................. .................................................................................................................................. .................................................................................................................................. .................................................................................................................................. ..............................................................................................................................[2] (ii) Does the information in the extract confirm this expected relationship between GDP per head and the level of foreign aid received per head? .................................................................................................................................. .................................................................................................................................. .................................................................................................................................. .................................................................................................................................. .................................................................................................................................. .................................................................................................................................. .................................................................................................................................. ..............................................................................................................................[2]
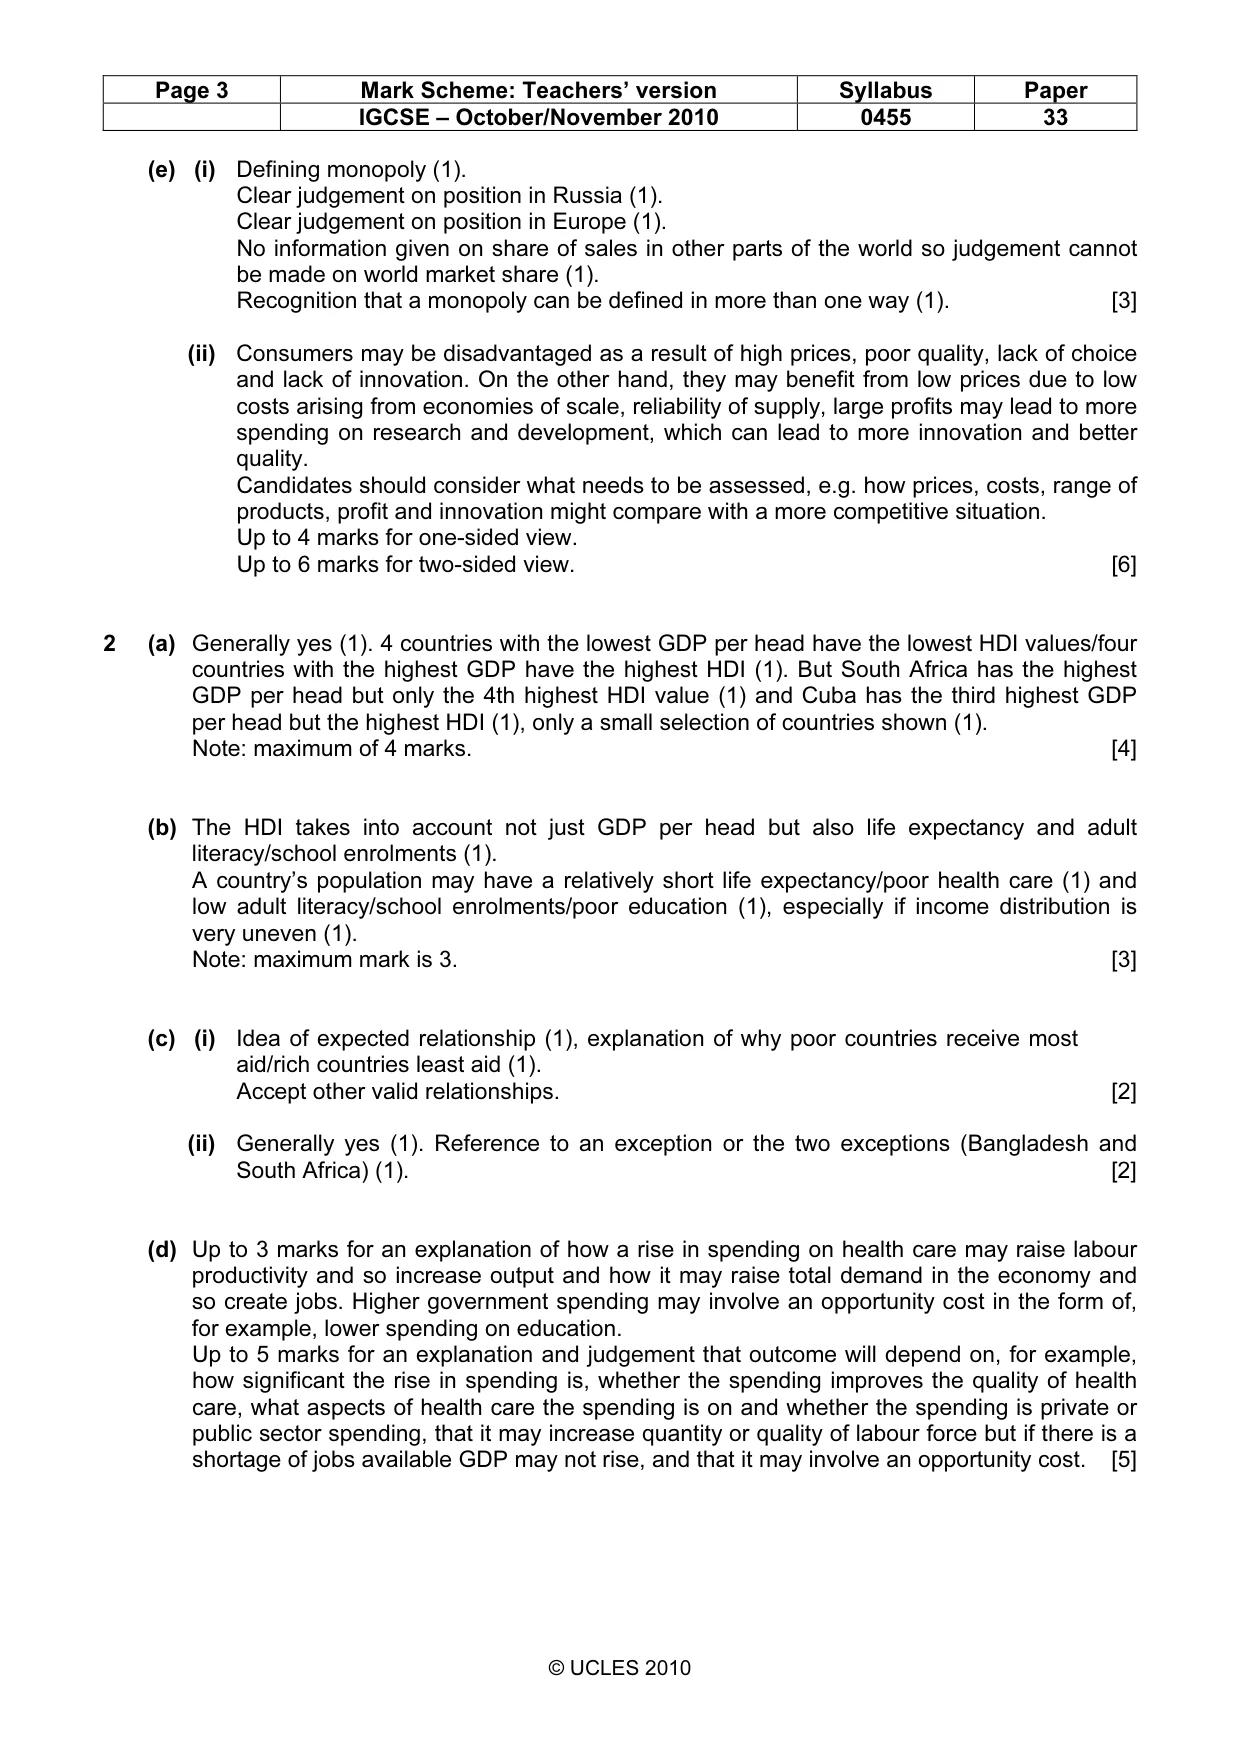
Mark scheme: 2 (a) Generally yes (1). 4 countries with the lowest GDP per head have the lowest HDI values/four countries with the highest GDP have the highest HDI (1). But South Africa has the highest GDP per head but only the 4th highest HDI value (1) and Cuba has the third highest GDP per head but the highest HDI (1), only a small selection of countries shown (1). Note: maximum of 4 marks. [4] (b) The HDI takes into account not just GDP per head but also life expectancy and adult literacy/school enrolments (1). A country’s population may have a relatively short life expectancy/poor health care (1) and low adult literacy/school enrolments/poor education (1), especially if income distribution is very uneven (1). Note: maximum mark is 3. [3] (c) (i) Idea of expected relationship (1), explanation of why poor countries receive most aid/rich countries least aid (1). Accept other valid relationships. [2] (ii) Generally yes (1). Reference to an exception or the two exceptions (Bangladesh and South Africa) (1). [2] (d) Up to 3 marks for an explanation of how a rise in spending on health care may raise labour productivity and so increase output and how it may raise total demand in the economy and so create jobs. Higher government spending may involve an opportunity cost in the form of, for example, lower spending on education. Up to 5 marks for an explanation and judgement that outcome will depend on, for example, how significant the rise in spending is, whether the spending improves the quality of health care, what aspects of health care the spending is on and whether the spending is private or public sector spending, that it may increase quantity or quality of labour force but if there is a shortage of jobs available GDP may not rise, and that it may involve an opportunity cost. [5]
More questions on Differences in economic development between countries
What was in this paper
The subtopics covered by these 2 questions, and how many questions each got. Open one in a new tab to see every Cambridge question on it.
What you needed in this session
Cambridge’s own grade thresholds for 2010 Oct/Nov, Paper 3 · Variant 3. A higher threshold means an easier paper — the bar moves with how the cohort did.