Cambridge IGCSE Chemistry (9-1) 0971 — 2020 Oct/Nov Paper 6 · Variant 2
0971/62/O/N/20 · 4 questions · 40 marks · ≈45 min
The question paper and its mark scheme, free to read here and free to download. This is Cambridge’s own paper, exactly as it was sat.
Question paper12 pages


Mark scheme8 pages
Answers below. Sit the paper first if you are practising.
Questions as text
Q1 · The diagram shows the apparatus used to pass an electric current through concentrated…
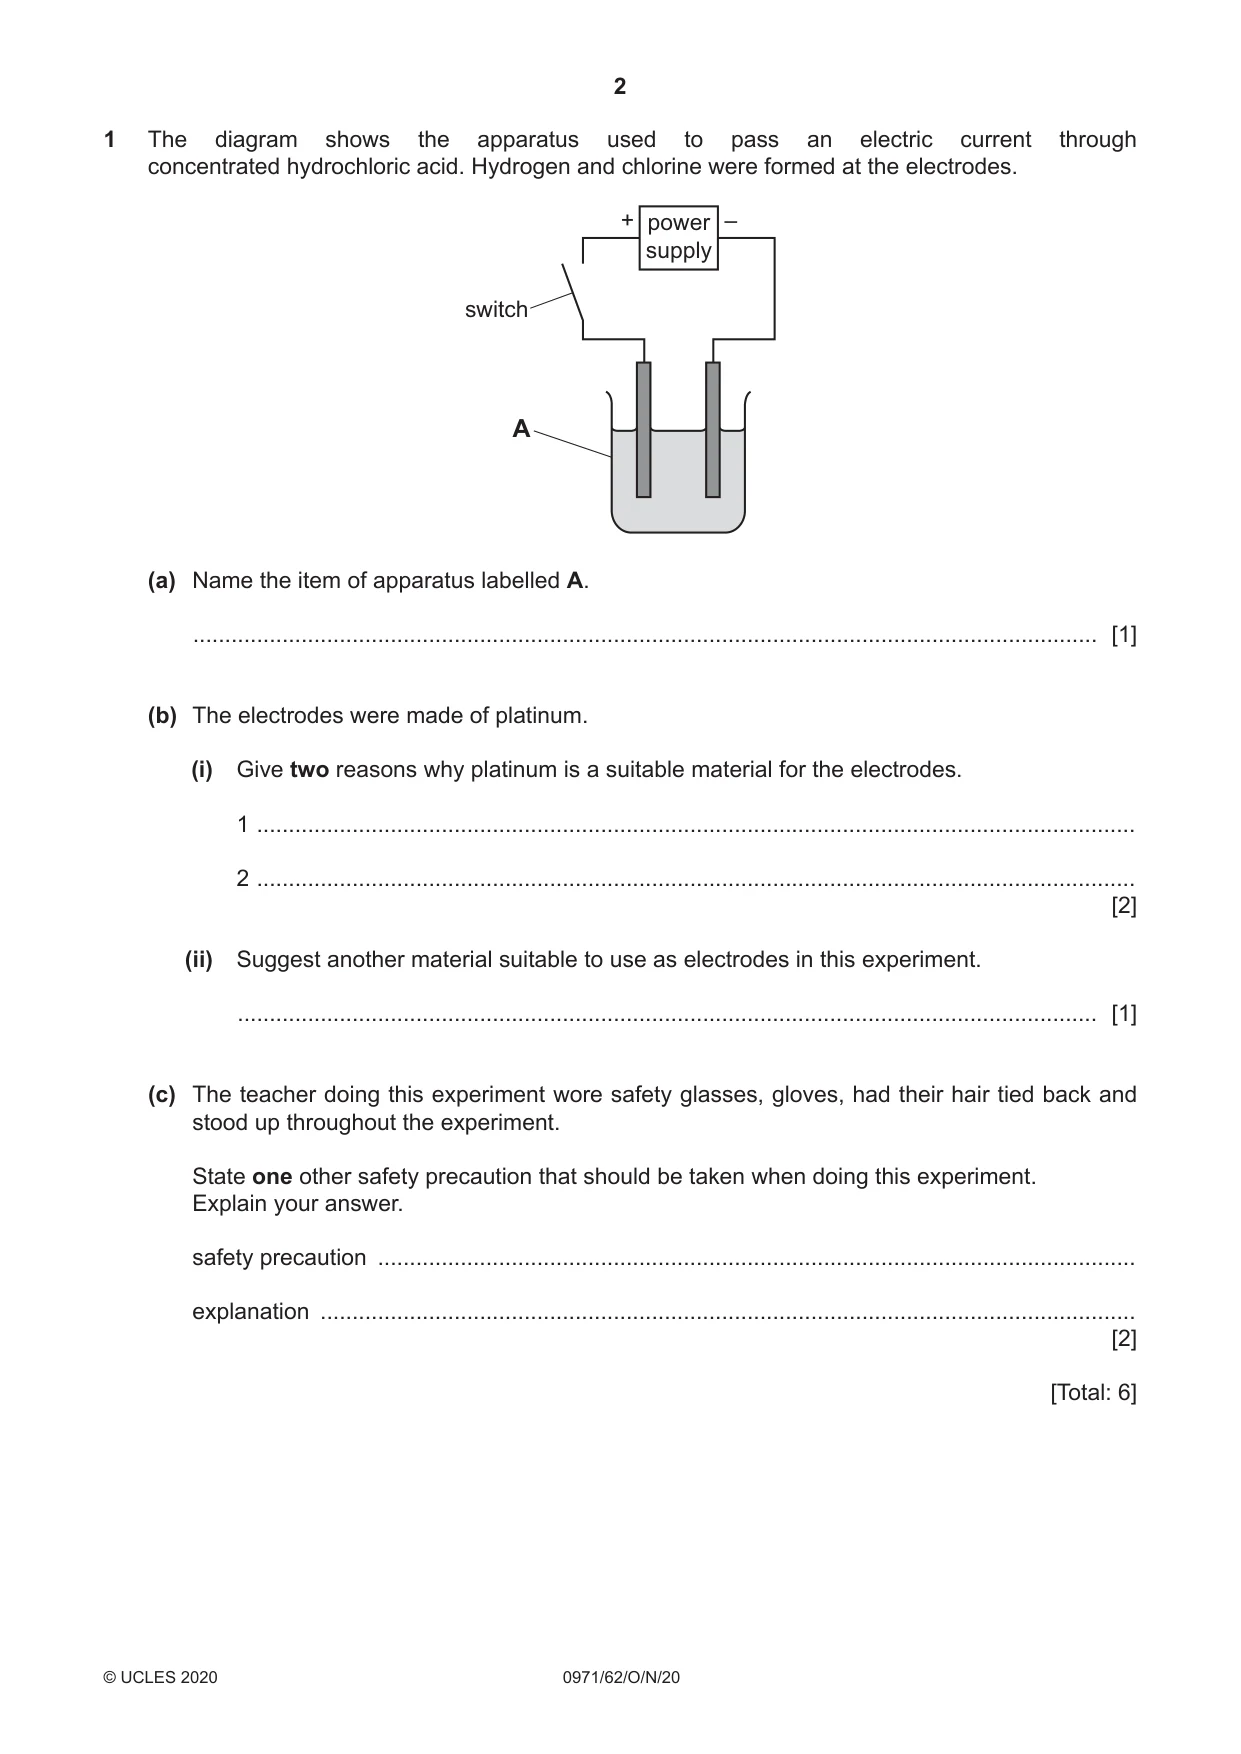
1 The diagram shows the apparatus used to pass an electric current through concentrated hydrochloric acid. Hydrogen and chlorine were formed at the electrodes. + power – supply switch A (a) Name the item of apparatus labelled A. .............................................................................................................................................. [1] (b) The electrodes were made of platinum. (i) Give two reasons why platinum is a suitable material for the electrodes. 1 .......................................................................................................................................... 2 .......................................................................................................................................... [2] (ii) Suggest another material suitable to use as electrodes in this experiment. ....................................................................................................................................... [1] (c) The teacher doing this experiment wore safety glasses, gloves, had their hair tied back and stood up throughout the experiment. State one other safety precaution that should be taken when doing this experiment. Explain your answer. safety precaution ........................................................................................................................ explanation ................................................................................................................................. [2] [Total: 6]
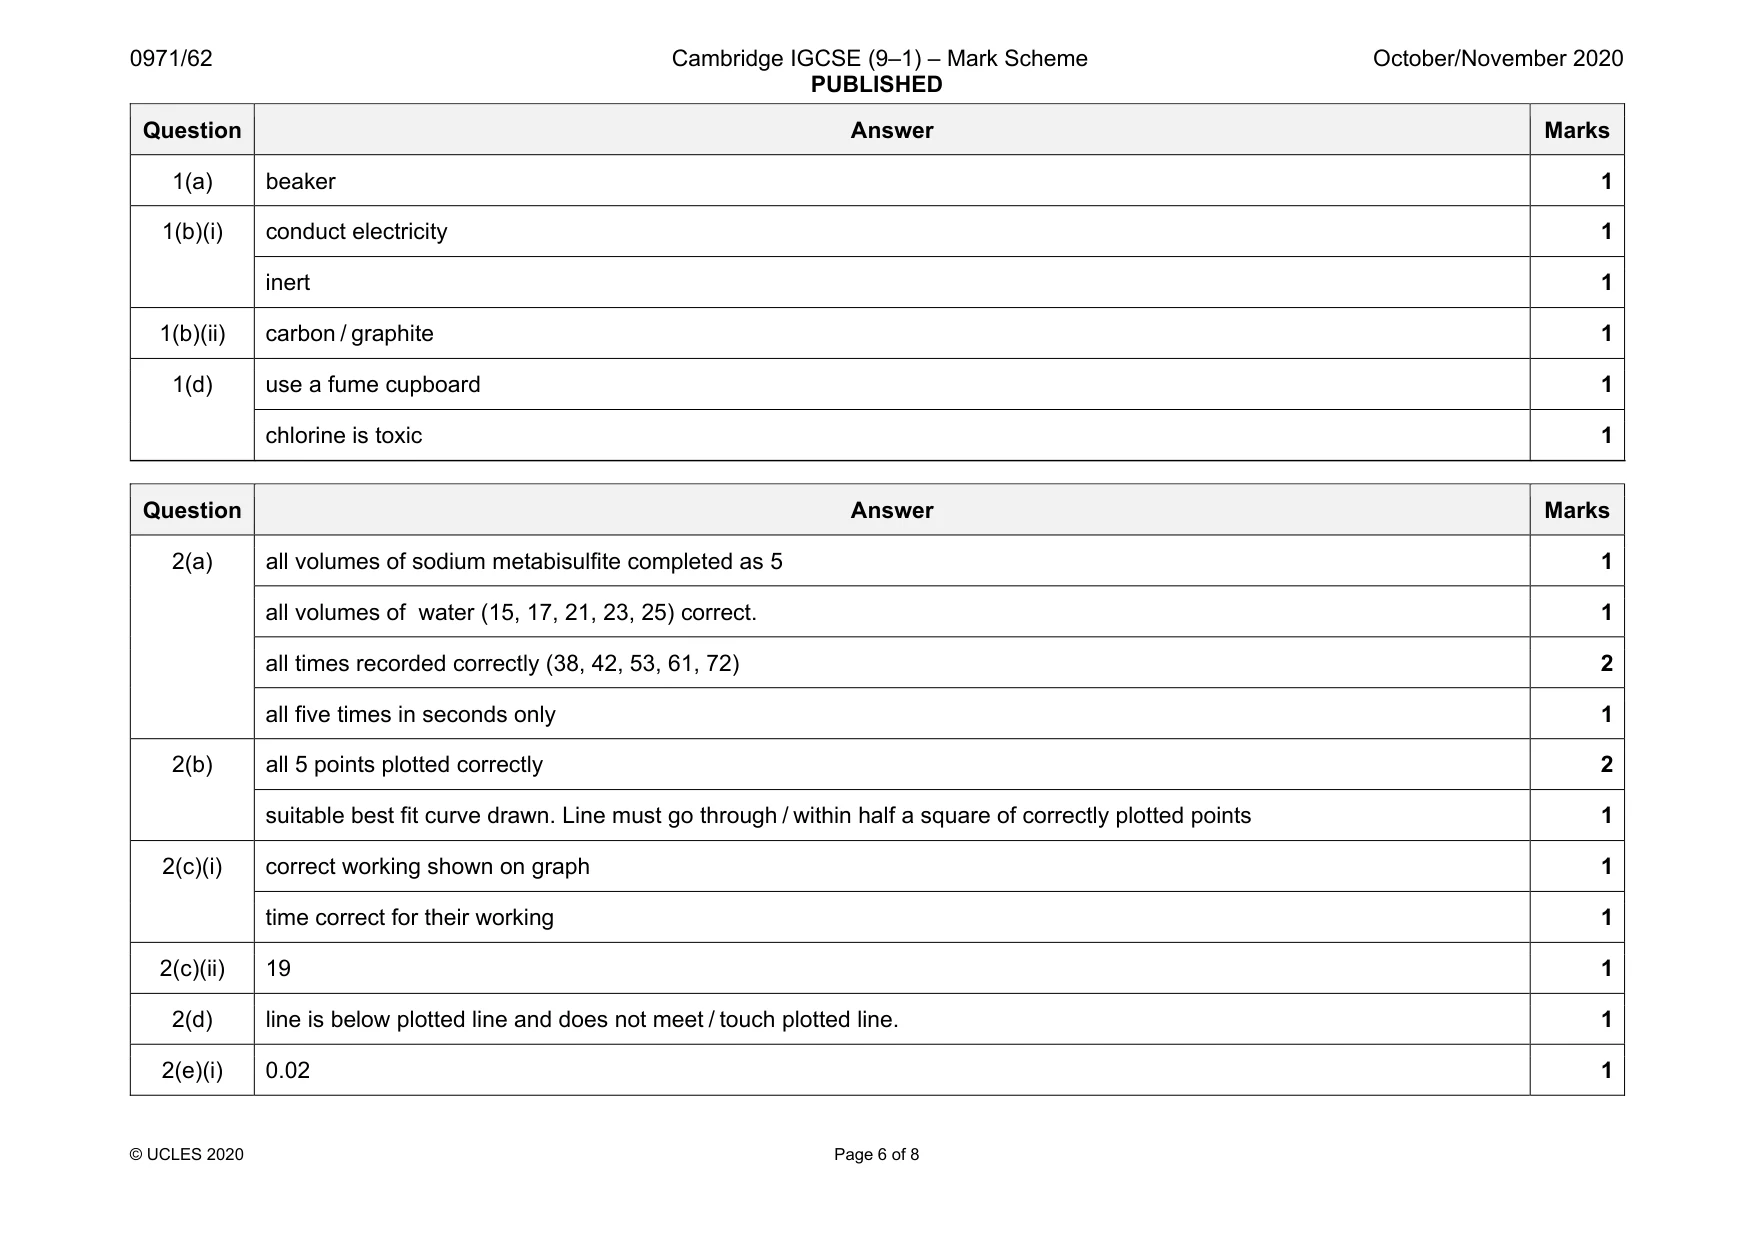
Mark scheme: 1(a) beaker 1 1(b)(i) conduct electricity 1 inert 1 1(b)(ii) carbon / graphite 1 1(d) use a fume cupboard 1 chlorine is toxic 1
Q2 · A student investigated the rate of a reaction between sodium metabisulfite and potassium…
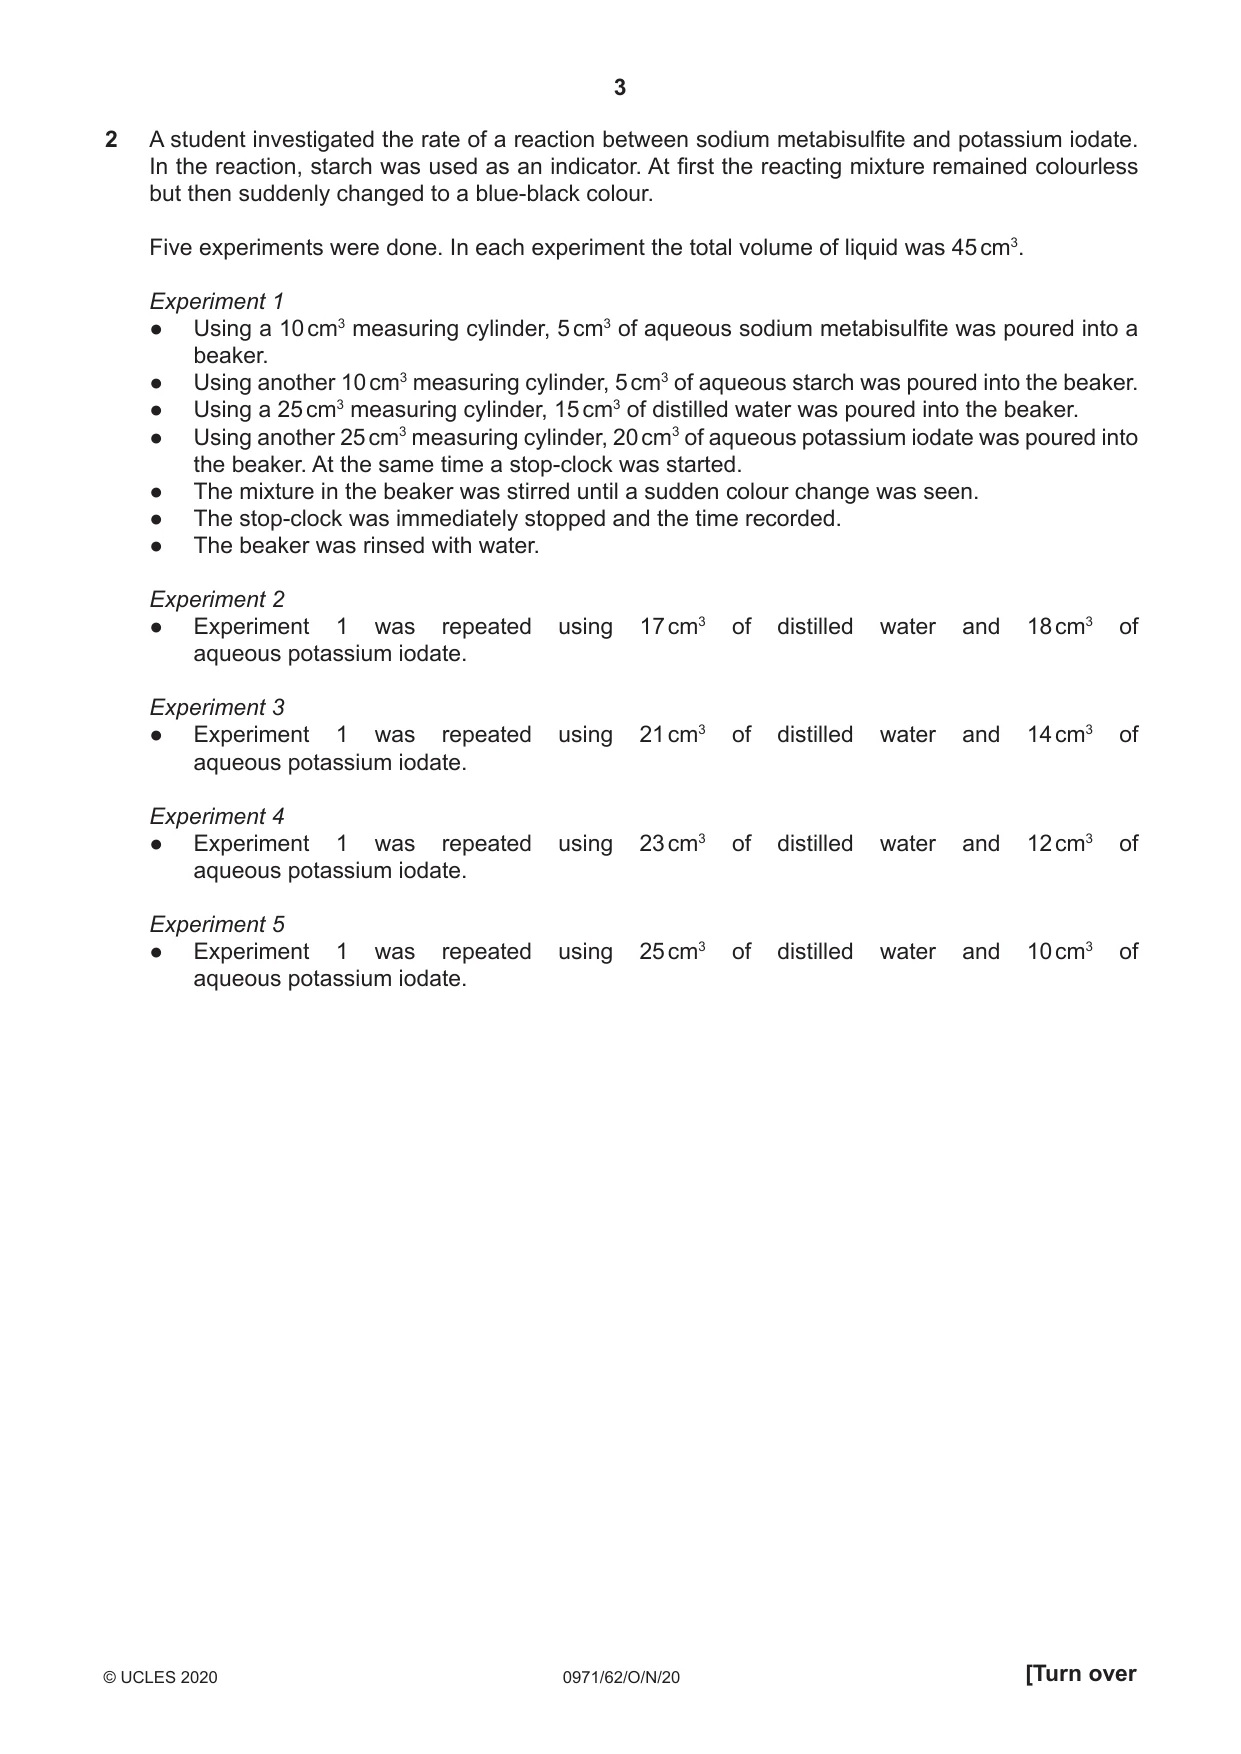
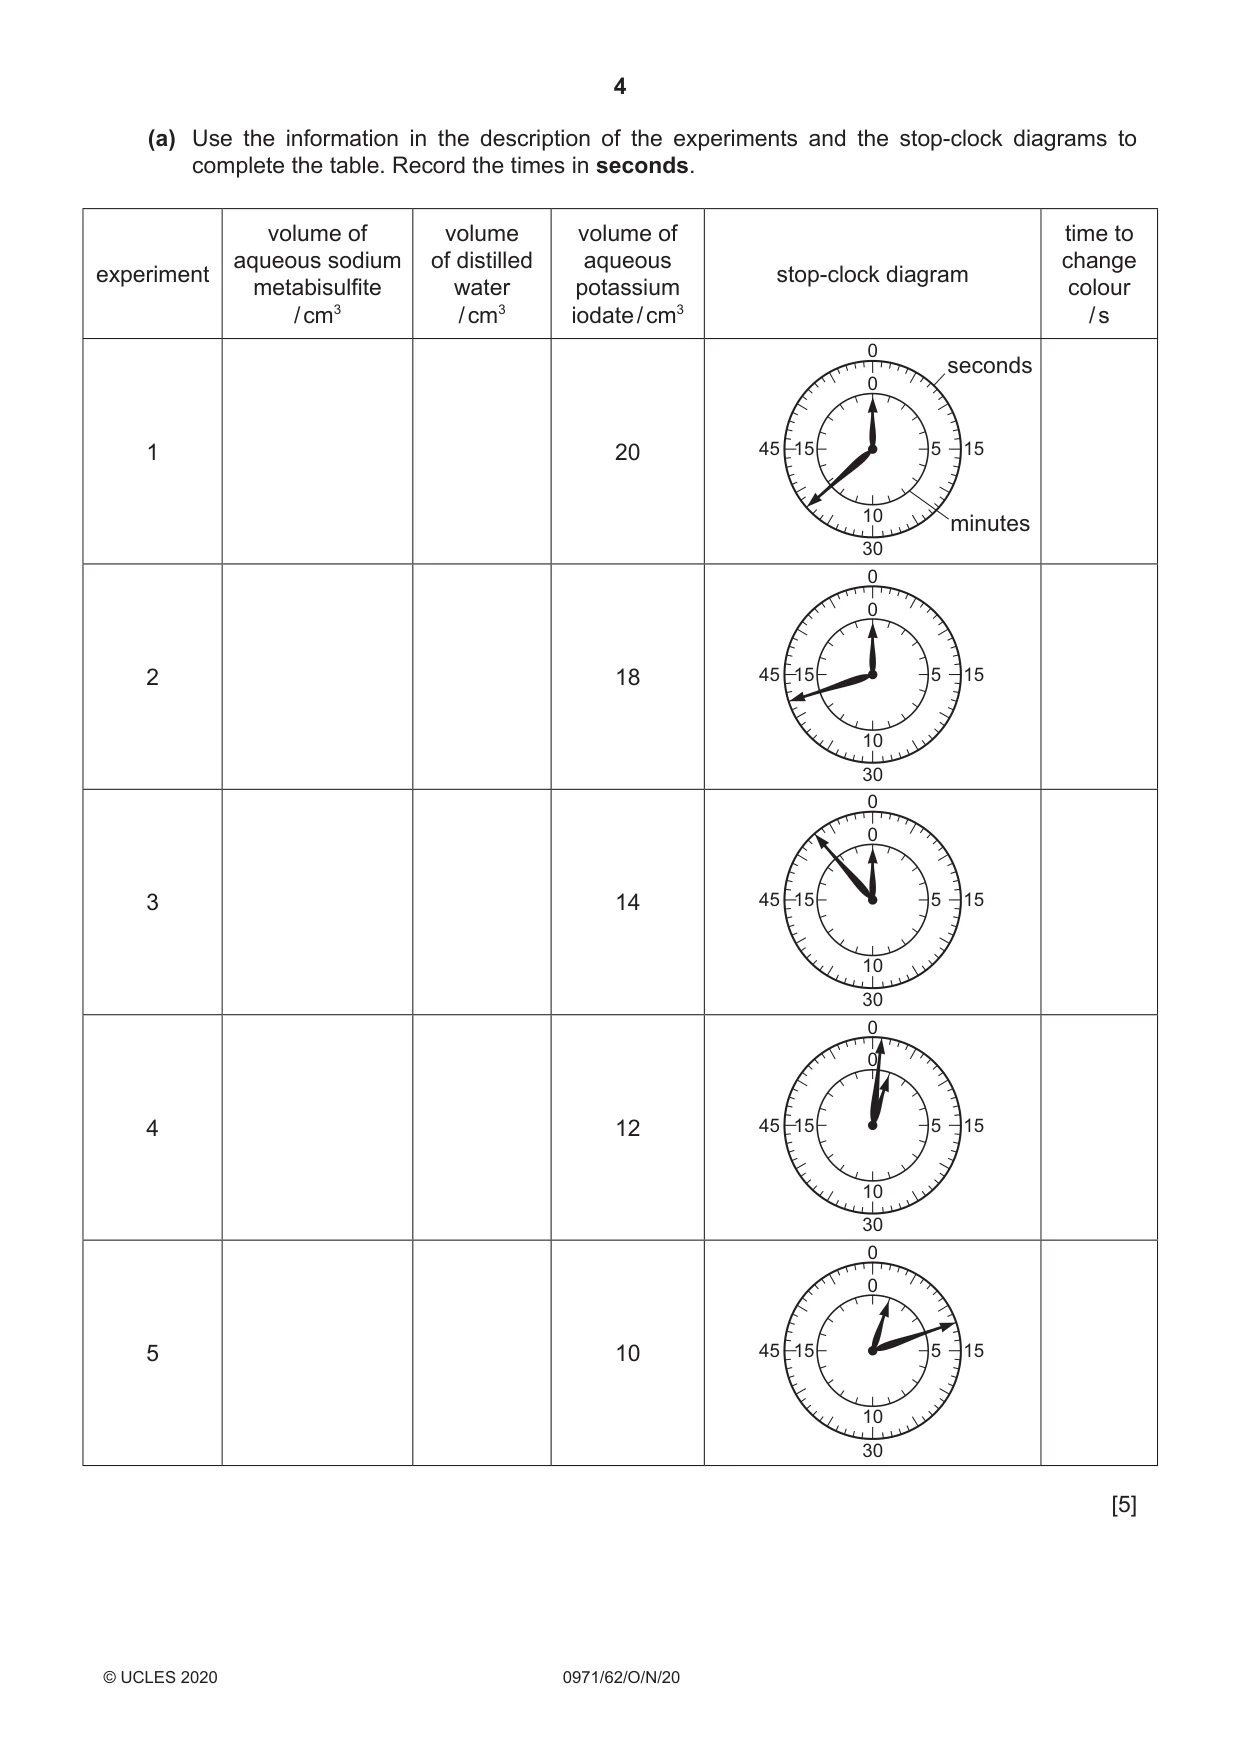
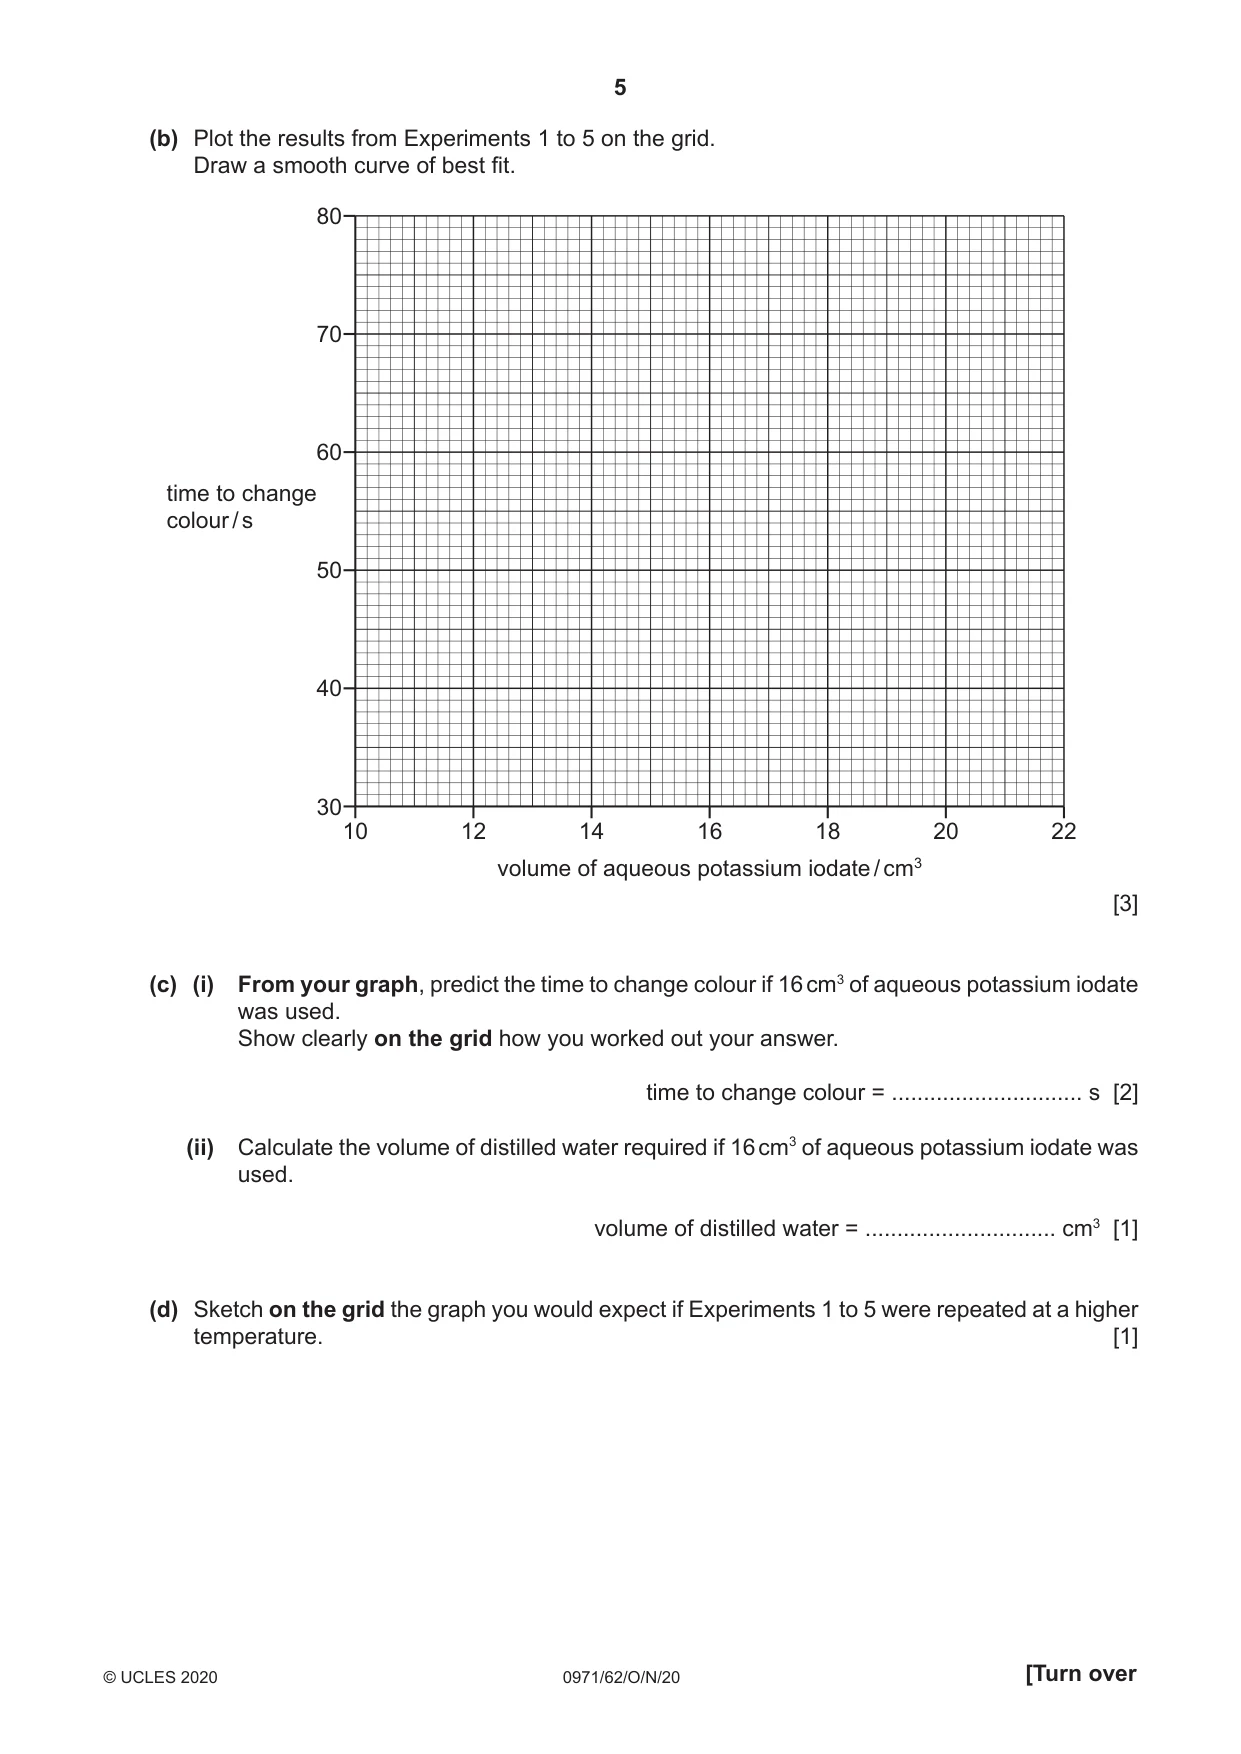
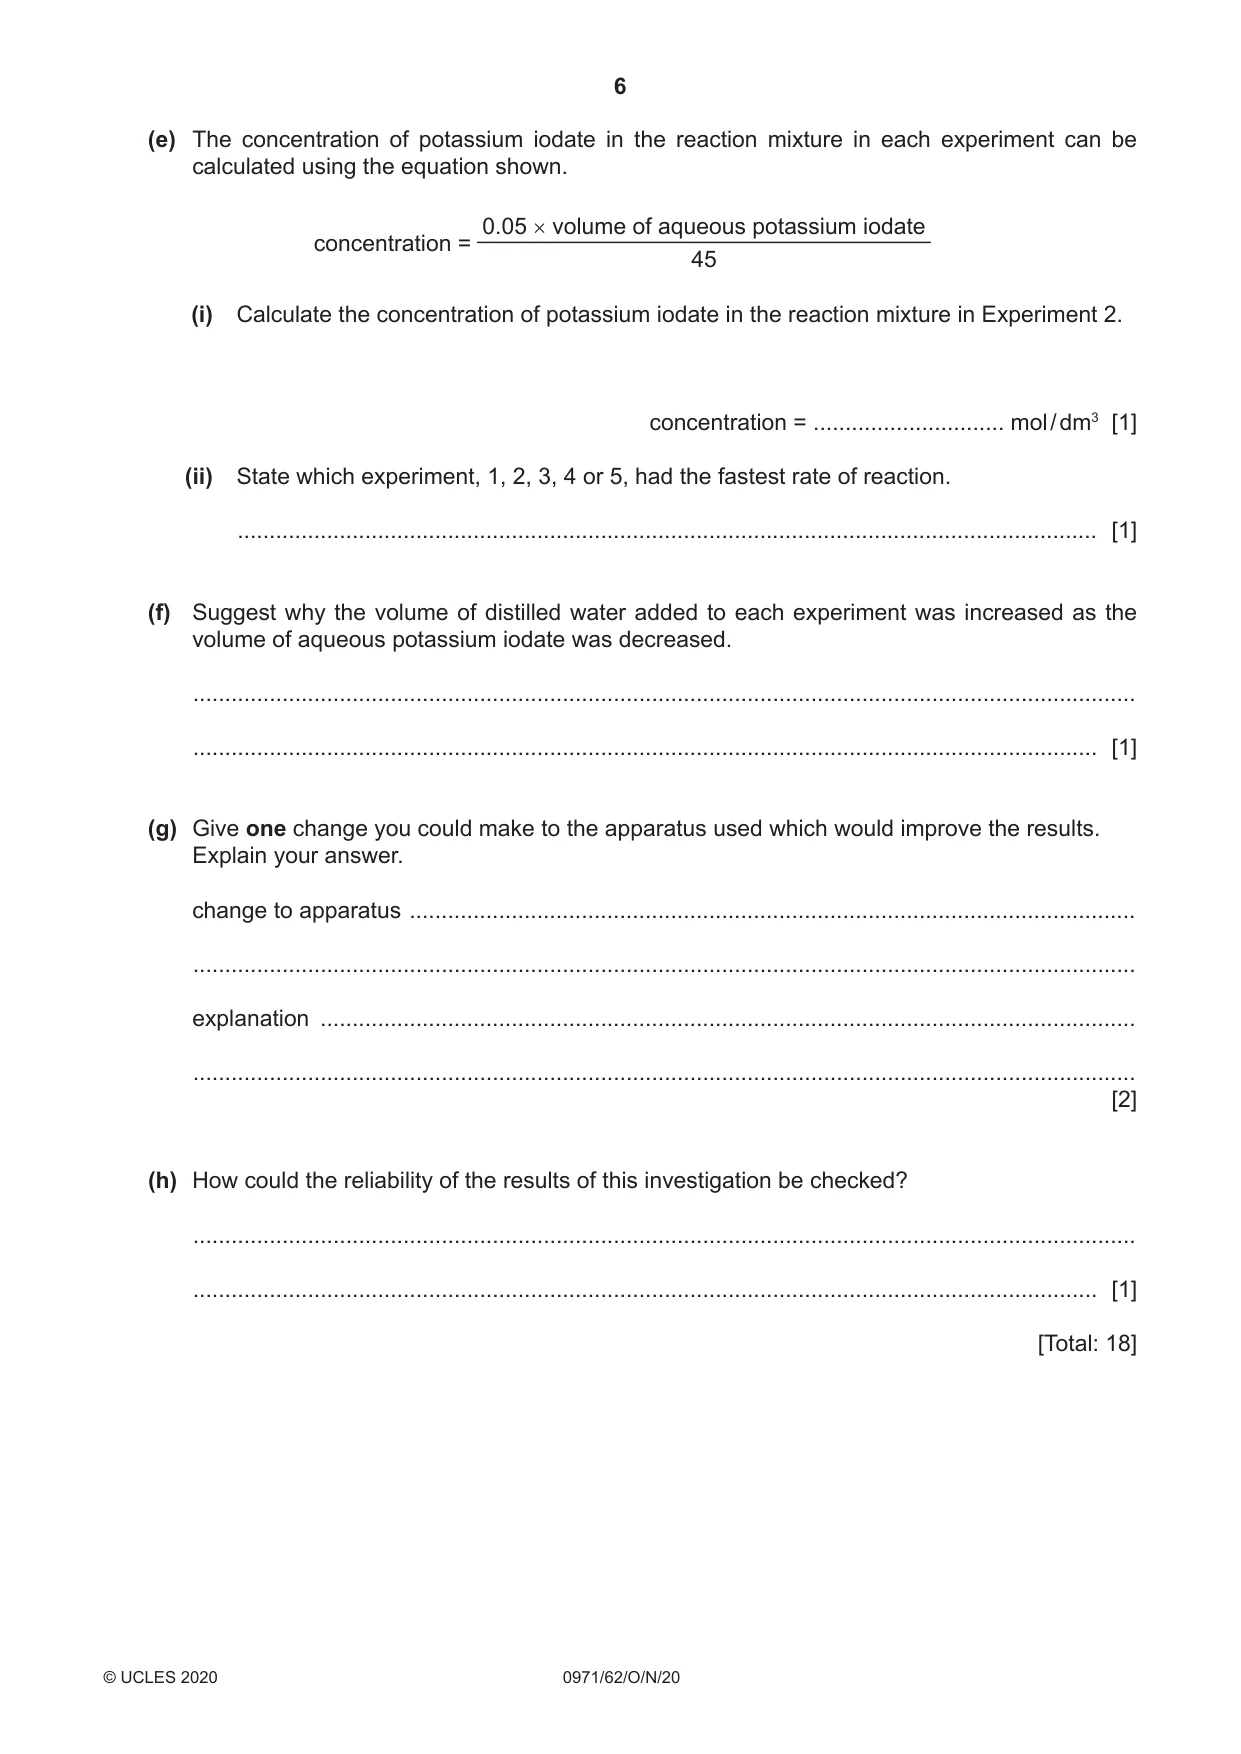
2 A student investigated the rate of a reaction between sodium metabisulfite and potassium iodate. In the reaction, starch was used as an indicator. At first the reacting mixture remained colourless but then suddenly changed to a blue-black colour. Five experiments were done. In each experiment the total volume of liquid was 45 cm3. Experiment 1 ●● Using a 10 cm3 measuring cylinder, 5 cm3 of aqueous sodium metabisulfite was poured into a beaker. ●● Using another 10 cm3 measuring cylinder, 5 cm3 of aqueous starch was poured into the beaker. ●● Using a 25 cm3 measuring cylinder, 15 cm3 of distilled water was poured into the beaker. ●● Using another 25 cm3 measuring cylinder, 20 cm3 of aqueous potassium iodate was poured into the beaker. At the same time a stop‑clock was started. ●● The mixture in the beaker was stirred until a sudden colour change was seen. ●● The stop‑clock was immediately stopped and the time recorded. ●● The beaker was rinsed with water. Experiment 2 ●● Experiment 1 was repeated using 17 cm3 of distilled water and 18 cm3 of aqueous potassium iodate. Experiment 3 ●● Experiment 1 was repeated using 21 cm3 of distilled water and 14 cm3 of aqueous potassium iodate. Experiment 4 ●● Experiment 1 was repeated using 23 cm3 of distilled water and 12 cm3 of aqueous potassium iodate. Experiment 5 ●● Experiment 1 was repeated using 25 cm3 of distilled water and 10 cm3 of aqueous potassium iodate. (a) Use the information in the description of the experiments and the stop‑clock diagrams to complete the table. Record the times in seconds. volume of volume volume of time to aqueous sodium of distilled aqueous changeexperiment stop‑clock diagram metabisulfite water potassium colour / cm3 / cm3 iodate / cm3 / s 0 seconds 0 1 20 45 15 5 15 10 minutes 30 0 0 2 18 45 15 5 15 10 30 0 0 3 14 45 15 5 15 10 30 0 0 4 12 45 15 5 15 10 30 0 0 5 10 45 15 5 15 10 30 [5] (b) Plot the results from Experiments 1 to 5 on the grid. Draw a smooth curve of best fit. 80 70 60 time to change colour / s 50 40 30 10 12 14 16 18 20 22 volume of aqueous potassium iodate / cm3 [3] (c) (i) From your graph, predict the time to change colour if 16 cm3 of aqueous potassium iodate was used. Show clearly on the grid how you worked out your answer. time to change colour = .............................. s [2] (ii) Calculate the volume of distilled water required if 16 cm3 of aqueous potassium iodate was used. volume of distilled water = .............................. cm3 [1] (d) Sketch on the grid the graph you would expect if Experiments 1 to 5 were repeated at a higher temperature. [1] (e) The concentration of potassium iodate in the reaction mixture in each experiment can be calculated using the equation shown. 0.05 × volume of aqueous potassium iodate concentration = 45 (i) Calculate the concentration of potassium iodate in the reaction mixture in Experiment 2. concentration = .............................. mol / dm3 [1] (ii) State which experiment, 1, 2, 3, 4 or 5, had the fastest rate of reaction. ....................................................................................................................................... [1] (f) Suggest why the volume of distilled water added to each experiment was increased as the volume of aqueous potassium iodate was decreased. .................................................................................................................................................... .............................................................................................................................................. [1] (g) Give one change you could make to the apparatus used which would improve the results. Explain your answer. change to apparatus .................................................................................................................. .................................................................................................................................................... explanation ................................................................................................................................. .................................................................................................................................................... [2] (h) How could the reliability of the results of this investigation be checked? .................................................................................................................................................... .............................................................................................................................................. [1] [Total: 18]
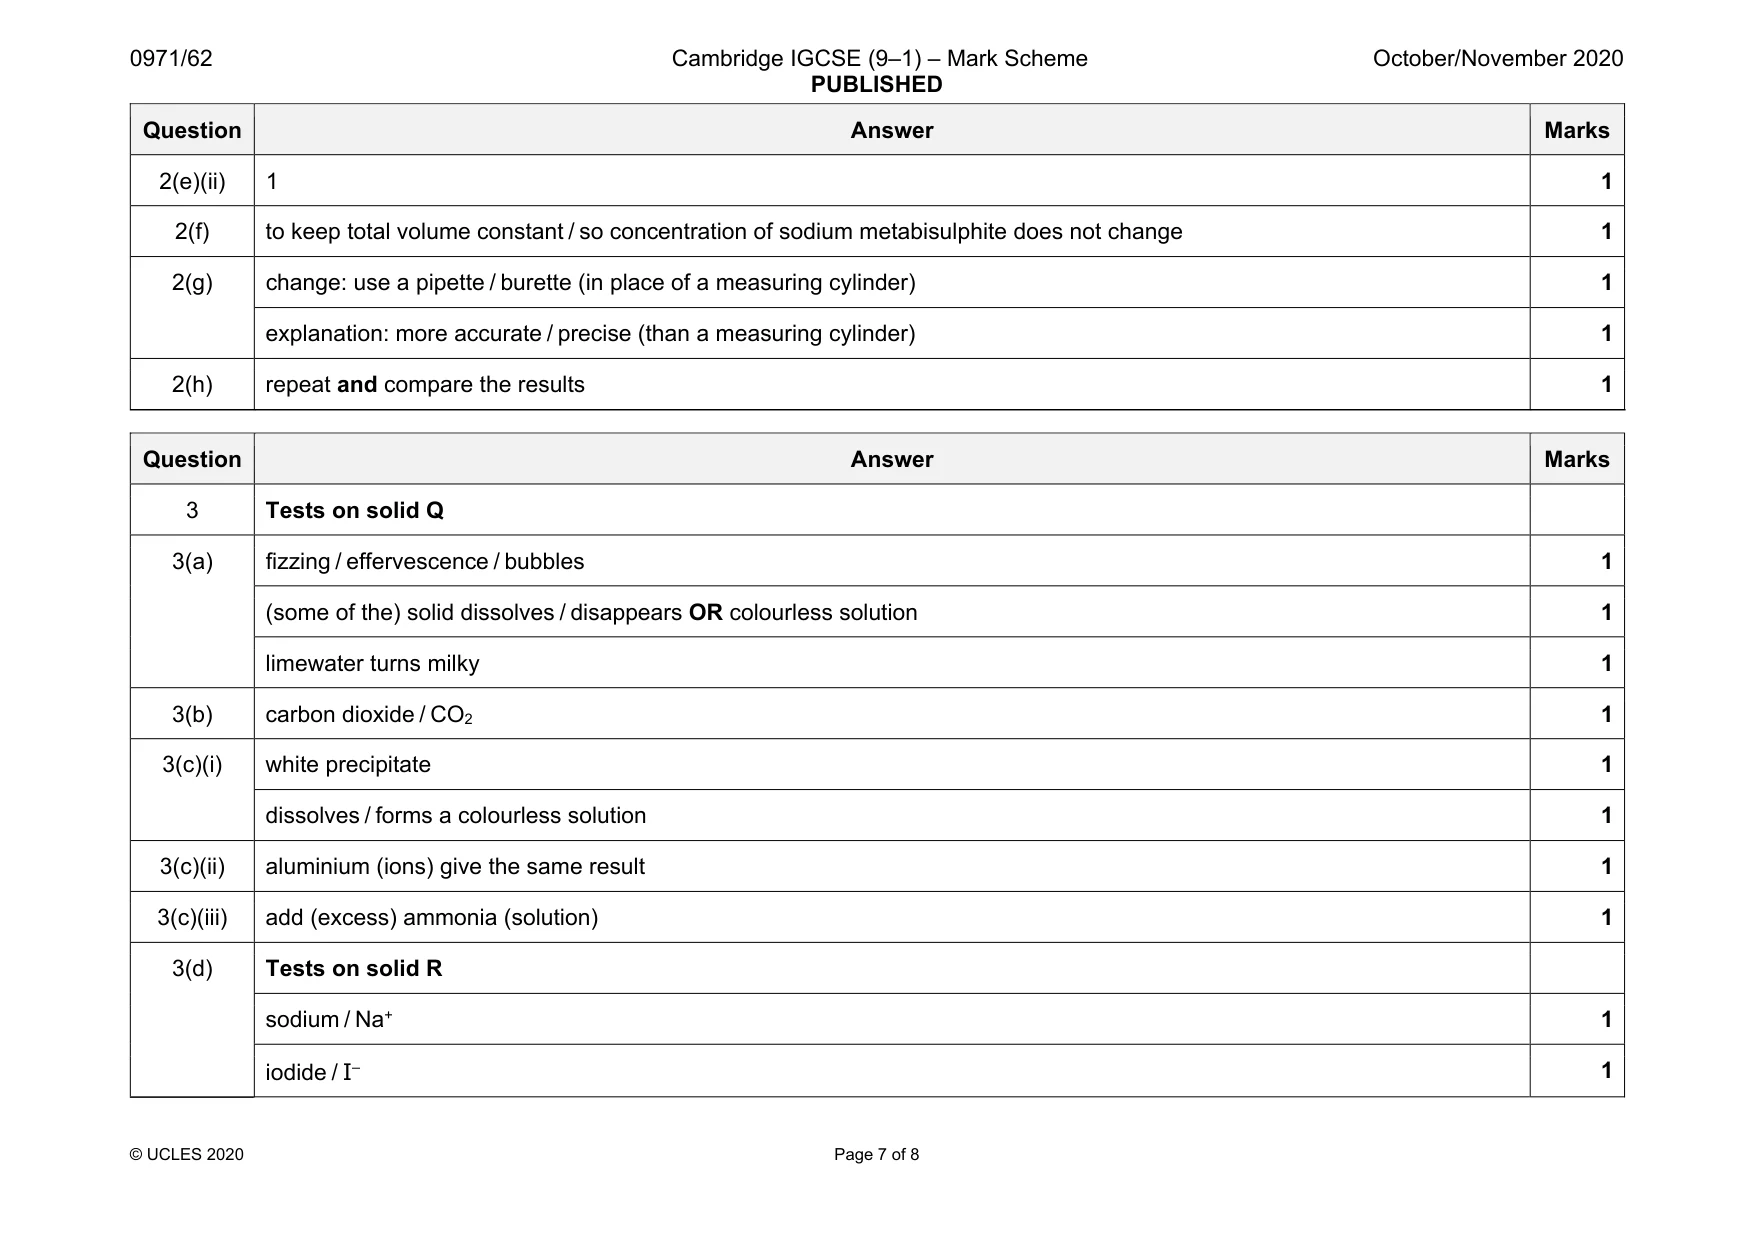
Mark scheme: 2(a) all volumes of sodium metabisulfite completed as 5 1 all volumes of water (15, 17, 21, 23, 25) correct. 1 all times recorded correctly (38, 42, 53, 61, 72) 2 all five times in seconds only 1 2(b) all 5 points plotted correctly 2 suitable best fit curve drawn. Line must go through / within half a square of correctly plotted points 1 2(c)(i) correct working shown on graph 1 time correct for their working 1 2(c)(ii) 19 1 2(d) line is below plotted line and does not meet / touch plotted line. 1 2(e)(i) 0.02 1 Question Answer Marks 2(e)(ii) 1 1 2(f) to keep total volume constant / so concentration of sodium metabisulphite does not change 1 2(g) change: use a pipette / burette (in place of a measuring cylinder) 1 explanation: more accurate / precise (than a measuring cylinder) 1 2(h) repeat and compare the results 1
Q3 · Solid Q and solid R were analysed
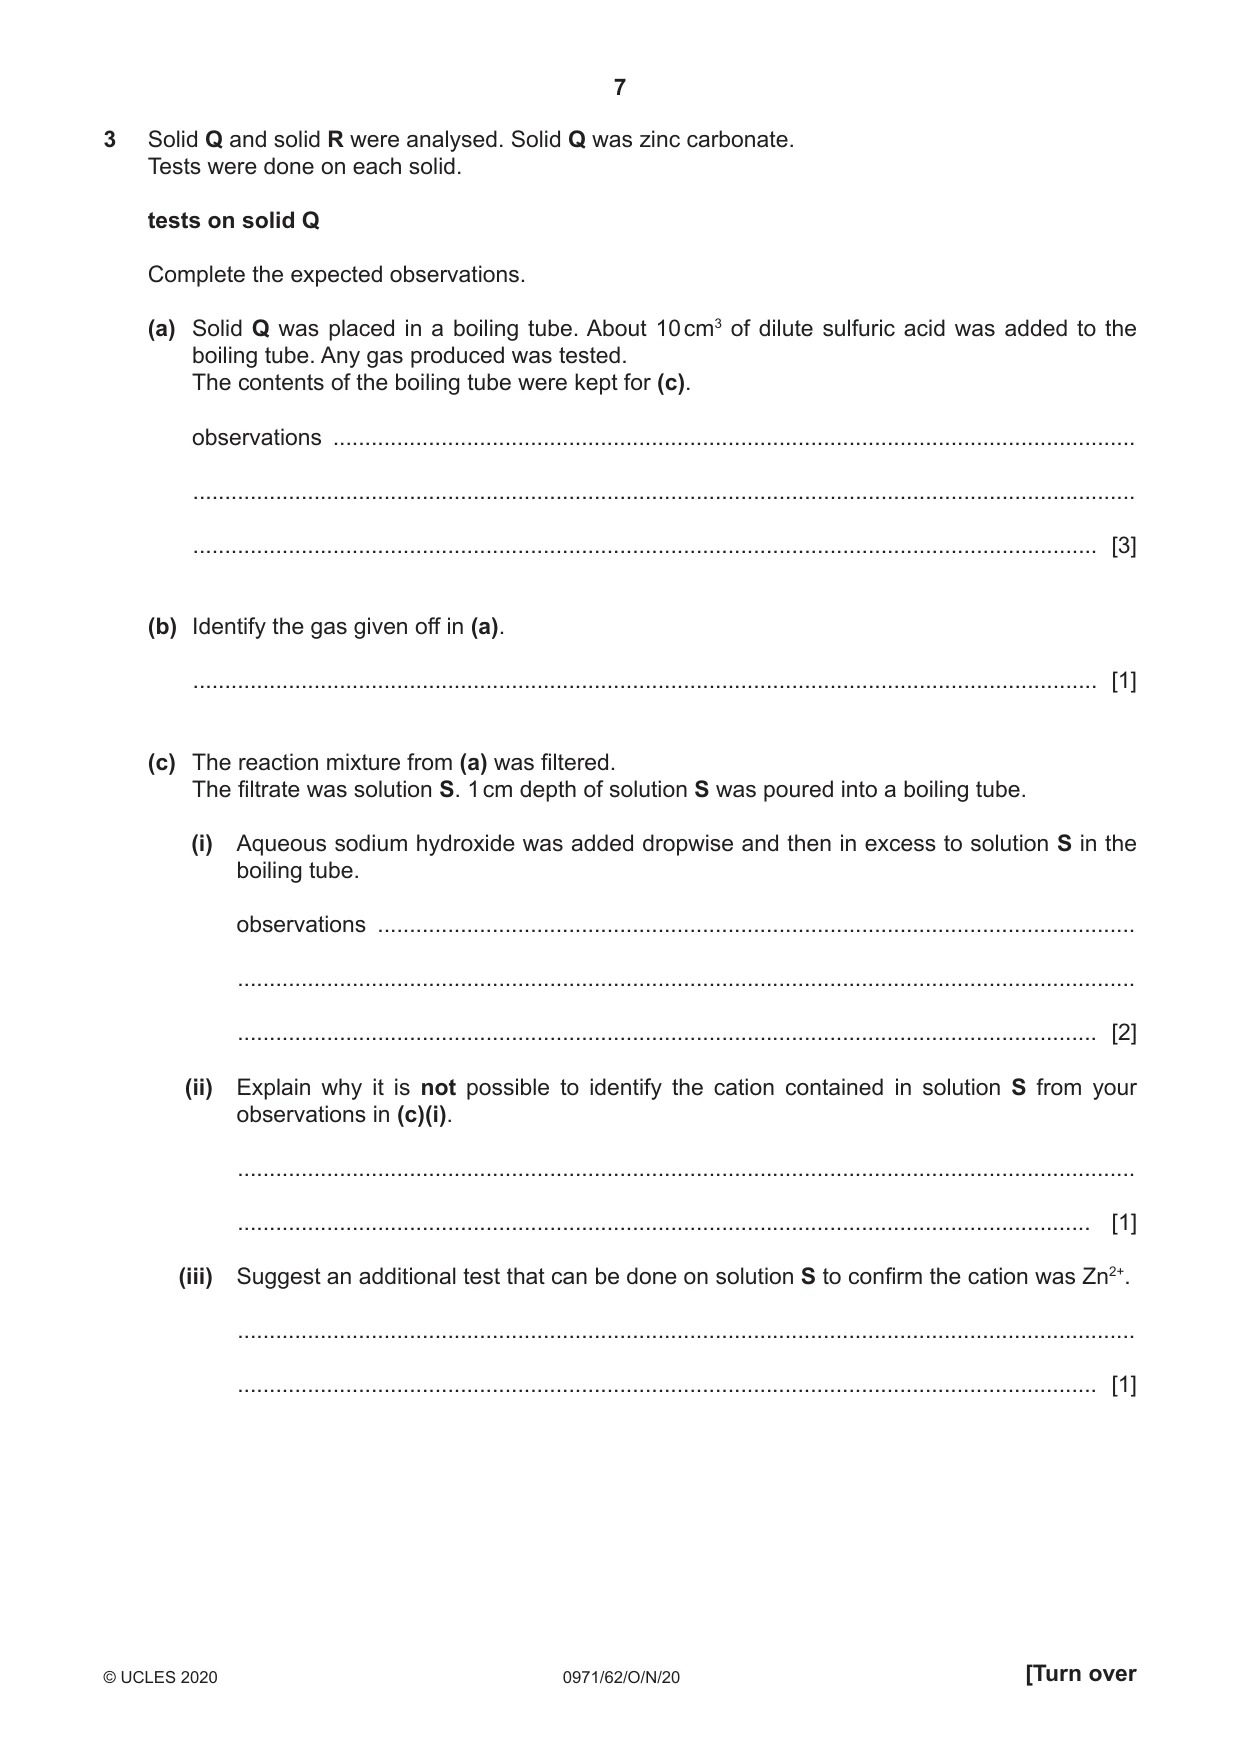
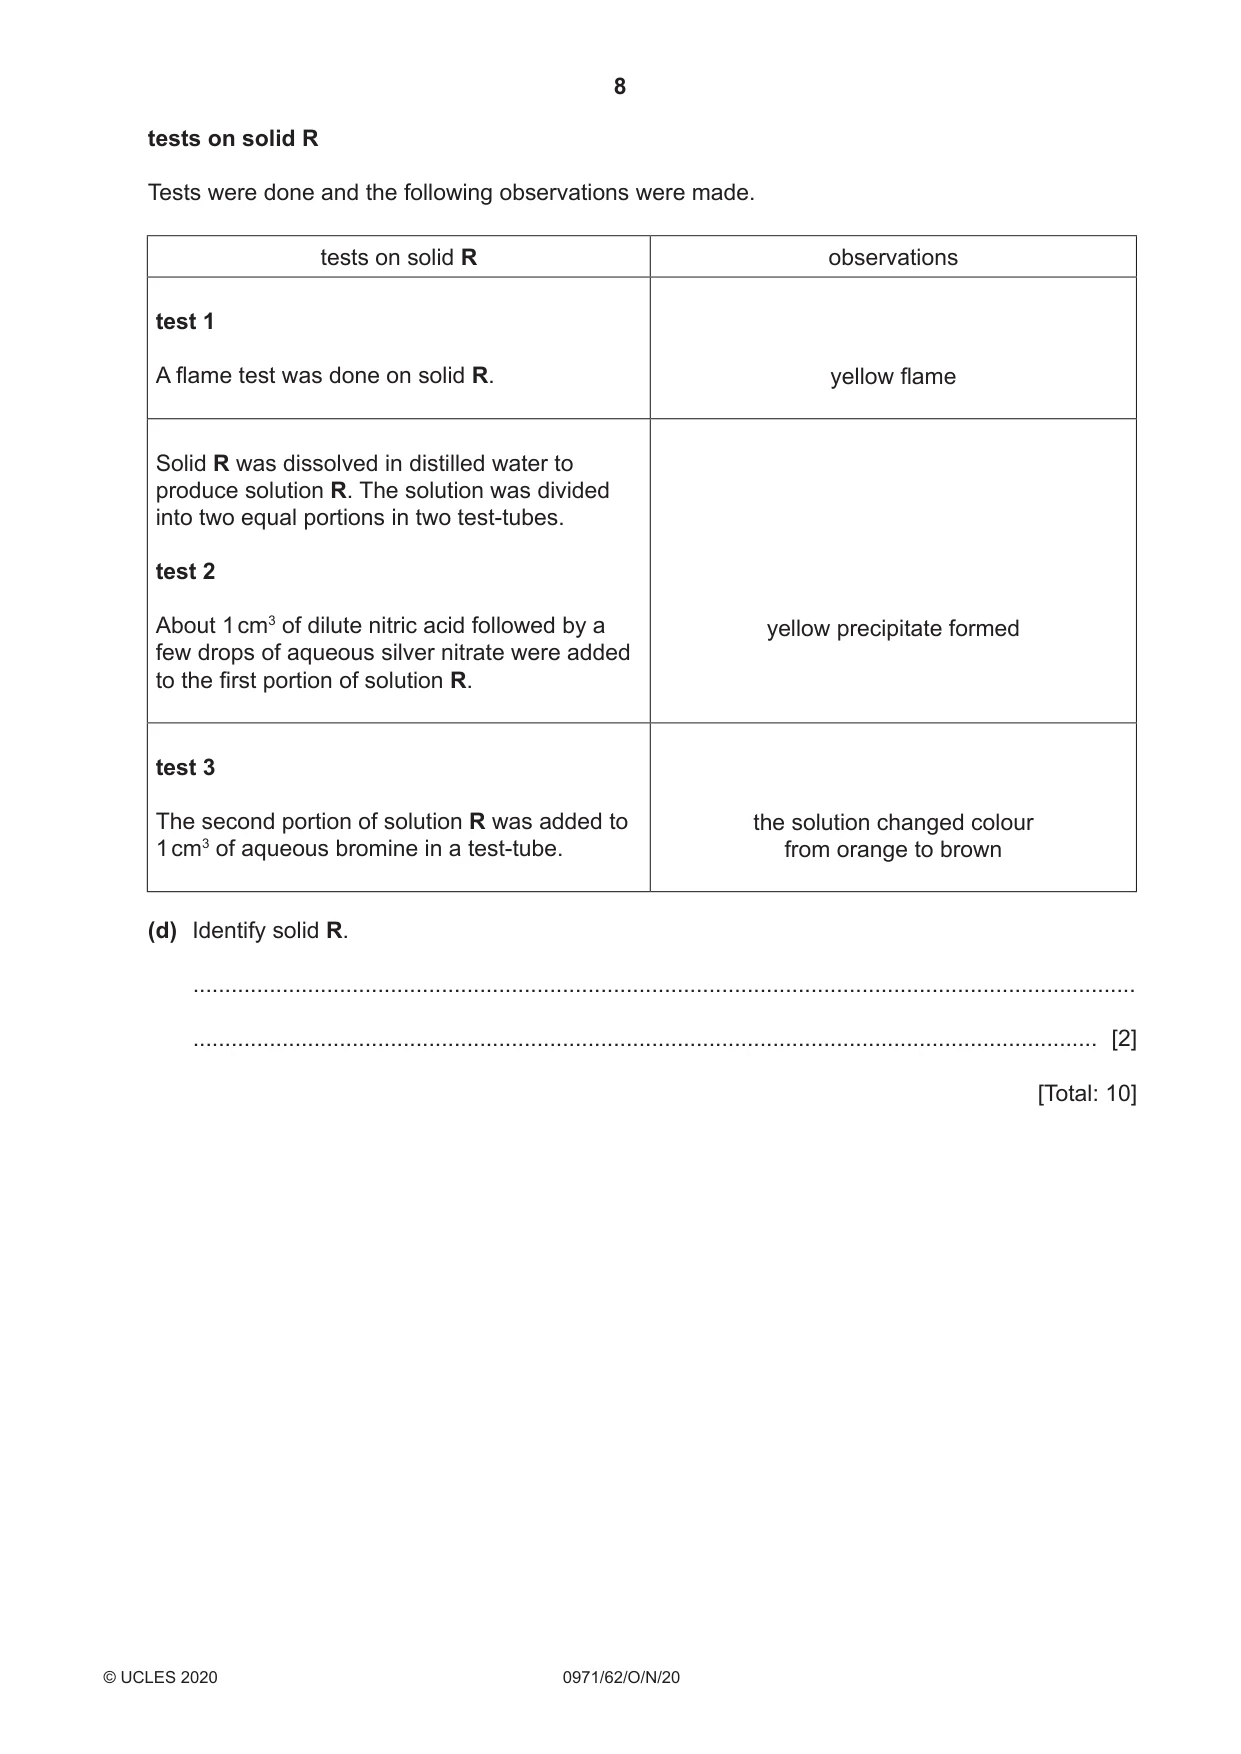
3 Solid Q and solid R were analysed. Solid Q was zinc carbonate. Tests were done on each solid. tests on solid Q Complete the expected observations. (a) Solid Q was placed in a boiling tube. About 10 cm3 of dilute sulfuric acid was added to the boiling tube. Any gas produced was tested. The contents of the boiling tube were kept for (c). observations ............................................................................................................................... .................................................................................................................................................... .............................................................................................................................................. [3] (b) Identify the gas given off in (a). .............................................................................................................................................. [1] (c) The reaction mixture from (a) was filtered. The filtrate was solution S. 1 cm depth of solution S was poured into a boiling tube. (i) Aqueous sodium hydroxide was added dropwise and then in excess to solution S in the boiling tube. observations ........................................................................................................................ ............................................................................................................................................. ....................................................................................................................................... [2] (ii) Explain why it is not possible to identify the cation contained in solution S from your observations in (c)(i). ............................................................................................................................................. ...................................................................................................................................... [1] (iii) Suggest an additional test that can be done on solution S to confirm the cation was Zn2+. ............................................................................................................................................. ....................................................................................................................................... [1] tests on solid R Tests were done and the following observations were made. tests on solid R observations test 1 A flame test was done on solid R. yellow flame Solid R was dissolved in distilled water to produce solution R. The solution was divided into two equal portions in two test‑tubes. test 2 About 1 cm3 of dilute nitric acid followed by a yellow precipitate formed few drops of aqueous silver nitrate were added to the first portion of solution R. test 3 The second portion of solution R was added to the solution changed colour 1 cm3 of aqueous bromine in a test‑tube. from orange to brown (d) Identify solid R. .................................................................................................................................................... .............................................................................................................................................. [2] [Total: 10]
Mark scheme: 3 Tests on solid Q 3(a) fizzing / effervescence / bubbles 1 (some of the) solid dissolves / disappears OR colourless solution 1 limewater turns milky 1 3(b) carbon dioxide / CO2 1 3(c)(i) white precipitate 1 dissolves / forms a colourless solution 1 3(c)(ii) aluminium (ions) give the same result 1 3(c)(iii) add (excess) ammonia (solution) 1 3(d) Tests on solid R sodium / Na+ 1 iodide / I– 1
Q4 · Brass is a mixture of two metals, copper and zinc
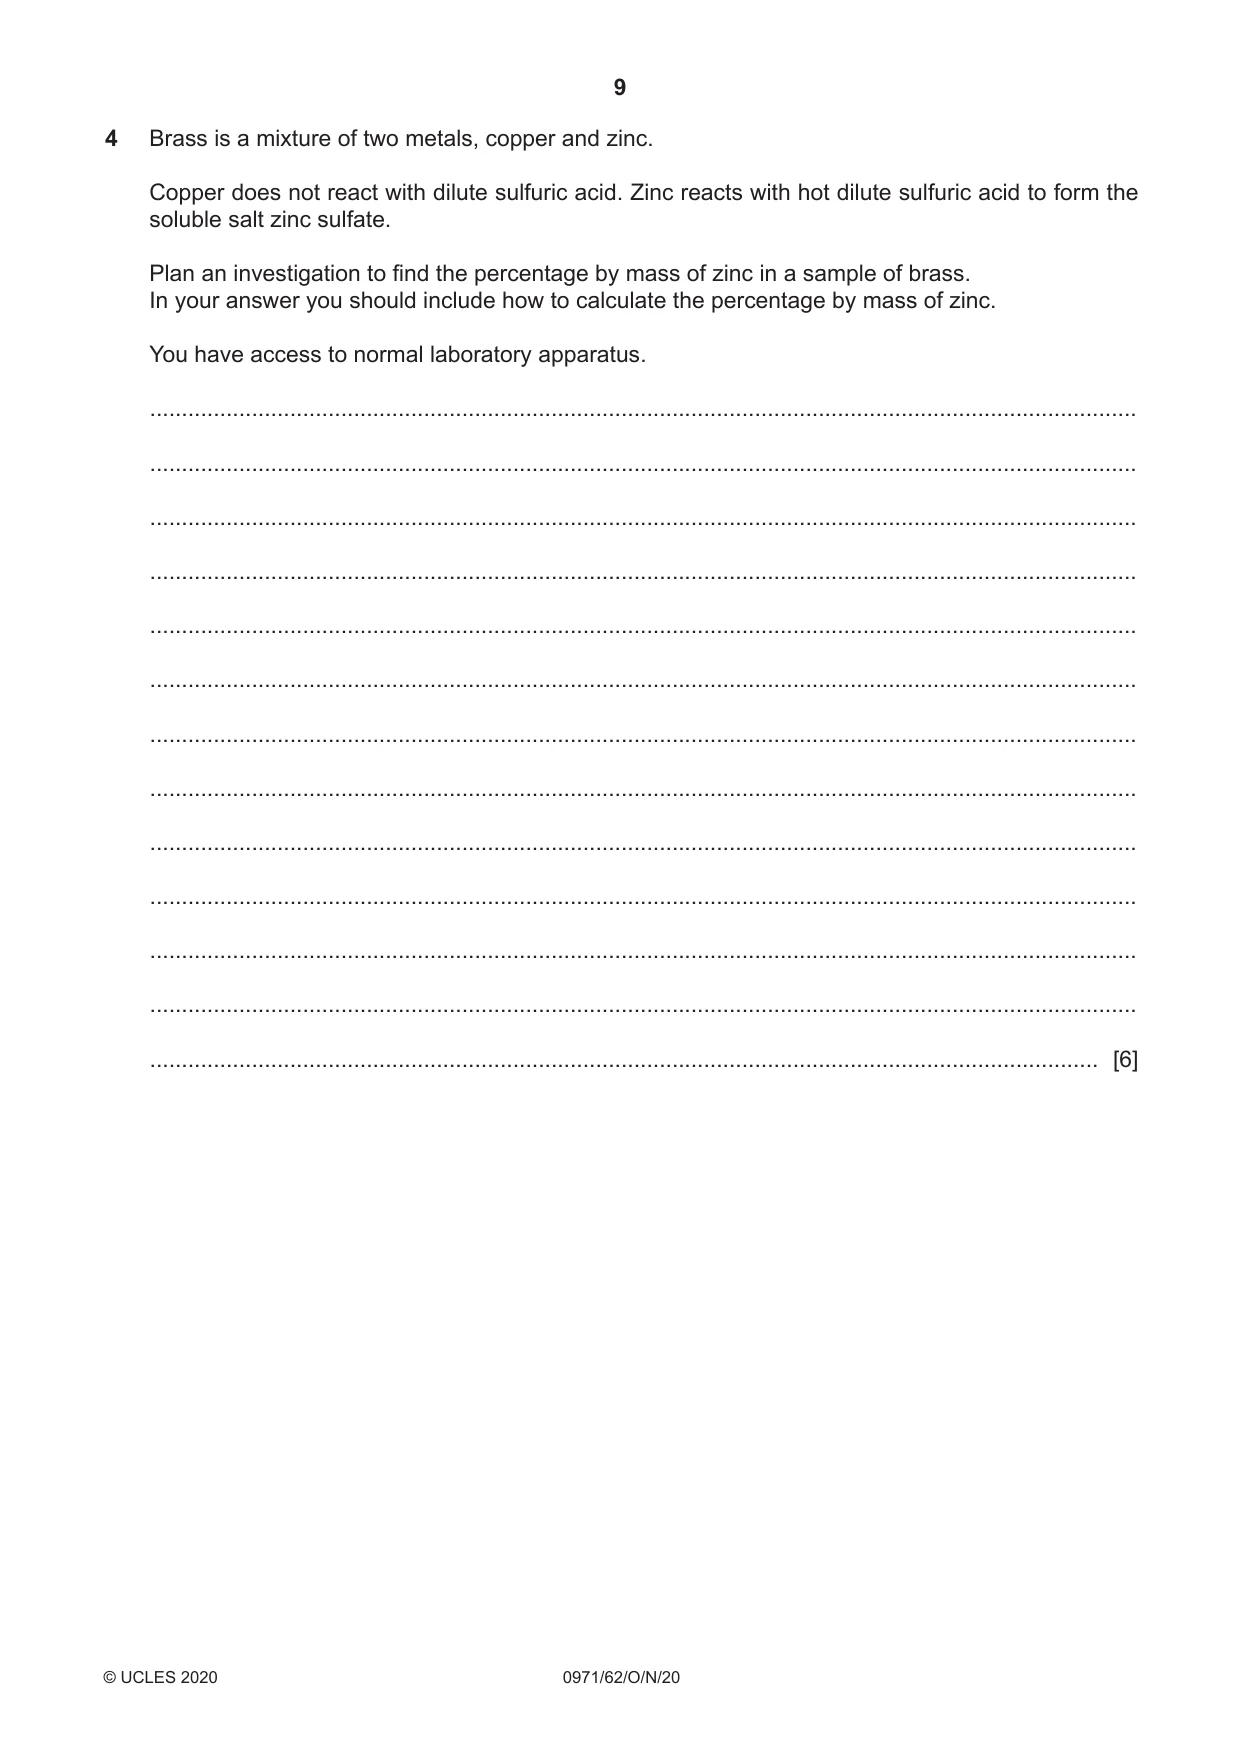
4 Brass is a mixture of two metals, copper and zinc. Copper does not react with dilute sulfuric acid. Zinc reacts with hot dilute sulfuric acid to form the soluble salt zinc sulfate. Plan an investigation to find the percentage by mass of zinc in a sample of brass. In your answer you should include how to calculate the percentage by mass of zinc. You have access to normal laboratory apparatus. ........................................................................................................................................................... ........................................................................................................................................................... ........................................................................................................................................................... ........................................................................................................................................................... ........................................................................................................................................................... ........................................................................................................................................................... ........................................................................................................................................................... ........................................................................................................................................................... ........................................................................................................................................................... ........................................................................................................................................................... ........................................................................................................................................................... ........................................................................................................................................................... ..................................................................................................................................................... [6]
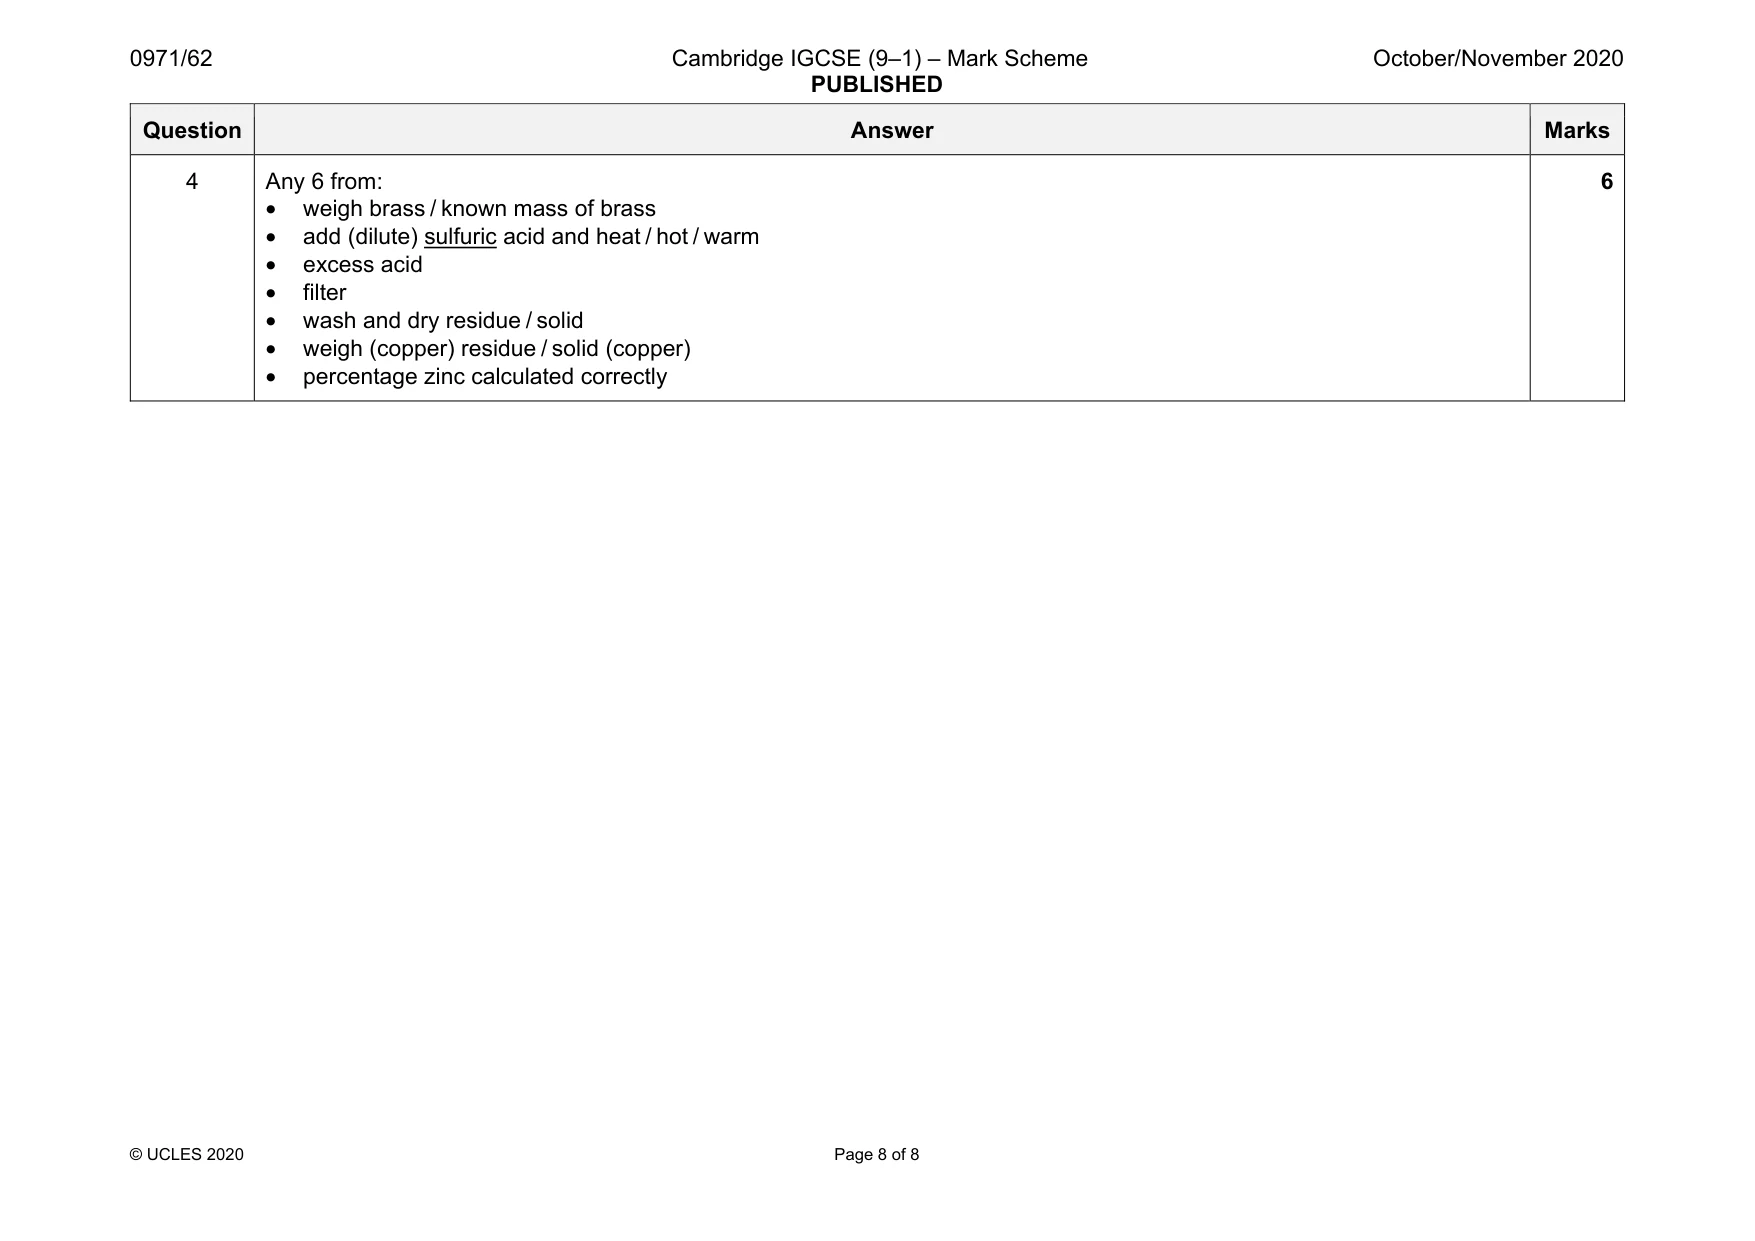
Mark scheme: 4 Any 6 from: • weigh brass / known mass of brass • add (dilute) sulfuric acid and heat / hot / warm • excess acid • filter • wash and dry residue / solid • weigh (copper) residue / solid (copper) • percentage zinc calculated correctly 6
What was in this paper
The subtopics covered by these 4 questions, and how many questions each got. Open one in a new tab to see every Cambridge question on it.
What you needed in this session
Cambridge’s own grade thresholds for 2020 Oct/Nov, Paper 6 · Variant 2. A higher threshold means an easier paper — the bar moves with how the cohort did.