Cambridge IGCSE Chemistry (9-1) 0971 — 2019 Oct/Nov Paper 6 · Variant 2
0971/62/O/N/19 · 4 questions · 40 marks · ≈45 min
The question paper and its mark scheme, free to read here and free to download. This is Cambridge’s own paper, exactly as it was sat.
Question paper12 pages




Mark scheme6 pages
Answers below. Sit the paper first if you are practising.
Questions as text
Q1 · A student did a single titration to find the concentration of a solution of dilute…
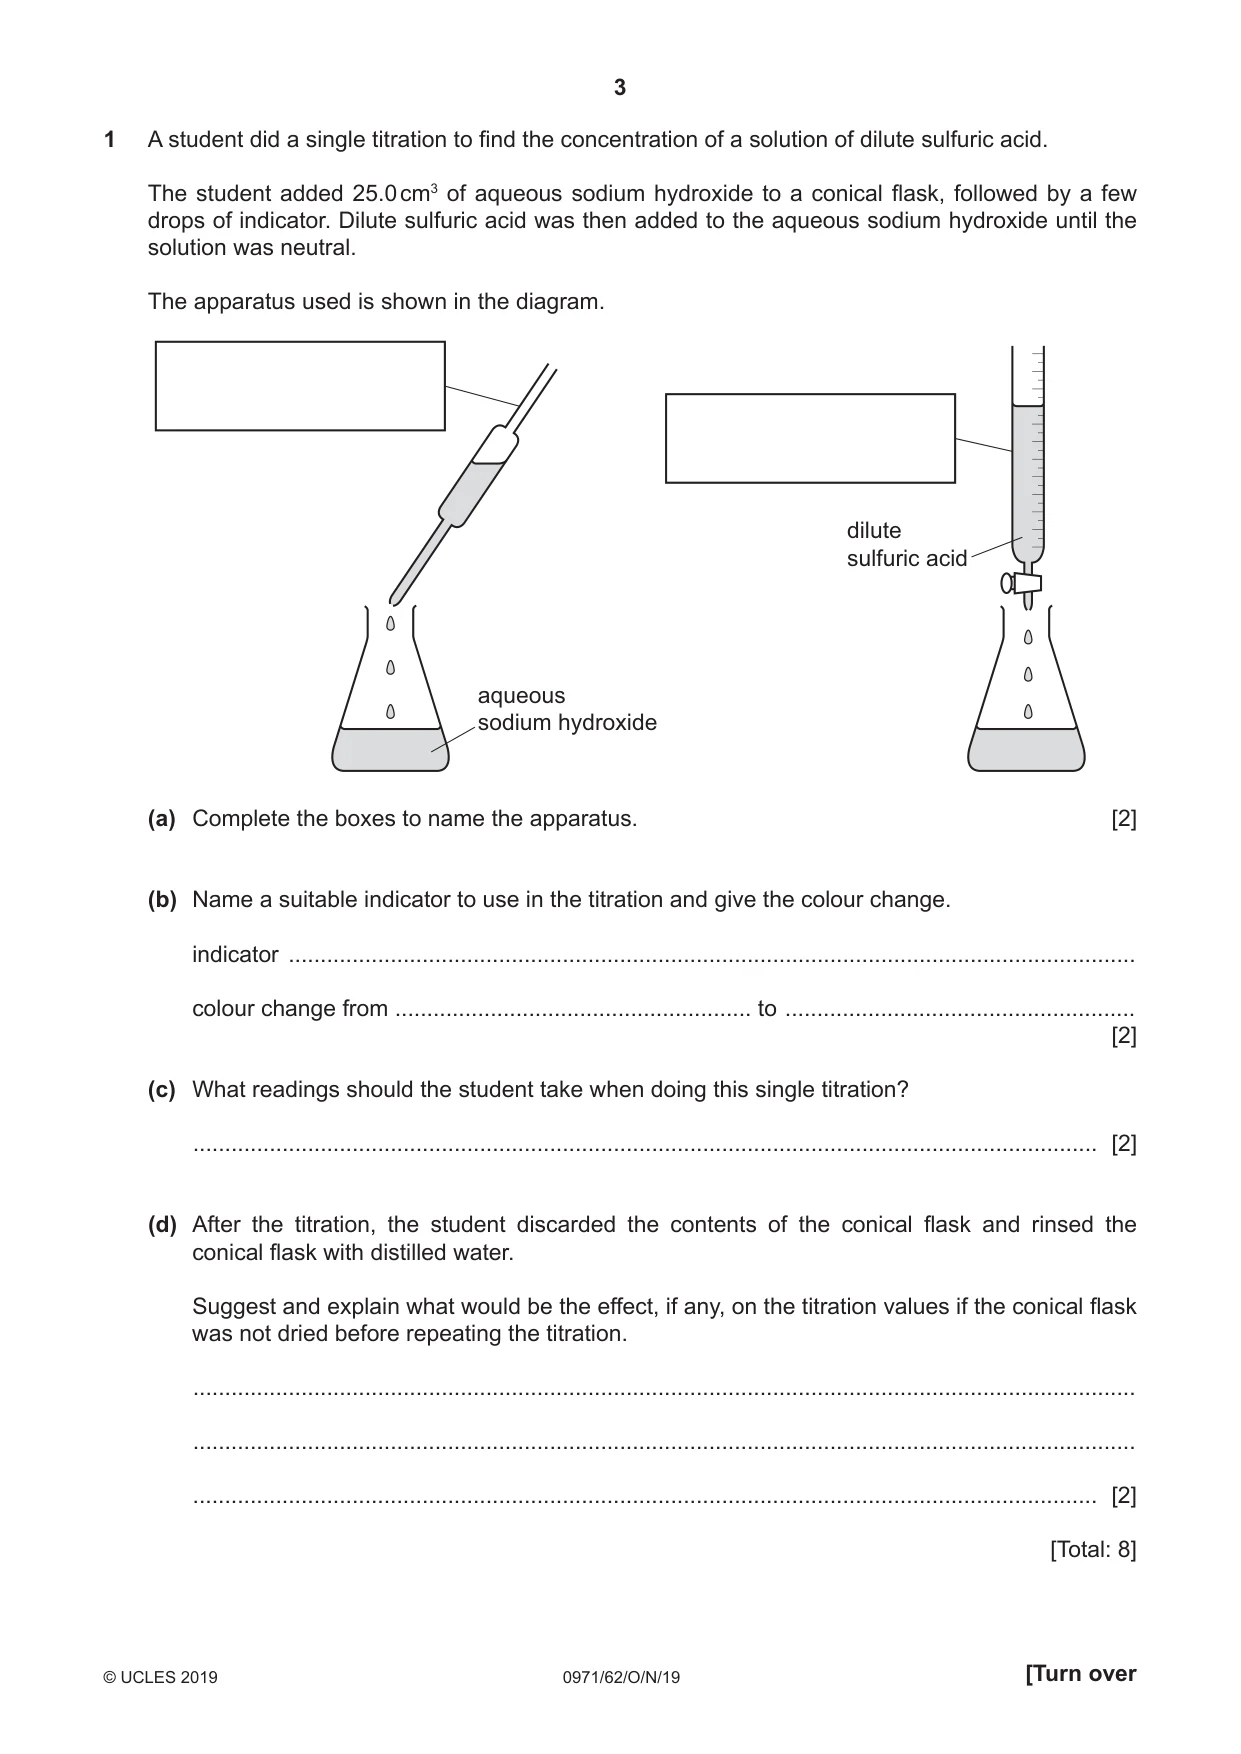
1 A student did a single titration to find the concentration of a solution of dilute sulfuric acid. The student added 25.0 cm3 of aqueous sodium hydroxide to a conical flask, followed by a few drops of indicator. Dilute sulfuric acid was then added to the aqueous sodium hydroxide until the solution was neutral. The apparatus used is shown in the diagram. dilute sulfuric acid aqueous sodium hydroxide (a) Complete the boxes to name the apparatus. [2] (b) Name a suitable indicator to use in the titration and give the colour change. indicator ...................................................................................................................................... colour change from ........................................................ to ....................................................... [2] (c) What readings should the student take when doing this single titration? .............................................................................................................................................. [2] (d) After the titration, the student discarded the contents of the conical flask and rinsed the conical flask with distilled water. Suggest and explain what would be the effect, if any, on the titration values if the conical flask was not dried before repeating the titration. .................................................................................................................................................... .................................................................................................................................................... .............................................................................................................................................. [2] [Total: 8]
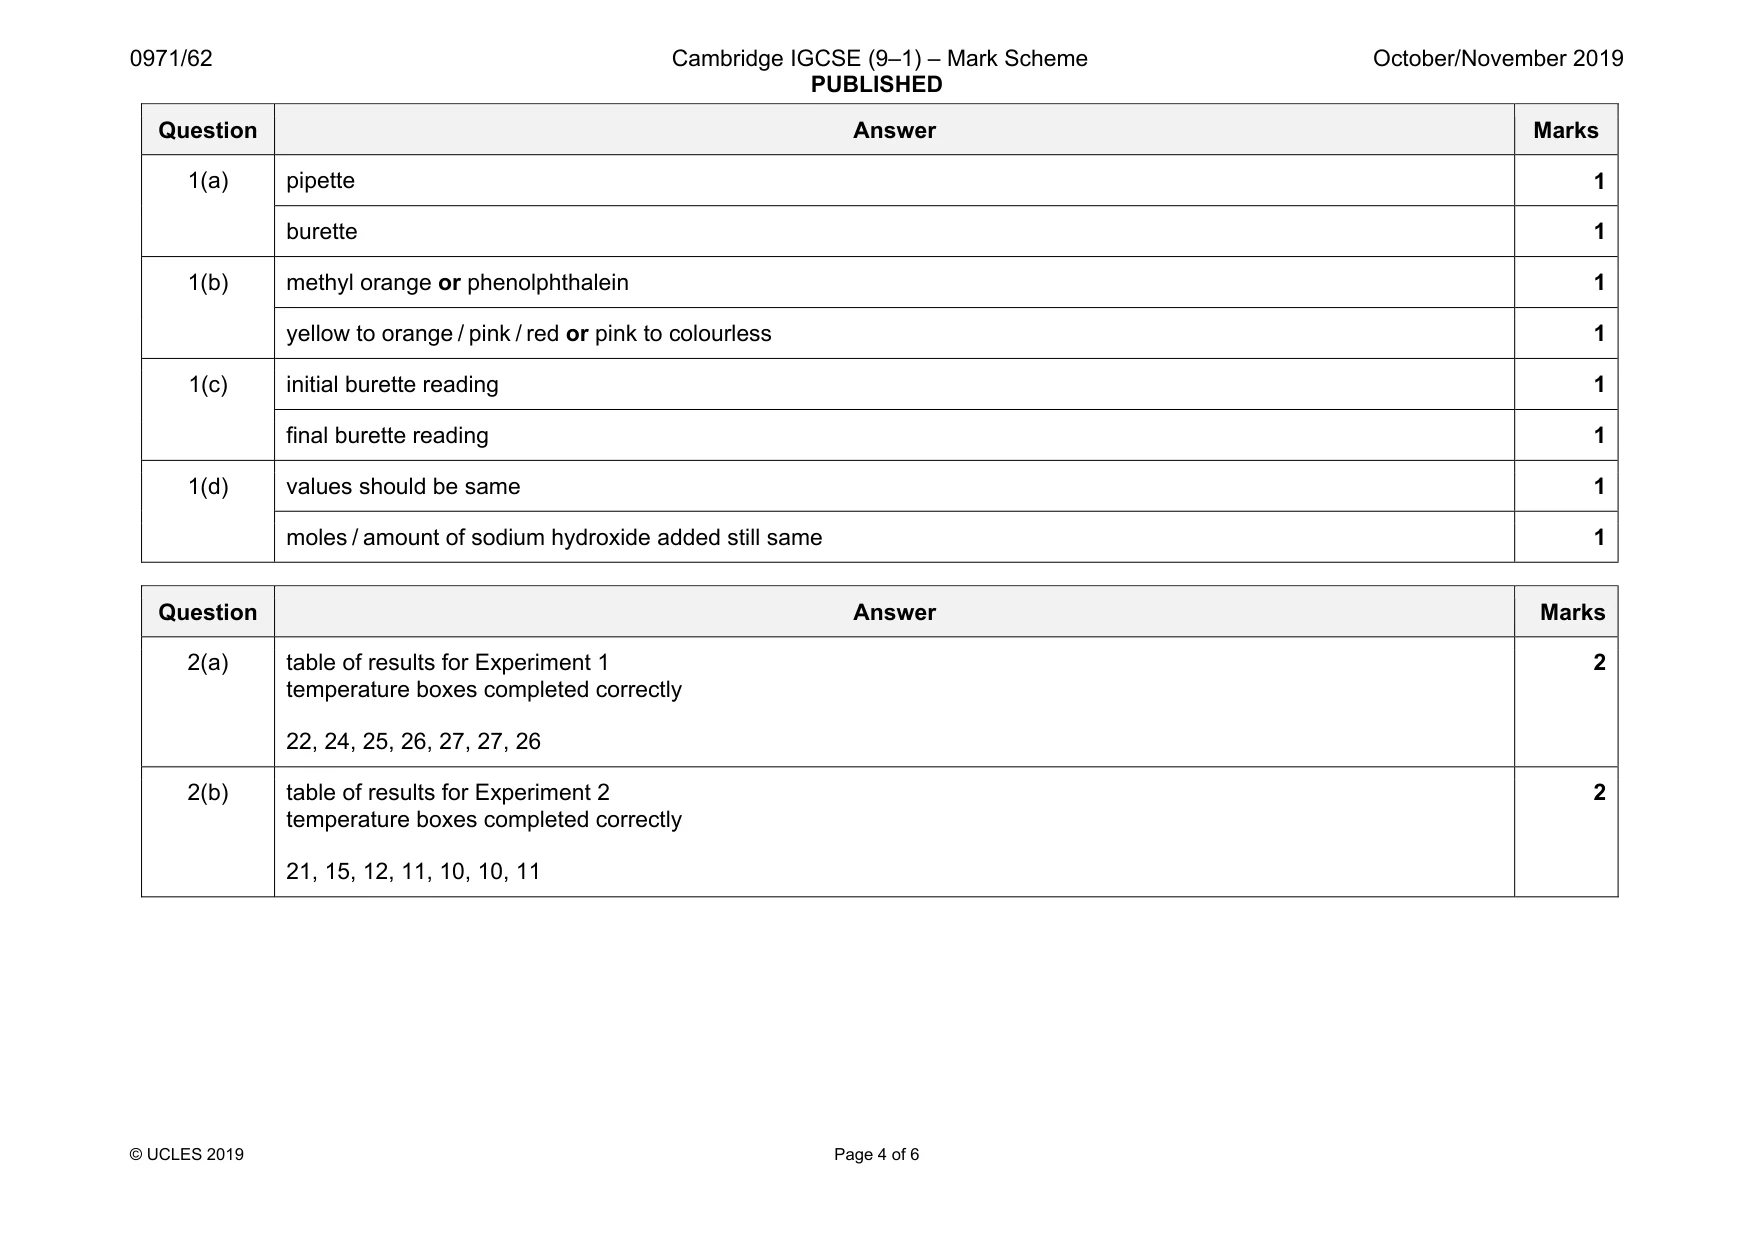
Mark scheme: 1(a) pipette 1 burette 1 1(b) methyl orange or phenolphthalein 1 yellow to orange / pink / red or pink to colourless 1 1(c) initial burette reading 1 final burette reading 1 1(d) values should be same 1 moles / amount of sodium hydroxide added still same 1
Q2 · A student investigated the temperature changes when two different solids, N and O…
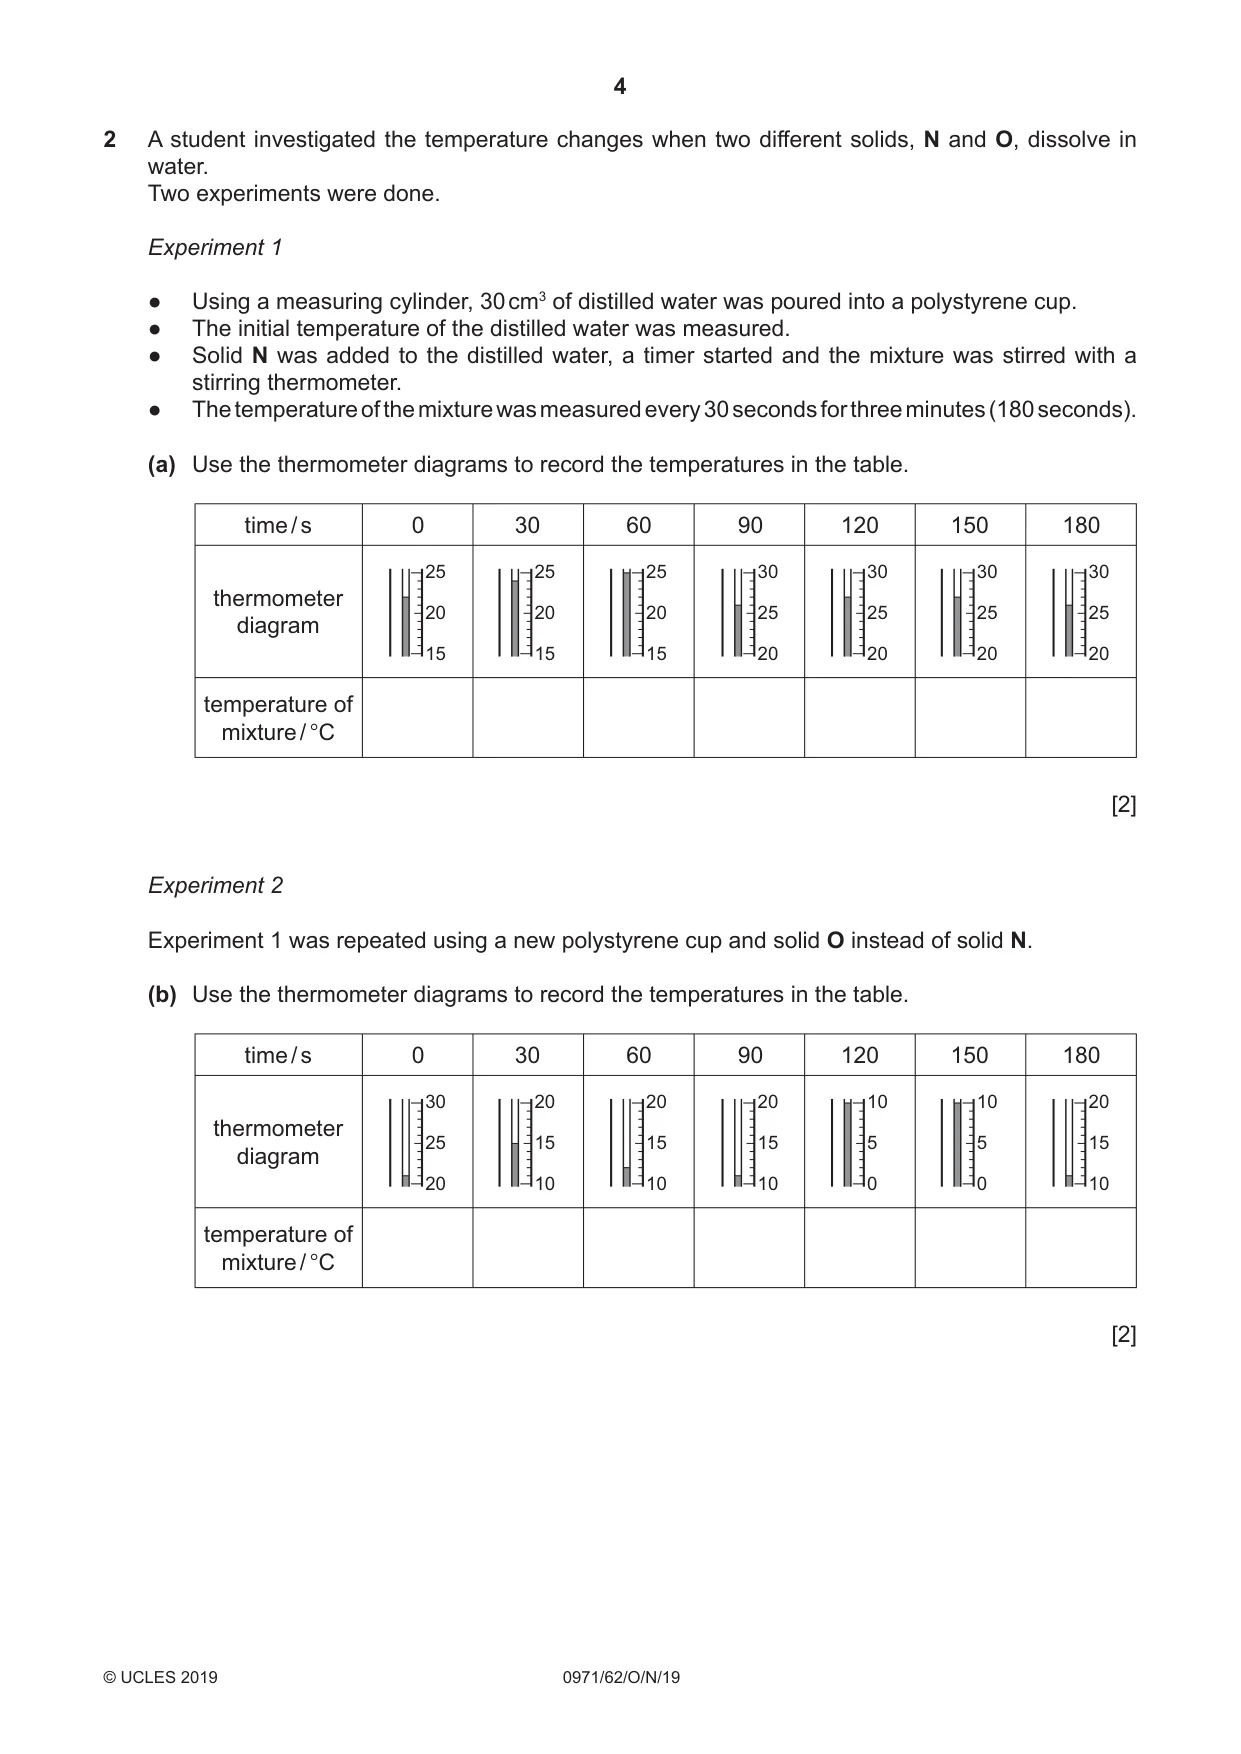
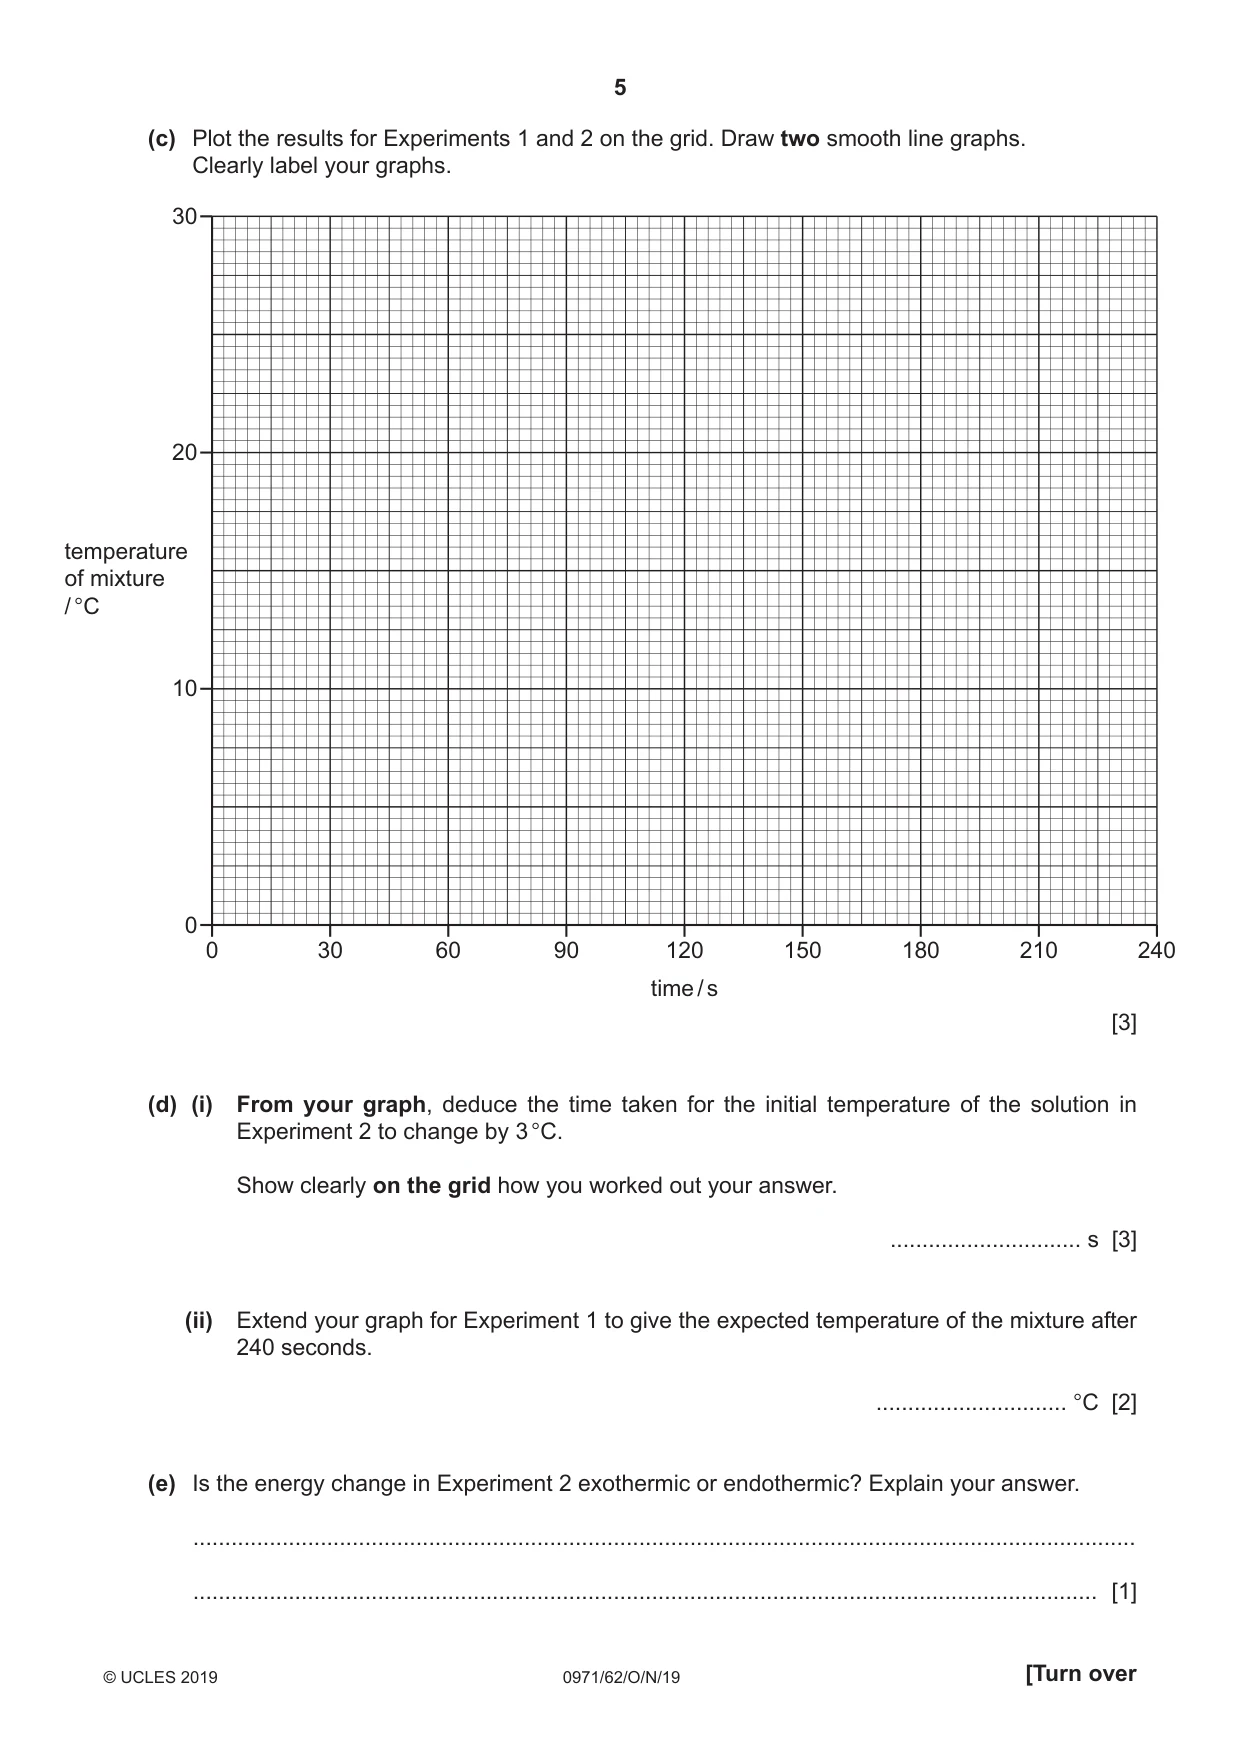
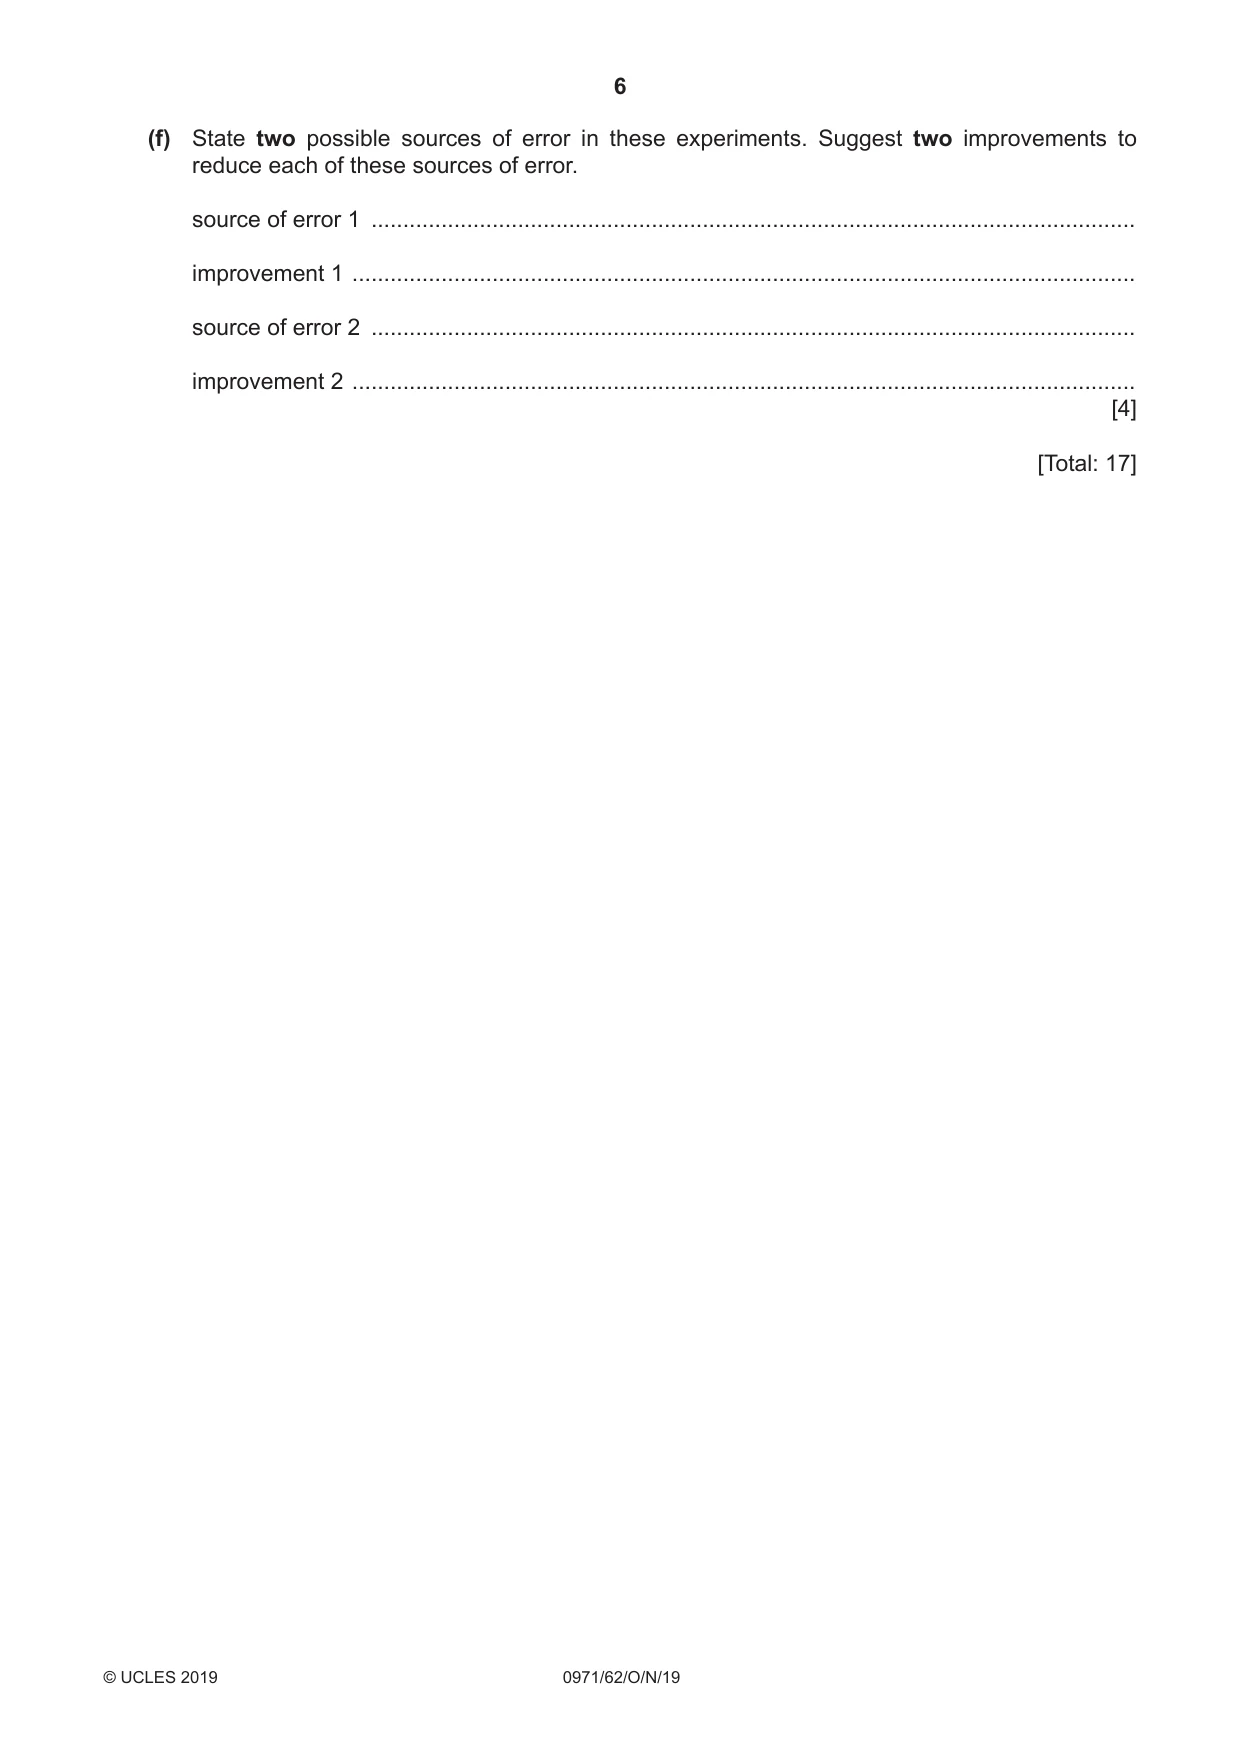
2 A student investigated the temperature changes when two different solids, N and O, dissolve in water. Two experiments were done. Experiment 1 ●● Using a measuring cylinder, 30 cm3 of distilled water was poured into a polystyrene cup. ●● The initial temperature of the distilled water was measured. ●● Solid N was added to the distilled water, a timer started and the mixture was stirred with a stirring thermometer. ●● The temperature of the mixture was measured every 30 seconds for three minutes (180 seconds). (a) Use the thermometer diagrams to record the temperatures in the table. time / s 0 30 60 90 120 150 180 25 25 25 30 30 30 30 thermometer 20 20 20 25 25 25 25 diagram 15 15 15 20 20 20 20 temperature of mixture / °C [2] Experiment 2 Experiment 1 was repeated using a new polystyrene cup and solid O instead of solid N. (b) Use the thermometer diagrams to record the temperatures in the table. time / s 0 30 60 90 120 150 180 30 20 20 20 10 10 20 thermometer 25 15 15 15 5 5 15 diagram 20 10 10 10 0 0 10 temperature of mixture / °C [2] (c) Plot the results for Experiments 1 and 2 on the grid. Draw two smooth line graphs. Clearly label your graphs. 30 20 temperature of mixture / °C 10 0 0 30 60 90 120 150 180 210 240 time / s [3] (d) (i) From your graph, deduce the time taken for the initial temperature of the solution in Experiment 2 to change by 3 °C. Show clearly on the grid how you worked out your answer. .............................. s [3] (ii) Extend your graph for Experiment 1 to give the expected temperature of the mixture after 240 seconds. .............................. °C [2] (e) Is the energy change in Experiment 2 exothermic or endothermic? Explain your answer. .................................................................................................................................................... .............................................................................................................................................. [1] (f) State two possible sources of error in these experiments. Suggest two improvements to reduce each of these sources of error. source of error 1 ......................................................................................................................... improvement 1 ........................................................................................................................... source of error 2 ......................................................................................................................... improvement 2 ........................................................................................................................... [4] [Total: 17]
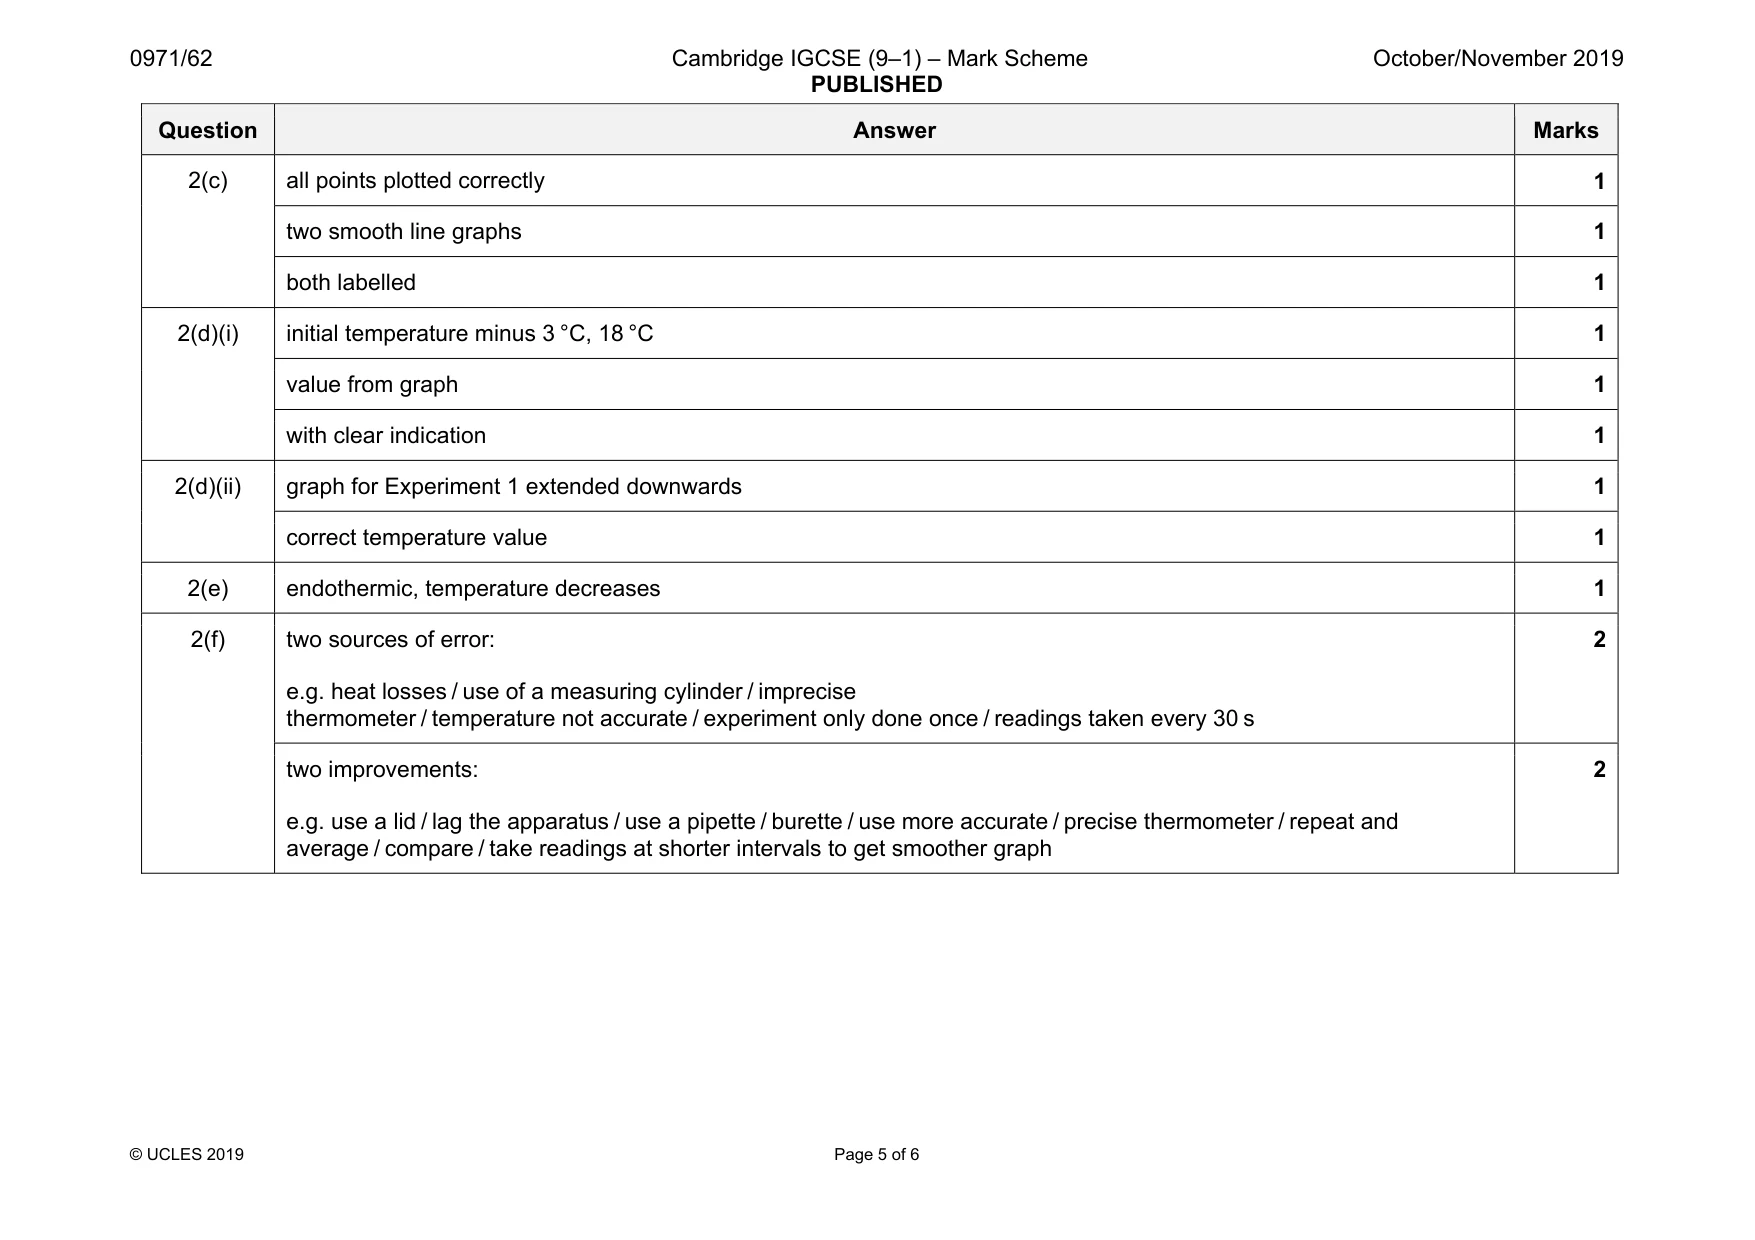
Mark scheme: 2(a) table of results for Experiment 1 temperature boxes completed correctly 22, 24, 25, 26, 27, 27, 26 2 2(b) table of results for Experiment 2 temperature boxes completed correctly 21, 15, 12, 11, 10, 10, 11 2 Question Answer Marks 2(c) all points plotted correctly 1 two smooth line graphs 1 both labelled 1 2(d)(i) initial temperature minus 3 °C, 18 °C 1 value from graph 1 with clear indication 1 2(d)(ii) graph for Experiment 1 extended downwards 1 correct temperature value 1 2(e) endothermic, temperature decreases 1 2(f) two sources of error: e.g. heat losses / use of a measuring cylinder / imprecise thermometer / temperature not accurate / experiment only done once / readings taken every 30 s 2 two improvements: e.g. use a lid / lag the apparatus / use a pipette / burette / use more accurate / precise thermometer / repeat and average / compare / take readings at shorter intervals to get smoother graph 2
Q3 · Two substances, solid P and solid Q, were analysed
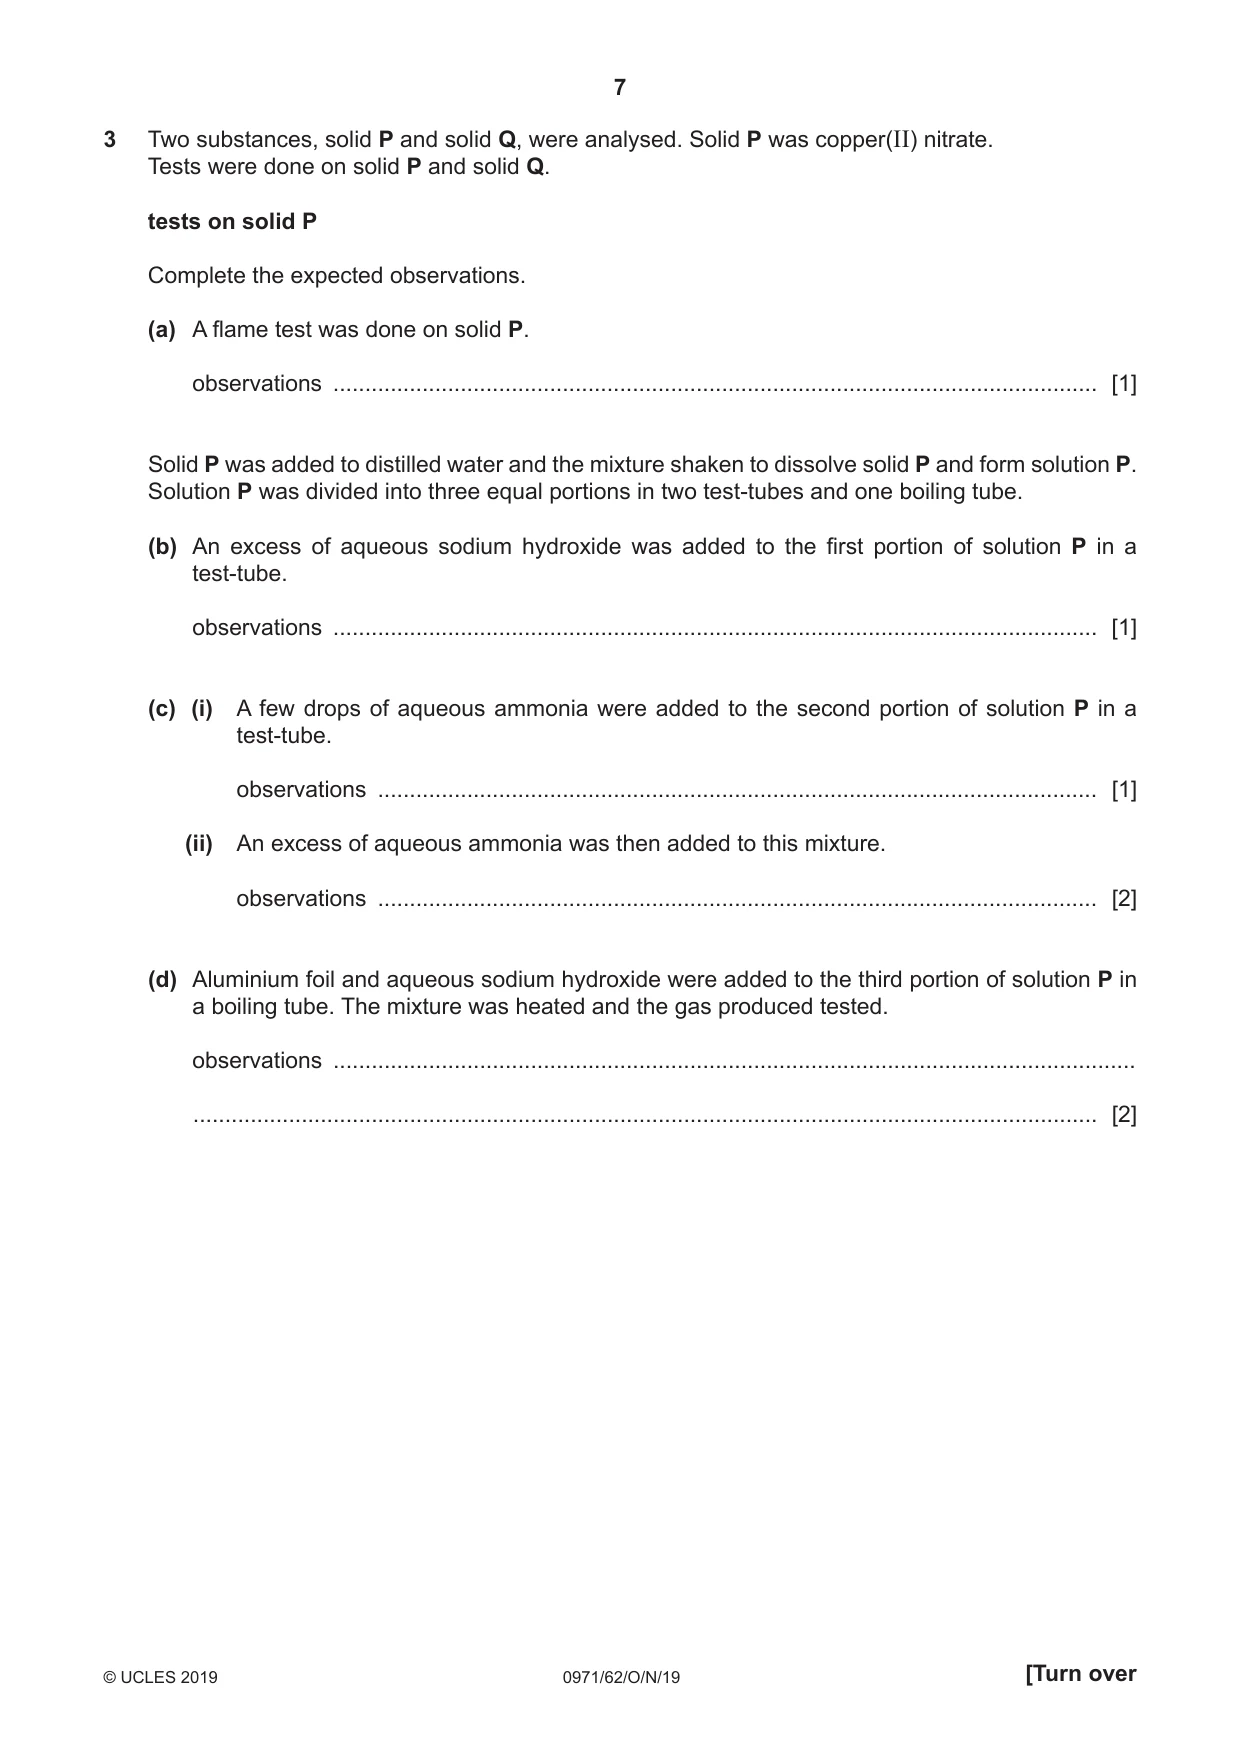
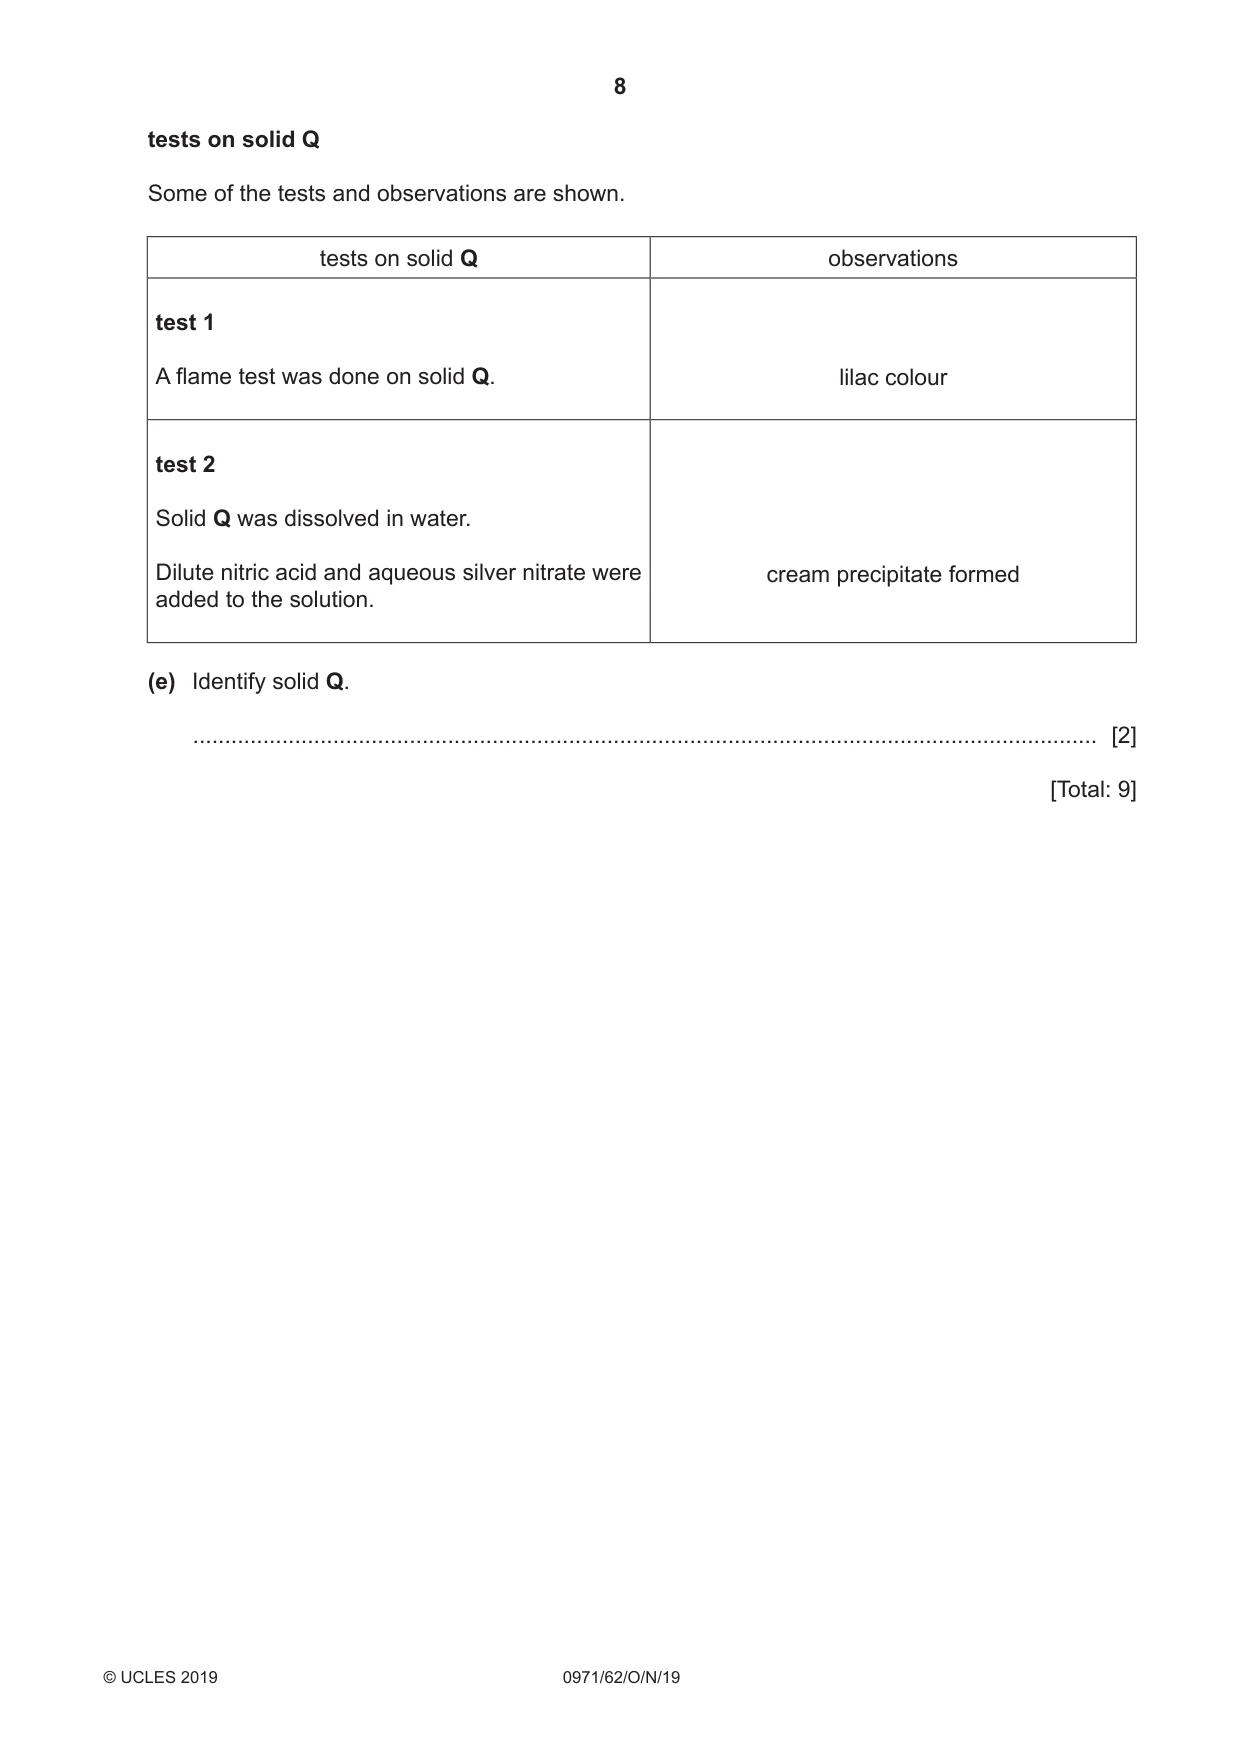
3 Two substances, solid P and solid Q, were analysed. Solid P was copper(II) nitrate. Tests were done on solid P and solid Q. tests on solid P Complete the expected observations. (a) A flame test was done on solid P. observations ������������������������������������������������������������������������������������������������������������������������ [1] Solid P was added to distilled water and the mixture shaken to dissolve solid P and form solution P. Solution P was divided into three equal portions in two test‑tubes and one boiling tube. (b) An excess of aqueous sodium hydroxide was added to the first portion of solution P in a test‑tube. observations ������������������������������������������������������������������������������������������������������������������������ [1] (c) (i) A few drops of aqueous ammonia were added to the second portion of solution P in a test‑tube. observations ����������������������������������������������������������������������������������������������������������������� [1] (ii) An excess of aqueous ammonia was then added to this mixture. observations ����������������������������������������������������������������������������������������������������������������� [2] (d) Aluminium foil and aqueous sodium hydroxide were added to the third portion of solution P in a boiling tube. The mixture was heated and the gas produced tested. observations ............................................................................................................................... .............................................................................................................................................. [2] tests on solid Q Some of the tests and observations are shown. tests on solid Q observations test 1 A flame test was done on solid Q. lilac colour test 2 Solid Q was dissolved in water. Dilute nitric acid and aqueous silver nitrate were cream precipitate formed added to the solution. (e) Identify solid Q. .............................................................................................................................................. [2] [Total: 9]
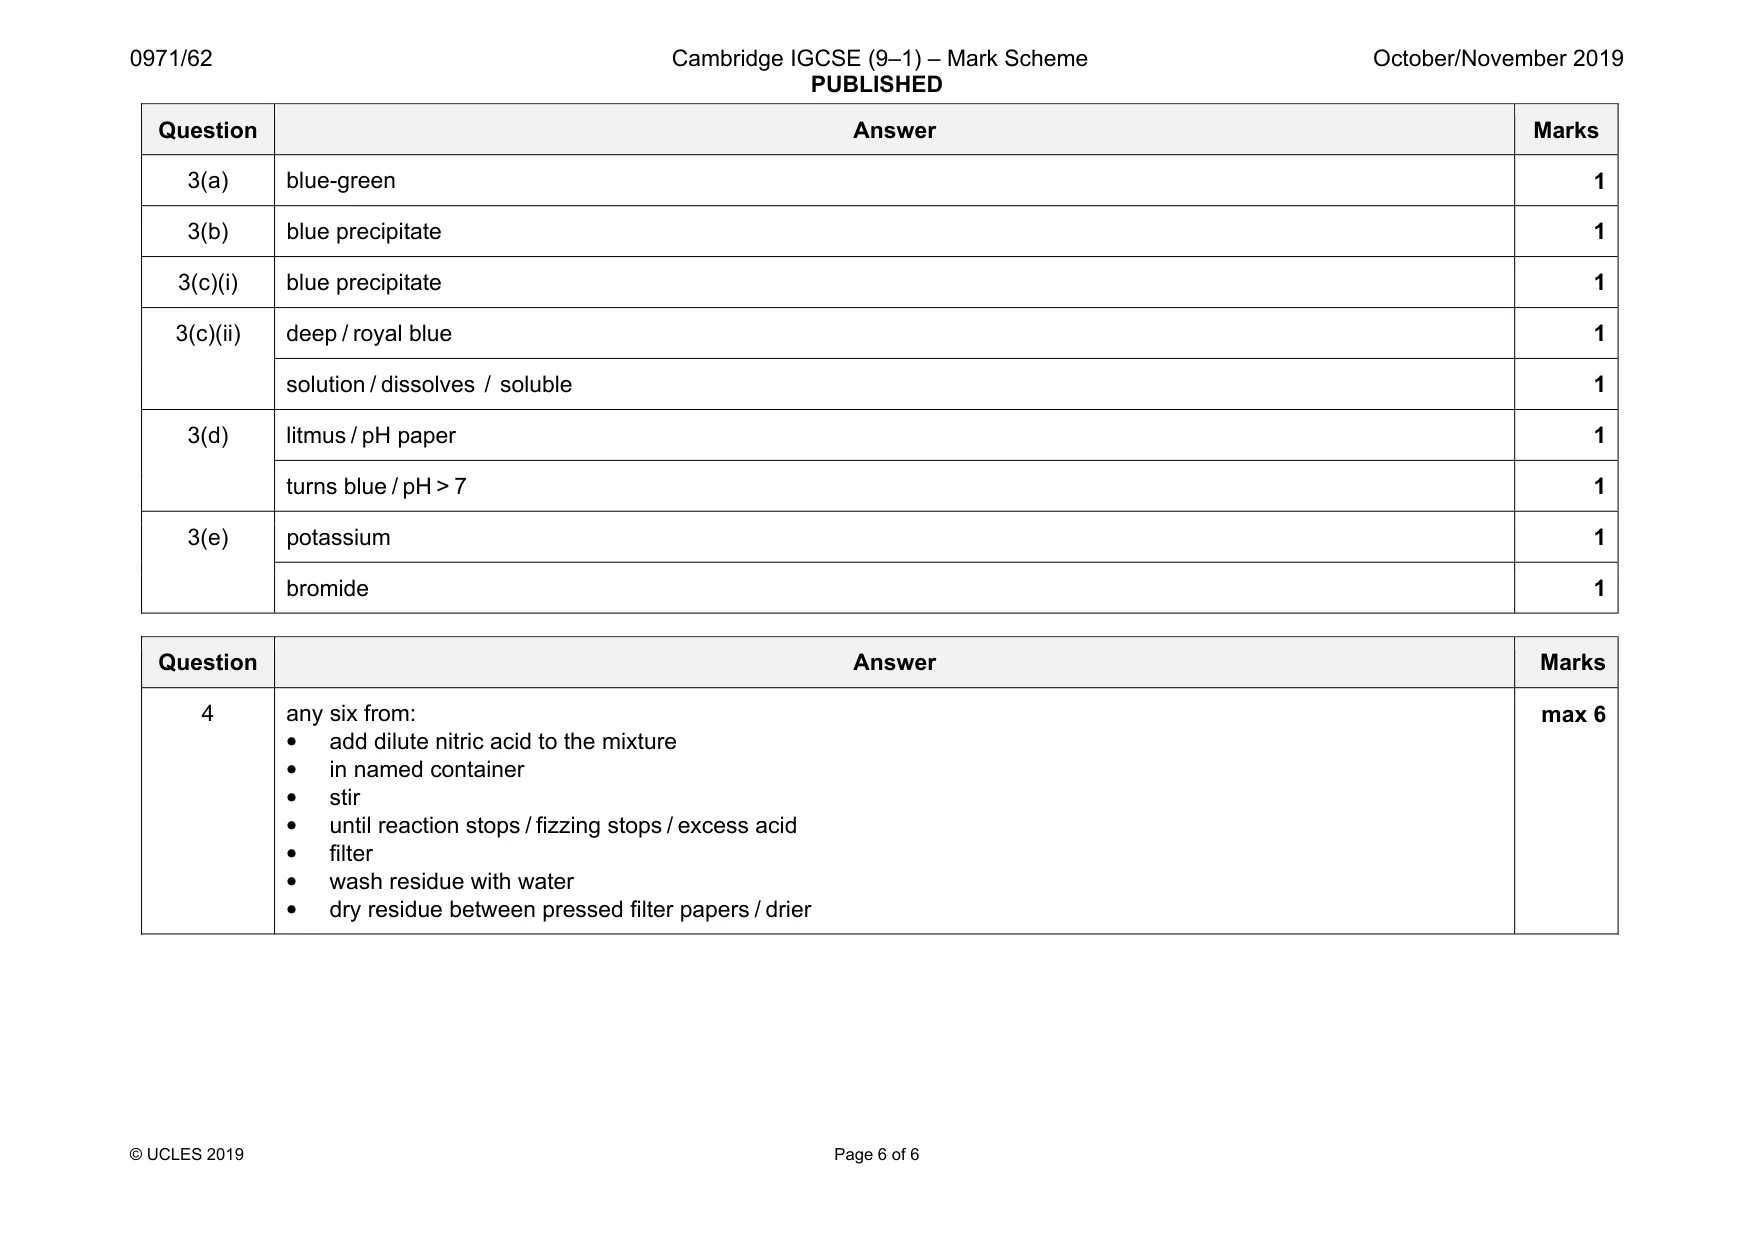
Mark scheme: 3(a) blue-green 1 3(b) blue precipitate 1 3(c)(i) blue precipitate 1 3(c)(ii) deep / royal blue 1 solution / dissolves / soluble 1 3(d) litmus / pH paper 1 turns blue / pH > 7 1 3(e) potassium 1 bromide 1
Q4 · The table gives some information about the properties of three substances found in a hand…
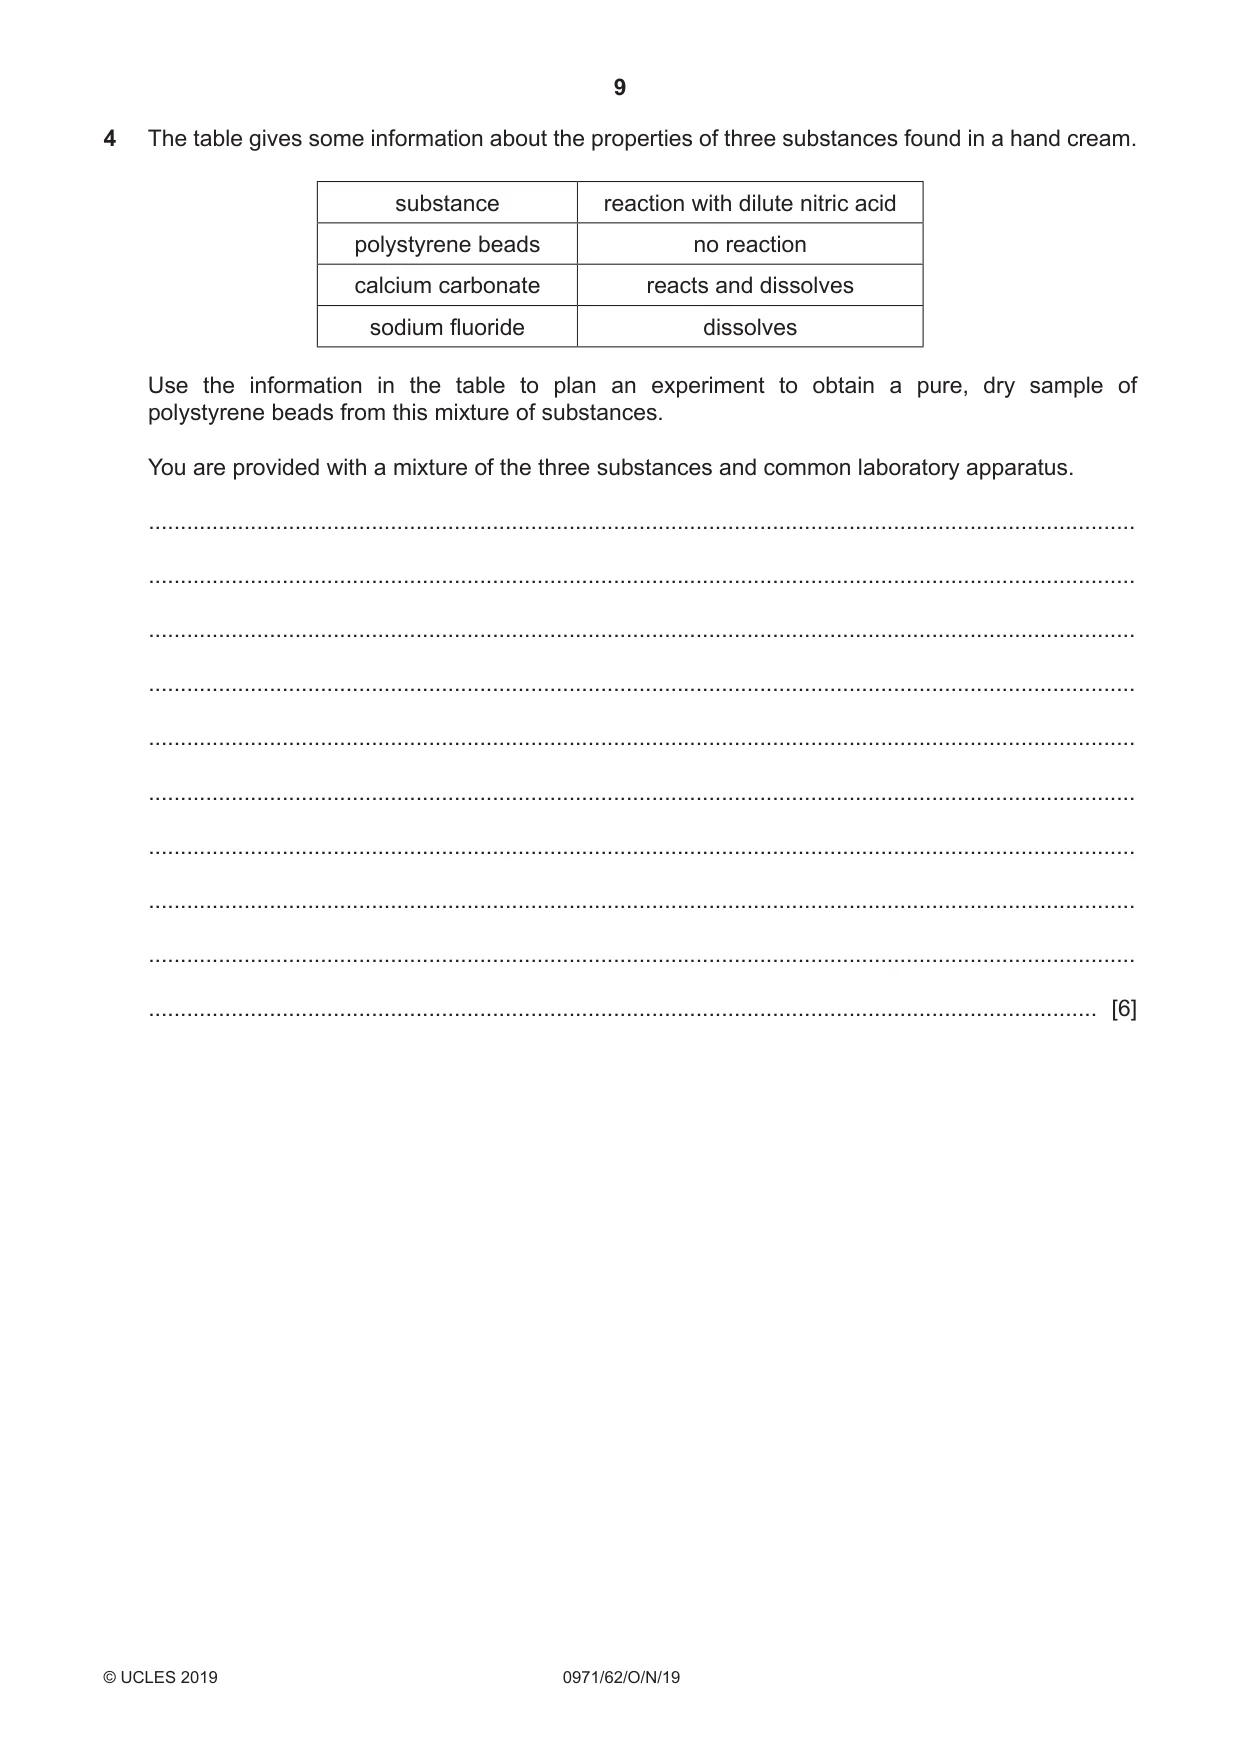
4 The table gives some information about the properties of three substances found in a hand cream. substance reaction with dilute nitric acid polystyrene beads no reaction calcium carbonate reacts and dissolves sodium fluoride dissolves Use the information in the table to plan an experiment to obtain a pure, dry sample of polystyrene beads from this mixture of substances. You are provided with a mixture of the three substances and common laboratory apparatus. ........................................................................................................................................................... ........................................................................................................................................................... ........................................................................................................................................................... ........................................................................................................................................................... ........................................................................................................................................................... ........................................................................................................................................................... ........................................................................................................................................................... ........................................................................................................................................................... ........................................................................................................................................................... ..................................................................................................................................................... [6]
Mark scheme: 4 any six from: • add dilute nitric acid to the mixture • in named container • stir • until reaction stops / fizzing stops / excess acid • filter • wash residue with water • dry residue between pressed filter papers / drier max 6
What was in this paper
The subtopics covered by these 4 questions, and how many questions each got. Open one in a new tab to see every Cambridge question on it.
What you needed in this session
Cambridge’s own grade thresholds for 2019 Oct/Nov, Paper 6 · Variant 2. A higher threshold means an easier paper — the bar moves with how the cohort did.