Cambridge IGCSE Chemistry (9-1) 0971 — 2018 Oct/Nov Paper 6 · Variant 2
0971/62/O/N/18 · 4 questions · 40 marks · ≈45 min
The question paper and its mark scheme, free to read here and free to download. This is Cambridge’s own paper, exactly as it was sat.
Question paper12 pages


Mark scheme6 pages
Answers below. Sit the paper first if you are practising.
Questions as text
Q1 · Magnesium ribbon was burned in air
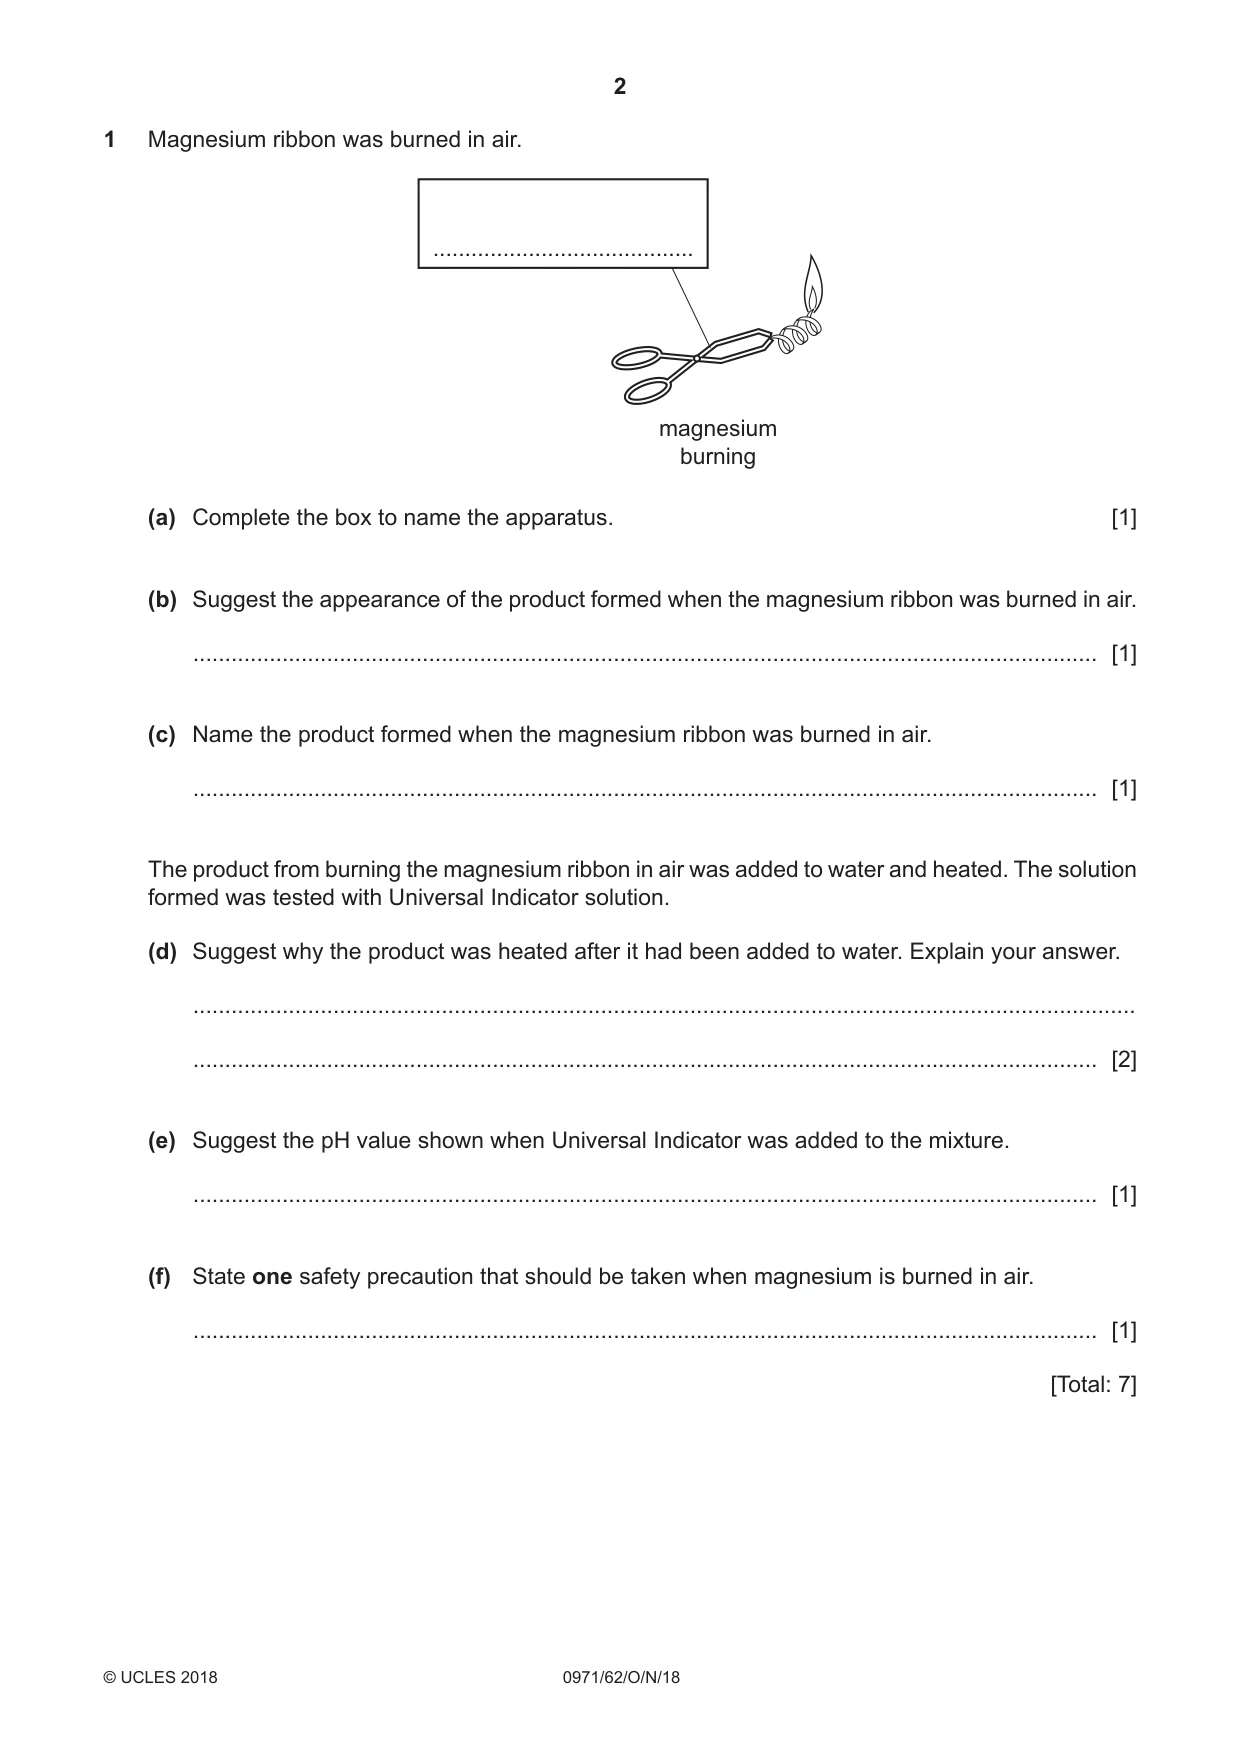
1 Magnesium ribbon was burned in air. ......................................... magnesium burning (a) Complete the box to name the apparatus. [1] (b) Suggest the appearance of the product formed when the magnesium ribbon was burned in air. .............................................................................................................................................. [1] (c) Name the product formed when the magnesium ribbon was burned in air. .............................................................................................................................................. [1] The product from burning the magnesium ribbon in air was added to water and heated. The solution formed was tested with Universal Indicator solution. (d) Suggest why the product was heated after it had been added to water. Explain your answer. .................................................................................................................................................... .............................................................................................................................................. [2] (e) Suggest the pH value shown when Universal Indicator was added to the mixture. .............................................................................................................................................. [1] (f) State one safety precaution that should be taken when magnesium is burned in air. .............................................................................................................................................. [1] [Total: 7]
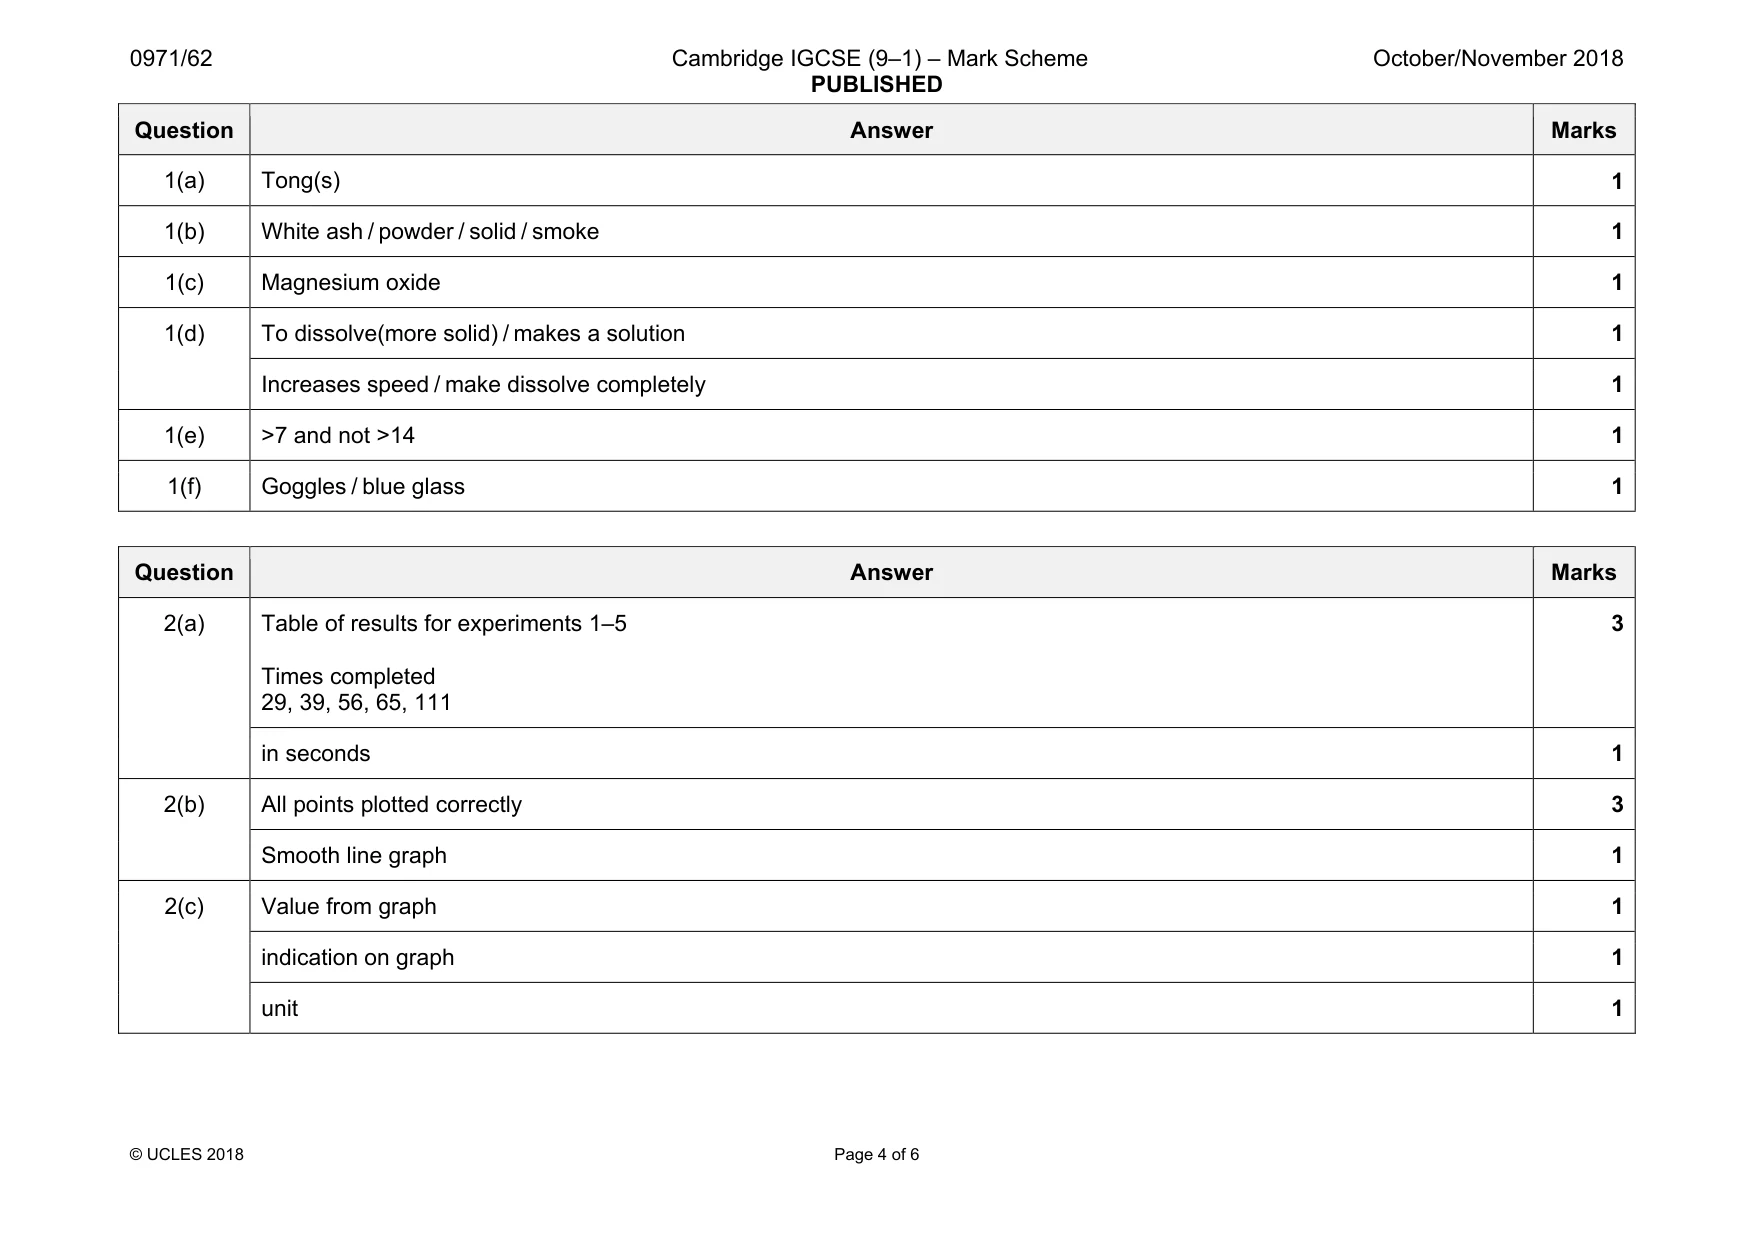
Mark scheme: 1(a) Tong(s) 1 1(b) White ash / powder / solid / smoke 1 1(c) Magnesium oxide 1 1(d) To dissolve(more solid) / makes a solution 1 Increases speed / make dissolve completely 1 1(e) >7 and not >14 1 1(f) Goggles / blue glass 1
Q2 · A student investigated the rate of reaction between solution L, solution M and…
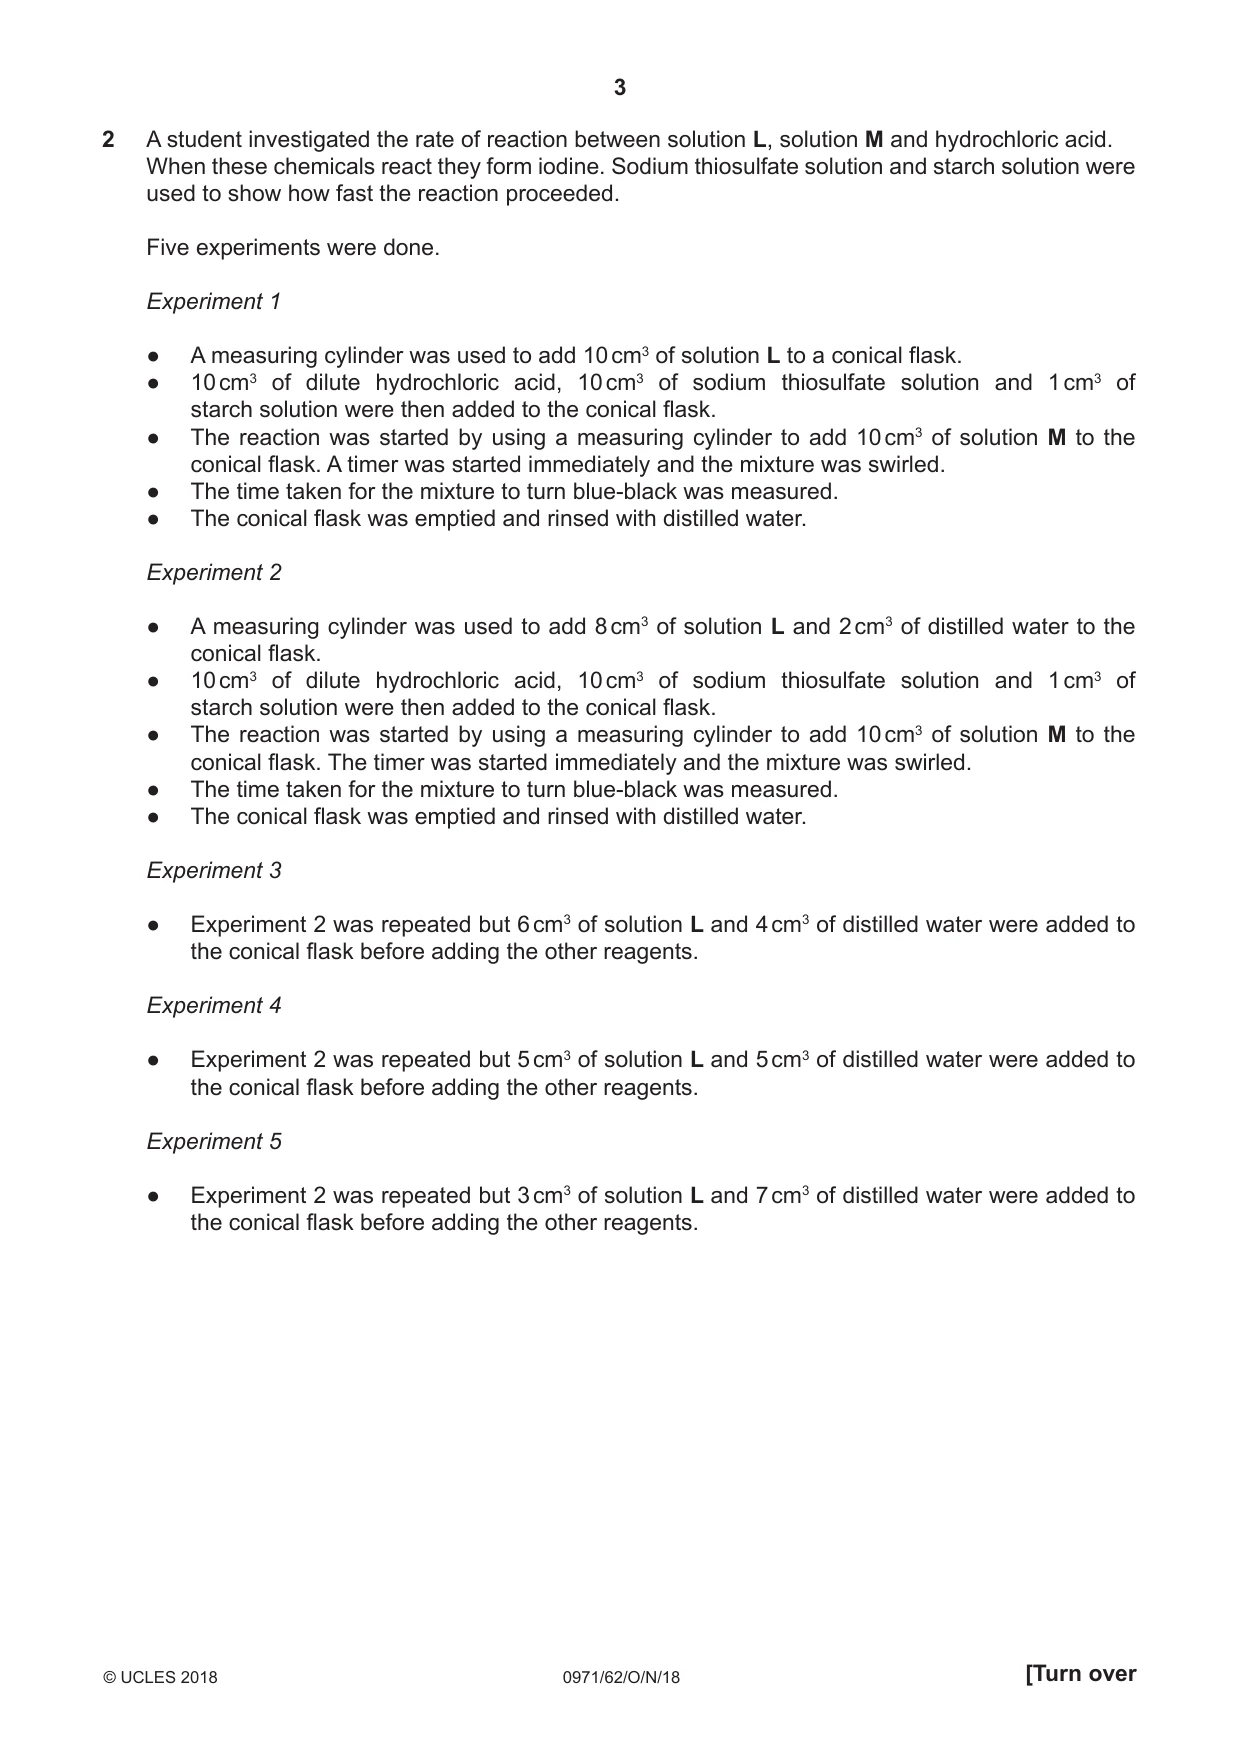
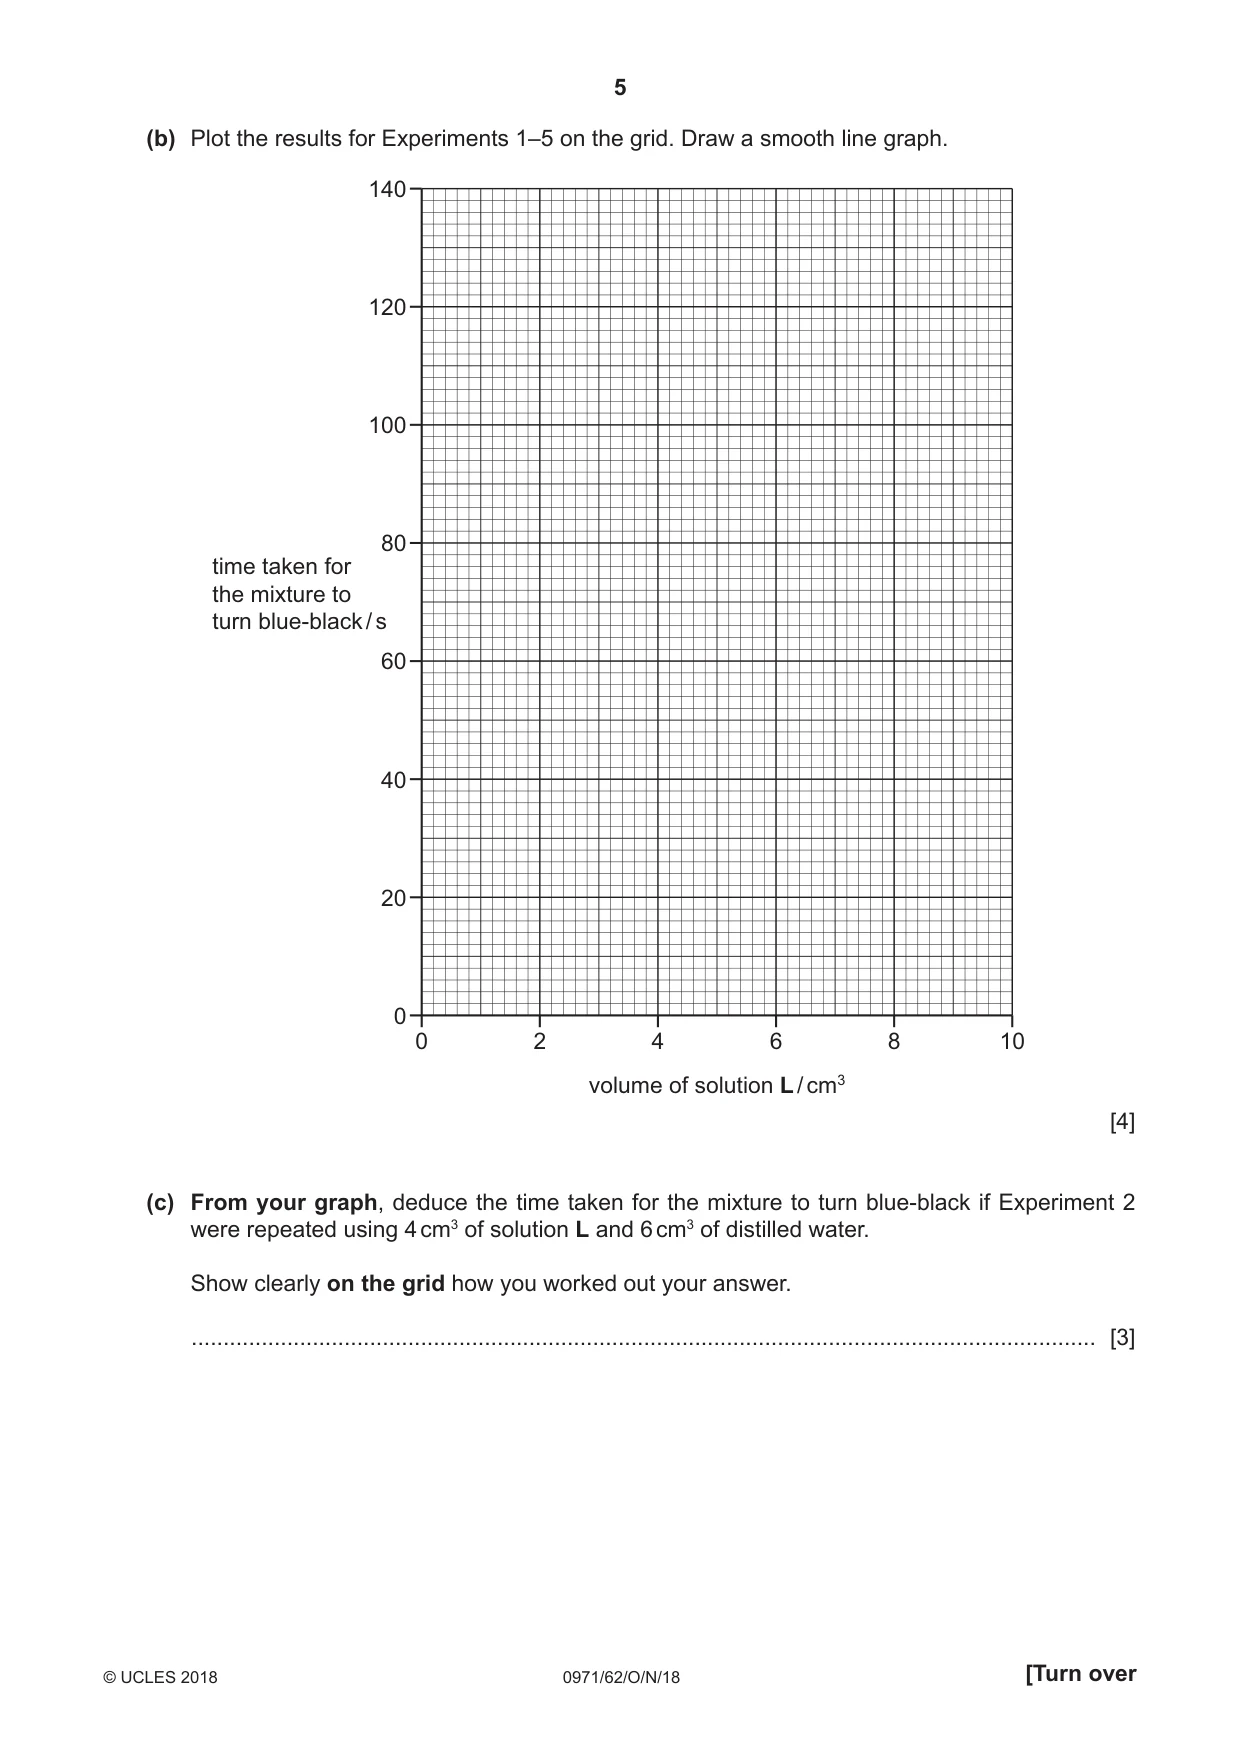
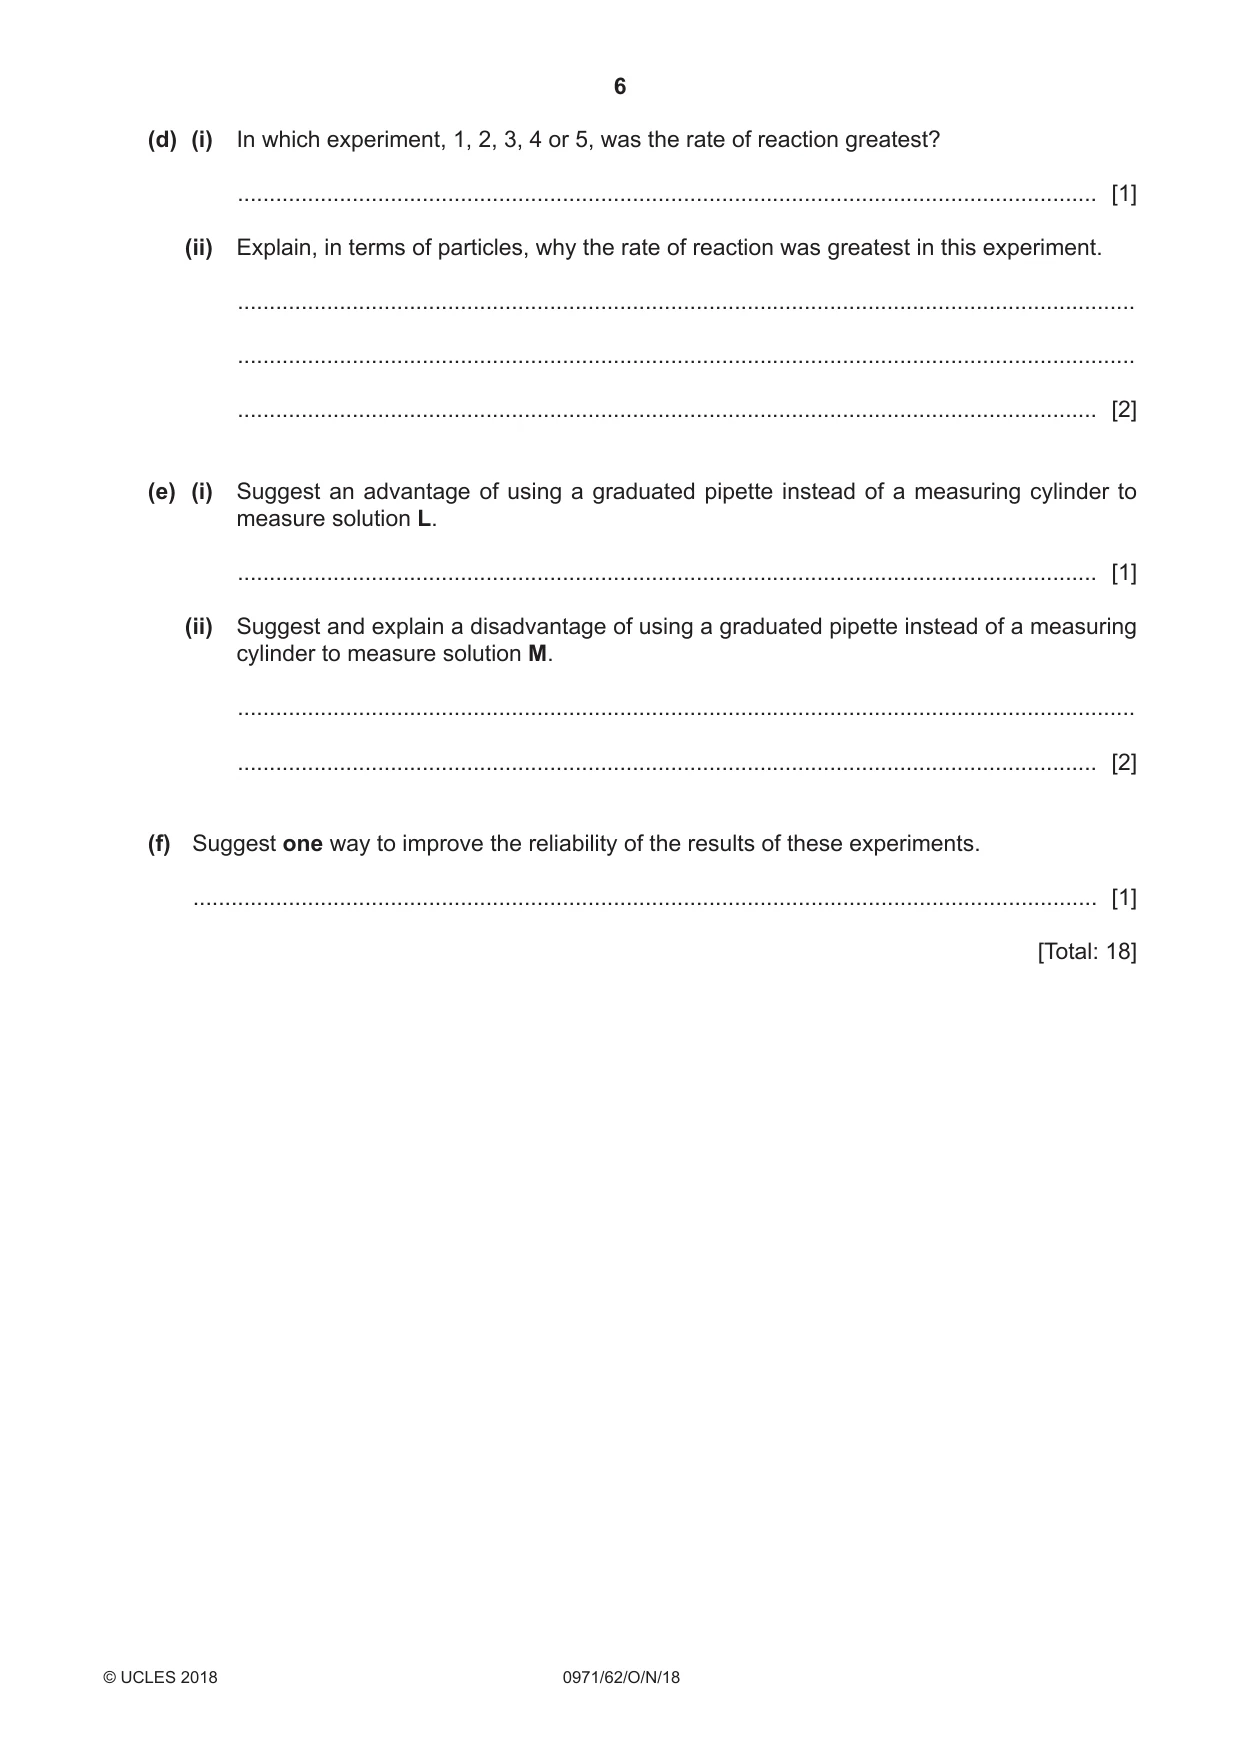
2 A student investigated the rate of reaction between solution L, solution M and hydrochloric acid. When these chemicals react they form iodine. Sodium thiosulfate solution and starch solution were used to show how fast the reaction proceeded. Five experiments were done. Experiment 1 ●● A measuring cylinder was used to add 10 cm3 of solution L to a conical flask. ●● 10 cm3 of dilute hydrochloric acid, 10 cm3 of sodium thiosulfate solution and 1 cm3 of starch solution were then added to the conical flask. ●● The reaction was started by using a measuring cylinder to add 10 cm3 of solution M to the conical flask. A timer was started immediately and the mixture was swirled. ●● The time taken for the mixture to turn blue-black was measured. ●● The conical flask was emptied and rinsed with distilled water. Experiment 2 ●● A measuring cylinder was used to add 8 cm3 of solution L and 2 cm3 of distilled water to the conical flask. ●● 10 cm3 of dilute hydrochloric acid, 10 cm3 of sodium thiosulfate solution and 1 cm3 of starch solution were then added to the conical flask. ●● The reaction was started by using a measuring cylinder to add 10 cm3 of solution M to the conical flask. The timer was started immediately and the mixture was swirled. ●● The time taken for the mixture to turn blue-black was measured. ●● The conical flask was emptied and rinsed with distilled water. Experiment 3 ●● Experiment 2 was repeated but 6 cm3 of solution L and 4 cm3 of distilled water were added to the conical flask before adding the other reagents. Experiment 4 ●● Experiment 2 was repeated but 5 cm3 of solution L and 5 cm3 of distilled water were added to the conical flask before adding the other reagents. Experiment 5 ●● Experiment 2 was repeated but 3 cm3 of solution L and 7 cm3 of distilled water were added to the conical flask before adding the other reagents. (a) Use the stop-clock diagrams to record the time taken for each experiment in the table. volume of time taken forexperiment volume of stop-clock distilled the mixture to number solution L / cm3 diagram water / cm3 turn blue-black / s 0 seconds 0 1 10 0 45 15 5 15 10 minutes 30 0 0 2 8 2 45 15 5 15 10 30 0 0 3 6 4 45 15 5 15 10 30 0 0 4 5 5 45 15 5 15 10 30 0 0 5 3 7 45 15 5 15 10 30 [4] (b) Plot the results for Experiments 1–5 on the grid. Draw a smooth line graph. 140 120 100 80 time taken for the mixture to turn blue-black / s 60 40 20 0 0 2 4 6 8 10 volume of solution L / cm3 [4] (c) From your graph, deduce the time taken for the mixture to turn blue-black if Experiment 2 were repeated using 4 cm3 of solution L and 6 cm3 of distilled water. Show clearly on the grid how you worked out your answer. .............................................................................................................................................. [3] (d) (i) In which experiment, 1, 2, 3, 4 or 5, was the rate of reaction greatest? ....................................................................................................................................... [1] (ii) Explain, in terms of particles, why the rate of reaction was greatest in this experiment. ............................................................................................................................................. ............................................................................................................................................. ....................................................................................................................................... [2] (e) (i) Suggest an advantage of using a graduated pipette instead of a measuring cylinder to measure solution L. ....................................................................................................................................... [1] (ii) Suggest and explain a disadvantage of using a graduated pipette instead of a measuring cylinder to measure solution M. ............................................................................................................................................. ....................................................................................................................................... [2] (f) Suggest one way to improve the reliability of the results of these experiments. .............................................................................................................................................. [1] [Total: 18]
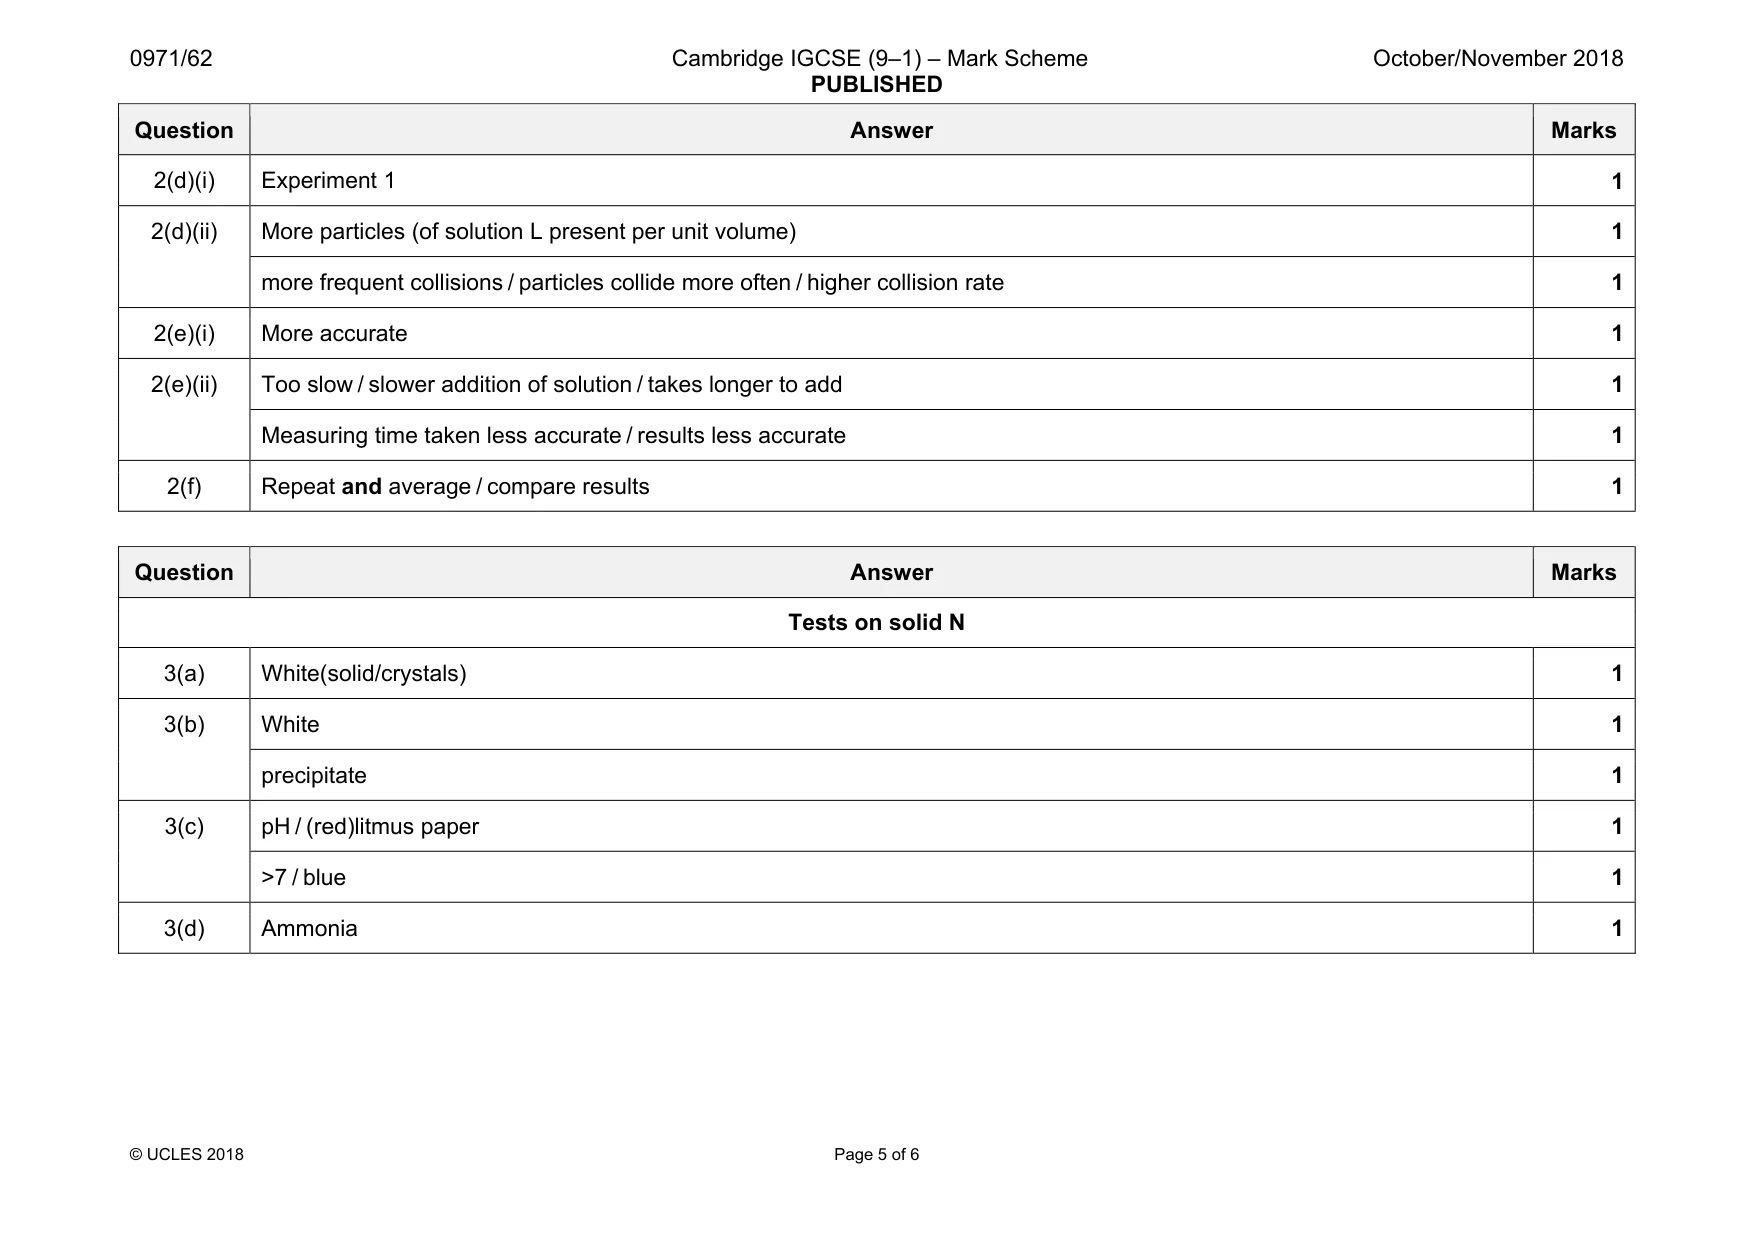
Mark scheme: 2(a) Table of results for experiments 1–5 Times completed 29, 39, 56, 65, 111 3 in seconds 1 2(b) All points plotted correctly 3 Smooth line graph 1 2(c) Value from graph 1 indication on graph 1 unit 1 Question Answer Marks 2(d)(i) Experiment 1 1 2(d)(ii) More particles (of solution L present per unit volume) 1 more frequent collisions / particles collide more often / higher collision rate 1 2(e)(i) More accurate 1 2(e)(ii) Too slow / slower addition of solution / takes longer to add 1 Measuring time taken less accurate / results less accurate 1 2(f) Repeat and average / compare results 1
Q3 · Solid N and solid O were analysed
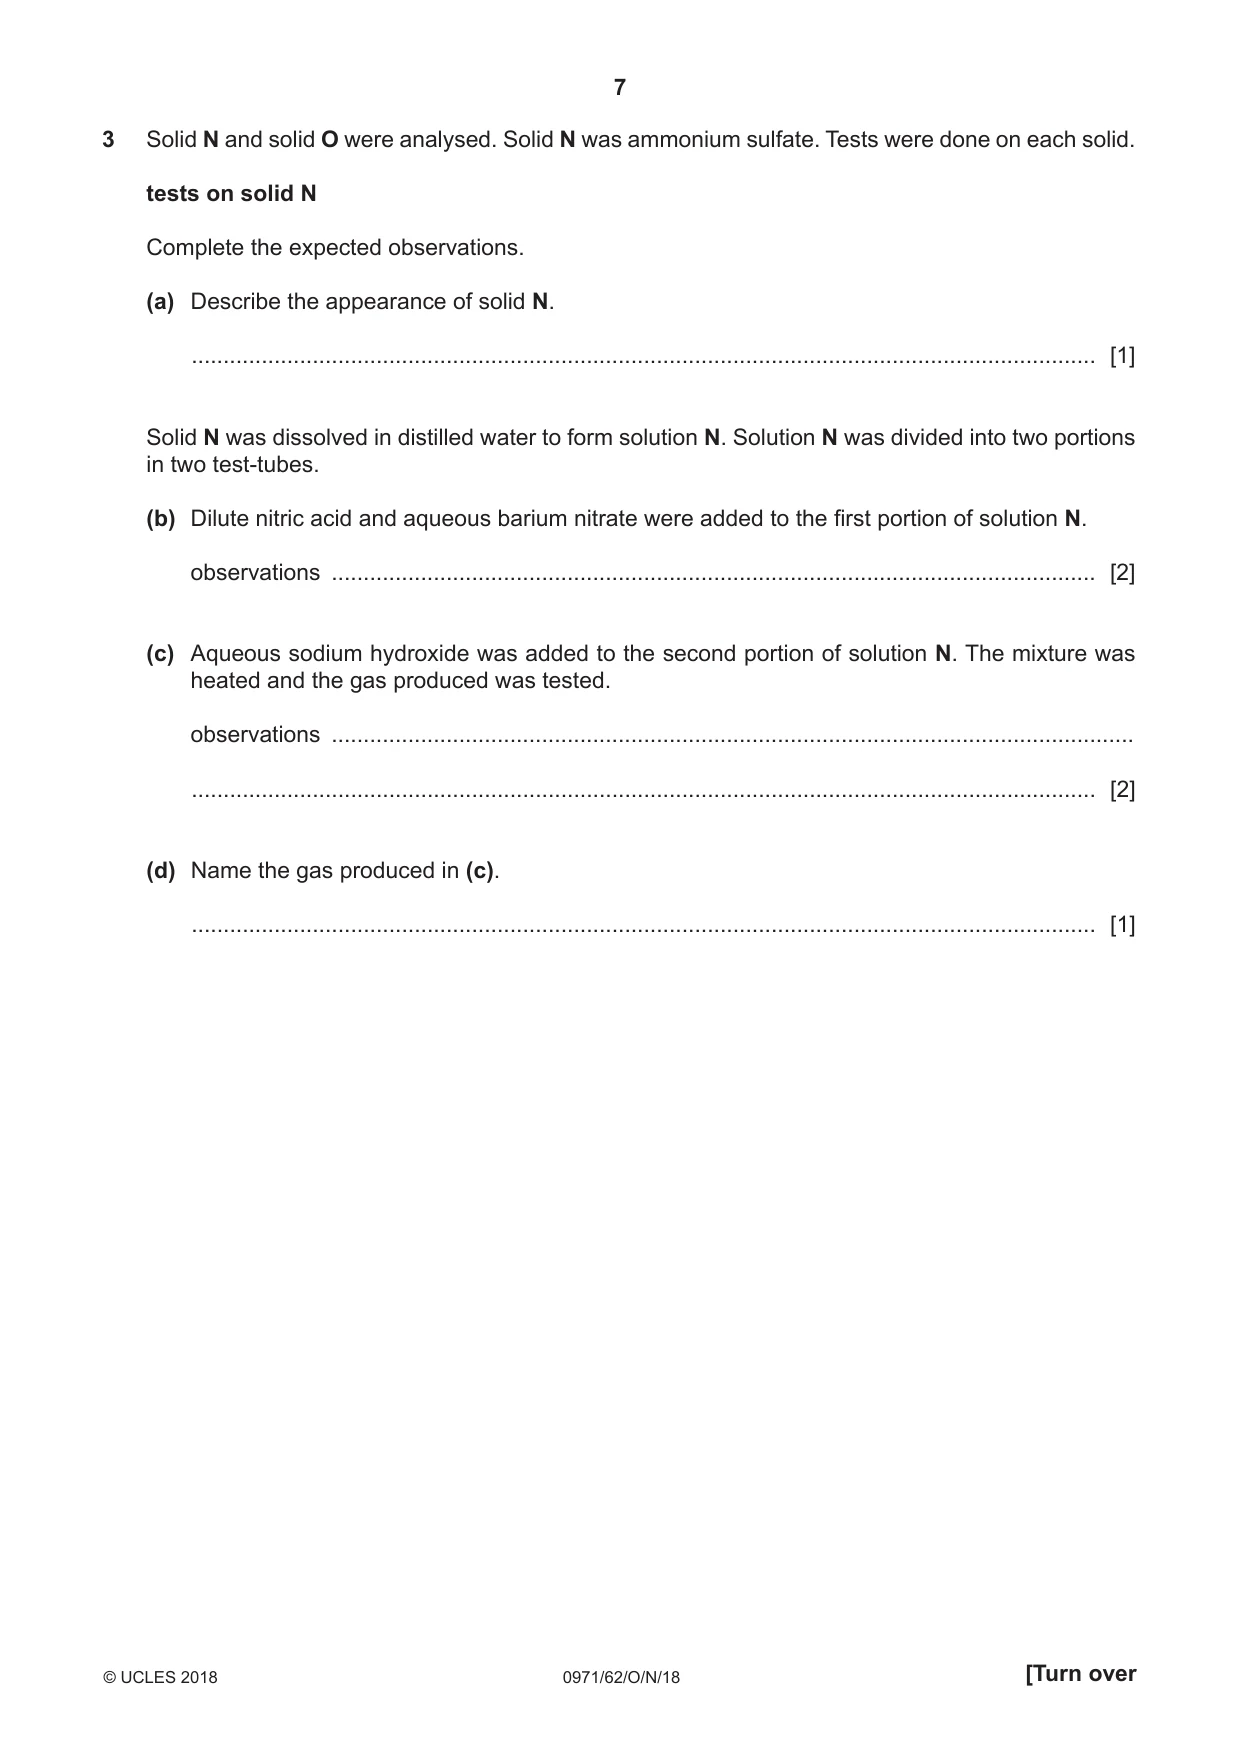
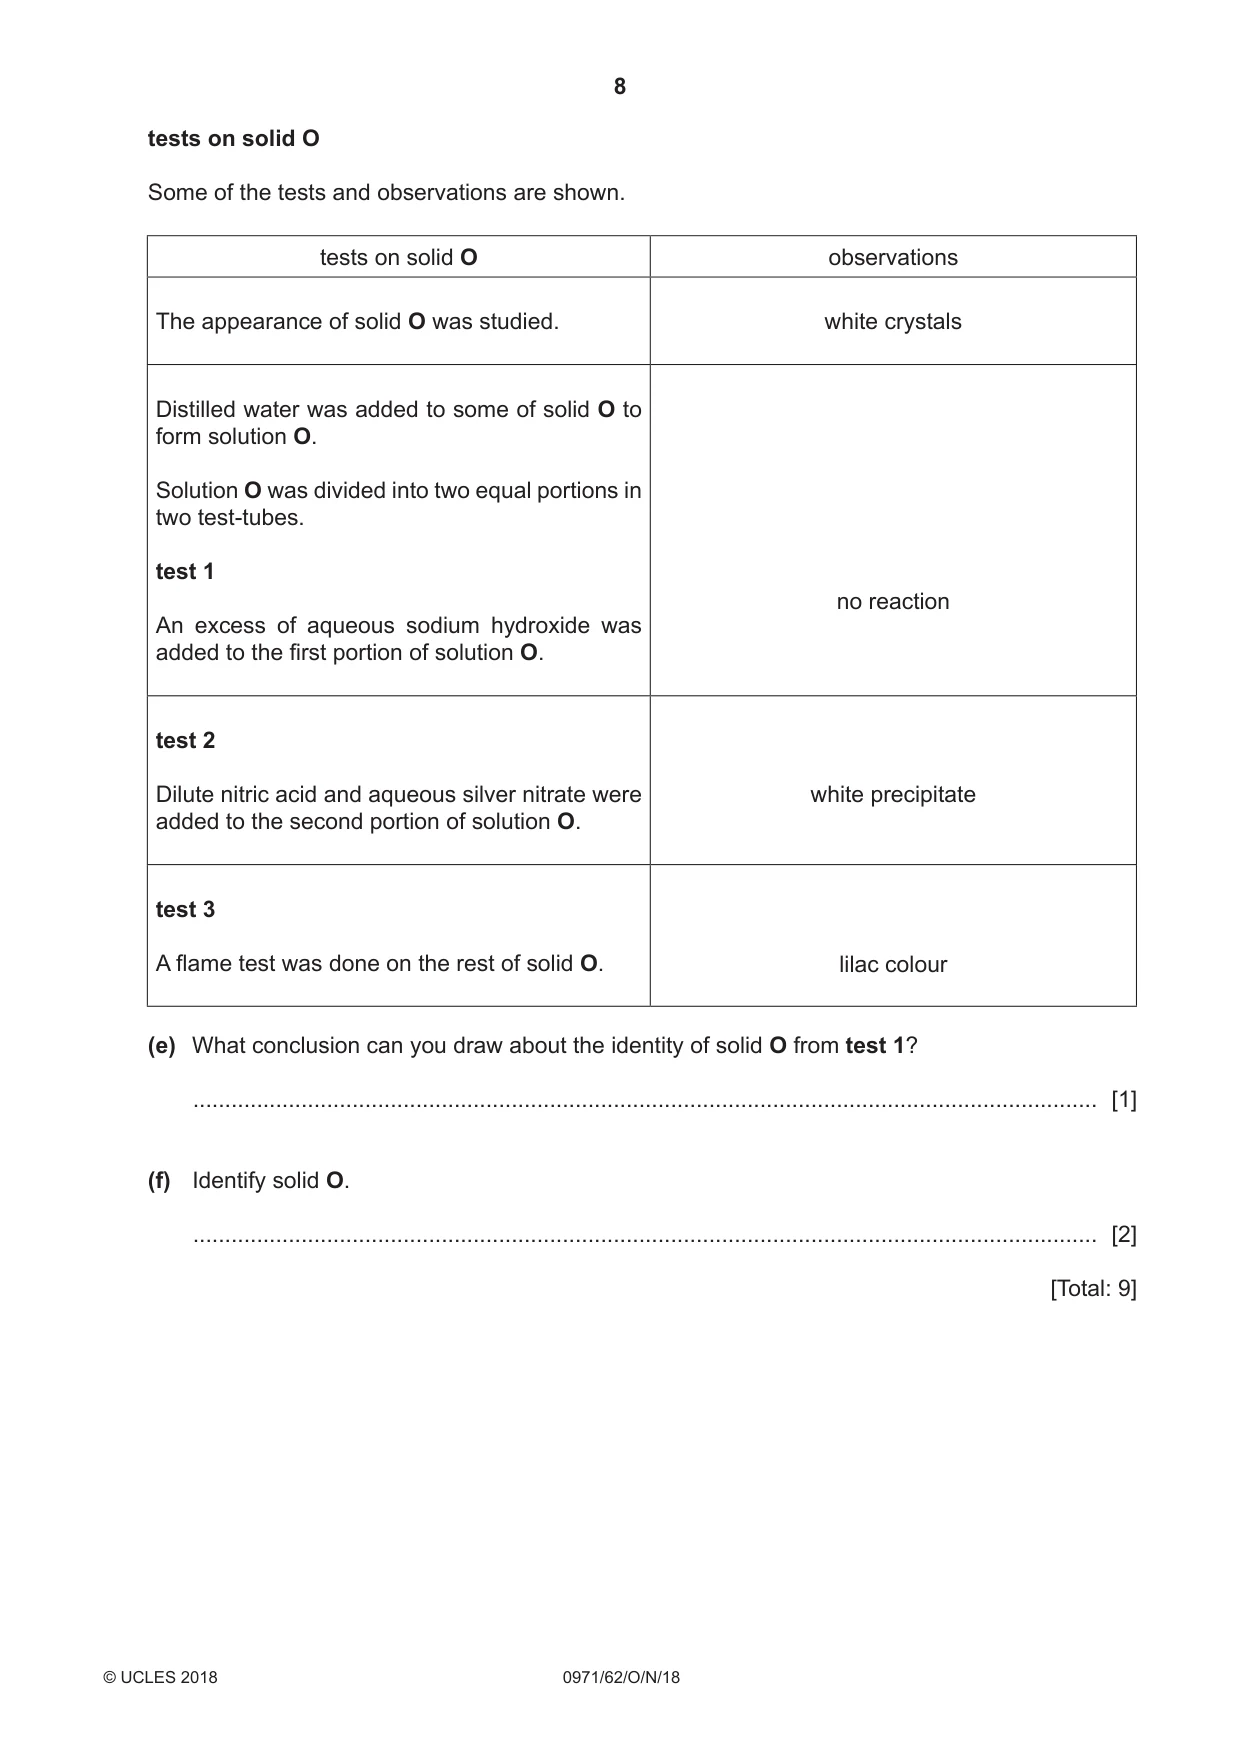
3 Solid N and solid O were analysed. Solid N was ammonium sulfate. Tests were done on each solid. tests on solid N Complete the expected observations. (a) Describe the appearance of solid N. .............................................................................................................................................. [1] Solid N was dissolved in distilled water to form solution N. Solution N was divided into two portions in two test‑tubes. (b) Dilute nitric acid and aqueous barium nitrate were added to the first portion of solution N. observations ......................................................................................................................... [2] (c) Aqueous sodium hydroxide was added to the second portion of solution N. The mixture was heated and the gas produced was tested. observations ............................................................................................................................... .............................................................................................................................................. [2] (d) Name the gas produced in (c). .............................................................................................................................................. [1] tests on solid O Some of the tests and observations are shown. tests on solid O observations The appearance of solid O was studied. white crystals Distilled water was added to some of solid O to form solution O. Solution O was divided into two equal portions in two test‑tubes. test 1 no reaction An excess of aqueous sodium hydroxide was added to the first portion of solution O. test 2 Dilute nitric acid and aqueous silver nitrate were white precipitate added to the second portion of solution O. test 3 A flame test was done on the rest of solid O. lilac colour (e) What conclusion can you draw about the identity of solid O from test 1? .............................................................................................................................................. [1] (f) Identify solid O. .............................................................................................................................................. [2] [Total: 9]
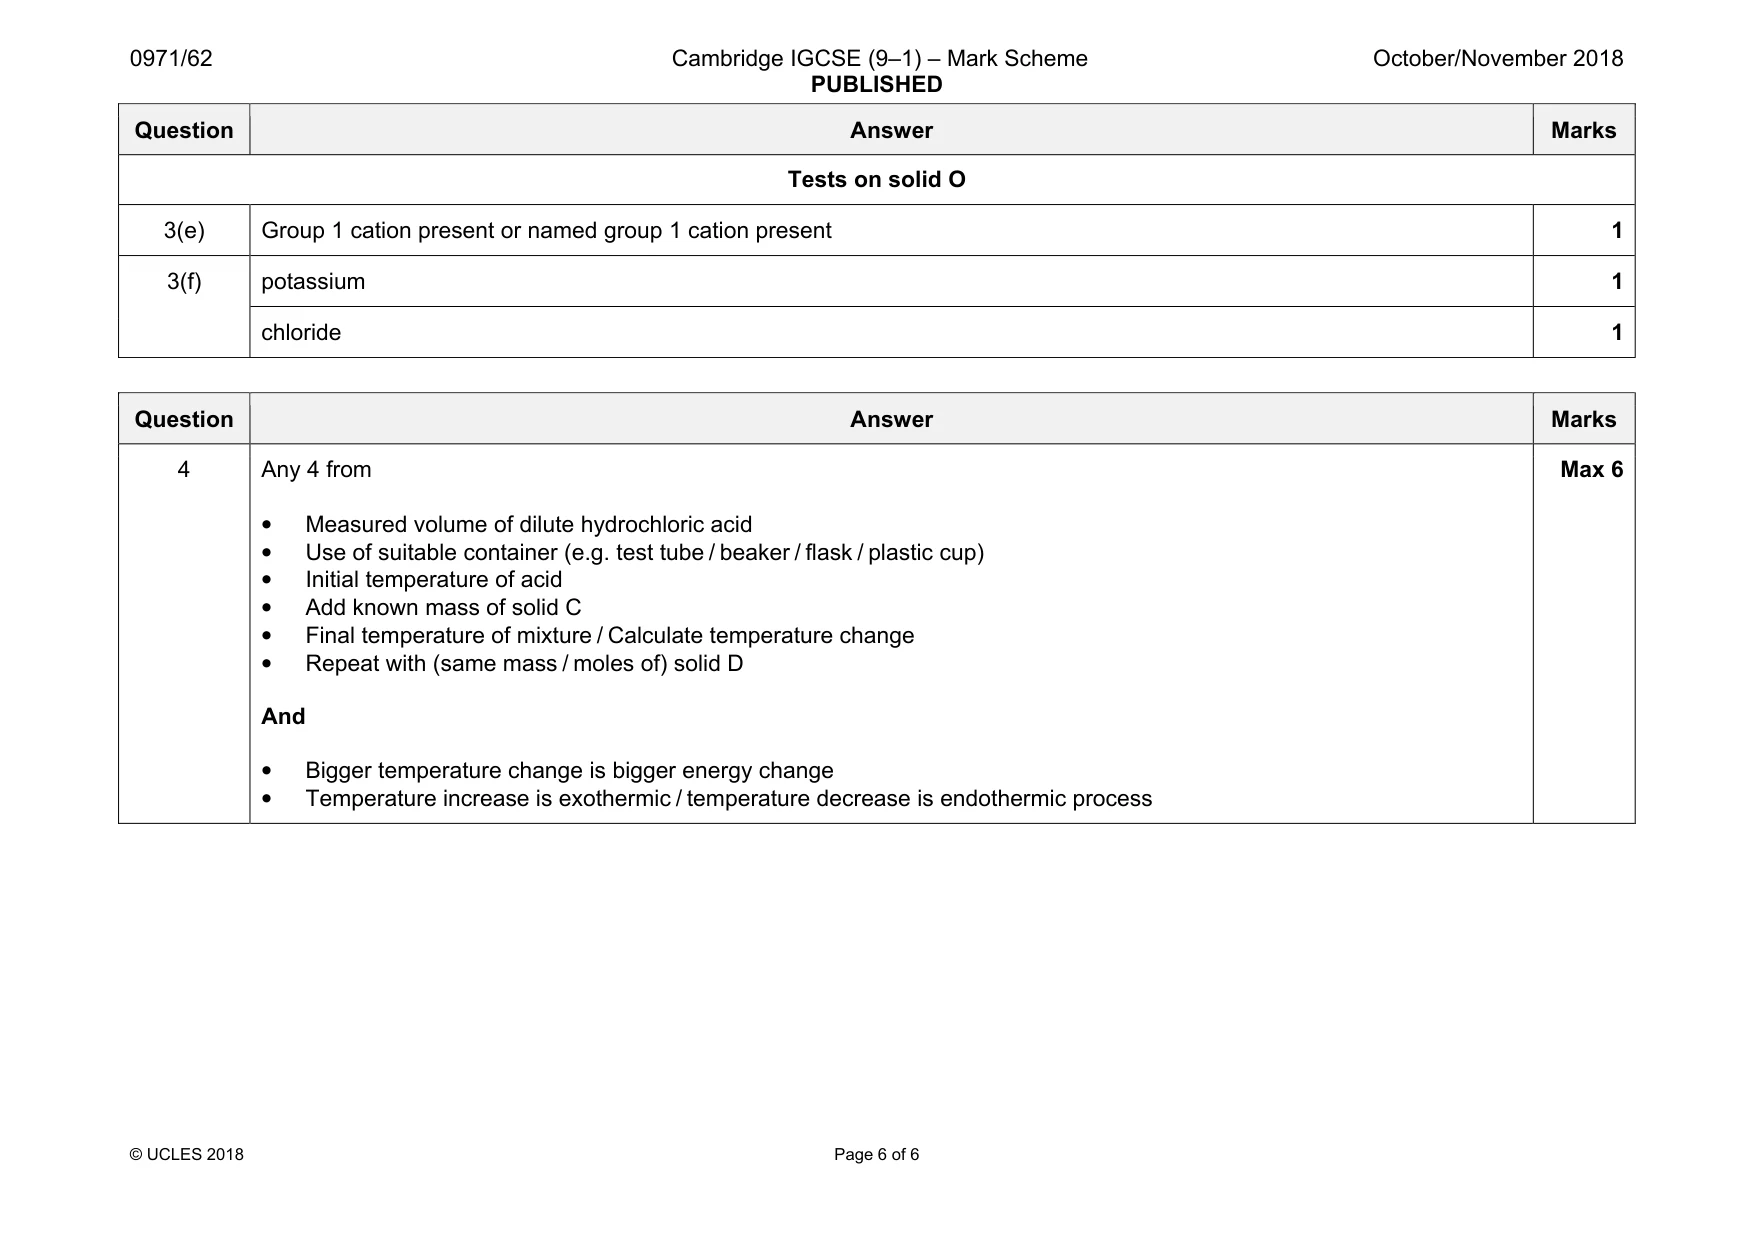
Mark scheme: 3(a) White(solid/crystals) 1 3(b) White 1 precipitate 1 3(c) pH / (red)litmus paper 1 >7 / blue 1 3(d) Ammonia 1 Question Answer Marks Tests on solid O 3(e) Group 1 cation present or named group 1 cation present 1 3(f) potassium 1 chloride 1
Q4 · When solid C and solid D separately react with dilute hydrochloric acid, one reaction is…
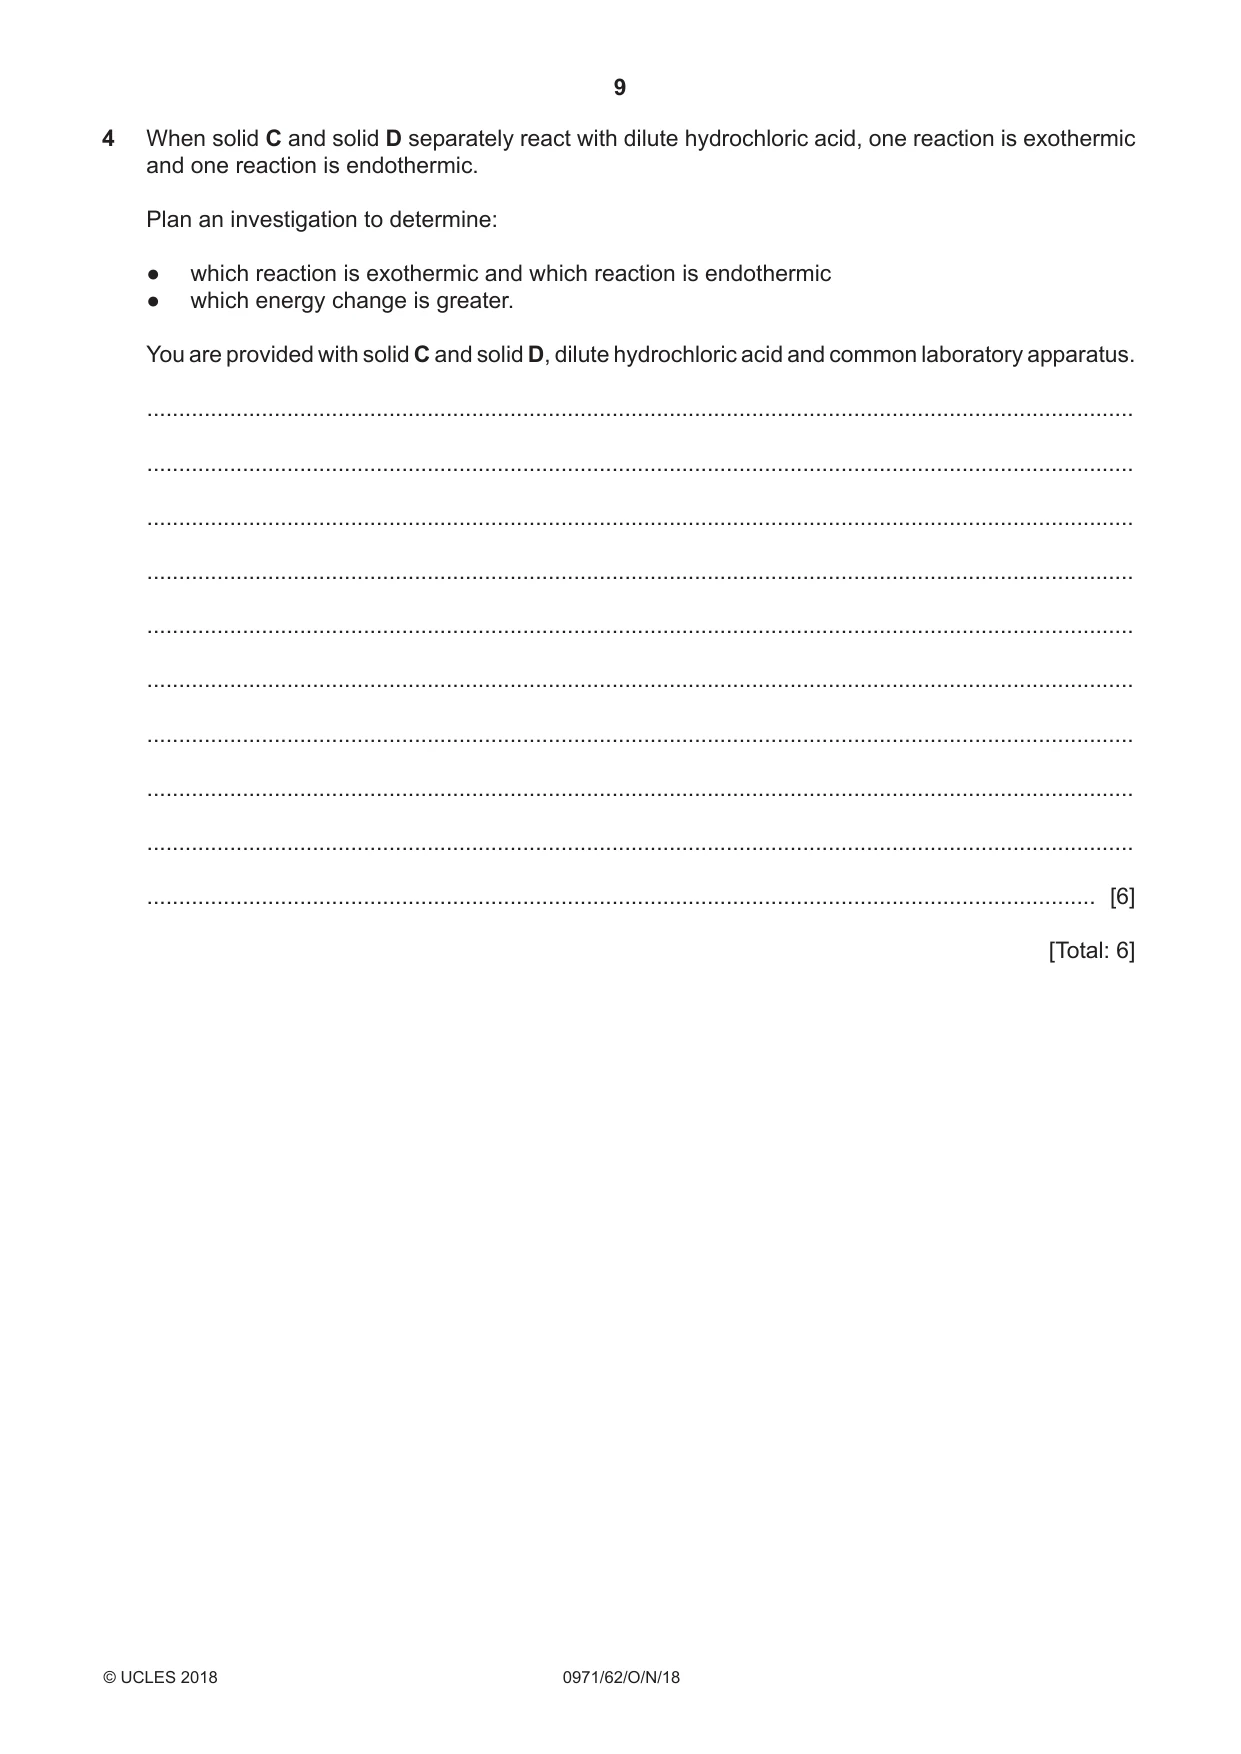
4 When solid C and solid D separately react with dilute hydrochloric acid, one reaction is exothermic and one reaction is endothermic. Plan an investigation to determine: ●● which reaction is exothermic and which reaction is endothermic ●● which energy change is greater. You are provided with solid C and solid D, dilute hydrochloric acid and common laboratory apparatus. ........................................................................................................................................................... ........................................................................................................................................................... ........................................................................................................................................................... ........................................................................................................................................................... ........................................................................................................................................................... ........................................................................................................................................................... ........................................................................................................................................................... ........................................................................................................................................................... ........................................................................................................................................................... ..................................................................................................................................................... [6] [Total: 6]
Mark scheme: 4 Any 4 from • Measured volume of dilute hydrochloric acid • Use of suitable container (e.g. test tube / beaker / flask / plastic cup) • Initial temperature of acid • Add known mass of solid C • Final temperature of mixture / Calculate temperature change • Repeat with (same mass / moles of) solid D And • Bigger temperature change is bigger energy change • Temperature increase is exothermic / temperature decrease is endothermic process Max 6
What was in this paper
The subtopics covered by these 4 questions, and how many questions each got. Open one in a new tab to see every Cambridge question on it.
What you needed in this session
Cambridge’s own grade thresholds for 2018 Oct/Nov, Paper 6 · Variant 2. A higher threshold means an easier paper — the bar moves with how the cohort did.