Cambridge IGCSE Biology (9-1) 0970 — 2024 May/June Paper 6 · Variant 1
0970/61/M/J/24 · 3 questions · 40 marks · ≈45 min
The question paper and its mark scheme, free to read here and free to download. This is Cambridge’s own paper, exactly as it was sat.
Question paper12 pages
Mark scheme8 pages
Answers below. Sit the paper first if you are practising.
Questions as text
Q1 · Cooking fruit and vegetables in water reduces their vitamin C content
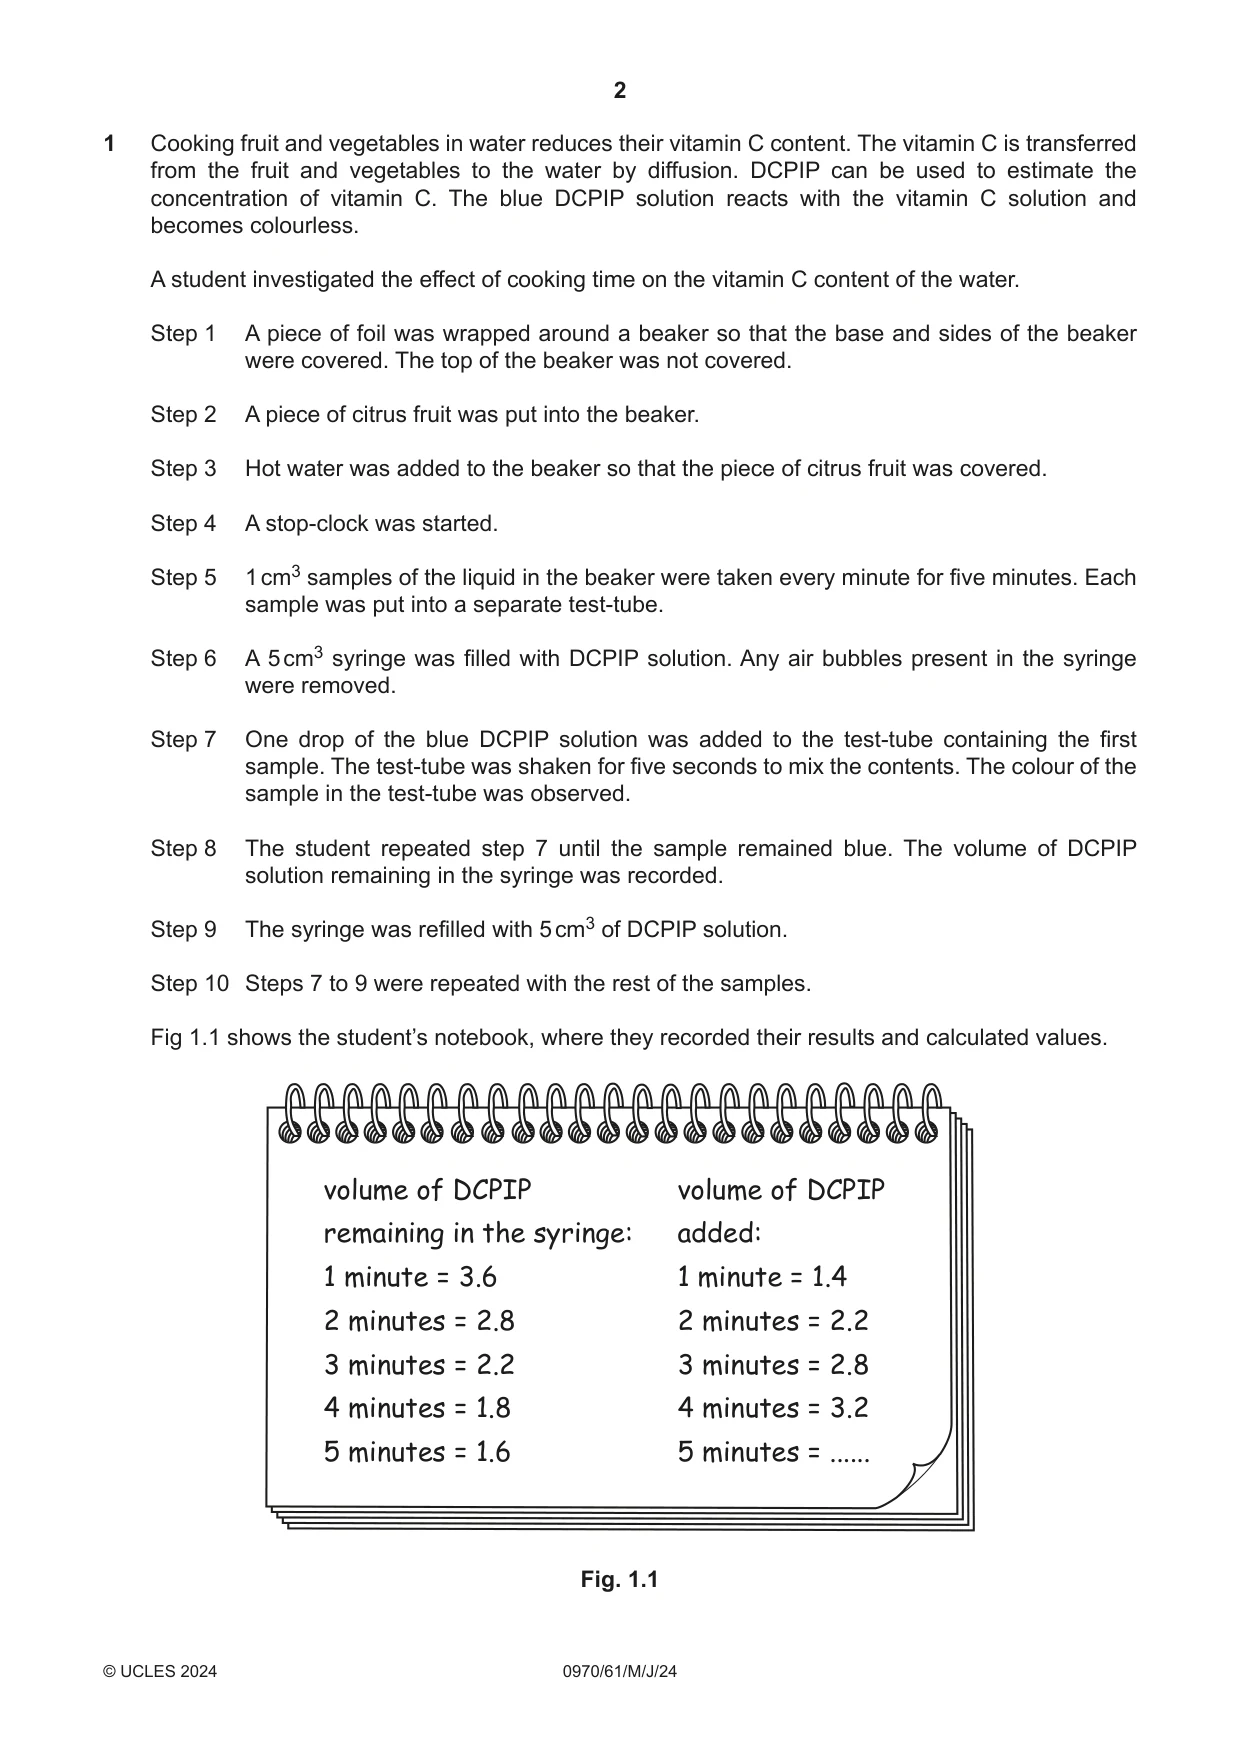
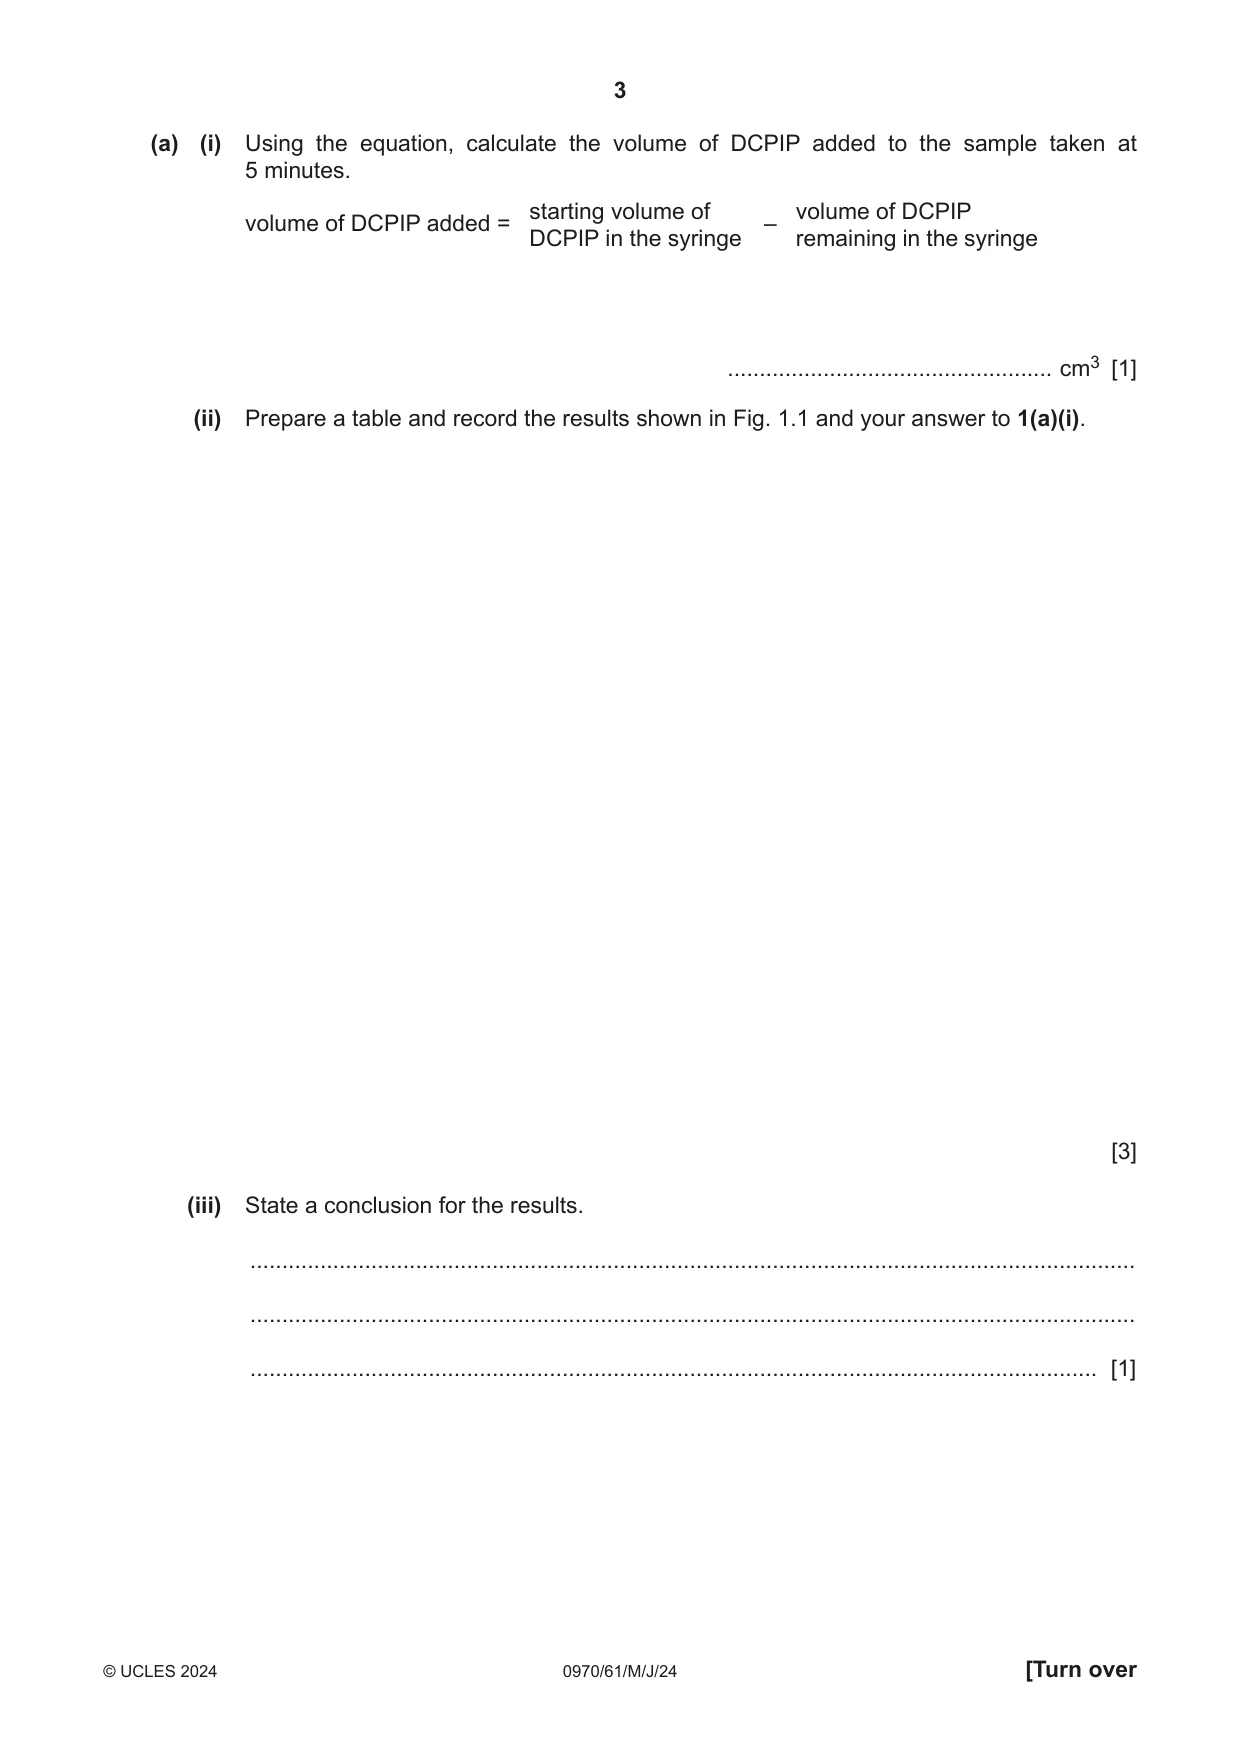
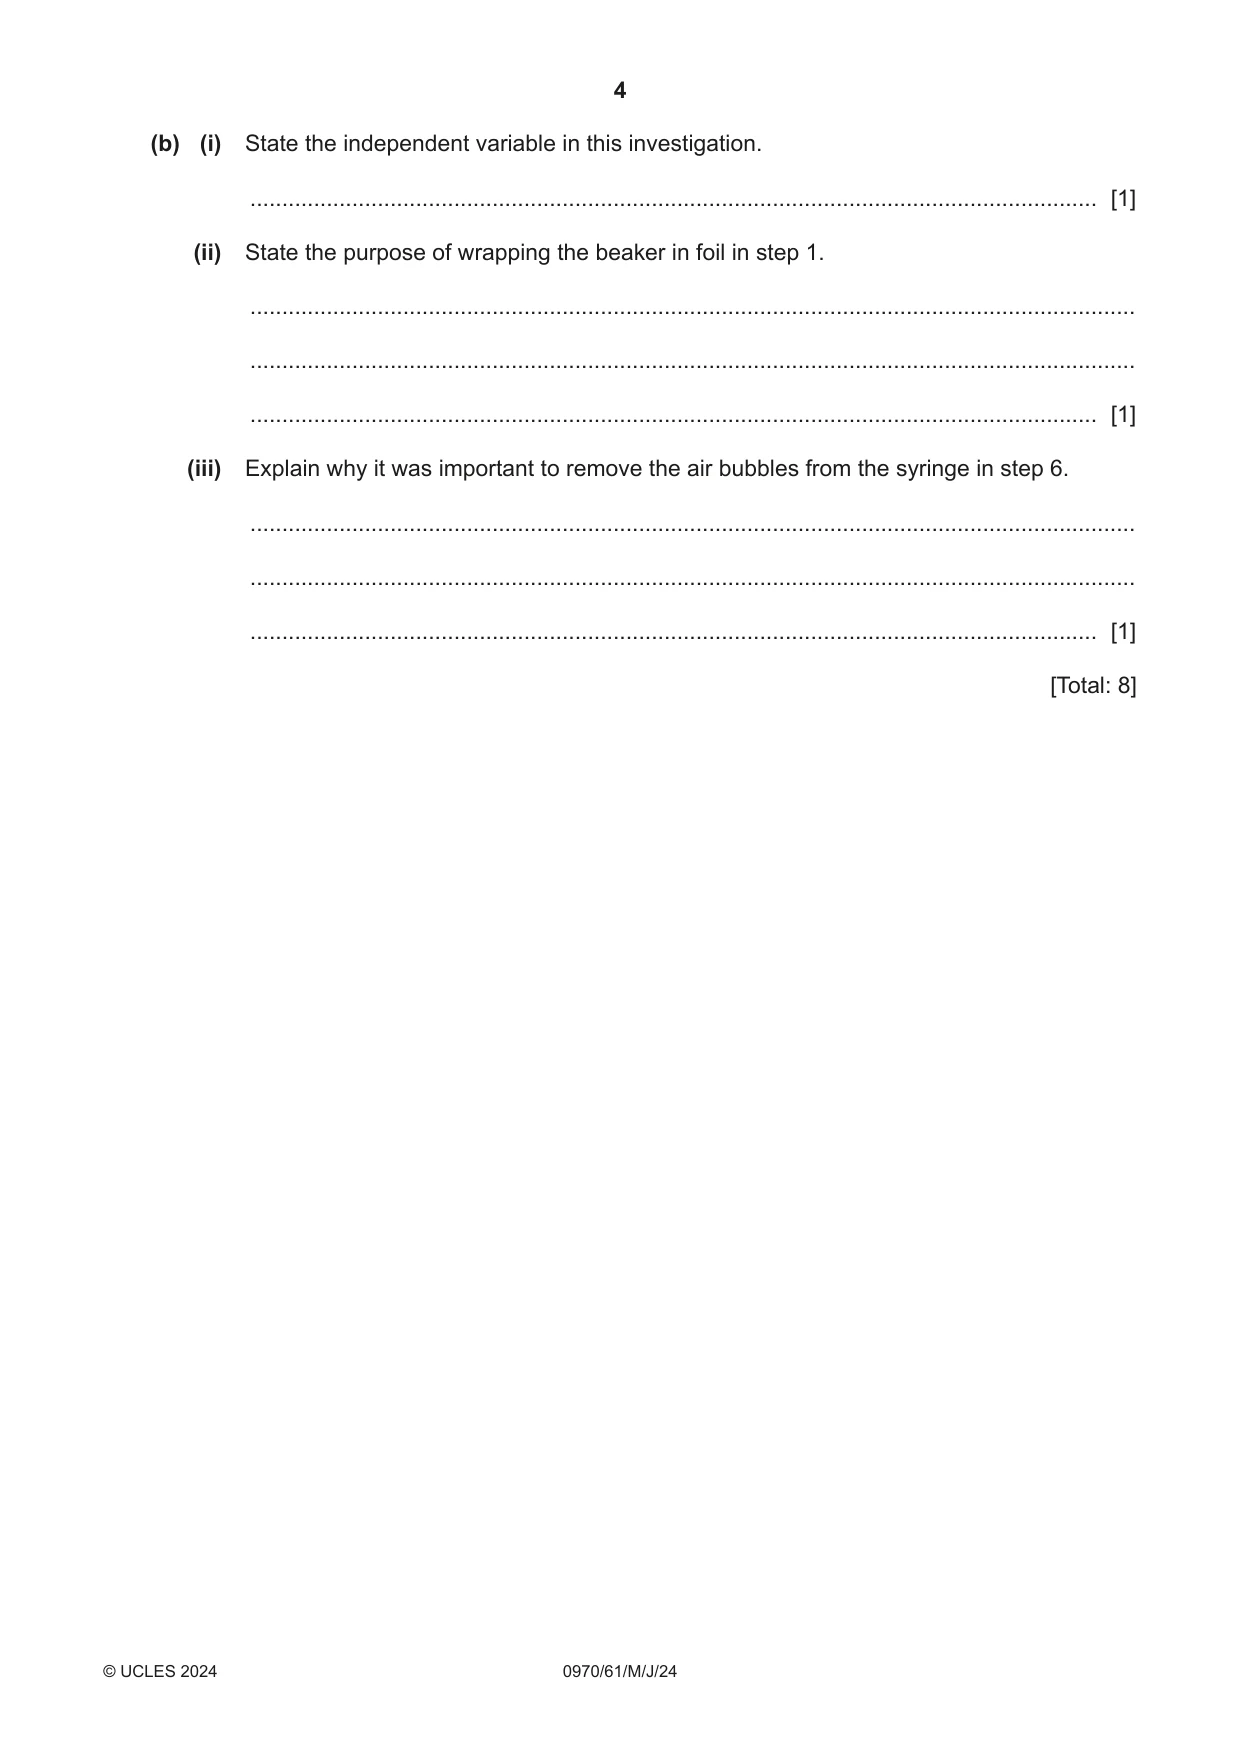
1 Cooking fruit and vegetables in water reduces their vitamin C content. The vitamin C is transferred from the fruit and vegetables to the water by diffusion. DCPIP can be used to estimate the concentration of vitamin C. The blue DCPIP solution reacts with the vitamin C solution and becomes colourless. A student investigated the effect of cooking time on the vitamin C content of the water. Step 1 A piece of foil was wrapped around a beaker so that the base and sides of the beaker were covered. The top of the beaker was not covered. Step 2 A piece of citrus fruit was put into the beaker. Step 3 Hot water was added to the beaker so that the piece of citrus fruit was covered. Step 4 A stop‑clock was started. Step 5 1 cm3 samples of the liquid in the beaker were taken every minute for five minutes. Each sample was put into a separate test‑tube. Step 6 A 5 cm3 syringe was filled with DCPIP solution. Any air bubbles present in the syringe were removed. Step 7 One drop of the blue DCPIP solution was added to the test‑tube containing the first sample. The test‑tube was shaken for five seconds to mix the contents. The colour of the sample in the test‑tube was observed. Step 8 The student repeated step 7 until the sample remained blue. The volume of DCPIP solution remaining in the syringe was recorded. Step 9 The syringe was refilled with 5 cm3 of DCPIP solution. Step 10 Steps 7 to 9 were repeated with the rest of the samples. Fig 1.1 shows the student’s notebook, where they recorded their results and calculated values. volume of DCPIP volume of DCPIP remaining in the syringe: added: 1 minute = 3.6 1 minute = 1.4 2 minutes = 2.8 2 minutes = 2.2 3 minutes = 2.2 3 minutes = 2.8 4 minutes = 1.8 4 minutes = 3.2 5 minutes = 1.6 5 minutes = ...... Fig. 1.1 (a) (i) Using the equation, calculate the volume of DCPIP added to the sample taken at 5 minutes. starting volume of volume of DCPIP volume of DCPIP added = – DCPIP in the syringe remaining in the syringe ................................................... cm3 [1] (ii) Prepare a table and record the results shown in Fig. 1.1 and your answer to 1(a)(i). [3] (iii) State a conclusion for the results. ........................................................................................................................................... ........................................................................................................................................... ..................................................................................................................................... [1] (b) (i) State the independent variable in this investigation. ..................................................................................................................................... [1] (ii) State the purpose of wrapping the beaker in foil in step 1. ........................................................................................................................................... ........................................................................................................................................... ..................................................................................................................................... [1] (iii) Explain why it was important to remove the air bubbles from the syringe in step 6. ........................................................................................................................................... ........................................................................................................................................... ..................................................................................................................................... [1] [Total: 8]
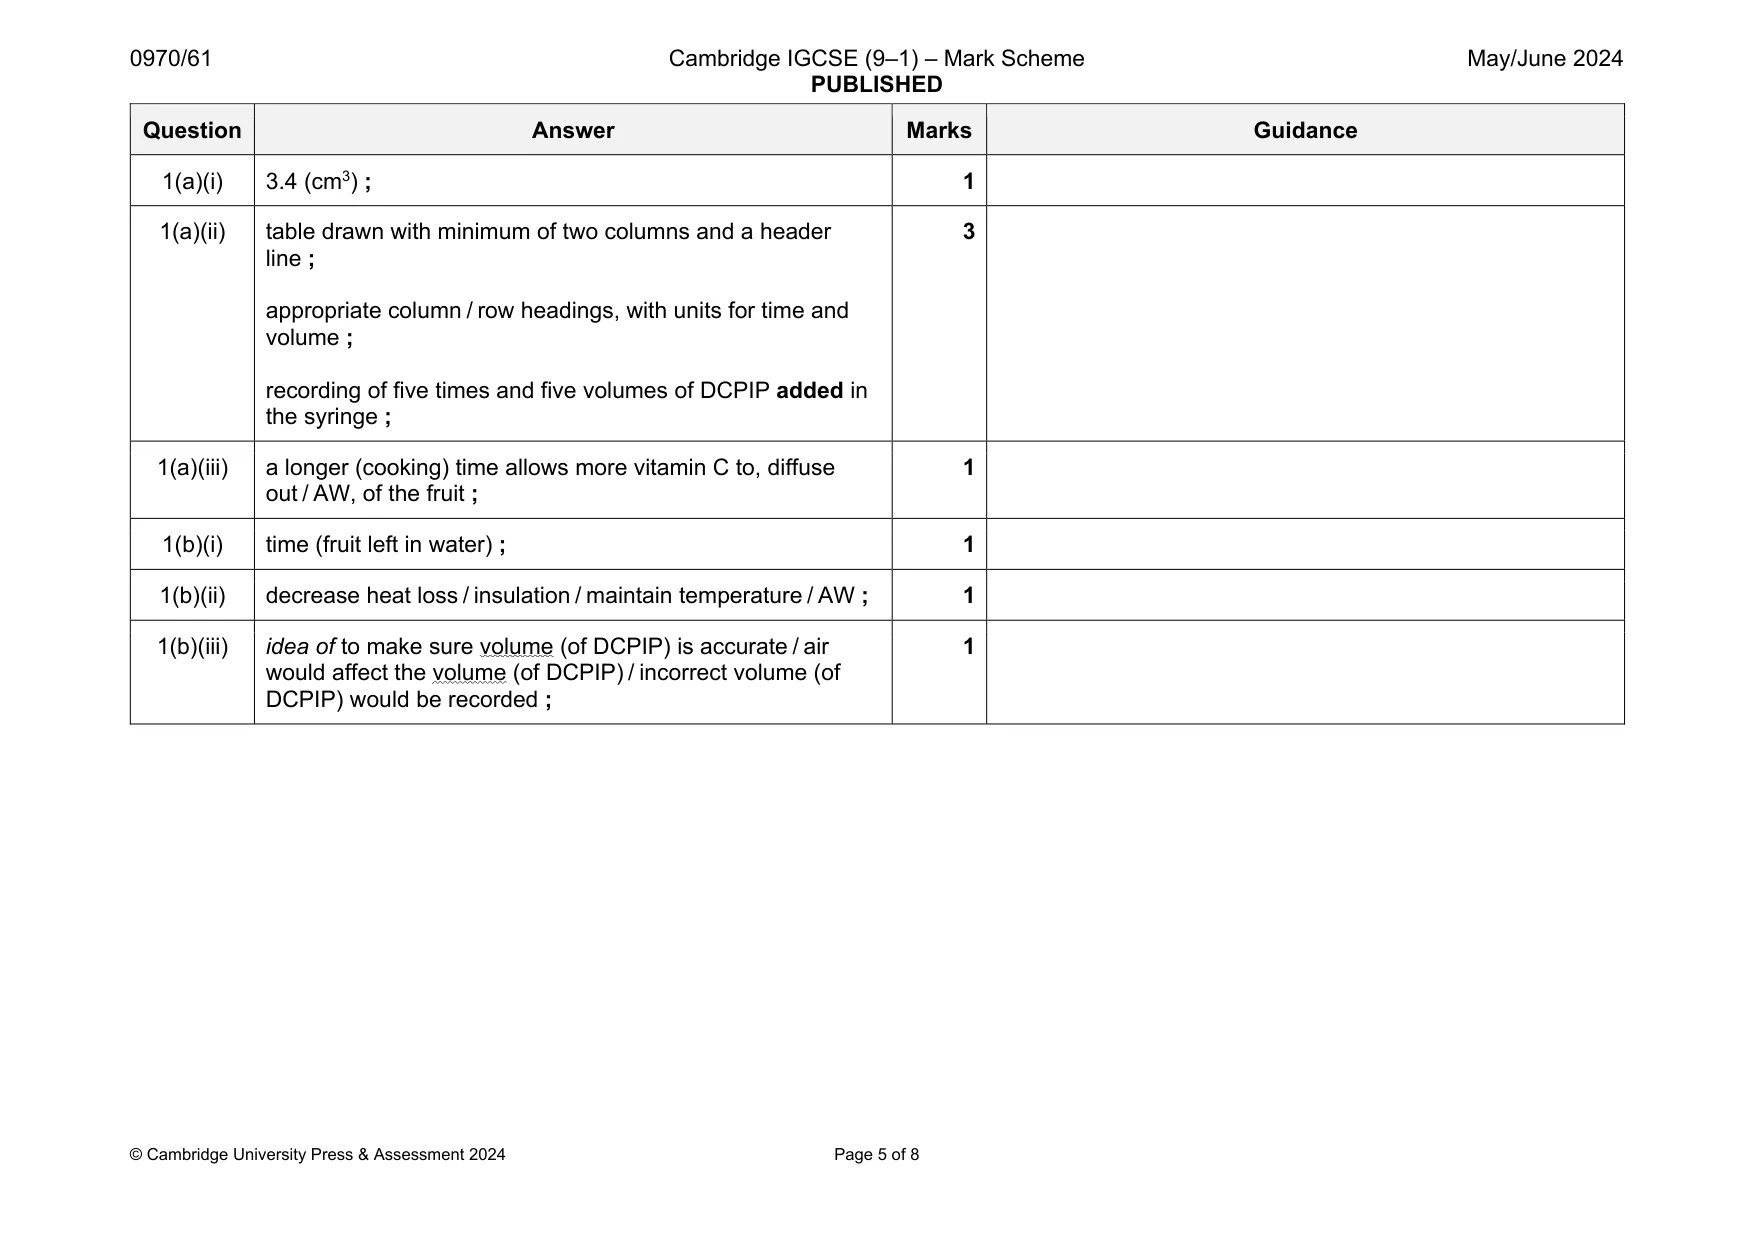
Mark scheme: 1(a)(i) 3.4 (cm3) ; 1 1(a)(ii) table drawn with minimum of two columns and a header line ; appropriate column / row headings, with units for time and volume ; recording of five times and five volumes of DCPIP added in the syringe ; 3 1(a)(iii) a longer (cooking) time allows more vitamin C to, diffuse out / AW, of the fruit ; 1 1(b)(i) time (fruit left in water) ; 1 1(b)(ii) decrease heat loss / insulation / maintain temperature / AW ; 1 1(b)(iii) idea of to make sure volume (of DCPIP) is accurate / air would affect the volume (of DCPIP) / incorrect volume (of DCPIP) would be recorded ; 1
Q2 · Plan an investigation to determine the effect of light intensity on photosynthesis in an…
2 Plan an investigation to determine the effect of light intensity on photosynthesis in an aquatic plant. .......................................................................................................................................................... .......................................................................................................................................................... .......................................................................................................................................................... .......................................................................................................................................................... .......................................................................................................................................................... .......................................................................................................................................................... .......................................................................................................................................................... .......................................................................................................................................................... .......................................................................................................................................................... .......................................................................................................................................................... .......................................................................................................................................................... .......................................................................................................................................................... .................................................................................................................................................... [6]
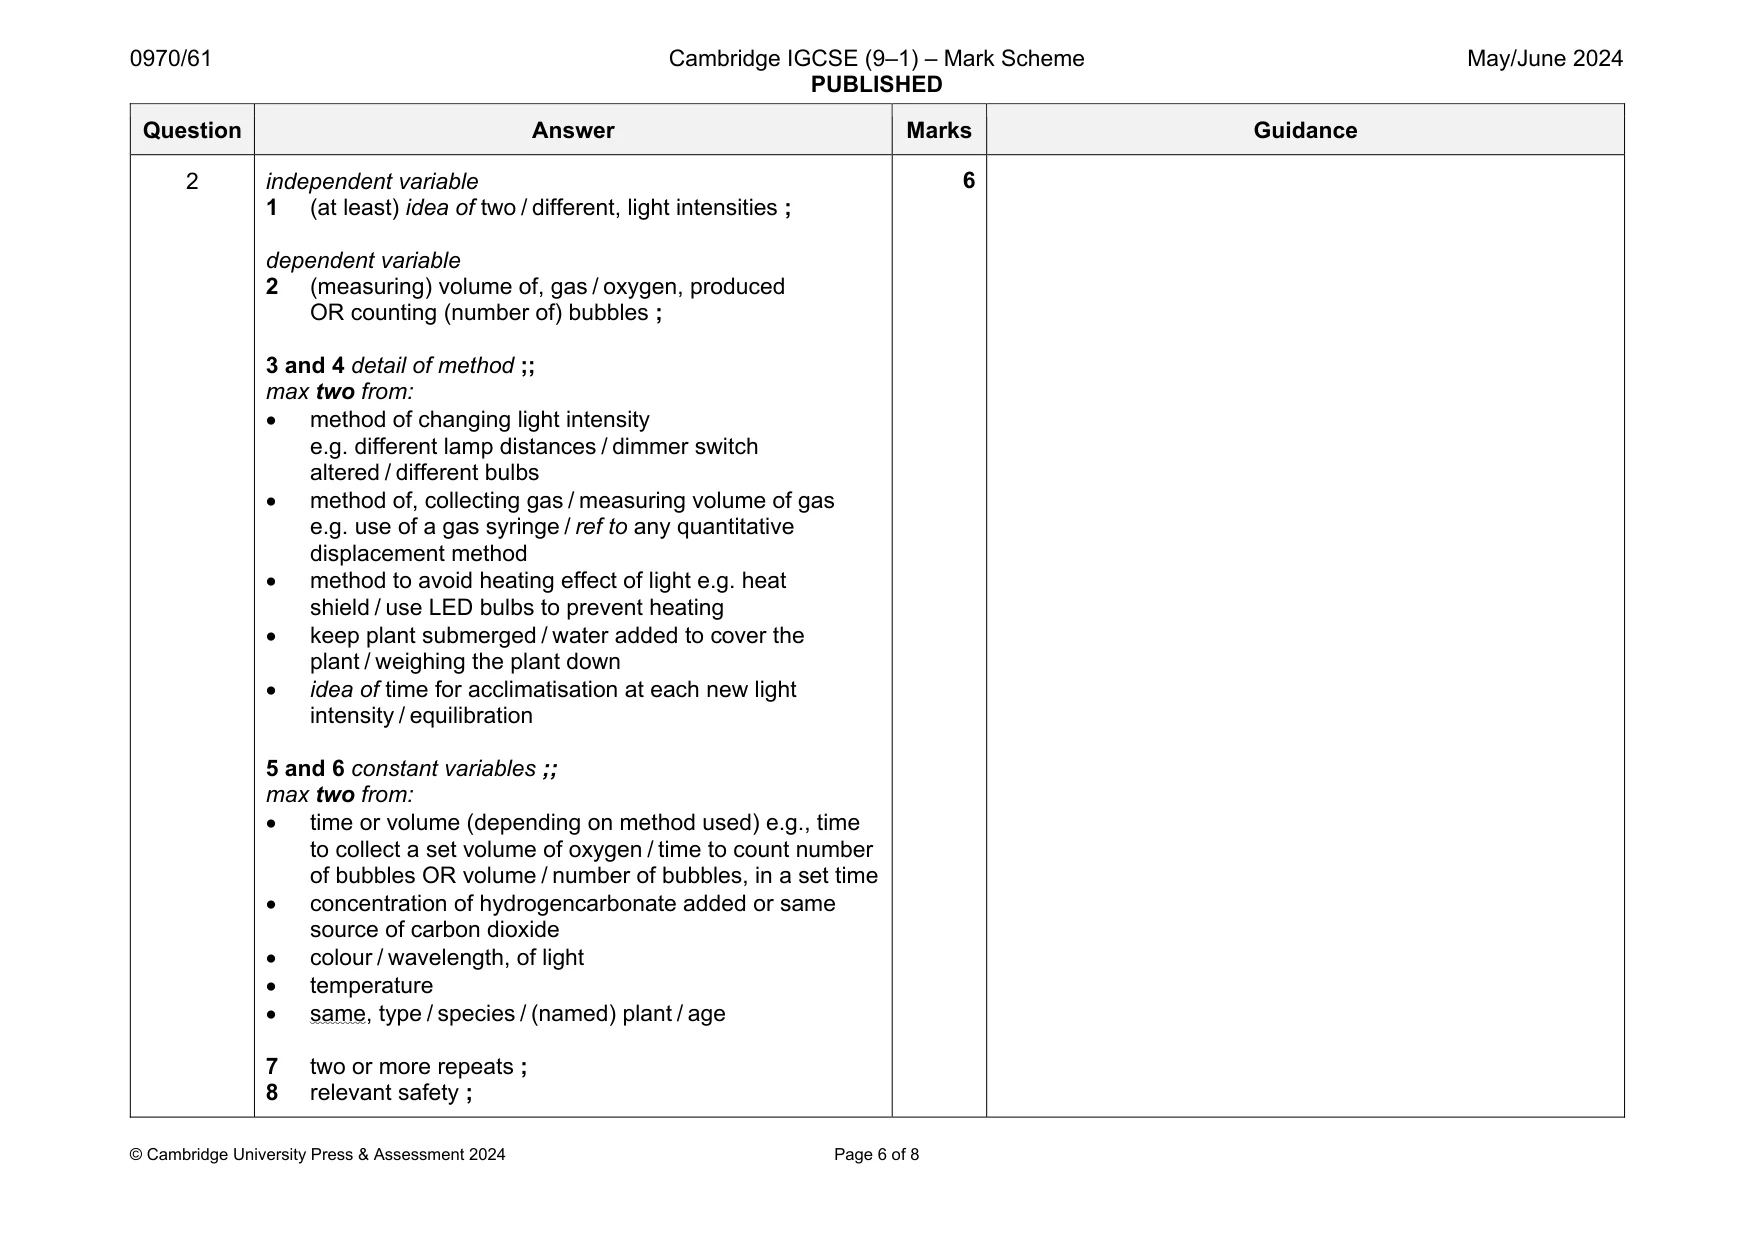
Mark scheme: 2 independent variable 1 (at least) idea of two / different, light intensities ; dependent variable 2 (measuring) volume of, gas / oxygen, produced OR counting (number of) bubbles ; 3 and 4 detail of method ;; max two from: method of changing light intensity e.g. different lamp distances / dimmer switch altered / different bulbs method of, collecting gas / measuring volume of gas e.g. use of a gas syringe / ref to any quantitative displacement method method to avoid heating effect of light e.g. heat shield / use LED bulbs to prevent heating keep plant submerged / water added to cover the plant / weighing the plant down idea of time for acclimatisation at each new light intensity / equilibration 5 and 6 constant variables ;; max two from: time or volume (depending on method used) e.g., time to collect a set volume of oxygen / time to count number of bubbles OR volume / number of bubbles, in a set time concentration of hydrogencarbonate added or same source of carbon dioxide colour / wavelength, of light temperature same, type / species / (named) plant / age 7 two or more repeats ; 8 relevant safety ;
Q3 · A photograph of a cross‑section of a persimmon fruit
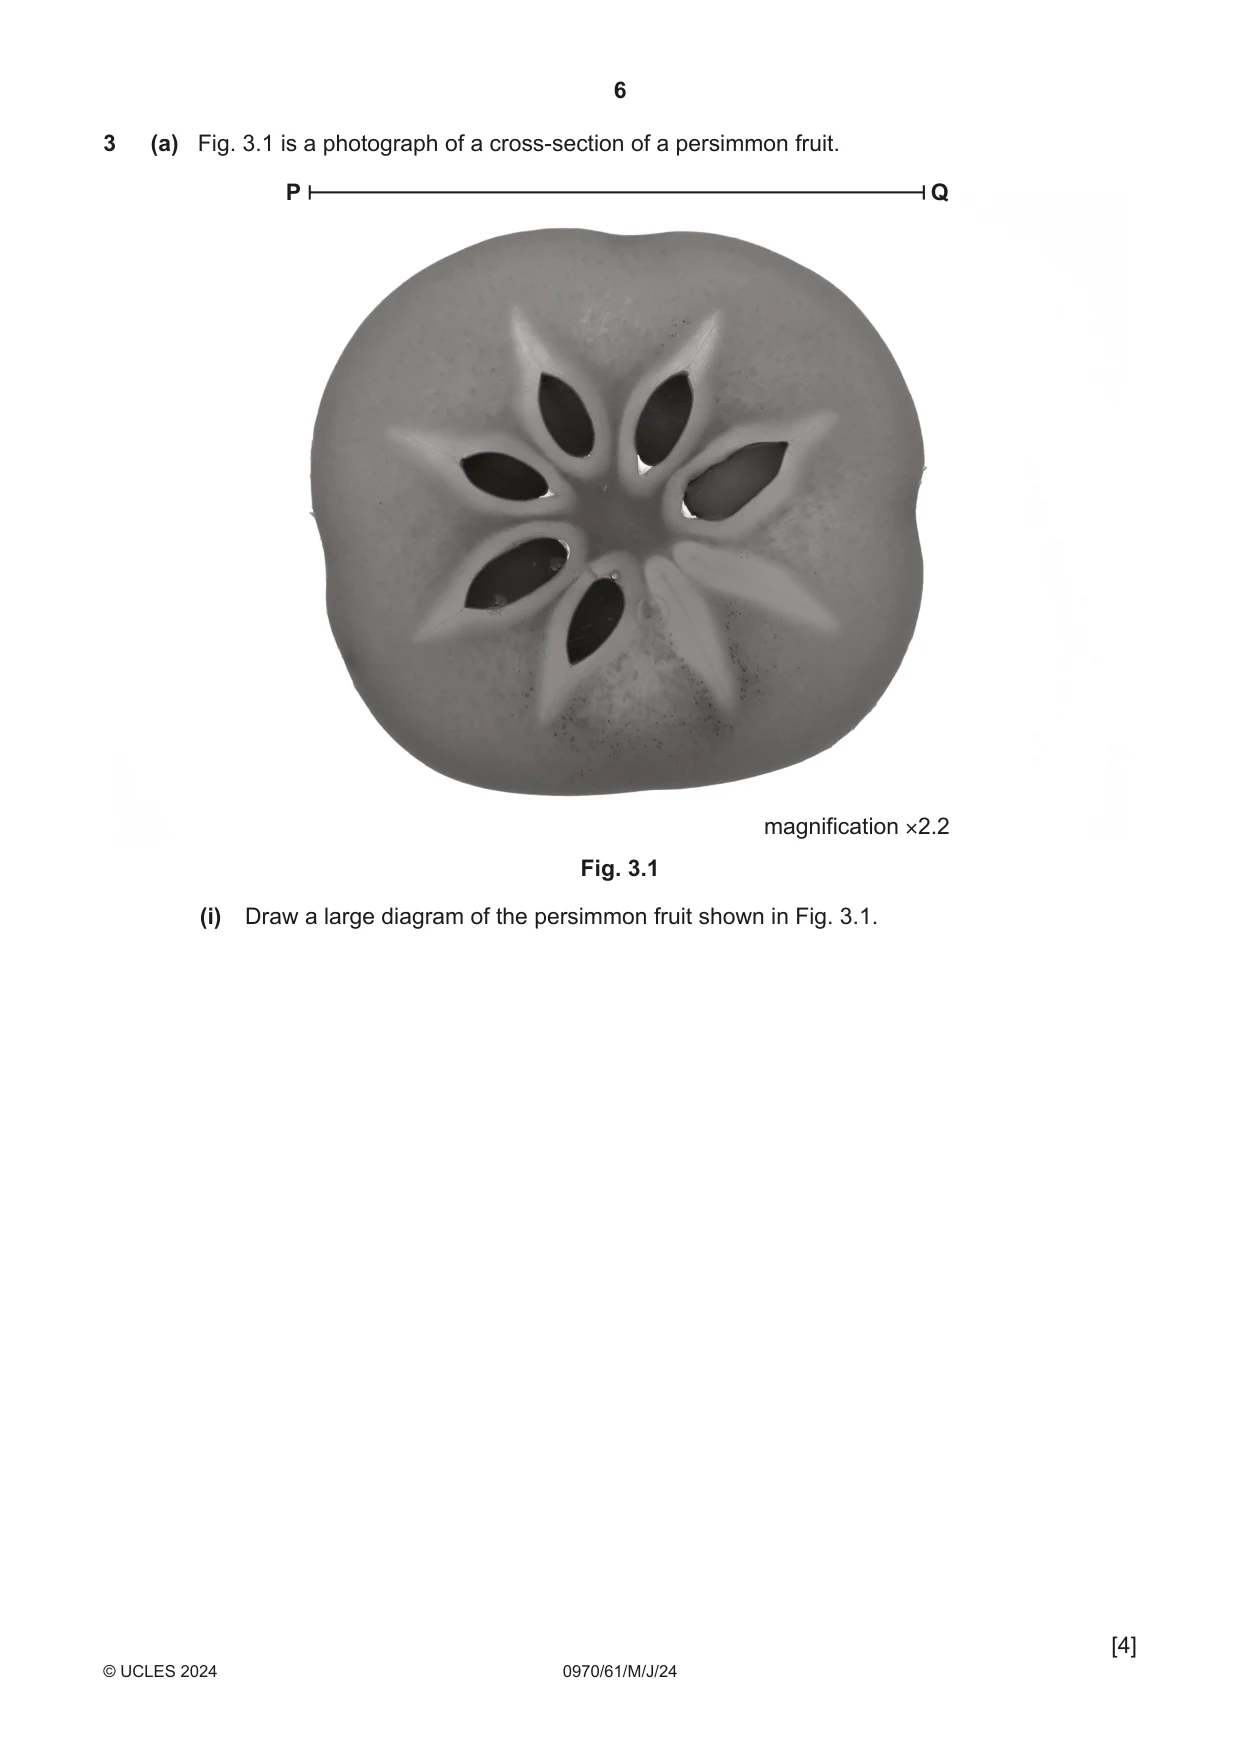
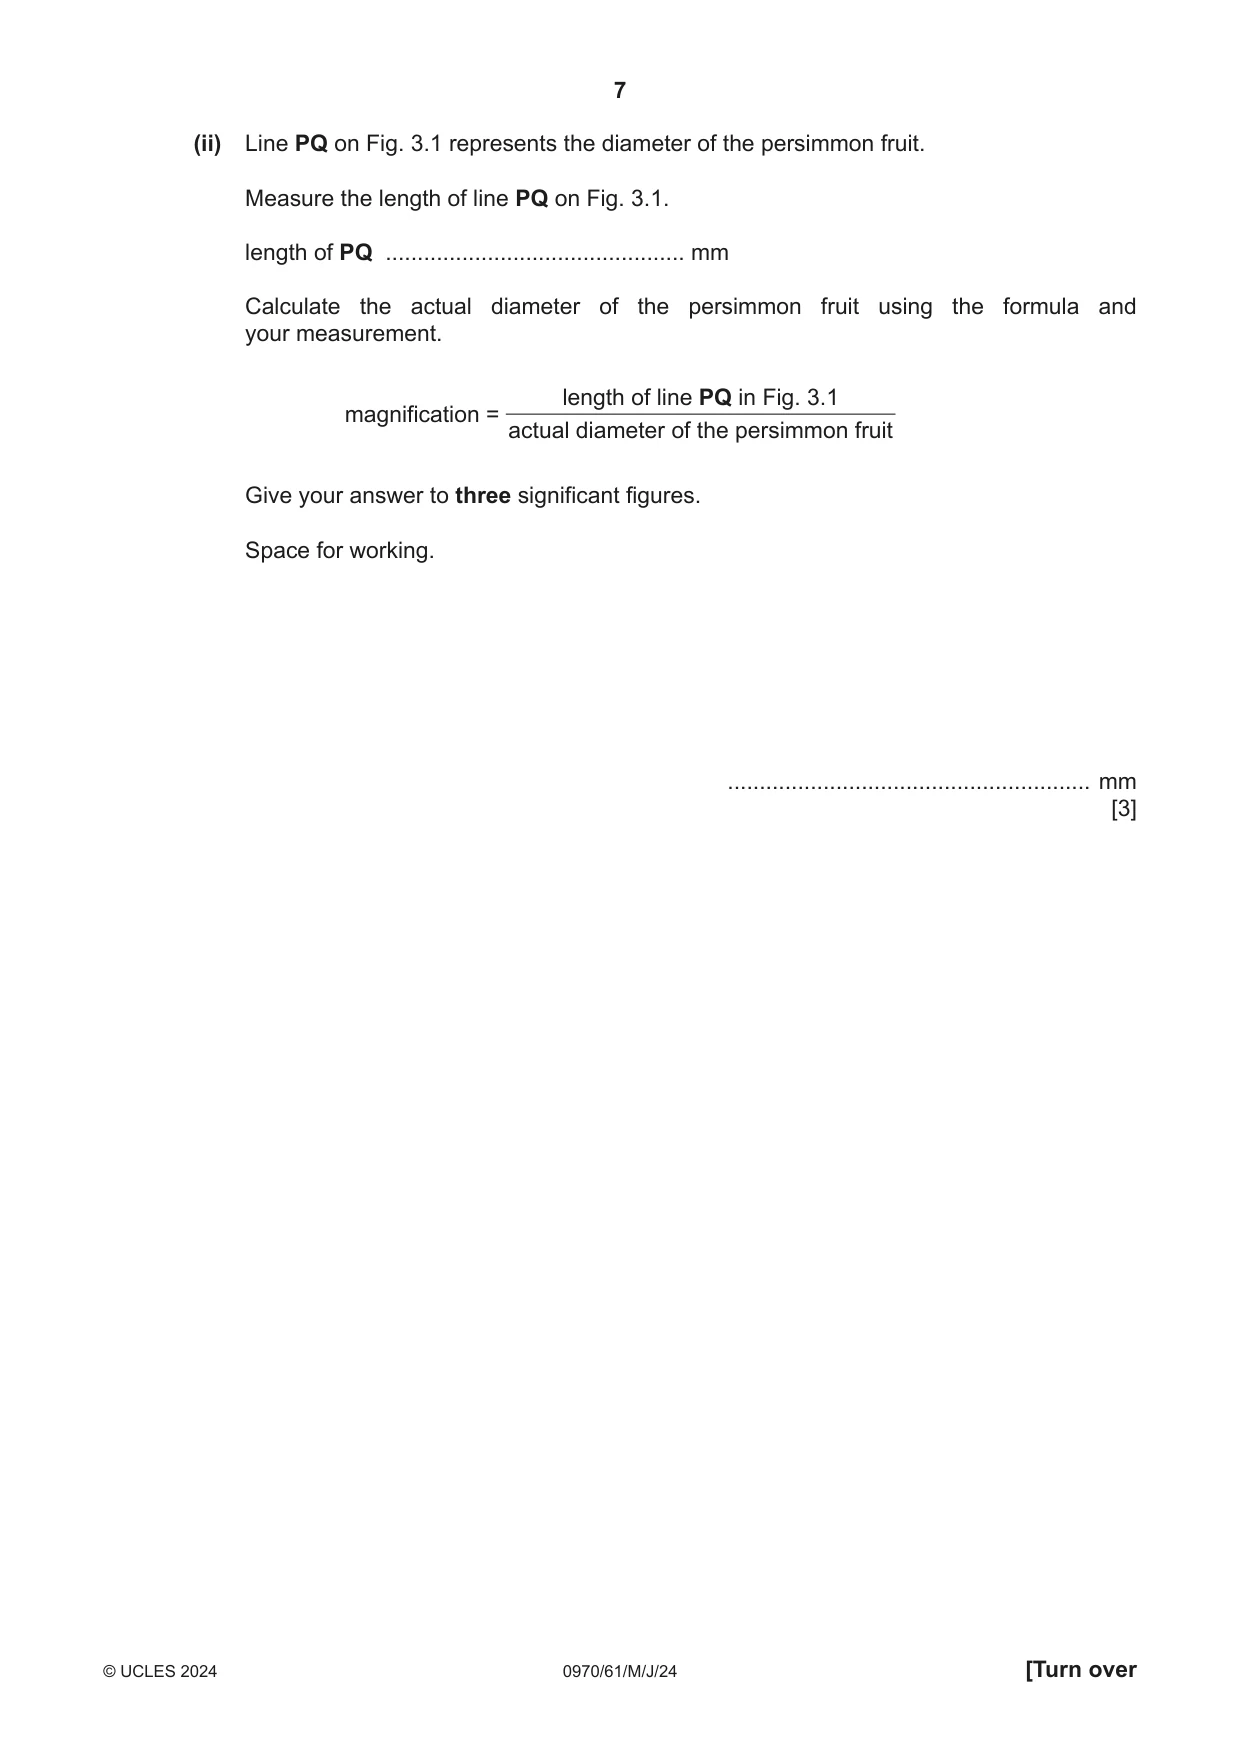
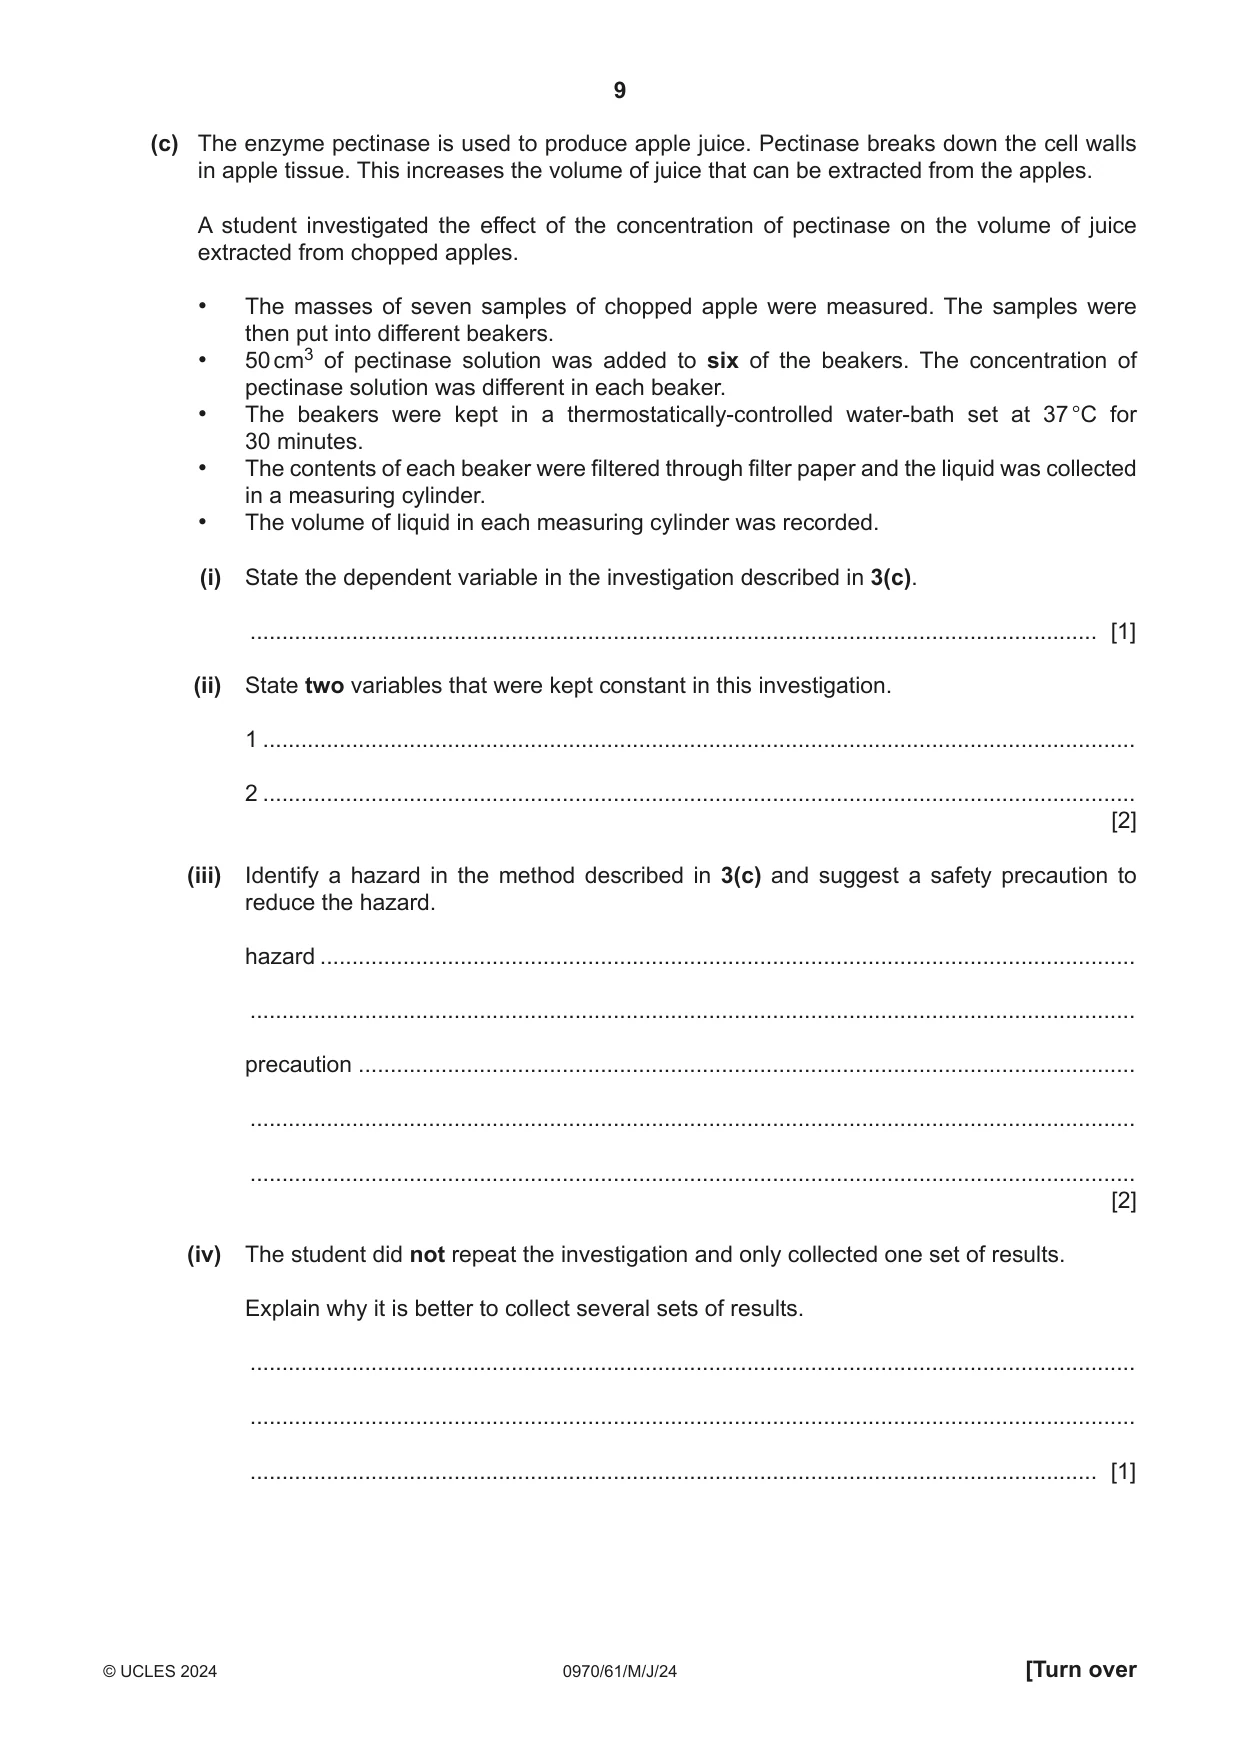
3 (a) Fig. 3.1 is a photograph of a cross‑section of a persimmon fruit. P Q magnification ×2.2 Fig. 3.1 (i) Draw a large diagram of the persimmon fruit shown in Fig. 3.1. [4] (ii) Line PQ on Fig. 3.1 represents the diameter of the persimmon fruit. Measure the length of line PQ on Fig. 3.1. length of PQ ............................................... mm Calculate the actual diameter of the persimmon fruit using the formula and your measurement. length of line PQ in Fig. 3.1 magnification = actual diameter of the persimmon fruit Give your answer to three significant figures. Space for working. ......................................................... mm [3] (b) Plants can make fats, starch and proteins. (i) State the names of the reagents that can be used to test samples of plant tissue for starch and protein. starch ................................................................................................................................. protein ................................................................................................................................ [2] (ii) Describe the method you would use to test a sample of plant tissue for fat. ........................................................................................................................................... ........................................................................................................................................... ........................................................................................................................................... ........................................................................................................................................... ..................................................................................................................................... [2]
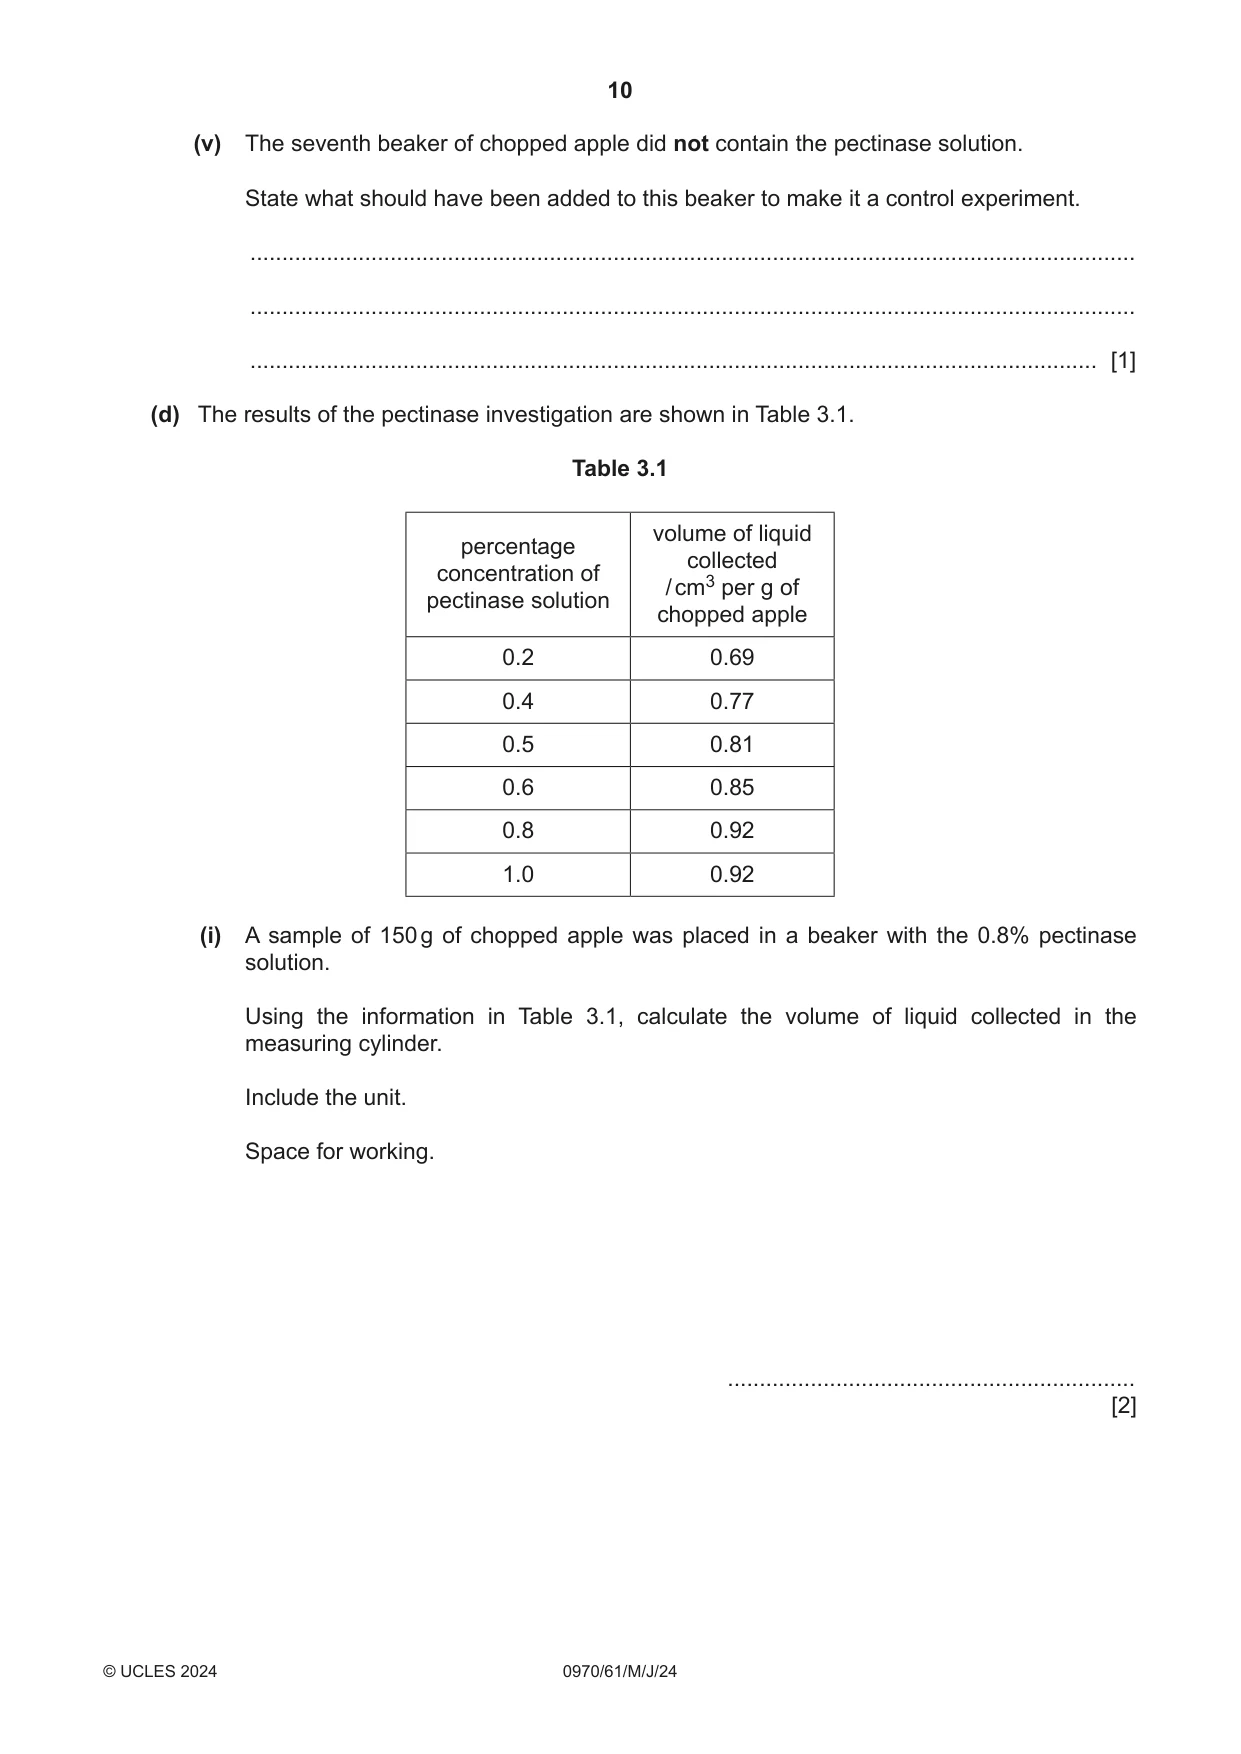
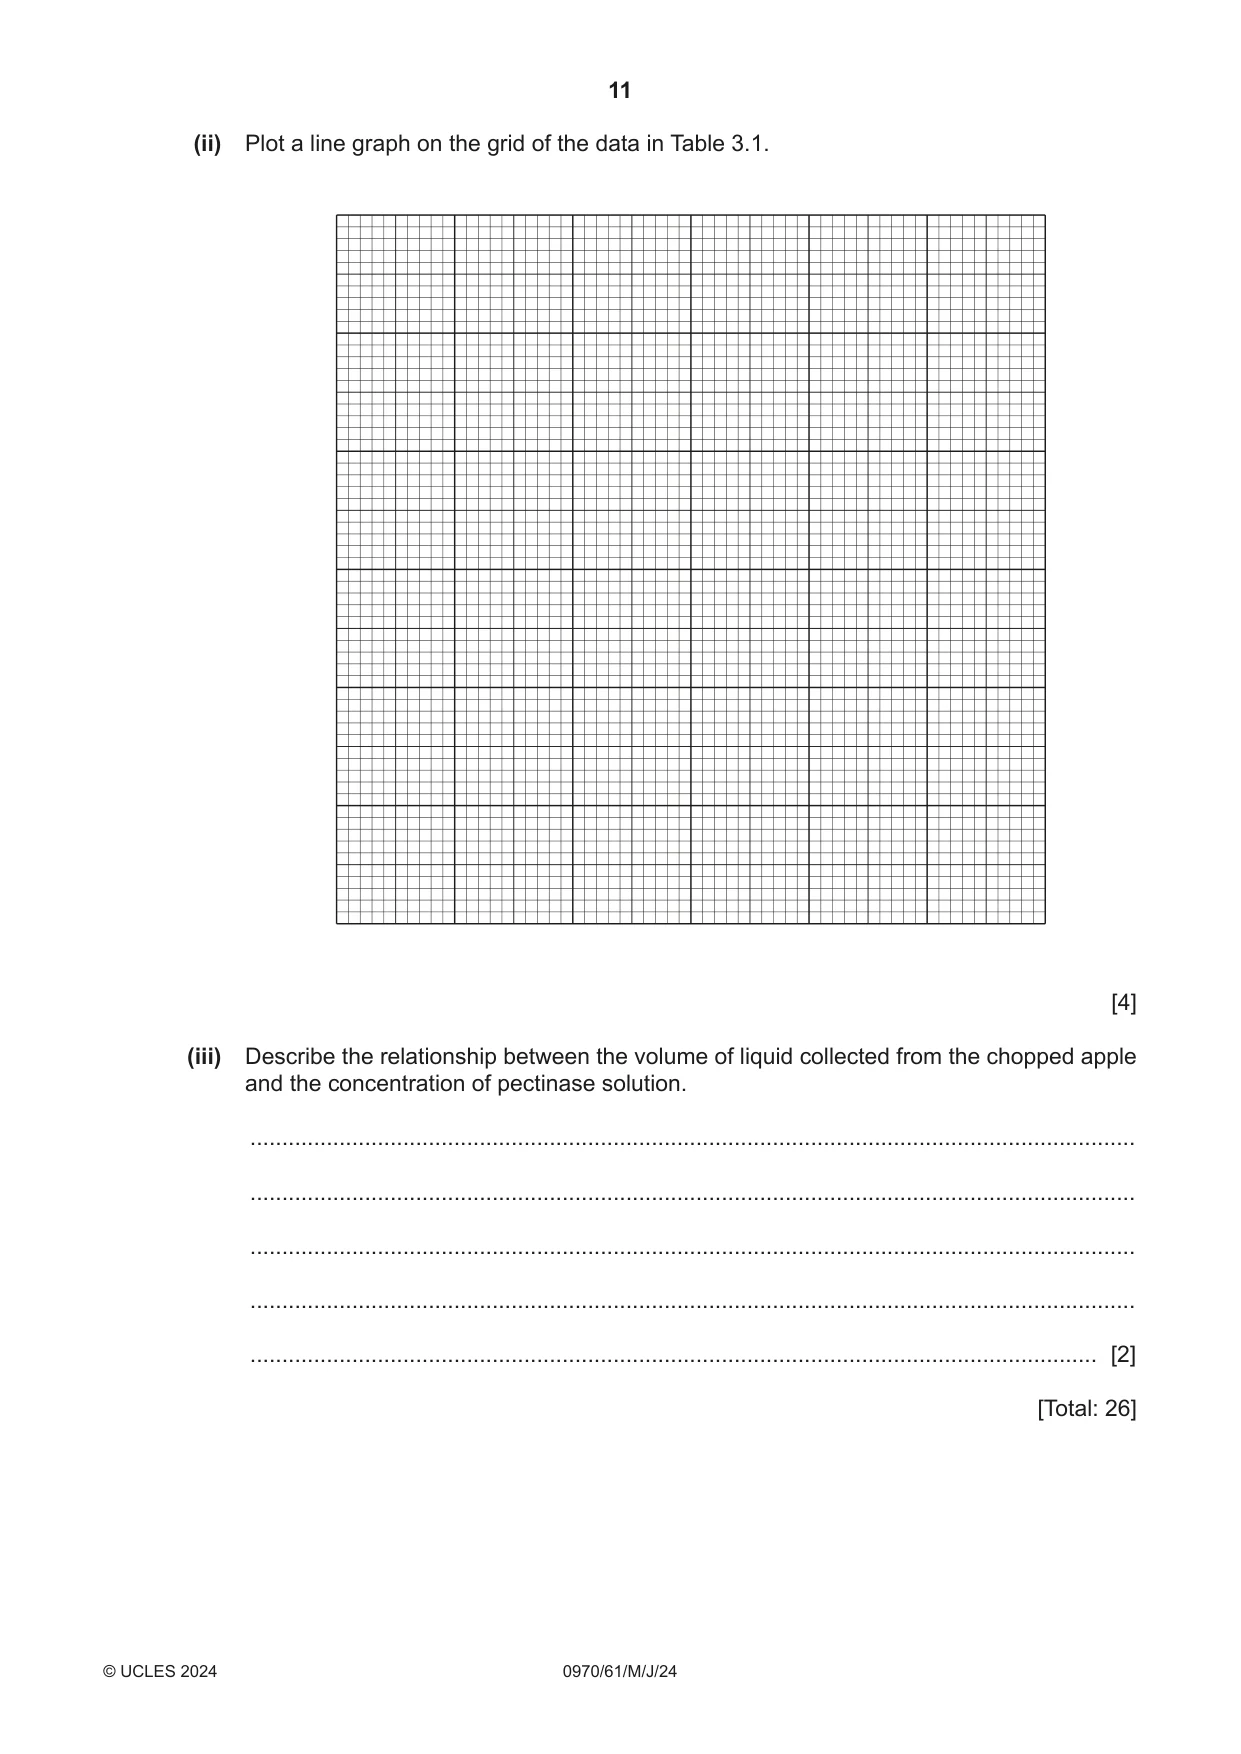
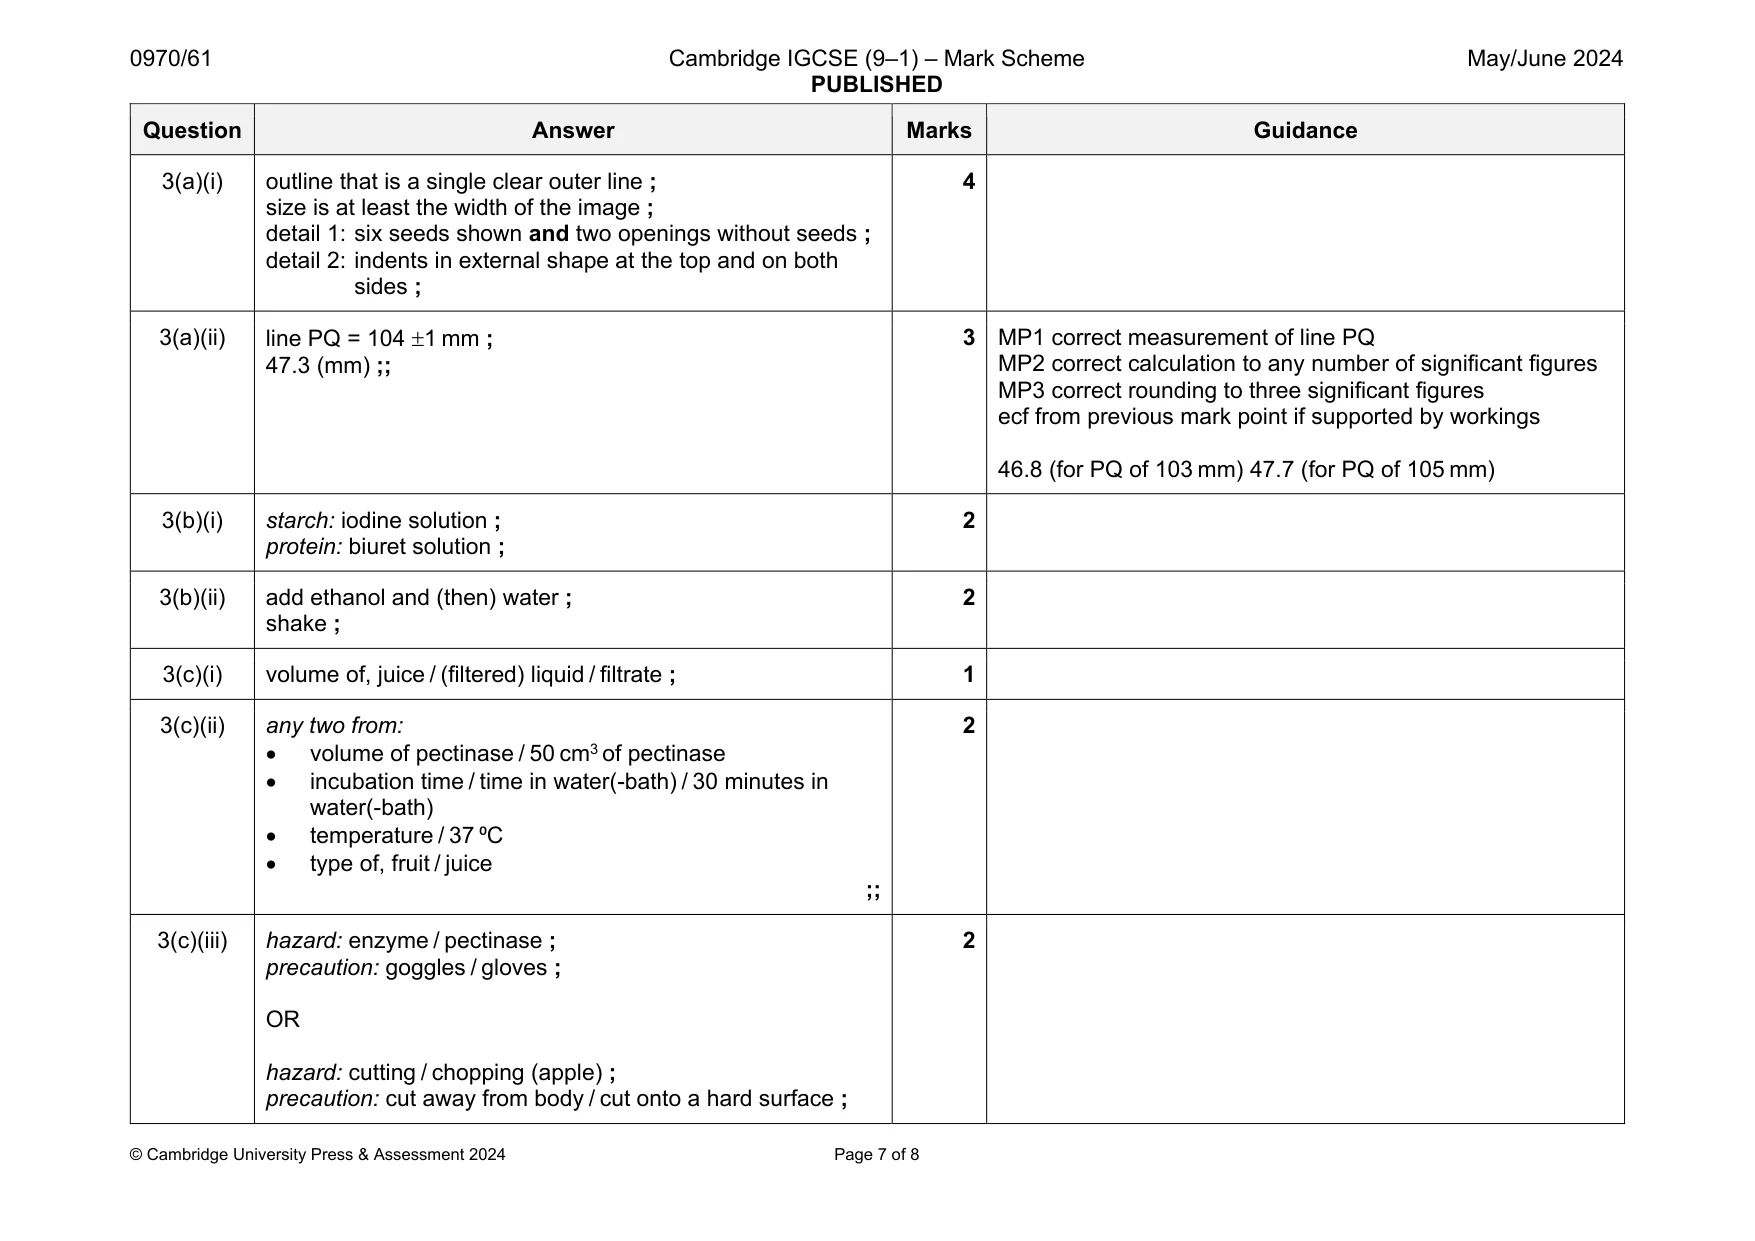
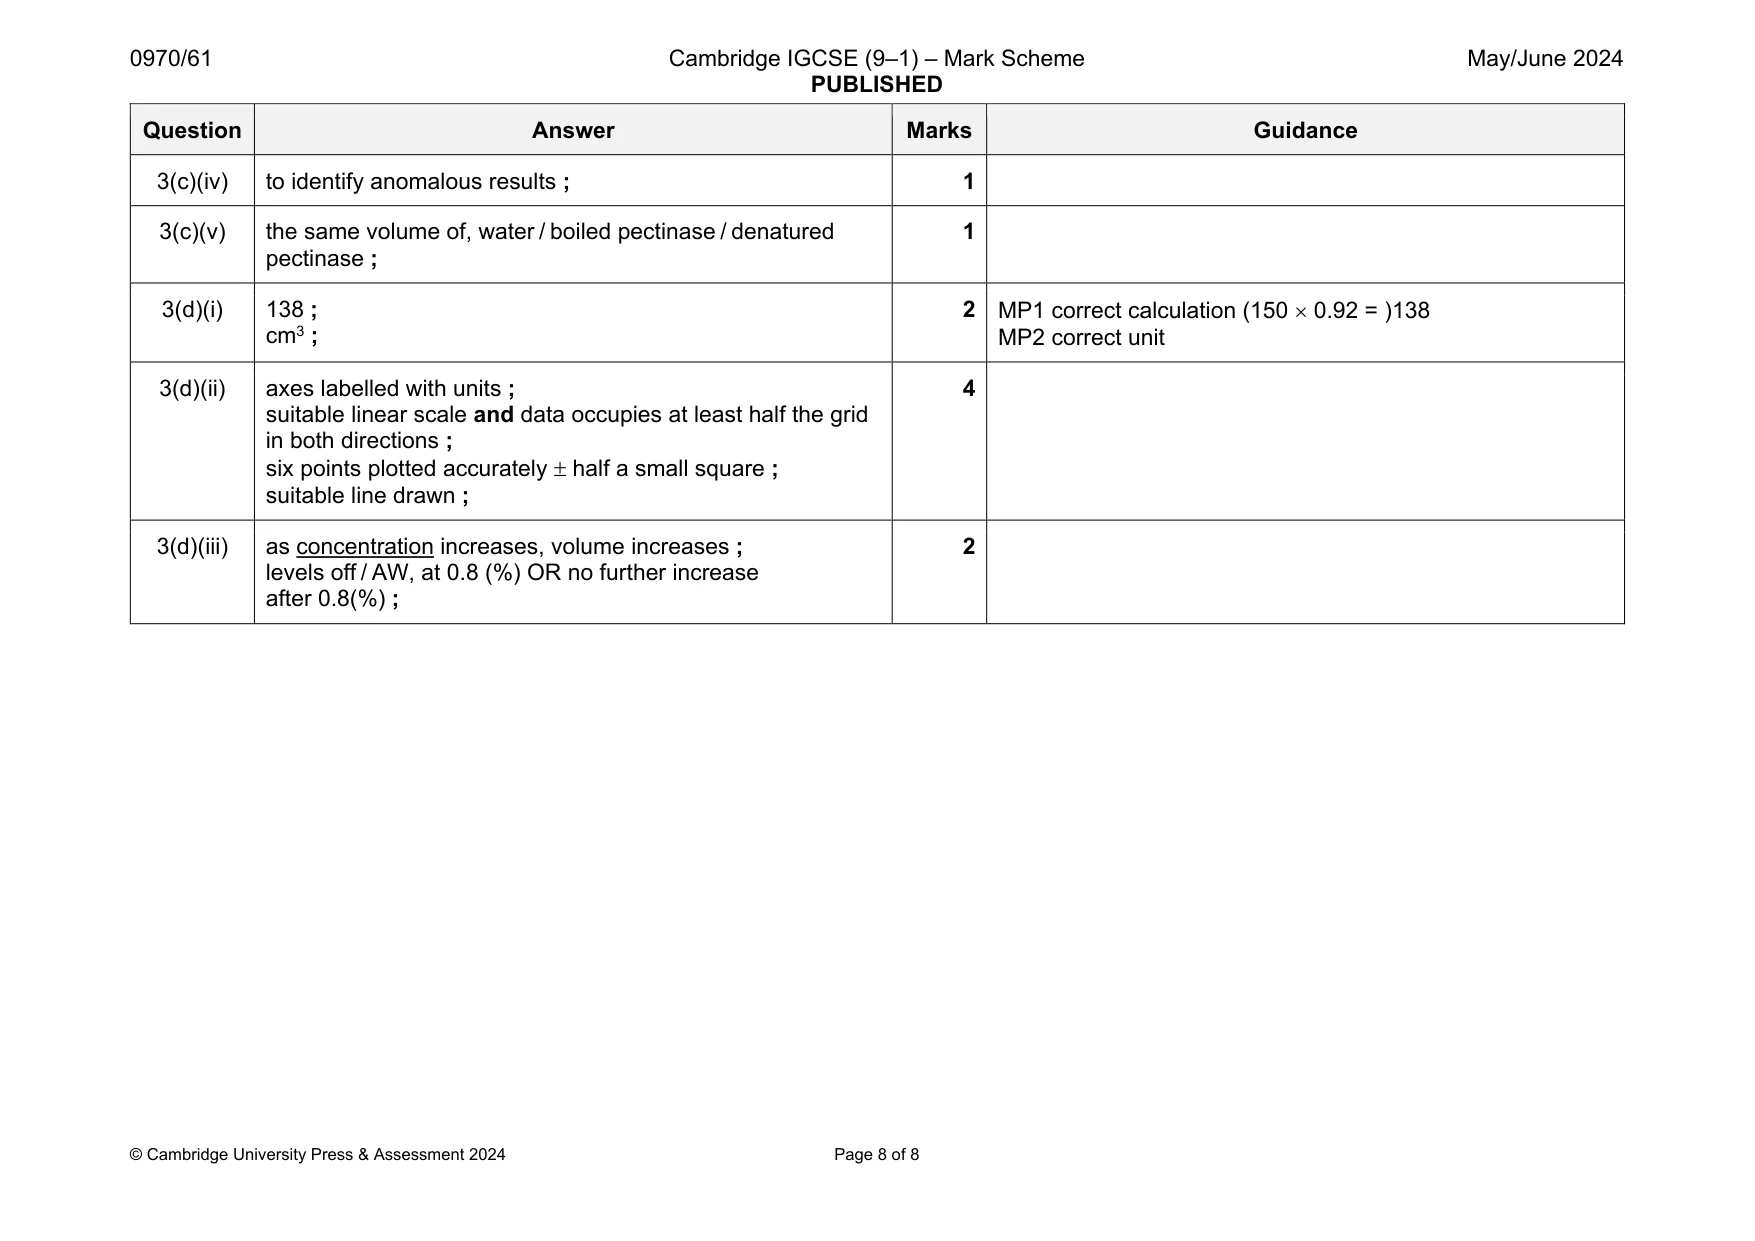
Mark scheme: 3(a)(i) outline that is a single clear outer line ; size is at least the width of the image ; detail 1: six seeds shown and two openings without seeds ; detail 2: indents in external shape at the top and on both sides ; 4 3(a)(ii) line PQ = 104 1 mm ; 47.3 (mm) ;; 3 MP1 correct measurement of line PQ MP2 correct calculation to any number of significant figures MP3 correct rounding to three significant figures ecf from previous mark point if supported by workings 46.8 (for PQ of 103 mm) 47.7 (for PQ of 105 mm) 3(b)(i) starch: iodine solution ; protein: biuret solution ; 2 3(b)(ii) add ethanol and (then) water ; shake ; 2 3(c)(i) volume of, juice / (filtered) liquid / filtrate ; 1 3(c)(ii) any two from: volume of pectinase / 50 cm3 of pectinase incubation time / time in water(-bath) / 30 minutes in water(-bath) temperature / 37 ⁰C type of, fruit / juice ;; 2 3(c)(iii) hazard: enzyme / pectinase ; precaution: goggles / gloves ; OR hazard: cutting / chopping (apple) ; precaution: cut away from body / cut onto a hard surface ; 2 Question Answer Marks Guidance 3(c)(iv) to identify anomalous results ; 1 3(c)(v) the same volume of, water / boiled pectinase / denatured pectinase ; 1 3(d)(i) 138 ; cm3 ; 2 MP1 correct calculation (150 0.92 = )138 MP2 correct unit 3(d)(ii) axes labelled with units ; suitable linear scale and data occupies at least half the grid in both directions ; six points plotted accurately half a small square ; suitable line drawn ; 4 3(d)(iii) as concentration increases, volume increases ; levels off / AW, at 0.8 (%) OR no further increase after 0.8(%) ; 2
What was in this paper
The subtopics covered by these 3 questions, and how many questions each got. Open one in a new tab to see every Cambridge question on it.
What you needed in this session
Cambridge’s own grade thresholds for 2024 May/June, Paper 6 · Variant 1. A higher threshold means an easier paper — the bar moves with how the cohort did.