Cambridge IGCSE Biology (9-1) 0970 — 2023 Oct/Nov Paper 5 · Variant 2
0970/52/O/N/23 · 3 questions · 40 marks · ≈45 min
The question paper and its mark scheme, free to read here and free to download. This is Cambridge’s own paper, exactly as it was sat.
Question paper12 pages


Mark scheme8 pages
Answers below. Sit the paper first if you are practising.
Questions as text
Q1 · You are going to investigate the effect of temperature on the activity of amylase
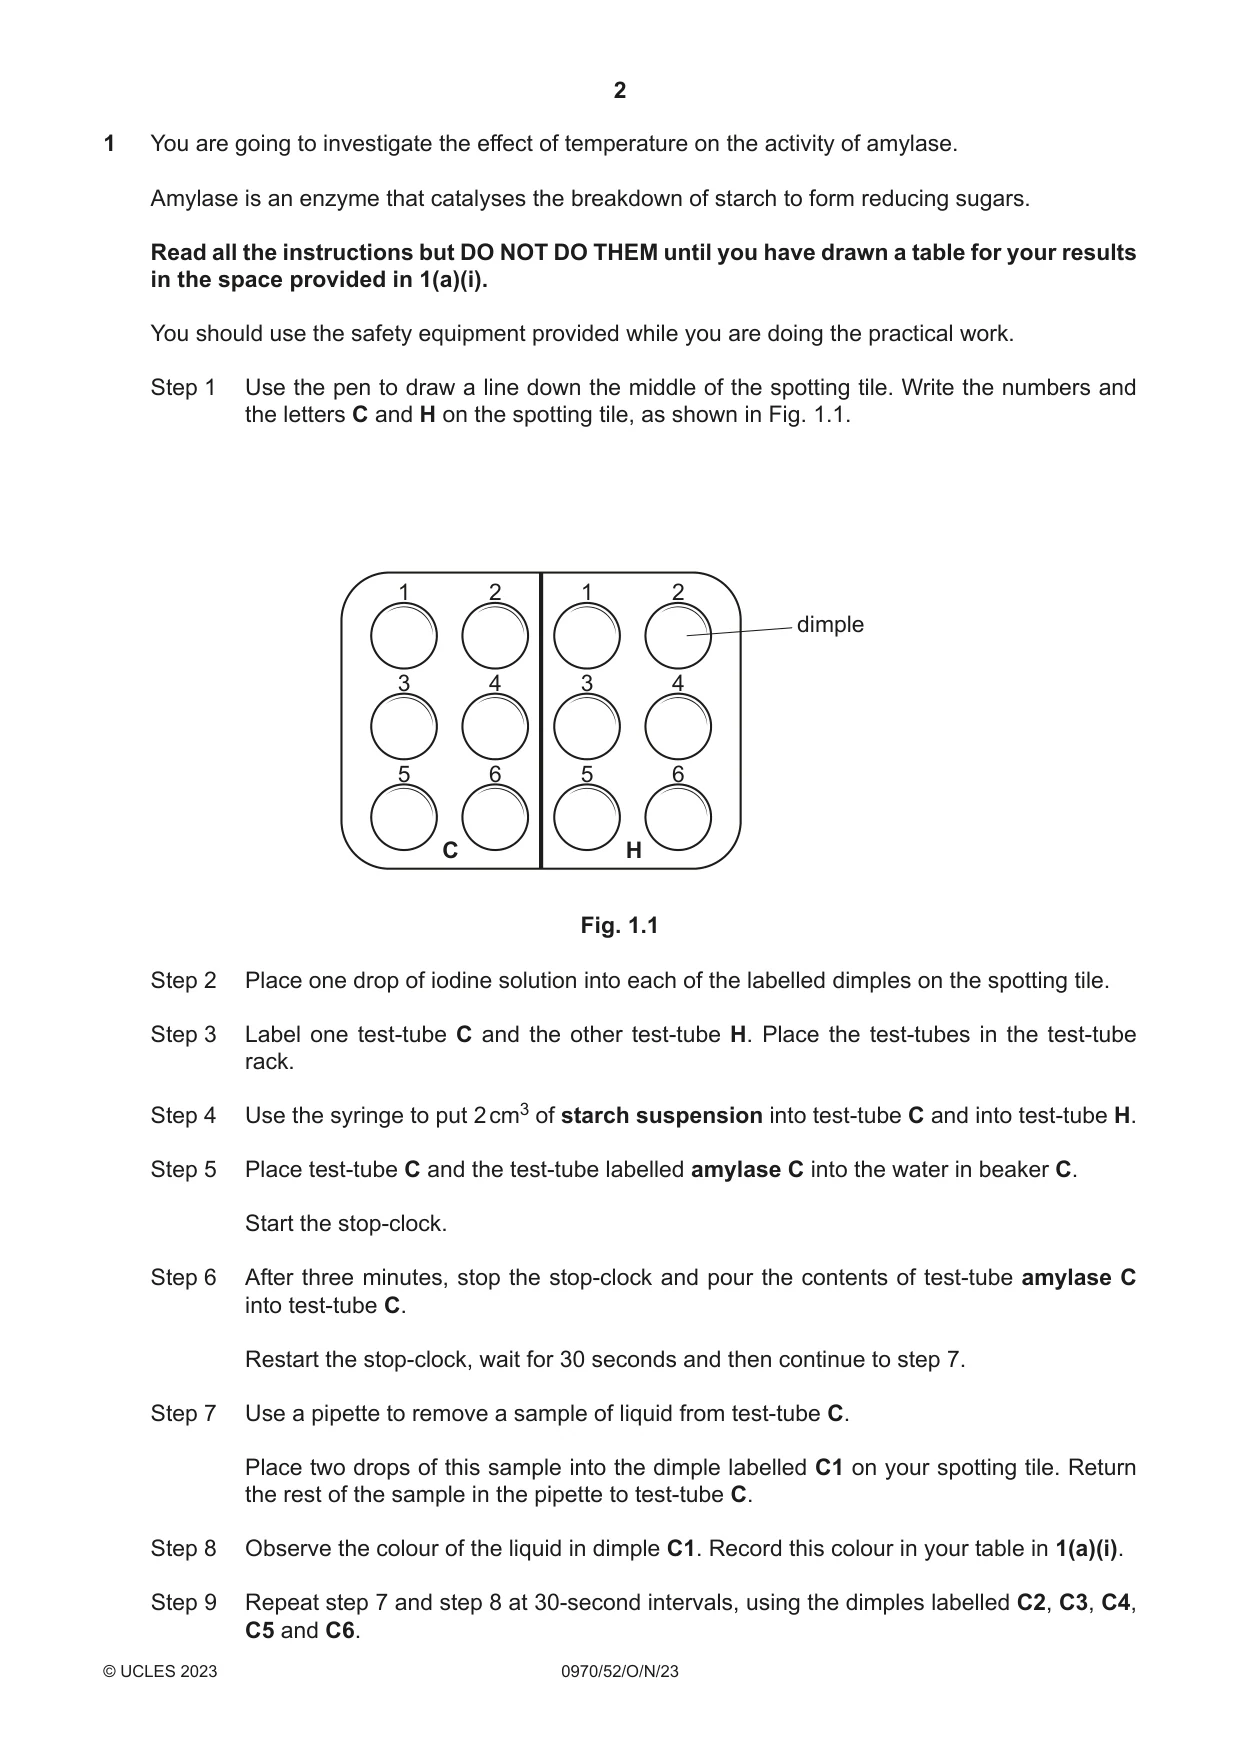
1 You are going to investigate the effect of temperature on the activity of amylase. Amylase is an enzyme that catalyses the breakdown of starch to form reducing sugars. Read all the instructions but DO NOT DO THEM until you have drawn a table for your results in the space provided in 1(a)(i). You should use the safety equipment provided while you are doing the practical work. Step 1 Use the pen to draw a line down the middle of the spotting tile. Write the numbers and the letters C and H on the spotting tile, as shown in Fig. 1.1. 1 2 1 2 dimple 3 4 3 4 5 6 5 6 C H Fig. 1.1 Step 2 Place one drop of iodine solution into each of the labelled dimples on the spotting tile. Step 3 Label one test-tube C and the other test-tube H. Place the test-tubes in the test-tube rack. Step 4 Use the syringe to put 2 cm3 of starch suspension into test-tube C and into test-tube H. Step 5 Place test-tube C and the test-tube labelled amylase C into the water in beaker C. Start the stop-clock. Step 6 After three minutes, stop the stop-clock and pour the contents of test-tube amylase C into test-tube C. Restart the stop-clock, wait for 30 seconds and then continue to step 7. Step 7 Use a pipette to remove a sample of liquid from test-tube C. Place two drops of this sample into the dimple labelled C1 on your spotting tile. Return the rest of the sample in the pipette to test-tube C. Step 8 Observe the colour of the liquid in dimple C1. Record this colour in your table in 1(a)(i). Step 9 Repeat step 7 and step 8 at 30-second intervals, using the dimples labelled C2, C3, C4, C5 and C6. Step 10 Raise your hand when you are ready for hot water to be added to beaker H. Step 11 Place test-tube H and test-tube amylase H into the hot water in beaker H. Reset the stop-clock to zero. Start the stop-clock again. Step 12 After three minutes, stop the stop-clock and pour the contents of test-tube amylase H into test-tube H. Restart the stop-clock, wait for 30 seconds and then continue to step 13. Step 13 Use a pipette to remove a sample of the liquid from test-tube H. Place two drops of this sample into the dimple labelled H1 on your spotting tile. Return the rest of the sample in the pipette to test-tube H. Step 14 Observe the colour of the liquid in dimple H1. Record this colour in your table in 1(a)(i). Step 15 Repeat step 13 and step 14 at 30-second intervals, using the dimples labelled H2, H3, H4, H5 and H6. (a) (i) Prepare a table for your results. [4] (ii) State the colour of iodine solution when starch is present. ..................................................................................................................................... [1] (iii) State a conclusion for your results. ........................................................................................................................................... ........................................................................................................................................... ..................................................................................................................................... [1] (iv) State the independent variable in this investigation. ..................................................................................................................................... [1] (v) State two variables that were kept constant in this investigation. 1 ........................................................................................................................................ ........................................................................................................................................... 2 ........................................................................................................................................ ........................................................................................................................................... [2] (b) (i) Explain why the method used in this investigation does not allow you to obtain an accurate time for the breakdown of starch. ........................................................................................................................................... ........................................................................................................................................... ..................................................................................................................................... [1] (ii) The temperature of the water in the beakers during the investigation was a source of error. Describe how you could improve the method to reduce this error. ........................................................................................................................................... ........................................................................................................................................... ..................................................................................................................................... [1] [Total: 11]
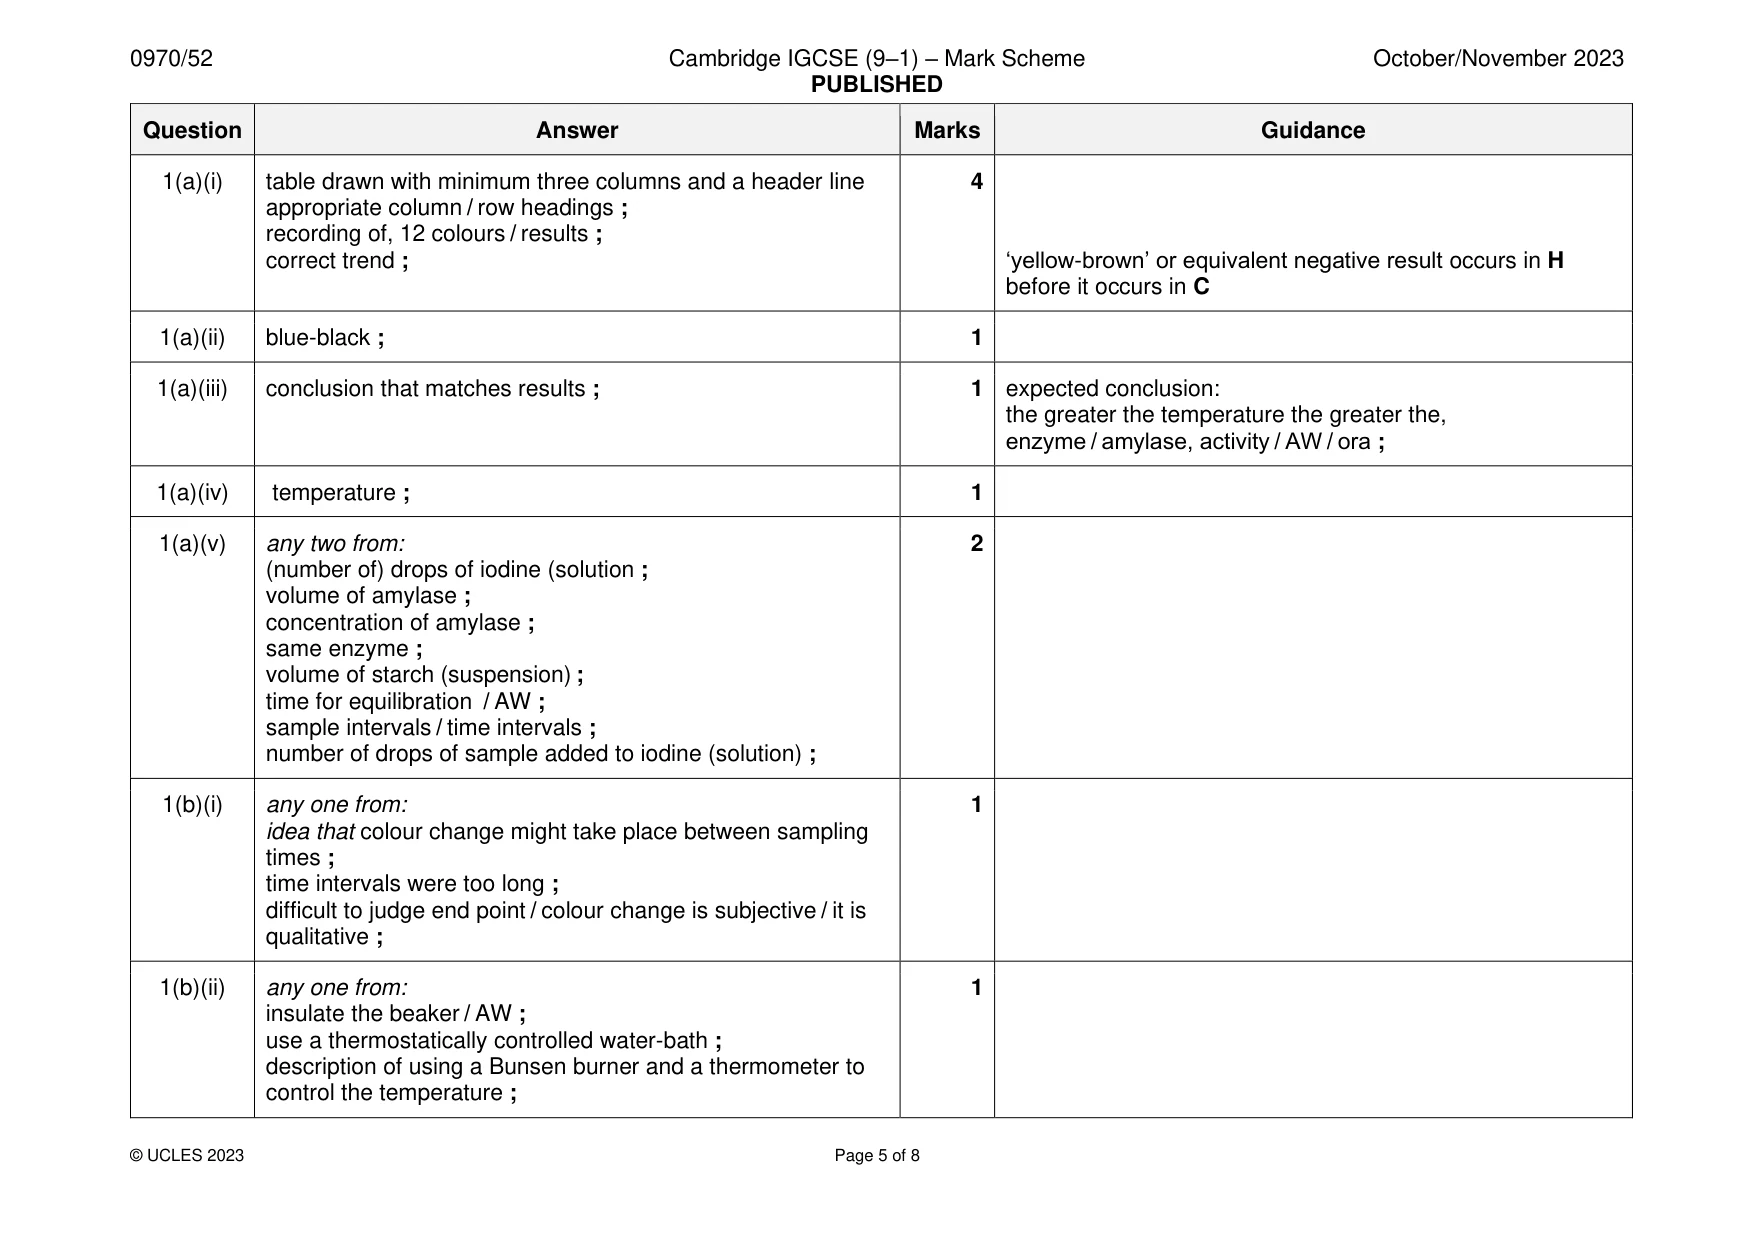
Mark scheme: Question Answer Marks Guidance 1(a)(i) table drawn with minimum three columns and a header line 4 appropriate column / row headings ; recording of, 12 colours / results ; correct trend ; ‘yellow-brown’ or equivalent negative result occurs in H before it occurs in C 1(a)(ii) blue-black ; 1 1(a)(iii) conclusion that matches results ; 1 expected conclusion: the greater the temperature the greater the, enzyme / amylase, activity / AW / ora ; 1(a)(iv) temperature ; 1 1(a)(v) any two from: 2 (number of) drops of iodine (solution ; volume of amylase ; concentration of amylase ; same enzyme ; volume of starch (suspension) ; time for equilibration / AW ; sample intervals / time intervals ; number of drops of sample added to iodine (solution) ; 1(b)(i) any one from: 1 idea that colour change might take place between sampling times ; time intervals were too long ; difficult to judge end point / colour change is subjective / it is qualitative ; 1(b)(ii) any one from: 1 insulate the beaker / AW ; use a thermostatically controlled water-bath ; description of using a Bunsen burner and a thermometer to control the temperature ;
Question 2
2 (a) Milk contains fats. The enzyme lipase catalyses the breakdown of fats to form fatty acids and glycerol. The fatty acids cause the pH of the milk to decrease. Plan an investigation to determine the effect of lipase concentration on the breakdown of fats in milk. ................................................................................................................................................... ................................................................................................................................................... ................................................................................................................................................... ................................................................................................................................................... ................................................................................................................................................... ................................................................................................................................................... ................................................................................................................................................... ................................................................................................................................................... ................................................................................................................................................... ................................................................................................................................................... ................................................................................................................................................... ................................................................................................................................................... ................................................................................................................................................... ................................................................................................................................................... ................................................................................................................................................... ............................................................................................................................................. [6] (b) The emulsion test is used to test a sample of food for fat. Describe the method you would use to do the emulsion test. ................................................................................................................................................... ................................................................................................................................................... ................................................................................................................................................... ................................................................................................................................................... ............................................................................................................................................. [2] [Total: 8]
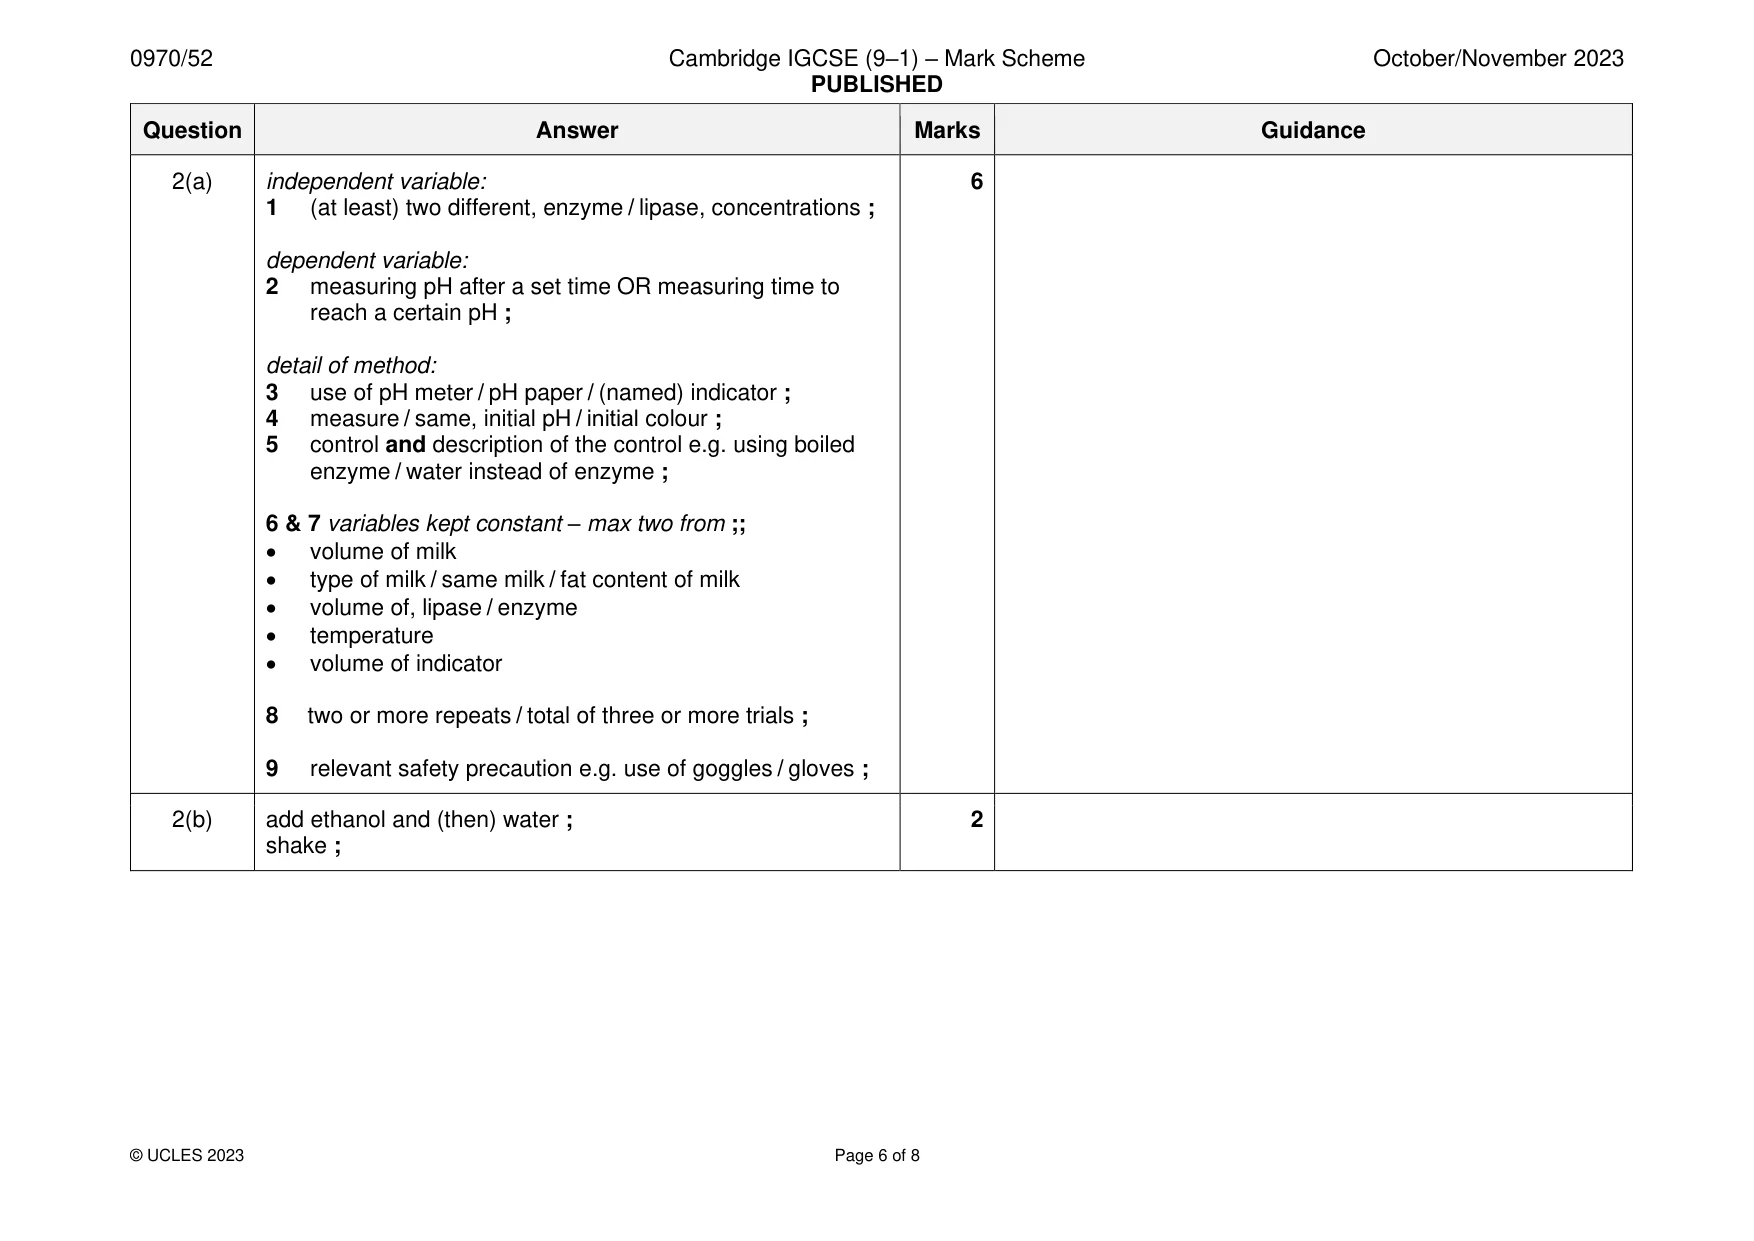
Mark scheme: 2(a) independent variable: 6 1 (at least) two different, enzyme / lipase, concentrations ; dependent variable: 2 measuring pH after a set time OR measuring time to reach a certain pH ; detail of method: 3 use of pH meter / pH paper / (named) indicator ; 4 measure / same, initial pH / initial colour ; 5 control and description of the control e.g. using boiled enzyme / water instead of enzyme ; 6 & 7 variables kept constant – max two from ;; • volume of milk • type of milk / same milk / fat content of milk • volume of, lipase / enzyme • temperature • volume of indicator 8 two or more repeats / total of three or more trials ; 9 relevant safety precaution e.g. use of goggles / gloves ; 2(b) add ethanol and (then) water ; 2 shake ;
Q3 · A photograph of a type of seaweed called bladder wrack
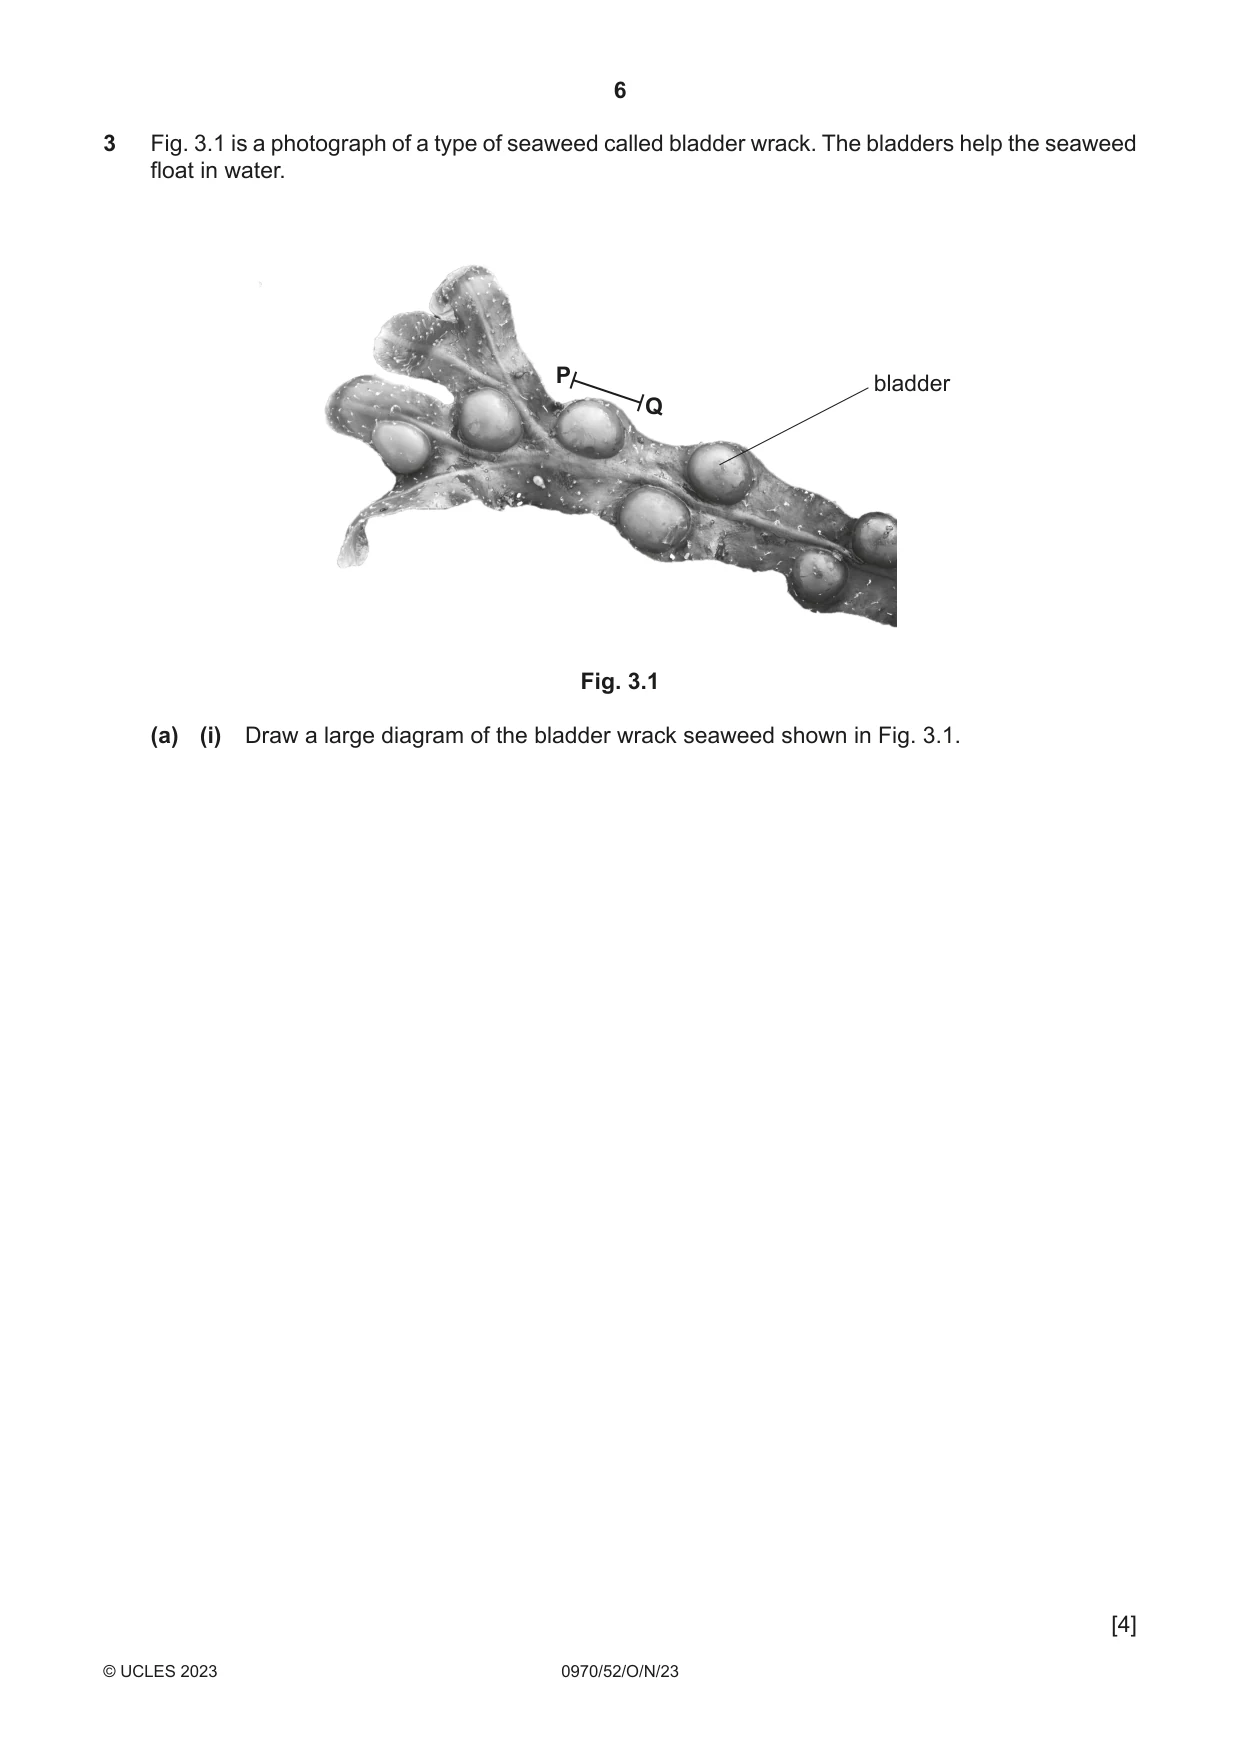
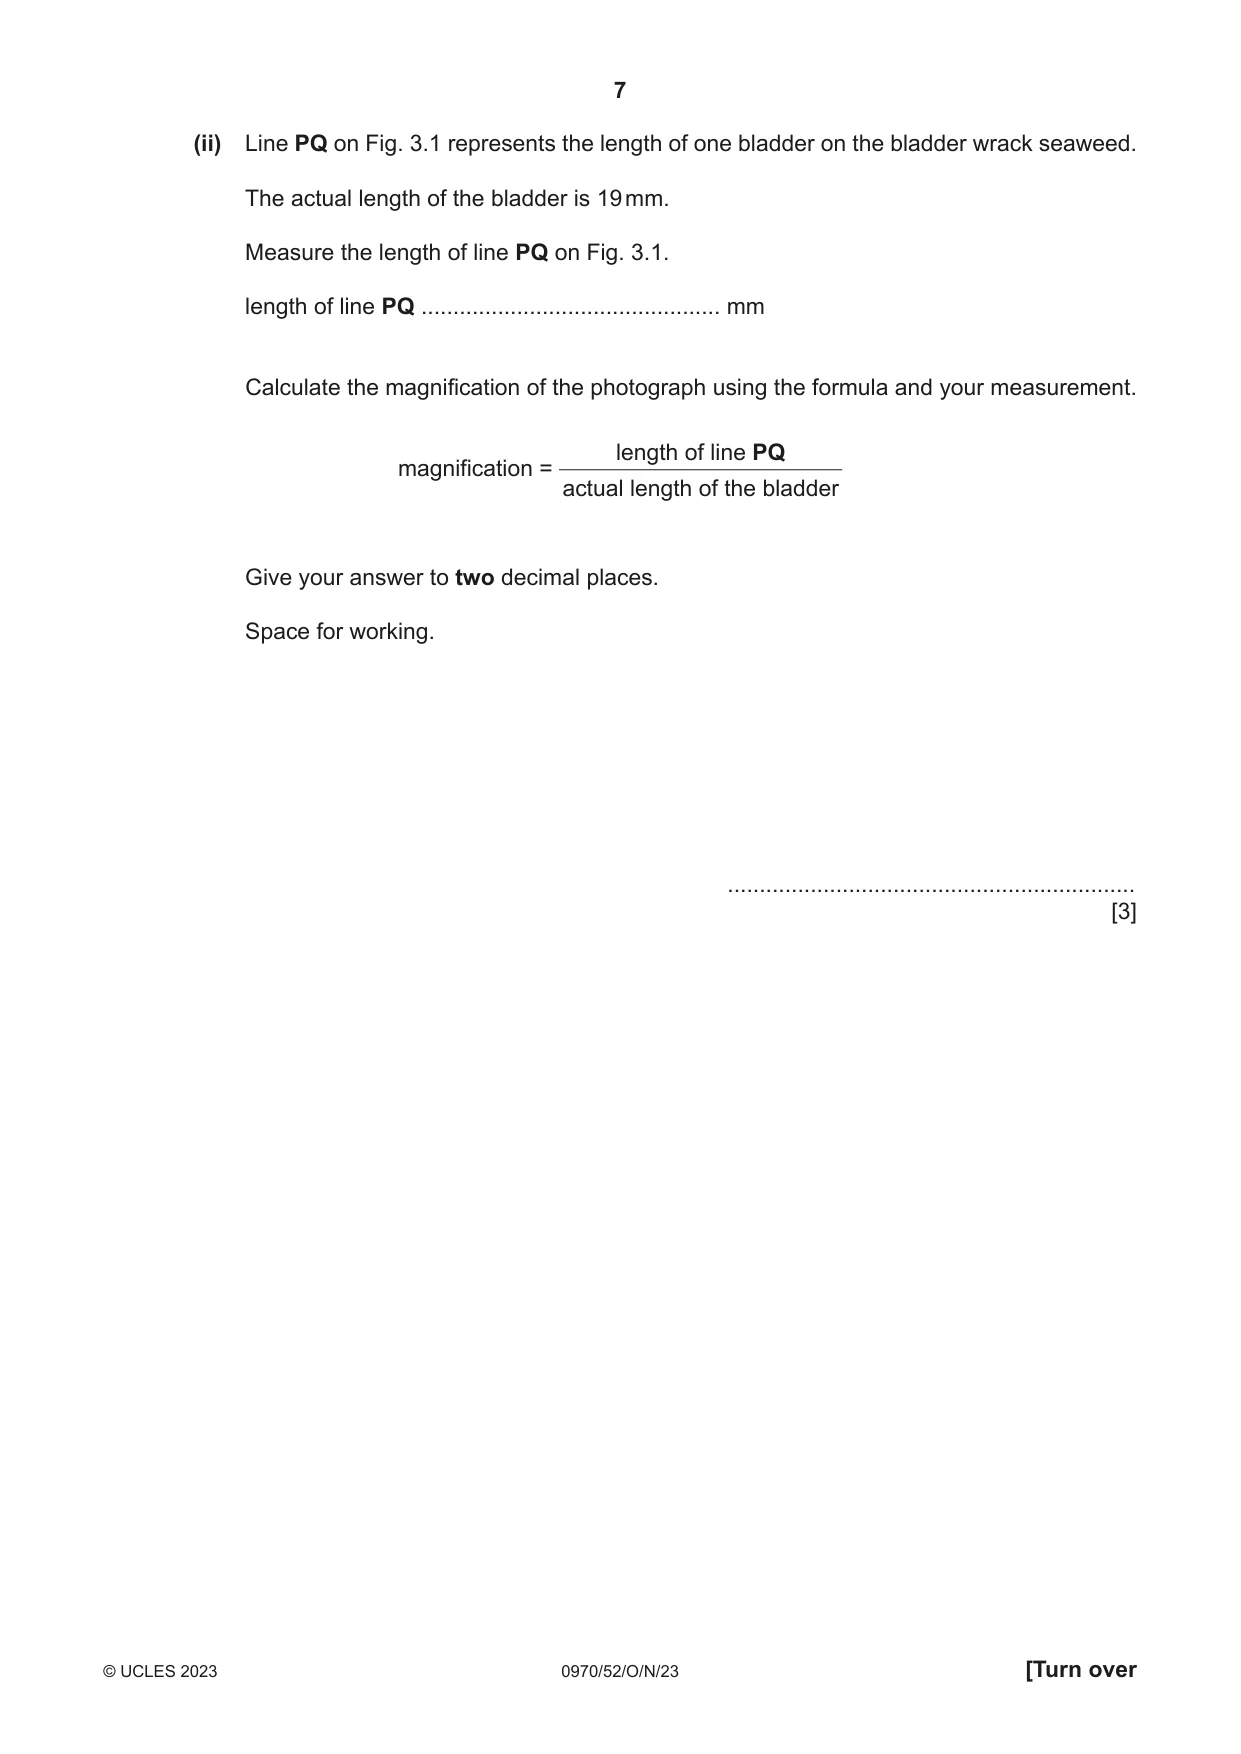
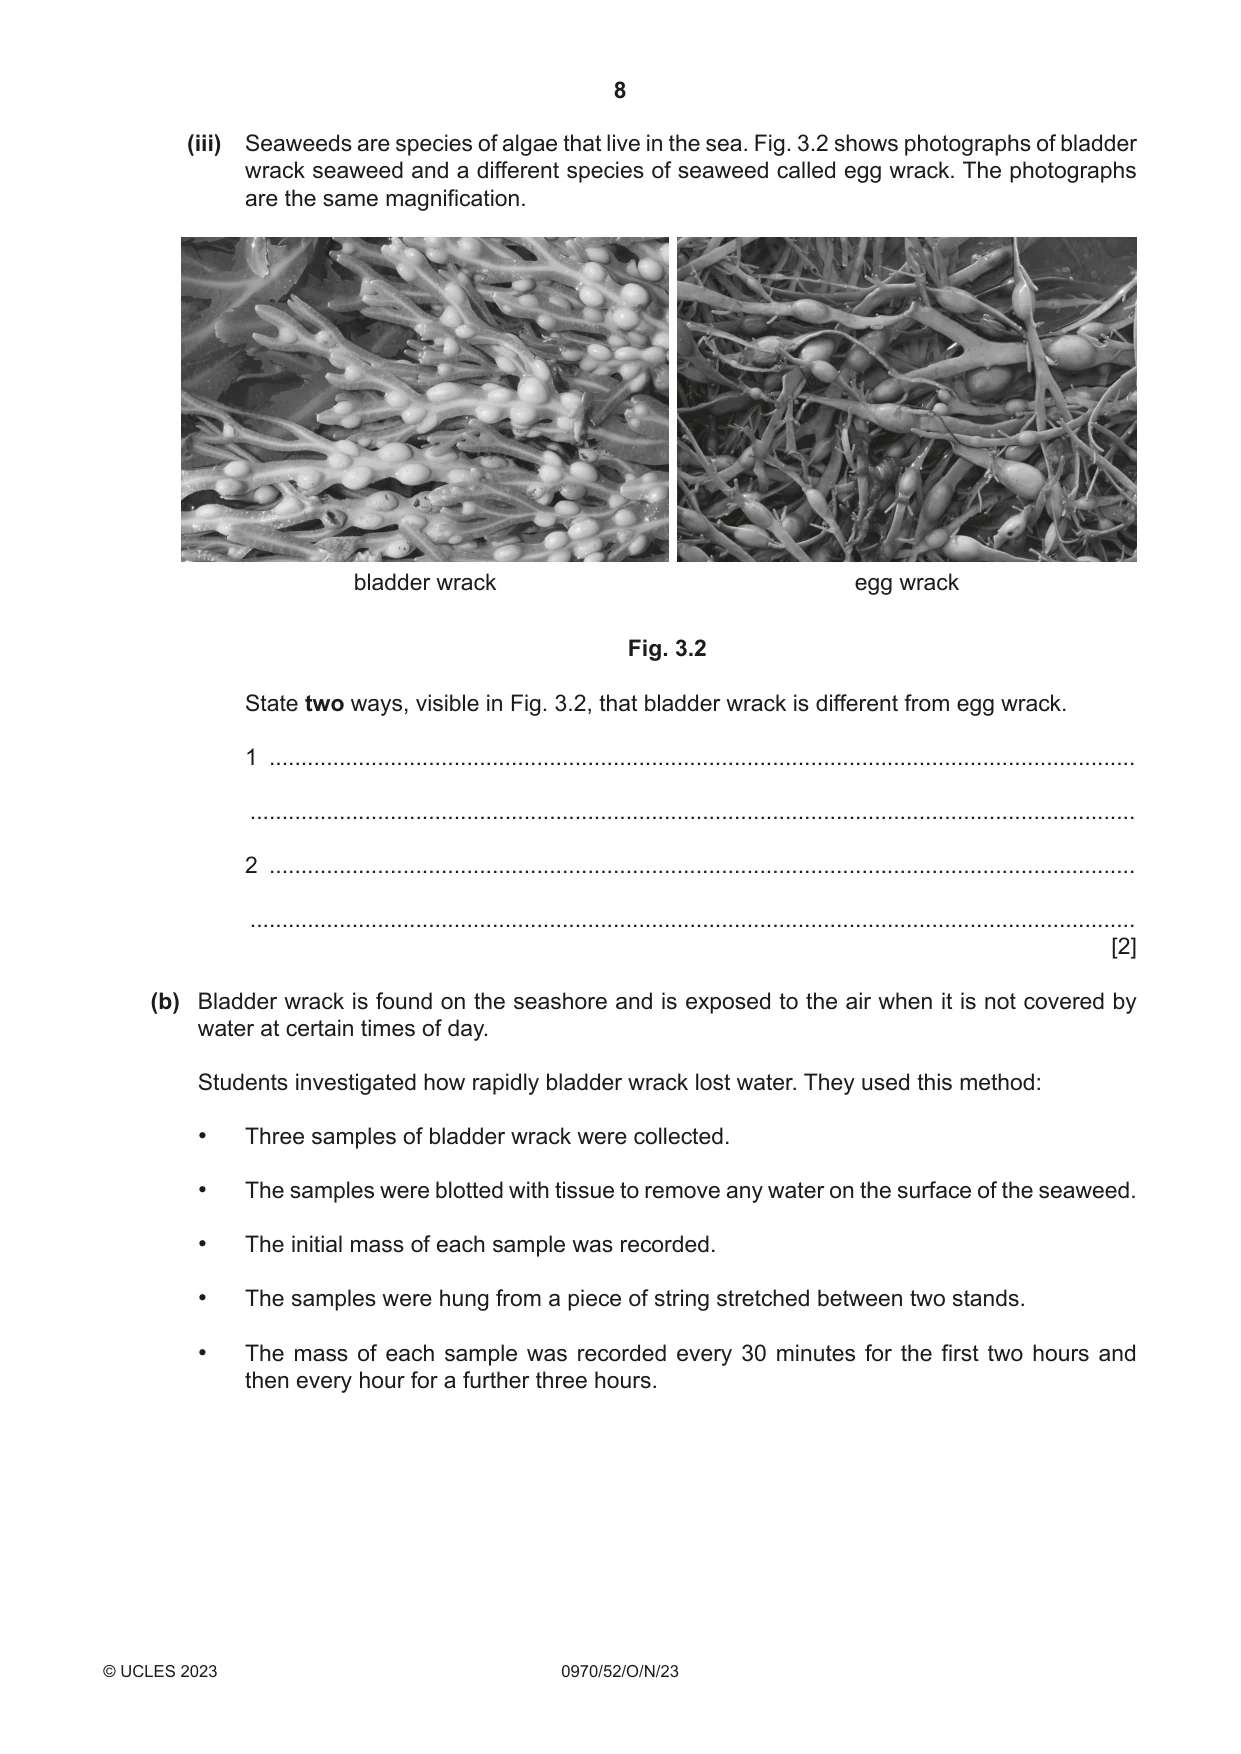
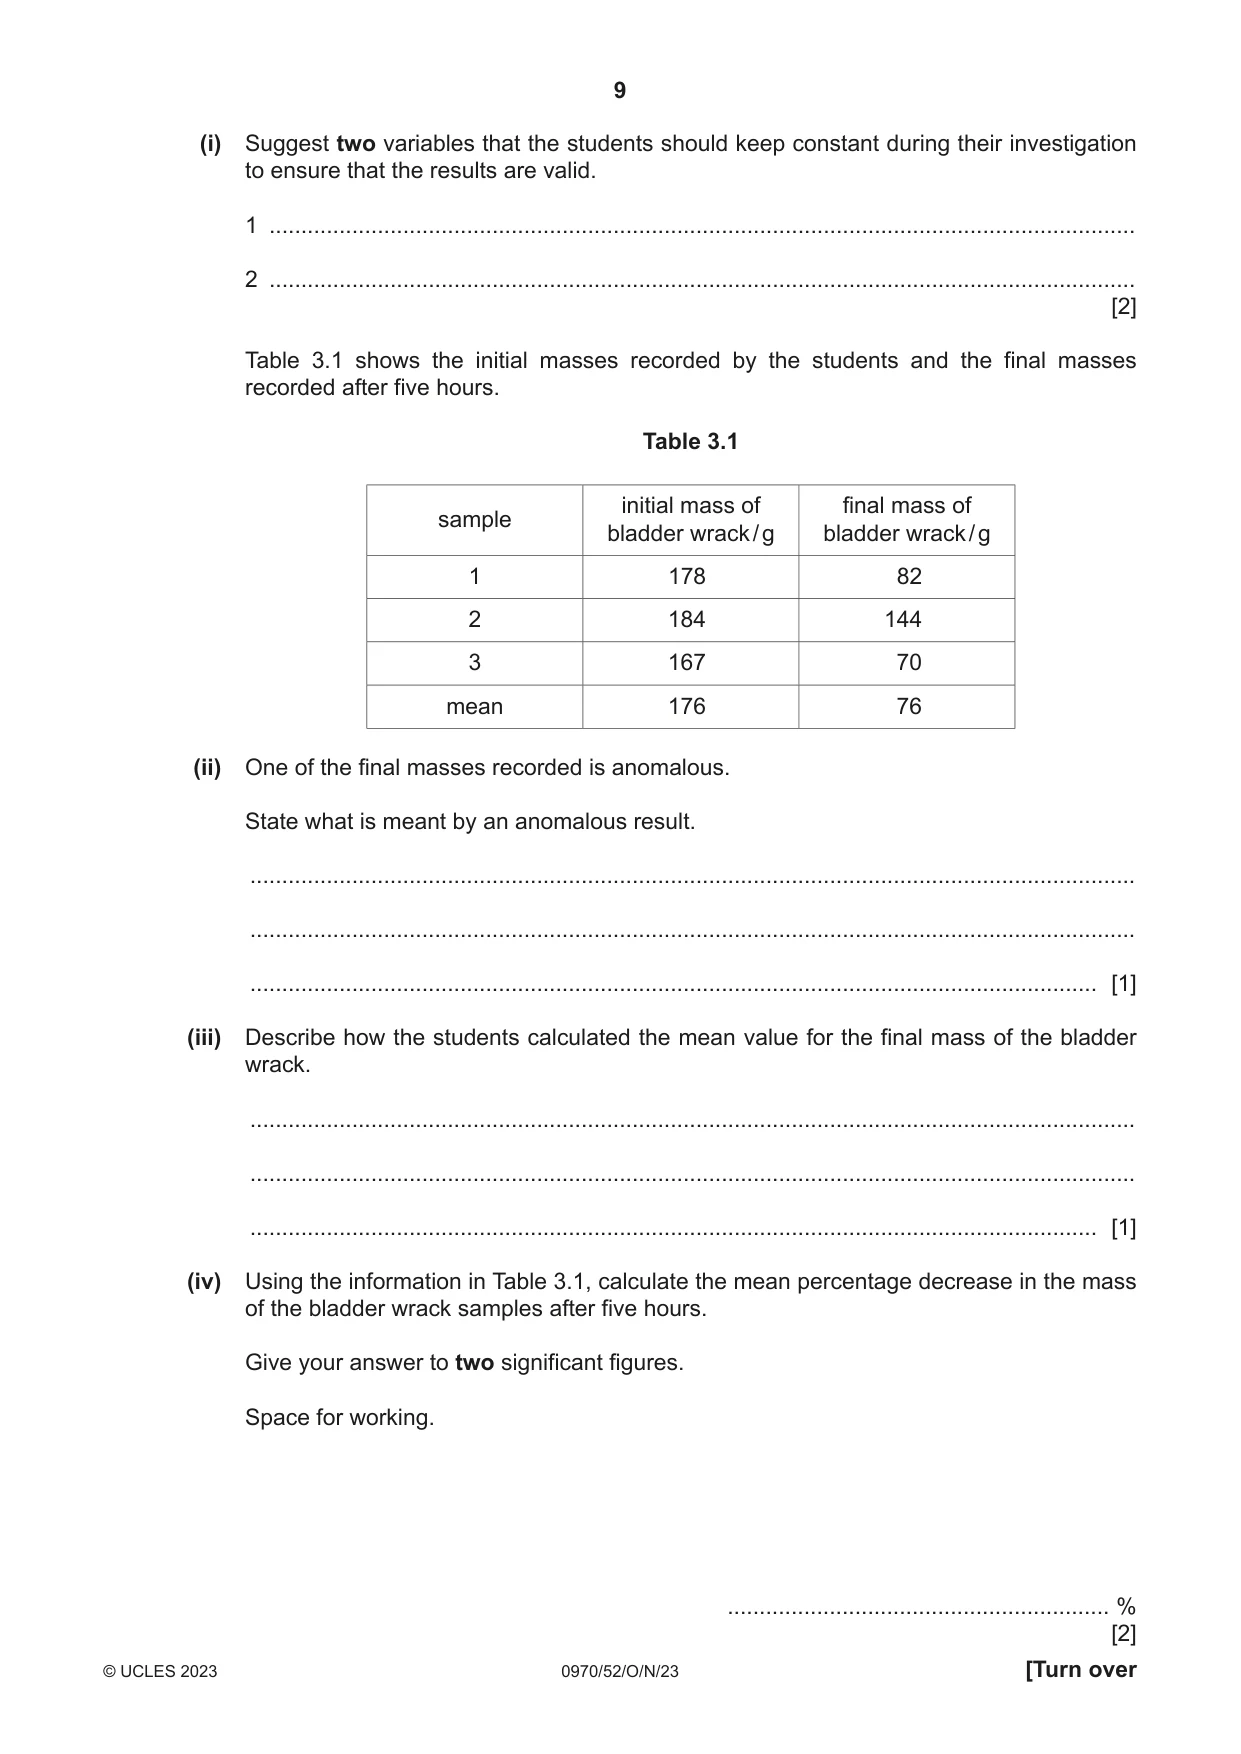
3 Fig. 3.1 is a photograph of a type of seaweed called bladder wrack. The bladders help the seaweed float in water. P bladder Q Fig. 3.1 (a) (i) Draw a large diagram of the bladder wrack seaweed shown in Fig. 3.1. [4] (ii) Line PQ on Fig. 3.1 represents the length of one bladder on the bladder wrack seaweed. The actual length of the bladder is 19 mm. Measure the length of line PQ on Fig. 3.1. length of line PQ ............................................... mm Calculate the magnification of the photograph using the formula and your measurement. length of line PQ magnification = actual length of the bladder Give your answer to two decimal places. Space for working. ................................................................ [3] (iii) Seaweeds are species of algae that live in the sea. Fig. 3.2 shows photographs of bladder wrack seaweed and a different species of seaweed called egg wrack. The photographs are the same magnification. bladder wrack egg wrack Fig. 3.2 State two ways, visible in Fig. 3.2, that bladder wrack is different from egg wrack. 1 ........................................................................................................................................ ........................................................................................................................................... 2 ........................................................................................................................................ ........................................................................................................................................... [2] (b) Bladder wrack is found on the seashore and is exposed to the air when it is not covered by water at certain times of day. Students investigated how rapidly bladder wrack lost water. They used this method: • Three samples of bladder wrack were collected. • The samples were blotted with tissue to remove any water on the surface of the seaweed. • The initial mass of each sample was recorded. • The samples were hung from a piece of string stretched between two stands. • The mass of each sample was recorded every 30 minutes for the first two hours and then every hour for a further three hours.
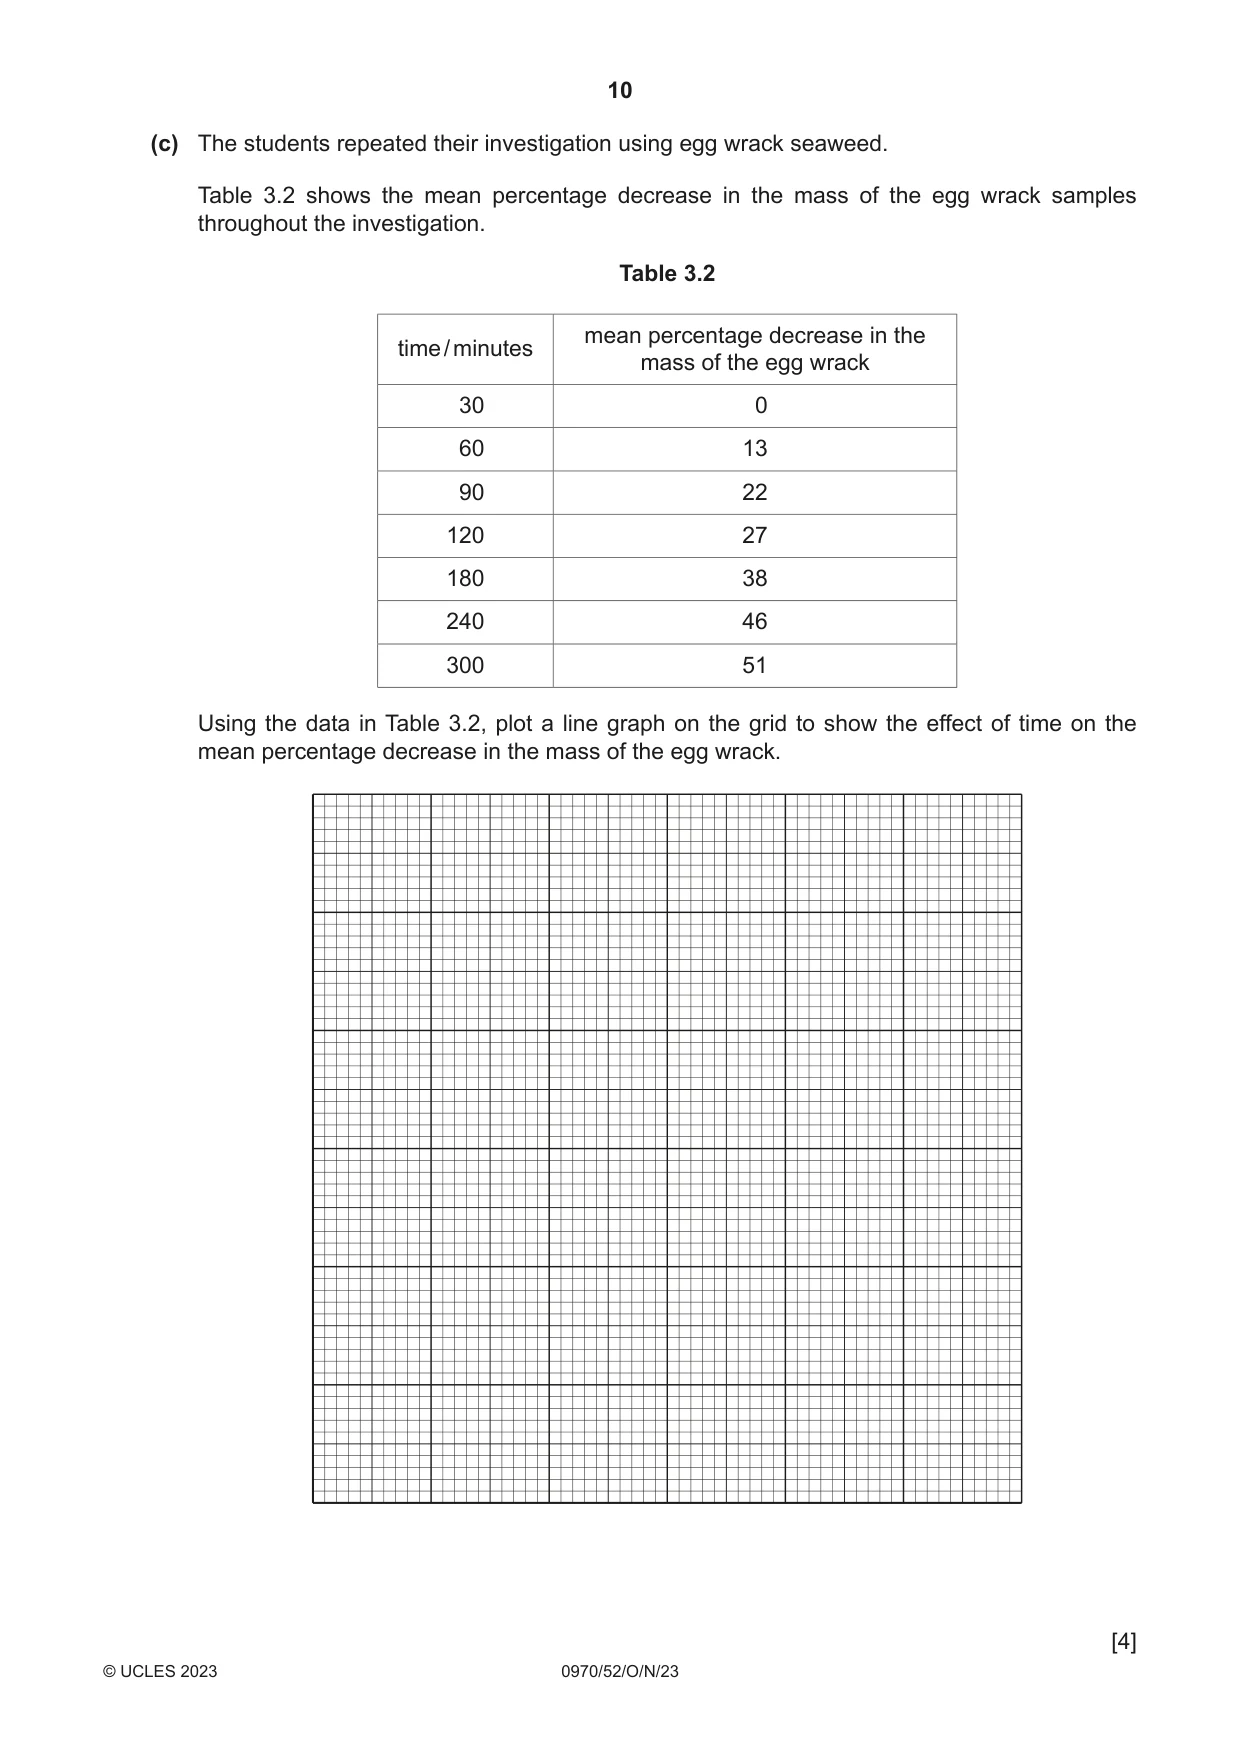
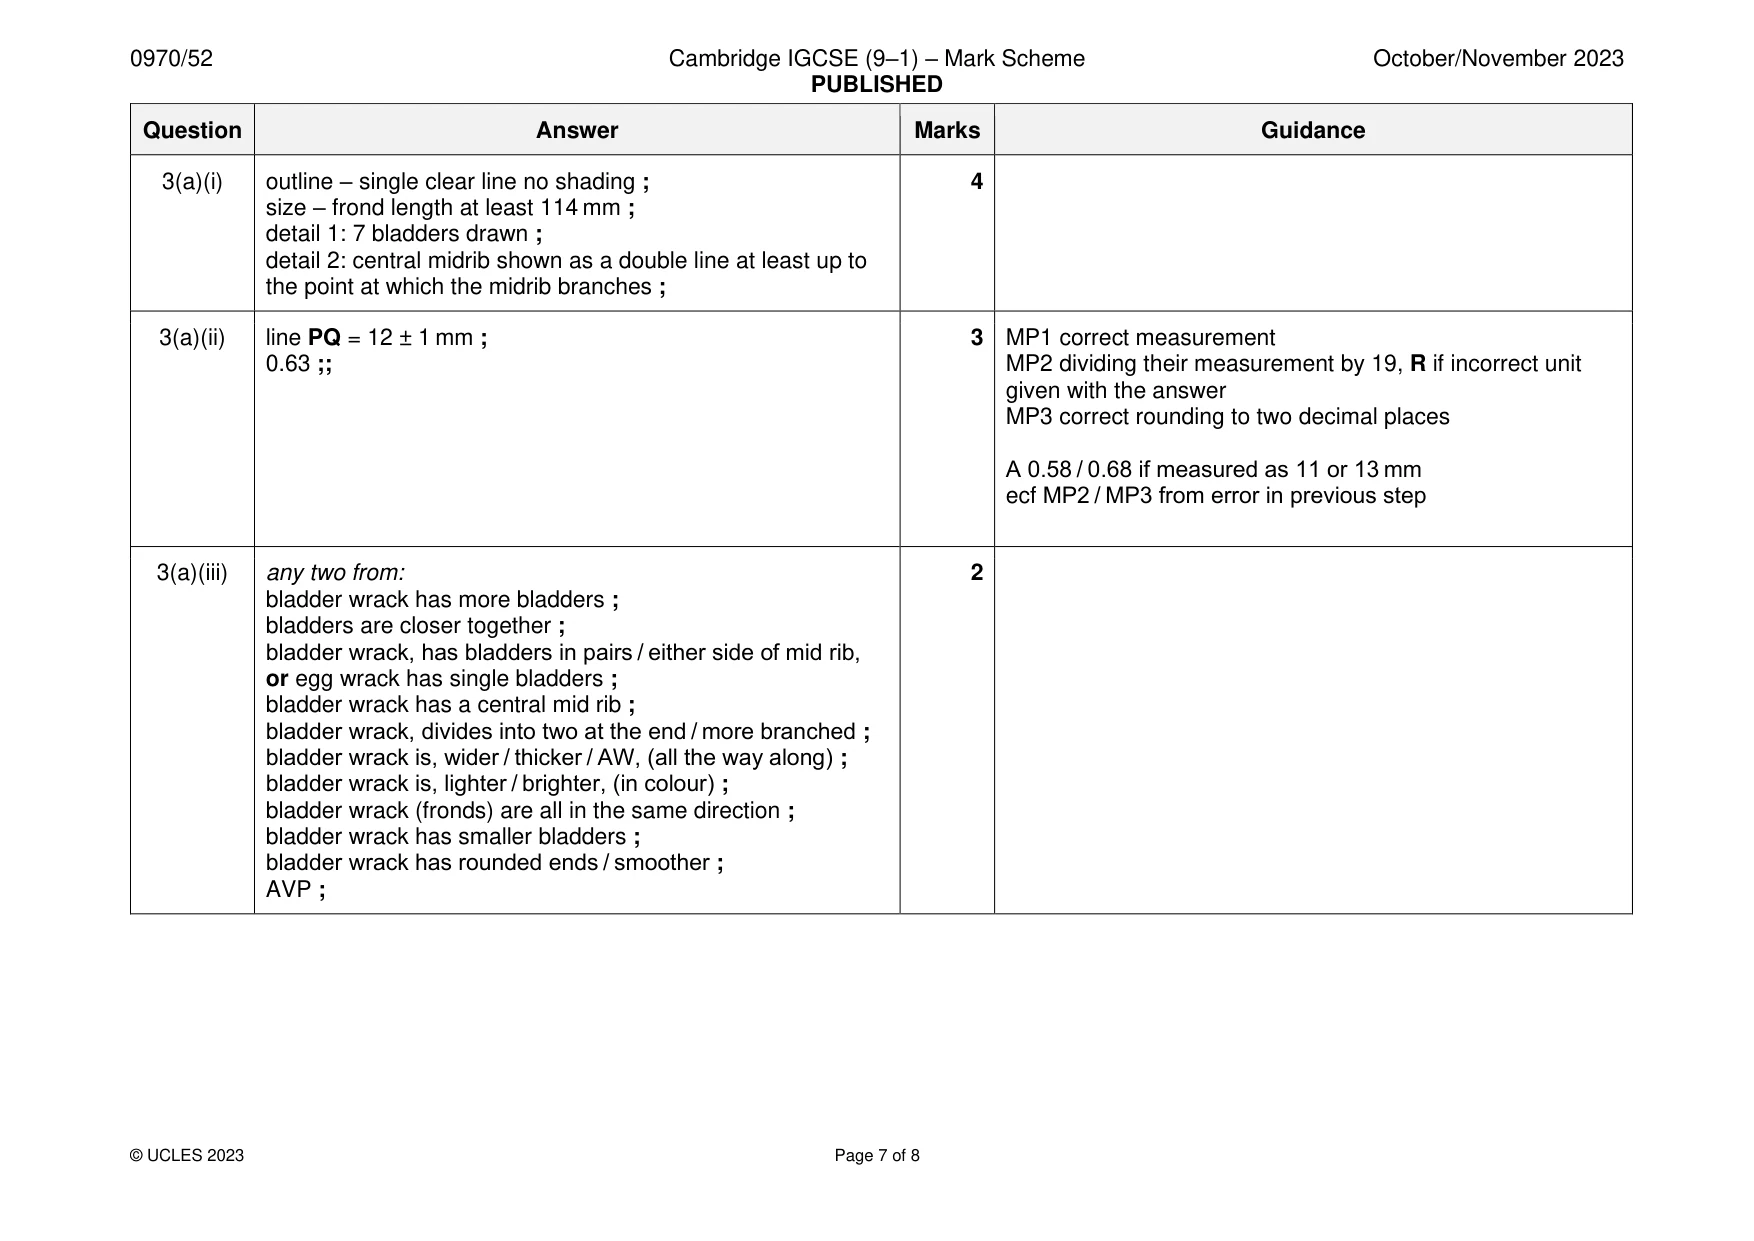
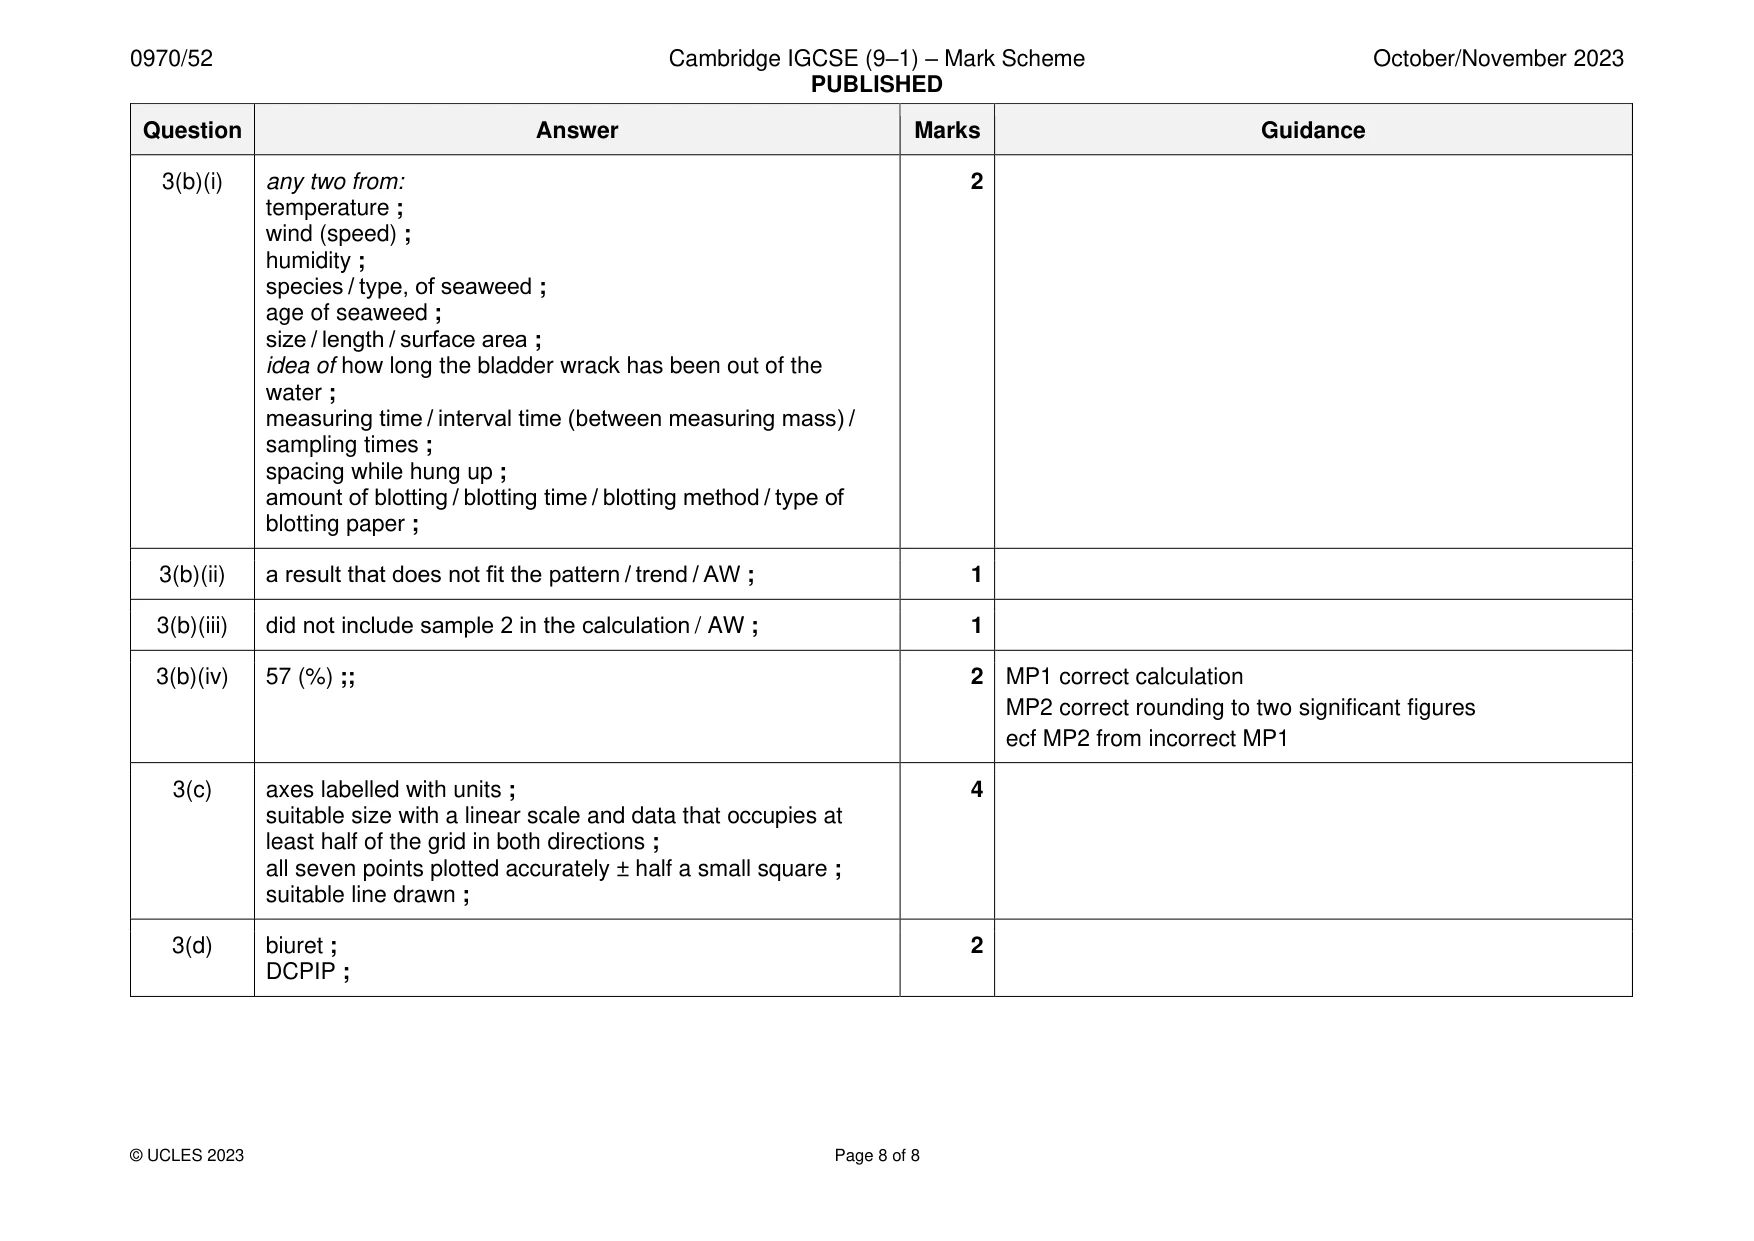
Mark scheme: 3(a)(i) outline – single clear line no shading ; 4 size – frond length at least 114 mm ; detail 1: 7 bladders drawn ; detail 2: central midrib shown as a double line at least up to the point at which the midrib branches ; 3(a)(ii) line PQ = 12 ± 1 mm ; 3 MP1 correct measurement 0.63 ;; MP2 dividing their measurement by 19, R if incorrect unit given with the answer MP3 correct rounding to two decimal places A 0.58 / 0.68 if measured as 11 or 13 mm ecf MP2 / MP3 from error in previous step 3(a)(iii) any two from: 2 bladder wrack has more bladders ; bladders are closer together ; bladder wrack, has bladders in pairs / either side of mid rib, or egg wrack has single bladders ; bladder wrack has a central mid rib ; bladder wrack, divides into two at the end / more branched ; bladder wrack is, wider / thicker / AW, (all the way along) ; bladder wrack is, lighter / brighter, (in colour) ; bladder wrack (fronds) are all in the same direction ; bladder wrack has smaller bladders ; bladder wrack has rounded ends / smoother ; AVP ; 3(b)(i) any two from: 2 temperature ; wind (speed) ; humidity ; species / type, of seaweed ; age of seaweed ; size / length / surface area ; idea of how long the bladder wrack has been out of the water ; measuring time / interval time (between measuring mass) / sampling times ; spacing while hung up ; amount of blotting / blotting time / blotting method / type of blotting paper ; 3(b)(ii) a result that does not fit the pattern / trend / AW ; 1 3(b)(iii) did not include sample 2 in the calculation / AW ; 1 3(b)(iv) 57 (%) ;; 2 MP1 correct calculation MP2 correct rounding to two significant figures ecf MP2 from incorrect MP1 3(c) axes labelled with units ; 4 suitable size with a linear scale and data that occupies at least half of the grid in both directions ; all seven points plotted accurately ± half a small square ; suitable line drawn ; 3(d) biuret ; 2 DCPIP ;
What was in this paper
The subtopics covered by these 3 questions, and how many questions each got. Open one in a new tab to see every Cambridge question on it.
What you needed in this session
Cambridge’s own grade thresholds for 2023 Oct/Nov, Paper 5 · Variant 2. A higher threshold means an easier paper — the bar moves with how the cohort did.