Cambridge IGCSE Biology (9-1) 0970 — 2021 Oct/Nov Paper 5 · Variant 2
0970/52/O/N/21 · 2 questions · 40 marks · ≈45 min
The question paper and its mark scheme, free to read here and free to download. This is Cambridge’s own paper, exactly as it was sat.
Question paper12 pages


Mark scheme9 pages
Answers below. Sit the paper first if you are practising.
Questions as text
Q1 · You are going to investigate the effect of temperature on the rate of respiration in…
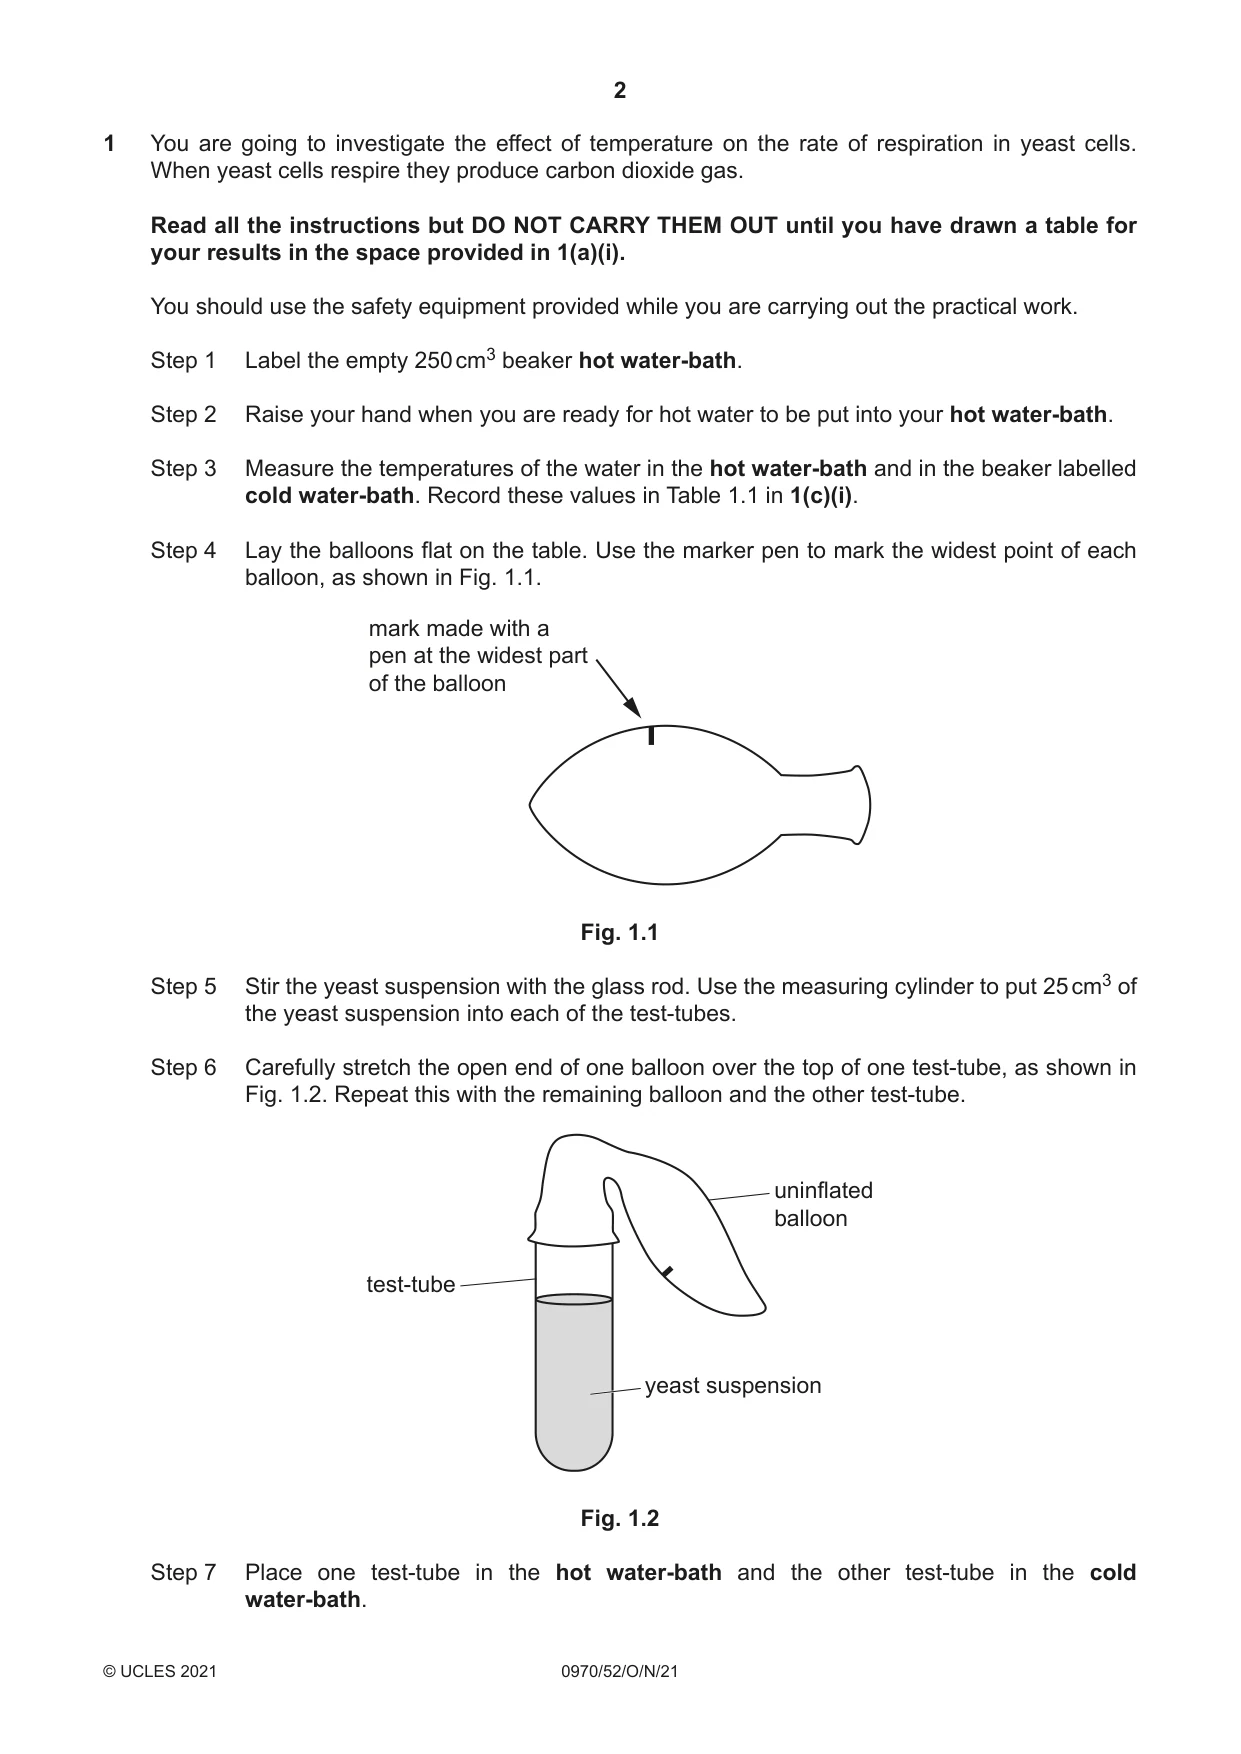
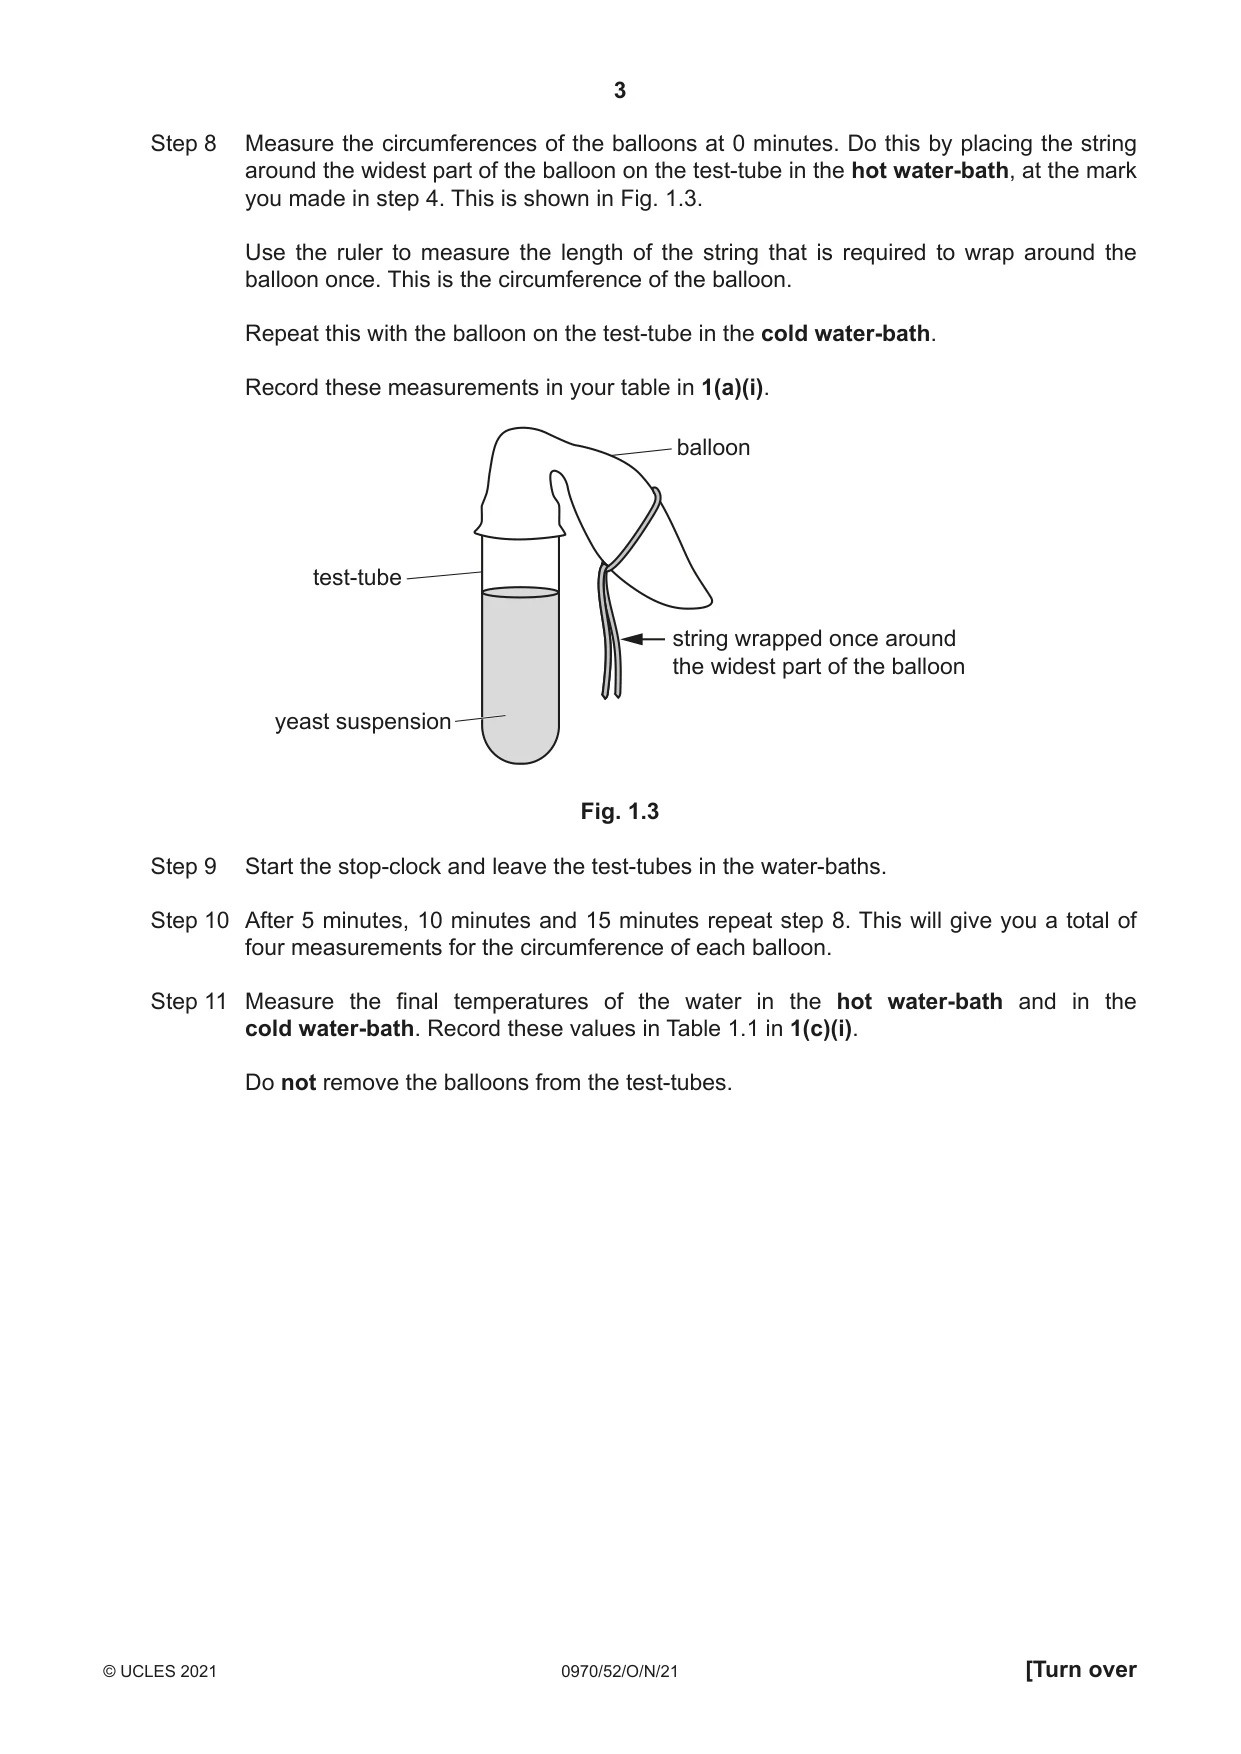
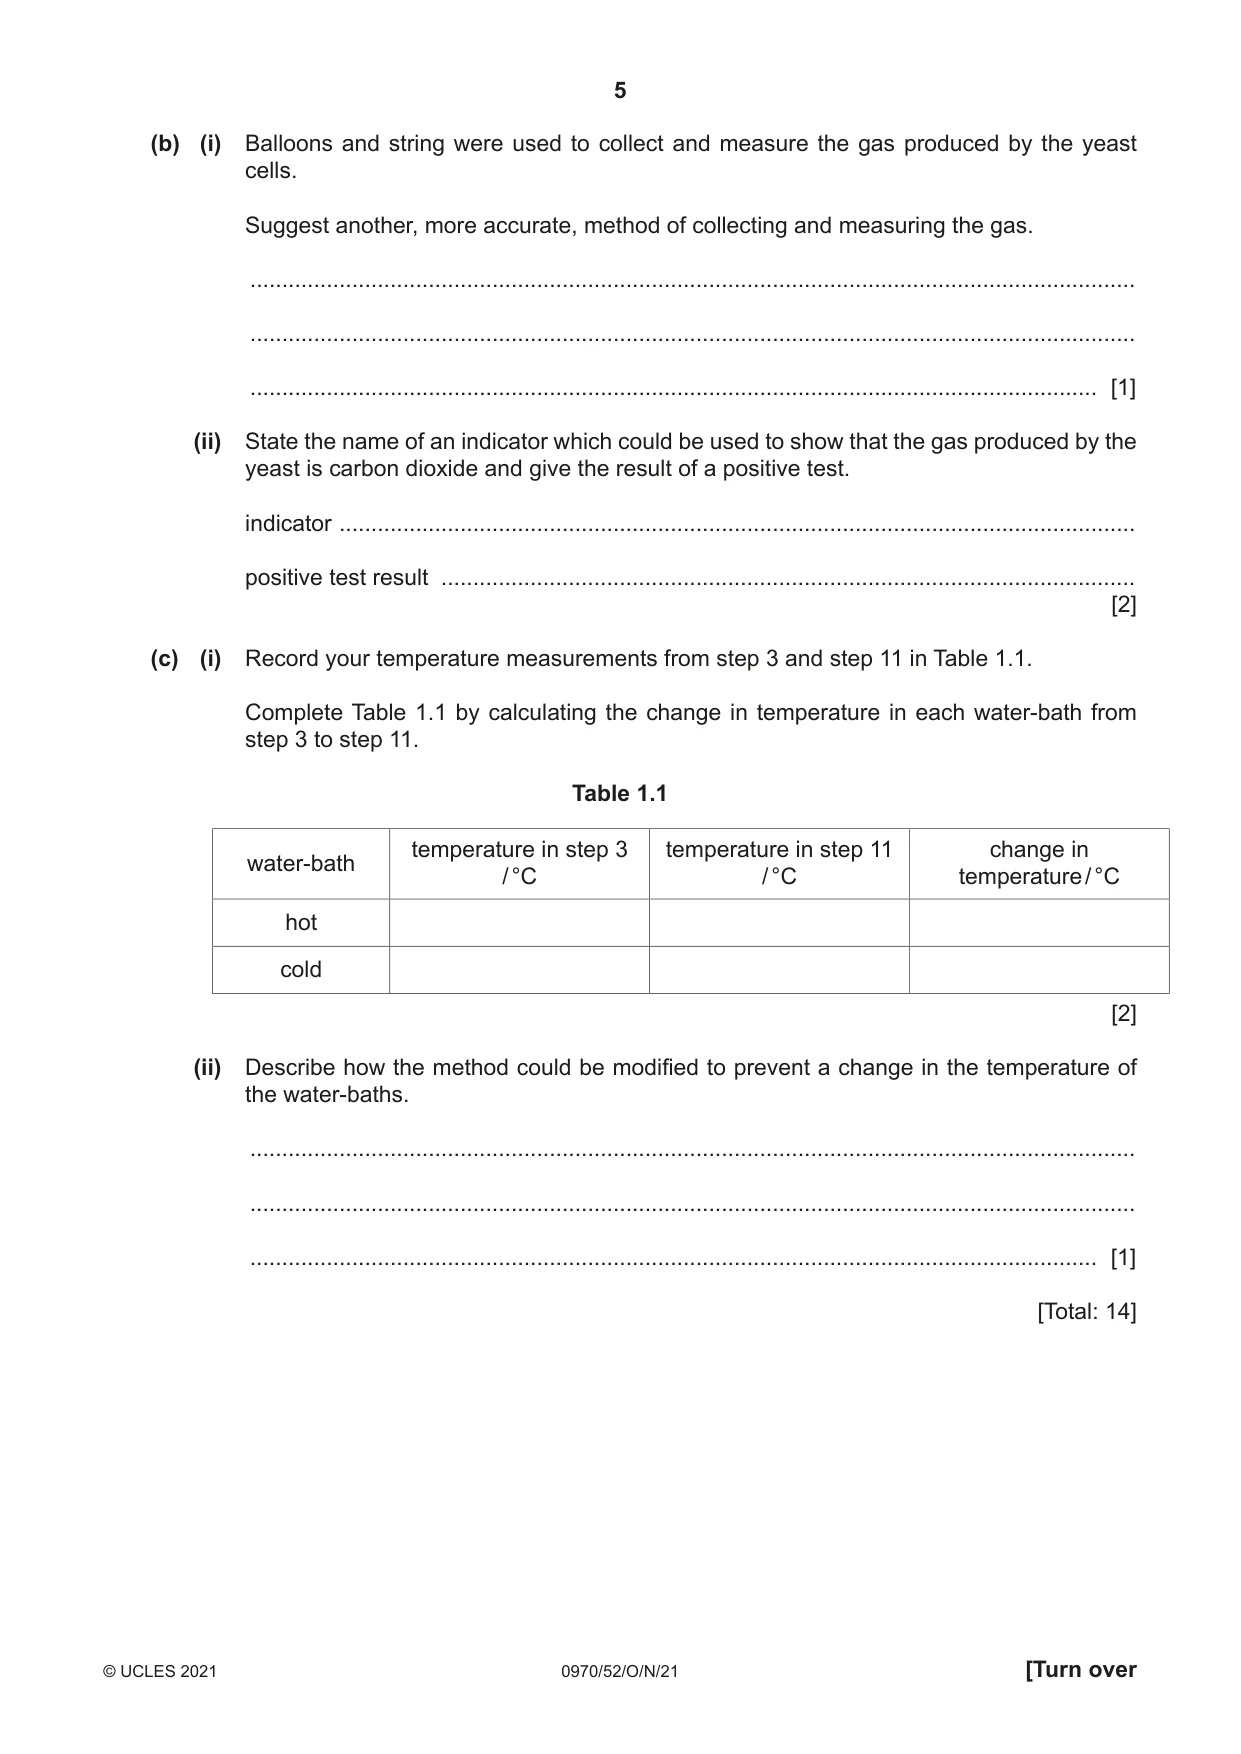
1 You are going to investigate the effect of temperature on the rate of respiration in yeast cells. When yeast cells respire they produce carbon dioxide gas. Read all the instructions but DO NOT CARRY THEM OUT until you have drawn a table for your results in the space provided in 1(a)(i). You should use the safety equipment provided while you are carrying out the practical work. Step 1 Label the empty 250 cm3 beaker hot water‑bath. Step 2 Raise your hand when you are ready for hot water to be put into your hot water‑bath. Step 3 Measure the temperatures of the water in the hot water‑bath and in the beaker labelled cold water‑bath. Record these values in Table 1.1 in 1(c)(i). Step 4 Lay the balloons flat on the table. Use the marker pen to mark the widest point of each balloon, as shown in Fig. 1.1. mark made with a pen at the widest part of the balloon Fig. 1.1 Step 5 Stir the yeast suspension with the glass rod. Use the measuring cylinder to put 25 cm3 of the yeast suspension into each of the test-tubes. Step 6 Carefully stretch the open end of one balloon over the top of one test-tube, as shown in Fig. 1.2. Repeat this with the remaining balloon and the other test-tube. uninflated balloon test-tube yeast suspension Fig. 1.2 Step 7 Place one test-tube in the hot water‑bath and the other test-tube in the cold water‑bath. Step 8 Measure the circumferences of the balloons at 0 minutes. Do this by placing the string around the widest part of the balloon on the test-tube in the hot water‑bath, at the mark you made in step 4. This is shown in Fig. 1.3. Use the ruler to measure the length of the string that is required to wrap around the balloon once. This is the circumference of the balloon. Repeat this with the balloon on the test-tube in the cold water‑bath. Record these measurements in your table in 1(a)(i). balloon test-tube string wrapped once around the widest part of the balloon yeast suspension Fig. 1.3 Step 9 Start the stop-clock and leave the test-tubes in the water-baths. Step 10 After 5 minutes, 10 minutes and 15 minutes repeat step 8. This will give you a total of four measurements for the circumference of each balloon. Step 11 Measure the final temperatures of the water in the hot water‑bath and in the cold water‑bath. Record these values in Table 1.1 in 1(c)(i). Do not remove the balloons from the test-tubes. (a) (i) Prepare a table to record your results from step 8 and step 10. [4] (ii) State a conclusion for these results. ........................................................................................................................................... ........................................................................................................................................... ..................................................................................................................................... [1] (iii) Suggest why it was important to stir the yeast suspension in step 5. ........................................................................................................................................... ........................................................................................................................................... ..................................................................................................................................... [1] (iv) State two variables, other than stirring, that were kept constant in this investigation. 1 ........................................................................................................................................ ........................................................................................................................................... 2 ........................................................................................................................................ ........................................................................................................................................... [2] (b) (i) Balloons and string were used to collect and measure the gas produced by the yeast cells. Suggest another, more accurate, method of collecting and measuring the gas. ........................................................................................................................................... ........................................................................................................................................... ..................................................................................................................................... [1] (ii) State the name of an indicator which could be used to show that the gas produced by the yeast is carbon dioxide and give the result of a positive test. indicator ............................................................................................................................. positive test result ............................................................................................................. [2] (c) (i) Record your temperature measurements from step 3 and step 11 in Table 1.1. Complete Table 1.1 by calculating the change in temperature in each water-bath from step 3 to step 11. Table 1.1 temperature in step 3 temperature in step 11 change in water-bath / °C / °C temperature / °C hot cold [2] (ii) Describe how the method could be modified to prevent a change in the temperature of the water-baths. ........................................................................................................................................... ........................................................................................................................................... ..................................................................................................................................... [1] [Total: 14]
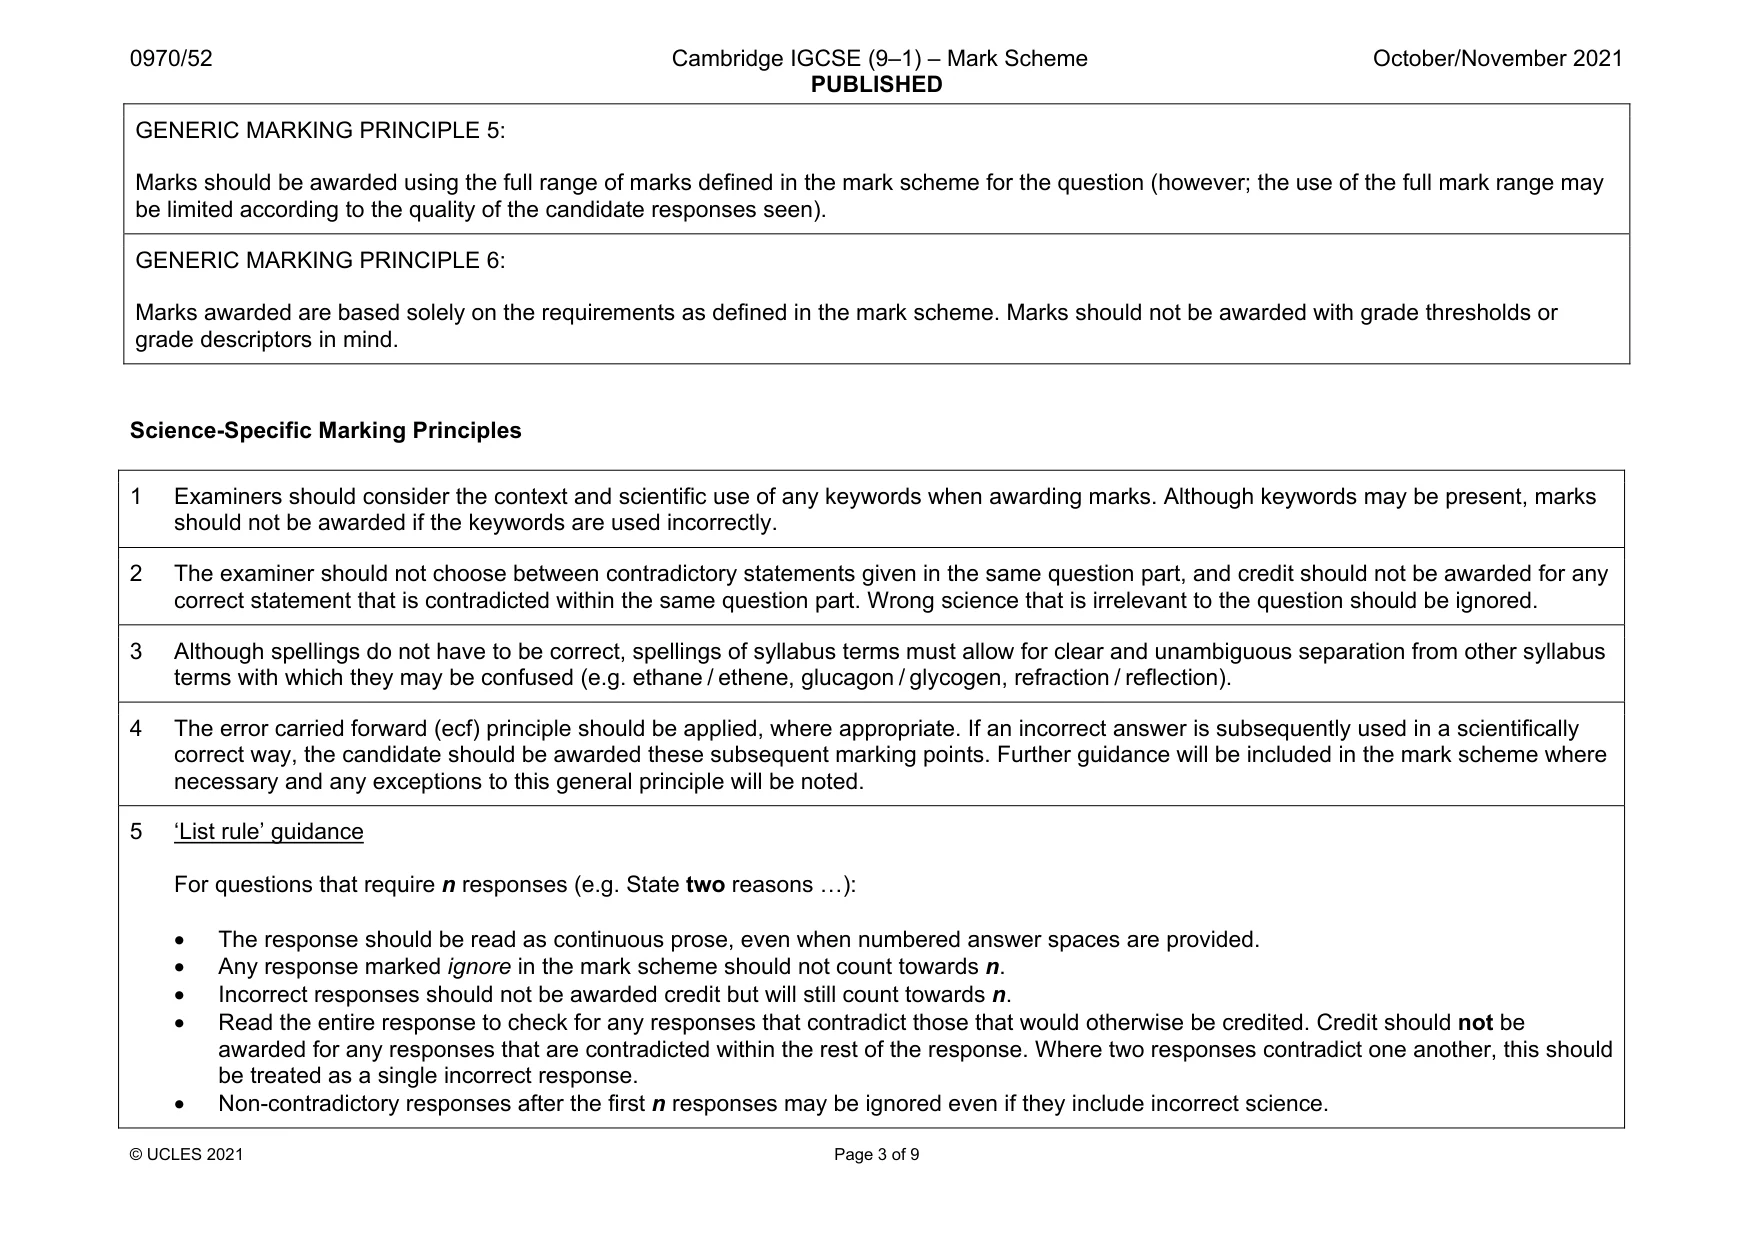
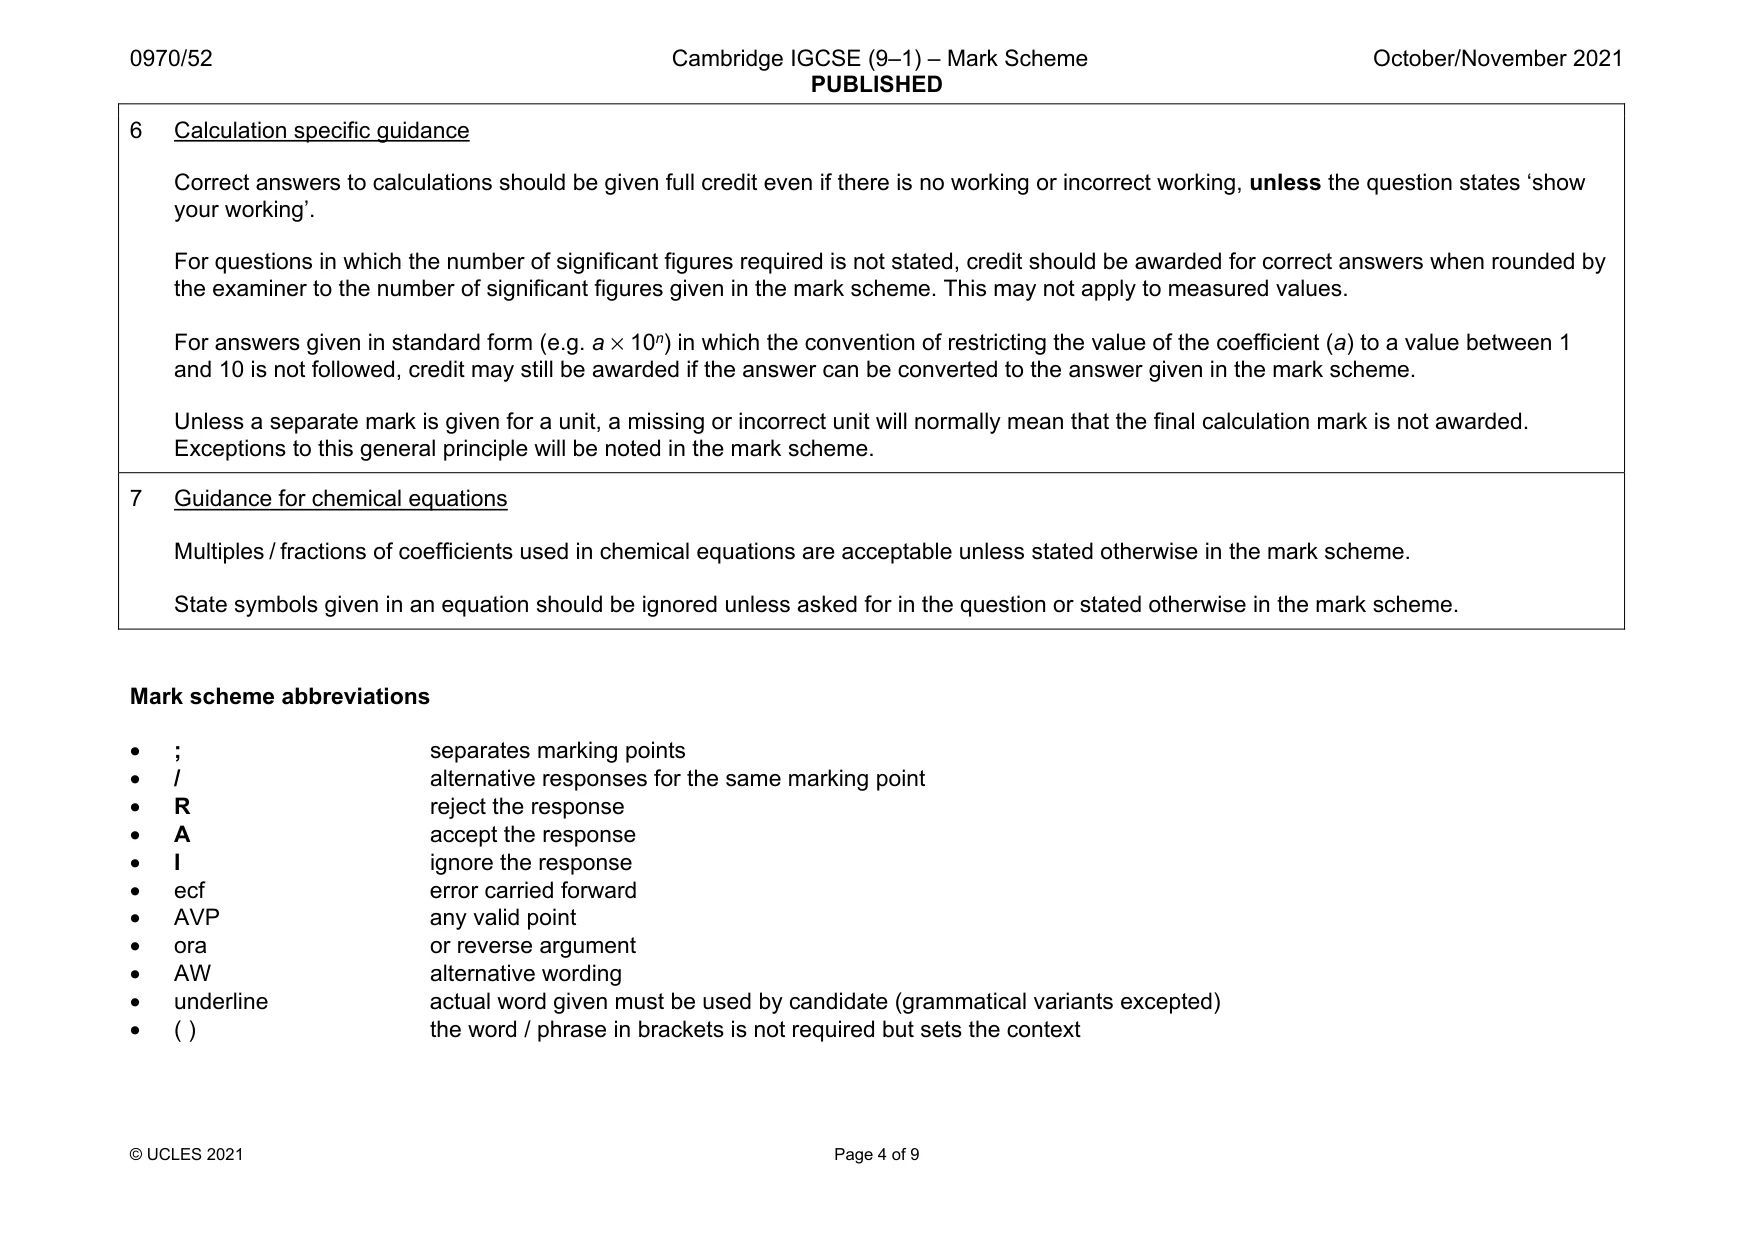
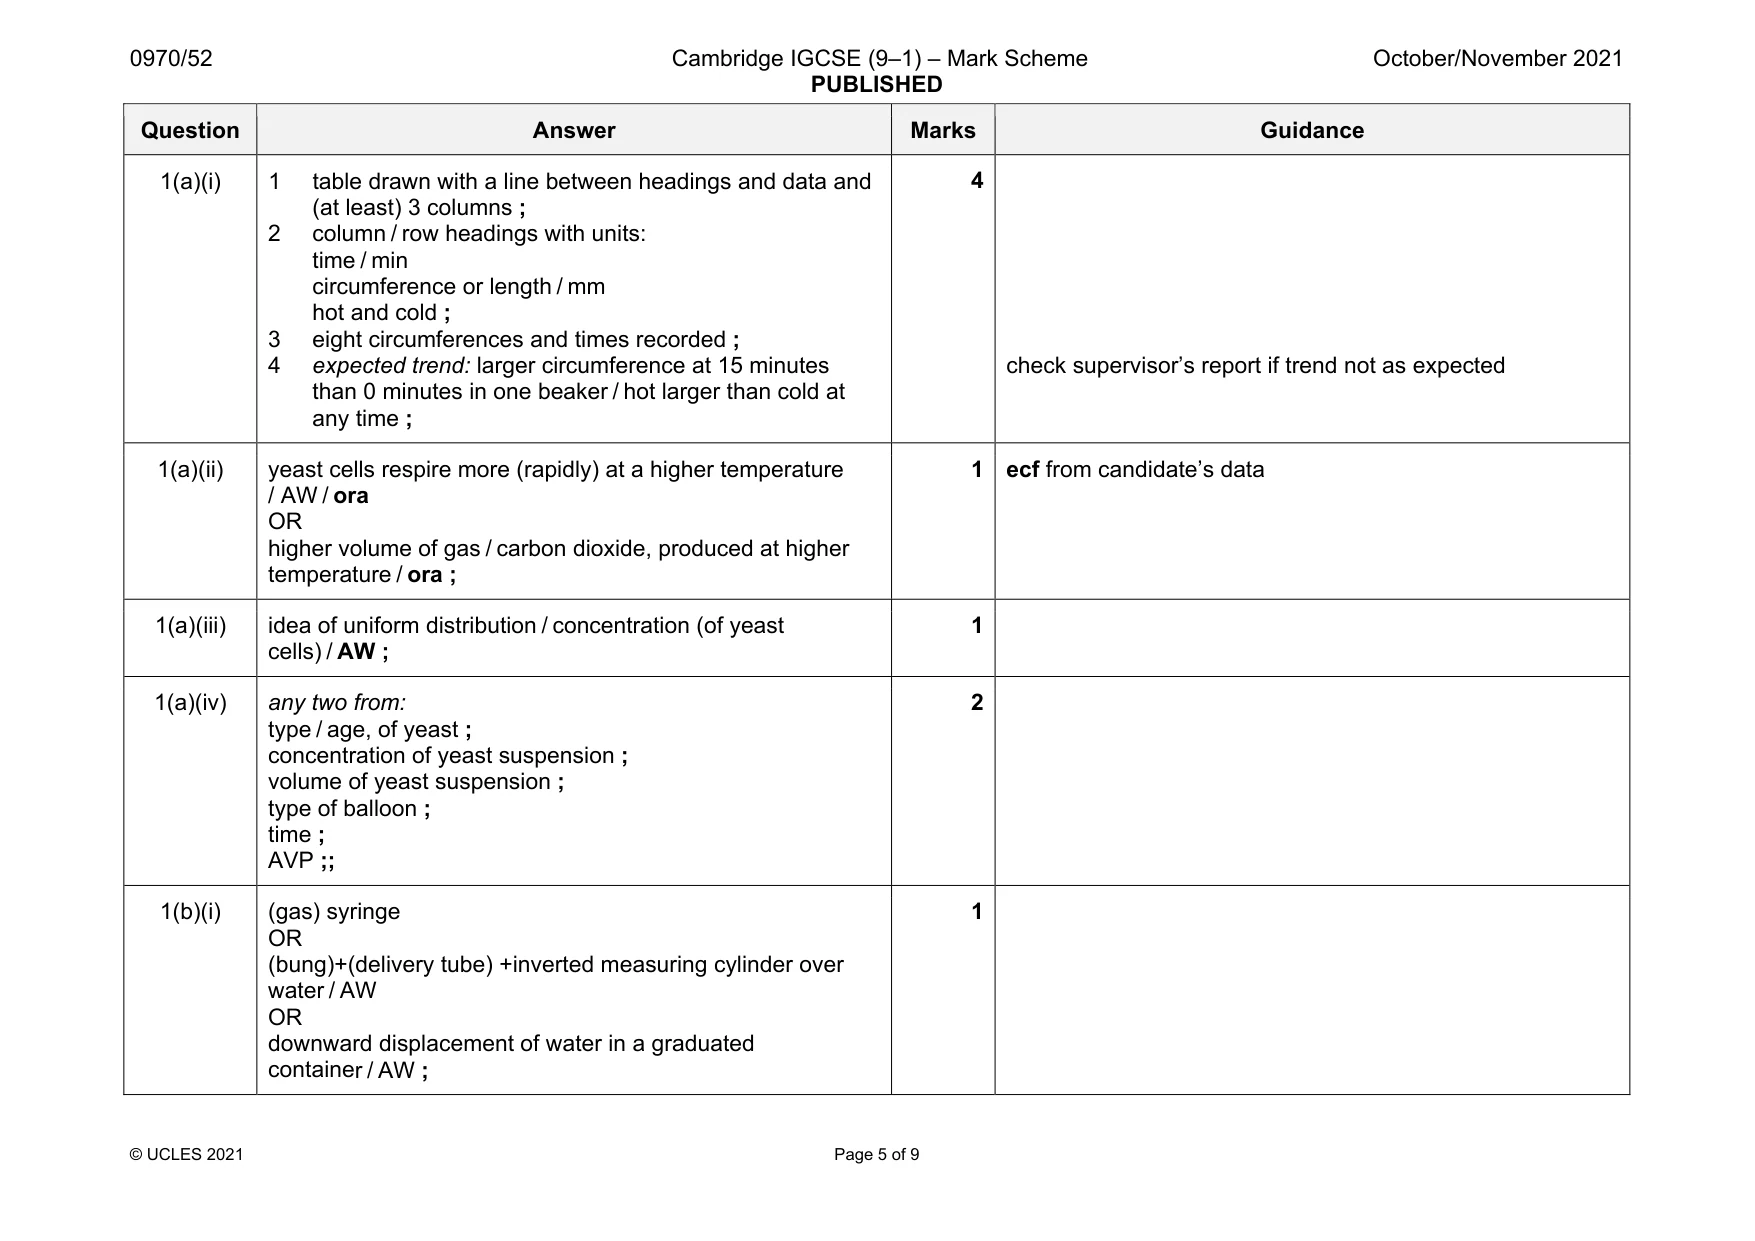
Mark scheme: 1(a)(i) 1 table drawn with a line between headings and data and (at least) 3 columns ; 2 column / row headings with units: time / min circumference or length / mm hot and cold ; 3 eight circumferences and times recorded ; 4 expected trend: larger circumference at 15 minutes than 0 minutes in one beaker / hot larger than cold at any time ; check supervisor’s report if trend not as expected 1(a)(ii) yeast cells respire more (rapidly) at a higher temperature / AW / ora OR higher volume of gas / carbon dioxide, produced at higher temperature / ora ; 1 ecf from candidate’s data 1(a)(iii) idea of uniform distribution / concentration (of yeast cells) / AW ; 1 1(a)(iv) any two from: type / age, of yeast ; concentration of yeast suspension ; volume of yeast suspension ; type of balloon ; time ; AVP ;; 2 1(b)(i) (gas) syringe OR (bung)+(delivery tube) +inverted measuring cylinder over water / AW OR downward displacement of water in a graduated container / AW ; 1 Question Answer Marks Guidance 1(b)(ii) limewater ; milky / white / cloudy / AW ; OR hydrogencarbonate ; yellow ; 2 1(c)(i) four temperatures recorded ; two changes in temperature correctly calculated ; 2 1(c)(ii) any one from: 1 use thermostatically controlled water-baths ; 2 use a Bunsen burner AND thermometer (method outlined) / use a Bunsen burner and monitor the temperature ; 3 top up with, hot water / cold water / ice, and monitor /use a thermometer ; 4 insulate the container / AW ; 1
Q2 · A photograph of a flower from the wind-pollinated grass plant, Briza maxima
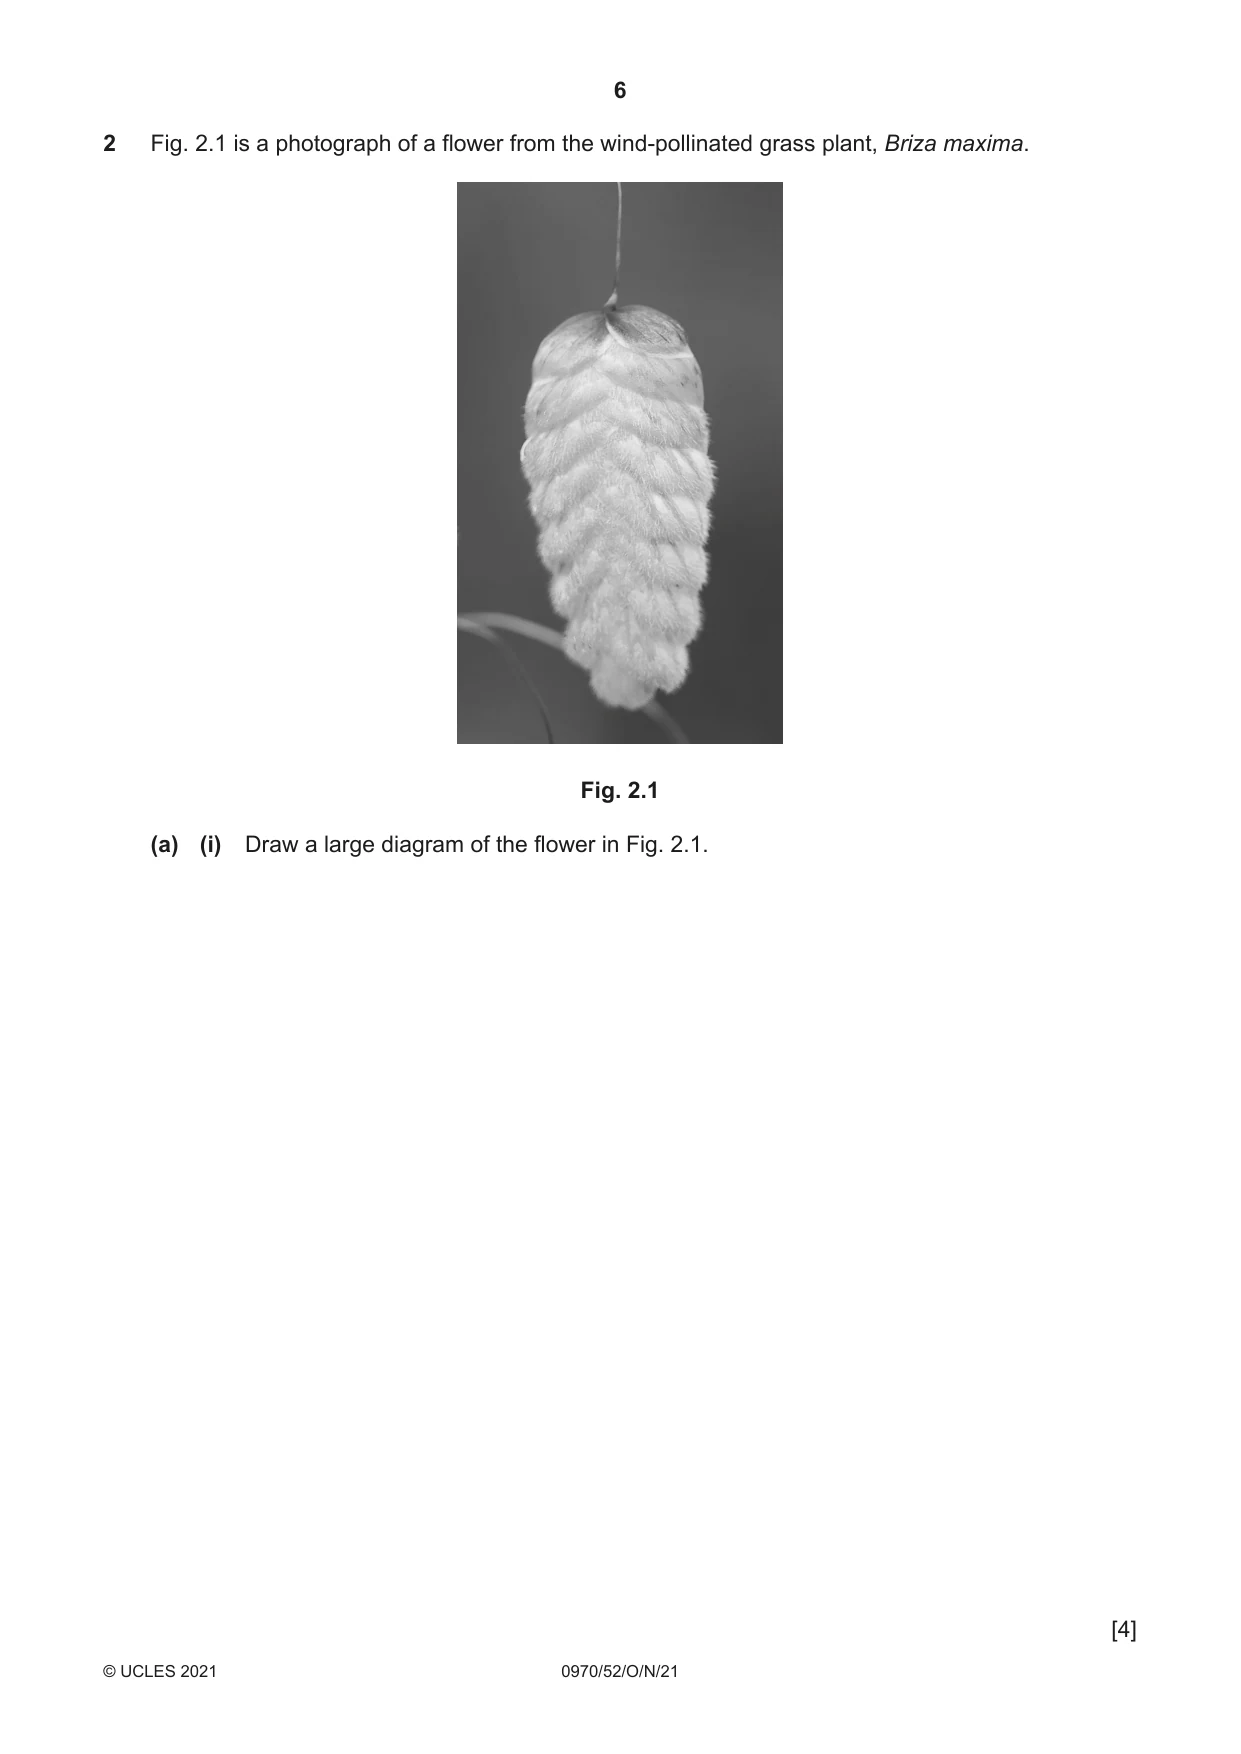
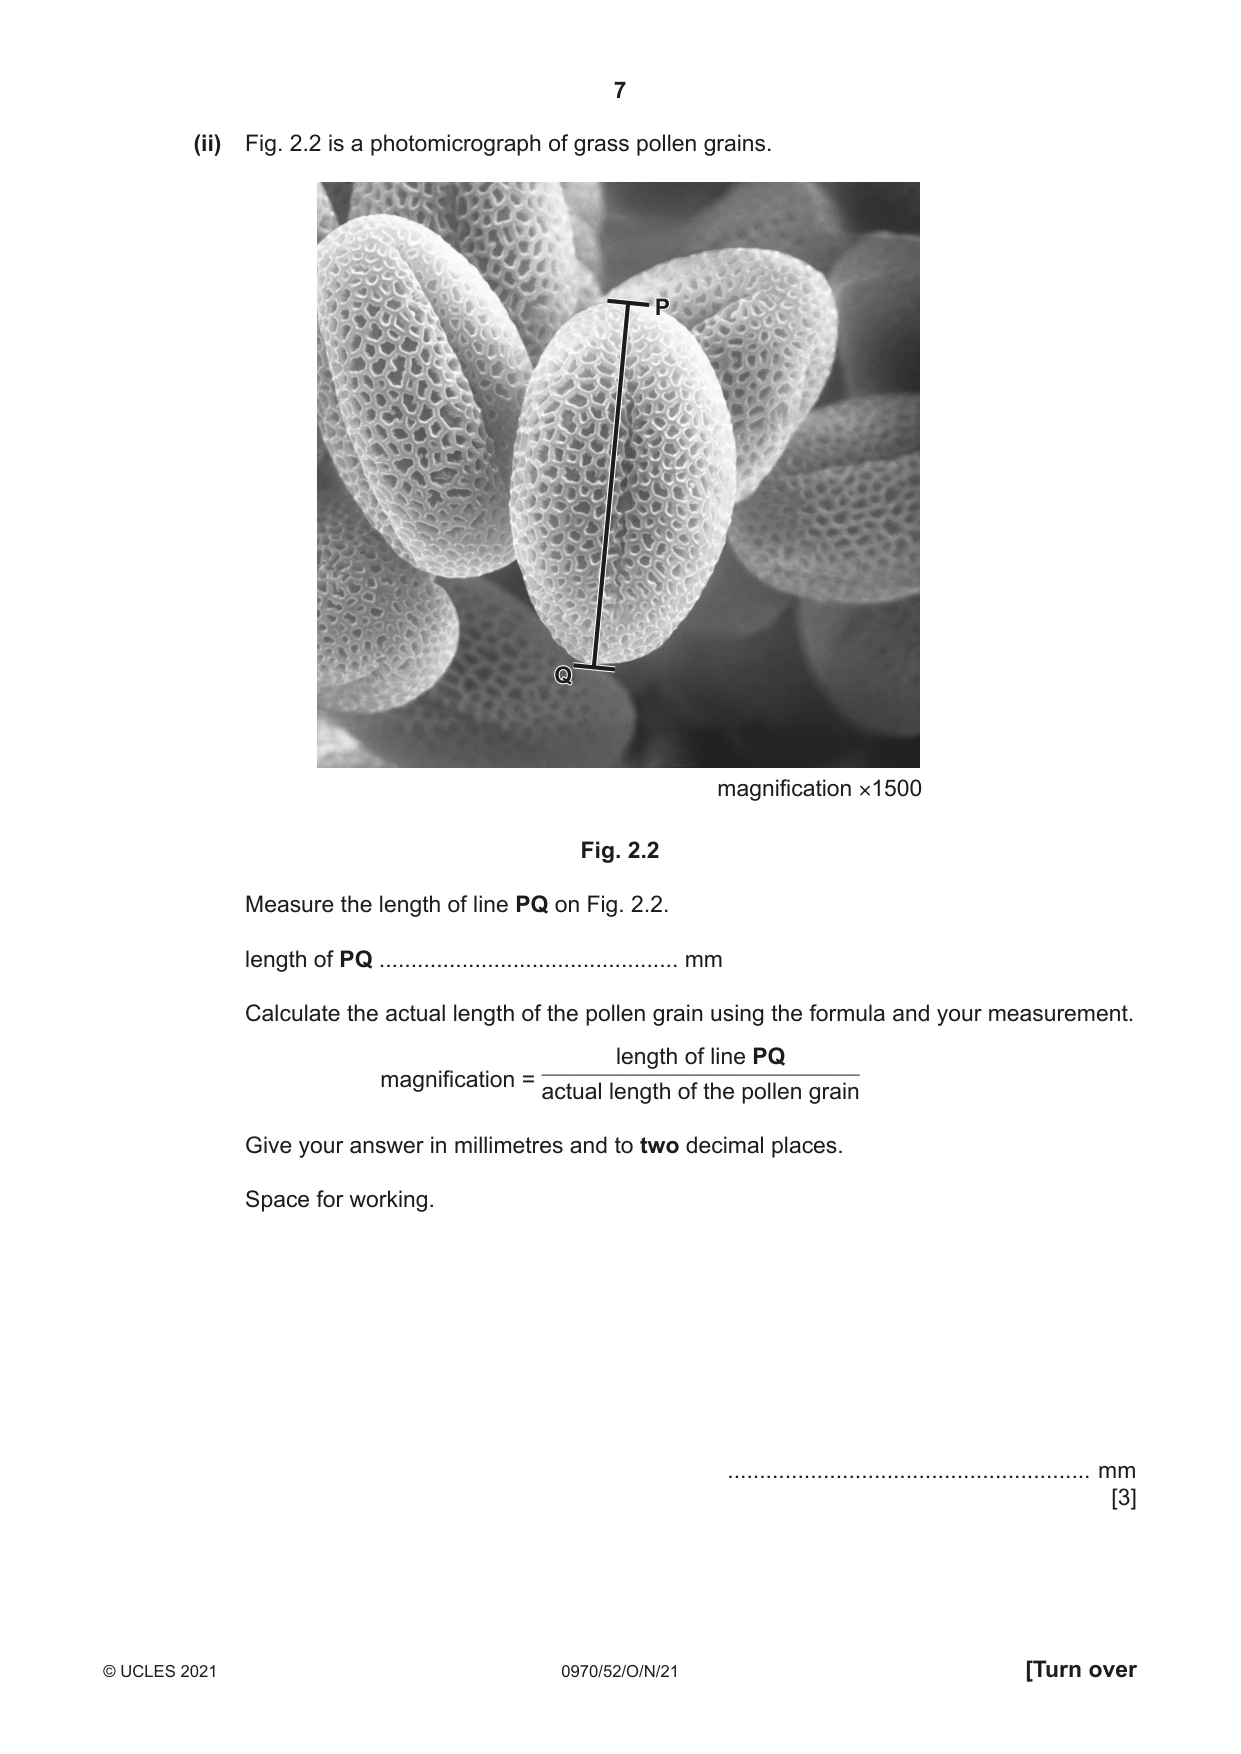
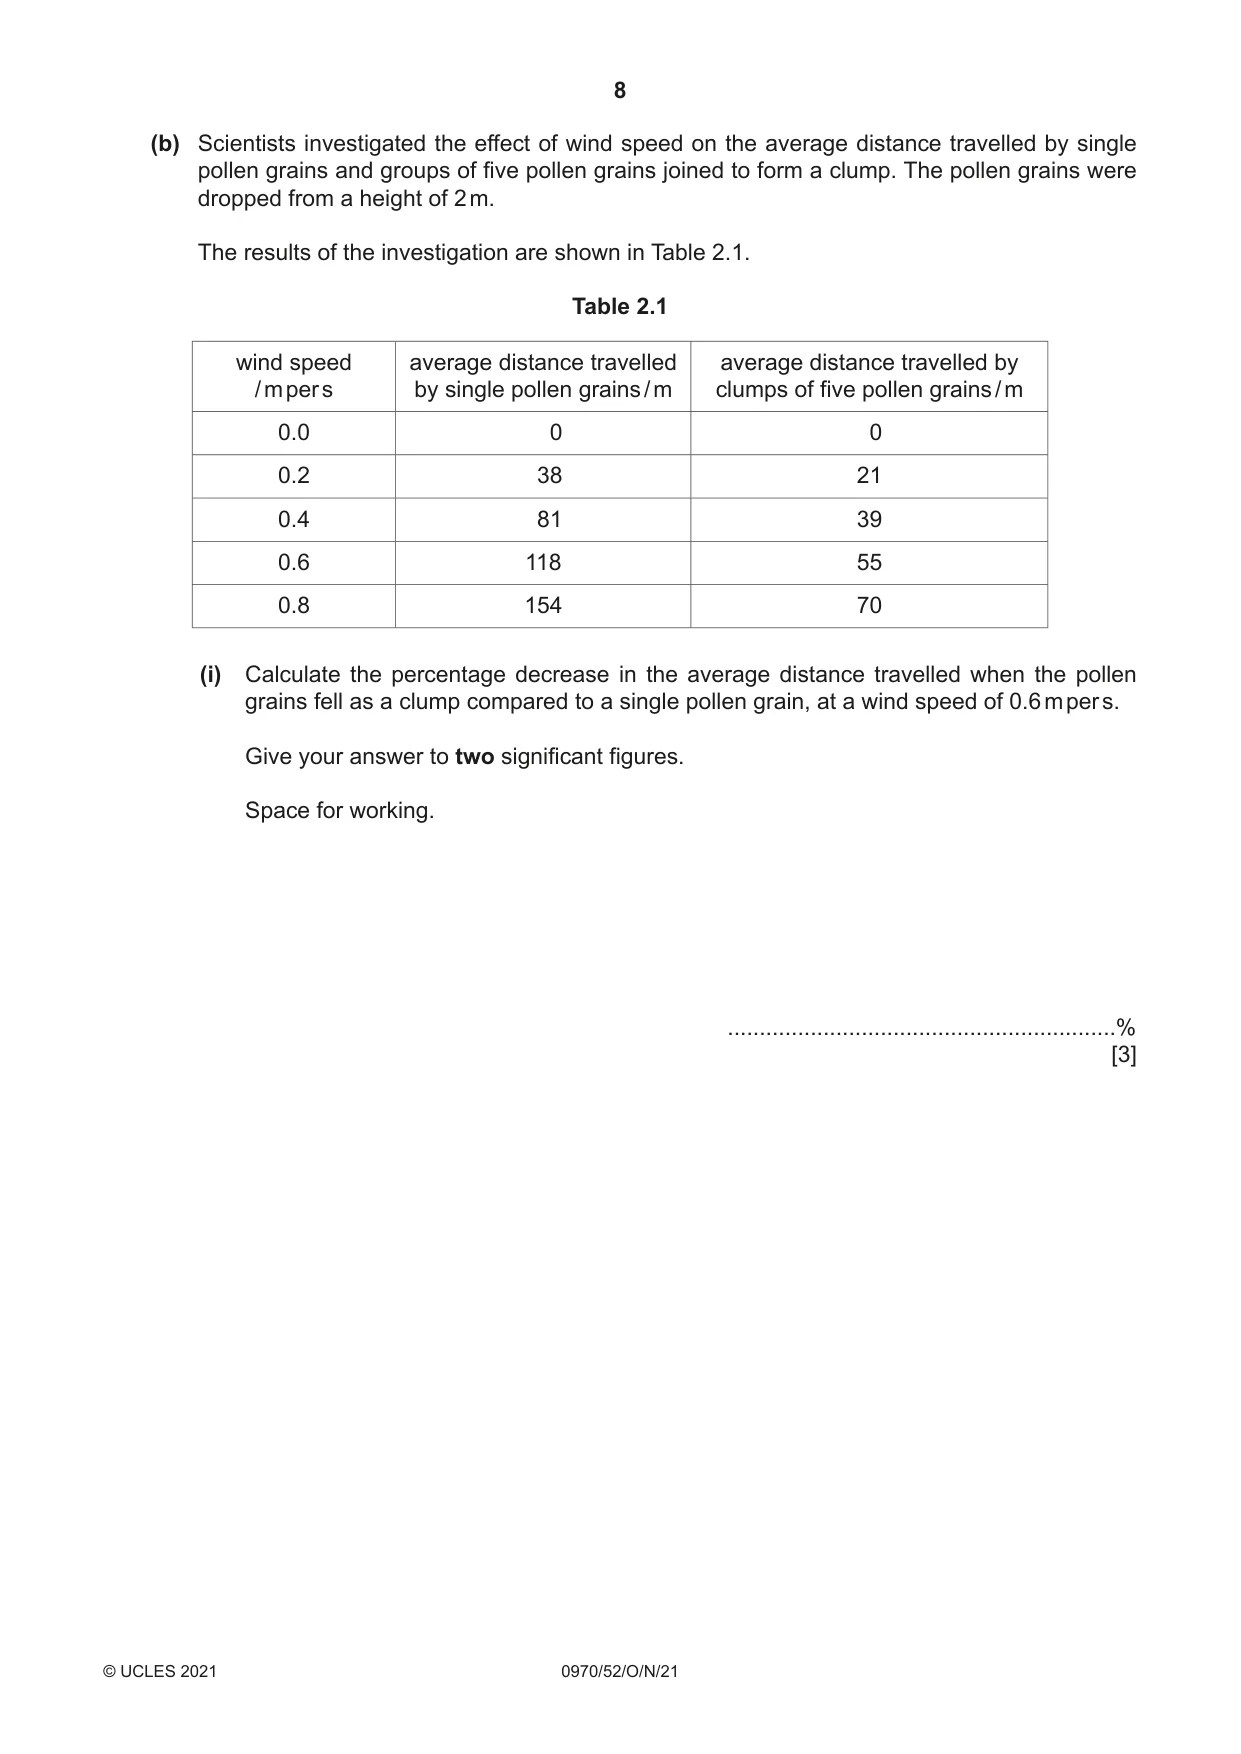
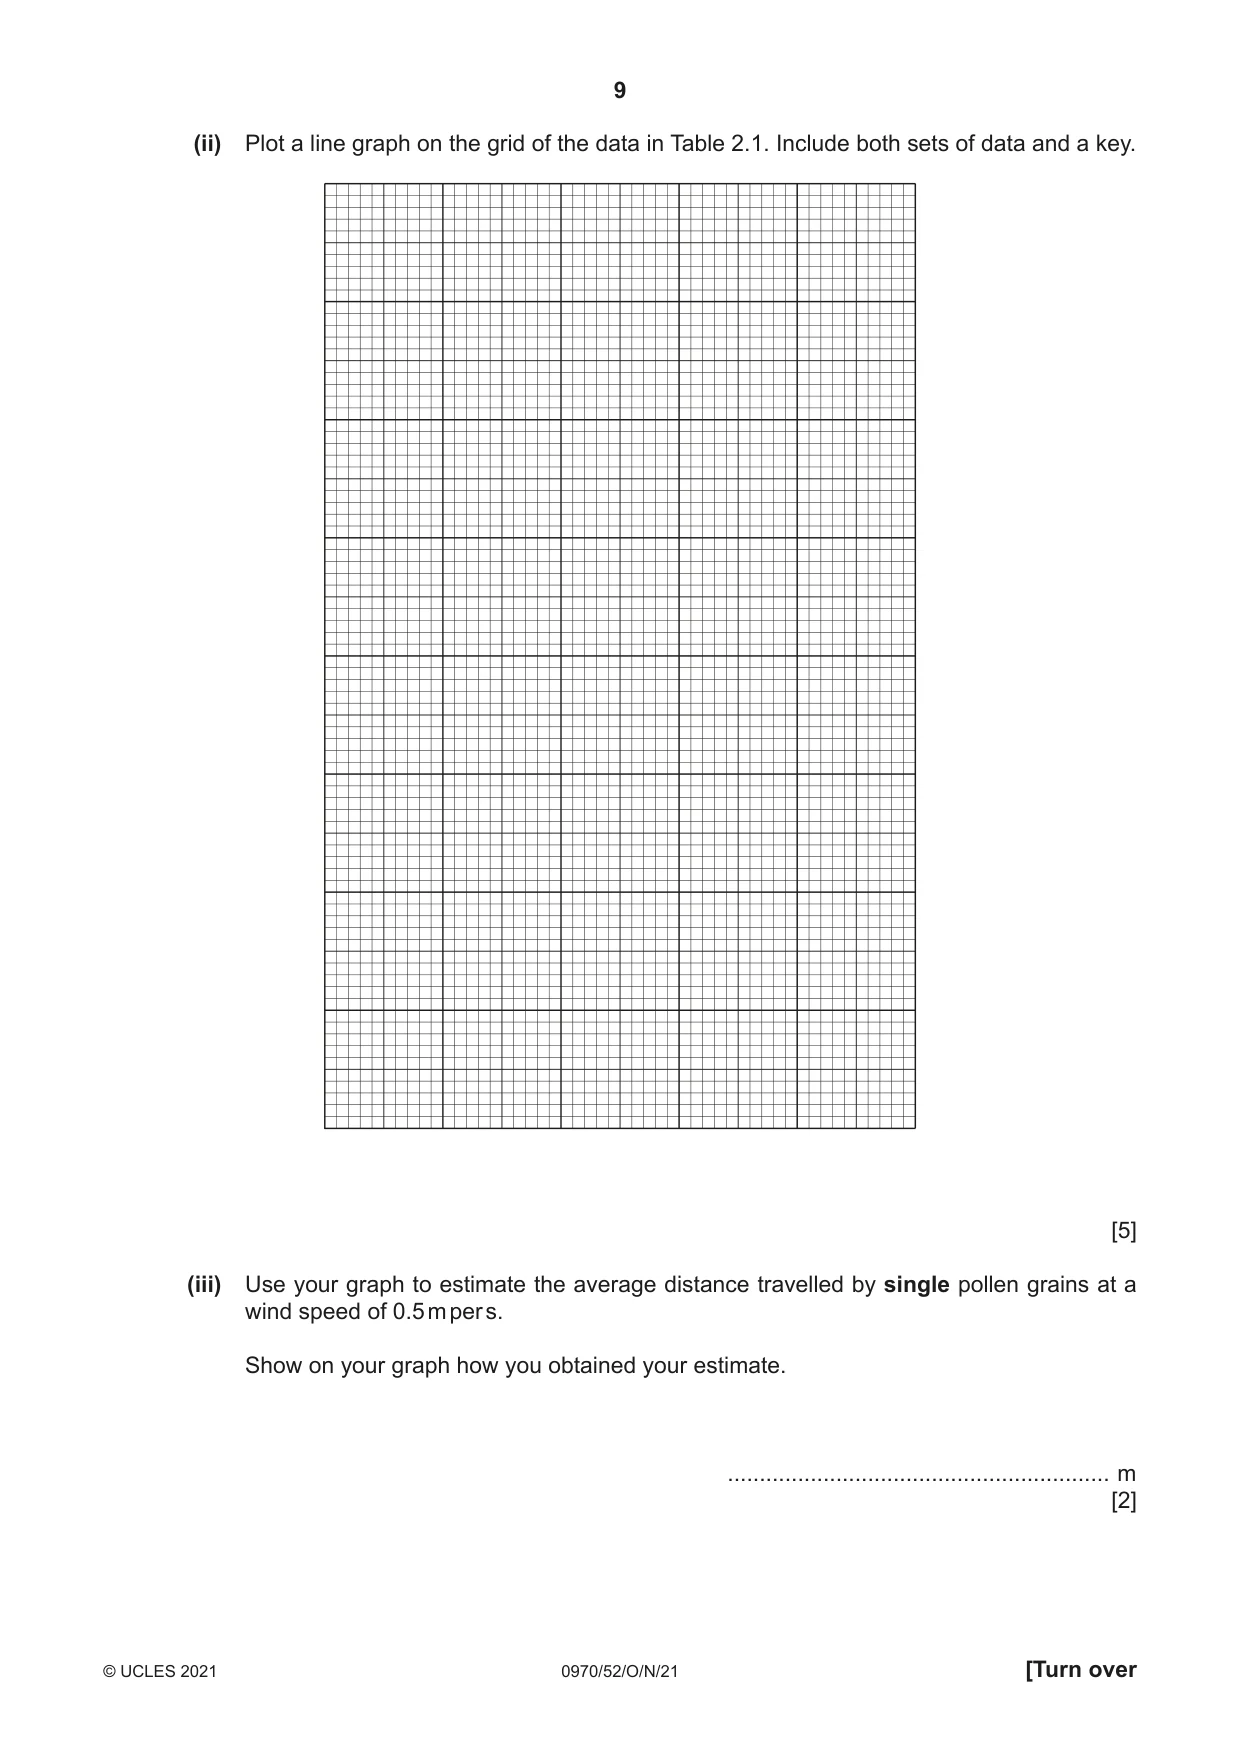
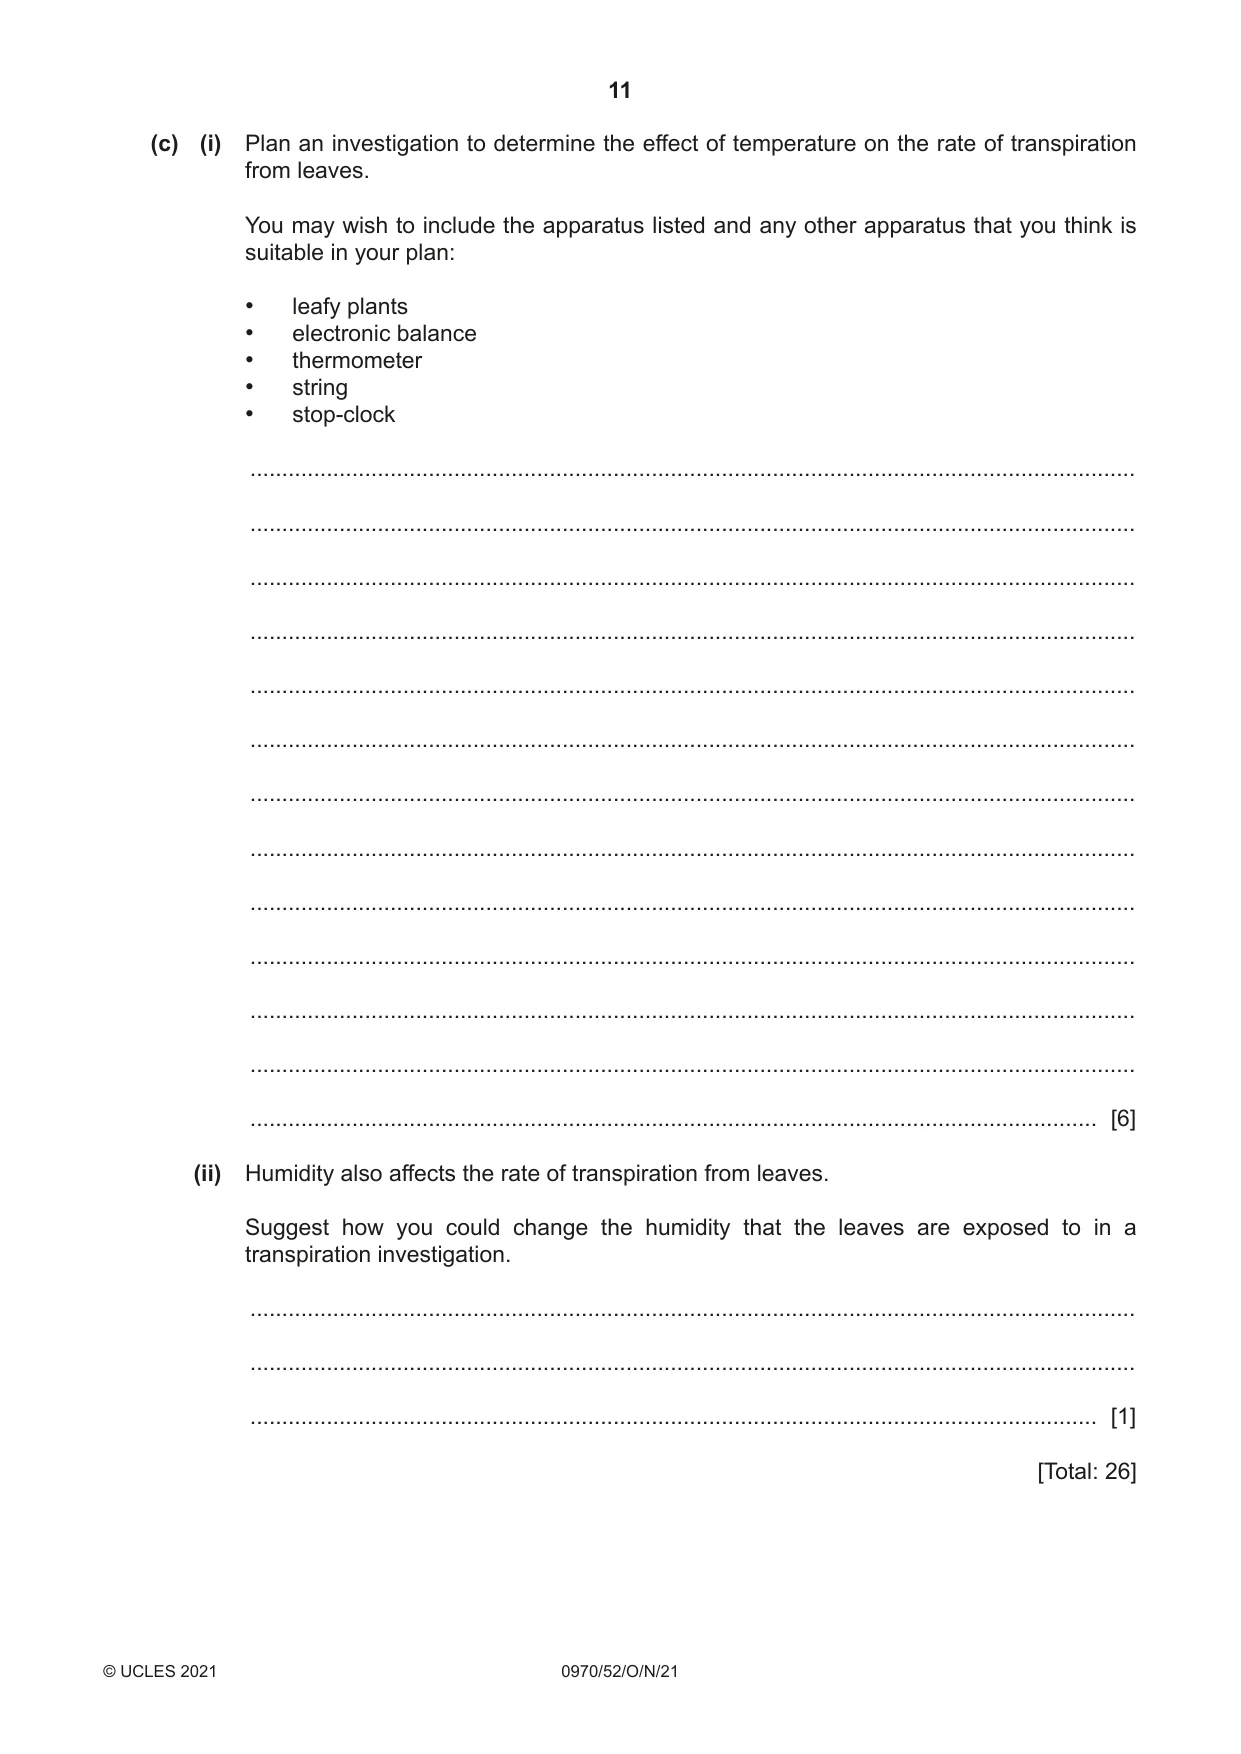
2 Fig. 2.1 is a photograph of a flower from the wind-pollinated grass plant, Briza maxima. Fig. 2.1 (a) (i) Draw a large diagram of the flower in Fig. 2.1. [4] (ii) Fig. 2.2 is a photomicrograph of grass pollen grains. P Q magnification ×1500 Fig. 2.2 Measure the length of line PQ on Fig. 2.2. length of PQ ............................................... mm Calculate the actual length of the pollen grain using the formula and your measurement. length of line PQ magnification = actual length of the pollen grain Give your answer in millimetres and to two decimal places. Space for working. ......................................................... mm [3] (b) Scientists investigated the effect of wind speed on the average distance travelled by single pollen grains and groups of five pollen grains joined to form a clump. The pollen grains were dropped from a height of 2 m. The results of the investigation are shown in Table 2.1. Table 2.1 wind speed average distance travelled average distance travelled by / m per s by single pollen grains / m clumps of five pollen grains / m 0.0 0 0 0.2 38 21 0.4 81 39 0.6 118 55 0.8 154 70 (i) Calculate the percentage decrease in the average distance travelled when the pollen grains fell as a clump compared to a single pollen grain, at a wind speed of 0.6 m per s. Give your answer to two significant figures. Space for working. .............................................................% [3]
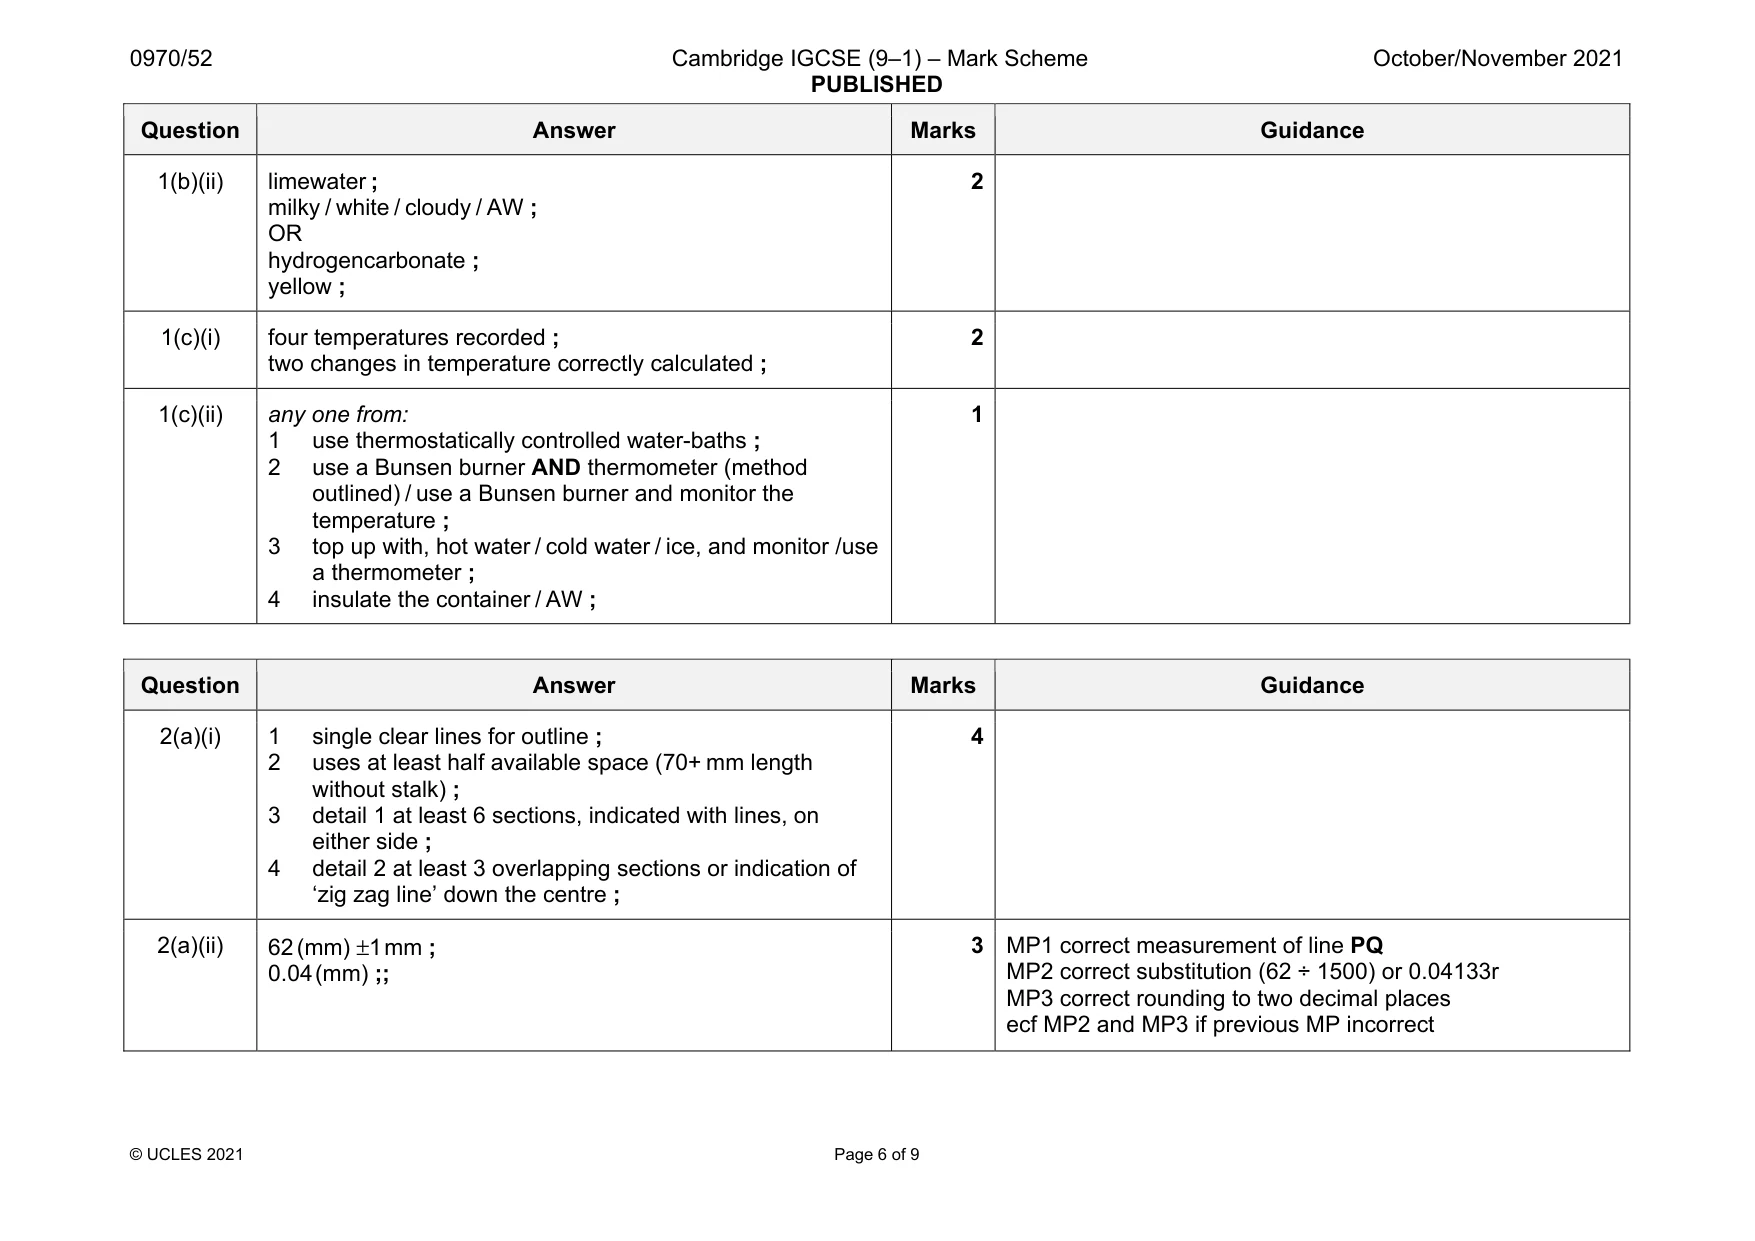
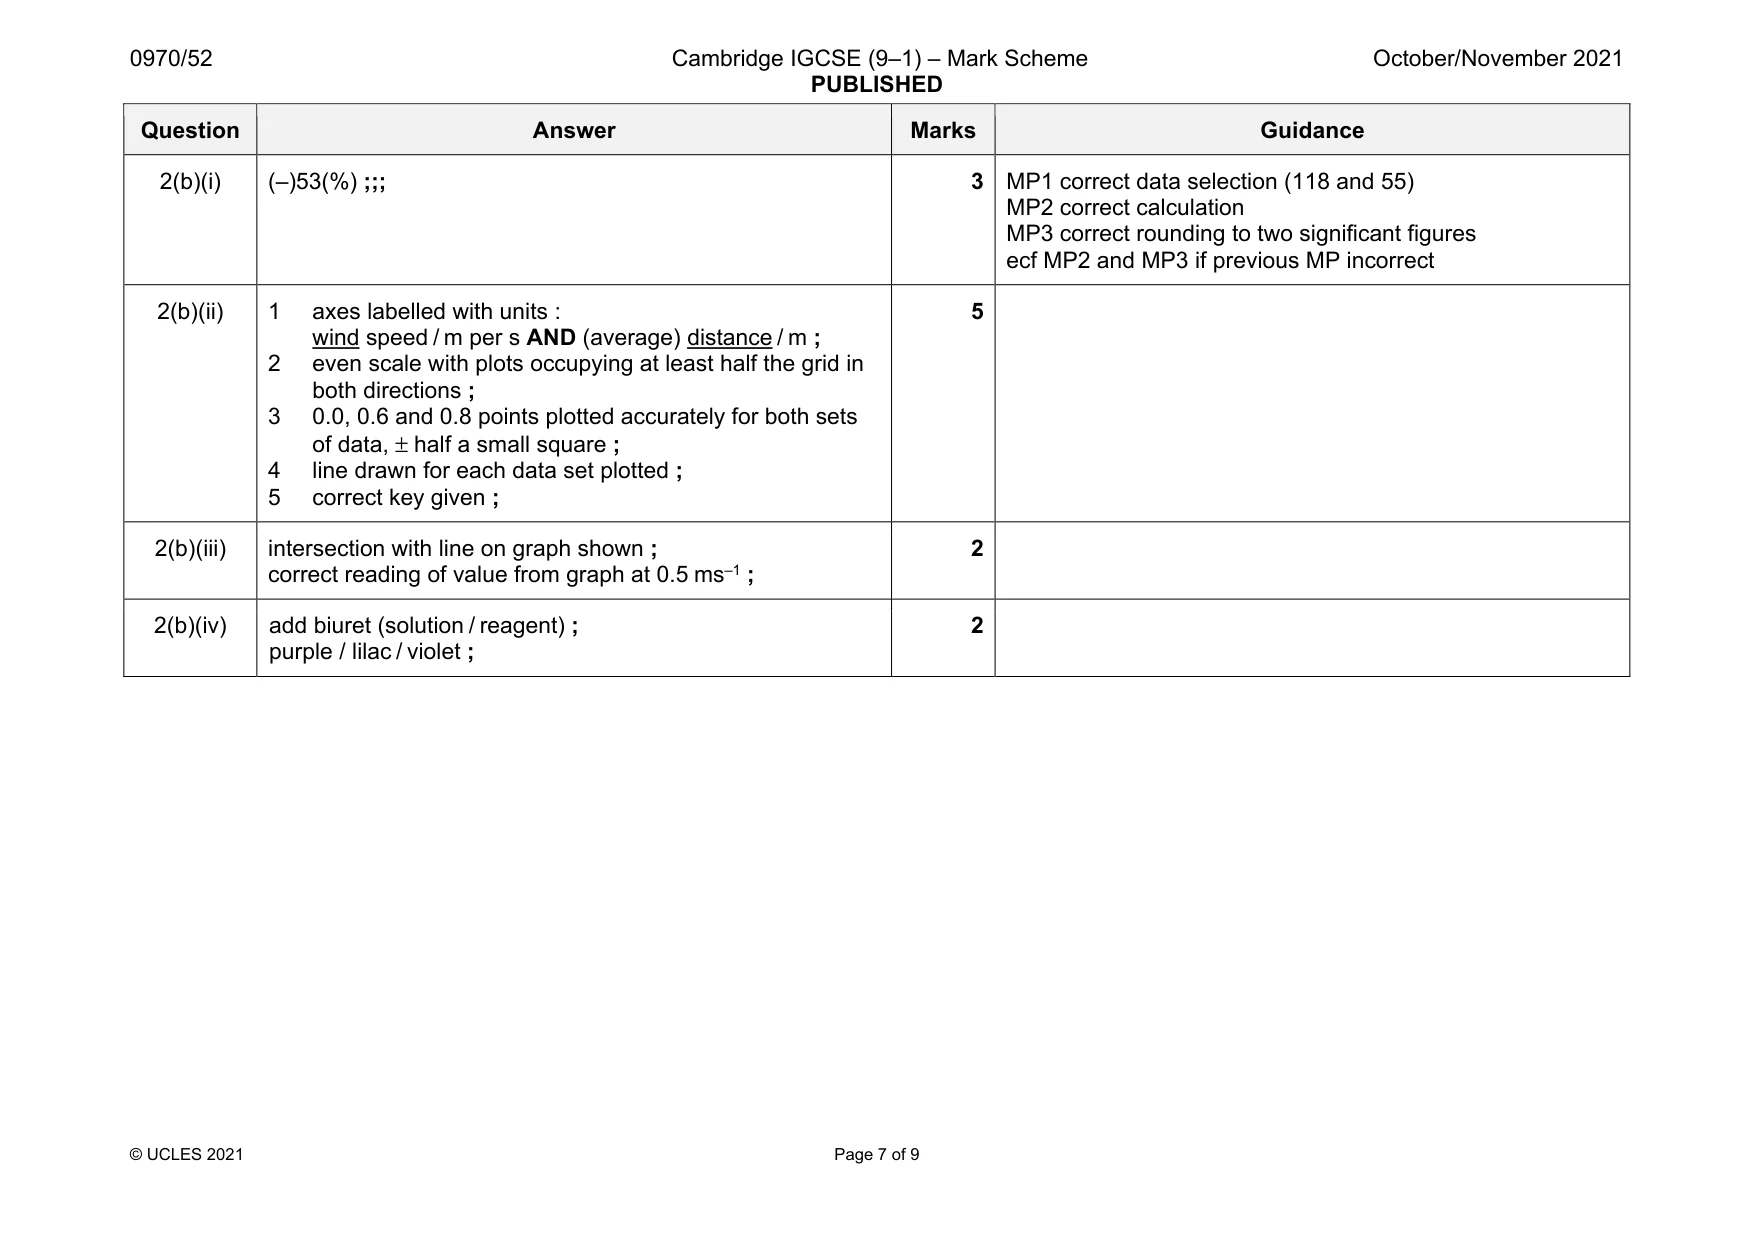
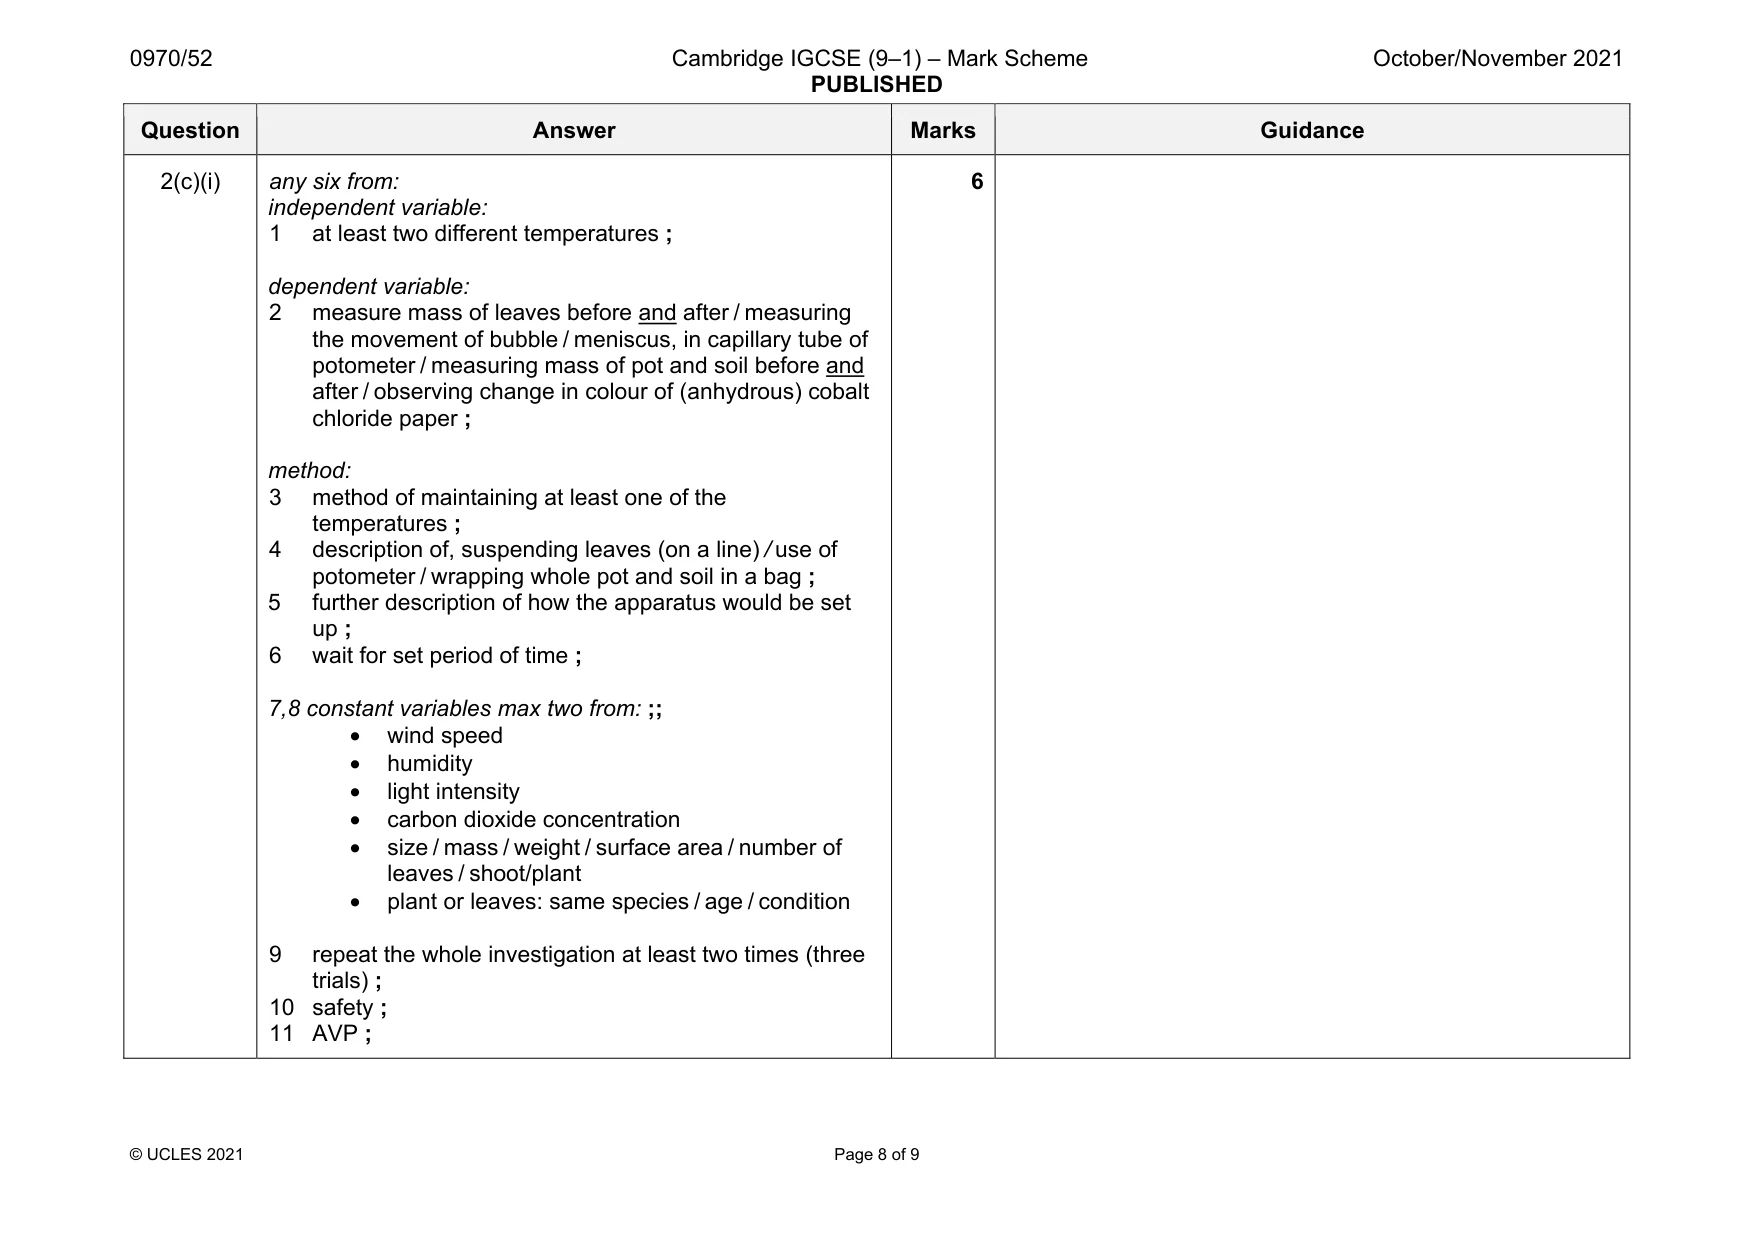
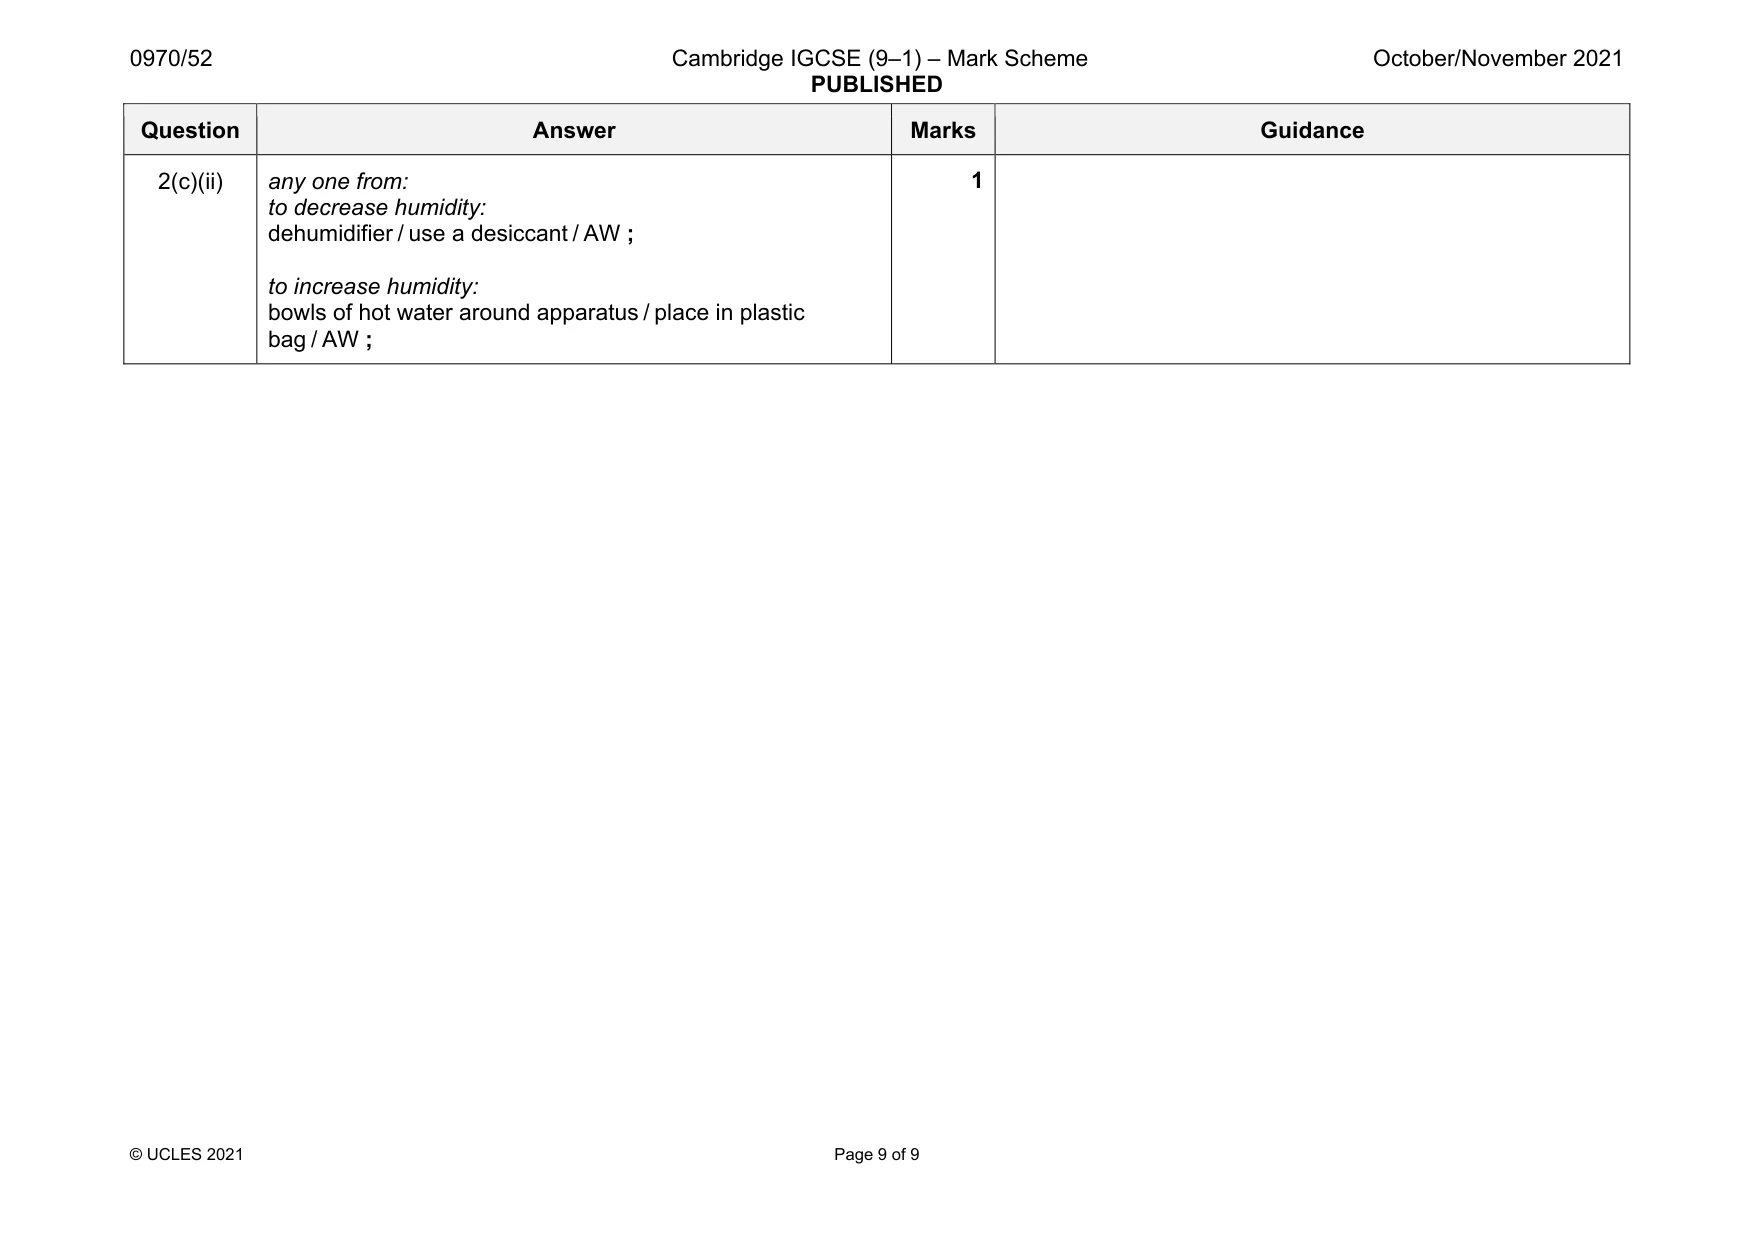
Mark scheme: 2(a)(i) 1 single clear lines for outline ; 2 uses at least half available space (70+ mm length without stalk) ; 3 detail 1 at least 6 sections, indicated with lines, on either side ; 4 detail 2 at least 3 overlapping sections or indication of ‘zig zag line’ down the centre ; 2(a)(ii) 62 (mm) ±1 mm ; 0.04 (mm) ;; 3 MP1 correct measurement of line PQ MP2 correct substitution (62 ÷ 1500) or 0.04133r MP3 correct rounding to two decimal places ecf MP2 and MP3 if previous MP incorrect Question Answer Marks Guidance 2(b)(i) (–)53(%) ;;; 3 MP1 correct data selection (118 and 55) MP2 correct calculation MP3 correct rounding to two significant figures ecf MP2 and MP3 if previous MP incorrect 2(b)(ii) 1 axes labelled with units : wind speed / m per s AND (average) distance / m ; 2 even scale with plots occupying at least half the grid in both directions ; 3 0.0, 0.6 and 0.8 points plotted accurately for both sets of data, ± half a small square ; 4 line drawn for each data set plotted ; 5 correct key given ; 5 2(b)(iii) intersection with line on graph shown ; correct reading of value from graph at 0.5 ms–1 ; 2 2(b)(iv) add biuret (solution / reagent) ; purple / lilac / violet ; 2 Question Answer Marks Guidance 2(c)(i) any six from: independent variable: 1 at least two different temperatures ; dependent variable: 2 measure mass of leaves before and after / measuring the movement of bubble / meniscus, in capillary tube of potometer / measuring mass of pot and soil before and after / observing change in colour of (anhydrous) cobalt chloride paper ; method: 3 method of maintaining at least one of the temperatures ; 4 description of, suspending leaves (on a line) / use of potometer / wrapping whole pot and soil in a bag ; 5 further description of how the apparatus would be set up ; 6 wait for set period of time ; 7,8 constant variables max two from: ;; • wind speed • humidity • light intensity • carbon dioxide concentration • size / mass / weight / surface area / number of leaves / shoot/plant • plant or leaves: same species / age / condition 9 repeat the whole investigation at least two times (three trials) ; 10 safety ; 11 AVP ; 6 Question Answer Marks Guidance 2(c)(ii) any one from: to decrease humidity: dehumidifier / use a desiccant / AW ; to increase humidity: bowls of hot water around apparatus / place in plastic bag / AW ; 1
What was in this paper
The subtopics covered by these 2 questions, and how many questions each got. Open one in a new tab to see every Cambridge question on it.
What you needed in this session
Cambridge’s own grade thresholds for 2021 Oct/Nov, Paper 5 · Variant 2. A higher threshold means an easier paper — the bar moves with how the cohort did.